Embed Size (px)
Citation preview

Eesti import arengumaadest ja arengumaade
probleemid kaupade tootmisel
2015

2
Sisukord
Sissejuhatus ...................................................................................................................................................................................... 3
1 Metoodika ja andmed ........................................................................................................................................................... 4
1.1 Arengumaade määratlus .......................................................................................................................................... 4
1.2 Impordi statistika ........................................................................................................................................................ 4
2 Ülevaade Eesti impordist arengumaadest..................................................................................................................... 6
2.1 Import jaotiste lõikes ................................................................................................................................................ 6
2.2 Import riikide lõikes ................................................................................................................................................... 7
2.3 Import kaubagruppide lõikes .................................................................................................................................. 8
2.3.1 Jaotis XII (jalatsid…) kaubagruppide ja riikide seosed .............................................................................. 9
2.3.2 Jaotis XI (tekstiil…) kaubagruppide ja riikide seosed ............................................................................. 11
2.3.3 Jaotise VIII (nahktooted ...) kaubagruppide ja riikide seosed ............................................................... 15
2.3.4 Jaotise XX (mänguasjad...) kaubagruppide ja riikide seosed ................................................................ 17
2.3.5 Jaotis XVI (masinad…) kaubagruppide ja riikide seosed ........................................................................ 19
2.4 Eestisse sisse toodavad suuremad kaubaartiklid lähtuvalt valitud arengumaadest ........................ 20
2.4.1 Hiina ........................................................................................................................................................................ 20
2.4.2 Türgi ........................................................................................................................................................................ 23
2.4.3 Bangladesh ........................................................................................................................................................... 25
2.4.4 India ........................................................................................................................................................................ 25
2.4.5 Pakistan .................................................................................................................................................................. 27
2.4.6 Tai ............................................................................................................................................................................ 28
3 Kirjandusülevaade probleemidest ................................................................................................................................ 30
3.1 Hiina ............................................................................................................................................................................. 31
3.2 Türgi ............................................................................................................................................................................. 37
3.3 Bangladesh ................................................................................................................................................................ 43
3.4 India ............................................................................................................................................................................. 48
3.5 Pakistan ....................................................................................................................................................................... 55
3.6 Tai ................................................................................................................................................................................. 59
Kokkuvõte ....................................................................................................................................................................................... 62
Lisa 1. WB arengumaade nimekiri .......................................................................................................................................... 63
Lisa 2. Kaupade nomenklatuuri jaotised ja 2-kohalised kaubagrupid ....................................................................... 64
Lisa 3. Import jaotiste lõikes .................................................................................................................................................... 67
Lisa 4. Import kaubagruppide lõikes (KN 2-kohaline kood) .......................................................................................... 69

3
Sissejuhatus Arengumaadest imporditakse Eestisse otse või kaudselt läbi teiste riikide palju kaupu, kuna seal on tootmiseks vajalikud ressursid või tootmine ise odavam. Arengumaades toodetavate kaupade odav hind on seotud mitmetel juhtudel aga negatiivsete mõjudega selle maa rahvale ja keskkonnale - näiteks tervistkahjustavates töötingimustes töötamine, keskkonda saastaval viisil tootmine jms. Arenenud riigid impordivad arengumaadest ka kaupu, mille sellistel tingimustel tootmine arenenud riigis endas oleks kas kehtivate regulatsioonide või ühiskondliku kokkuleppe tõttu välistatud.
Uuringu eesmärgiks on kaardistada Eesti impordi seosed arengumaadega ning seeläbi anda ülevaade, millistesse arengumaade probleemidesse Eesti inimesed oma tarbimisega potentsiaalselt panustavad. Analüüsi eesmärgiks on:
1. kaardistada Eesti import arengumaadest sellisel määral nagu olemasoleva statistika põhjal võimalik ning
2. varasemate uuringute põhjal tuua välja riigiti ühiskondlikud ja keskkonna probleemid, mis seonduvad valitud arengumaade suuremate impordiartiklitega.
Uuringu esimeses osas kaardistatakse Eesti import arengumaadest nii jaotiste, kaubagruppide, kaupade alamgruppide (4-kohalised koodid) kui ka päritoluriikide põhjal. Selleks kasutatakse Statistikaameti andmeid, mis näitavad Eestisse imporditavaid kaupu päritoluriigi järgi. Lähemalt uuritakse viite riiki, millest Eesti enim impordib ning mille puhul on põhjust eeldada, et sealt importides panustame erinevatesse probleemidesse. Probleemsete riikide valik põhineb U.S. Department Of Labor uuringul1, mis kaardistas lapstööjõudu kasutavad tootmisvaldkonnad ja riigid.
Uuringu teises osas antakse ülevaade teaduskirjanduses kajastatud probleemidest esimese osas põhjal välja valitud Eesti importpartneritega – Hiina, India, Türgi, Bangladesh, Pakistan ja Tai.
Uuringu tellijaks on MTÜ Arengukoostöö Ümarlaud.
Uuringu tegemist rahastas Euroopa Komisjon.
1 U.S. Department Of Labor. List of Goods Produced By Child Labor or Forced Labor, 2010. http://www.dol.gov/ilab/reports/child-labor/list-of-goods/

4
1 Metoodika ja andmed
1.1 Arengumaade määratlus Ühtset arengumaade määratlust pole olemas, erinevad uurijad ja organisatsioonid lähtuvad erinevatest kriteeriumitest. Rahvusvahelised organisatsioonid nagu Rahvusvaheline Valuutafond (International Monetary Foundation – IMF) ja Ühinenud Rahvaste Organisatsioon (ÜRO) koostavad nimekirju arengumaadest ja vähim arenenud maadest, mis omavahel üks-ühele ei kattu.
Uuringus kasutame Maailmapanga (World Bank - WB) koostatavat ja regulaarselt uuendatavat nimekirja arengumaadest, sest ÜRO koostatud maade nimekiri hõlmab vähem riike, sisaldades ainult ÜRO poolt regulaarselt jälgitavaid maid2. WB klassifikatsioon põhineb eelkõige rahvuslikul kogusissetulekul (gross national income – GNI) ja sellest lähtuvalt määratleme arengumaadena need riigid, mis on WB poolt klassifitseeritud madala või keskmise sissetulekuga riikideks. WB määratleb arengumaa kui riigi, mille elanikest enamik elavad oluliselt väiksemate rahaliste vahenditega, oluliselt väiksema hulga avalike teenustega kui rahvastik kõrgelt arenenud industrialiseeritud maades3. WB andmetel elab 5 miljonit maailma 6 miljonist elanikust arengumaades, kus sissetulek on tavaliselt alla 2$ päevas (1,84 eurot).
Nagu öeldud sisaldavad erinevad nimekirjad erinevaid riike. Nt ei sisalda WB nimekiri Iisraeli, samas kui ÜRO nimekiri seda sisaldab. ÜRO arengumaade nimekiri ei sisalda aga Euroopa riike, mistõttu seal pole nt Valgevenet ja Ukrainat. Antud uuringus kasutatav arengumaade nimekiri on toodud uuringu lisas 1. Seda arengumaade nimekirja kasutatakse Eesti impordi statistika jaotamisel gruppidesse. Ülejäänud riike, mida nimekirjas ei ole määratletakse kategooriaga „muud riigid“.
1.2 Impordi statistika Eesti impordi andmed kaubagruppide ja riikide lõikes pärinevad Statistikaametist4. Tabelis esitatakse kaupade import nii päritolumaa kui saatjamaa järgi. Antud juhul kasutame 2014. aasta andmeid impordi päritolumaa ja väärtuse kohta5.
Kaubagrupid on andmetes esitatud kaupade kombineeritud nomenklatuuri6 (KN) 4-kohalise koodi tasemel. Kombineeritud nomenklatuur jaguneb 22 jaotiseks ja 99 kaubagrupiks. Analüüsis kasutatakse erineva taseme kaupade grupeerimist (jaotis, kaubagrupp või 4-kohaline kood ehk alamgrupp). Kõikide impordi statistika arvestuste jaoks kasutatakse kaubagruppide 4-kohalise koodi (alamgruppide) tabelit, selle põhjal arvestatakse ka 2-kohalised koodid (kaubagrupid) ja jaotised. Kuna 4-kohaline kood on määratud väiksemale osale kaupadest, kui 2-kohaline kood, siis ei lange siin kasutatav impordi näitaja
2 UN kõige viimane arengumaade klassifikatsioon sisaldab 107 arengumaad (UN 2015:140) samas kui WB klassifikatsioon sisaldab 127 riiki arengumaadena. WB klassifikatsioonis kajastatakse 188 WB liikmesriiki ja lisaks 36 riiki, mille elanike arv on enam kui 30 tuhat. https://datahelpdesk.worldbank.org/knowledgebase/articles/378834-how-does-the-world-bank-classify-countries 3 WB FAQ Q. What is a developing country? http://web.worldbank.org/WBSITE/EXTERNAL/EXTSITETOOLS/0,,contentMDK:20147486~menuPK:344190~pagePK:98400~piPK:98424~theSitePK:95474,00.html#1 4 Statistikaameit veebiandmebaasis regulaarselt avaldatav tabel VK200: kaupade eksport ja import kaubakoodi (kn 4-kohaline kood) ja riigi järgi http://pub.stat.ee/px-web.2001/dialog/varval.asp?ma=VK200&ti=KAUPADE+EKSPORT+JA+IMPORT+KAUBAKOODI+%28KN+4%2DKOHALINE+KOOD%29+JA+RIIGI+J%C4RGI&path=../database/Majandus/25Valiskaubandus/03Valiskaubandus_alates_2004/&search=VK200&lang=2 5 Impordi väärtus esitatakse CIF (cost, insurance and freight) hindades ehk hindades importija maa piiril, sisaldades muu hulgas kindlustuse ja transpordi kulusid riigipiirini. 6 Statistikaamet, kombineeritud nomenklatuur http://www.stat.ee/15784

5
kokku kogu impordi näitajaga 2014. aastal7. 4-kohalise kaupade koodiga tabelis on eristatud import päritolumaa järgi ja seetõttu kasutataksegi just seda tabelit sh kõrgema taseme kaubagruppide leidmiseks.
Impordi statistika sisaldab nii Eestisse lõpptarbimiseks toodud kaupa, vahetarbimises kasutatavat kaupa kui ka kaupade sissevedu välismaale edasimüügiks, taasväljaveo kohustusega ajutist sissevedu töötlemise eesmärgil ning taassissevedu pärast töötlemist väljaspool Eestit. See ei hõlma transiiti ega teenuseid. Eesti import jagunes 2014. a selliselt, et8:
56% oli vahetarbimine ehk kasutatakse tootmise sisendina, 15% oli kapitalikaubad, mis on tootmiseks vajalikud masinad ja seadmed ning 22% oli lõpptarbimiseks sisse toodud kaubad.
Osa Eestisse toodavatest kaupadest eksporditakse kas otse või ümbertöödeldult, mistõttu kogu sisse toodavat kaupa ei tarbi Eesti inimesed. Kuna eksporti pole võimalik kaubagrupi ja impordimaa detailsusega seostada, siis ei ole võimalik teada saada, milline osa arengumaadest toodetud kaupadest Eestis tarbitakse ja milline viiakse välja. Seega kajastab analüüs Eestisse sisseveetavate kaupade seost arengumaadega laiemalt ehk mitte ainult lõpptarbijate tarbitavate kaupade näol, aga ka tootjate sisendina kasutatavaid tooteid ja materjale ning Eestist lõpuks välja viidavaid tooteid.
Statistikaameti mõistete selgituse kohaselt on saatjariik maa, kust kaup on vahetult saadetud ja päritolumaa riik, kus kaup on toodetud. Uuringus kasutame importi päritolumaa järgi. Kuigi see peaks kajastama tootjamaad, siis andmetesse süvenedes ilmneb, et statistika ei ole väga täpne. Näiteks Eesti riisi impordist 17% tuleb päritolumaa järgi Saksamaalt ja 8% Lätist, kus tõenäoliselt siiski see riis pole kasvanud. Päritolumaa märgitakse statistikas importijate poolt ning Statistikaamet seda täpselt ei kontrolli, eriti väiksemate kaubagruppide osas. Lisaks sellele on tootjamaad keeruline defineerida, kui kaubad koosnevad erinevatest riikidest imporditud sisenditest, mis pannakse kokku ühes riigis. Seetõttu on näiteks arenenud riikidest imporditavate elektroonikakaupade seas ka muuhulgas osaliselt arengumaadest imporditud sisendeid. Seega, kui esitada statistika põhjal info Eesti impordi kohta arengumaadest, siis lisaks sellele, mis otseselt välja paistab on kaudselt mõju arengumaadele ka impordi osas, mis on komplekteeritud, pakendatud või ümber töödeldud küll arenenud maades, kuid sisaldavad arengumaades toodetud komponente (nö teise ringi mõjud).
7 Kogu import Eestisse oli 2014. aastal 13,8 mlrd eurot, kuid ligi ühe mlrd jagu kaupu pole 4-kohalise koodi tasemel märgitud. Seetõttu on 4-kohalise koodiga kaupade tabeli põhjal kogu impordi suurus 12,6 mlrd. Kauba jaotiste kaupa ulatuvad erinevused V jaotise (mineraalsed tooted) tegelikus impordis ja 4-kohalise kaupade koodiga märgitud impordis 1%-st kuni XX jaotise korral (muud töösutstooted) 18%-ni. 8 Statistikaamet, tabel VK095: väliskaubandus --- aasta, kaubavoog, kaup ning kuu. Import 2014. aastal. Muu kategooria (mootoribensiin, sõiduautod, mujal spetsifitseerimata kaubad) moodustas impordist 2014. aastal 8%.
6
2 Ülevaade Eesti impordist arengumaadest Statistikaameti KN 4-kohalise klassifikatsiooni täpsusega toodi erinevaid kaupu Eestisse 2014. aastal 12,6 mlrd euro väärtuses. Arenguriikide osakaal on sellest vaid 13% (1,65 mlrd eurot). Järgnevalt vaatame Eestisse imporditavaid kaupu jaotiste lõikes.
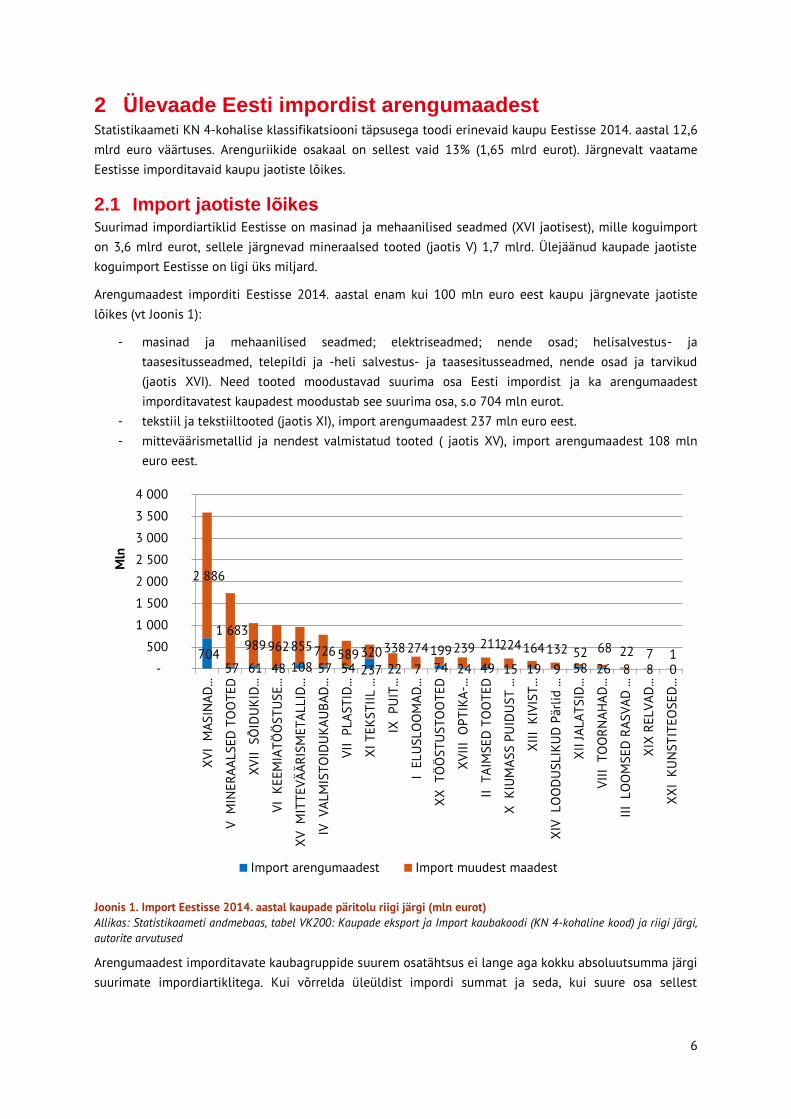
2.1 Import jaotiste lõikes Suurimad impordiartiklid Eestisse on masinad ja mehaanilised seadmed (XVI jaotisest), mille koguimport on 3,6 mlrd eurot, sellele järgnevad mineraalsed tooted (jaotis V) 1,7 mlrd. Ülejäänud kaupade jaotiste koguimport Eestisse on ligi üks miljard.
Arengumaadest imporditi Eestisse 2014. aastal enam kui 100 mln euro eest kaupu järgnevate jaotiste lõikes (vt Joonis 1):
- masinad ja mehaanilised seadmed; elektriseadmed; nende osad; helisalvestus- ja taasesitusseadmed, telepildi ja -heli salvestus- ja taasesitusseadmed, nende osad ja tarvikud (jaotis XVI). Need tooted moodustavad suurima osa Eesti impordist ja ka arengumaadest imporditavatest kaupadest moodustab see suurima osa, s.o 704 mln eurot.
- tekstiil ja tekstiiltooted (jaotis XI), import arengumaadest 237 mln euro eest. - mitteväärismetallid ja nendest valmistatud tooted ( jaotis XV), import arengumaadest 108 mln
euro eest.
Joonis 1. Import Eestisse 2014. aastal kaupade päritolu riigi järgi (mln eurot) Allikas: Statistikaameti andmebaas, tabel VK200: Kaupade eksport ja Import kaubakoodi (KN 4-kohaline kood) ja riigi järgi, autorite arvutused
Arengumaadest imporditavate kaubagruppide suurem osatähtsus ei lange aga kokku absoluutsumma järgi suurimate impordiartiklitega. Kui võrrelda üleüldist impordi summat ja seda, kui suure osa sellest
704 57 61 48 108 57 54 237 22 7 74 24 49 15 19 9 58 26 8 8 0
2 886
1 683 989 962 855 726 589 320 338 274 199 239 211 224 164 132 52 68 22 7 1
-
500
1 000
1 500
2 000
2 500
3 000
3 500
4 000
XVI
MAS
INAD
...
V M
INER
AALS
ED T
OO
TED
XVII
SÕ
IDU
KID
...
VI K
EEM
IATÖ
ÖST
USE
...
XV M
ITTE
VÄÄR
ISM
ETAL
LID
...
IV V
ALM
ISTO
IDU
KAU
BAD
...
VII
PLAS
TID
...
XI T
EKST
IIL ..
.
IX P
UIT
...
I EL
USL
OO
MAD
...
XX T
ÖÖ
STU
STO
OTE
D
XVIII
OPT
IKA-
...
II T
AIM
SED
TO
OTE
D
X K
IUM
ASS
PUID
UST
...
XIII
KIV
IST.
..
XIV
LO
OD
USL
IKU
D P
ärlid
...
XII J
ALAT
SID
...
VIII
TO
ORN
AHAD
...
III L
OO
MSE
D R
ASVA
D ..
.
XIX
RELV
AD...
XXI
KUN
STIT
EOSE
D...
Mln
Import arengumaadest Import muudest maadest

7
moodustab import arengumaadest, siis suurimad toodete jaotised, mille puhul enam kui kolmandik tuleb arengumaadest on:
- relvad ja laskemoon; nende osad ja tarvikud (jaotis XIX), millest 52% tuli arengumaadest - jalatsid, peakatted, vihma- ja päevavarjud, jalutuskepid, istmega jalutuskepid; piitsad, ratsapiitsad
ja nende osad; töödeldud suled ja sulgedest tooted; tehislilled; tooted juustest (jaotis XII), millest 53% tuli arengumaadest
- tekstiil ja tekstiilitooted (jaotis XI), millest 42% tuli arengumaadest.
Joonis 2. Import Eestisse (mln eurot, vasak skaala) ja impordi osatähtsus arengumaadest (%, parem skaala) 2014. a Allikas: Statistikaameti andmebaas, tabel VK200: Kaupade eksport ja Import kaubakoodi (KN 4-kohaline kood) ja riigi järgi, autorite arvutused
Jättes kõrvale asjaolu, et erinevatest kaupade jaotistest osa läheb vahetoodanguks ja uuesti ekspordiks, on nende kaupade osas suurem tõenäosus, et tarbija kasutab arengumaadest osaliselt või tervikuna pärit kaupa. Näiteks jaotis XII (jalatsid...) korral on iga teine toode pärit arengumaadest. Lisaks sellele võib ka arenenud maadest olev toode olla valmistatud osaliselt või täielikul arengumaades, seega on selliste kaupade ostmisel veelgi suurem tõenäosus kui iga teise toote korral, et tootesse on panustanud arengumaades elavad inimesed.
2.2 Import riikide lõikes 2014. aastal imporditi Eestisse kaupu 97-st WB arengumaade nimekirjas olevast riigist. Toote päritolumaa järgi imporditakse arengumaadest enim Eestisse Hiinast, kust tuli 58% arengumaade impordist (kokku 961 mln euro eest) ning 8% kogu Eesti impordist. Järgmised riigid olid importijatena palju väiksema tähtsusega – Türgi, Valgevene, Ukraina. Nende osatähtsus arengumaade impordist oli ligi 5% (70-91 mln eurot) ja Eesti kogu impordist alla 1%. Vaatamata sellele, et suuremal osal arenguriikidest on suhteliselt väike tähtsus Eesti koguimpordis, võib olla üksikute tootegruppide kaupa nende osatähtsus suur.
20%
3% 6% 5%11%
7% 8%
42%
6%2%
27%
9%
19%
6%10%
6%
53%
28%27%
52%
11%
0%
10%
20%
30%
40%
50%
60%
- 500
1 000 1 500 2 000 2 500 3 000 3 500 4 000
XVI
MAS
INAD
...
V M
INER
AALS
ED…
XVII
SÕ
IDU
KID
...
VI K
EEM
IATÖ
ÖST
USE
... XV…
IV…
VII
PLAS
TID
...
XI T
EKST
IIL ..
.
IX P
UIT
...
I EL
USL
OO
MAD
...
XX T
ÖÖ
STU
STO
OTE
D
XVIII
OPT
IKA-
...
II T
AIM
SED
TO
OTE
D
X K
IUM
ASS
PUID
UST
...
XIII
KIV
IST.
..
XIV
LO
OD
USL
IKU
D…
XII J
ALAT
SID
...
VIII
TO
ORN
AHAD
...
III L
OO
MSE
D R
ASVA
D ..
.
XIX
RELV
AD...
XXI
KUN
STIT
EOSE
D...
Mln
Import kokku Arengumaade impordi osatähtsus

8
Tabel 1. Import arengumaadest, mille import päritolumaa järgi oli suurem kui 1 mln eurot 2014. a (eurodes)
Riik Import Riik Import Riik Import
Hiina 961 070 239 Lõuna-Aafrika 19 462 304 Ecuador 3 627 400
Türgi 91 213 091 Mehhiko 18 181 870 Dominikaani Vabariik 3 490 165
Valgevene 73 848 517 Bangladesh 17 955 875 Elevandiluurannik 3 268 618
Ukraina 70 727 475 Pakistan 12 753 492 Moldova 3 214 424
Rumeenia 62 581 663 Bulgaaria 8 318 884 Ghana 3 014 441
Tai 45 604 579 Filipiinid 8 295 978 Gruusia 2 694 985
India 42 660 209 Maroko 7 727 365 Kolumbia 2 364 282
Brasiilia 33 407 296 Sri Lanka 6 432 336 Peruu 2 247 735
Malaisia 28 220 967 Tuneesia 5 345 946 Küpros 2 222 753
Kasahstan 28 142 577 Costa Rica 4 447 347 Iraan 1 479 821
Vietnam 27 125 741 Egiptus 4 343 388 Guatemala 1 016 264
Indoneesia 22 501 987 Kambodža 4 141 903 Nigeeria 1 004 161
Allikas: Statistikaameti andmebaas, tabel VK200: Kaupade eksport ja Import kaubakoodi (KN 4-kohaline kood) ja riigi järgi, autorite arvutused
2.3 Import kaubagruppide lõikes Kokku on kaubagruppide seas (2-kohalise koodi alusel) 13 gruppi, mille puhul arengumaade osakaal kaubagrupi impordist on üle 50% (vt Tabel 2 ja Lisa 4 kõikide kaubagruppide kohta). Sellistesse kaubagruppidesse kuuluvate toodete tarbimisel on tõenäoline, et enam kui pooltel juhtudel on need on pärit arengumaadest. Samas kõik need kaubagrupid on kogu Eesti impordist suhteliselt väikesemahulised (alla 1%).
Tabel 2. Suuremate arengumaade osatähtsusega kaubagruppide (KN 2-kohaline kood) import Eestisse 2014. a (eurodes)
Kaubagrupi nimi Jaotis Import Import arengu-maadest
Arengumaade osakaal
kaubagrupi impordist
46 - õlgedest, espartost ja muudest punumismaterjalidest tooted; korv- ja vitspunutised
IX 1 006 338 767 335 76%
66 - vihma- ja päevavarjud, jalutuskepid, istmega jalutuskepid, piitsad, ratsapiitsad ja nende osad
XII 634 420 470 491 74%
53 - muud taimsed tekstiilkiud; paberlõng ja paberlõngast riie
XI 4 021 046 2 814 902 70%
67 - töödeldud suled ja udusuled ning tooted nendest; tehislilled; tooted juustest
XII 1 446 308 979 741 68%
42 - nahktooted; sadulsepatooted ja rakmed; reisitarbed, käekotid jms tooted; tooted loomasooltest (v.a jämesiidist)
VIII 38 609 376 23 168 956 60%
61 - silmkoelised ja heegeldatud rõivad ning rõivamanused (trikootooted)
XI 122 387 177 70 439 702 58%
62 - rõivad ning rõivamanused, v.a silmkoelised või heegeldatud
XI 143 220 903 80 938 270 57%
55 - keemilised staapelkiud XI 60 483 449 32 506 160 54%
65 - peakatted ja nende osad XII 8 003 486 4 289 675 54%
64 - jalatsid, kedrid jms tooted; nende osad XII 100 209 070 52 409 399 52%

9
63 - muud tekstiilist valmistooted; komplektid; kantud rõivad ja kasutatud tekstiiltooted; kaltsud
XI 46 013 265 23 899 325 52%
93 - relvad ja laskemoon; nende osad ja tarvikud XVIII 14 888 242 7 678 324 52%
95 - mänguasjad, mängud ja spordiinventar; nende osad ja tarvikud
XX 66 863 292 33 112 200 50%
Allikas: Statistikaameti andmebaas, tabel VK200: Kaupade eksport ja Import kaubakoodi (KN 4-kohaline kood) ja riigi järgi, autorite arvutused
Kuna tabelis toodud kaubagruppide näol on tegemist gruppidega, mis on Eesti impordis suhteliselt väikese mahuga, siis kuigi nende päritolumaa on sageli arengumaa, on nende väikese mahu tõttu mõju arengumaadele ka pigem väike. Kaubagrupid, mis arengumaade impordist moodustavad suurima osakaalu on sellised, mis on ka Eestis tervikuna suurimad – s.o jaotis XVI alla kuuluvad kaubagrupid 85 (elektrimasinad ja –seadmed...) ja 86 (tuumareaktorid, katlad, masinad...). Neist kaubagruppidest tuli arengumaadest 527 ja 177 mln euro väärtuses kaupa. Kaubagruppide koguimpordis oli aga arengumaade osatähtsus vastavalt 21% ja 15%.
Alljärgnevalt kirjutame detailsemalt lahti impordi jagunemise riikide vahel kaubagruppide osas, millest suurem osa kaupadest tuleb arengumaadest, s.o. jaotise XII (jalatsid...), jaotise XI (tekstiil...) alla kuuluvad kaubagrupid, samuti jaotise VIII alt kaubagrupi 42 (nahktooted ...) ja jaotise XX alt kaubagrupi 95 (mänguasjad...). Lisaks neile kirjutame lahti suurima impordi absoluutmahuga jaotise XVI alla kuuluvad kaubagrupid.
2.3.1 Jaotis XII (jalatsid…) kaubagruppide ja riikide seosed
XII jaotis sisaldab järgmisi kaubagruppe:
64 Jalatsid jms tooted; nende toodete osad 65 Peakatted ja nende osad 66 Vihmavarjud, päevavarjud, jalutuskepid, piitsad, ratsapiitsad, nende osad 67 Töödeldud suled ja udusuled ning tooted nendest; tehislilled; juustest tooted
Kõikide nimetatud kaubagruppide osas oli 2014. aastal arengumaade impordi osakaal suurem kui 50%.
Joonis 3. Jaotis 12 Impordi jagunemine riigiti 2014. a Allikas: Statistikaameti andmebaas, tabel VK200: Kaupade eksport ja Import kaubakoodi (KN 4-kohaline kood) ja riigi järgi, autorite arvutused
Arengumaadest suurim osakaal kuulus selles jaotises, nagu kogu Eesti impordis, Hiinale, kust pärineb ligi kolmandik selle valdkonna toodetest. Järgnevad Vietnam ja Indoneesia. Jaotise alla kuuluvatest kaubagruppidest on kõikide korral suurimaks päritolumaaks Hiina. Grupi 65 (peakatted...) korral järgneb
Jaotis 12 110 mln
Arengumaad53%
Hiina 31%
Vietnam 7%
Indoneesia 4%
Muud arengumaad (41)12%
Muud riigid48%

10
Vietnami asemel Hiinale Filipiinid, kuid siiski oluliselt tagasihoidlikuma määraga (15% kaubagrupi koguimpordist).
Tervikuna on arengumaade osakaal suurem väikesemahuliste kaubagruppide (66 vihmavarjud... ja 67 töödeldud suled ...) impordis vastavalt 74 % ja 67%.
Tabel 3. Jaotis 12 alla kuuluvate kaubagruppide impordi jagunemine riigiti
Import kokku
Import arengumaadest
Arengumaade osakaal
Arengumaad Riigi import Osakaal kaubagrupi impordist
Grupp 64 100 209 070 52 409 399 52.3% Hiina 30 321 416 30.3%
Vietnam 7 189 201 7.2%
Indoneesia 3 780 667 3.8%
India 2 352 347 2.3%
Muud (34) 8 765 768 8.7%
Grupp 65 8 003 486 4 289 675 53.6% Hiina 2 844 759 35.5%
Sri Lanka 1 166 715 14.6%
Muud (27) 278 201 3.5%
Grupp 66 634 420 470 491 74.2% Hiina 469 066 73.9%
Muud (5) 1 425 0.2%
Grupp 67 1 446 308 979 741 67.7% Hiina 763 442 52.8%
Vietnam 100 467 6.9%
Filipiinid 32 823 2.3%
Muud(6) 83 009 6%
Allikas: Statistikaameti andmebaas, tabel VK200: Kaupade eksport ja Import kaubakoodi (KN 4-kohaline kood) ja riigi järgi, autorite arvutused
Järgnevas tabelis on suurima arengumaadest imporditava kauba osakaaluga grupid kirjeldatud detailsemalt – 4-kohalise koodi tasemel ehk alamgruppidena. Alamgruppide lõikes tuleb grupi 6603 kaupadest pea kõik arengumaadest. Seda peamiselt Hiinast aga väikses osas ka Rumeeniast. Suure impordimahu poolest on silmatorkav alamgrupp 6402, kuhu kuuluvad kummist või plastist jalanõud. Suur osa neist tuleb lisaks Hiinale ka Vietnamist ja Indoneesiast.
Tabel 4. Jaotis 12 alla kuuluvate kaubagruppide impordi jagunemine riigiti
Kood Kauba nimetus Import arengu-maadest
Import kokku
Arengu-maade osakaal
Arengu-maa
Arengu-maa
impordi osakaal
kogu impordist
6603 Rubriikides 6601 ja 6602 nimetatud toodete osad, kaunistused ja manused
19 914 21 971 91% Hiina 88%
Rumeenia 3% 6701 Linnunahad jm linnuosad, kaetud
sulgede või udusulgedega, linnusuled, sulgede osad, udusuled ning tooted nendest (v.a rubriigi 0505 tooted ja töödeldud sulerood ja -tüvikud)
34 289 41 960 82% Hiina 82%
6502 Kübaratoorikud, punutud või valmistatud mis tahes materjalist ribade ühendamise teel, vormimata, servadeta, voodrita, kaunistusteta
3 062 3 901 78% Hiina 77%
Türgi 1% 6402 Muud jalatsid kummist või plastist 11 211 669 14 696 826 76% Hiina 59%

11
välistaldade ja pealsetega Vietnam 7% Indoneesia 5% Brasiilia 1% Kambodža 1% 6601 Vihmavarjud ja päevavarjud (sh
jalutuskepp-vihmavarjud, aiavarjud jms)
448 521 594 154 75% Hiina 75%
6702 Tehislilled, -lehed ja -puuviljad ning nende osad; tehislilledest, -lehtedest või -puuviljadest tooted
541 989 759 925 71% Hiina 68%
Tai 2% Filipiinid 1% Allikas: Statistikaameti andmebaas, tabel VK200: Kaupade eksport ja Import kaubakoodi (KN 4-kohaline kood) ja riigi järgi, autorite arvutused
2.3.2 Jaotis XI (tekstiil…) kaubagruppide ja riikide seosed
XI jaotis: tekstiil ja tekstiilitooted, sisaldab järgmisi kaubagruppe.
Grupp 50 - siid Grupp 51 - lambavill ja muude loomade vill ning loomakarvad; hobusejõhvist lõng ja riie Grupp 52 - puuvill Grupp 53 - muud taimsed tekstiilkiud; paberlõng ja paberlõngast riie Grupp 54 - keemilised filamentkiud; keemiliste tekstiilmaterjalide ribad jms vormid Grupp 55 - keemilised staapelkiud Grupp 56 - vatt, vilt ja lausriie; erilõngad; nöörid, paelad, köied ja trossid ning tooted nendest Grupp 57 - vaibad ja muud tekstiilpõrandakatted Grupp 58 - eririie; taftingriie; pits; seinavaibad; posamendid; tikandid Grupp 59 - impregneeritud, pealistatud, kaetud või lamineeritud tekstiilriie; tekstiiltooted; tööstuslikuks otstarbeks Grupp 60 - silmkoelised ja heegeldatud kangad (trikookangad) Grupp 61 - silmkoelised ja heegeldatud rõivad ning rõivamanused (trikootooted) Grupp 62 - rõivad ning rõivamanused, v.a silmkoelised või heegeldatud Grupp 63 - muud tekstiilist valmistooted; komplektid; kantud rõivad ja kasutatud tekstiiltooted; kaltsud
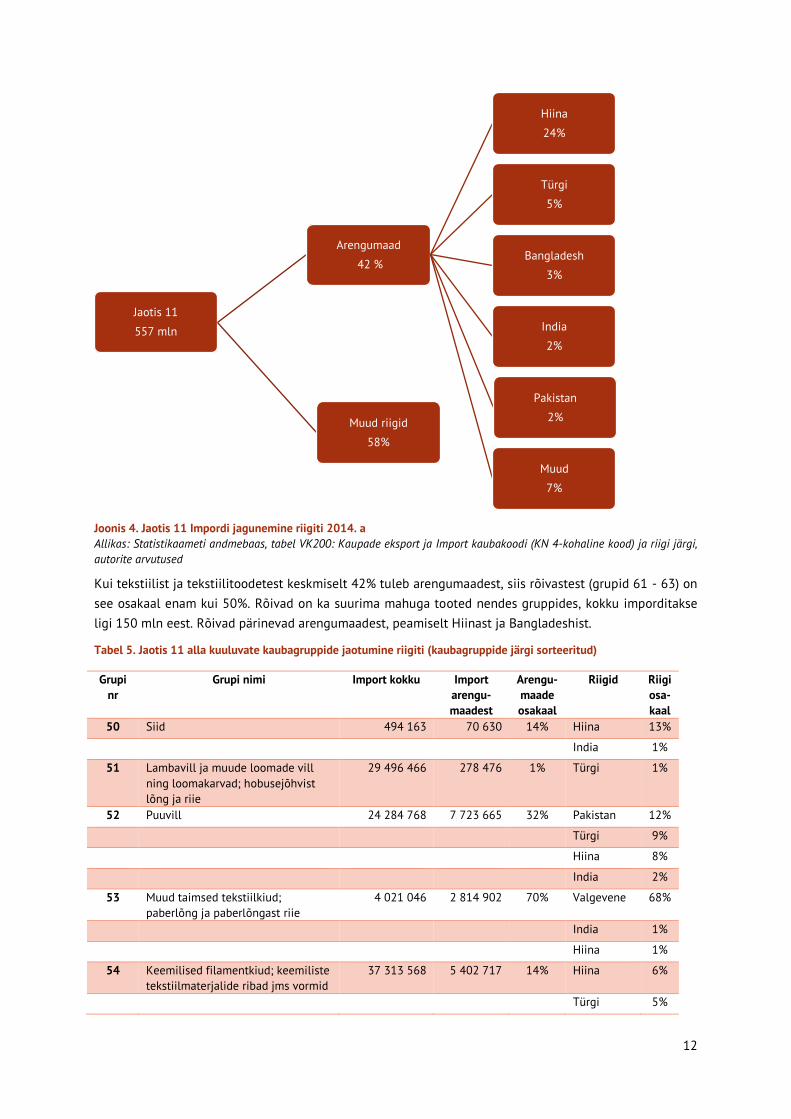
Tekstiili ja tekstiiilitooteid imporditakse 557 mln eest, millest 42% tuleb arengumaadest. Suurimateks on jällegi Hiina (24%) ja Türgi(5%), aga suured impordi mahud on ka Bangladeshist, Indiast ja Pakistanist. Tekstiili ja tekstiiilitooteid imporditakse paljudest Aasia riikidest ning teatud väiksemate tootegruppide puhul võib suur osakaal impordist pärineda ka teistest Aasia riikidest.
12
Joonis 4. Jaotis 11 Impordi jagunemine riigiti 2014. a Allikas: Statistikaameti andmebaas, tabel VK200: Kaupade eksport ja Import kaubakoodi (KN 4-kohaline kood) ja riigi järgi, autorite arvutused
Kui tekstiilist ja tekstiilitoodetest keskmiselt 42% tuleb arengumaadest, siis rõivastest (grupid 61 - 63) on see osakaal enam kui 50%. Rõivad on ka suurima mahuga tooted nendes gruppides, kokku imporditakse ligi 150 mln eest. Rõivad pärinevad arengumaadest, peamiselt Hiinast ja Bangladeshist.
Tabel 5. Jaotis 11 alla kuuluvate kaubagruppide jaotumine riigiti (kaubagruppide järgi sorteeritud)
Grupi nr
Grupi nimi Import kokku Import arengu-maadest
Arengu-maade osakaal
Riigid Riigi osa-kaal
50 Siid 494 163 70 630 14% Hiina 13%
India 1%
51 Lambavill ja muude loomade vill ning loomakarvad; hobusejõhvist lõng ja riie
29 496 466 278 476 1% Türgi 1%
52 Puuvill 24 284 768 7 723 665 32% Pakistan 12%
Türgi 9%
Hiina 8%
India 2%
53 Muud taimsed tekstiilkiud; paberlõng ja paberlõngast riie
4 021 046 2 814 902 70% Valgevene 68%
India 1%
Hiina 1%
54 Keemilised filamentkiud; keemiliste tekstiilmaterjalide ribad jms vormid
37 313 568 5 402 717 14% Hiina 6%
Türgi 5%
Jaotis 11 557 mln
Arengumaad42 %
Hiina 24%
Türgi5%
Bangladesh3%
India2%
Muud7%
Pakistan2%Muud riigid
58%

13
Malaisia 2%
India 1%
55 Keemilised staapelkiud 60 483 449 32 506 160 54% Hiina 40%
Türgi 5%
Pakistan 5%
56 Vatt, vilt ja lausriie; erilõngad; nöörid, paelad, köied ja trossid ning tooted nendest
19 268 098 2 317 764 12% Hiina 10%
Türgi 1%
57 Vaibad ja muud tekstiilpõrandakatted
6 272 618 1 010 357 16% Hiina 7%
India 6%
Türgi 1%
58 Eririie; taftingriie; pits; seinavaibad; posamendid; tikandid
19 870 391 5 115 038 26% Türgi 16%
Hiina 8%
Tai 1%
59 Impregneeritud, pealistatud, kaetud või lamineeritud tekstiilriie; tekstiiltooted tööstuslikuks otstarbeks
24 825 831 2 550 472 10% Hiina 6%
India 2%
Rumeenia 1%
Türgi 1%
60 Silmkoelised ja heegeldatud kangad (trikookangad)
19 369 792 1 636 423 8% Hiina 5%
Türgi 3%
61 Silmkoelised ja heegeldatud rõivad ning rõivamanused (trikootooted)
122 387 177 70 439 702 58% Hiina 28%
Bangladesh 8%
Türgi 7%
India 4%
Kambodža 2%
62 Rõivad ning rõivamanused, v.a silmkoelised või heegeldatud
143 220 903 80 938 270 57% Hiina 31%
Bangladesh 4%
Türgi 3%
India 3%
Vietnam 2%
Rumeenia 2%
Ukraina 2%
Tuneesia 2%
63 Muud tekstiilist valmistooted; komplektid; kantud rõivad ja kasutatud tekstiiltooted; kaltsud
46 013 265 23 899 325 52% Hiina 37%
Pakistan 4%
Ukraina 3%
India 3%
Türgi 3%

14
Allikas: Statistikaameti andmebaas, tabel VK200: Kaupade eksport ja Import kaubakoodi (KN 4-kohaline kood) ja riigi järgi, autorite arvutused
4-kohalise koodiga tähistatud kaupadest on järgnevas tabelis toodud jaotise 11 alla kuuluvatest kaupadest need, mille impordist on suurim osakaal arengumaadel, mille koguimport on suurem kui 20 tuhat eurot aastas ning mis ei ole klassifikatsiooni nimega „muud kaubad“. Viimased jäävad vaatluse alt välja, sest sellistest kaupadest ei ole võimalik aru saada esitamata kogu klassifikatsiooni. Praegusel juhul aga vaadatakse ainult suuremaid kaubagruppe.
Arengumaadest imporditakse osakaalult peaaegu kogu vill ja lõng (alamgrupid 5206, 5201, 5403), mida tuuakse Türgist, Kasahstanist, Usbekistanist ja Indiast.
Tabel 6. Jaotis 11 alla kuuluvate 4-kohaliste kaubagruppide jaotumine riigiti
Kood Kaubagrupi nimetus Import kokku
Import arengu-maadest
Arengu-maade osakaal
Riik Riigi osakaal
impordis 5206 Puuvillane lõng (v.a õmblusniit)
puuvillasisaldusega alla 85 % massist, jaemüügiks pakendamata
315 926 314 424 100% Türgi 100%
5201 Puuvill, kraasimata ja kammimata 21 133 20 274 96% Kasahstan 82%
Usbekistan 14%
5403 Lõng tehisfilamentkiududest (v.a õmblusniit), jaemüügiks pakendamata, k.a tehismonofilament joontihedusega alla 67 detsiteksi…
84 554 78 092 92% India 6%
Indoneesia 87%
5513 Riie sünteesstaapelkiududest segus peamiselt või üksnes puuvillaga, sünteesstaapelkiudude sisaldusega alla 85 % massist, pindtihedusega mitte üle 170 g/m²
8 045 185 7 246 610 90% Hiina 60%
Pakistan 30%
5305 Kookoskiud, manillakanep (abaka ehk Musa textilis Nee), ramjee jt mujal nimetamata taimsed kiud, toored või töödeldud, kuid ketramata; nende kiudude takud, kraasmed ja jäätmed (sh lõngajäätmed ja kohestatud jäätmed)
31 688 26 537 84% India 74%
Sri Lanka 9%
5516 Tehisstaapelkiududest riie 11 425 525 9 134 404 80% Hiina 79%
Türgi 1%
6216 Sõrmkindad, labakindad ja sõrmedeta kindad
2 110 368 1 675 668 79% Hiina 75%
Pakistan 2%
Indoneesia 2%
6209 Väikelaste rõivad ja rõivamanused 1 369 641 1 067 593 78% Hiina 59%
Bangladesh 7%
India 4%
Sri Lanka 4%
5309 Linane riie 3 546 083 2 752 325 78% Valgevene 76%
Türgi 1%
5204 Puuvillane õmblusniit, jaemüügiks 36 976 28 475 77% Türgi 65%

15
pakendatud või pakendamata
India 11%
Hiina 1%
6116 Sõrmkindad, labakindad ja sõrmedeta kindad, silmkoelised või heegeldatud
4 205 973 3 219 567 77% Hiina 67%
Sri Lanka 4%
Pakistan 3%
6107 Meeste ja poiste aluspüksid, püksikud, öösärgid, pidžaamad, supelmantlid, hommikumantlid jms rõivaesemed, silmkoelised või heegeldatud
4 124 949 3 004 156 73% Hiina 33%
Bangladesh 9%
India 9%
Sri Lanka 5%
Rumeenia 3%
Türgi 3%
Kambodža 3%
Tai 2%
Pakistan 2%
5605 Metalliseeritud lõng, mähitud või mähkimata, mis koosneb metallniidi, -riba või -pulbriga kombineeritud või metalliga kaetud tekstiillõngast või rubriigi 5404 või 5405 ribast vms
60 668 43 564 72% Hiina 66%
Türgi 5%
6205 Meeste ja poiste päevasärgid 5 811 290 4 162 000 72% Hiina 25%
India 17%
Bangladesh 8%
Türgi 8%
Rumeenia 3%
Vietnam 2%
Indoneesia 2%
Allikas: Statistikaameti andmebaas, tabel VK200: Kaupade eksport ja Import kaubakoodi (KN 4-kohaline kood) ja riigi järgi, autorite arvutused
2.3.3 Jaotise VIII (nahktooted ...) kaubagruppide ja riikide seosed
Jaotise VIII all on kolm 2-kohalise koodiga tähistatud kaubagruppi.
Grupp 41 - toornahad (v.a karusnahad) ja nahk Grupp 42 - nahktooted; sadulsepatooted ja rakmed; reisitarbed, käekotid jms tooted; tooted loomasooltest (v.a jämesiidist) Grupp 43 - karusnahk ja tehiskarusnahk; nendest valmistatud tooted
Keskmiselt on VIII jaotise import arengumaadest suhteliselt väike – ligi veerand, kuid see ei ole kaubagruppide üleselt ühtlane jaotus. Grupp 41 ja 43 on suhteliselt väikese arengumaade osakaaluga, kuid grupist 42 imporditakse 60% arengumaadest.

16
Joonis 5. Jaotis 8 (toornahad, nahk, karusnahk ja tooted nendest; sadulsepatooted ja rakmed; reisitarbed, käekotid jms tooted; tooted loomasooltest (v.a jämesiidist)) Impordi jagunemine riigiti 2014. a Allikas: Statistikaameti andmebaas, tabel VK200: Kaupade eksport ja Import kaubakoodi (KN 4-kohaline kood) ja riigi järgi, autorite arvutused
Joonis 6. Kaubagrupp 42 (nahktooted, sadulsepatooted ja rakmed, reisitarbed, käekotid jms tooted, tooted loomasoolest (V.a jämesiidist)) impordi jagunemine riigiti 2014. a Allikas: Statistikaameti andmebaas, tabel VK200: Kaupade eksport ja Import kaubakoodi (KN 4-kohaline kood) ja riigi järgi, autorite arvutused
Oluline on arengumaade osakaal just nahast kottide, kohvrite ja karpide ning rõivaste ja rõivamanuste impordis, mis on ka kogu kaubagrupi suurimad impordiartiklid. Kõikide kaupade korral on arengumaadest suurim osakaal just Hiinal, väiksema mahuga panustavad ka Pakistan, India, Indoneesia, Türgi, Vietnam jt maad.
Jaotis 8 94 mln
Arengumaad28%
Hiina 19%
India 1%
Pakistan1%
Muud arengumaad (37)6%
Muud riigid72%
Grupp 4238 mln
Arengumaad60%
Hiina 45%
India 3%
Pakistan3%
Indoneesia3%
Muud (32)6%
Muud riigid40%

17
Tabel 7 Jaotis 8 alla kuuluvate 4-kohaliste kaubagruppide jaotumine riigiti
Kood Kauba nimetus Import arengumaadest
Import kokku
Arengu-maade osakaal
Riik Arengu-maa
osakaal 4201 Mis tahes materjalist
sadulsepatooted ja rakmed mis tahes loomadele (sh trengid, ohjad, põlvekaitsmed, suukorvid, sadulakatted, sadulakotid, koeramantlid jms)
164 081 484 876 34% Hiina 32%
4202 Reisikohvrid, käsikohvrid, kosmeetikakohvrikesed, diplomaadikohvrid, portfellid, ranitsad, prillitoosid, binokli-, kaamera-, muusikariista- või püssivutlarid, püstolikabuurid jms tooted; reisikotid, termoskotid toidukaupade ja jookide jaoks, tualett-tarvete kotid, seljakotid, käekotid, kandekotid, rahakotid, rahataskud, kaarditaskud, portsigarid, tubakakotid, tööriistakotid, spordikotid, pudelite kandekastid ja -karbid, ehtekarbid, puudritoosid, lauahõbedakarbid jms tooted nahast või komposiitnahast, lehtplastidest, tekstiilmaterjalidest, vulkaniseeritud kiust või papist, täielikult või osaliselt kaetud nimetatud materjalide või paberiga
16 445 248 269 56314 61% Hiina 49%
Indoneesia 4%
Vietnam 3%
India 2%
4203 Nahast või komposiitnahast rõivad ja rõivamanused
6 460 129 10 959799 59% Hiina 36%
Pakistan 11%
India 6%
Türgi 4%
Allikas: Statistikaameti andmebaas, tabel VK200: Kaupade eksport ja Import kaubakoodi (KN 4-kohaline kood) ja riigi järgi, autorite arvutused
2.3.4 Jaotise XX (mänguasjad...) kaubagruppide ja riikide seosed
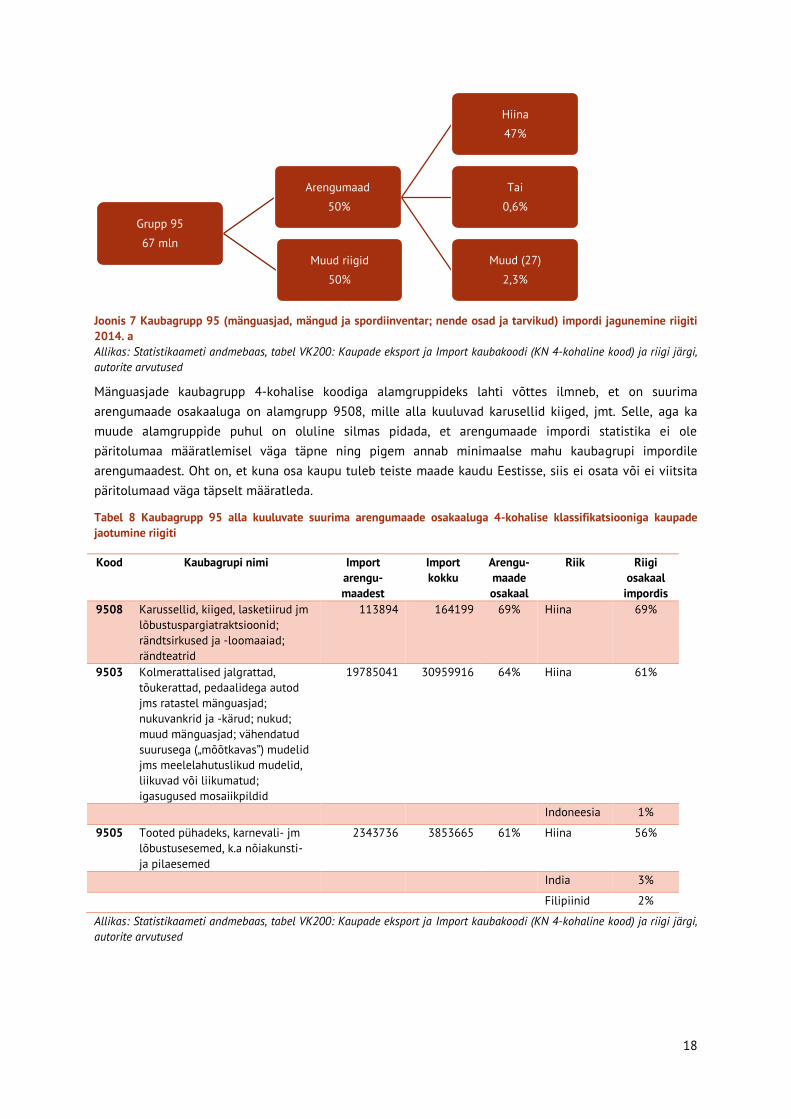
Jaotise XX, ehk mitmesugused tööstustooted, impordist pärineb vaid ligi veerand arengumaadest (24%). See tuleb valdavalt Hiinast, kõikidest teistest arengumaadest tuuakse alla 1% selle kaubagrupi impordist. Nii nagu jaotise VIII puhul pole ka selles jaotises kõik kaubagrupid arengumaade osatähtsuselt sarnaselt väikesed. Kaubagrupi 95 (mänguasjad, mängud ja spordiinventar; nende osad ja tarvikud) impordist pool tuleb arengumaadest ning valdavas osas jällegi Hiinast (46,7%). Kõigist teistest riikidest imporditi alla 1% kogu kaubagrupi impordist.
18
Joonis 7 Kaubagrupp 95 (mänguasjad, mängud ja spordiinventar; nende osad ja tarvikud) impordi jagunemine riigiti 2014. a Allikas: Statistikaameti andmebaas, tabel VK200: Kaupade eksport ja Import kaubakoodi (KN 4-kohaline kood) ja riigi järgi, autorite arvutused
Mänguasjade kaubagrupp 4-kohalise koodiga alamgruppideks lahti võttes ilmneb, et on suurima arengumaade osakaaluga on alamgrupp 9508, mille alla kuuluvad karusellid kiiged, jmt. Selle, aga ka muude alamgruppide puhul on oluline silmas pidada, et arengumaade impordi statistika ei ole päritolumaa määratlemisel väga täpne ning pigem annab minimaalse mahu kaubagrupi impordile arengumaadest. Oht on, et kuna osa kaupu tuleb teiste maade kaudu Eestisse, siis ei osata või ei viitsita päritolumaad väga täpselt määratleda.
Tabel 8 Kaubagrupp 95 alla kuuluvate suurima arengumaade osakaaluga 4-kohalise klassifikatsiooniga kaupade jaotumine riigiti
Kood Kaubagrupi nimi Import arengu-maadest
Import kokku
Arengu-maade osakaal
Riik Riigi osakaal
impordis 9508 Karussellid, kiiged, lasketiirud jm
lõbustuspargiatraktsioonid; rändtsirkused ja -loomaaiad; rändteatrid
113894 164199 69% Hiina 69%
9503 Kolmerattalised jalgrattad, tõukerattad, pedaalidega autod jms ratastel mänguasjad; nukuvankrid ja -kärud; nukud; muud mänguasjad; vähendatud suurusega („mõõtkavas”) mudelid jms meelelahutuslikud mudelid, liikuvad või liikumatud; igasugused mosaiikpildid
19785041 30959916 64% Hiina 61%
Indoneesia 1%
9505 Tooted pühadeks, karnevali- jm lõbustusesemed, k.a nõiakunsti- ja pilaesemed
2343736 3853665 61% Hiina 56%
India 3%
Filipiinid 2%
Allikas: Statistikaameti andmebaas, tabel VK200: Kaupade eksport ja Import kaubakoodi (KN 4-kohaline kood) ja riigi järgi, autorite arvutused
Grupp 9567 mln
Arengumaad50%
Hiina 47%
Tai 0,6%
Muud (27)2,3%
Muud riigid50%

19
2.3.5 Jaotis XVI (masinad…) kaubagruppide ja riikide seosed
Jaotis XVI on suurim imporditavate kaupade grupp absoluutmahus nii kõikidest riikidest kokku kui ka arengumaadest. Sellest grupist otsese päritolumaana on arenguriike märgitud suhteliselt vähe, vaid viiendiku (19,6%) kaupade korral. Suurimad pärituolumaad on arengumaadest jällegi Hiina (15,5%), kuid ka Rumeenia (1,3%).
Joonis 8. Jaotis XVI impordi jagunemine riikide järgi Allikas: Statistikaameti andmebaas, tabel VK200: Kaupade eksport ja Import kaubakoodi (KN 4-kohaline kood) ja riigi järgi, autorite arvutused
Jaotise alla kuuluvad kaks kaubagruppi.
1. Grupp 84 - tuumareaktorid, katlad, masinad ja mehaanilised seadmed; nende osad (arengumaade osatähtsus 21%)
2. Grupp 85 - elektrimasinad ja -seadmed, nende osad; helisalvestus- ja taasesitusseadmed, telepildi ja -heli salvestus- ja taasesitusseadmed, nende osad ja tarvikud (arengumaade osatähtsus 16%)
4-kohalise kaupade klassifikatsiooni tasemel tuleb enam kui 60% arengumaadest kahe alamgrupi puhul (8545 ja 8534). Mõlema alamgrupi puhul on Hiina osa valdav võrreldes teiste arengumaadega. Tabel 9 Jaotis 16 alla kuuluvate 4-kohaliste kaubagruppide, mille arengumaade osakaal on suurem kui 60%, jaotumine riigiti
Kood Nimi Import arengu-maadest
Import kokku
Arengu-maade osakaal
Riik Osakaal
8545 Süsielektroodid, süsiharjad, kaarlambi- ja primaarelemendisöed jms elektrotehnikatooted grafiidist või muust süsiniku erimist, metallosadega või metallosadeta
1523224 2285769 67% Hiina 67%
8534 Trükilülitused 74873604 122049031 61% Hiina 61%
Allikas: Statistikaameti andmebaas, tabel VK200: Kaupade eksport ja Import kaubakoodi (KN 4-kohaline kood) ja riigi järgi, autorite arvutused
Ligi pool kaubast tuleb arengumaadest ka järgmiste alamgruppide puhul.
Tabel 10. Jaotis 16 alla kuuluvate 4-kohaliste kaubagruppide, mille arengumaade osakaal on ligi 50%, jaotumine riigiti
Kood Kaubagrupi nimetus Import arengu-maadest
Import kokku Arengu-maade osakaal
Riik Riigi osakaal
8513 Kantavad elektrivalgustid oma 636457 1200992 53% Hiina 50%
Jaotis XVI3 594 mln
Arengumaad20 %
Hiina 16 %
Rumeenia1,3 %
Tai 0,8 %
Muud (60) 2%
Muud riigid80 %

20
vooluallikaga (näiteks patarei, aku, magneeto), v.a rubriiki 8512 kuuluvad
8527 Ringhäälingu vastuvõtuaparaadid, samasse korpusesse paigaldatud helisalvestus või -taasesitusseadmete või ajanäitajaga või ilma nendeta
2497996 4811209 52% Hiina 34%
Tai 10%
Malaisia 4%
8473 Osad ja tarvikud (v.a katted, kandekastid jms), mida kasutatakse üksnes või peamiselt rubriikide 8469–8472 seadmete juures
7836434 15463121 51% Hiina 42%
Malaisia 7%
8467 Käsiinstrumendid, pneumaatilise, hüdraulilise või sisseehitatud elektrilise või mitte-elektrilise ajamiga
19812830 41514908 48% Hiina 43%
Rumeenia 5%
8518 Mikrofonid ja nende alused; valjuhääldid, korpusesse monteeritud või monteerimata; kõrvaklapid ja kuularid, komplektis mikrofoniga või mikrofonita, ning mikrofoni ja üht või mitut valjuhääldit sisaldavad komplektid; elektrilised helisagedusvõimendid; elektriline helivõimendusaparatuur
5375079 11498202 47% Hiina 42%
Mehhiko 2%
8478 Käesolevas grupis mujal nimetamata seadmed tubakataimede eeltöötluseks ning tubakatoodete valmistamiseks
10647 23198 46% Indoneesia 46%
8471 Arvutid, nende plokid; optilised ning magnetriiderid, seadmed kodeeritud andmete kirjutamiseks andmekandjatele, mujal nimetamata seadmed nende andmete töötlemiseks
45642276 101975155 45% Hiina 39%
Vietnam 3%
Allikas: Statistikaameti andmebaas, tabel VK200: Kaupade eksport ja Import kaubakoodi (KN 4-kohaline kood) ja riigi järgi, autorite arvutused
2.4 Eestisse sisse toodavad suuremad kaubaartiklid lähtuvalt
valitud arengumaadest Kui eelnevalt kirjeldasime suurema impordimahu ja suurima arengumaade osakaaluga kaubagruppide importi arengumaade lõikes, siis siinkohal kirjeldame arengumaade kaupa, millised on suurimad impordiartiklid neist maadest. Arengumaad, mida vaatame on järgmise peatüki jaoks valitud kahe põhimõtte alusel: 1) maal on Eesti impordis suhteliselt suur osakaal, 2) maa on välja toodud kui lapstööjõudu kasutav riik (U.S. Department Of Labor, 2010 uuringu põhjal).
2.4.1 Hiina
Hiina kui arenguriigi osakaal Eesti koguimpordist on kõige suurem – 961 miljonit eurot ehk 7,68%. arenguriikide impordist on see üle poole ehk 61,21%.
Kaubagrupid (2-kohalise koodi tasemel), mille osatähtsus Hiina päritolu toodetel Eestisse importimisel on suurim tuuakse välja järgmises tabelis. Jaotistest kajastuvad siin kõige enam XI (tekstiil…) ja XII (jalatsid, peakatted…).

21
Tabel 11. Suurema Hiina impordi osakaaluga kaubagrupid Eestis (2-kohalise koodi tasemel) 2014. aastal
Kaubagrupi nr ja nimetus Jaotis Import Hiinast % Eesti kaubagrupi
impordist 66 - vihma- ja päevavarjud, jalutuskepid, istmega jalutuskepid, piitsad, ratsapiitsad ja nende osad
XII 469 066 73,9%
46 - õlgedest, espartost ja muudest punumismaterjalidest tooted; korv- ja vitspunutised
IX 645 608 64,2%
67 - töödeldud suled ja udusuled ning tooted nendest; tehislilled; tooted juustest
XII 763 442 52,8%
95 - mänguasjad, mängud ja spordiinventar; nende osad ja tarvikud
XIX 31 200 000 46,6%
42 - nahktooted; sadulsepatooted ja rakmed; reisitarbed, käekotid jms tooted; tooted loomasooltest (v.a jämesiidist)
X 17 300 000 44,8%
55 - keemilised staapelkiud XI 24 300 000 40,2%
63 - muud tekstiilist valmistooted; komplektid; kantud rõivad ja kasutatud tekstiiltooted; kaltsud
XI 17 200 000 37,4%
65 - peakatted ja nende osad XII 2 844 759 35,5%
62 - rõivad ning rõivamanused, v.a silmkoelised või heegeldatud
XI 44 000 000 30,8%
64 - jalatsid, kedrid jms tooted; nende osad XII 30 300 000 30,3%
61 - silmkoelised ja heegeldatud rõivad ning rõivamanused (trikootooted)
XI 34 700 000 28,4%
Allikas: Statistikaameti andmebaas, tabel VK200: Kaupade eksport ja Import kaubakoodi (KN 4-kohaline kood) ja riigi järgi, autorite arvutused
4-kohalise alamgrupigrupi koodi tasemel on toodud järgmises tabelis välja kaubad, mille osas tuuakse pooled või enam Hiinast. Tabelisse on pandud ainult need alamgrupid, mille impordi absoluutmaht Hiinast oli suurem kui 100 tuhat eurot. Mõnede väiksemate alamgruppide puhul on samuti Hiina peamiseks importijamaaks, kuid grupi väikese mahu tõttu on see üleüldiselt võttes väiksema tähtsusega.
Tabel 12. Suurema Hiina impordi osakaaluga kaubagrupid Eestis (4-kohalise koodi tasemel) 2014. aastal
Kaubagrupi nimetus kood Import Hiinast Import kokku Hiina osakaal kogu kaubagrupi impordist
Klompkivi, ääriskivid ja sillutusplaadid looduslikust kivist (v.a kiltkivist)
6801 369 167 373 504 99%
Puitraamid maalidele, fotodele, peeglitele jms
4414 854 897 1 032 619 83%
Tehisstaapelkiududest riie 5516 9 059 818 11 425 525 79%
Kampol- ja vaikhapped, nende derivaadid; kampolpiiritus ja kampolõlid; ümbersulatatud vaigud
3806 108 321 141 115 77%
Vihmavarjud ja päevavarjud (sh jalutuskepp-vihmavarjud, aiavarjud jms)
6601 447 726 594 154 75%
Sõrmkindad, labakindad ja sõrmedeta kindad
6216 1 576 999 2 110 368 75%
Ioonivahetajad, mis põhinevad rubriikide 3901–3913 polümeeridel, algkujul
3914 2 581 558 3 500 155 74%
Heterotsüklilised ühendid, millel ei ole muid heteroaatomeid peale lämmastiku aatomi(te)
2933 1 168 438 1 649 777 71%
Muud kellad 9105 467 724 664 798 70%
Põimikud jms tooted punumismaterjalidest, lindiks ühendatud
4601 114 238 164 668 69%

22
Kaubagrupi nimetus kood Import Hiinast Import kokku Hiina osakaal kogu kaubagrupi impordist
või mitte; punumismaterjalid, põimikud jms tooted nendest, paralleelsetest kiududest lamevormiks kokku punutud või kootud, ka valmistooted (näiteks matid, kiudvaibad, võrestikud) Karussellid, kiiged, lasketiirud jm lõbustuspargiatraktsioonid; rändtsirkused ja -loomaaiad; rändteatrid
9508 113 894 164 199 69%
Tehislilled, -lehed ja -puuviljad ning nende osad; tehislilledest, -lehtedest või -puuviljadest tooted
6702 519 076 759 925 68%
Leelismetallid ja leelismuldmetallid; haruldased muldmetallid, skandium ja ütrium (ehedana, segudena või sulamitena); elavhõbe
2805 500 372 740 303 68%
Sõrmkindad, labakindad ja sõrmedeta kindad, silmkoelised või heegeldatud
6116 2 827 054 4 205 973 67%
Süsielektroodid, süsiharjad, kaarlambi- ja primaarelemendisöed jms elektrotehnikatooted grafiidist või muust süsiniku erimist, metallosadega või metallosadeta
8545 1 523 174 2 285 769 67%
Korvpunutised, vitspunutised jms tooted, valmistatud punumismaterjalidest kindla kuju järgi või toodetud rubriigi 4601 punutistest; tooted käsnkõrvitsast
4602 531 370 841 670 63%
Kolmerattalised jalgrattad, tõukerattad, pedaalidega autod jms ratastel mänguasjad; nukuvankrid ja -kärud; nukud; muud mänguasjad; vähendatud suurusega („mõõtkavas”) mudelid jms meelelahutuslikud mudelid, liikuvad või liikumatud; igasugused mosaiikpildid
9503 18 970 837 30 959 916 61%
Trükilülitused 8534 73 860 568 122 049 031 61%
Riie sünteesstaapelkiududest segus peamiselt või üksnes puuvillaga, sünteesstaapelkiudude sisaldusega alla 85 % massist, pindtihedusega mitte üle 170 g/m²
5513 4 859 741 8 045 185 60%
Väikelaste rõivad ja rõivamanused 6209 813 378 1 369 641 59%
Heterotsüklilised ühendid, millel ei ole muid heteroaatomeid peale hapniku aatomi(te)
2932 273 529 461 239 59%
Muud jalatsid kummist või plastist välistaldade ja pealsetega
6402 8 615 830 14 696 826 59%
Tooted looduslikest või kultiveeritud pärlitest, vääris- või poolvääriskividest (looduslikest, tehislikest või taastatud)
7116 244 612 422 123 58%
Muu sünteesstaapelkiududest riie 5515 5 730 298 10 039 419 57%
Tooted pühadeks, karnevali- jm lõbustusesemed, k.a nõiakunsti- ja pilaesemed
9505 2 153 212 3 853 665 56%
Raudoksiidid ja -hüdroksiidid; muldvärvid, mis sisaldavad massist vähemalt 70 % keemiliselt seotud rauda
2821 346 983 629 895 55%

23
Kaubagrupi nimetus kood Import Hiinast Import kokku Hiina osakaal kogu kaubagrupi impordist
(arvestatuna Fe2O3-le)
Tekid ja reisivaibad 6301 967 104 1 823 217 53%
Termosed jm vaakumanumad koos ümbrisega; nende osad, v.a klaaskolvid
9617 266 876 505 322 53%
Puitmarketrii ja -intarsia; puitlaekad ja -kastikesed juveeltoodete, terariistade jms hoidmiseks; puidust kujukesed jm dekoratiivesemed; puidust mööbliesemed, mis ei kuulu gruppi 94
4420 202 330 389 230 52%
Difosforpentaoksiid; fosforhape; kindla või muutuva keemilise koostisega polüfosforhapped
2809 100 201 194 678 51%
Juveeltoodete imitatsioonid 7117 1 768 253 3 491 801 51%
Kantavad elektrivalgustid oma vooluallikaga (näiteks patarei, aku, magneeto), v.a rubriiki 8512 kuuluvad
8513 605 907 1 200 992 50%
Laste pildiraamatud, joonistus- ja värvimisalbumid
4903 466 404 928 783 50%
Väävelorgaanilised ühendid 2930 733 418 1 464 792 50%
Naiste ja tüdrukute mantlid, poolmantlid, keebid, joped, anorakid (sh suusajakid), tuulejoped ja tuulepluusid jms, v.a rubriiki 6204 kuuluvad rõivad
6202 9 350 053 18 862 944 50%
Kotid kaupade pakendamiseks 6305 1 327 591 2 691 196 49%
Reisikohvrid, käsikohvrid, kosmeetikakohvrikesed, diplomaadikohvrid, portfellid, ranitsad, prillitoosid, binokli-, kaamera-, muusikariista- või püssivutlarid, püstolikabuurid jms tooted; reisikotid, termoskotid toidukaupade ja jookide jaoks, tualett-tarvete kotid, seljakotid, käekotid, kandekotid, rahakotid, rahataskud, kaarditaskud, portsigarid, tubakakotid, tööriistakotid, spordikotid, pudelite kandekastid ja -karbid, ehtekarbid, puudritoosid, lauahõbedakarbid jms tooted nahast või komposiitnahast, lehtplastidest, tekstiilmaterjalidest, vulkaniseeritud kiust või papist, täielikult või osaliselt kaetud nimetatud materjalide või paberiga
4202 13 144 081 26 956 314 49%
Allikas: Statistikaameti andmebaas, tabel VK200: Kaupade eksport ja Import kaubakoodi (KN 4-kohaline kood) ja riigi järgi, autorite arvutused
2.4.2 Türgi
Hiinaga võrreldes pole ühelgi teisel arengumaal kaubagruppide impordis sedavõrd suurt osatähtsust. Arengumaadest teisel kohal olevast Türgist imporditi Eestisse 91 mln euro eest kaupu, mis kogu Eesti impordist moodustas vaid 0,72%.
Kõige suurema osakaaluga on Türgi import kaubagrupi 58 (eririie, taftingriie …) puhul, kus Türgi osakaal on 16%. Kahekohalise tähisega kaubagruppide puhul on Türgist suurema osakaaluga veel neid, mis kuuluvad jaotisesse XI (tekstiil…).

24
Tabel 13. Suurema Türgi impordi osakaaluga kaubagrupid Eestis (2-kohalise koodi tasemel) 2014. aastal
Kaubagrupi nimi kood Jaotis Import kokku % kogu riigi kaubagrupi impordist
58 - eririie; taftingriie; pits; seinavaibad; posamendid; tikandid
58 XI 3 234 822 16%
5 - mujal nimetamata loomsed tooted
5 I 355 846 13%
52 – puuvill 52 XI 2 109 532 9%
61 - silmkoelised ja heegeldatud rõivad ning rõivamanused (trikootooted)
61 XI 8 190 584 7%
69 - keraamikatooted 69 XIII 2 582 671 6%
54 - keemilised filamentkiud; keemiliste tekstiilmaterjalide ribad jms vormid
54 XI 2 028 492 5%
55 - keemilised staapelkiud 55 XI 3 031 086 5%
26 - maagid, räbu ja tuhk 26 V 24 467 5%
28 - anorgaanilised kemikaalid; väärismetallide, haruldaste muldmetallide, radioaktiivsete elementide ja isotoopide orgaanilised ja anorgaanilised ühendid
28 VI 1 757 025 4%
60 - silmkoelised ja heegeldatud kangad (trikookangad)
60 XI 671 986 3%
Allikas: Statistikaameti andmebaas, tabel VK200: Kaupade eksport ja Import kaubakoodi (KN 4-kohaline kood) ja riigi järgi, autorite arvutused
Vaadates 4-kohalise koodiga tähistatud kaupu ehk varasemaid kaubagruppe spetsiifilisemalt, siis ilmneb, et nelja alamgrupi lõikes tuleb enam kui pool impordist Türgist. Kolm neist alamgruppidest on jaotisest XI (tekstiil ja tekstiilitooted) ja on seotud teatud sorti lõngade ja riidega. Veel nelja alamgrupi osas on Türgi osakaal umbes veerand. Need kuuluvad erinevate kaupade jaotiste alla.
Tabel 14. Suurema Türgi impordi osakaaluga kaubagrupid Eestis (4-kohalise koodi tasemel) 2014. aastal
Nimetus Kood Import Türgist
Türgi osakaal riigi kogu impordis
Puuvillane lõng (v.a õmblusniit) puuvillasisaldusega alla 85 % massist, jaemüügiks pakendamata
5206 314424 100%
Trossikee, trossid, punutud lindid jms alumiiniumist tooted, elektriisolatsioonita
7614 691307 94%
Lõng (v.a õmblusniit) keemilistest staapelkiududest, jaemüügiks pakendatud
5511 250936 60%
Karusriie ja šenillriie, v.a rubriikide 5802 ja 5806 riie 5801 3120476 49%
Juveeltooted ning nende osad väärismetallist või väärismetalliga plakeeritud metallist
7113 2781674 28%
Karbonaadid; peroksokarbonaadid (perkarbonaadid); tehniline ammooniumkarbonaat (sisaldab ammooniumkarbamaati)
2836 1746859 24%
Keraamilised valamud, kraanikausid, kraanikausijalad, vannid, bideed, klosetipotid, loputuskastid, pissuaarid jms sanitaartehnikatooted
6910 1168231 24%
Kuivatatud puuviljad ja marjad, v.a rubriikide 0801–0806 puuviljad; selle grupi pähklite või kuivatatud puuviljade ja marjade segud
0813 755272 21%
Allikas: Statistikaameti andmebaas, tabel VK200: Kaupade eksport ja Import kaubakoodi (KN 4-kohaline kood) ja riigi järgi, autorite arvutused

25
2.4.3 Bangladesh
Eesti import Bangladeshist oli 2014. aastal 17,96 mln eurot, mis kogu Eesti impordist moodustas 0,14%.
Bangladeshist ei imporditud ühtegi kaupa sellises mahus, et selle osakaal oleks enam kui kümnendik. Kokku oli nelja kaubagrupi osas Bangladeshi osakaal enam kui 1% kogu selle kaubagrupi impordist. Need on toodud alljärgnevas tabelis. Neist kolm kuuluvad jaotise XI (tekstiil…) alla ja üks XII (jalatsid…) alla.
Tabel 15. Suurema Bangladeshi impordi osakaaluga kaubagrupid Eestis (2-kohalise koodi tasemel) 2014. aastal
Kaubagrupi nimetus Kood Import Bangladeshist Bangladeshi osakaal kogu impordist
61 - silmkoelised ja heegeldatud rõivad ning rõivamanused (trikootooted)
61 9933914 8%
62 - rõivad ning rõivamanused, v.a silmkoelised või heegeldatud
62 5904067 4%
64 - jalatsid, kedrid jms tooted; nende osad 64 1228737 1%
63 - muud tekstiilist valmistooted; komplektid; kantud rõivad ja kasutatud tekstiiltooted; kaltsud
63 323909 1%
Allikas: Statistikaameti andmebaas, tabel VK200: Kaupade eksport ja Import kaubakoodi (KN 4-kohaline kood) ja riigi järgi, autorite arvutused
4-kohalise alamgrupi koodiga kaupadest tuli viies grupis ligi kümnendik või enam impordist Bangladeshist. Kõik need alamgrupid kuuluvad 2-kohalisse kaubagruppi 61, mis on jaotisest XI (tekstiil….).
Tabel 16. Suurema Bangladeshi impordi osakaaluga kaubagrupid Eestis (4-kohalise koodi tasemel) 2014. aastal
Kaubagrupi nimetus kood Import Bangladeshist
Bangladeshi osakaal kogu impordist
T-särgid, särgikud ja muud alussärgid, silmkoelised või heegeldatud
6109 3883153 19%
Meeste ja poiste päevasärgid, silmkoelised või heegeldatud 6105 340444 12%
Väikelaste rõivad ja rõivamanused, silmkoelised või heegeldatud
6111 366354 11%
Meeste ja poiste aluspüksid, püksikud, öösärgid, pidžaamad, supelmantlid, hommikumantlid jms rõivaesemed, silmkoelised või heegeldatud
6107 360785 9%
Kampsunid, pulloverid, kardiganid, vestid jms rõivaesemed, silmkoelised või heegeldatud
6110 2302446 9%
Allikas: Statistikaameti andmebaas, tabel VK200: Kaupade eksport ja Import kaubakoodi (KN 4-kohaline kood) ja riigi järgi, autorite arvutused
2.4.4 India
Eesti importist pärines Indiast 2014. aastal 42,7 mln euro eest kaupa, mis moodustab 0,34% kogu Eesti impordist.
Kümne suurima India osakaaluga 2-kohalise tähisega kaubagruppidest on suurima absoluutmahuga kolm kaubagruppi, mis kuuluvad jaotise XI (tekstiil…) alla. Suurim suhteline osakaal päritolumaana on Indial kaubagruppides 13 (šellak….) ja 9 (kohv…), mis on jaotisest II (taimsed tooted).
Tabel 17. Suurema India impordi osakaaluga kaubagrupid Eestis (2-kohalise koodi tasemel) 2014. aastal
Kaubagrupi nimetus Kood Jaotis Import Indiast
India osakaal kogu impordist
13 - šellak; kummivaigud, vaigud ja muud taimemahlad ja -ekstraktid
13 II 99199 7%
9 - kohv, tee, mate ja vürtsid 9 II 3137862 6%

26
57 - vaibad ja muud tekstiilpõrandakatted 57 385334 6%
61 - silmkoelised ja heegeldatud rõivad ning rõivamanused (trikootooted)
61 XI 5191290 4%
36 - lõhkeained; pürotehnilised tooted; tuletikud; pürofoorsed sulamid; teatavad kergsüttivad valmistised
36 VI 229222 3%
42 - nahktooted; sadulsepatooted ja rakmed; reisitarbed, käekotid jms tooted; tooted loomasooltest (v.a jämesiidist)
42 VIII 1318386 3%
80 - tina ja tinatooted 80 XV 36206 3%
62 - rõivad ning rõivamanused, v.a silmkoelised või heegeldatud
62 XI 4381125 3%
63 - muud tekstiilist valmistooted; komplektid; kantud rõivad ja kasutatud tekstiiltooted; kaltsud
63 XI 1299760 3%
64 - jalatsid, kedrid jms tooted; nende osad 64 XII 2352347 2%
Allikas: Statistikaameti andmebaas, tabel VK200: Kaupade eksport ja Import kaubakoodi (KN 4-kohaline kood) ja riigi järgi, autorite arvutused
4-kohalise koodiga alamgruppidest on kolm, millest enam kui pool imporditakse Indiast. Neist üks (alamgrupp 7102) kuulub jaotise XIV (looduslikud ja kultiveeritud pärlid…) alla ja kaks jaotise VI (keemiatööstuse…) alla liigitatud gruppidesse. Kuni viiendik imporditakse Indiast kuues alamgrupis, millest kolm kuuluvad jaotisesse II (taimsed tooted) ja kaks jaotisesse XI (tekstiil…).
Tabel 18. Suurema India impordi osakaaluga kaubagrupid Eestis (4-kohalise koodi tasemel) 2014. aastal
Kaubagrupi nimetus kood import Indiast
India impordi osakaal
Teemandid, töödeldud või töötlemata, raamistamata ning kinnitamata 7102 797661 69%
Eeterlikud õlid, mis sisaldavad või ei sisalda terpeene, k.a tahked või absoluteeritud valmistised; resinoidid; õlivaiguekstraktid; eeterlike õlide kontsentraadid rasvades, mittelenduvates õlides, vahades vms keskkonnas (saadud anfloraaži või leotamise teel); terpeenid, mis saadakse kõrvalsaadustena eeterlike õlide vabastamisel terpeenidest; eeterlike õlide veeaurudestillaadid ja vesilahused
3301 1195865 60%
Tuletikud (v.a rubriigis 3604 nimetatud pürotehnilised tooted) 3605 229214 59%
Piprad perekonnast Piper; perekonda Capsicum või Pimenta kuuluvad kuivatatud, purustatud või jahvatatud viljad
0904 2699191 38%
Kookospähklid, brasiilia pähklid ja kašupähklid, värsked või kuivatatud, lüditud või lüdimata, kooritud või koorimata
0801 849404 33%
Puuvillane lõng (v.a õmblusniit), puuvillasisaldusega vähemalt 85 % massist, jaemüügiks pakendamata
5205 331098 28%
Aniisi, tähtaniisi, apteegitilli, koriandri, ristiköömne või köömne seemned; kadakamarjad
0909 134449 23%
Aktiivsüsi; aktiveeritud looduslikud mineraaltooted; loomne süsi, k.a ammendatud loomne süsi
3802 267898 21%
Suurrätikud, pea- ja kaelarätikud, sallid, mantiljad, loorid jms 6214 434126 20%
Sulfoonamiidid 2935 125206 18%
Ketoonid ja kinoonid, millel on või ei ole muid hapnikku sisaldavaid funktsionaalrühmi, nende halogeen-, sulfo-, nitro- ja nitrosoderivaadid
2914 171684 18%
Töödeldud kivi (v.a kiltkivi) monumentideks ja ehituse tarbeks, tooted sellest, v.a rubriigi 6801 tooted; mosaiigikuubikud jms looduslikust kivist (sh kiltkivist) tooted, alusele kinnitatud või mitte; looduslikust kivist (sh kiltkivist) kunstlikult värvitud graanulid, puru ja pulber
6802 1007982 18%
Meeste ja poiste päevasärgid 6205 968894 17%
Polükarboksüülhapped, nende anhüdriidid, halogeniidid ja peroksiidid ning vastavad peroksühapped; nende halogeen-, sulfo-, nitro- ja nitrosoderivaadid
2917 116746 14%
27
Muud õliseemned ja õliviljad, purustatud või purustamata 1207 103451 14%
Naiste ja tüdrukute pluusid ja särkpluusid 6206 1073543 13%
Kuivatatud köögivili (tervelt, tükeldatult, viilutatult, purustatult või pulbrina), muul viisil töötlemata
0712 479525 12%
Meeste ja poiste päevasärgid, silmkoelised või heegeldatud 6105 348636 12%
Telgedel kootud vaibad ja muud tekstiilpõrandakatted, v.a tafting- ja flokeeritud vaibad, valmistoodetena või mitte, k.a „Kelem”, „Schumacks”, „Karamanie” jms käsitelgedel kootud vaibad
5702 180643 12%
Muud rauast või terasest valatud tooted 7325 456876 11%
Väikelaste rõivad ja rõivamanused, silmkoelised või heegeldatud 6111 363756 11%
Meeste ja poiste mantlid, poolmantlid, keebid, joped, anorakid (sh suusajakid), tuulejoped, tuulepluusid jms rõivad (v.a rubriigis 6103 nimetatud), silmkoelised või heegeldatud
6101 200177 11%
Voodipesu, lauapesu, vannilinad, käterätikud ning köögirätikud 6302 1018282 11%
Meeste ja poiste aluspüksid, püksikud, öösärgid, pidžaamad, supelmantlid, hommikumantlid jms rõivaesemed, silmkoelised või heegeldatud
6107 353438 9%
Allikas: Statistikaameti andmebaas, tabel VK200: Kaupade eksport ja Import kaubakoodi (KN 4-kohaline kood) ja riigi järgi, autorite arvutused
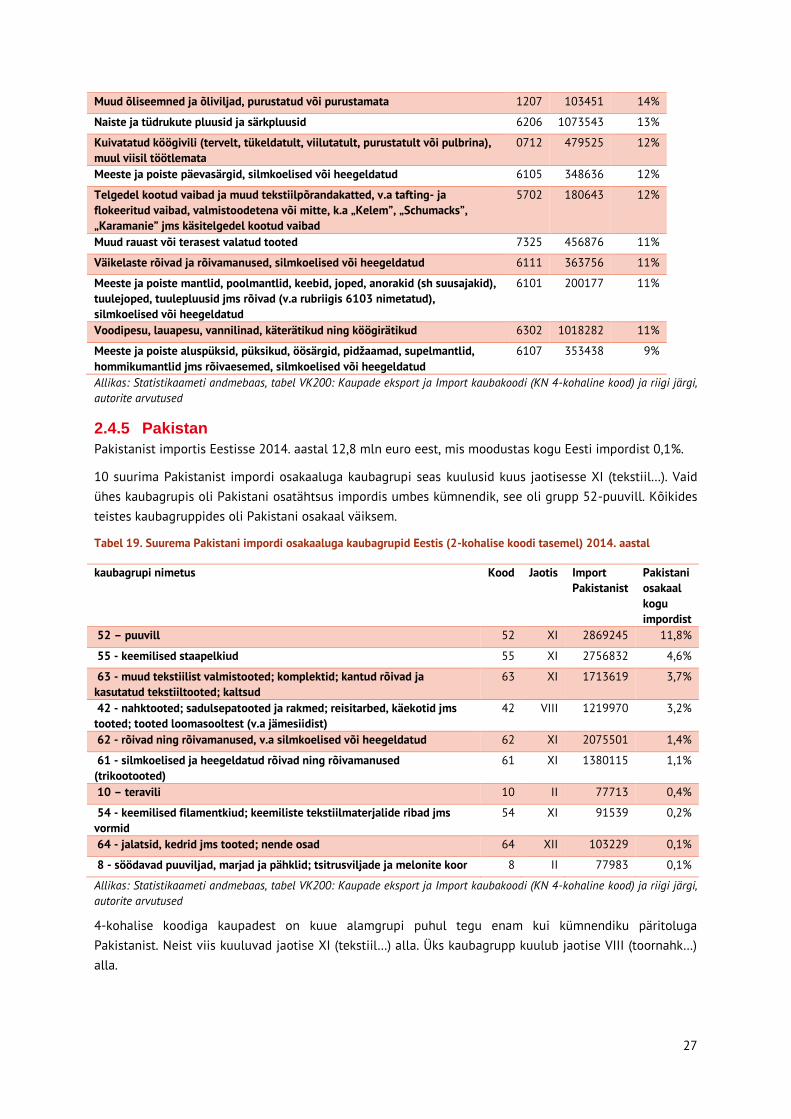
2.4.5 Pakistan
Pakistanist importis Eestisse 2014. aastal 12,8 mln euro eest, mis moodustas kogu Eesti impordist 0,1%.
10 suurima Pakistanist impordi osakaaluga kaubagrupi seas kuulusid kuus jaotisesse XI (tekstiil…). Vaid ühes kaubagrupis oli Pakistani osatähtsus impordis umbes kümnendik, see oli grupp 52-puuvill. Kõikides teistes kaubagruppides oli Pakistani osakaal väiksem.
Tabel 19. Suurema Pakistani impordi osakaaluga kaubagrupid Eestis (2-kohalise koodi tasemel) 2014. aastal
kaubagrupi nimetus Kood Jaotis Import Pakistanist
Pakistani osakaal kogu impordist
52 – puuvill 52 XI 2869245 11,8%
55 - keemilised staapelkiud 55 XI 2756832 4,6%
63 - muud tekstiilist valmistooted; komplektid; kantud rõivad ja kasutatud tekstiiltooted; kaltsud
63 XI 1713619 3,7%
42 - nahktooted; sadulsepatooted ja rakmed; reisitarbed, käekotid jms tooted; tooted loomasooltest (v.a jämesiidist)
42 VIII 1219970 3,2%
62 - rõivad ning rõivamanused, v.a silmkoelised või heegeldatud 62 XI 2075501 1,4%
61 - silmkoelised ja heegeldatud rõivad ning rõivamanused (trikootooted)
61 XI 1380115 1,1%
10 – teravili 10 II 77713 0,4%
54 - keemilised filamentkiud; keemiliste tekstiilmaterjalide ribad jms vormid
54 XI 91539 0,2%
64 - jalatsid, kedrid jms tooted; nende osad 64 XII 103229 0,1%
8 - söödavad puuviljad, marjad ja pähklid; tsitrusviljade ja melonite koor 8 II 77983 0,1%
Allikas: Statistikaameti andmebaas, tabel VK200: Kaupade eksport ja Import kaubakoodi (KN 4-kohaline kood) ja riigi järgi, autorite arvutused
4-kohalise koodiga kaupadest on kuue alamgrupi puhul tegu enam kui kümnendiku päritoluga Pakistanist. Neist viis kuuluvad jaotise XI (tekstiil…) alla. Üks kaubagrupp kuulub jaotise VIII (toornahk…) alla.

28
Tabel 20. Suurema Pakistani impordi osakaaluga kaubagrupid Eestis (4-kohalise koodi tasemel) 2014. aastal
Kaubagrupi nimetus Kood Import Pakistanist
Pakistani impordi osakaal
Riie sünteesstaapelkiududest segus peamiselt või üksnes puuvillaga, sünteesstaapelkiudude sisaldusega alla 85 % massist, pindtihedusega mitte üle 170 g/m²
5513 2383302 30%
Puuvillane riie puuvillasisaldusega vähemalt 85 % massist, pindtihedusega kuni 200 g/m²
5208 2372024 19%
Meeste ja poiste särgikud jm alussärgid, aluspüksid, püksikud, öösärgid, pidžaamad, supelmantlid, hommikumantlid jms tooted
6207 107288 16%
Riie puuvilla ja peamiselt või üksnes keemiliste kiudude segust, puuvillasisaldusega alla 85 % massist, pindtihedusega kuni 200 g/m²
5210 208874 13%
Voodipesu, lauapesu, vannilinad, käterätikud ning köögirätikud 6302 1079833 11%
Nahast või komposiitnahast rõivad ja rõivamanused 4203 1206810 11%
Allikas: Statistikaameti andmebaas, tabel VK200: Kaupade eksport ja Import kaubakoodi (KN 4-kohaline kood) ja riigi järgi, autorite arvutused
2.4.6 Tai
Taist pärines Eesti impordist 2014. aastal 45,6 mln euro eest kaupu. Kogu Eesti impordist oli see väga väike osa – 0,36%.
Suurema Tai impordi osakaaluga 10 kaubagruppi on toodud järgmises tabelis. Siia alla kuulub kolm kaupade gruppi jaotisest IV (valmistoidukaubad…), teised kaubagrupid on erinevatest jaotistest.
Tabel 21. Suurema Tai impordi osakaaluga kaubagrupid Eestis (4-kohalise koodi tasemel) 2014. aastal
Kaubagrupi nimetus kood Jaotis Import % kogu riigi kaubagrupi impordist
67 - töödeldud suled ja udusuled ning tooted nendest; tehislilled; tooted juustest
67 XII 29 997 2,1%
16 - tooted lihast, kalast, vähkidest, limustest või muudest veeselgrootutest
16 IV 726 399 1,6%
20 - tooted köögi- ja puuviljadest, marjadest, pähklitest või muudest taimeosadest
20 IV 868 104 1,6%
55 - keemilised staapelkiud 55 XI 708 121 1,2%
69 – keraamikatooted 69 XIII 479 654 1,1%
35 - valkained; modifitseeritud tärklis; liimid; ensüümid 35 VI 294 363 1,1%
21 - mitmesugused toiduvalmistised 21 IV 1 066 270 1,1%
85 - elektrimasinad ja -seadmed, nende osad; helisalvestus- ja taasesitusseadmed, telepildi ja -heli salvestus- ja taasesitusseadmed, nende osad ja tarvikud
85 XVI 22 700 000 0,9%
42 - nahktooted; sadulsepatooted ja rakmed; reisitarbed, käekotid jms tooted; tooted loomasooltest (v.a jämesiidist)
42 VIII 326 538 0,8%
3 - kalad ja vähid, limused ja muud veeselgrootud 3 I 1 056 599 0,8%
Allikas: Statistikaameti andmebaas, tabel VK200: Kaupade eksport ja Import kaubakoodi (KN 4-kohaline kood) ja riigi järgi, autorite arvutused
4-kohalise kaubagrupi tähisega alamkaupadest toodi kuni kümnendik Taist neljas kaubagrupis, millest kaks kuuluvad jaotisesse XVI (masinad…).
Tabel 22. Suurema Tai impordi osakaaluga kaubagrupid Eestis (4-kohalise koodi tasemel) 2014. aastal
Kaubagrupi nimetus Kaubagrupi kood
Import Taist Tai osakaal kogu impordist
Kuivatatud, soolatud või soolvees kala; külm- või kuumsuitsukala; inimtoiduks kõlblik kalajahu ja -
0305 965 201 13%

29
graanulid
Keraamilised (v.a portselanist) lauanõud ja kööginõud, muud majapidamistarbed ja tualett-tarbed
6912 301 147 11%
Kliimaseadmed, mis koosnevad mootoriga varustatud ventilaatorist ning seadmetest õhutemperatuuri ja õhuniiskuse reguleerimiseks, k.a seadmed, mis ei võimalda niiskust eraldi reguleerida
8415 4 596 938 11%
Ringhäälingu vastuvõtuaparaadid, samasse korpusesse paigaldatud helisalvestus või -taasesitusseadmete või ajanäitajaga või ilma nendeta
8527 485 769 10%
Allikas: Statistikaameti andmebaas, tabel VK200: Kaupade eksport ja Import kaubakoodi (KN 4-kohaline kood) ja riigi järgi, autorite arvutused

30
3 Kirjandusülevaade probleemidest Arenguriikidega kaasnevaid probleeme vaatleme läbi artiklite, mis on eelretsenseeritud ehk sellest lähtuvalt usaldusväärsed viitamiseks. Kirjanduse ülevaate saamiseks otsisime artikleid järgnevatest andmebaasidest: EBSCO, Oxford University Press ja Science Direct. Laiemalt jagunevad probleemid, millesse arenguriikides toodetud kauba tarbimisel võime panustada, järgmiselt:
- Ebainimlikud töötingimused - Keskkonnamõjud - Lapstööjõud
Tulenevalt Eesti impordi statistika analüüsist ja U.S. Department of Labor poolt välja antud lapstööjõu uuringu tulemustest võtsime välja 6 riiki, millest Eesti suuremal määral impordib ning mille puhul on võimalus, et teatud valdkondades kasutatakse lapstööjõudu. Need on järgnevad:
- Hiina - Türgi - Bangladesh - India - Pakistan - Tai
Kuna käesoleva uuringu eesmärgiks ei ole ainult lapstööjõu probleemile tähelepanu pööramine, siis artiklite otsingus kasutasime ka eespool mainitud teisi probleeme. Artiklite leidmiseks kasutasime järgnevaid sõnakombinatsioone: China + inhuman working conditions; China + forced labor; China + work safety; China + harassment; Chinese factories + environmental impacts; China + child labor. Samad märksõnade kombinatsioonid vaatasime läbi ka teiste riikidega: Turkey, Bangladesh, India, Pakistan, Thailand. Samuti kasutasime riigi kohta teadaolevaid andmeid suurematest imporditavatest kaubagruppidest ja nendega viisime samuti läbi otsingu artiklite leidmiseks. Näiteks: China + circuit boards (ehk trükilülitused) jne.
Kuigi arengumaade elatustase on oluliselt madalam kui arenenud maades, siis nende majandusareng on enamasti kiirem, mistõttu on tegemist ka kiirelt muutuvate töötamise ning tootmise tingimustega. Seepärast ei vaadanud me artikleid, mis olid avaldatud varem kui 2000. aastal. Kirjandusloetelu järjestasime tähtsuse (relevance) järjekorras ehk otsisime esimesena artikleid, mis vastaks paremini otsitavate sõnade kombinatsioonile.
Kõigi nende eespool mainitud riikide puhul, millega Eestil on kõige suuremal määral side, on tegu suurte eksportivate riikidega. Seetõttu on ka nende maade siseselt olulised regionaalsed erinevused. Artiklite põhjal on näha, et selgelt eristuvad probleemid on pigem maapiirkondades (rural areas). Linnapiirkonnad (nt Hong Kong) käituvad sageli sarnasemalt arenenud riikidega.
Järgnevalt on riigispetsiifiliselt esitatud kirjandusotsingute tulemused. Tulemused on esitatud kujul, kus esimeses lahtris on lühiülevaade artikli sisust ja sellele järgnevalt on viide artiklile. Artikli leiab üles DOI numbri sisestamisel otsingusse.

31
3.1 Hiina Hiina kohta informatsiooni otsimisel kasutasime riigi ja meie poolt vaadeldavate probleemide otsingukombinatsioone ja sinna juurde ka 2. peatükis välja toodud enim imporditavate toodete märksõnu. Hiina puhul võib leitud artiklid jaotada suuremas plaanis nelja kategooriasse:
1) Artiklid, mis kajastavad Hiina üldist poliitilist ja majanduslikku olukorda, sest tegu on suure riigiga ning piirkonnad on omavahel väga erinevad. Suuremad linnad ja maakonnad on mitmes mõttes nagu arenenud maad, kuid maapiirkonnad ja vaesemad maakonnad nagu arenguriigid. Lisaks on Hiina mitmete probleemide põhjuseks valitsev režiim – näiteks isikuvabaduste piiramise küsimused (Tabel 1)
2) Artiklid, mis näitavad probleeme laiemalt, mida algselt otsingus kasutasime ehk ebainimlikud töötingimused, keskkonnaprobleemid ja lapstööjõud. (Tabel 2)
3) Artiklid, mis viitavad probleemidele nendes valdkondades, kust Eestisse rohkem imporditakse – tekstiil, jalatsid ja trükilülitused. See otsing on seotud suuresti 2. peatükiga ja annab võimaluse luua otsesemaid seoseid Eesti impordi ja vastavas valdkonnas olevate probleemidega (Tabel 3)
Tabel 23. Artiklite lühikokkuvõtted ja viited – Hiina poliitikast ja majandusest tulenevad probleemid
In January 2008, China adopted a new labour contract law. This new law represents the most significant reform to the legislation on employment relations in mainland China in more than a decade. The paper provides a theoretical framework on the inter-linkages between labour market regulation, option value and the choice and timing of employment. All in all, the paper demonstrates that the Labour Contract Law in its own right will have only small impacts upon employment in the fast-growing Chinese economy. Rather, possibly induced increasing unit labour costs may adversely affect employment. Chen, Y.F., Funke, M. China's new Labour Contract Law: No harm to employment? – China Economic Review, 2009, Vol. 20, pp. 558-572. DOI:10.1016/j.chieco.2009.03.008 Brazil, China, and India have seen falling poverty in their reform periods, but to varying degrees and for different reasons. History left China with favorable initial conditions for rapid poverty reduction through market-led economic growth; at the outset of the reform process there were many distortions to be removed and a relatively low inequality of access to the opportunities so created, though inequality has risen markedly since. By concentrating such opportunities in the hands of the better off, prior inequalities in various dimensions handicapped poverty reduction in both Brazil and India. Brazil’s recent success in complementing market-oriented reforms with progressive social policies has helped it achieve a higher proportionate rate of poverty reduction than India, although Brazil has been less successful in terms of economic growth. In the wake of its steep rise in inequality, China might learn from Brazil’s success with such policies. India needs to do more to assure that poor people are able to participate in both the country’s growth process and its social policies; here there are lessons from both China and Brazil. All three countries have learned how important macroeconomic stability is to poverty reduction. Ravallion, M. A Comparative Perspective on Poverty Reduction in Brazil, China, and India – The World Bank Research Observer, 2011, Vol. 26, No. 1, pp. 71-104 DOI: 10.1093/wbro/lkp031 China and Mexico have both pursued export-oriented development strategies in the global economy, but with different implications for national development and industrial upgrading. While Mexico has been the paradigm for the neoliberal (‘Washington consensus’) development model associated with foreign direct investment, extensive privatization, and open markets, China has attained record levels of foreign capital inflows and export growth utilizing a more strategic, statist approach to its development. In the past decade, China has surpassed Mexico in their battle for pre-eminence in the US market. One of the keys to China’s success has been a unique form of industrial organization called supply-chain cities, which has permitted it to achieve both economies of scale and scope in global value chains. Gereffi, G. Development Models and Industrial Upgrading in China and Mexico – European Sociological Review, 2009, Vol. 25, No. 1, pp. 37-51 DOI:10.1093/esr/jcn034 In this globalised world, China has become the factory of the world. Before 1970s, China was an underdeveloped and predominantly agrarian economy. The economic reforms initiated by the Communist government in the year 1979 have helped China to emerge has one of the largest economies in the world. The Special Economic Zones were

32
created as part of the process of industrialization of the Chinese economy. Since then, these SEZs have played a significant role in China’s success. Encouraged by this, a number of countries including India have adopted the SEZ model for improving their export potential. While evaluating the role of these SEZs, we need to examine the working conditions in the factories located inside the SEZs. The intense competition among the factory owners to export at low cost at short deadlines has led to inhuman working conditions in these factories. In spite of adequate labour laws, workers continue to get exploited. RoyChoudhury, K. Review Paper: Special Economic Zones in China – SIES Journal of Management, 2010, Vol.7, No. 1, pp. 114-120 Background: Socioeconomic transformation in China at the beginning of the twenty-first century has led to rapid urbanization and accelerated rural–urban migration. As a result, the concerns about public health problems triggered by increasing internal population mobility have been more widely studied in recent years. Sources of data: Published data in Chinese and English on health of migrants and their families in mainland China from 2000 to 2012. Areas of agreement: The shifting patterns of disease distribution due to rural– urban migration, health equity and health reform strategies that cater for this specific yet substantial subpopulation are outstanding concerns. Infectious diseases, mental health, occupational health and women’s health are emerging public health priorities related to migration. Areas of controversy: The high mobility and large numbers of Chinese rural–urban migrants pose challenges to research methods and the reliability of evidence gained. Growing points: While the theme of working migrants is common in the literature, there have also been some studies of health of those left behind but who often remain unregistered. Migration within China is not a single entity and understanding the dynamics of new and emerging societies will need further study. Areas timely for developing research: Social, economic, emotional, environmental and behavioural risk factors that impact on health of migrants and their families call for more attention from health policy-makers and researchers in contemporary China. Mou, J., Griffiths, S.M., Fong, H., Dawes, M.G. Health of China’s rural–urban migrants and their families: a review of literature from 2000 to 2012 – British Medical Bulletin, 2013, Vol. 106, pp. 19-43 DOI:10.1093/bmb/ldt016 China’s rural-to-urban migration has affected 12.6 million school-age rural children who have migrated with their parents and another 22 million who have been left behind by their migrant parents. Not enough is known, either theoretically or empirically, about the causal impact of migration on the well-being of this large number of Chinese children affected by migration. Propensity score matching methods are applied to estimate the effects of migration in children 10–15 years old from a 2010 national survey (N=2,417). Children’s migration has significant positive effects on their objective well-being but no negative effects on their subjective well-being. There is little difference between the left-behind and non-migrant children across multiple life domains. The Rosenbaum bounds tests indicate that the causal effects of child migration are sensitive to hidden bias for certain outcomes, but not for others. Xu, H., Xie, Y. The Causal Effects of Rural-to-Urban Migration on Children’s Well-being in China – European Sociological Review, 2015, Vol. 31, No. 4, pp. 502-519 DOI: 10.1093/esr/jcv009 Criticism has long been laid about China’s unwillingness to subscribe to international human rights norms, the rule of law and liberal democratic practices. The United Nations and Western States and scholars have argued that human rights and liberal democracy underlain by a Western rule-of-law model are prerequisites to human development and governmental legitimacy. Is authoritarianism in China incompatible with human rights and democracy? Is the rule of law rejected entirely by the state apparatuses in China? Is there really no human rights protection under China’s Constitution and laws? Has China’s approach to international human rights law evolved since its realization of the roles it may play in shaping international law? What do the Chinese people think or want about China’s political reform vis-a'-vis human rights and democratic practices? With China’s rise in the current international order, these questions raise important issues this article addresses. Chan, P.C.W. Human Rights and Democracy with Chinese Characteristics? – Human Rights Law Review, 2013, Vol. 13, No.4, pp. 645-689 DOI:10.1093/hrlr/ngt034 While the right to privacy has been accepted as one of the most fundamental human rights, the protection of privacy in China is not comparable to the protection in the West. Within China, there is considerable growing concern about the right to privacy and the scope for its protection. This is so because unlike most industrialized countries, China still lacks a comprehensive and coherent system for privacy protection. This paper will explore the development in privacy protection by a sampling of cases and a look of the legislative initiatives undertaken by the Chinese authorities. The protection of privacy in China is not comparable to the protection in the West. However, in recent years privacy law has been developing in China, and a number of cases have been decided by the courts and legislative initiatives

33
issued by the government. These piece provides a review of recent cases and legislative developments, as well as reaching some conclusions for the future. Ong, R. Recognition of the right to privacy on the Internet in China – International Data Privacy Law, 2011, Vol. 1, No. 3, pp. 172-179 DOI: 10.1093/idpl/ipr008 This paper provides the first systematic analysis of the reasons why women endure longer unemployment durations than men in post-restructuring urban China. This analysis is based upon data obtained from a national representative household survey. Rejecting the view that women are less earnest than men in their desire for reemployment, this analysis shows that women’s job search efforts are handicapped by a lack of access to social networks, unequal entitlement to social re-employment services, higher earnings losses from job separations for women, and unfair treatment of women with respect to mandatory retirement. Fenglian Du, F., Dong, X.-Y. Why do women have longer durations of unemployment than men in postrestructuring urban China? Cambridge Journal of Economics, 2009, Vol. 33, pp. 233-252 DOI: 10.1093/cje/ben034
Tabel 24. Artiklite lühikokkuvõtted ja viited – lapstööjõud, keskkonnaprobleemid ja tööohutus
Examining child labor through the lenses of weak agency, distributive inequality, and harm suggests that not all work performed by children is equally morally objectionable. Some work, especially work that does not interfere with or undermine their health or education, may allow children to develop skills they need to become well-functioning adults and broaden their future opportunities. Other work, including child prostitution and bonded labor, is unambiguously detrimental to children. Eliminating these forms of child labor should be the highest priority. Blanket bans on all child labor may drive families to choose even worse options for their children, however. Moreover, child labor is often a symptom of other problems—poverty, inadequate education systems, discrimination within families, ethnic conflicts, inadequately protected human rights, weak democratic institutions—that will not be eliminated by banning child labor. Satz, D. Child Labor: A Normative Perspective – The World Bank Economic Review, 2003, Vol. 17, No. 2, pp. 297-309. DOI: 10.1093/wber/lhg015 With rapid socio-economic development in Mainland China, work safety remains a serious and continuous concern for the country. To better understand work-related accidents, we propose to analyze the dynamic situation and future trends of work safety in Mainland China using grey theory. The forecasting models, i.e., GM models are constructed by use of annual data sets of work-related deaths from five branches: mining and commercial casualties, highway traffic accidents, railway traffic accidents, fire disasters, and all fatal casualties. The effectiveness of these proposed models is demonstrated through accuracy test. The predicted results show that the death counts, not only in the four sub-sections but also overall, will decline continuously, suggesting that the work safety situation will improve. Jiuchang Wei, J., Zhou, L., Wang, F., Wub, D. Work safety evaluation in Mainland China using grey theory – Applied Mathematical Modelling, 2015, Vol. 39, pp. 924-933 Using several waves of the China Health and Nutrition Survey (CHNS), this study analyzes the effect of long work hours on health and lifestyles in a sample of 18- to 65-year-old Chinese workers. Although working long hours does significantly increase the probabilities of high blood pressure and poorer reported health, the effects are small. Also small are the negative effects of long work hours on sleep time, fat intake, and the probabilities of sports participation or watching TV. We find no positive association between work time and different measures of obesity and no evidence of any association with calorie intake, food preparation and cooking time, or the sedentary activities of reading, writing, or drawing. In general, after controlling for a rich set of covariates and unobserved individual heterogeneity, we find little evidence that long work hours affect either the health or lifestyles of Chinese workers. Nie, P., Otterbach, S., Sousa-Poza, A. Long work hours and health in China – China Economic Review, 2015, Vol. 33, pp. 212-229 DOI: 10.1016/j.chieco.2015.02.004 It is estimated that over 10,000,000 occupational injuries occur in China each year. This study explored the relationships between four dimensions of safety climate (management commitment, safety supervision, coworker support, and safety training), three dimensions of safety behavior (safety compliance, personal protective equipment, and safety initiatives), and occupational injuries among Chinese manufacturing workers. A cross-sectional survey was conducted using a sample of 3970 manufacturing workers from 42 companies in Zhongshan City, China. A structured questionnaire was used to capture participants’ socio-demographic characteristics, occupational safety climate, occupational safety behavior, and occupational injuries in the previous year. Path analysis was used to test the relationships between safety climate, safety behavior and injuries at each workplace. The results revealed significant associations between different safety climates, safety behavior, and unintentional injuries, and provided evidence that safety behavior strongly mediates the relationship between safety climate and unintentional injuries. Our study

34
reinforces the empirical association of occupational safety climate and safety behavior with occupational injuries and identifies some effective measures to prevent and control injuries in Chinese workplaces. Liu, X., Huang, G., Huang, H., Wang, S., Xiao, Y., Chen, W. Safety climate, safety behavior, and worker injuries in the Chinese manufacturing industry – Safety Science, 2015, Vol. 78, pp. 173-178 DOI: 10.1016/j.ssci.2015.04.023 Epidemiological studies suggest that trichloroethylene (TCE) exposure may be associated with renal cancer. The biological mechanisms involved are not exactly known although nephrotoxicity is believed to play a role. Studies on TCE nephrotoxicity among humans, however, have been largely inconsistent. We studied kidney toxicity in Chinese factory workers exposed to TCE using novel sensitive nephrotoxicity markers. Eighty healthy workers exposed to TCE and 45 comparable unexposed controls were included in the present analyses. Personal TCE exposure measurements were taken over a 2-week period before urine collection. Ninety-six percent of workers were exposed to TCE below the current US Occupational Safety and Health Administration permissible exposure limit (100 ppm 8 h TWA), with a mean (SD) of 22.2 (35.9) ppm. Kidney injury molecule-1 (KIM-1) and Pi-glutathione S transferase (GST) alpha were elevated among the exposed subjects as compared with the unexposed controls with a strong exposure-response association between individual estimates of TCE exposure and KIM-1 (P < 0.0001). This is the first report to use a set of sensitive nephrotoxicity markers to study the possible effects of TCE on the kidneys. The findings suggest that at relatively low occupational exposure levels a toxic effect on the kidneys can be observed. This finding supports the biological plausibility of linking TCE exposure and renal cancer. Roel Vermeulen1, R., Zhang, L., Spierenburg, A., Tang, X., Bonventre, J.V., Reiss, B., et al. Elevated urinary levels of kidney injury molecule-1 among Chinese factory workers exposed to trichloroethylene, Carcinogenesis, 2012, Vol.33 No.8 pp.1538-1541 DOI: 10.1093/carcin/bgs191 According to official Chinese publications, China has made great progress in improving its environment. For example, the State of Environment (SOE) Report of 1998 states: “There has been continuing progress in the control of total amount of pollutants and industrial pollution sources and a comprehensive urban environmental improvement.” According to the SOE of 2000, “Tremendous efforts have been made in abating environmental pollution, with a focus on water pollution prevention and control in key river basins, cities, regions and marine areas and industrial pollution control.” The SOE 2006 offers a reassuring message: “Uniting all social forces and mobilizing the initiatives of each stakeholder, we have created a new situation where environmental protection is facilitated by all parties.” On the other hand, some researchers, commentators, and the media in the West paint a wholly negative picture. For example, Economy (2007) finds that “water pollution and water scarcity are burdening the economy, rising levels of air pollution are endangering the health of millions of Chinese, and much of the country’s land is rapidly turning into desert.” In late 2007, the New York Times ran a ten-part series titled “Choking on growth—Examining the impact of China’s epic pollution crisis.” Vennemo, H., Aunan, K., Lindhjem, H., Seip, H.M. Environmental Pollution in China: Status and Trends – Review of Environmental Economics and Policy, 2009, Vol. 3, No. 2, pp. 209-230. DOI: 10.1093/reep/rep009
Tabel 25 Artiklite lühikokkuvõtted ja viited – Eesti impordiga seotud probleemid
The rapid proliferation of electronic devices in the last two decades has compelled the researchers to find a remedy for one of the most toxic and hazardous waste materials e the waste Printed Circuit Boards. Numerous articles have been published demonstrating the process routes for recycling of this toxic but otherwise useful waste due to nearly 30% metal content. In this paper, more than 150 related articles mostly published in the last 15 years and covering the broad areas like characterization of waste Printed Circuit Boards, health hazards associated with the processing and the different routes of recycling have been analyzed to provide a comprehensive overview on this topic. Physical separation processes employing electrostatic separator, magnetic separator, froth floatation, etc., has been reviewed for separation of metals and non-metals, along with useful utilizations of the non-metallic materials. The recovery of metals from this waste material through pyrometallurgical, hydrometallurgical or biohydrometallurgical routes is also critically discussed. Ghosh, B., Ghosh, M.K., Parhi, P., Mukherjee, P.S., Mishra P.K. Waste Printed Circuit Boards recycling: an extensive assessment of current status – Journal of Cleaner Production, 2015, Vol. 94, pp. 5-19 The amount of spent electronic and electrical solid wastes (i.e. e-wastes) has increased to a new level with the rapid development of electronic and electrical industries. Management of e-wastes challenges the administrators and researchers. As a major component of the e-waste stream, pollution caused by the spent printed circuit boards has captured increasing attention. Various innovative methods have recently been developed to dispose and reuse these municipal spent printed circuit boards. In this mini-review article, the disposal approaches for spent printed circuit boards are highlighted. The present state and future perspective are also discussed. We hope that this mini-review

35
can promote the extensive understanding and effective disposal of the spent printed circuit boards in the field of solid waste treatment and resources. Xu, Y., Liu, J. Recent developments and perspective of the spent waste printed circuit boards – Waste Management & Research, 2015, Vol. 33, No. 5, pp. 392-400 DOI: 10.1177/0734242X15576024 Production facilities, especially factories, should have long-term aspirations to be environmental responsible through adequate waste prevention and management processes. In this paper, we consider the case study of a clothing factory in China with significant labor-intensive operations. The factory's layout, process design, and materials management are aspects that can address the prevention and elimination of unnecessary transportation, processing waste, waiting time, inefficient work methods, inventory, and overproduction. This paper develops a fuzzy-based assessment procedure to consider waste prevention and management in the clothing industry. Here, the factory is modeled as a production unit using a fuzzy multistate network with labor-intensive operations. Using reliability analysis, we determine the probability of demand satisfaction to indicate whether the factory's waste prevention actions are effective. Further, we also show that the established fuzzy-based assessment procedure can consider both pessimistic and optimistic scenarios. Thus, this procedure is extremely useful to a production manager who seeks a comprehensive status of a clothing factory with a focus on consistent improvement. Chang, P.-C., Lin, Y.-K., Chen, J. C. A fuzzy-based assessment procedure for a clothing factory with waste-prevention consideration – Journal of Cleaner Production, 2015, Vol. 108, pp. 484-493 DOI: 10.1016/j.jclepro.2015.06.144 The carbon footprint (CFP) reflects the greenhouse gases (GHGs) generated throughout the life cycle of a human activity or product, and is therefore an important tool for assessing and managing GHG emissions. At the level of an individual product, a carbon-labeling scheme that provides more information for consumers could play an important role in encouraging a shift to low-carbon consumption. China is the largest textile and garment producer and consumer in the world. Studying the carbon footprint of textiles is therefore important domestically, for the management of domestic greenhouse gas emission and, internationally, for the communication of carbon information and relevant trade negotiations. For establishing the product carbon labeling system in China, this paper constructed an operable and comparable CFP assessment method and framework at product level and presents a complete case for pure cotton shirts made in China. Based on investigations of several Chinese textile companies and the observation of every production sub-process, the system boundary and methods of assessing textile product CFP were established. We then estimated Chinese CFP conversion factors for relevant energy sources and materials, and calculated the actual CFP for the life cycle of a pure cotton shirt. The average CFP of a pure cotton shirt produced in China, throughout its life cycle, is estimated as 8.771 kgCO2e. Of this, direct CFP is 0.347 kgCO2e, whereas indirect CFP is much higher, at 8.423 kgCO2e. The industrial production stage accounts for the highest proportion of the CFP, and overall production (including agricultural and industrial production) accounts for more than 90% of the total CFP. Approximately 96% of CFP throughout the product life cycle is indirect CFP, which is embedded in the use of energy and materials in each process. Within the industrial production stage, the transportation and weaving sub-processes account for nearly all the direct CFP (0.347 kgCO2e). Energy consumption, especially of electricity, is the main contributor to the CFP of textile products. These results could facilitate comparison between different products, and for the same products from different producers, In order to reduce the CFP throughout the entire textiles sector. Wang, C., Wang, L., L, X., Du, C., Ding, D., Jia, J., Yan, Y., Wu, G. Carbon footprint of textile throughout its life cycle: a case study of Chinese cotton shirts – Journal of Cleaner Production, 2015, Vol. 108, pp. 464-475 DOI: 10.1016/j.jclepro.2015.05.127 This study analyzes the OTI (overall textile industry) energy efficiency gap between China and the US and measures the longitudinal changes in OTI energy efficiency over time. A breadthwise comparison of the energy efficiency among OTI subsectors indicates that the CFI (chemical fiber industry) is the key subsector for improving energy efficiency. This study conducts a quantitative analysis of the influencing factors of energy efficiency of the CFI in China. The energy efficiency of the CFI in Fujian and its influencing factors are compared with that of the national level. Results indicate that the main factors influencing the energy efficiency of CFI in China include economic structure, energy structure, industry scale, and technology, whereas industry concentration has no significant effect. Economic indicators show that the energy efficiency of Fujian's CFI has continued to improve yearly, and is currently above the national average. The low proportion of state-owned and state holding enterprises value, low proportion of coal consumption in the energy structure, industrial scale with a majority of medium- and large-sized enterprises, and advanced technology level are the main reasons for the success of Fujian's CFI. Finally, this study proposes several feasible policies that could be adopted by the authorities concerned. Peng, L., Zhang, Y., Wang, Y., Zeng, X., Peng, N., Yu, A. Energy efficiency and influencing factor analysis in the overall Chinese textile industry – Energy, 2015, Vol. 93, pp. 1222-1229 DOI: 10.1016/j.energy.2015.09.075 Based on field surveys conducted in Guangdong, Zhejiang and Beijing in 2000 and 2001, this paper argues that accession to the World Trade Organisation (WTO) by China will create a new competitive arena for different

36
categories of textile and clothing firms located in that country, partly dependent on the size and ownership of the firm. From the perspectives of reducing import tariffs, eliminating export quotas and the regulations on trade disputes, WTO accession does matter for the majority of Chinese firms in this ‘win–lose’ game. From the perspective of compliance with international standards, this paper argues that accession to the WTO does not really matter for some Chinese firms, as they may not survive the intense competition prior to 2005, when the effects of the Agreement on Textiles and Clothing materialise. Godfrey Yeung, G., Mok, V. Does WTO accession matter for the Chinese textile and clothing industry? – Cambridge Journal of Economics, 2004, Vol. 28, pp. 937-954 DOI: 10.1093/cje/beh040 The textile industry uses large amounts of electricity, fuel, and water, with corresponding greenhouse gas emissions (GHGs) and contaminated effluent. Emerging energy-efficiency, greenhouse gas (GHG), and pollution mitigation technologies will be crucial for the textile industry as it responds to population and economic growth that is expected to spur a rapid increase in textile consumption over the coming decades and a corresponding increase in the industry's absolute energy use and GHG and other pollutant missions. This paper gives an overview of textile industry processes and compiles available information on the energy savings, environmental and other benefits, costs, commercialization status, and references for 18 emerging technologies to reduce the industry's energy use and environmental emissions. Although studies from around the world identify a variety of sector-specific and cross-cutting energy efficiency technologies that have already been commercialized for the textile industry, information is scarce and/or scattered regarding emerging or advanced energy-efficiency and low-carbon technologies that are not yet commercialized or at the very early stage of adoption. This paper is intended to be a resource on these emerging technologies for engineers, researchers, investors, textile manufacturers, policy makers, and other interested parties. Hasanbeigi, A., Price, L. A technical review of emerging technologies for energy and water efficiency and pollution reduction in the textile industry – Journal of Cleaner Production, 2015, Vol. 95, pp. 30-44 DOI: 10.1016/j.jclepro.2015.02.079 Wenzhou used to be one of the poorest regions in eastern China. With limited arable land, poor road access to major cities, and little support from the upper level governments, this region seemed to lack all the conditions necessary for economic growth. However, over the past several decades Wenzhou has developed the most dynamic private sector in China, and has accordingly achieved one of the fastest growth rates. In particular, the footwear industry in Wenzhou has grown from a negligible market share to the largest in China. Here, we report a survey of 140 Wenzhou-based footwear enterprises of various scales, and use this information to examine the driving forces behind the dramatic rural industrial growth seen in this region. Our results show that clustering deepens the division of labor in the production process and makes it possible for small entrepreneurial firms to enter the industry by focusing on a narrowly defined stage of production. Therefore, Wenzhou represents an example of how clustering plays a significant role in helping fledgling rural industries overcome the growth constraints of capital and technology in the incipient stage of industrialization. Huang, Z., Zhang, X., Zhu, Y. The role of clustering in rural industrialization: A case study of the footwear industry in Wenzhou – China Economic Review, 2008, Vol. 19, pp. 409-420 DOI: 10.1016/j.chieco.2007.11.001 This study examines the social impacts of labor-related corporate social responsibility (CSR) policies or corporate codes of conduct on upholding labor standards through a case study of CSR discourses and codes implementation of Reebok – a leading branded company enjoying a high-profiled image for its human rights achievement – in a large Taiwanese-invested athletic footwear factory located in South China. I find although implementation of Reebok labor-related codes has resulted in a ‘‘race to ethical and legal minimum’’ labor standards when notoriously inhumane and seriously illegal labor rights abuses were curbed, Chinese workers were forced to work harder and faster but, earned less payment and the employee-elected trade union installed through codes implementation operated more like a ‘‘company union’’ rather than an autonomous workers’ organization representing worker’ interests. In order to explain the paradoxical effects of Reebok labor-related codes on labor standards, I argue the result is determined by both structural forces and agency-related factors embedded in industrial, national and local contexts. To put it shortly, I find the effectiveness of Reebok labor related codes is constrained not only by unsolved tension between Reebok’s impetus for profit maximization and commitment to workers’ human rights, but also by hardnosed competition realities at marketplace, and Chinese government’s insufficient protection of labor rights. Despite drawing merely from a single case study, these findings illuminate key determinants inhibiting the effectiveness of labor-related CSR policies or codes in upholding labor standards, and hence two possible wayouts of the deadlock: (1) sharing cost for improving labor standards among key players in global supply chain; and (2) combining regulatory power of voluntary codes and compulsory state legislations. Yu, X. Impacts of Corporate Code of Conduct on Labor Standards: A Case Study of Reebok’s Athletic Footwear Supplier Factory in China – Journal of Business Ethics, 2008, Vol. 81, pp. 513-529 DOI 10.1007/s10551-007-9521-2 Nowadays, food industry is facing challenges in preserving better quality of fruit and vegetable products after

37
processing. Recently, many attentions have been drawn to ginger rhizome processing due to its numerous health promoting properties. In our study, ginger rhizome slices were subjected to airdrying (AD), freeze drying (FD), infrared drying (IR), microwave drying (MD) and intermittent microwave & convective drying (IM&CD). Quality attributes of the dried samples were compared in terms of volatile compounds, 6, 8, 10-gingerols, 6-shogaol, antioxidant activities and microstructure. Results showed that AD and IR were good drying methods to preserve volatiles. FD, IR and IM&CD led to higher retention of gingerols, TPC, TFC and better antioxidant activities. However, FD and IR had relative high energy consumption and drying time. Therefore, considering about the quality retention and energy consumption, IM&CD would be very promising for thermo sensitive material. An, K., Zhao, D., Wangb, Z., Wua, J., Xu, Y., Xiao, G. Comparison of different drying methods on Chinese ginger (Zingiber officinale Roscoe): Changes in volatiles, chemical profile, antioxidant properties, and microstructure – Food Chemistry, 2016, Vol. 197, pp. 1292-1300 DOI: 10.1016/j.foodchem.2015.11.033
3.2 Türgi Türgi kohta informatsiooni otsimisel kasutasime riigi ja meie poolt vaadeldavate probleemide otsingukombinatsioone ja lisaks ka 2. peatükis välja toodud enim imporditavate toodete märksõnu.
Türgi osas ei leia palju artikleid lapstööjõust ja eriti ebainimlikest töötingimustest kui normaalsest ühiskonna osast. Türgi kohta artikleid otsides tulid sagedased vasted probleemide kohta sisserände osas, seda aga antud uuringu raames ei vaadatud. Valdkonnapõhised probleemid on üldiselt seotud tekstiili tootmisega. Türgi kohta leitud artiklid süstematiseerisime järgnevalt:
1) Artiklid, mis kajastavad töökeskkonna turvalisuse küsimusi, regulatsioone ja majandusprobleemide üldisemat külge. (Tabel 4)
2) Artiklid seoses lapstööjõuga. (Tabel 5) 3) Artiklid, kus on välja toodud probleemid Türgi ühes suurimas ekspordivaldkonnas ehk
tekstiilitööstuses. Eesti impordi seos Türgiga avaldub samuti suurel määral just selles valdkonnas. (Tabel 6)
4) Artiklid, mis vaatlevad vägivalla erinevaid vorme. Enamjaolt puudutab see naiste vastast koduvägivalda seoses töötamisega ja ahistamist. (Tabel 7)
5) Artiklid, milles on uuritud keskkonnaprobleeme Türgis. (Tabel 8)
Tabel 26. Artiklite lühikokkuvõtted ja viited – töökeskkond ja majandus
On the 13th of May 2014 a fire related incident in the Soma coal mine in Turkey caused 301 fatalities and more than 80 injuries. This has been the largest coal mine accident in Turkey, and in the OECD country group, so far. This study investigated if such a disastrous event should be expected, in a statistical sense, based on historical observations. For this purpose, PSI’s ENSAD database is used to extract accident data for the period 1970–2014. Four different cases are analyzed, i.e., OECD, OECD w/o Turkey, Turkey and USA. Analysis of temporal trends for annual numbers of accidents and fatalities indicated a non-significant decreasing tendency for OECD and OECD w/o Turkey and a significant one for USA, whereas for Turkey both measures showed an increase over time. The expectation analysis revealed clearly that an event with the consequences of the Soma accident is rather unlikely for OECD, OECD w/o Turkey and USA. In contrast, such a severe accident has a substantially higher expectation for Turkey, i.e. it cannot be considered an extremely rare event, based on historical experience. This indicates a need for improved safety measures and stricter regulations in the Turkish coal mining sector in order to get closer to the rest of OECD. Spada, M., Burgherr, P. An aftermath analysis of the 2014 coal mine accident in Soma, Turkey: Use of risk performance indicators based on historical experience – Accident Analysis and Prevention, 2016, Vol. 87, pp. 134-140 DOI: 10.1016/j.aap.2015.11.020 Many transition and developing economies have reduced direct public involvement in the production and trade of seed and other agricultural inputs. This trend creates opportunities for farmers to realize improved access to inputs, including technology from international private research. Unfortunately, input regulations often derail these opportunities by blocking private entry and the introduction of private technology. This study looks at the experience in Bangladesh, India, Turkey, and Zimbabwe to see whether regulations make a difference in agriculture and input industries in developing economies. In all countries, companies and farmers responded to regulatory

38
reforms by introducing and adopting more new technology and by expanding the production, trade, and use of inputs. The increased use of private technology has brought higher yields and incomes, allowing farmers and consumers to reach higher levels of welfare. These results challenge governments to open their regulatory systems to allow market entry and the introduction of private technology through seeds and other inputs. Gisselquist, D., Nash, J., Pray, C. Deregulating the Transfer of Agricultural Technology: Lessons from Bangladesh, India, Turkey, and Zimbabwe – World Bank Research Observer, 2002, Vol. 17, No. 2, pp. 237-266 ISSN: 1564-6971 Fatal underground coal mine injuries are a worldwide problem. Zonguldak holds 95% of all Turkey’s coal reserves. Aim was to investigate fatalities in the underground coal-mining industry in the Zonguldak province. Retrospective study of fatal underground coal-mining accidents from 1994 to 2003 through evaluation of industry records. Results: There were 164 deaths available for analysis. The median age was 36 years (range: 14–56 years). Eighty-one fatalities (49%) were due to subsidence, 33 (20%) were due to underground railway accidents and 18 (11%) were due to gas poisoning. Asphyxia was the most common cause of death (99, 60%). The majority of fatalities (144, 87%) occurred instantaneously at the scene of the incident. The remainder (20, 13%) occurred on the way to the hospital or in the emergency room or the intensive care unit. The underground coal-mining industry in Turkey requires strategies to improve safety and reduce the number of fatalities occurring. These strategies should focus on improved underground safety through engineering measures. Kucuker, H. Occupational fatalities among coal mine workers in Zonguldak, Turkey, 1994–2003 – Occupational Medicine, 2006, Vol. 56, pp. 144–146 DOI: 10.1093/occmed/kqj023 Occupational accidents lead to serious problems in Turkey and in many other countries. The most important results of occupational accidents are deaths, injuries or disabilities. In addition, many other important work related accidents cause serious financial losses. As it is all around tbe world, there are certain sectors in which occupational accidents mostly occur. Taking the number of accidents, the number of permanent incapacities and the number of deaths into account, these sectors can be listed as Mining, Metal, and Construction. These three sectors are indicated as the priority sectors by Republic of Turkey Ministry of Labour and Social Security in terms of the struggle against occupational accidents. When the data on the accidents at work between 2004 and 2010 is analyzed, it is seen that 46,4% of the accidents and 41,1% of the deaths in Turkey occurred only in these three sectors. Therefore, examining these three sectors would enable to reveal their specific problems regarding occupational safety. In this study, using the accident data from the year 2004 to 2010 by SSI (Social Security Institution), all the accidents which occurred in Turkey and the accidents specifically in Mining, Metal and Construction sectors were compared in temis of the parameters, which are also used by the international accident statisticians. (Since it has not been completed yet, the accident data on the year 2011 was not included in this study.) Ceylan, H. Analysis of Occupational Accidents According to The Sectors in Turkey – Gazi Universitv Jownal of Science, 2012, Vol. 25, No. 4, pp. 909-918 Fishing has always been a dangerous occupation, and numerous factors have a direct or indirect impact on the health of fisherman. To examine the health, safety and working conditions of small-scale fishing fleets in the Turkish Aegean Sea coasts. Data were obtained from a questionnaire distributed to a random sample of small-scale fishermen along the Aegean Sea coast. Data collection took place between September 2009 and January 2010. Results: Out of 5714 Aegean Sea small-scale fishermen, 1166 from 76 fishing ports participated. Twenty-nine per cent of fishermen did not have any social security cover. The most prevalent health problems (using International Classification of Diseases and Related Health Problems 10th Revision [ICD- 10]) found were musculoskeletal problems (e.g. discopathies, muscular strain, rheumatism) and eye, ear–nose, digestive and urinary system problems. Alcohol consumption was high (68%) in fishermen and 72% reported that they smoked more during fishing trips. Health problems appeared to be associated with a number of factors including migrant status, income satisfaction, rank, type of fishing and cumulative work per year. In Turkey, small-scale fishermen experience a significant number of health problems and have unhealthy lifestyles. Interventions designed to improve working conditions of small-scale fishermen could help to reduce the number of occupational injuries, which in turn may impact positively on their health. Prevention policies to reduce alcohol and tobacco consumption should also be developed. Percin, F., Akyol, O., Davas, A., Saygi, H. Occupational health of Turkish Aegean small-scale fishermen – Occupational Medicine, 2012, Vol. 62, pp. 148-151 DOI: 10.1093/occmed/kqr181 Although work provides many economic and other benefits, a wide array of workplace hazards also present risks to the health and safety of people at work. These include but are not limited to, "chemicals, biological agents, physical factors, ergonomic conditions, allergens, a complex network of safety risks," and a broad range of psychosocial risk factors. Occupational risk factors are those factors which directly or indirectly influence the health and performance of the workers. There are different risk factors associated to the working people’s health within the given environment of the workplace. Participation of women at work is ensured by the laps of globalization. When we look into the role of women in today’s world, women are employed in every industry and institute and hold nearly every

39
kind of jobs. Present study aims at understanding the association between perceived occupational risk factors, safety culture and psycho-social health of working women in metal industries in Turkey. In this study, researchers try to highlight the importance of the issue in the context of Turkey and more specifically working women in metal industries. For the present study, 1750 working women were sampled from metal industries through simple random sampling by using sample size determinant formula in Turkey. The results showed that there is a positive association among perceived occupational risk factors, safety culture and Perception of safety awareness. The negative directional relation is observed between the Fatalism perception and awareness of safety and health of working women. Akalpa, G., Aytac, S., Yamankaradeniz, N., Cankaya, O. et al. Perceived safety culture and occupational risk factors among women in metal industries: A study in Turkey – Procedia Manufacturing, 2015, Vol. 3, pp. 4956-4963 DOI: 10.1016/j.promfg.2015.07.640 Tabel 27. Artiklite lühikokkuvõtted ja viited – lapstööjõud
Education is an important tool for development of individuals and societies. Children as a part of education system and the adults of future are a vital importance. The education system should be covered, especially children, including every human being in order to develop. In Turkey the process of education raised to twelve year, is known 4+4+4 system, and this decision got so much reaction because of its possible results. One of this results is the child labour problem. The aim of this study is to discuss the effects of education system on the child labour and bring into question social work intervention in order to eliminate this problem. Yıldırım, B., Beydilib, E., Görgülüc, M. The effects of education system on to the child labour: an evaluation from the social work perspective – Procedia-Social and Behavioral Sciences, 2015, Vol. 174, pp. 518-522 DOI: 10.1016/j.sbspro.2015.01.697 Two little known forms of child labour in Turkey are examined. The process through which these children are made to work has parallels with the experiences of slaves. First, a longstanding practice from Northwestern Turkey of parents hiring children to better-off farmers is examined. Further, a more recent problem is examined where children are trafficked to big cities and forced to join criminal rings. Both forms of child labour are consequences of poverty. The factors that give rise to child trafficking and parents letting their children be trafficked are extreme poverty and internal displacement of families. Degirmencioglu, S.M., Acar, H., Acar, Y.B. Extreme Forms of Child Labour in Turkey – Children and Society, 2008, Vol. 22, pp. 191-200 DOI: 10.1111/j.1099-0860.2008.00150.x The phenomenon of children working on the streets is a societal issue in all underdeveloped or developing countries just as it is in Turkey. The purpose of this research was to examine the reasons that children work on the street by conducting individual in-depth interviews with working children and their mothers, choosing individuals from similar socioeconomic demographic backgrounds and making a comparison of their acceptance or rejection of working, the perception of social support received by the mothers, and their problem-solving skills. The research was a mixed study that used both qualitative and quantitative techniques. The research was conducted in two stages. In the first stage, quantitative comparisons were made of the problem-solving skills of and social support received by the mothers of children working on the streets (n=37) and non-working children (n=35) and of the parental acceptance or rejection/control status of working children (n = 41) and non-working children (n = 41). In the second stage, the reasons children were working on the streets were evaluated qualitatively with seven children who were working on the streets and nine mothers. The Child/Adolescent Parental Acceptance–Rejection/Control Questionnaire, the Multidimensional Scale of Perceived Social Support, the Problem-Solving Inventory, and individual interview questionnaires were used as data collection tools. The social support and problem solving skills of the mothers with children working on the streets were lower than those of the mothers whose children were not working. The main themes and sub-themes that stood out at the end of the research were socioeconomic and political factors, environmental factors, cultural factors and family factors. Mert, K., Kadıoğlu, H. The reasons why children work on the streets: A sample from Turkey – Children and Youth Services Review, 2014, Vol. 44, pp. 171-180 Tabel 28. Artiklite lühikokkuvõtted ja viited – tekstiilitööstus
Cotton textile and clothing industry is a complex and multi-tiered system that consists of cotton cultivation and harvesting, fiber production, yarn manufacturing, fabric preparation, fabric processing that includes bleaching and dying sub-processes among others and fabrication of the final product. An array of environmental concerns are associated with this sector, the most significant of which are issues related to use of agrochemicals in the cultivation of cotton and water, energy and chemical consumption in the fabric processing stage. Textile industry is a significant contributor to the Turkish economy constituting18% of total export volume in 2013 according to

40
Turkish Statistical Institute. In the study, environmental impacts of Eco T-shirts produced from organically grown cotton and processed with green dyeing recipe were compared to that of conventional T-shirts, in terms of their contributions to global warming, acidification, aquatic and terrestrial eutrophication and photochemical ozone formation using life cycle assessment methodology. The results reveal that Eco T-shirts have lower impact potentials across all inspected categories, with the most dramatic reduction in aquatic eutrophication potential (up to 97%)due to elimination of nitrogen and phosphorus containing chemical based fertilizers. The results also show that global warming potential is by far the largest environmental impact for both conventional and Eco T-shirts with the main impact coming from use phase, followed by cultivation and harvesting and fabric processing phases. The results of the analysis underline the importance of utilizing sustainable raw materials in all life cycle stages of cotton textile products and the necessity of focusing on the consumer behavior and sustainable practices in the use phase of the products as well. Baydara, G., Ciliza, N., Mammadova, A. Life cycle assessment of cotton textile products in Turkey – Resources, Conservation and Recycling, 2015, Vol. 104, pp. 213-223 DOI: 10.1016/j.resconrec.2015.08.007 In 2004, USA signed a bilateral free trade agreement with Morocco that was potentially devastating for the Turkish firm Mithat, an established clothing supplier of a number of major US buyers including Gap/Banana Republic/Old Navy. By means of this case study, we observe the manner in which manufacturing suppliers make their own calculations in response to their buyers’ sourcing calculus—a daunting task, especially when it is necessary to take into account politically motivated bilateral free trade agreements between countries which are neither natural partners nor in geographical proximity with each other. Tokatli, N., Kızılgun, O. Coping with the changing rules of the game in the global textiles and apparel industries: evidence from Turkey and Morocco – Journal of Economic Geography, 2010, Vol. 10, pp. 209-229 DOI: 10.1093/jeg/lbp033 Textile sector of Turkey has a large production capacity and it is one of the important sectors. Many industrial heating processes generate waste energy in textile industry. Therefore, there is a tremendous waste-heat potential to utilize in textile applications. This study assesses the potential of waste-heat obtained from particularly dyeing process at textile industry in Bursa where textile center of Turkey. Energy consumptions could be decreased by using of waste-heat recovery systems (WHRSs). A thermodynamic analysis is performed in this study. An exergy-based approach is performed for optimizing the effective working conditions for WHRSs with water-to-water shell and tube heat exchanger. The payback period is found to be less than 6 months. The variations of the parameters which affect the system performance such as waste-water inlet temperature, mass flow rate, cooling water inlet pressure and dead state conditions are examined respectively. The results of the analysis show that the exergy destruction rate and economical profit increase with increasing of mass flow rate of the waste water. Similarly, exergy destruction rate, effectiveness and economical profit increase while the second law efficiency decreases as the waste-water inlet temperature increases. Pulat, E., Etemoglu, A.B, Can, M. Waste-heat recovery potential in Turkish textile industry: Case study for city of Bursa. – Renewable and Sustainable Energy Reviews, 2009, Vol. 13, pp. 663-672 DOI: 10.1016/j.rser.2007.10.002 Wet processing textile industry has many different processing stages (dyeing, sizing, de-sizing, scouring, softening, etc.). Many chemicals currently used in the wet processing textile industry affect the amount and the type of waste produced and their influence on the aquatic life of the receiving stream. One of the critical steps in pollution prevention studies is auditing the use of chemicals and making the necessary chemical substitutions. This chemical substitution study was conducted on one of the major textile factories in Turkey with a capacity of 20,000 tons of denim fabric per year. During this study, chemical consumption level, receipts applied, environmentally problematic and alternative chemicals were examined. Integrated Pollution Prevention and Control (IPPC) Reference Document on Best Available Techniques (BAT) for the Textiles Industry was accepted as main reference document and also related case studies were examined. According to the study, over 70% reduction in sulphide, which is very toxic to aquatic life, was achieved by replacing sulphur dyestuff with low sulphide content. By replacing an alternative complexing agent, the mill not only prevented the 3100 kg/month COD load to the wastewater treatment plant (WWTP), but also obtained more biodegradable wastewater generated during production. On the other hand, some of the chemical substitution options were on progress or dropped. Ozturk, E., Yetis, U., Dilek, F.B., Demirer, G.N. A chemical substitution study for a wet processing textile mill in Turkey – Journal of Cleaner Production, 2009, Vol. 17, pp. 239-247 DOI: 10.1016/j.jclepro.2008.05.001 The serpentine and amphibole minerals, collectively known as asbestos, have been used in a large number of products. In industrialised nations, these products are strictly regulated because of health concerns, and their consumption has declined significantly in recent decades. In contrast, some developing nations are increasing their use of asbestos products, while others are decreasing it gradually. The developing nations with inadequate control mechanisms will face occupational and environmental consequences of their asbestos use. As a developing nation,

41
Turkey recently regulated asbestos products and airborne fibre concentrations; however, their current status is unknown at this point. Therefore, asbestos and alternative products, and the potential for worker exposure to asbestos fibres are investigated in representative Turkish industrial facilities. The experimental results show that asbestos products containing chrysotile and alternatives containing fibre glass or wollastonite are present in Turkish factories. Some of the asbestos products are manufactured and used commonly, while others are no longer manufactured, though they are in-place. The potential for worker exposure to fibres is assessed in light of the experimental results and similar studies, and the risk of exposure was minimal in these facilities, as asbestos products were non-friable and isolated from the work environment. Karadagli, F. Comparative Assessment of Asbestos-Containing and Alternative Materials in Turkish Industrial Facilities – Indoor Built Environ, 2011, Vol. 20, No. 4:, pp. 471-478 DOI: 10.1177/1420326X11410089 Tabel 29. Artiklite lühikokkuvõtted ja viited – vägivald
In the light of feminist critiques, this paper examines how the United Nation’s anti trafficking protocol is materialised in Turkey with a focus on the issue of “consent” in determining victims of sex trafficking. Contrary to the Protocol, non-payment and forcible transportation become important criteria and create barriers in identifying a “victim” of sex trafficking. It is argued that Turkey’s interpretation of the UN Protocol is rather narrow and this is mostly a result of Turkey’s existing migration and prostitution regimes. Based on qualitative fieldwork, this paper intends to advance the knowledge in the field of sex trafficking using Turkey as a case study. Coskun, E. “Consent” Issue in Sex Trafficking and Evidence from Turkey – Social Politics, 2015, pp. 1-22 DOI: 10.1093/sp/jxv018 The major purpose of this study was to examine perceptions of workplace sexual harassment in the Turkish context. In Study 1, 53 working women were interviewed to identify culture-relevant behaviors that are considered to be sexual harassment. In Study 2, the factor structure of perceptions was explored. In addition, the way in which these perceptions are related to personal variables (i.e. gender role attitudes, self-esteem, and negative affectivity) was investigated. Participants were 353 women currently employed at various organisations. Five factors were identified: sexist hostility, insinuation of interest, sexual hostility, physical sexual offense, and sexual bribery and coercion. Each factor was regressed on the personal variables. After controlling for relevant demographic and organisational variables, gender role attitudes, self-esteem, and negative affectivity predicted sexual harassment perceptions. Specifically, negative affectivity predicted milder forms of harassment, attitudes predicted factors that are considered more severe, and self-esteem predicted all factors but sexist hostility. The extent to which sexual harassment manifestations are universal and how certain manifestations that appeared in the Turkish context broaden the scope of sexual harassment are discussed by referring to the US literature. Toker, Y., Sümer, C. Workplace Sexual Harassment Perceptions in the Turkish Context and the Role of Individual Differences – Applied Psychology: An International Review, 2010, Vol. 59, No. 4, pp. 616–646 DOI: 10.1111/j.1464-0597.2010.00420.x A large, nationally representative, cross-sectional survey was conducted in Turkey in 2008. In this survey, which used the WHO (World Health Organization) study module on violence, information about lifetime and current violence (past 12 months) was obtained using weighted, stratified, and multistage cluster sampling. This article describes factors associated with physical or sexual violence experienced by ever-married women, aged 15 to 49, from their current or most recent husbands in the 12 months before the survey. Logistic regression analysis is used to describe the risk and protective factors from a considerable range of explanatory variables. The findings confirm that many factors are similar to the experiences of other countries. The physical or sexual violence experienced by ever-married women from their husbands was 15.1%. The violence experienced by women is significantly positively associated with early childhood abuse experiences of both women and their husbands; marriages decided by families or others; husband’s behaviors such as drunkenness, adultery, controlling women’s behavior, and preventing contact with women’s family and friends. The age of the women, their contribution to the household income, support from women’s families, women’s acceptance of male authority, and nonpartner violence experience as well as regional differentials also affect the risk of violence. No significant associations were found with the employment status of women and men or education difference. This study, as one of the largest surveys ever conducted on the issue of domestic violence using face-to-face interviews, demonstrated how the patriarchal family structure still affects women’s lives in Turkey. This is particularly significant, given Turkey’s setting between traditional and modern values. Yüksel-Kaptanoğlu, I., Türkyılmaz, A.S., Heise, L. What Puts Women at Risk of Violence From Their Husbands? Findings From a Large, Nationally Representative Survey in Turkey – Journal of Interpersonal Violence, 2012, Vol. 27, No. 14, pp. 2743-2769 DOI: 10.1177/0886260512438283
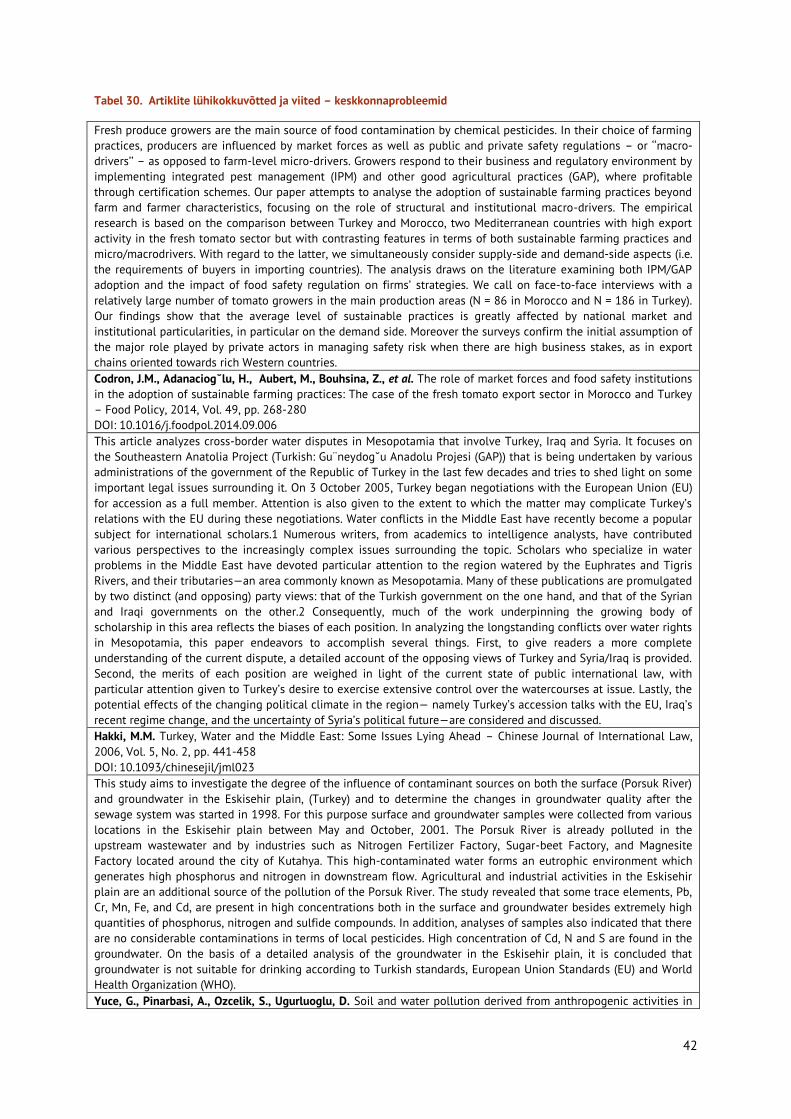
42
Tabel 30. Artiklite lühikokkuvõtted ja viited – keskkonnaprobleemid
Fresh produce growers are the main source of food contamination by chemical pesticides. In their choice of farming practices, producers are influenced by market forces as well as public and private safety regulations – or ‘‘macro-drivers’’ – as opposed to farm-level micro-drivers. Growers respond to their business and regulatory environment by implementing integrated pest management (IPM) and other good agricultural practices (GAP), where profitable through certification schemes. Our paper attempts to analyse the adoption of sustainable farming practices beyond farm and farmer characteristics, focusing on the role of structural and institutional macro-drivers. The empirical research is based on the comparison between Turkey and Morocco, two Mediterranean countries with high export activity in the fresh tomato sector but with contrasting features in terms of both sustainable farming practices and micro/macrodrivers. With regard to the latter, we simultaneously consider supply-side and demand-side aspects (i.e. the requirements of buyers in importing countries). The analysis draws on the literature examining both IPM/GAP adoption and the impact of food safety regulation on firms’ strategies. We call on face-to-face interviews with a relatively large number of tomato growers in the main production areas (N = 86 in Morocco and N = 186 in Turkey). Our findings show that the average level of sustainable practices is greatly affected by national market and institutional particularities, in particular on the demand side. Moreover the surveys confirm the initial assumption of the major role played by private actors in managing safety risk when there are high business stakes, as in export chains oriented towards rich Western countries. Codron, J.M., Adanaciog˘lu, H., Aubert, M., Bouhsina, Z., et al. The role of market forces and food safety institutions in the adoption of sustainable farming practices: The case of the fresh tomato export sector in Morocco and Turkey – Food Policy, 2014, Vol. 49, pp. 268-280 DOI: 10.1016/j.foodpol.2014.09.006 This article analyzes cross-border water disputes in Mesopotamia that involve Turkey, Iraq and Syria. It focuses on the Southeastern Anatolia Project (Turkish: Gu¨neydog˘u Anadolu Projesi (GAP)) that is being undertaken by various administrations of the government of the Republic of Turkey in the last few decades and tries to shed light on some important legal issues surrounding it. On 3 October 2005, Turkey began negotiations with the European Union (EU) for accession as a full member. Attention is also given to the extent to which the matter may complicate Turkey’s relations with the EU during these negotiations. Water conflicts in the Middle East have recently become a popular subject for international scholars.1 Numerous writers, from academics to intelligence analysts, have contributed various perspectives to the increasingly complex issues surrounding the topic. Scholars who specialize in water problems in the Middle East have devoted particular attention to the region watered by the Euphrates and Tigris Rivers, and their tributaries—an area commonly known as Mesopotamia. Many of these publications are promulgated by two distinct (and opposing) party views: that of the Turkish government on the one hand, and that of the Syrian and Iraqi governments on the other.2 Consequently, much of the work underpinning the growing body of scholarship in this area reflects the biases of each position. In analyzing the longstanding conflicts over water rights in Mesopotamia, this paper endeavors to accomplish several things. First, to give readers a more complete understanding of the current dispute, a detailed account of the opposing views of Turkey and Syria/Iraq is provided. Second, the merits of each position are weighed in light of the current state of public international law, with particular attention given to Turkey’s desire to exercise extensive control over the watercourses at issue. Lastly, the potential effects of the changing political climate in the region— namely Turkey’s accession talks with the EU, Iraq’s recent regime change, and the uncertainty of Syria’s political future—are considered and discussed. Hakki, M.M. Turkey, Water and the Middle East: Some Issues Lying Ahead – Chinese Journal of International Law, 2006, Vol. 5, No. 2, pp. 441-458 DOI: 10.1093/chinesejil/jml023 This study aims to investigate the degree of the influence of contaminant sources on both the surface (Porsuk River) and groundwater in the Eskisehir plain, (Turkey) and to determine the changes in groundwater quality after the sewage system was started in 1998. For this purpose surface and groundwater samples were collected from various locations in the Eskisehir plain between May and October, 2001. The Porsuk River is already polluted in the upstream wastewater and by industries such as Nitrogen Fertilizer Factory, Sugar-beet Factory, and Magnesite Factory located around the city of Kutahya. This high-contaminated water forms an eutrophic environment which generates high phosphorus and nitrogen in downstream flow. Agricultural and industrial activities in the Eskisehir plain are an additional source of the pollution of the Porsuk River. The study revealed that some trace elements, Pb, Cr, Mn, Fe, and Cd, are present in high concentrations both in the surface and groundwater besides extremely high quantities of phosphorus, nitrogen and sulfide compounds. In addition, analyses of samples also indicated that there are no considerable contaminations in terms of local pesticides. High concentration of Cd, N and S are found in the groundwater. On the basis of a detailed analysis of the groundwater in the Eskisehir plain, it is concluded that groundwater is not suitable for drinking according to Turkish standards, European Union Standards (EU) and World Health Organization (WHO). Yuce, G., Pinarbasi, A., Ozcelik, S., Ugurluoglu, D. Soil and water pollution derived from anthropogenic activities in

43
the Porsuk River Basin, Turkey – Environ Geol, 2006, Vol. 49, pp. 359-375 DOI 10.1007/s00254-005-0072-5 The World Business Council for Sustainable Development (WBCSD) and the World Resource Institute (WRI) set the scope-based carbon footprint accounting standards in which all possible supply-chain related indirect greenhouse gas emissions are captured. Although this carbon footprint accounting standards are widely used in regional policy making, there is little effort in analyzing the scope-based carbon footprints of nations using a multi-region input–output (MRIO) analysis in order to consider the role of global trade. This research aims to advance the body of knowledge on carbon footprint analysis of the manufacturing sectors with a holistic approach combining the WBCSD & WRI’s scope-based carbon footprint accounting standards with a time series MRIO framework. To achieve this goal, a global scope-based carbon footprint analysis of the Turkish manufacturing sectors has been conducted as a case study. We employed a time series MRIO analysis by using theWorld Input–Output Database on the world’s 40 largest economies covering 1440 economic sectors. The results showed that electricity, gas and water supply was the most dominant sector in the supply chains of the Turkish industrial sectors with the largest carbon footprint. On average, indirect emissions of the Turkish manufacturing industry are found to be higher than direct emissions during the period from 2000 to 2009. The results of this analysis revealed that supply chain related indirect emissions (represented by scope 3) are responsible for nearly 56.5% total carbon emissions of sectors, which highlights the crucial role of supply chains on overall carbon footprint of sectors. Kucukvara, M., Egilmezb, G., Onatc, N.C., Samadid, H. A global, scope-based carbon footprint modeling for effective carbon reduction policies: Lessons from the Turkish manufacturing – Sustainable Consumption, Vol. 1, 2015, pp. 47-66 DOI: 10.1016/j.spc.2015.05.005 In this study we aim at providing an analytical framework for Turkey to study the macroeconomics and environmental impacts of the existing coal subsidization scheme. To this end we develop a regionally differentiated applied general equilibrium model spanning over 2015–2030. Our analytical apparatus focuses exclusively on the fiscal implications as well as the environmental repercussions of the removal of the subsidies on greenhouse gas emissions. With the aid of a set of alternative policy scenarios against a “business as usual” path, we study the regional and sectorial performances of growth, employment, investment and capital accumulation, consumption/ welfare and trade balance. Our results indicate that by simple elimination of the coal subsidization scheme, Turkey can reduce its aggregate gaseouse missions by as much as 5% without a significant loss in its GDP. Acar, S., Yeldan, A.E. Environmental impacts of coal subsidies in Turkey: A general equilibrium analysis – Energy Policy, 2016, Vol. 90, pp. 1-15 DOI: 10.1016/j.enpol.2015.12.003
3.3 Bangladesh Bangladeshi kohta informatsiooni otsimisel kasutasime riigi ja meie poolt vaadeldavate probleemide otsingukombinatsioone ja sinna juurde ka 2. peatükis välja toodud enim imporditavate toodete märksõnu.
Bangladeshi puhul avaldus enim probleeme keskkonna küsimustes ja sarnaselt Türgiga tekstiili- ning rõivatööstuses. Artiklid süstematiseerisime järgnevatesse gruppidesse:
1) Artiklid, mis kajastavad probleeme seoses looduse ja keskkonnaga. 2) Artiklid, mis kajastavad olukorda Bangladeshi tekstiili- ja rõivatööstustes. 3) Artiklid üleüldistest probleemidest tööregulatsioonidega, majandusega ja töötingimustega. 4) Artiklid vägivalla kohta, lisaks ka üks artikkel lapstööjõu teemal.
Tabel 31. Artiklite lühikokkuvõtted ja viited – keskkond
The paper examines the impacts of climate change, agroecology and socio-economic factors on agricultural land use diversity (ALUD) using a panel data of 17 regions of Bangladesh covering a 61 year period (1948–2008) by applying a dynamic panel GMM estimator. Results revealed that ALUD and total rainfall have actually increased @ 0.19% and 0.02% per year whereas variability in temperature has declined @ 0.06% with significant differences across agroecological zones (AEZs). Among the climatic factors, total rainfall significantly increases ALUD. ALUD is also significantly influenced by agroecological characteristics. ALUD is significantly higher in Ganges River Floodplains but lower in Meghna River Flood-plains and Chittagong Coastal Plain. Among the socio-economic factors, ALUD increases significantly with increase in the prices of vegetables, jute and phosphate fertilizer and R&D investment. ALUD significantly decreases with increase in the prices of lentil, onion, sugarcane, nitrogen and potassium

44
fertilizers and extension expenditure. Policy implications include price policies to improve vegetable and jute prices, stabilise/reduce fertilizer prices and investments in R&D to develop crops that are suitable for high rainfall areas as well as specific AEZs in order to promote ALUD in Bangladesh. Rahman, S. Impacts of climate change, agroecology and socio-economic factors on agricultural land use diversity in Bangladesh (1948–2008) – Land Use Policy, 2016, Vol. 50, pp. 169-178 DOI: 10.1016/j.landusepol.2015.09.010 Concerns about the sustainability of conventional agriculture have prompted widespread introduction of integrated pest management (IPM), an ecologically based approach to control harmful insects and weeds. IPM is intended to reduce ecological and health damage from chemical pesticides by using natural parasites and predators to control pest populations. Since chemical pesticides are expensive for poor farmers, IPM offers the prospect of lower production costs and higher profitability. However, adoption of IPM may reduce profitability if it also lowers overall productivity or induces more intensive use of other production factors. On the other hand, IPM may actually promote more productive farming by encouraging more skillful use of available resources. Data scarcity has hindered a full accounting of IPM’s impact on profitability, health, and local ecosystems. Using new survey data, this paper attempts such an accounting for rice farmers in Bangladesh. We compare outcomes for farming with IPM and conventional techniques, using input-use accounting and conventional production functions. All of our results suggest that the productivity of IPM rice farming is not significantly different from conventional farming. Since IPM reduces pesticide costs with no countervailing loss in production, it appears to be more profitable than conventional rice farming. Our interview results also suggest substantial health and ecological benefits. However, externality problems make it difficult for farmers to adopt IPM individually. Without collective adoption, neighbors’ continued reliance on chemicals to eliminate pests will also kill helpful parasites and predators, as well as expose IPM farmers and local ecosystems to chemical spillovers from adjoining fields. Successful IPM adoption may therefore depend on institutional support for collective action. Dasgupta, S., Meisner, C., Wheeler, D. Is Environmentally Friendly Agriculture Less Profitable for Farmers? Evidence on Integrated Pest Management in Bangladesh – Review of Agricultural Economics, 2008, Vo. 29, No 1, pp. 103–118 DOI:10.1111/j.1467-9353.2006.00332.x Brick kilns in Bangladesh use inefficient coal burning technology that generates substantial air pollution. We investigated the incentives of stakeholders in brick manufacturing in Bangladesh to help inform strategies to reduce this pollution. A team of Bangladeshi anthropologists conducted in-depth interviews with brick buyers, kiln owners, and Department of Environment employees. Brick buyers reported that bricks manufactured in traditional kilns worked well for most construction purposes and cost 40% less than bricks manufactured in more modern, less polluting, kilns. Brick kiln owners favored approaches with rapid high return on a modest investment. They preferred kilns that operate only during the dry season, allowing them to use cheaper low-lying flood plain land and inexpensive seasonal labor. The Department of Environment employees reported that many kilns violate environmental regulations but shortages of equipment and manpower combined with political connections of kiln owners undermine enforcement. The system of brick manufacturing in Bangladesh is an economic equilibrium with the manufacture of inexpensive bricks supplying the demand for construction materials but at high cost to the environment and health of the population. Low-cost changes to improve kiln efficiency and reduce emissions could help move toward a more socially desirable equilibrium. Luby, S.P., Biswas, D., Gurley, E.S., Hossainc, I. Why highly polluting methods are used to manufacture bricks in Bangladesh – Energy for Sustainable Development, 2015, Vol. 28, pp. 68-74 DOI: 10.1016/j.esd.2015.07.003 Bangladesh has experienced the largest mass poisoning of a population in history owing to contamination of groundwater with naturally occurring inorganic arsenic. Prolonged drinking of such water risks development of diseases and therefore has implications for children’s cognitive and psychological development. This study examines the effect of arsenic contamination of tubewells, the primary source of drinking water at home, on the learning outcome of school-going children in rural Bangladesh using recent nationally representative data on secondary school children. We unambiguously find a negative and statistically significant correlation between mathematics scores and arsenic-contaminated drinking tubewells at home, net of the child’s socio-economic status, parental background and school specific unobserved correlates of learning. Similar correlations are found for an alternative measure of student achievement and subjective well-being (i.e. self-reported measure of life satisfaction), of the student. We conclude by discussing the policy implication of our findings in the context of the current debate over the adverse effect of arsenic poisoning on children. Asadullaha, M.N, Chaudhuryd, N. Poisoning the mind: Arsenic contamination of drinking water wells and children’s educational achievement in rural Bangladesh – Economics of Education Review, 2011, Vol. 30, pp. 873-888 DOI: 10.1016/j.econedurev.2011.05.001 This study examines the relationship between the yield of three major rice crops (e.g., Aus, Aman and Boro) and three main climate variables (e.g., maximum temperature, minimum temperature and rainfall) for Bangladesh. We use time series data for the 1972–2009 period at an aggregate level to assess the relationship between climate

45
variables and rice yield using both the ordinary least squares and median (quantile) regression methods. The findings of this study confirm that climate variables have had significant effects on rice yields but that these effects vary among three rice crops. Maximum temperature is statistically significant for all rice yields with positive effects on Aus and Aman rice and adverse effects on Boro rice. Minimum temperature has a statistically significant negative effect on Aman rice and a significantly positive effect on Boro rice. Finally, rainfall has a statistically significant effect on Aus and Aman rice. Nonetheless, the influences of maximum temperature and minimum temperature are more pronounced compared with that of rainfall. Given these effects of temperature on rice crops and increasing climate change vulnerabilities, policy makers should fund the research and development of temperature tolerant rice varieties, particularly for Aman and Boro rice. Sarker, A.R., Alam, K., Gowa, J. Exploring the relationship between climate change and rice yield in Bangladesh: An analysis of time series data – Agricultural Systems, 2012, Vol. 112, pp. 11-16 DOI: 10.1016/j.agsy.2012.06.004 Tabel 32. Artiklite lühikokkuvõtted ja viited – tekstiil ja rõivad
If the world wants an image that sums up the true cost of supplying big-name retailers with cheap, fast fashion, it only has to look at the horrifying images that emerged from Dhaka in April 2013. This is now the deadliest garment-factory accident in history. The death toll from the building collapse at the Rana Plaza complex in the Savar district of Greater Dhaka, Bangladesh stands at more than 1100 making it the world’s worst industrial accident since the Bhopal disaster in India in 1984 and worse than the Triangle Shirtwaist Factory fire of 1911 that prompted American legislation requiring improved factory safety standards. Since 2005, at least 1800 garment workers have been killed in factory fires and building collapses in Bangladesh alone according to research by the advocacy group International Labor Rights Forum and the problem affects many other countries where cheap clothes are manufactured. Hobson, J. To die for? The health and safety of fast fashion – Occupational Medicine, 2013, Vol. 63, No. 5, pp. 317-319. DOI: 10.1093/occmed/kqt079 This paper applies a CGE model to analyze the effects of better addressing worker’s rights in Bangladesh’s textile and apparel industries. Results show that an increased minimum wage for unskilled, low-, and medium-skilled workers has negative impacts for these workers in aggregate and also for the economy in terms of export, GDP, and welfare. This comes from the decrease in employment. However, labor productivity-increasing improvements in factory conditions and services to workers not only increase incomes of workers, but also welfare. Entrepreneurs also enjoy higher incomes, enabling them to pay for improving the work environment. Ahmed, N., Peerlings, J.H.M. Addressing Workers’ Rights in the Textile and Apparel Industries: Consequences for the Bangladesh Economy – World Development, 2009, Vol. 37, No. 3, pp. 661-675 DOI: 10.1016/j.worlddev.2008.06.003 Evidence on the association of work stress with cortisol levels is inconsistent and mostly stems from Western countries, with limited generalizability to other regions of the world. These inconsistencies may partly be due to methodological limitations associated with the measurement of cortisol secretion in saliva, serum or urine. The present study set out to explore associations of work stress with long-term integrated cortisol levels in hair among 175 workers of an export oriented ready-made garment (RMG) factory in Dhaka, Bangladesh. Work-related demands (WD), interpersonal resources (IR) and work-related values (WV) were assessed using a psychometrically evaluated interview. WD consisted of four items on physical demands, time pressure, worries about mistakes and exposure to abusive language. IR comprised five items addressing support, recognition, adequate payment, workers’ trust in the management, and the management’s trust in workers, as perceived by the workers. WV captured job security, promotion prospects and job latitude by three items. Hair cortisol concentrations (HCC) were analyzed by liquid chromatography—mass spectrometry. Stepwise multivariable linear regression models (backward elimination of predictors) were used to estimate associations of HCC with the three work stress components. For significant work stress component(s), further multivariable linear regression analyses were conducted to explore whether, and if so, which individual item(s)contributed most. The mean HCC equaled 3.27 (SD 2.58) pg/mg. HCC were found to be significantly associated with WV (beta = 0.209, p = 0.021). Additional analyses of the three WV items revealed that this association was largely driven the item on ‘‘promotion prospects’’ (beta = 0.230, p = 0.007) implying that the perception of good promotion prospects was associated with higher HCC. The finding of elevated HCC with good promotion prospects may initially seem counter-intuitive, but is supported by research documenting that job promotion may result in poorer mental well-being. Moreover, being promoted in the Bangladeshi RMG industry may represent a stressful experience: job promotions are rare in this setting and are associated with the need to meet exceptional job-related demands. Further research from ethnic and culturally diverse occupational settings is needed to test this hypothesis, to shed light on the reproducibility of our findings and to improve our understanding of the psychobiological implications of psychosocial working conditions across cultures and contexts.

46
Steinischa, M., Yusufc, R., Lie, J., Stalderf, T. Work stress and hair cortisol levels among workers in a Bangladeshi ready-made garment factory: Results from across-sectional study – Psychoneuroendocrinology, 2014, Vol. 50, pp. 20-27 DOI: 10.1016/j.psyneuen.2014.08.001 Can export growth occur in states with weak governance and competitive clientelism? Conventional wisdom is that effective industrial policy requires a politically stable country with a centralized government. Absent these conditions, countries can pursue alternative types of industrial policies. Contexts with stable, or predictable, mis- governance and a government committed to nonintervention can yield strong export performance. We test this hypothesis in Bangladesh by examining the creation of industrial policy in the Ready Made Garment (RMG) sector. This paper highlights how the particular “political settlement” in Bangladesh has created a viable environment in which the RMG sector continues to grow. Ahmed, F.Z., Greenleaf, A., Sacks, A. The Paradox of Export Growth in Areas of Weak Governance: The Case of the Ready Made Garment Sector in Bangladesh – World Development, 2014, Vol. 56, pp. 258–271 DOI: 10.1016/j.worlddev.2013.11.001 Using firm-level data from five developing countries—Brazil, Ecuador, South Africa, Tanzania, and Bangladesh—and three industries—food processing, textiles, and the garments and leather products—this article examines the importance of various sources of knowledge for explaining productivity and formally tests whether sector- or country-specific characteristics dominate these relationships. Knowledge sources driving productivity appear mainly sector specific. Also differences in the level of development affect the effectiveness of knowledge sources. In the food processing sector, firms with higher educated managers are more productive, and in least-developed countries, additionally those with technology licenses and imported machinery and equipment. In the capital-intensive textiles sector, productivity is higher in firms that conduct R&D. In the garments and leather products sector, higher education of the managers, licensing, and R&D raise productivity. Goedhuys, M., Janz, N., Mohneny, P. Knowledge-based productivity in “low-tech” industries: evidence from firms in developing countries – Industrial and Corporate Change, 2013, Vol. 23, No. 1, pp. 1-23 DOI:10.1093/icc/dtt006 Ready-made garment (RMG) in Bangladesh faces challenges to ensure workplace safety for the millions of garment workers in compliance with the national and international labour standards and labour rights. The recent deadly Rana Plaza collapse resulted in three important plans of actions to address the challenges in the sector. This paper presents an assessment of the potential and challenges of RMG industry in Bangladesh. It presents a detail review of the initiatives taken after Rana Plaza accident along with progress made in terms of overcoming the challenges. It also presents a detail review of the actions the structural assessments of buildings housing RMG factories in Bangladesh including its progress, implementation mechanism, and outcomes. The study reveals that RMG is one of the most important export oriented business sector in Bangladesh, which has progressed a lot since the Rana Plaza collapse in terms of achieving workplace safety compliance under three plans of actions, among which achievement in initiatives regarding structural assessment of RMG factory buildings is significant. Still nearly 1000 factories remain to be assessed. Moreover, assessment of buildings is not an end in itself, based on the recommendations of the assessment, the weak factory buildings need to be made resilient by addressing the structural issues. Ansary, M.A, Barua, U. Workplace safety compliance of RMG industryin Bangladesh: Structural assessment of RMG factory buildings – International Journal of Disaster Risk Reduction, 2015, Vol. 14, pp. 424-437 DOI: 10.1016/j.ijdrr.2015.09.008 This article contributes to the debate on the key factors shaping global value chains in the garment sector by focusing on one aspect: namely trade regimes and their related ‘rules of origin’. We study Bangladesh, the leading least developed global garment manufacturer, to assess how changes in the European Union’s regime for preferential market access affect the trade profile, and upgrading prospects, of Bangladesh’s garment industry. We find that shifting trade preferences play a key role in determining structural transformations within the industry. This calls for more careful consideration of trade regimes within GVC analysis. Curran, L., Nadvi, K. Shifting trade preferences and value chain impacts in the Bangladesh textiles and garment industry – Cambridge Journal of Regions, Economy and Society, 2015, Vol. 8, pp. 459-474 DOI: 10.1093/cjres/rsv019 In this research the thermal performance of ready-made garments (RMG) factory building’s envelope has been measured on the basis of internationally established indoor thermal comfort range for the workers. A three-dimensional model has been developed to conduct thermal simulations for typical RMG factory. The simulated factory has been divided into three different zones based on their activities and results have been analyzed by means of statistical distributions. Two types of variables were considered in this study, these were ‘thickness of the exterior wall’ and ‘type of the local construction materials’. Nineteen different exterior wall construction types have been observed through simulations. Prior to the simulations, thermal properties of available local materials were measured in the laboratory. From the analysis, it was found that change of building exterior wall materials and their constructions have significant contributions on the indoor thermal environment of RMG factory building particularly

47
in production spaces. It was also observed that in brick constructions using 2nd class local brick’s potentially results in higher indoor temperature leading to poor thermal condition. However, the thermal performance of 3rdclass local brick constructions has been found relatively better than other types because of porosity and physical properties of the materials used. Chowdhurya, S., Ahmedb, K.S., Hamadaa, Y. Thermal performance of building envelope of ready-made garments (RMG) factories in Dhaka, Bangladesh – Energy and Buildings, 2015, Vol. 107, pp. 144-154 DOI: 10.1016/j.enbuild.2015.08.014 This article contributes to the debate on the key factors shaping global value chains in the garment sector by focusing on one aspect: namely trade regimes and their related ‘rules of origin’. We study Bangladesh, the leading least developed global garment manufacturer, to assess how changes in the European Union’s regime for preferential market access affect the trade profile, and upgrading prospects, of Bangladesh’s garment industry. We find that shifting trade preferences play a key role in determining structural transformations within the industry. This calls for more careful consideration of trade regimes within GVC analysis. Curran, L., Nadvi, K. Shifting trade preferences and value chain impacts in the Bangladesh textiles and garment industry – Cambridge Journal of Regions, Economy and Society, 2015, Vol. 8, pp. 459-474 DOI: 10.1093/cjres/rsv019 Although Bangladesh’s livestock population provides a significant resource of raw material for value addition, the export performance of the leather processing sector is poor. Internally sourced raw hides and skins (RHS) dominate the procurement structure, but are subject to cultural-religious traditions. This study seeks to investigate the extent that the three-day Festival of Sacrifice (Eid-ul-Azha), on which every year Muslims sacrifice millions of animals to Allah and which accounts for more than 40% of the annual RHS production constrains the industry’s competitiveness. Based on the global value chain approach, our findings are drawn from qualitative data. We show that Eid-ul-Azha leads to a temporary oversupply of RHS, which results in serious challenges in the organization of the value chain. Our results point to the special role of systemic trust ensured by religious requirements for sacrificial animals and thus RHS, which enables middlemen to enter the supply chain temporarily. Despite their flexible and voluminous small-scale collection, temporary middlemen lack experience and competences to adequately assess quality and price, thus affecting the competitiveness of downstream actors, in particular the tanneries. Our findings complement the concept of global value chains by stressing the impact of culture-specific constraints, temporarily available resources and trust in relations to middlemen on the competitiveness of the export-oriented leather industry. Strasser, J., Dannenberg, P., Kulke, E. Temporary resource availability and quality constraints in the global leather value chain - The impact of the festival of sacrifice on the leather industry in Bangladesh – Applied Geography, 2013, pp. 410-419 DOI: 10.1016/j.apgeog.2013.02.008 Tabel 33. Artiklite lühikokkuvõtted ja viited – töötingimused ja regulatsioonid
Developing countries are attracting a significant portion of global foreign direct investments. Governments of such countries often compete fiercely for attracting multinational corporations (MNCs) in the expectation of the advantages they will bring to their economies, often prioritising economic goals over fundamental human rights. For a long time, economists have analysed the economic impacts of MNCs, while a parallel strand of work in political science, business ethics and international law investigates the repercussions of MNC operations on human rights. Despite the significant relatedness and complementarities, these two bodies of literature have so far poorly interacted. This paper addresses this limitation and systematically analyses and integrates existing micro-level empirical evidence on the economic and human rights impacts of MNCs on developing countries. It provides a critical analysis of what is known and highlights what we do not know about the factors that mediate the positive and/or negative impacts of MNC operations on host developing countries. Based on a critical analysis of the literature, it discusses avenues for future research in this field and sets the grounds for a new interdisciplinary research agenda on this subject. Giuliani, E., Macchi, C. Multinational corporations’ economic and human rights impacts on developing countries: a review and research agenda – Cambridge Journal of Economics, 2014, Vol. 38, pp. 479-517 DOI: 10.1093/cje/bet060 Much of the world’s waste is exported to Bangladesh, where it is salvaged by some of the planet’s poorest people. Recycling and manufacturing of plastic, metal, garment, and leather products dominate a 7 km2 area in Dhaka housing nearly 700,000 people. They are mostly migrants, whose cheap labor has resulted in the proliferation of hundreds of unregulated small scale factories, including 200 tanneries. The $1 billion USD tanning industry exports nearly 80% of the leather products to Europe, China and the US. Each day 75 MT of solid wastes and 21,600 m3 of liquid wastes are discharged, untreated, into the Buriganga River. Workers and residents suffer daily from exposures to unsafe occupational and environmental conditions.

48
von Braun, M. The Value of Waste: Prognosis for occupational and environmental disease (Lessons from Bangladesh) – 8th European Public Health Conference: Parallel Sessions, pp. 7. Tabel 34. Artiklite lühikokkuvõtted ja viited – vägivald ja lapstööjõud
Waste dumping is one of the major causes of environment pollution in Bangladesh. This study was designed to assess the impact on health of children working in one of the garbage dumping sites in Dhaka. Blood samples were collected from exposed (n¼20, aged: 8–15 years, exposed to dumped garbage from 6 months to 6 years) and control subjects (n¼15, age matched and never worked in the garbage dumping site). Oxidative stress markers like lipid hydroperoxides, thiobarbituric acid reactive substances and protein carbonyl content were measured. Alkaline comet assay was performed to assess the possible damage in DNA. To check the consequences of possible toxic exposure, we performed liver function tests of the study subjects. Oxidative stress-mediated damage of macromolecules was found to be significantly increased in the exposed children. Liver function tests were found normal. Thus, the children working in garbage dumping site are in severe health risk. Lahiry, G., Rahman, T., Mahbub Hasan, A.K.M, Dutta, A.K, et al. Assessment of Impact on Health of Children Working in the Garbage Dumping Site in Dhaka, Bangladesh – Journal of Tropical Pediatrics, 2011, Vol. 57, No. 6, pp. 472-475 DOI: 10.1093/tropej/fmr002 This qualitative research involved five (5) victims by in-depth interviews, observation, and study of documentations. The study findings, all of the victims were promised to work as maids, but they were then forced to work as a house cleaner. In this case, the victims’ current employment does not reflect their work permit when working as a cleaner by the employment agency. Here, victims were being exploited commercially for the benefit of the employment agency. There were also issues of exploitations when the victims have to work longer hours. There were times when the victims did not get paid at all. Syamsuddin, Azlinda Azman. “Door to door cleaner”: A new variant of human trafficking in domestic sector – Procedia-Social and Behavioral Sciences, 2015, Vol. 172, pp. 405-410 While there are many positive societal implications of increased female labor force participation, working may increase a woman’s risk of domestic violence. Using data I collected from Bangladesh, I document a positive correlation between work and domestic violence, but only among women with low education or young age at marriage. These results suggest that women with low bargaining power face increased risk of domestic violence upon entering the labor force as their husbands seek to counteract their increased bargaining power. Consequently, policies that increase women’s baseline bargaining power will decrease the risk that they face domestic violence upon beginning work. Heath, R. Women’s Access to Labor Market Opportunities, Control of Household Resources, and Domestic Violence: Evidence from Bangladesh – World Development, 2014, Vol. 57, pp. 32-46 DOI: 10.1016/j.worlddev.2013.10.028
3.4 India India kohta informatsiooni otsimisel kasutasime samuti riigi ja meie poolt vaadeldavate probleemide otsingukombinatsioone ja sinna juurde ka 2. peatükis välja toodud enim imporditavate toodete märksõnu.
Erinevalt Hiinast ilmnes India kohta tehtud otsingutes palju artikleid lapstööjõu kasutamise probleemist ja naiste vastasest vägivallast. Viimase kohta ei tulnud artikleid Hiina kohta praktiliselt üldse. India kohta leitud artiklid süstematiseerisime järgnevalt:
1) Artiklid, mis annavad ülevaatliku pilgu India majandusest ja sealsetest probleemidest. Lisaks on selles tabelis toodud ka tööohutuse alaste õigusnormide loomise ja tööõnnetuste kohta.
2) Artiklid, mis kajastavad lapstööjõuga seonduvaid probleeme. India puhul tegime sellest eraldi punkti, kuna neid artikleid on väga palju.
3) Artiklid, mis uurivad vägivalda naiste vastu, ahistamist ja ärakasutamist. 4) Artiklid, mis kajastavad probleeme tekstiili- ja rõivatööstusest. Selle puhul on konkreetsemalt
võimalik luua sidemeid Eesti impordistatistika ja vastava riigi probleemide kohta. 5) Artiklid majandustegevuse tõttu tekkinud keskkonnaprobleemidest.

49
Tabel 35. Artiklite lühikokkuvõtted ja viited – Ülevaatlikud probleemid
The paper presents an empirical investigation into alternative forms of organization of rural industries and their dynamics in the post-reform period of India by means of a field survey carried out in the state of West Bengal in 2001–02. The selected industries (handloom, brassware, hornware, clay works, conchshell and lac works) all belong to traditional crafts. The major organisational forms are ‘independent units’ and ‘tied units’, the latter being tied to traders and/or master enterprises for raw materials and work-orders, each of which account for more than 40% of our sample units. The third form, ‘cooperative units’, is clearly in the decline. Tied units appear to define the upcoming trend bringing the forces released by ‘liberalisation’, e.g., the growth of exports, drawn to the level of village-artisans. In particular, the system appears to be a vehicle for product-differentiation and innovation, both of which are very much evident in our study area. Maiti, D. The organisational morphology of rural industries and its dynamics in liberalized India: a study of West Bengal – Cambridge Journal of Economics, 2008, Vol. 32, pp. 577-591 DOI: 10.1093/cje/bem057 This study examines whether the joint adoption of organic and fair trade systems adds additional benefits to smallholders in developing countries. We use panel data collected from 300 smallholder rural black pepper growers in Kerala, India to assess household welfare impacts. We apply a multinomial endogenous switching regression model along with a counterfactual analysis to estimate certification effects. Results show that both certification systems have a significant impact on income compared to conventional black pepper farming. However, membership in fair trade marketing systems does not increase income of organic farmers, but has positive effects on asset accumulation of smallholder farmers. Parvathi, P., Waibel, H. Organic Agriculture and Fair Trade: A Happy Marriage? A Case Study of Certified Smallholder Black Pepper Farmers in India – World Development, 2016, Vol. 77, pp. 206-220 DOI: 10.1016/j.worlddev.2015.08.027 This paper probes the role of labour efficiency in promoting energy efficiency and economic performance with reference to small scale brick enterprises cluster in Malur, Karnataka State, India. In the bricks industry, the technology in use being similar, labour efficiency has a negative influence on energy cost. Therefore, those enterprises that exhibited higher labour productivities had lower average energy intensity and higher returns to scale as compared to those that had lower labour productivities. Considering this, improvement of labour efficiency can be an alternative approach for energy efficiency improvement in energy intensive small scale industries in developing countries like India, which face the obstacle of financial constraints in up-grading technology as a means of energy efficiency improvement. Bala Subrahmanya, M.H. Labour productivity, energy intensity and economic performance in small enterprises: A study of brick enterprises cluster in India – Energy Conversion and Management, 2006, Vol. 47, pp. 763–777 DOI: 10.1016/j.enconman.2005.05.021 The debate over labour market regulations in India is highly polarised. Advocates of labour market deregulation suggest that the labour law framework in the country confers disproportionate powers on workers and trade unions in the formal sector of the economy, resulting in industrial conflicts and poor productivity. Using workplace union survey data from the state of Maharashtra, this paper examines the veracity of these claims. Maharashtra is recognised as a state with a broadly pro-worker labour law framework. We find that even pro-worker labour laws at best offer only weak protection to workers and unions in the formal sector establishments. Unions find themselves increasingly vulnerable to employer hostility. We discuss these findings in the context of the role of state and judiciary in employment relations and of union links with political parties. Badigannavar, V., Kelly, J. Do Labour Laws Protect Labour in India? Union Experiences of Workplace Employment Regulations in Maharashtra, India – Industrial Law Journal, 2012, Vol. 41, No. 4, pp. 439-470 DOI: 10.1093/indlaw/dws038 Due to rapid industrialization, with high population density and constraints of land, it is expected that level of risks arising from the hazardous industries will increase in India in the coming decades. However, 30 years after the Bhopal accident (1984), except a few discrete regulations, there is as yet no integrated system for assessing and managing risks arising out of these hazardous industries in India. The gravity of aspects related to the management of industrial risk still remains crucially important. In particular, there is no standard guideline on risk analysis methodology, acceptability or tolerability criteria, nor is there an accident database or a risk reduction strategy for the areas where risk levels are already high. On top of this, there are technical and legislative gaps in the institutional framework to implement any of the above mentioned issues. With the backdrop of the Bhopal gas tragedy, the objective of this paper is therefore to evaluate the effectiveness of a comprehensive risk assessment framework for the emerging economy of India, in order to control and/or to reduce the risk level that exists. In this context, regulations and policies pertaining to industrial risk assessment were reviewed. Sengupta, A., Bandyopadhyay, D., van Westen, C.J., van der Veen, A. An evaluation of risk assessment framework for industrial accidents in India – Journal of Loss Prevention in the Process Industries, 2015, pp. 1-8

50
DOI: 10.1016/j.jlp.2015.12.012
Tabel 36. Artiklite lühikokkuvõtted ja viited - lapstööjõud
In this paper, using the 2005–2006 National Family Health Survey dataset from India, we study the likelihood of a school-age child working, combining work with schooling or being idle, rather than attending school full time. Our analysis finds that with the inclusion of household chores in the child labour definition, boys are significantly more likely than girls to be full-time students and significantly less likely to be working, being idle or combining school and work. There are also significant regional differences, with children from the north-eastern states significantly more likely to be in the idle category rather than in school. The likelihood of being in the idle category is also significantly higher for older children, children with pre-school age siblings, urban children, Muslims and children from Scheduled Tribes. Finally, parental education, household wealth and land ownership are significantly and negatively correlated with the likelihood that the child is working, but land ownership does increase the risk of a child combining work and schooling. Rammohan, A. The trade-off between child labour and schooling in India – Education Economics, 2014, Vol. 22, No. 5, pp. 484-510, DOI: 10.1080/09645292.2011.641271 The constitution of India, as a part of the fundamental lights, has laid down that the State shall direct its policy towards protection of childhood and youth against exploitation and shall not be employed to work in any factory or mine or engaged in any hazardous employment. India has the largest number of urban and rural child workers in the world. The Government of India acknowledges at least 17.5 million working children.2 Footwear industry is also one of the major export oriented industry employing a large number of children. The Footwear Industry is a significant segment of the Leather Industry in India. India ranks second among the footwear producing countries next to China. The industry is labour intensive and is concentrated in the small and cottage industry sectors. While leather shoes and uppers are concentrated in large-scale units, the sandals and Chappals are produced in the household and cottage sector. The major production centers India are Chennai, Ranipet, Ambur in Tamil Nadu, Mumbai in Maharashtra, Kanpur and Agra in Uttar Pradesh, Jalandhar in Punjab and Delhi. The processes in the footwear making include last making, pattern cutting, clicking, Sewing, Assembling and Finishing. Children between 10 and 15 years old are mainly employed in assembling shoes. Some 80 percent of the children work for contractors at home. Children work on soling (fixing upper portions of shoes to leather or rubber soles) with glue. Children in cramped poorly lit rooms suffer from continuous skin contact with industrial adhesives and breathing vapors from glues. The children working in the footwear industry are exposed to physical factors like poor illumination, noise and poor ventilation, and chemicals like leather dust, benzene that is used as a solvent in glues and p-tert butyl phenols, which is used in neoprene adhesives. Thus most children suffer from respiratory problems, lung diseases and skin infections through constant exposure to glue and fumes. They are also exposed to risk of nasal cancer, neurotoxicity and adverse physical factors. It is recommended to stop child labour and let the child be bread eater rather than bread earner. Tiwari, R.R. Child labour in footwear industry: Possible occupational health hazards – Indian Journal of Occupational and Environmental Medicine, 2005, Vol. 9, No. 1, pp 7-9 Despite recent multilateral efforts to single out child labor in debt bondage as one of the worst forms of child labor, several important questions have yet to be addressed: How pervasive is the phenomenon? Are there systematic correlations between the incidence of children in debt bondage and the economic, legislative, and financial development indicators of the economy? How does an understanding of these correlates affect the way national and international policy measures aimed at targeting this form of child labor are perceived? This article addresses each of these questions. The empirical findings suggest strong correlation between the likelihood of the incidence of child labor in debt bondage with the stage of development of an economy, the stage of financial development, and enforcement of core labor rights. Building on this evidence, the article presents a theoretical model that highlights the drawbacks and merits of a number of policies aimed at putting checks on child labor in debt bondage. Basu, A.K., Chau, N.H. Targeting Child Labor in Debt Bondage: Evidence, Theory, and Policy Implications – World Bank Economic Review, 2003, Vol. 17, No. 2, pp. 255-281. DOI: 10.1093/wber/lhg020 In this paper we analyse the determinants of child work and schooling in rural India within a bivariate probit framework. Our sample consists of 93,825 children (6–15-year-olds) from the 50th Round of the National Sample Survey (NSS) in India. Our primary focus is whether an increase in the wages earned by fathers and mothers in our sample would help decrease the work done by children. Two results stand out from our analysis. First, we can confirm the luxury axiom in India: an increase in mothers’ and fathers’ wages does decrease child work. The effect is neither continuous nor monotonic in the case of mothers’ wages, however. In fact, we find that mothers’ work actually increases the probability of child (especially girls’) work, and this effect is mitigated by an increase in mothers’ wages only when the latter increases quite significantly. Second, mothers’ and fathers’ education are very

51
significant in decreasing the probability of children working. Finally, the supply of schooling is a significant determinant of the probability both of work and of schooling (though the specific variables that are significant vary for boys and girls). Kambhampati, U.S., Rajan, R. Does Child Work Decrease with Parental Income? The Luxury Axiom Revisited in India – The European Journal of Development Research, 2005, Vol.17, No.4, pp.649-680 DOI: 10.1080/09578810500367664 Background: There are millions of working children worldwide. Several causes are suggested for this social evil of which poverty plays a significant role in whether a child will work. Objective: To determine the morbidity profile in the working children of gem polishing units of Jaipur, India and assess some of its associated socio-economic factors. Methods: The present cross-sectional study included 586 gem polishing working children. Using interview, the demographic characteristics, occupational and clinical history of participants were recorded. The reason for taking up the job, income from the job and their desire to attend the school were also asked to assess the social causes of child labor in this region. Results: The mean±SD age of the working children was 11.3±5.3 years. In most of the instances, parents compelled the child to take up the job. Supposed to increase the family income substantially, the child labor activity failed to do so. On the other hand, the children suffered from several occupational health problems like eyestrain, headache, gastrointestinal complaints (eg, abdominal pain, nausea, vomiting, and diarrhea), musculoskeletal symptoms (eg, back pain, pain in limbs, neck pain, and joint pains) and skin diseases (eg, scabies, dermatitis). Conclusion: It seems that the social factors forcing the children to work in the studied region, result in deterioration of their health and affect their growth. Tiwari, R.R., Saha, A. Morbidity Profile of Child Labor at Gem Polishing Units of Jaipur, India – International Journal of Occupational & Environmental Medicine, 2014, Vol 5, No. 3, pp. 125-129 Child labour is a concrete manifestation of violations of a range of rights of children and is recognized as a serious and enormously complex social problem in India. Notwithstanding the increase in the enrolment of children in elementary schools and increase in literacy rates since1980s, child labour continues to be a significant phenomenon in Bihar. Irrespective of what is shown in the official statistics, we say that the phenomenon of child labour is significant because, the Child Labour (Prohibition and Regulation) Act, 1986 is a legislation to address hazardous industrial child labour in a limited way as the purview of the Act covers only the organized sectors of production. As it is inbuilt in the law, this Act has excluded a vast section of toiling children in the unorganized sectors, as over 90 percent of the labour force in Bihar is accounted for by the unorganised sectors of production. Prof. Shrivastava, S., Kumar, R. The Hidden Factory: Child Labour in Bihar (India) – International Journal of Multidisciplinary Approach and Studies, 2015, Vol. 2, No.2, pp. 186-191 ISSN NO: 2348 – 537X We explored the causes and circumstances of violent behaviour among a group of child labourers in the Indian unorganized sectors. From 14 categories of occupations, a total of 1,400 child labourers were interviewed in both urban and rural areas. The average family size of these mostly illiterate child labourers is seven, and average family income is 3,200 INR per month. In the short term child labourers become violent, aggressive, and criminal, following a pyramid of violent behaviour, including socio-economic pressure, cultural deviance, and psychological pressure. When considering family history it seems that the problem is part of a vicious cycle of violence, which persists through generations and evolves with financial crisis, early marriage, and violence in the family and workplace. Our study demonstrates that the most vulnerable groups of child labourers belong to the following workplaces: dhabas, food stalls, rail/bus stations, rail-floor cleaning, and rag picking. Giving high priority to capacity building within the community, including support for locally-generated solutions, is warranted. Dalal, K., Rahman, F., Jansson, B. The origin of violent behaviour among child labourers in India – Global Public Health, 2008, Vol. 3, No. 1, pp. 77-92 DOI: 10.1080/17441690701238114 Tabel 37. Artiklite lühikokkuvõtted ja viited – vägivald
The practice of dowry is widespread in India and refers to the payment of cash/gifts by the bride’s family to the bridegroom’s family before marriage. Though prohibited by law, dowry is widely practised, and often contributes to severe injuries and even death of young brides. This study examined the prevalence and risk factors for dowry demand and dowry harassment and its psychosocial correlates across different social strata in India, and also by husband and mother-in-law characteristics. In a cross-sectional survey of 9938 women in rural, urban and urban non-slum sites across India conducted in 1998–99, dowry demand was found to be significantly higher ( p < 0.001) in the urban non-slum and rural areas (26% and 23% respectively) than in urban slum areas (18%). Overall, 17% of groom’s families were not satisfied with the dowry, this being higher in rural areas (21%) than in urban slum and non-slum areas (about 14% in both). The overall prevalence of dowry harassment among this group of women was

52
13.3%. Mothers-in-law who had themselves experienced dowry demand were 14 (95% CI 5.0–40.4) and 5 (95% CI 1.3– 18.9) times more likely to demand and harass daughters-in-law over dowry, respectively. Another significant risk factor for dowry-related harassment was mother-in law’s status in the family. Interventions related to modifiable risk factors, such as increased social support at the community level, should help reduce dowry harassment. Jeyaseelan, V., Kumar, S., Jeyaseelan, L., Shankar, V., Yadav, B.K., Bangdiwala, S.I. Dowry Demand And Harassment: Prevalence And Risk Factors In India – Journal of Biosocial Science, 2015, Vol.47, No. 6, pp 727-745 DOI: 10.1017/S0021932014000571 Although substantial research has explored the causes of India’s excessively masculine population sex ratio, few studies have examined the consequences of this surplus of males. We merge individual-level data from the 2004–2005 India Human Development Survey with data from the 2001 India population census to examine the association between the district-level male-to-female sex ratio at ages 15 to 39 and selfreports of victimization by theft, breaking and entering, and assault. Multilevel logistic regression analyses reveal positive and statistically significant albeit substantively modest effects of the district-level sex ratio on all three victimization risks. We also find that higher male-to-female sex ratios are associated with the perception that young unmarried women in the local community are frequently harassed. Household-level indicators of family structure, socioeconomic status, and caste, as well as areal indicators of women’s empowerment and collective efficacy, also emerge as significant predictors of self-reported criminal victimization and the perceived harassment of young women. The implications of these findings for India’s growing sex ratio imbalance are discussed. South, S.J., Trent, K., Bose, S. Skewed Sex Ratios and Criminal Victimization in India – Demography, 2014, Vol. 51, pp. 1019-1040 DOI: 10.1007/s13524-014-0289-6 There is a silent complicity in child marriage in India and many rural and backward communities treat it as normal. The Government has recently amended the law to prohibit such marriage. Even though the legal framework is not bereft of problems, field data do not suggest any reduction in the incidence of child marriage. For socioeconomic reasons, the practice continues unabated. This article, based on field experiences in the Malda district of West Bengal, tries to analyse the factors leading to the continuation of the practice in order to explore social policy to prevent this social evil. Ghosh, B. Child Marriage, Society And The Law: A Study In A Rural Context In West Bengal, India – International Journal of Law, Policy and the Family, 2011, Vol. 25, No. 2, pp. 199-219 DOI:10.1093/lawfam/ebr002 Objective(s): To document the prevalence of physical, emotional and sexual abuse during childhood among college students. Method(s): The study was conducted among college students of Puducherry, South India. Stratified random sampling was done to select colleges. Data were gathered using the adapted ‘Ministry of Women and Child Development Questionnaire on Child Abuse for Young adults’. Results: A total of 936 college students completed the questionnaire. Mean6SD age of the participants was 19.261.1 years. Half (48%) of the participants reported being mocked because of their physical appearance. In all, 56% (524/936) of the participants reported that they were beaten during their childhood, of which 13.4% (70/524) required medical treatment. Around 10% reported someone exposing his/her private parts to them, while in 6.4% of the cases, the perpetrator forced the study participants to expose their private parts. Conclusion(s): Emotional, physical and sexual abuse is common in childhood and demands prompt interventions at the familial, community and political levels. Bhilwar, M., Upadhyay, R.P., Rajavel, S., Singh, S.K., Vasudevan, K., Chinnakali, P. Childhood Experiences of Physical, Emotional and Sexual Abuse among College Students in South India – Journal of Tropical Pediatrics, 2015, Vol. 61, pp. 329-338 DOI: 10.1093/tropej/fmv037 Background. Female sex workers (FSWs) are vulnerable to physical and sexual violence at work. This article examines the prevalence of recent physical and sexual violence victimization and associations of type of sex work among a large sample of young FSWs. Method. We used data from a cross-sectional survey on sex trafficking and sex work in southern India that included 1138 FSWs aged 18–25 years residing in 3 districts of Andhra Pradesh state. The independent variable was organization of sex work. FSWs on contract at sex work establishments outside their home district were classified as contract workers, as compared with women who worked autonomously within their home district. Using logistic regression models adjusted for sociodemographic factors, we assessed the relation between contract/ non-contract sex work and various forms of violence experienced by FSWs. Results. Results indicate a high prevalence of work-related physical and sexual violence; 50% FSWs reported physical violence, and 77% reported sexual violence. FSWs performing contract work were at increased risk of physical and sexual violence at work, compared with women engaged in sex work in their home districts. Conclusions. The findings that contract work outside the home district increases the vulnerabilities faced by FSWs in

53
India suggest that violence and disease prevention services aimed at FSWs would be more effective if organization of sex workdas contract or noncontractdis taken into account. George, A., Sabarwal, S., Martin, P. Violence in Contract Work Among Female Sex Workers in Andhra Pradesh, India – The Journal of Infectious Diseases, 2011, Vol. 204, 1235–1240 DOI: 10.1093/infdis/jir542 Tabel 38. Artiklite lühikokkuvõtted ja viited – tekstiil ja rõivatööstus
There is a growing body of literature about the impacts of Bacillus thuringiensis (Bt) cotton in developing countries. While many studies show remarkable benefits for farmers, there are also reports that question these results. Most previous studies consider impacts in deterministic terms, neglecting existing variability. Here we explain the main factors influencing the agronomic and economic outcomes. Apart from differences in pest pressure and patterns of pesticide use, germplasm effects can play an important role. Theoretical arguments are supported by empirical evidence from India. Better understanding of impact variability can help explain some of the paradoxes in the recent controversy over genetically modified crops. Qaim, M., Subramanian, A., Naik, G., Zilberman, D. Adoption of Bt Cotton and Impact Variability: Insights from India – Review of Agricultural Economics, 2006, Vol. 28, No. 1, pp. 48-58 DOI:10.1111/j.1467-9353.2006.00272.x Introduction: Textile sector in India plays an important role in the country's economy, providing employment to a significant population in rural and urban areas. Objectives: This paper focuses on health and safety aspects of textile workers in Solapur City (one of the key textile cluster) in the state of Maharashtra, India. Methodology: A sample of 180 workers from the identified textile industries of Solapur city were assessed for their general physique, muscle tone, lung condition, and eyesight using different techniques. The study aimed at developing a framework for understanding risks to textile workers resulting from lack of health and safety standards in companies. Results: Findings showed that most of the workers have been affected by respiratory problems, increase in muscle tone, eye problems and musculoskeletal problem. It has been also observed that job security or regular work impacts positively to the worker’s long term body health. However, there is an immediate need to adopt and implement measures in accordance with Indian Factories Act (OHSAS 18001/ILO-OSH 2001) which includes directions and procedures in respect of industrial installations, work environment and occupational health and safety guidelines. Hiremath, R., Kattumuri, R., Kumar, B., Hiremath, G. Health and safety aspects of textile workers from Solapur (India) textile industries – Indian Journal Of Community Health, 2014, Vol. 26, No. 4, pp. 365 – 371. Fresh water is a precious natural resource that has been currently facing a severe stress because of its growing consumption by the industrialised civilisation. The global scarcity of fresh water has warranted an increasing demand for the treatment, recycling and reusing of wastewater for industrial purposes. This paper investigates the use of high energy gamma radiation to degrade and decontaminate combined textile wastewater and its potential application in textile wet processing and reuse for irrigation purposes. The treatment was carried out using a Cobalt-60 gamma radiation source at 10 kGy irradiation dose with a dose rate of 13 kGy/h. The change in pH, decolouration percentage, reduction of total suspended solids, total dissolved solids, biological oxygen demand and chemical oxygen demand, variation of electrical conductivity and heavy metal content of irradiated wastewater were extensively investigated. Then the treated wastewater was recycled for cotton fabric processing and reused in the irrigation of Malabar spinach plant. The detailed experimental results demonstrated that the irradiated wastewater can be satisfactorily used as an alternative to fresh water for scouring-bleaching and dyeing of cotton fabric. The risk to human health of fabric dyed with irradiated wastewater was also investigated. Carcinogenetic risk analysed by Gas chromatographyemass spectrometry showed the presence of banned amine in dyed fabric under the detection limit of 10 ppm and the absence of formaldehyde, signifying the non-toxicity of the fabric for human health. In case of a potential use in irrigation, treated wastewater was applied to Malabar spinach plant and compared with a controlled planting using the underground fresh water for irrigation. The plant irrigated with irradiated wastewater exhibited a better growth in terms of leaf count, root length and plant growth. It was further revealed that degradation of the textile dyes by gamma radiation led to an increase in nitrogen content in the irradiated wastewater that itself acted as a biofertiliser providing additional nutrient for a better growth of the aforementioned plant. So it can be concluded that gamma irradiation is a promising tool for the degradation and decontamination of textile wastewater for its safe recycling in textile wet processing and reuse as irrigation water having fertilising properties. Furthermore, the effectual reusing and recycling of irradiated wastewater demonstrated in this research work bear its scientific credibility in application field where consumption of million litres of fresh water per day and concurrently discharging same amount of effluent could be reduced considerably in a single textile dyeing industry. Rahman Bhuiyan, M.A., Mizanur Rahman, M., Shaid A., Bashar, M.M., Khan, M.A. Scope of reusing and recycling the textile wastewater after treatment with gamma radiation – Journal of Cleaner Production, 2016, Vol. 112, pp. 3063-3071

54
DOI: 10.1016/j.jclepro.2015.10.029 Does the labeling of tradable products like carpets which have been produced without child labor increase the welfare of children and their families? This paper presents results of surveys conducted in India and Nepal. The findings suggest a positive link between social labeling and the removal of child laborers for households above the subsistence level. However, for households below the subsistence level, no significant influence has been found. CHAKRABARTY, S., GROTE, U. Child Labor in Carpet Weaving: Impact of Social Labeling in India and Nepal – World Development, 2009, Vol. 37, No. 10, pp. 1683-1693 DOI: 10.1016/j.worlddev.2009.03.013 The working environment in carpet industry was assessed for fungal contamination in Gwalior (India). The sampling was carried out in five carpet units that were selected randomly. The Petri plates containing potato dextrose agar (PDA) medium was exposed for a period of 15 min near the workplace (exposed) and outside environment (control). They were covered again with aluminium foil before transporting them to the laboratory for further analysis. It was found that various types of fungal species viz., Aspergillus niger, A. parasitics, Fusarium sp., Alternaria sp., Penicillium sp., Trichoderma sp., Curvularia sp., Cladosporium sp., and yeast were present at the work place, which may cause various types of diseases among the weavers. Therefore, we recommended good housekeeping and workplace design, which is necessary for control of fungal contamination at the work place, that may not only reduce the disease among workers but may also increase productivity and efficiency of the workers. Wani, K. A., Mamta, K., Khan, T. A., Lone, R. Fungal contamination of carpet industry in Gwalior Madhya Pradesh (India) – Indoor and Built Environment, 2014, Vol. 23, No.5, pp. 724-729 DOI: 10.1177/1420326X13480374 Tabel 39. Artiklite lühikokkuvõtted ja viited – keskkonnaprobleemid
Electronic waste or e-waste is one of the global rising problems in developing countries like India and developed countries. E-waste comprises material that is valuable as well as toxic and has shoddier health and environment impact. This review paper presents an overview of global e-waste stats, health con- cerns of e-waste components along with the waste management, recycling, legislative polices and recommendations related to e-waste. Existing and future initiatives of e-waste management have been addressed by explaining the developed countries initiatives towards e-waste management. The key to success in terms of e-waste management such as Extended Producer Responsibility (EPR) and Producer Responsibility Organization (PRO) initiatives have been presented in a lucid manner. E-waste arena is a platform for business initiative for energy production (hydrogen and electricity) and precise metal recovery (gold, silver and platinum) through biotechnological approaches. Garlapati, V.K. E-waste in India and developed countries: Management, recycling, business and biotechnological initiatives – Renewable and Sustainable Energy Reviews, 2016, Vol. 54, pp. 874-881 DOI: 10.1016/j.rser.2015.10.106 The present work was aimed at the establishment of baseline radioactive data in the proposed Lambapur and Peddagattu uranium mining areas in the Andhra Pradesh state, India. The background concentrations of naturally occurring radioactivity in the near-surface soils of the study areas were estimated and the results were analysed. The 238U concentration in the nearsurface soil of the study area was found to vary from 100 to 176 Bq kg21, with a mean of 138+24 Bq kg21. 232Th in the study area soils was found to vary between 64 and 116 Bq kg21, with a mean of 83+15 Bq kg21. The 40K concentration was found to vary between 309 and 373 Bq kg21, with a mean of 343+20 Bq kg21. The mean natural background radiation levels were also measured with thermoluminescence (TL) dosimetry technique and with a mR-survey meter, in the villages of the study area. Dose rates measured by TL are found to vary from 1287 to 3363 mGy y21, with a mean of 2509 + 424 mGy y21. The dose rates measured in the same villages with a mR-survey meter were found to be in the range of 1211–3255 mGy y21, with a mean of 2524 + 395 mGy y21. The mean radiation levels in the study area are found to be relatively high when compared with (Indian) national and international averages. Correlations among radon, thoron and gamma dose rates were found to be poor. The pre-operational data produced in this work will be useful for comparison with future radiation levels during the proposed uranium mining operations. Vinay Kumar Reddy, K., Gopal Reddy, C., Vidya Sagar, D., Yadagiri Reddy, P., Rama Reddy, K. Environmental Radioactivity Studies In The Proposed Lambapur and Peddagattu Uranium Mining Areas Of Andhra Pradesh, India – Radiation Protection Dosimetry, 2012, Vol. 151, No. 2, pp. 290-298 DOI: 10.1093/rpd/ncs005 Water, the environment, and food production are closely interrelated at the local, regional and global levels. With rapidly increasing water demands, the competition among household, industrial, environmental, and agricultural water uses has been escalating in many regions. Although the achievements of irrigation in ensuring food security and improving rural welfare have been impressive, past experiences also indicate problems and failures of irrigated agriculture, often related to environmental issues including groundwater overdraft, water quality reduction, waterlogging, and salinization. Hydrological records over a long period have shown a marked reduction in the

55
annual discharge on some of the world’s major rivers (OECD), due in significant part to growth in agricultural water consumption. Rosegrant, M.W., Cai, X. Water Constraints And Environmental Impacts Of Agricultural Growth – American Agricultural Economics Association, 2002, Vol. 84, No. 3, pp. 832-838
3.5 Pakistan Pakistani kohta informatsiooni otsimisel kasutasime riigi ja meie poolt vaadeldavate probleemide otsingukombinatsioone ja sinna juurde 2. peatükis välja toodud enim imporditavate toodete märksõnu.
Pakistani kohta leidus enim artikleid seoses nende suure ekspordivaldkonnaga, milleks on puuvill. Antud valdkonda uurisime lähemalt ka seetõttu, et Eesti impordistatistika osas on seosed Pakistaniga selles vallas olemas. Artiklid jagasime Pakistani puhul nelja kategooriasse:
1) Artiklid, mis kajastavad probleeme seoses töötervisega 2) Artiklid, mis on uurinud vägivalla ja lapstööjõu probleeme 3) Artiklid majandustegevuse tõttu ilmnenud keskkonnaprobleemidest Pakistanis. 4) Artiklid nende ühe suurima eksportvaldkonna kohta, milleks on puuvill.
Tabel 40. Artiklite lühikokkuvõtted ja viited – töötervis
Principal objective of this study was to evaluate the health risks of brick kiln workers to dust bound PAHs exposure in Punjab province (Pakistan). To this aim, surface dust samples were collected from brick kiln units located in Chung Khurd (Lahore city),Gujranwala city and Sohra village (in the vicinity of Gujranwala). The highest ΣPAH levels were measured in the dust samples collected in Sohdra village (mean 2578 ng g−1 d.w., range 302–6757 ng g−1 d.w.) followed by Gujranwala city (mean 957, range 16.1–1963 ng g−1 d.w.) and Chung Khurd (mean 882, range 692–1007 ng g−1 d.w.). Source identification using diagnostic ratios and principal component analysis identified coal and wood combustion as the major PAHs sources. The cancer risk model (CR-Model 1) and the Incremental Lifetime Cancer Risk model (ILCR-Model 2) were used to evaluate the cancer risk assessment via ingestion, inhalation and dermal contact pathways. Both models suggested that brick kiln workers (including adults and children) were exposed to high-potential carcinogenic risk via both ingestion and dermal contact pathways during the brick making process. This study also emphasizes the need for pollution control in the brick kiln industry of Pakistan. Kamal, A., Malik, R.M., Martellini, T., Cincinelli, A. Cancer risk evaluation of brick kiln workers exposed to dust bound PAHs in Punjab province (Pakistan) – Science of the Total Environment, 2014, Vol. 493, pp. 562–570 DOI: 10.1016/j.scitotenv.2014.05.140 Mercury (Hg) is considered as a global pollutant because of its presence in every environmental sector. This study was conducted to investigate the negative impacts of Hg on the human beings involved in gold mining along the three rivers (Gilgit, Hunza and Indus) in the northern areas of Pakistan. Biological samples such as blood, urine, hair and nails were obtained from the gold miners including men and women and extracted using standard procedure. The final extracts were analyzed for Hg and its species concentrations using atomic absorption spectrophotometer (Perkin Elmer-700) equipped with mercury hydride system (MHS-15). Total Hg concentrations in the blood, plasma, urine, hair and nails of male workers were 41 μg/L, 30.8 μg/L, 49.5 μg/L 0.64 μg/kg and 0.46 μg/kg, respectively, while in female workers were 44.4 μg/L, 36.8 μg/L, 41.5 μg/L, 1.1 μg/kg and 0.97 μg/kg, respectively. The results indicated that Hg in all (100%) samples exceeded the permissible limit set by US Environmental Protection Agency, (USEPA, 1997) and World Health Organization, (WHO, 2003). Being a highly toxic metal, Hg exposure has caused diseases in the workers such as inhalation problem, belly and neck pain, skin burn, stunted growth in children, teeth, heart, respiratory, kidney, joints and skin problems Riaz, A., Khana, S., Shahc, M.T, Li, G. et al. Mercury contamination in the blood, urine, hair and nails of the gold washers and its human health risk during extraction of placer gold along Gilgit, Hunza and Indus rivers in Gilgit-Baltistan, Pakistan – Environmental Technology & Innovation, 2016, Vol. 5, pp. 22–29 This article examines the circumstances under which corporate social responsibility (CSR) initiatives facilitate and/or constrain labour agency in global production networks (GPNs). Using a case study of Nike’s CSR approach in the football manufacturing industry of Pakistan, we explore the extent to which the measures advocated in a new, emerging policy paradigm on CSR in GPNs enabled labour agency at Nike’s main football supplier factory in Pakistan. We argue that while such CSR policies can create enhanced space for labour agency, that potential agency is also shaped (i) by wider economic forces within the global economy and (ii) relationships with local/national actors and regulatory frameworks. Understanding the intersection of these dimensions becomes vital to interpreting

56
the potential for, and activation of, labour agency within CSR-influenced GPNs. Lund-Thomsen, P., Coe, N.M. Corporate social responsibility and labour agency: the case of Nike in Pakistan – Journal of Economic Geography, 2015, Vol. 15, pp. 275–296 DOI: 10.1093/jeg/lbt041
Tabel 41. Artiklite lühikokkuvõtted ja viited – vägivald ja lapstööjõud
Our study attempts to describe the demographics, characteristics of victims and perpetrators, and circumstances leading to burn events among females in Pakistan. Methods: Human Rights Commission of Pakistan (HRCP) systematically collected data on burns among women using newspaper reports from January 2004 till December 2005. We analyzed the aggregated data and estimated burn rates. Results: A total of 222 burn events were reported from 2004 to 2005; complete data were not available for all variables. Adults (>18 years) constituted 74% (91/123) of cases with 95% (121/127) being married. Most burns were caused by bursting of stoves (34%; 64/189) or victims set-on fire (33%; n ¼ 63/189). Burns using acids accounted for 13% (25/189). Husbands (52%; 51/98) and in-laws (23%; 23/98) were the perpetrators in known burn events. Burns were classified as accidental in half of cases (51%; 97/189) and related to domestic issues in a quarter (25%; 47/189). There were 49% of (92/189) burns that were reported as intentional. The mean annual rate of burns among women (15–64 years of age) was found to be 33 per 100 000. Conclusion: Newspaper reports are good source of surveillance when information is otherwise limited. Majority of burns (51%) were classified as accidental while 49%were reported as intentional, though there is a limitation in the accuracy of reported accidental events. There is a dire need for systematic data collection and devising preventive strategies for this important public health problem that remains largely neglected in Pakistan. Nasrullah, M., Muazzam, S. Newspaper reports: a source of surveillance for burns among women in Pakistan – Journal of Public Health, 2009, Vol. 32, No. 2, pp. 245-249 DOI: 10.1093/pubmed/fdp102 Using data from Peru and Pakistan, this article tests two hypotheses: there is a positive association between hours of child labor and poverty, and there is a negative association between child schooling and poverty. Both of these hypotheses are confirmed by the Pakistani data, but not by the Peruvian data. The reduction in poverty rates due to income from children's labor is greater in Pakistan than in Peru. The nature of interaction between adult and child labor markets varies with the gender of the child and the adult. In Peru rising men's wages significantly reduce the labor hours of girls, whereas in Pakistan there is a strong complementarity between women's and girls' labor markets. Both data sets agree on the positive role that increasing adult education can play in improving child welfare. Ray, R. Child Labors Child Schooling, and Their Interaction with Adult Labor: Empirical Evidence for Peru and Pakistan – The World Bank Economic Review, 2000, Vol. 14, No. 2, pp. 347-367 Although much of the literature on child labor looks at the decision on whether to send a child to school or to work (or both), little attention has focused on the number of hours worked. This article analyzes the determinants of school attendance and hours worked by children in Pakistan and Nicaragua. A theoretical model of children's labor supply is used to simultaneously estimate the school attendance decision and the hours worked, using a full model maximum likelihood estimator. The model analyzes the marginal effects of explanatory variables, conditioning on latent states, that is, the propensity of the household to send the child to work or not. These marginal effects are in some cases rather different across latent states, with important policy implications. Rosati, F.C., Rossi, M.C. Children's Working Hours and School Enrollment: Evidence from Pakistan and Nicaragua – World Bank Economic Review, 2003, Vol. 17, No. 2, pp. 283 – 295 DOI: 10.1093/wber/lhg023 Child labor is a common consequence of economic shocks in developing countries. We show that reducing vulnerability can affect child labor outcomes. We exploit the extension of a health and accident insurance scheme by a Pakistani microfinance institution that was set up as a randomized controlled trial and accompanied by household panel surveys. Together with increased coverage the microfinance institution offered assistance with claim procedures in treatment branches. We find lower incidence of child labor, hazardous occupations and child labor earnings caused by the innovation. Boys are more often engaged in child labor in our sample, but also seem to profit more from the insurance innovation. Landmanna, A., Frölicha, M. Can health-insurance help prevent child labor? An impact evaluation from Pakistan – Journal of Health Economics, 2015, Vol. 39, pp. 51–59 DOI: 10.1016/j.jhealeco.2014.10.003 This article is motivated by the remarkable observation that children of land-rich households are often more likely to be in work than the children of land-poor households. The vast majority of working children in developing economies are in agricultural work, predominantly on farms operated by their families. Land is the most important store of wealth in agrarian societies, and it is typically distributed very unequally. These facts challenge the common

57
presumption that child labor emerges from the poorest households. This article suggests that this apparent paradox can be explained by failures of the markets for labor and land. Credit market failure will tend to weaken the force of this paradox. These effects are modeled and estimates obtained using survey data from rural Pakistan and Ghana. The main result is that the wealth paradox persists for girls in both countries, whereas for boys it disappears after conditioning on other covariates. Bhalotra, S., Heady, C. Child Farm Labor: The Wealth Paradox – World Bank Economic Review, 2003, Vol. 17, No. 2, pp. 197 – 227 DOI: 10.1093/wber/lhg017
Tabel 42. Artiklite lühikokkuvõtted ja viited – keskkond
This review article focuses on the current situation of e-waste in Pakistan with the emphasis on defining the major e-waste recycling sites, current and future domestic generation of e-waste, hidden flows or import of e-waste and discusses various challenges for e-waste management. Needed policy interventions and possible measures to be taken at governmental level are discussed to avoid the increasing problem of e-waste in the country. Our findings highlight that there is still a general lack of reliable data, inventories and research studies addressing e-waste related issues in the context of environmental and human health in Pakistan. There is therefore a critical need to improve the current knowledge base, which should build upon the research experience from other countries which have experienced similar situations in the past. Further research into these issues in Pakistan is considered vital to help inform future policies/control strategies as already successfully implemented in other countries. Iqbal, M., Breivik, K., Syed, J.H., Malik, R.N., Li, J. et al. Emerging issue of e-waste in Pakistan: A review of status, research needs and data gaps – Environmental Pollution, 2015, Vol. 207, pp. 308-318 DOI: 10.1016/j.envpol.2015.09.002 Landfills all around the world are one of the major sources that contribute towards global warming and climate change. Although landfilling should be prioritized last in the waste management hierarchy due to highest greenhouse gas emissions as compared to other waste management systems it is still very common around the world. In this study, methane emissions are estimated by applying First Order Decay model to landfills in Pakistan over the latest data available by Pakistan Environmental Protection Agency. Results demonstrate that nearly 14.18 Gg of methane is emitted from the landfills in Pakistan each year. By combusting this methane in the form of biogas collected from the landfills as a waste management scheme we can reduce greenhouse effect up to ~88%. Same percentage is observed when we apply the similar analysis over the potentially improved practice. Also, Pakistan is facing severe economic crises due to continuous increasing gap between energy demand and supply. Demand is increasing exponentially while supply is observed to remain constant over the last few years due to frozen capacity in spite of having significant renewable/alternate energy resources. Current electricity shortfall has reached up to 6000 MW. Present operational landfills in Pakistan can only contribute up to ~0.1% to cater the total deficit which does not make any significant difference but if 75% of the total waste generated today is collected and 50% of it landfilled then Pakistan has the potential to produce ~83.17 MW of power that can contribute up to 1.4% to overcome the current power shortage. The outcomes of this paper may also be applicable to other developing countries having similar resources. Jibran, M. Zuberia, S., Ali, S.F. Greenhouse effect reduction by recovering energy from waste landfills in Pakistan – Renewable and Sustainable Energy Reviews, 2015, Vol. 44, pp. 117–131 DOI: 10.1016/j.rser.2014.12.028 Water pollution is one of the major threats to public health in Pakistan. Drinking water quality is poorly managed and monitored. Pakistan ranks at number 80 among 122 nations regarding drinking water quality. Drinking water sources, both surface and groundwater are contaminated with coliforms, toxic metals and pesticides throughout the country. Various drinking water quality parameters set by WHO are frequently violated. Human activities like improper disposal of municipal and industrial effluents and indiscriminate applications of agrochemicals in agriculture are the main factors contributing to the deterioration of water quality. Microbial and chemical pollutants are the main factors responsible exclusively or in combination for various public health problems. This review discusses a detailed layout of drinking water quality in Pakistan with special emphasis on major pollutants, sources of pollution and the consequent health problems. The data presented in this review are extracted from various studies published in national and international journals. Also reports released by the government and non-governmental organizations are included. Azizullah, A., Khattak, M.N.K, Richter, P., Häder, D-P. Water pollution in Pakistan and its impact on public health – Environment International, 2011, Vol. 37, pp. 479–497 DOI: 10.1016/j.envint.2010.10.007 Tabel 43. Artiklite lühikokkuvõtted ja viited – puuvill
58
Cotton workers in small weaving household factories (power looms) in Pakistan are typically exposed to high levels of cotton dusts. Working in the textile manufacturing industry has been classified as a possible human carcinogen (group 2B) by the International Agency for Research on Cancer. The study set out to determine potential cytotoxic and genotoxic effects of occupational exposure to cotton dusts in exfoliated buccal cells of exposed cotton workers. Nuclear anomalies reflecting cytotoxic and genotoxic effects were evaluated in a representative sample of 51 exposed male cotton weavers and in the same number of age-matched male non-exposed subjects applying the micronucleus cytome assay. Nuclear anomalies reflecting cytotoxicity (karyolysis, karyorrhexis, condensed chromatin and pyknosis) were significantly elevated in exposed cotton workers. The frequency of micronucleated cells increased significantly with increasing years of work in power looms (odds ratio = 1.043 per year; 95% confidence interval: 1.012–1.076, P = 0.007). Results were consistent with the typical inflammatory pattern and injury in epithelia due to unprotected occupational exposure to cotton dusts and other toxic, allergic and infectious substances in the working areas of the cotton industry. Occupational exposure in power looms induces cytotoxic effects and, upon chronic exposure, DNA damage. This may eventually result in typical obstructive patterns of pulmonary symptoms and in a clinical condition called byssinosis in exposed cotton workers. Long exposure may lead to chronic inflammation and cumulative damage of DNA in buccal stem cells that may indicate an increased risk of oropharyngeal cancer. Khan, A.W., Nersesyan, A., Knasmüller, S., Moshammer, H.,* Kundi, M. Nuclear anomalies in exfoliated buccal cells in Pakistani cotton weavers – Mutagenesis, 2015, Vol. 30, pp.613–619 DOI: 10.1093/mutage/gev022 The amount of pesticides used in crop production in Pakistan has increased rapidly in the last decades, whereas farmers in many areas of the country show little knowledge of safe and efficient use of pesticides. The level of willingness to pay (WTP) for avoiding health risks by pesticides was studied among 318 randomly selected cotton farmers from two districts of the area of Punjab (i.e., Vehari and Lodhran) in Pakistan, using the contingent valuation method. Most farmers felt that pesticide use is a prerequisite for successful cotton production, whereas at the same time they were well aware of pesticide health risks, which they considered minor. The majority of the farmers (77%) showed varying levels of WTP some fee up to 20% of the current pesticide expenditures for avoiding pesticide health risks, but few were willing to pay a fee over 20%. The mean WTP per farmer was low, reaching 5.8 $US on an annual basis. By contrast, a considerable proportion of the farmers (23%) were not willing to pay any fee for avoiding pesticide health risks. These individuals were mostly poor small-scale farmers with limited or no education. High levels of risk perception about pesticides, past experience of pesticide intoxication, high levels of education, and high income were associated with high farmers' WTP for less health risks by pesticides. Farmers who perceived major health risks by pesticides appeared to be highly willing to pay a premium for safe pesticides. Elderly farmers appeared more likely to pay some premium for safe pesticides as a result of higher farming experience and higher income than young farmers. Well-educated farmers were more likely to pay a high premium for safe pesticides. Large farm size was a significant predictor of positive WTP, which was interpreted as an indicator of farmers' wealth. Khan, M., Damalas, C.A. Farmers' willingness to pay for less health risks by pesticide use: A case study from the cotton belt of Punjab, Pakistan – Science of the Total Environment, 2015, Vol. 530-531, pp. 297–303 DOI: 10.1016/j.scitotenv.2015.05.110 Innovations in cotton (Gossypium hirsutum L.) pest management should be initially based on the perspective of cotton farmers, recognizing farmers' constraints and their existing technical knowledge as the basis for an effective collaboration. A survey of 318 randomly selected farmers from two districts of the cotton belt of Punjab in Pakistan was conducted to study common crop protection problems and related behaviors in cotton production in the area. Data were collected through group discussions with farmers and individual interviews. Relative frequencies of distribution for the tested variables, weighted average scores based on the weight assigned to each answer for the rating scales, and the Borich Needs Assessment Model for the training needs were used for relevant comparisons. Most farmers considered pest damage to be important in cotton production causing significant yield losses. Farmers had awareness of some major insect pests, but the majority of them used descriptive than specific names when defining a pest. Among well-known insects whiteflies, aphids, leafhoppers, thrips, and bollworms were mentioned, but farmers had great difficulty in distinguishing the different species. Identification of cotton diseases was practically non-existent, except from cotton leaf curl. Farmers were aware of a limited number of major weeds. Most of them stated purple nutsedge and bermudagrass as frequent weed problems in cotton production in the area. In general, weeds were perceived as a constant and unresolved problem in cotton production, but with less impact on yield than insects. The majority of the farmers relied on the chemical method for pest control, but knowledge on pesticide safety issues was below average. High needs for training were found on a) the proper period for pesticide application, b) the identification of natural enemies for cotton pests, and c) the discrimination of symptoms of various diseases. Understanding farmers' views of pests and their impact can be a first major step for more efficient pest management in cotton production. Khan, M., Damalas, C.A. Farmers' knowledge about common pests and pesticide safety in conventional cotton production in Pakistan – Crop Protection, 2015, Vol. 77, pp. 45-51

59
DOI: 10.1016/j.cropro.2015.07.014
3.6 Tai Tai kohta informatsiooni otsimisel kasutasime samuti riigi ja meie poolt vaadeldavate probleemide otsingukombinatsioone ja sinna juurde ka 2. peatükis välja toodud enim imporditavate toodete märksõnu.
Tai kohta leidus antud otsingumärksõnadele vastavaid artikleid teistest vähem. Silma aga paistis seksitööstuse kohta käivate artiklite rohkus võrreldes teiste meie poolt käsitletavate riikidega. Tai puhul jagasime leitud artiklid kolme kategooriasse:
1) Artiklid, mis kajastavad probleeme seoses naiste vastase vägivallaga. 2) Artiklid, mille raames on uuritud majandustegevusest tulenevaid keskkonnaprobleeme Tais 3) Artiklid üleüldistest probleemidest majanduse ja töötingimustega.
Tabel 44. Artiklite lühikokkuvõtted ja viited – vägivald
Organisations and scholars have recently drawn attention to what they call a modern form of slavery, ‘domestic slavery’. Domestic workers in Europe and elsewhere live and work in appalling conditions and are vulnerable to abuse. This article describes the problem, presents the relevant legal instruments and analyses a decision of the European Court of Human Rights, Siliadin v France, where France was found in breach of the prohibition of slavery, servitude, forced and compulsory labour under the European Convention on Human Rights. The paper examines the growing interaction between international labour law and international human rights law. It argues that the decision in Siliadin and its legal implications constitute a positive first step towards addressing the problem of the coercion and vulnerability of migrant domestic workers. Mantouvalou, V. Servitude and Forced Labour in the 21st Century: The Human Rights of Domestic Workers – Industrial Law Journal, 2006, Vol. 35, No. 4, pp. 395-414 DOI: 10.1093/indlaw/dwl029 In this article, our ethnographic focus is a human trafficking “reality tour” of Thailand, a one-week tour of purported trafficking-related sites that the authors jointly attended. This tour was part of a growing number of trips around the world that offer alternatives to mass tourism, taking issues of social justice and humanitarian intervention as their focal orientation. As scholars with an interest in trafficking, labor exploitation, and sex workers’ rights, we chose to take not human trafficking itself, but rather the “reality tour” that claimed to represent it as our ethnographic object, to critically interrogate the reality of the “realities of the global trade in humans” that it endeavored to convey. What do commercially packaged “anti-trafficking” tours reveal about global panics around sexuality and sex work, as well as about the politics of tourism and development in Thailand? Transnationally, how does the notion of “NGOs as experts” interact with local expertise around trafficking, labor, and sex workers’ rights? And how do moral and political economies of authenticity circulate in the “reality tourist” experience? We situate our interrogation of these issues within the expanding literatures on tourism and authenticity as well as the critical literatures on sex tourism and sex trafficking, two terrains of scholarship that have infrequently been juxtaposed. Bernstein, E. Shih, E. The Erotics of Authenticity: Sex Trafficking and “Reality Tourism” in Thailand – Social Politics, 2014, Vol. 21, No. 3, pp.430-460 DOI: 10.1093/sp/jxu022 Tabel 45. Artiklite lühikokkuvõtted ja viited – keskkond
This research is aimed at developing a methodology for the calculation of greenhouse gas (GHG) for palm oil mills in Thailand. It was prepared by setting up a system boundary to cover palm oil mills with the wet extraction process for the evaluation of the cradle to gate process. The existing methodologies for calculation were reviewed to develop a Thai GHG calculation methodology. There were 14 palm oil mills participated in the assessment of GHG emitted at source and the collection of data in relation to GHG calculation. They accounted for 34.6% of total crude palm oil (CPO) production capacity in Thailand. The GHG emissions of the wet extraction process arose from the acquisition of raw material, the chemicals used, the energy used, transportation and wastewater management. The average GHG emission value of fourteen mills without allocation was 1198 kgCO2e/metric ton (MT) CPO. The major sources emitting GHG were from the cultivation and harvesting of fresh fruit bunches and the wastewater treatment system. The total CPO production in Thailand in the year 2009 by the wet extraction process emitted an approximate total of 1.62 million GHG metric tons of CO2e. The GHG emission values of CPO by energy allocation from the mills with biogas capture, the mills without biogas capture, the Thailand average, and the best observed

60
scenarios were 750, 1087, 871 and 440 kgCO2e/MT CPO, respectively. Kaewmai, R., H-Kittikun, A., Musikavong, C. Greenhouse gas emissions of palm oil mills in Thailand – International Journal of Greenhouse Gas Control, 2012, Vol. 11, pp. 141-151 DOI: 10.1016/j.ijggc.2012.08.006 The aim of this study is to assess potential health risk of exposure to particle-associated polycyclic aromatic hydrocarbons (PAHs) in children living in a megacity with traffic congestion such as Bangkok. The study population comprised 184 Thai schoolboys (aged 8–13 years) attending schools adjacent to high-density traffic areas in Bangkok and schools located in the provincial area of Chonburi. The ambient concentration of total PAHs at roadsides in proximity to the Bangkok schools was 30-fold greater than at roadsides in proximity to the provincial schools (30.39 ± 5.80 versus 1.50 ± 0.28 ng/m3; P < 0.001). Benzo(g,h,i)perylene (BghiP), an indicator of automobile exhaust emission, was the predominant PAH. Personal exposure to total PAHs and the corresponding benzo(a)pyrene (BaP) equivalent concentrations in Bangkok schoolchildren were 3.5-fold higher than in provincial schoolchildren (4.13 ± 0.21 versus 1.18 ± 0.09 ng/m3; P < 0.001 and 1.50 ± 0.12 versus 0.43 ± 0.05 ng/m3; P < 0.001, respectively). The concentration of urinary 1-hydroxypyrene (1-HOP) was significantly higher in Bangkok schoolchildren. Bulky carcinogen–DNA adduct levels in peripheral lymphocytes were also significantly higher (0.45 ± 0.03 versus 0.09 ± 0.00 adducts/108 nt; P < 0.001). Finally, a significantly higher level of DNA strand breaks and a significantly lower level of DNA repair capacity were observed in Bangkok schoolchildren (P < 0.001). This study indicates that Bangkok schoolchildren exposed to a high level of genotoxic PAHs in ambient air may be more vulnerable to the health impacts associated with the exposure to genotoxic pollutants than children in provincial areas and may have increased health risks for the development of certain diseases such as cancer. Tuntawiroon, J., Mahidol, C., Navasumrit, P., Autrup, H., Ruchirawat, M. Increased health risk in Bangkok children exposed to polycyclic aromatic hydrocarbons from traffic-related sources – Carcinogenesis, 2007, Vol.28, No.4, pp.816-822 DOI: 10.1093/carcin/bgl175 There is increasing public concern over human health risks associated with extensive use of pesticides in agriculture. Regulation of pesticide maximum residue limits (MRLs) in food commodities is established in many developed countries. For Thailand, this regulation exists in law but is not fully enforced. Therefore, pesticide residues in vegetables and fruits have not been well monitored. This study investigated the pesticide residues in Chinese kale, a commonly eaten vegetable among Asians. The Chinese kale samples (N=117)were purchased from markets in Nakhon Pathom Province, Thailand, and analyzed for the content of 28 pesticides. Analysis was performed by the multiresidual extraction followed by GC–MS/MS. Of pesticides investigated, 12 pesticides were detected in 85% of the Chinese kale samples. Although carbaryl, deltamethrin, diazinon, fenvalerate and malathion were found in some samples, their levels were lower than their MRLs. However, in 34 samples tested, either carbofuran, chlorpyrifos, chlorothalonil, cypermethrin, dimethoate, metalaxyl or profenofos was detected exceeding their MRLs. This represents a 29% rate of pesticide detection above the MRL; a rate much higher than in developed countries. Washing vegetables under running water significantly reduced (p b 0.05) profenofos residues by 55%. The running water method did not significantly decrease cypermethrin residues in the samples but washing with vinegar did. Our research suggests that routine monitoring of pesticide residues is necessary to reduce the public health risks associated with eating contaminated vegetables. Washing vegetables before consumption is advisable as this helps to reduce the level of pesticide residues in our daily intake. Wanwimolruk, S., Kanchanamayoon, O., Phopin, K., Prachayasittikul, V. Food safety in Thailand 2: Pesticide residues found in Chinese kale (Brassica oleracea), a commonly consumed vegetable in Asian countries – Science of the Total Environment, 2015, Vol. 532, pp. 447-455 DOI: 10.1016/j.scitotenv.2015.04.114 After Malaysia, Thailand is the world second largest exporter of natural rubber. However, the processing of natural rubber prior to manufacture into rubber products requires excessive use of groundwater for its operation and discharges considerable quantities of wastewater. Overexploitation of groundwater from aquifer creates a serious threat to the source of potable water supply. Therefore, there is much need to develop sustainable practices for the improvement of in-plant wastewater control and recycling management. The overall water balance for the whole factory shows that 70% of the wastewater is generated from the washing process and ends up in the wastewater treatment plant. With the aim to reduce raw water consumption and amount of wastewater discharge to a nearby river, the concepts of water conservation and wastewater reuse are incorporated as a package of the improved wastewater treatment system. For water reuse purpose, an activated sludge plant coupled with anaerobic and aerobic systems is recommended to upgrade the existing wastewater treatment system. By employing rock bed filtration for polishing effluent of treatment plant, raw water consumption is reduced by 69% and achieves a 77% reduction in the water discharged to the river. Leong, S.T., Muttamara, S., Laortanakul, P. Reutilization of wastewater in a rubber-based processing factory: a case study in Southern Thailand – Resources, Conservation and Recycling, 2003, Vol. 37, pp. 159-172 This paper aims to assess sustainability of different sugarcane cultivation practices in selected sites in North-eastern

61
Thailand; and to provide recommendations to improve sustainability of sugarcane cultivation in the areas studied. This study evaluates the environmental and socio-economic impacts of sugarcane cultivation in different stages at detailed level. The indicators assessed are the impacts on global warming, human toxicity, terrestrial acidification, freshwater eutrophication, marine eutrophication, terrestrial ecotoxicity, freshwater ecotoxicity, marine ecotoxicity, agricultural land occupation, water depletion, fossil fuel depletion, employment generation, worker income, wages and working conditions. The results reveal that the sugarcane cultivation causes highest impacts on freshwater ecotoxicity, freshwater eutrophication and marine ecotoxicity. Yields, cultivation practices and distance to the sugar mill are the key factors influencing the environmental and socio-economic impacts. Moreover, it is suggested that optimal quantities of fertilizers and pesticides consumed may help to increase yields. This will consequently lower the environmental impacts and reduce production cost. The distance from farm to sugar mill could also influence production cost and the environmental impacts. Mechanized harvesting is found to be a way to reduce production cost. However, it is associated with an increase in environmental impacts as well as reduction in employment. Wages and working conditions of jobs in sugarcane farming are found to be poorer compared to rice farming. Sugarcane farming may experience a lack of laborers in the future which may lead to more mechanization. Recommendations proposed to improve sustainability of the sugarcane cultivation include increasing yields, managing fertilizer and agro-chemical applications, and zoning agricultural crops. Prasara-A, J., Gheewala, S.H. Sustainability of sugarcane cultivation: case study of selected sites in north-eastern Thailand – Journal of Cleaner Production, 2015, pp. 1-10 Tabel 46. Artiklite lühikokkuvõtted ja viited – töötingimused
Using the Thai PISA 2009 literacy test, this paper offers two contributions to the literature on the achievement gap between students in urban and rural areas. The first contribution relates to the estimation of the student-level education production function at different points along the achievement distributions. With the use of Oaxaca–Blinder decomposetion, the second contribution demonstrates how much of the achievement differential between urban–rural students can be explained by unmeasured school characteristics. It has been found that the impact of student, family as well as school characteristics on student achievements vary along the test achievement distributions. Decompositions exercises at the mean find that about 45–48 percent of urban–rural achievement gaps are accounted for by the unmeasured characteristics of schools. The disaggregated decomposition exercise along the achievement percentile shows that these characteristics account for about 12–15 percent low-performing students and increase to about 61–69 percent for high-performing students. Lounkaew, K. Explaining urban–rural differences in educational achievement in Thailand: Evidence from PISA literacy data – Economics of Education Review, 2013, Vol. 37, pp. 213-225 Objectives: Latex product manufacturing is an important industry in south-east Asia but has the potential for considerable occupational exposure of workers to latex allergens. Although exposure to latex allergens can result in adverse health reactions, few studies to characterize this exposure have been conducted to date. This study therefore aimed to characterize current airborne inhalable dust and the specific allergen, Hev b 6.02, exposures in this industry in Thailand. Methods: Workers were recruited from three factories in the southern part of Thailand. Full-shift inhalable dust personal air sampling was conducted using IOM sampling heads equipped with polytetrafluoroethylene filters at a 2.0 l min−1 flowrate. After weighing to determine inhalable dust levels, filters were extracted and analysed for Hev b 6.02 using an enzyme immunometric assay. Results: Two hundred and seventy-five workers agreed to participate, resulting in a total of 292 measurements. Geometric mean (GM) personal exposure to inhalable dust was 0.88 mg m–3, but individual exposures up to 12.34 mg m–3 were measured. The pattern of exposure was similar across factories, with highest exposures in the stripping (GM 2.08–4.05 mg m–3 for the 3 factories) and tumbling departments (1.11–2.17 mg m–3). Within-worker (day-to-day) variability contributed 92% to total variability. The Hev b 6.02 exposure pattern was similar with time-weighted average GM exposure levels in the oldest factory ranging from 8.7 mg m–3 in the laboratory to 30.2 mg m–3 in the stripping department. In contrast to inhalable dust exposure, total exposure variability was primary driven by variability between workers (67%). Conclusions: Workers in these latex product factories get routinely exposed to measurable Hev b 6.02 levels, which ay give rise to increased incidence of allergic symptoms and occupational asthma. Also, in this measurement campaign a 10 mg m–3, but not 15 mg m–3, occupational exposure limit for inhalable dust was occasionally exceeded. Highest Hev b 6.02 exposures were found in the stripping and tumbling departments, which would be natural targets for interventions aimed at reducing exposure. Sanguanchaiyakrit, N., Povey, A.C., de Vocht, F. Personal Exposure to Inhalable Dust and the Specific Latex Aero-Allergen, Hev b6.02, in Latex Glove Manufacturing in Thailand – Ann. Occup. Hyg., 2014, Vol. 58, No. 5, pp. 542–550 DOI: 10.1093/annhyg/meu013

62
Kokkuvõte Analüüsis kaardistatakse Eesti seosed arengumaadega Statistikaameti andmete põhjal, mis näitavad Eesti impordi statistikat toote päritoluriigi järgi. Arengumaade definitsioonina kasutati Maailmapanga (World Bank - WB) koostatavat ja regulaarselt uuendatavat nimekirja. Analüüsis kasutati erineval tasemel kaupade grupeerimist (jaotis, kaubagrupp või 4-kohaline kood ehk alamgrupp). Tulemused esitleti nii olulisemate kaubagruppide kui ka riikide lõikes.
Eestisse toodi 2014. aastal 12,6 mlrd euro väärtuses erinevaid kaupu, millest arenguriikide osakaal oli vaid 13% (1,65 mlrd eurot). Suurimad impordiartiklid Eestisse on masinad ja mehaanilised seadmed (koguimport on 3,6 mlrd), millele järgnesid mineraalsed tooted (1,7 mlrd). Arengumaadest suurimad kaubagrupid on relvad ja laskemoon, nende osad ja tarvikud (52% arengumaadest); jalatsid, peakatted, vihma- ja päevavarjud, jalutuskepid, istmega jalutuskepid, piitsad, ratsapiitsad ja nende osad, töödeldud suled ja sulgedest tooted, tehislilled, tooted juustest (53% arengumaadest) ja tekstiil ja tekstiilitooted (42% arengumaadest).
Toote päritolumaa järgi imporditakse arengumaadest enim Eestisse Hiinast, kust tuli 58% arengumaade impordist (kokku 961 mln euro eest). Sama ilmneb vaadates riike ka kaubagruppide ja jaotiste lõikes: nii jaotise XII (jalatsid…), jaotise XI (tekstiil…), jaotise VIII (nahktooted…), jaotise XX (kus all mänguasjad…) ja ka jaotise XVI (masinad…) tuleb kõige suurem osa Hiinast (üle poole ehk 61,2% kõigi arenguriikide impordist). Teiste arenguriikidena, mille kohta tehti uuringu teises osas artiklite otsing, olid impordi mahud järgmised:
1. Türgi, kust imporditi Eestisse 91 mln euro eest kaupu, mis kogu Eesti impordist moodustas vaid 0,72%,
2. Bangladesh, kust imporditi 17,96 mln euro eest, mis kogu Eesti impordist moodustas 0,14%, 3. India, kust imporditi 42,7 mln euro eest kaupa, mis moodustab 0,34% kogu Eesti impordist, 4. Pakistan, kust imporditi 12,8 mln euro eest, mis moodustab kogu Eesti impordist 0,1% ja 5. Tai, kust imporditi 45,6 mln euro eest kaupu, mis kogu Eesti impordist oli väga väike osa –
kõigest 0,36%.
Uuringu teine osa keskendub arenguriikidega kaasnevaid probleeme (ebainimlikud töötingimused, keskkonnamõjud ja lapstööjõud) käsitlevate eelretsenseeritud teadusartiklite välja otsimisele ja loetlemisele. Uuringuosa eesmärgiks on anda ülevaade, milliseid teemasid ja kuidas on uuritud. Kõigi riikide puhul leidus artikleid, mis kajastasid tootmisest tulenevaid keskkonnaprobleeme. Teiste probleemide osas on riigiti uuringute jaotused erinevad.

63
Lisa 1. WB arengumaade nimekiri 1 Albania 2 Algeria 3 American Samoa 4 Angola 5 Armenia 6 Azerbaijan 7 Belarus 8 Belize 9 Benin
10 Bolivia 11 Bosnia and Herzegovina 12 Botswana 13 Brazil 14 Bulgaria 15 Burkina Faso 16 Burundi 17 Cabo Verde 18 Cambodia 19 Cameroon 20 Central African Republic 21 Chad 22 China 23 Colombia 24 Comoros 25 Congo, Dem. Rep. 26 Congo, Rep. 27 Costa Rica 28 Cote d'Ivoire 29 Cuba 30 Djibouti 31 Dominica 32 Dominican Republic 33 Ecuador 34 Egypt, Arab Rep. 35 El Salvador 36 Eritrea 37 Ethiopia 38 Fiji 39 Gabon 40 Gambia, The 41 Georgia 42 Ghana 43 Grenada
44 Guatemala 45 Guinea 46 Guinea-Bissau 47 Guyana 48 Haiti 49 Honduras 50 Indonesia 51 Iran, Islamic Rep. 52 Iraq 53 Jamaica 54 Jordan 55 Kazakhstan 56 Kenya 57 Kiribati 58 Korea, Dem. Rep. 59 Kosovo 60 Kyrgyz Republic 61 Lao PDR 62 Lebanon 63 Lesotho 64 Liberia 65 Libya 66 Macedonia, FYR 67 Madagascar 68 Malawi 69 Malaysia 70 Mali 71 Marshall Islands 72 Mauritania 73 Mauritius 74 Mexico 75 Micronesia, Fed. Sts. 76 Moldova 77 Mongolia 78 Montenegro 79 Morocco 80 Mozambique 81 Myanmar 82 Namibia 83 Nicaragua 84 Niger 85 Nigeria 86 Palau
87 Panama 88 Papua New Guinea 89 Paraguay 90 Peru 91 Philippines 92 Romania 93 Rwanda 94 Samoa 95 Sao Tome and Principe 96 Senegal 97 Serbia 98 Sierra Leone 99 Solomon Islands
100 Somalia 101 South Africa 102 South Sudan 103 St. Lucia 104 St. Vincent and the Grenadines 105 Sudan 106 Suriname 107 Swaziland 108 Syrian Arab Republic 109 Zambia 110 Zimbabwe 111 Tajikistan 112 Tanzania 113 Thailand 114 Timor-Leste 115 Togo 116 Tonga 117 Tunisia 118 Turkey 119 Turkmenistan 120 Tuvalu 121 Uganda 122 Ukraine 123 Uzbekistan 124 Vanuatu 125 West Bank and Gaza 126 Vietnam 127 Yemen, Rep.

64
Lisa 2. Kaupade nomenklatuuri jaotised ja 2-kohalised
kaubagrupid Rooma numbritega on toodud jaotised ja 2-kohalised numbrid näitavad jaotise alla kuuluvaid kaubagruppe.
I ELUSLOOMAD; LOOMSED TOOTED ..01 Elusloomad ..02 Liha ja toidukõlblikud subproduktid ..03 Kalad ja vähilaadsed, molluskid ja muud veeselgrootud ..04 Piim ja piimatooted; linnumunad; naturaalne mesi; ... ..05 Muud loomsed tooted II TAIMSED TOOTED ..06 Eluspuud ja muud taimed; taimesibulad, -juured jms; ... ..07 Köögivili ning toiduks kasutatavad juured ja mugulad ..08 Toiduks kasutatavad puuviljad, marjad ja pähklid; ... ..09 Kohv, tee, mate ja maitseained ..10 Teravili ..11 Jahu, tangud ja kruubid; linnased; tärklis; inuliin; nisugluteen ..12 Õliseemned ja -viljad; muud seemned ja viljad; ... ..13 Ðellak; kummivaigud, vaigud ja muud taimemahlad ja -ekstraktid ..14 Taimne punumismaterjal; mujal nimetamata taimsed tooted III LOOMSED JA TAIMSED RASVAD NING ÕLID, NENDE LÕHUSTAMISSAADUSED; ... ..15 Loomsed ja taimsed rasvad ning õlid, nende lõhustamissaadused; ... IV VALMISTOIDUKAUBAD; KARASTUSJOOGID; ALKOHOOLSED JOOGID JA ÄÄDIKAS; TUBAKAS ... ..16 Lihast, kalast, vähilaadsetest, molluskitest ja muudest veeselgrootutest tooted ..17 Suhkur ja suhkrust kondiitritooted ..18 Kakao ja kakaotooted ..19 Linnastest, jahust, tärklisest ja piimast valmistatud tooted; ... ..20 Köögi- ja puuviljadest, pähklitest ning teistest taimeosadest tooted ..21 Mitmesugused toidukaubad ..22 Joogid (veed), alkohol ja äädikas ..23 Toiduainete tootmise jäägid ja jäätmed; tööstuslikult toodetud loomasöödad ..24 Tubakas ja tööstuslikud tubakaasendajad V MINERAALSED TOOTED ..25 Sool; väävel; mullad ja kivimid, lubi ja tsement ..26 Maagid, räbu ja tuhk ..27 Mineraalne kütus, mineraalõlid ja nende destilleerimissaadused; ... VI KEEMIATÖÖSTUSE JA SELLEGA SEOTUD TÖÖSTUSHARUDE TOOTED ..28 Anorgaanilised kemikaalid; väärismetallide, haruldaste muldmetallide, ... ..29 Orgaanilised kemikaalid ..30 Farmaatsiatooted ..31 Väetised ..32 Park- ja värvainete ekstraktid; tanniinid ja nende derivaadid; värvained, ... ..33 Eeterlikud õlid ja resinoidid; parfümeeria- ja kosmeetikatooted ning hügieenivahendid ..34 Seep, orgaanilised pindaktiivsed ained, pesuvahendid, määrdeained, tehisvahad, ... ..35 Valkained; modifitseeritud tärklis; liimid; fermendid

65
..36 Lõhkeained; pürotehnilised tooted; tuletikud; pürofoorsed sulamid; ...
..37 Foto- ja kinokaubad
..38 Mitmesugused keemiatooted VII PLASTID JA PLASTTOOTED; KUMMI JA KUMMITOOTED ..39 Plastid ja plasttooted ..40 Kummi ja kummitooted VIII TOORNAHAD, NAHK, KARUSNAHK JA TOOTED NENDEST; SADULSEPATOOTED JA RAKMED;... ..41 Toornahad (v.a karusnahad) ja nahk ..42 Nahktooted; sadulsepatooted ja rakmed; käekotid, reisitarbed jms tooted; ... ..43 Karusnahk ja tehiskarusnahk; tooted nendest IX PUIT JA PUITTOOTED; PUIDUSÜSI; KORK JA KORGIST TOOTED; ÕLGEDEST JA MUUST PUNUMISMATERJALIST ... ..44 Puit ja puittooted; puidusüsi ..45 Kork jatooted sellest ..46 Õlgedest, espartost ja muust punumismaterjalist tooted; korv- ja vitspunutised X PUIDUST VÕI MUUST TAIMSEST KIUDMATERJALIST PABERIMASS; PABERI- VÕI PAPIJÄÄTMED; PABER ... ..47 Puidust või muust taimsest kiudmaterjalist paberimass; paberi- ja papijäätmed ..48 Paber ja papp; paberimassist, paberist või papist tooted ..49 Raamatud, ajalehed, pildid jm trükitooted; käsikirjad, masinakirjatekstid ... XI TEKSTIIL JA TEKSTIILTOOTED ..50 Siid ..51 Lamba- jt loomade vill, jäme loomakarv; hobusejõhvist lõng ja riie ..52 Puuvill ja puuvilltooted ..53 Muud taimsed tekstiilkiud; paberlõng ja riie ..54 Sünteetilised ja tehiskiud ..55 Keemilised filamentkiud ..56 Vatt, vilt ja lausriie; erilõngad; nöörid ja köied ning tooted nendest ..57 Vaibad ja muud tekstiilpõrandakatted ..58 Kootud erikangad; läbiõmmeldud karuse abil karvastatud kangad; ... ..59 Impregneeritud, pealistatud, kaetud või lamineeritud; tekstiiltooted tööstuslikuks otstarbeks ..60 Silmkoe- ja heegeldatud kangad (trikookangad) ..61 Silmkoelised ja heegeldatud rõivad ning rõivamanused (trikootooted) ..62 Rõivad ning rõivamanused, v.a silmkoelised ja heegeldatud ..63 Muud tekstiilist valmistooted; komplektid; kantud rõivad ja ... XII JALATSID, PEAKATTED, VIHMA- JA PÄEVAVARJUD, JALUTUSKEPID, PIITSAD, ... ..64 Jalatsid jms tooted; nende toodete osad ..65 Peakatted ja nende osad ..66 Vihmavarjud, päevavarjud, jalutuskepid, piitsad, ratsapiitsad, nende osad ..67 Töödeldud suled ja udusuled ning tooted nendest; tehislilled; juustest tooted XIII KIVIST, KIPSIST, TSEMENDIST, ASBESTIST, VILGUKIVIST JMS MATERJALIST TOOTED; ... ..68 Kivist, kipsist, tsemendist, asbestist, vilgukivist jms materjalist tooted ..69 Keraamikatooted ..70 Klaas ja klaastooted XIV LOODUSLIKUD JA KULTIVEERITUD PÄRLID, VÄÄRIS- JA POOLVÄÄRISKIVID, VÄÄRISMETALLID, ... ..71 Looduslikud ja kultiveeritud pärlid, vääris- ja poolvääriskivid, väärismetallid, ... XV METALLID JA METALLTOOTED
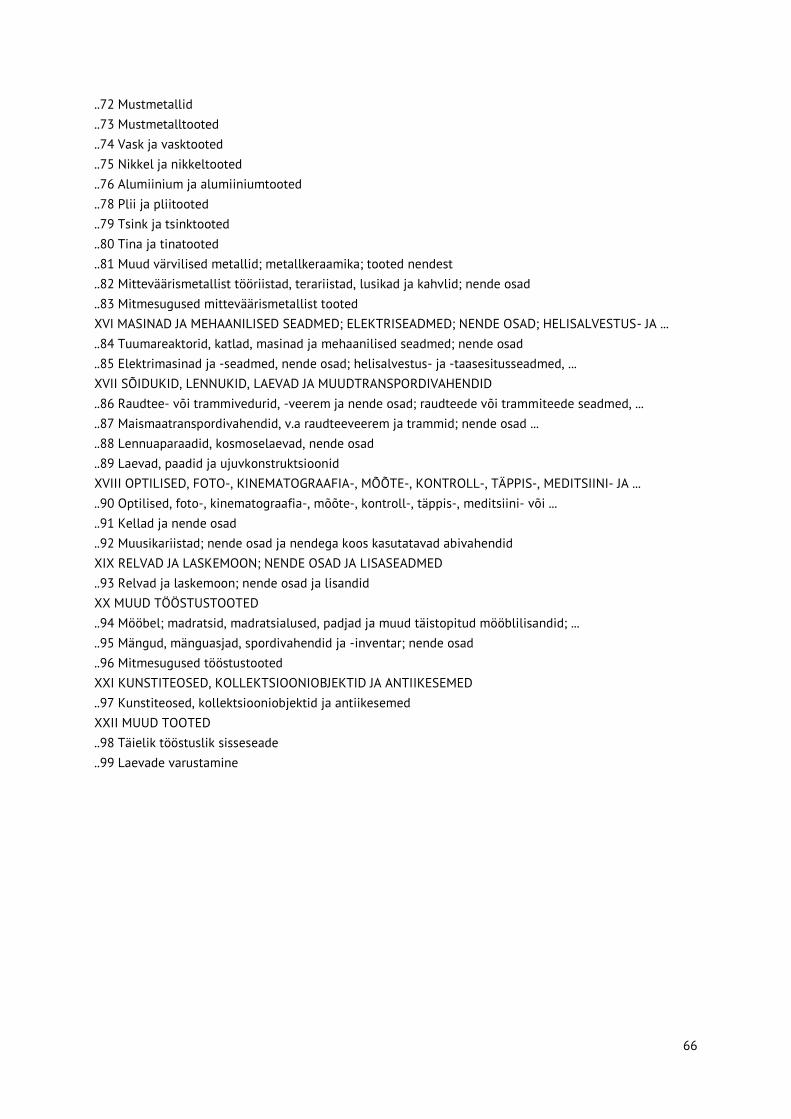
66
..72 Mustmetallid
..73 Mustmetalltooted
..74 Vask ja vasktooted
..75 Nikkel ja nikkeltooted
..76 Alumiinium ja alumiiniumtooted
..78 Plii ja pliitooted
..79 Tsink ja tsinktooted
..80 Tina ja tinatooted
..81 Muud värvilised metallid; metallkeraamika; tooted nendest
..82 Mitteväärismetallist tööriistad, terariistad, lusikad ja kahvlid; nende osad
..83 Mitmesugused mitteväärismetallist tooted XVI MASINAD JA MEHAANILISED SEADMED; ELEKTRISEADMED; NENDE OSAD; HELISALVESTUS- JA ... ..84 Tuumareaktorid, katlad, masinad ja mehaanilised seadmed; nende osad ..85 Elektrimasinad ja -seadmed, nende osad; helisalvestus- ja -taasesitusseadmed, ... XVII SÕIDUKID, LENNUKID, LAEVAD JA MUUDTRANSPORDIVAHENDID ..86 Raudtee- või trammivedurid, -veerem ja nende osad; raudteede või trammiteede seadmed, ... ..87 Maismaatranspordivahendid, v.a raudteeveerem ja trammid; nende osad ... ..88 Lennuaparaadid, kosmoselaevad, nende osad ..89 Laevad, paadid ja ujuvkonstruktsioonid XVIII OPTILISED, FOTO-, KINEMATOGRAAFIA-, MÕÕTE-, KONTROLL-, TÄPPIS-, MEDITSIINI- JA ... ..90 Optilised, foto-, kinematograafia-, mõõte-, kontroll-, täppis-, meditsiini- või ... ..91 Kellad ja nende osad ..92 Muusikariistad; nende osad ja nendega koos kasutatavad abivahendid XIX RELVAD JA LASKEMOON; NENDE OSAD JA LISASEADMED ..93 Relvad ja laskemoon; nende osad ja lisandid XX MUUD TÖÖSTUSTOOTED ..94 Mööbel; madratsid, madratsialused, padjad ja muud täistopitud mööblilisandid; ... ..95 Mängud, mänguasjad, spordivahendid ja -inventar; nende osad ..96 Mitmesugused tööstustooted XXI KUNSTITEOSED, KOLLEKTSIOONIOBJEKTID JA ANTIIKESEMED ..97 Kunstiteosed, kollektsiooniobjektid ja antiikesemed XXII MUUD TOOTED ..98 Täielik tööstuslik sisseseade ..99 Laevade varustamine

67
Lisa 3. Import jaotiste lõikes Tabel 47. Impordi statistika jaotiste lõikes (sorteeritud impordi osatähtsuse järgi arengumaadest)
Jaotise nimi Impordi summa arengu-maadest
Impordi summa kokku
Arengu-maade osakaal jaotise
impordist
Jaotise osakaal kogu
Eesti impordis
Jaotise osakaal
arengumaade impordis
XII jaotis - jalatsid, peakatted, vihma- ja päevavarjud, jalutuskepid, istmega jalutuskepid; piitsad, ratsapiitsad ja nende osad; töödeldud suled ja sulgedest tooted; tehislilled; tooted juustest
58 149 306 110 293 284 53% 0,9% 3,5%
XIX jaotis - relvad ja laskemoon; nende osad ja tarvikud
7 678 324 14 888 242 52% 0,1% 0,5%
XI jaotis - tekstiil ja tekstiiltooted 236 703 901 557 321 535 42% 4,4% 14,4%
VIII jaotis - toornahad, nahk, karusnahk ja tooted nendest; sadulsepatooted ja rakmed; reisitarbed, käekotid jms tooted; tooted loomasooltest (v.a jämesiidist)
25 918 503 93 769 933 28% 0,7% 1,6%
III jaotis - loomsed ja taimsed rasvad ja õlid ning nende lõhustamissaadused; töödeldud toidurasvad; loomsed ja taimsed vahad
8 404 029 30 859 024 27% 0,2% 0,5%
XX jaotis - mitmesugused tööstustooted
74 183 366 273 202 027 27% 2,2% 4,5%
XVI jaotis - masinad ja mehaanilised seadmed; elektriseadmed; nende osad; helisalvestus- ja taasesitusseadmed, telepildi ja -heli salvestus- ja taasesitusseadmed, nende osad ja tarvikud
703 915 336 3 594 359 985 20% 28,5% 42,8%
II jaotis - taimsed tooted 49 373 291 259 835 220 19% 2,1% 3,0%
XXI jaotis - kunstiteosed, kollektsiooniobjektid ja antiikesemed
156 829 1 376 978 11% 0,0% 0,0%
XV jaotis - mitteväärismetallid ja nendest valmistatud tooted
108 025 930 963 486 774 11% 7,6% 6,6%
XIII jaotis - kivist, kipsist, tsemendist, asbestist, vilgust jms materjalist tooted; keraamikatooted; klaas ja klaastooted
18 820 190 183 127 921 10% 1,5% 1,1%
XVIII jaotis - optika-, foto-, kino-, 24 236 874 262 516 897 9% 2,1% 1,5%
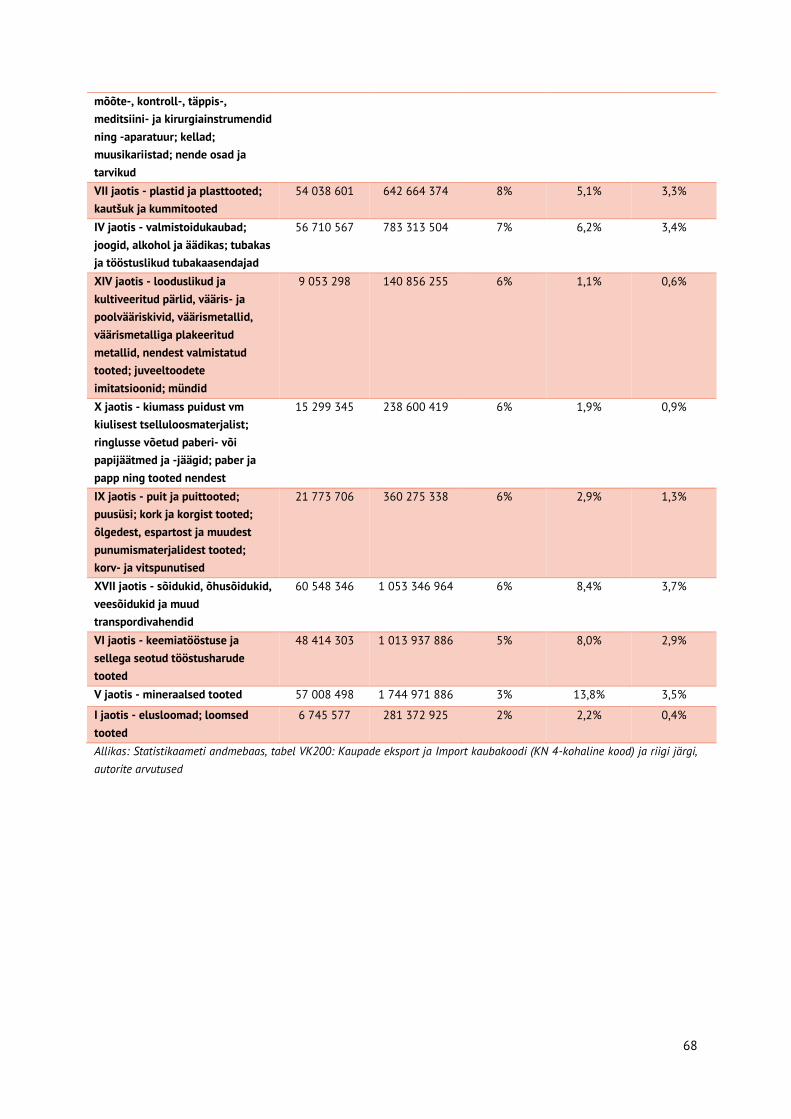
68
mõõte-, kontroll-, täppis-, meditsiini- ja kirurgiainstrumendid ning -aparatuur; kellad; muusikariistad; nende osad ja tarvikud VII jaotis - plastid ja plasttooted; kautšuk ja kummitooted
54 038 601 642 664 374 8% 5,1% 3,3%
IV jaotis - valmistoidukaubad; joogid, alkohol ja äädikas; tubakas ja tööstuslikud tubakaasendajad
56 710 567 783 313 504 7% 6,2% 3,4%
XIV jaotis - looduslikud ja kultiveeritud pärlid, vääris- ja poolvääriskivid, väärismetallid, väärismetalliga plakeeritud metallid, nendest valmistatud tooted; juveeltoodete imitatsioonid; mündid
9 053 298 140 856 255 6% 1,1% 0,6%
X jaotis - kiumass puidust vm kiulisest tselluloosmaterjalist; ringlusse võetud paberi- või papijäätmed ja -jäägid; paber ja papp ning tooted nendest
15 299 345 238 600 419 6% 1,9% 0,9%
IX jaotis - puit ja puittooted; puusüsi; kork ja korgist tooted; õlgedest, espartost ja muudest punumismaterjalidest tooted; korv- ja vitspunutised
21 773 706 360 275 338 6% 2,9% 1,3%
XVII jaotis - sõidukid, õhusõidukid, veesõidukid ja muud transpordivahendid
60 548 346 1 053 346 964 6% 8,4% 3,7%
VI jaotis - keemiatööstuse ja sellega seotud tööstusharude tooted
48 414 303 1 013 937 886 5% 8,0% 2,9%
V jaotis - mineraalsed tooted 57 008 498 1 744 971 886 3% 13,8% 3,5%
I jaotis - elusloomad; loomsed tooted
6 745 577 281 372 925 2% 2,2% 0,4%
Allikas: Statistikaameti andmebaas, tabel VK200: Kaupade eksport ja Import kaubakoodi (KN 4-kohaline kood) ja riigi järgi, autorite arvutused

69
Lisa 4. Import kaubagruppide lõikes (KN 2-kohaline kood) Tabel 48. Kaubagruppide (KN 2-kohaline kood) import Eestisse 2014. a (eurodes)
Kaubagrupi nimi Jaotis Import kokku Import arengu-maadest
Arengumaade osakaal kaubagrupi impordist
Kaubagrupi osakaal
kogu Eesti impordis
46 - õlgedest, espartost ja muudest punumismaterjalidest tooted; korv- ja vitspunutised
IX 1006338 767335 76% 0.0%
66 - vihma- ja päevavarjud, jalutuskepid, istmega jalutuskepid, piitsad, ratsapiitsad ja nende osad
XII 634420 470491 74% 0.0%
53 - muud taimsed tekstiilkiud; paberlõng ja paberlõngast riie
XI 4021046 2814902 70% 0.0%
67 - töödeldud suled ja udusuled ning tooted nendest; tehislilled; tooted juustest
XII 1446308 979741 68% 0.0%
42 - nahktooted; sadulsepatooted ja rakmed; reisitarbed, käekotid jms tooted; tooted loomasooltest (v.a jämesiidist)
VIII 38609376 23168956 60% 0.3%
61 - silmkoelised ja heegeldatud rõivad ning rõivamanused (trikootooted)
XI 122387177 70439702 58% 1.0%
62 - rõivad ning rõivamanused, v.a silmkoelised või heegeldatud
XI 143220903 80938270 57% 1.1%
55 - keemilised staapelkiud XI 60483449 32506160 54% 0.5%
65 - peakatted ja nende osad XII 8003486 4289675 54% 0.1%
64 - jalatsid, kedrid jms tooted; nende osad XII 100209070 52409399 52% 0.8%
63 - muud tekstiilist valmistooted; komplektid; kantud rõivad ja kasutatud tekstiiltooted; kaltsud
XI 46013265 23899325 52% 0.4%
93 - relvad ja laskemoon; nende osad ja tarvikud
XVIII 14888242 7678324 52% 0.1%
95 - mänguasjad, mängud ja spordiinventar; nende osad ja tarvikud
XX 66863292 33112200 50% 0.5%
26 - maagid, räbu ja tuhk V 502502 216855 43.2% 0.0%
14 - taimne punumismaterjal; mujal nimetamata taimsed tooted
II 59245 21900 37.0% 0.0%
52 - puuvill XI 24284768 7723665 31.8% 0.2%
8 - söödavad puuviljad, marjad ja pähklid; tsitrusviljade ja melonite koor
II 87210981 27176245 31.2% 0.7%
15 - loomsed ja taimsed rasvad ja õlid ning nende lõhustamissaadused; töödeldud toidurasvad; loomsed ja taimsed vahad
III 30859024 8404029 27.2% 0.2%
36 - lõhkeained; pürotehnilised tooted; tuletikud; pürofoorsed sulamid; teatavad kergsüttivad valmistised
VI 6694831 1750675 26.1% 0.1%
58 - eririie; taftingriie; pits; seinavaibad; posamendid; tikandid
XI 19870391 5115038 25.7% 0.2%
5 - mujal nimetamata loomsed tooted I 2761847 679566 24.6% 0.0%
92 - muusikariistad; nende osad ja tarvikud XVII 4072870 966142 23.7% 0.0%
85 - elektrimasinad ja -seadmed, nende osad; helisalvestus- ja taasesitusseadmed, telepildi ja -heli salvestus- ja taasesitusseadmed, nende osad ja tarvikud
XVI 2467042193 527378633 21.4% 19.6%
94 - mööbel; madratsid, madratsialused, padjad ja muud täistopitud mööblilisandid; mujal nimetamata lambid ja valgustid;
XX 167267585 34888092 20.9% 1.3%

70
sisevalgustusega sildid, valgustablood jms; kokkupandavad ehitised 9 - kohv, tee, mate ja vürtsid II 49731090 10353444 20.8% 0.4%
18 - kakao ja kakaotooted IV 51707862 9119757 17.6% 0.4%
69 - keraamikatooted XIII 42077997 7310979 17.4% 0.3%
57 - vaibad ja muud tekstiilpõrandakatted XI 6272618 1010357 16.1% 0.0%
75 - nikkel ja nikkeltooted XV 2085685 330489 15.8% 0.0%
96 - mitmesugused tööstustooted XX 39071150 6183074 15.8% 0.3%
84 - tuumareaktorid, katlad, masinad ja mehaanilised seadmed; nende osad
XVI 1127317792 176536703 15.7% 8.9%
99 - muu XXII 588863 85868 14.6% 0.0%
54 - keemilised filamentkiud; keemiliste tekstiilmaterjalide ribad jms vormid
XI 37313568 5402717 14.5% 0.3%
50 - siid XI 494163 70630 14.3% 0.0%
91 - kellad ja nende osad XVII 16836486 2305524 13.7% 0.1%
82 - mitteväärismetallist tööriistad, terariistad, lusikad ja kahvlid; nende mitteväärismetallist osad
XV 52840282 7166693 13.6% 0.4%
12 - õliseemned ja õliviljad; mitmesugused terad, seemned ja viljad; tööstuses kasutatavad taimed ja ravimtaimed; õled ja sööt
II 19019187 2576991 13.5% 0.2%
40 - kautšuk ja kummitooted VII 137251488 18543142 13.5% 1.1%
74 - vask ja vasktooted XV 46922502 6301208 13.4% 0.4%
24 - tubakas ja tööstuslikud tubakaasendajad IV 31611942 4078034 12.9% 0.3%
83 - mitmesugused mitteväärismetallist tooted XV 70761328 8755972 12.4% 0.6%
49 - raamatud, ajalehed, pildid jm trükitooted; käsikirjad, masinakirjatekstid ning plaanid ja joonised
X 18034323 2226998 12.3% 0.1%
29 - orgaanilised kemikaalid VI 154360624 18851090 12.2% 1.2%
7 - köögivili ning söödavad juured ja mugulad II 46685621 5633788 12.1% 0.4%
56 - vatt, vilt ja lausriie; erilõngad; nöörid, paelad, köied ja trossid ning tooted nendest
XI 19268098 2317764 12.0% 0.2%
73 - raud- ja terastooted XV 300853239 35421850 11.8% 2.4%
23 - toiduainetetööstuse jäägid ja jäätmed; tööstuslikult toodetud loomasöödad
IV 75707660 8865340 11.7% 0.6%
72 - raud ja teras XV 361241117 41390088 11.5% 2.9%
97 - kunstiteosed, kollektsiooniobjektid ja antiikesemed
XXI 1376978 156829 11.4% 0.0%
59 - impregneeritud, pealistatud, kaetud või lamineeritud tekstiilriie; tekstiiltooted tööstuslikuks otstarbeks
XI 24825831 2550472 10.3% 0.2%
13 - šellak; kummivaigud, vaigud ja muud taimemahlad ja -ekstraktid
II 1324921 129652 9.8% 0.0%
10 - teravili II 19673966 1920620 9.8% 0.2%
6 - eluspuud ja muud taimed; taimesibulad, -juured jms; lõikelilled ja dekoratiivne taimmaterjal
II 15359980 1475000 9.6% 0.1%
28 - anorgaanilised kemikaalid; väärismetallide, haruldaste muldmetallide, radioaktiivsete elementide ja isotoopide orgaanilised ja anorgaanilised ühendid
VI 47664638 4528478 9.5% 0.4%
20 - tooted köögi- ja puuviljadest, marjadest, pähklitest või muudest taimeosadest
IV 54602080 4883246 8.9% 0.4%
70 - klaas ja klaastooted XIII 75326456 6573462 8.7% 0.6%

71
90 - optika-, foto-, kino-, mõõte-, kontroll-, täppis-, meditsiini- ja kirurgiainstrumendid ning -aparatuur; nende osad ja tarvikud
XVII 241607541 20965208 8.7% 1.9%
60 - silmkoelised ja heegeldatud kangad (trikookangad)
XI 19369792 1636423 8.4% 0.2%
41 - toornahad (v.a karusnahad) ja nahk VIII 19644144 1494955 7.6% 0.2%
68 - kivist, kipsist, tsemendist, asbestist, vilgust jms materjalist tooted
XIII 65723468 4935749 7.5% 0.5%
76 - alumiinium ja alumiiniumtooted XV 112244059 8138434 7.3% 0.9%
39 - plastid ja plasttooted VII 505412886 35495459 7.0% 4.0%
21 - mitmesugused toiduvalmistised IV 99166036 6890948 6.9% 0.8%
71 - looduslikud ja kultiveeritud pärlid, vääris- ja poolvääriskivid, väärismetallid, väärismetalliga plakeeritud metallid, nendest valmistatud tooted; juveeltoodete imitatsioonid; mündid
XIV 140856255 9053298 6.4% 1.1%
16 - tooted lihast, kalast, vähkidest, limustest või muudest veeselgrootutest
IV 44807916 2845858 6.4% 0.4%
48 - paber ja papp; paberimassist, paberist või papist tooted
X 206944074 13072214 6.3% 1.6%
87 - sõidukid, v.a raudtee- ja trammiteeveerem, ning nende osad ja tarvikud
XVII 982666147 58576337 6.0% 7.8%
44 - puit ja puittooted; puusüsi IX 358182929 20982809 5.9% 2.8%
22 - joogid, alkohol ja äädikas IV 309451738 16967582 5.5% 2.5%
34 - seep, orgaanilised pindaktiivsed ained, pesemisvahendid, määrdeained, tehisvahad ja vahavalmistised, poleerimis- ja puhastusvahendid, küünlad jms tooted, voolimispastad, stomatoloogiline vaha ja hambaravis kasutatavad kipsisegud
VI 60379208 3220633 5.3% 0.5%
80 - tina ja tinatooted XV 1082884 48509 4.5% 0.0%
3 - kalad ja vähid, limused ja muud veeselgrootud
I 125034488 5403940 4.3% 1.0%
35 - valkained; modifitseeritud tärklis; liimid; ensüümid
VI 27109907 1158521 4.3% 0.2%
88 - õhusõidukid, kosmoseaparaadid ja nende osad
XVII 10950677 446491 4.1% 0.1%
38 - mitmesugused keemiatooted VI 99355652 3893053 3.9% 0.8%
33 - eeterlikud õlid ja resinoidid; parfümeeria- ja kosmeetikatooted ning hügieenivahendid
VI 107137179 3988130 3.7% 0.8%
43 - karusnahk ja tehiskarusnahk; nendest valmistatud tooted
VIII 35516413 1254592 3.5% 0.3%
25 - sool; väävel; mullad ja kivimid; krohvimismaterjalid, lubi ja tsement
V 39994030 1381069 3.5% 0.3%
81 - muud mitteväärismetallid; metallkeraamika; tooted nendest
XV 10893700 375734 3.4% 0.1%
27 - mineraalkütused, mineraalõlid ja nende destilleerimissaadused; bituumenained; mineraalvahad
V 1704475354 55410574 3.3% 13.5%
89 - laevad, paadid ja ujuvkonstruktsioonid XVII 19299132 626548 3.2% 0.2%
19 - tooted teraviljast, jahust, tärklisest või piimast; valikpagaritooted
IV 71565579 2163083 3.0% 0.6%
79 - tsink ja tsinktooted XV 3552546 93307 2.6% 0.0%
32 - park- ja värvaineekstraktid; tanniinid ja nende derivaadid; värvained ja pigmendid; värvid ja lakid; kitt ja muud mastiksid; tint
VI 106228400 2457853 2.3% 0.8%

72
30 - farmaatsiatooted VI 318793354 7179797 2.3% 2.5%
86 - raudtee- või trammivedurid, -veerem ning nende osad; raudtee- või trammiteeseadmed ja -tarvikud ning nende osad; mitmesugused mehaanilised (sh elektromehaanilised) liikluskorradldusseadmed
XVII 40431008 898970 2.2% 0.3%
45 - kork ja korgist tooted IX 1086071 23562 2.2% 0.0%
17 - suhkur ja suhkrukondiitritooted IV 44692691 896719 2.0% 0.4%
31 - väetised VI 81837309 1324574 1.6% 0.6%
37 - foto- ja kinokaubad VI 4376784 61499 1.4% 0.0%
51 - lambavill ja muude loomade vill ning loomakarvad; hobusejõhvist lõng ja riie
XI 29496466 278476 0.9% 0.2%
2 - liha ja söödav rups I 83496788 654395 0.8% 0.7%
11 - jahvatustööstuse tooted; linnased; tärklis; inuliin; nisugluteen
II 20770229 85651 0.4% 0.2%
78 - plii ja pliitooted XV 1009432 3646 0.4% 0.0%
4 - piim ja piimatooted; linnumunad; naturaalne mesi; mujal nimetamata loomse päritoluga toiduained
I 68529322 7595 0.0% 0.5%
1 - elusloomad I 1550480 81 0.0% 0.0%
47 - kiumass puidust vm kiulisest tselluloosmaterjalist; ringlusse võetud paberi- või papijäätmed ja -jäägid
X 13622022 133 0.0% 0.1%
98 - täielik tööstuslik sisseseade XXII 0 0
Allikas: Statistikaameti andmebaas, tabel VK200: Kaupade eksport ja Import kaubakoodi (KN 4-kohaline kood) ja riigi järgi, autorite arvutused