Embed Size (px)
Citation preview
1
Effect of Flow Regime on Convective Heat Transfer in Porous Copper Manufactured by Lost
Carbonate Sintering
Xianke Lu and Yuyuan Zhao*
School of engineering, University of Liverpool, Liverpool L69 3GH, UK
Abstract
The fluid flow hydrodynamics and forced convective heat transfer in porous Cu samples
manufactured by the Lost Carbonate Sintering process, with pore size 425-710 μm and
porosities 0.6-0.8, have been investigated experimentally. Pressure drop and heat transfer
coefficient were measured for pore-based Reynolds numbers in the range of 0.5-380. Five flow
regimes, namely pre-Darcy, transition to Darcy, Darcy, transition to non-Darcy and non-Darcy,
were identified. The Reynolds numbers for the flow regime boundaries increased nearly
linearly with porosity. The permeability of the porous Cu samples increased and the form drag
coefficient decreased with increasing porosity. Both the friction factor and the heat transfer
coefficient depended strongly on the flow rate. The relationship between Nusselt number and
Reynolds number showed three sections, with each section fitting well with the correlation
𝑁𝑢 = 𝐶𝑇𝑅𝑒𝑛 with different CT and n values. The value of n was largely independent of
porosity, except at the lowest porosity. The flow regimes had a strong effect on the heat transfer
performance. The three sections of the Nusselt number vs Reynolds number curves broadly
corresponded to the pre-Darcy, Darcy and non-Darcy regimes.
Keywords: Porous metal, convective heat transfer, porous flow, flow regime, pressure drop.
*Corresponding author
Professor Yuyuan Zhao
School of Engineering
University of Liverpool
Liverpool L69 3GH
UK
Email: [email protected]
Tel.: +44 (0)151 794 4697
2
1. Introduction
Open cell porous metals show excellent heat transfer performance under forced convection
conditions due to their large specific surface area and good fluid flow permeability (Ashby et
al., 2000; Goodall and Mortensen, 2014; Thewsey and Zhao, 2008). They are regarded as
potential candidates for use in active cooling devices for high-rate heat dissipation, especially
when conventional passive cooling techniques are inadequate (Hetsroni et al., 2006). Pressure
drop and heat transfer coefficient are two key parameters for their use as heat exchangers (Diani
et al., 2015; Nie et al., 2017). Therefore, understanding the relationships between fluid flow
hydrodynamics and heat transfer in porous metals under forced convection is of great
significance for the development of new generation compact heat exchangers.
The relationship between pressure drop and flow velocity in porous media was firstly
correlated by Darcy (Bejan, 2013) based on experimental observations. He found that the cross-
sectional averaged velocity through a column of porous medium is proportional to the pressure
drop along the porous material and inversely proportional to the viscosity of the working fluid.
Darcy’s law is normally expressed as follows:
∆𝑃
𝐿= −
𝜇
𝐾𝑉
(1)
where ΔP is the pressure drop, L is the length of the sample, μ is the viscosity of the fluid, K is
the permeability of the porous medium, and V is the Darcian velocity, which is the volumetric
flow rate of the fluid divided by the cross-sectional area.
Unfortunately, Darcy’s law is only applicable to very slow moving flows in a quite narrow
Reynolds number range. Deviation from the Darcy law is observed when the Reynolds number
exceeds a certain value depending on the porous medium’s structure and characteristic length,
due to the effects of inertial force. Forchheimer (Forchheimer, 1901) reasoned that as the flow
velocity increases, form drag becomes more prevalent. He extended Darcy’s law and suggested
a nonlinear relationship between the pressure drop and fluid velocity to account for the form
drag effect after the Darcy regime:
∆𝑃
𝐿=
𝜇
𝐾𝑉 + 𝜌𝐶𝑉2
(2)
where ρ is the density of the working fluid and C is the form drag coefficient.
Dybbs and Edwards (Dybbs and Edwards, 1984) suggested a more detailed division of the
flow into Darcy, inertial flow, unsteady laminar flow and turbulent flow regimes. Bear (Bear,
1972) pointed out the existence of a pre-Darcy flow regime at the extremely low Reynolds
number range. It is now widely accepted that fluid flow in porous media can be divided into
3
four regimes: pre-Darcy, Darcy, Forchheimer and turbulent (Fand et al., 1987; Kececioglu and
Jiang, 1994). The Forchheimer and turbulent regimes are often jointly termed as non-Darcy
regime because the Forchheimer equation is applicable to both regimes.
The different flow behaviours in the porous media in different flow regimes can make a
great difference on the heat transfer performance (Lu et al., 2018). The Darcy regime is
characteristic of steady laminar flow dominated by the viscous force. The heat is transferred
from the near wall region to the non-near wall regions in the liquid phase through heat
conduction, which is less efficient. In the Forchheimer regime, the interaction between the fluid
flow and the uneven wall results in more efficient fluid mixing in the boundary layer (Dybbs
and Edwards, 1984), although flow is still laminar. In the turbulent regime, velocity distribution
across the pore/channel becomes more uniform because of the development of eddies and
vortices, and so does the temperature in the liquid phase. The uniformly dispersed heat in the
liquid phase leads to a greater temperature difference between the solid and liquid, which can
greatly enhance the heat transfer performance.
The relationship between convective heat transfer coefficient and flow velocity in porous
media is usually expressed in the form of empirical correlations between Nusselt (Nu) and
Reynolds (Re) numbers. The majority of the models developed to date, e.g., by Wakao et al.
(Wakao et al., 1979) and Hwang and Chao (Hwang and Chao, 1994), are for convective heat
transfer in packed beds in the form of
𝑁𝑢 = 𝐶1 + 𝐶2𝑅𝑒𝑛 (3)
where C1, C2 and n are parameters with either constant (Wakao et al., 1979) or variable (Hwang
and Chao, 1994) values. This correlation works well at high Re or for fully developed flow but
underestimates the heat transfer coefficient in other regimes.
Hunt and Tien (Hunt and Tien, 1988) experimentally investigated the forced convective heat
transfer in a fibrous metal foam in the non-Darcy flow regime and showed that Nu was directly
proportional to either the channel length based Re or the permeability based Re and that Nu
depends on the porosity, pore size and thermal conductivity of the porous sample. Calmidi and
Mahajan (Calmidi and Mahajan, 2000) showed that Nu in high porosity (0.89-0.97) metal
foams correlated well with pore size based Re as follows
𝑁𝑢 = 𝐶𝑇𝑅𝑒𝑛 (4)
where CT and n are empirical constants, varying in different Re ranges.
The porous media involved in the previous studies are largely limited to packed beds and
granular porous media with porosities in the range of 0.3 – 0.5 (Fand et al., 1987; Kececioglu
and Jiang, 1994) or metal foams consisting of inter-connected dodecahedral-like cells with
4
porosities higher than 0.85 (Boomsma and Poulikakos, 2002; Dukhan et al., 2014). Very little
research has been conducted on convective heat transfer in porous metals manufactured by
space holder methods, which have an intermediate porosity range of 0.5 - 0.8. In addition, the
Nu-Re relations investigated so far are limited to the non-Darcy flow regimes. A study covering
all flow regimes is necessary.
The Lost Carbonate Sintering (LCS) process (Zhao et al., 2005) is one of the space holder
methods used to manufacturing porous metals with highly controllable structures, including
porosity, pore size, and pore shape (Zhao and Zhang, 2008). The as-manufactured porous
copper can increase the convective heat transfer coefficient by 2-3 times compared with an
empty channel (Xiao and Zhao, 2013; Zhang et al., 2009). A recent study on the fluid flow in
transparent porous glass samples mimicking the porous structures of typical porous metals
manufactured by space holder methods, by micro-particle image velocimetry (μ-PIV), has
demonstrated the existence of laminar, transitional and turbulent flows and identified the flow
regimes as pre-Darcy, Darcy, Forchheimer and turbulent (Lu et al., 2018).
In this study, we investigated the fluid flow hydrodynamics and heat transfer performance
in porous copper samples with a series of porosities, manufactured by the LCS process. We
identified the flow regimes and the corresponding Re ranges and correlated the friction factor
with Re. We further measured the convective heat transfer coefficients in a wide Re range and
established the relationship between Nu and Re in different flow regimes. The work provides
some insightful understanding of the effect of flow regimes on convective heat transfer in
porous media with intermediate porosities, especially porous metals manufactured by space
holder methods.
2. Experimental
2.1 Preparation of porous copper samples
Five porous copper samples, with porosities of 0.64, 0.66, 0.71, 0.75 and 0.78, were
fabricated by the LCS process (Zhao et al., 2005). The raw materials used in fabricating the
samples were a commercially pure Cu powder (Ecka Granules Metal Powder Ltd, UK) with a
mean particle size of 70 μm and a food grade K2CO3 powder (E&E Ltd, Australia) with a
particle size range of 425 – 710 μm. The Cu and K2CO3 powders were mixed at a pre-specified
volume ratio according to the target porosity and then compacted into a preform under a
pressure of 200 MPa. The preform was first sintered at 800oC for 30 minutes to form
preliminary bonding between the Cu particles and then sintered at 950oC for 2 hours to
5
decompose the K2CO3 particles and form complete bonding between the Cu particles. The
sample was cooled to room temperature, resulting in an open-cell porous Cu sample with a
pore size of 425 – 710 μm and a fixed porosity. The dimensions of the samples for the pressure
drop and heat transfer coefficient measurements were 20305 mm3.
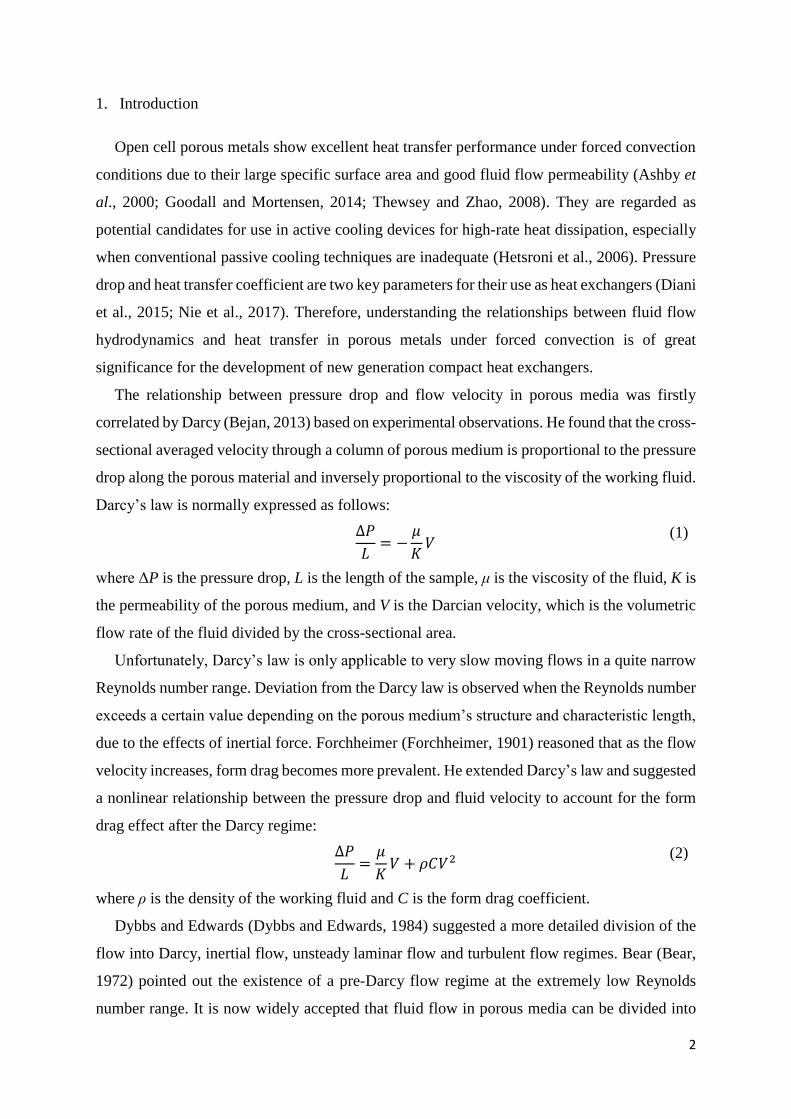
Fig. 1 shows typical SEM photographs of one of the porous copper samples at different
magnifications. The majority of the pores are nearly spherical and have a size range of 425 –
710 μm, which replicate the particles of the K2CO3 powder used. The pores are interconnected
by relatively large windows and small voids between the copper particles, allowing fluids, such
as water, to flow through the sample.
Fig. 1 SEM micrographs of an LCS porous copper sample showing representative features
2.2 Experimental setup
A purpose-built system was used for the heat transfer coefficient and pressure drop
measurements. The experimental apparatus consisted of a test section and various supporting
systems, as shown in Fig. 2. The working fluid used in this study was water. A very fine valve
and a volume flow meter (Fl50001A, Omega Engineering Ltd., UK) were used to control the
flow rate of water passing through the porous Cu sample. The volume flow rate was calibrated
for better accuracy by weighing the water flowing through the system in a fixed period of time.
The maximum pressure the flow control system could apply was 400 kPa. A heater control
system was used to supply electric power to the heaters and the heat flux to the test section was
6
varied by adjusting the voltage input. All the thermocouple and pressure transducer signals
were recorded by a data logging system.
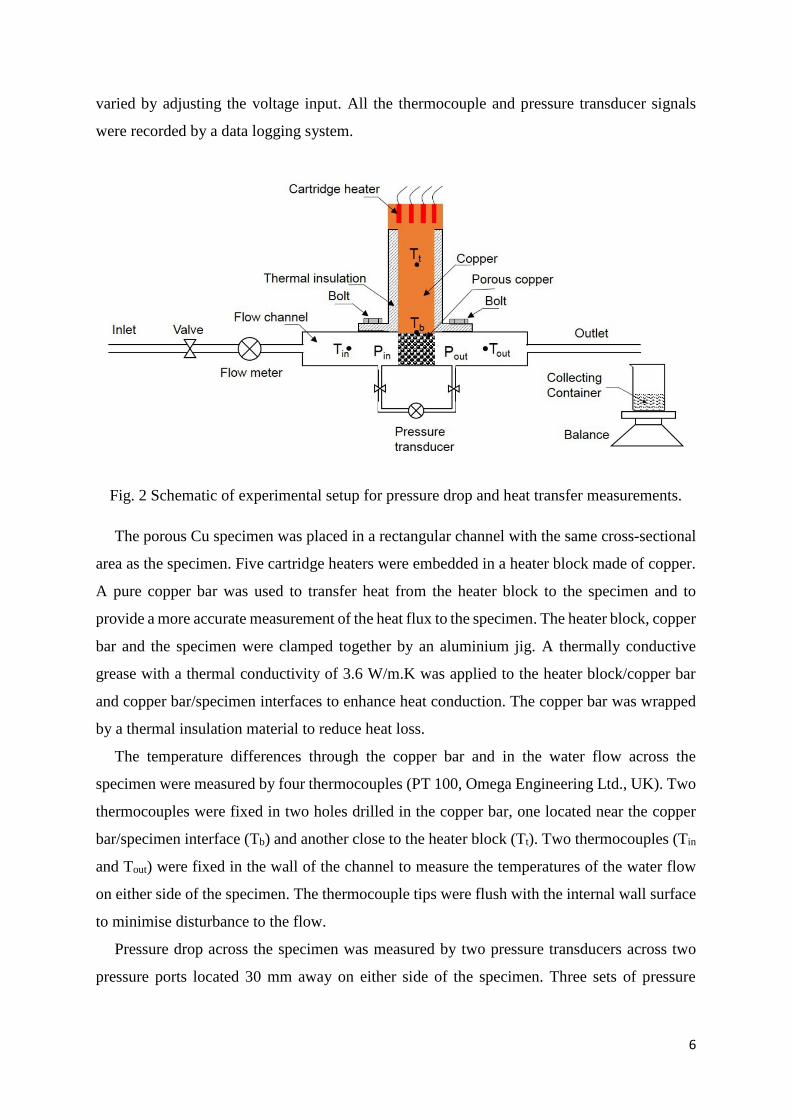
Fig. 2 Schematic of experimental setup for pressure drop and heat transfer measurements.
The porous Cu specimen was placed in a rectangular channel with the same cross-sectional
area as the specimen. Five cartridge heaters were embedded in a heater block made of copper.
A pure copper bar was used to transfer heat from the heater block to the specimen and to
provide a more accurate measurement of the heat flux to the specimen. The heater block, copper
bar and the specimen were clamped together by an aluminium jig. A thermally conductive
grease with a thermal conductivity of 3.6 W/m.K was applied to the heater block/copper bar
and copper bar/specimen interfaces to enhance heat conduction. The copper bar was wrapped
by a thermal insulation material to reduce heat loss.
The temperature differences through the copper bar and in the water flow across the
specimen were measured by four thermocouples (PT 100, Omega Engineering Ltd., UK). Two
thermocouples were fixed in two holes drilled in the copper bar, one located near the copper
bar/specimen interface (Tb) and another close to the heater block (Tt). Two thermocouples (Tin
and Tout) were fixed in the wall of the channel to measure the temperatures of the water flow
on either side of the specimen. The thermocouple tips were flush with the internal wall surface
to minimise disturbance to the flow.
Pressure drop across the specimen was measured by two pressure transducers across two
pressure ports located 30 mm away on either side of the specimen. Three sets of pressure
7
transducers (DP15, Validyne Engineering, USA) with different ranges (3.5 kPa, 22 kPa and
140 kPa) were used according to the pressure drop magnitudes.
2.3 Measurement and calculation procedures
In each experiment, the specimen was first placed in the flow channel, which was then sealed
by the heater assembly using eight bolts. Pressure drop and heat transfer coefficient were
measured separately due to different flow rate steps and different times to reach steady state.
Before each measurement, a high water flow rate (e.g., 1500 ml/min) was applied through the
specimen for 5 minutes to flush out any air bubbles inside the specimen.
In pressure drop measurement, the flow rate was varied from low to high in steps of 50 and
200 ml/min in the flow rate ranges of 50 – 1000 and 1000 – 3000 ml/min, respectively. For
each flow rate, 60 seconds was allowed for the flow to reach a steady state before recording
the pressure data. The pressure recording lasted about 60 seconds at a sampling rate of 100 Hz
and the mean value was used.
The heat transfer coefficient measurement was conducted immediately after the pressure
drop measurement. The flow rate was varied from low to high in steps of 10, 30 and 120 ml/min
in the flow rate ranges of 10 – 100, 100 – 300 and 300 – 3000 ml/min, respectively. Smaller
steps were used because heat transfer coefficient was very sensitive to flow rate, especially at
low flow rates. For each flow rate, the four temperatures (Tb, Tt, Tin and Tout) were recorded
when a steady state (temperature fluctuates < 0.1C) was reached after 45 – 60 minutes.
The heat flux supplied to the specimen was considered to be equal to the heat flux through
the copper bar by thermal conduction, if the heat loss from the copper bar is ignored, and was
calculated by:
𝐽 = 𝑘𝐶𝑢𝐴
(𝑇𝑡 − 𝑇𝑏)
𝑑
(5)
where kCu is the thermal conductivity of pure copper, A is the cross-sectional area of the copper
bar, Tt and Tb are temperatures of the top and bottom locations, and d is the distance between
Tt and Tb (110 mm).
The overall heat transfer coefficient of the cooling system, comprising the porous copper
and the fluid flow, was determined by
ℎ =
𝐽
𝐴(𝑇𝑏 − 𝑇𝑖𝑛)
(6)
where Tin is the water temperature in the inlet region.
8
The accuracies of the thermocouples, calliper and balance used to measure temperature,
dimension and mass were 0.01C, 0.01 mm and 0.01 g, respectively. The resultant uncertainties
of heat transfer coefficient and pressure drop were estimated to be 0.6% and 0.25%,
respectively, according to uncertainty analysis (Moffat, 1988).
3. Results and Discussion
3.1 Flow behaviour
3.1.1. Pressure drop
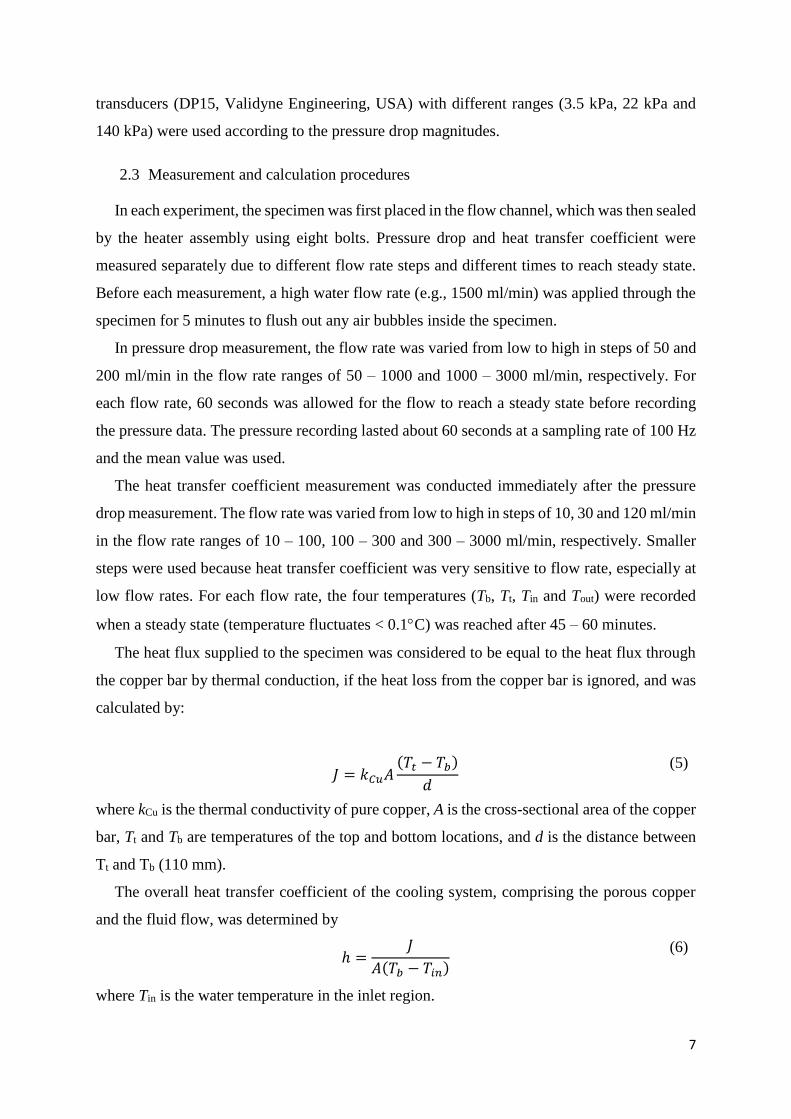
The relationship between the length-normalised pressure drop (ΔP/L) and the pore size
based Re for porous Cu samples with different porosities are shown in Fig. 3. The pore size
based Re was defined as:
𝑅𝑒 =
𝜌𝑉𝐷
𝜇
(7)
where ρ is the density of water, μ is the dynamic viscosity of water, D is average pore size of
the porous Cu samples (567.5 m) and V is Darcian velocity, which is the volume flow rate of
water divided by the cross-sectional area of the specimen. Fig. 3 shows that the relationship
between ΔP/L and Re is initially linear at low Re and becomes nonlinear at high Re. From the
ΔP/L - Re plots, however, it is difficult to identify the transition from the linear range to the
nonlinear range.
9
Fig. 3 Relationship between the length-normalised pressure drop and pore size based
Reynolds number for porous Cu samples with different porosities.
3.1.2. Flow regimes
The extended Darcy-Forchheimer equation (Eq. 2) can be expressed in terms of the
relationship between reduced pressure drop (ΔP/LV) and Re and rewritten as follows:
−
∆𝑃
𝐿𝑉=
𝜇
𝐾+
𝜇𝐶
𝐷𝑅𝑒
(8)
Flow regime identification can be made by observing the change in the slope of the ΔP/LV -
Re plot, or the value of C. The four flow regimes, pre-Darcy, Darcy, Forchheimer and turbulent,
correspond to C < 0, C = 0, C > 0 (higher magnitude) and C > 0 (lower magnitude).
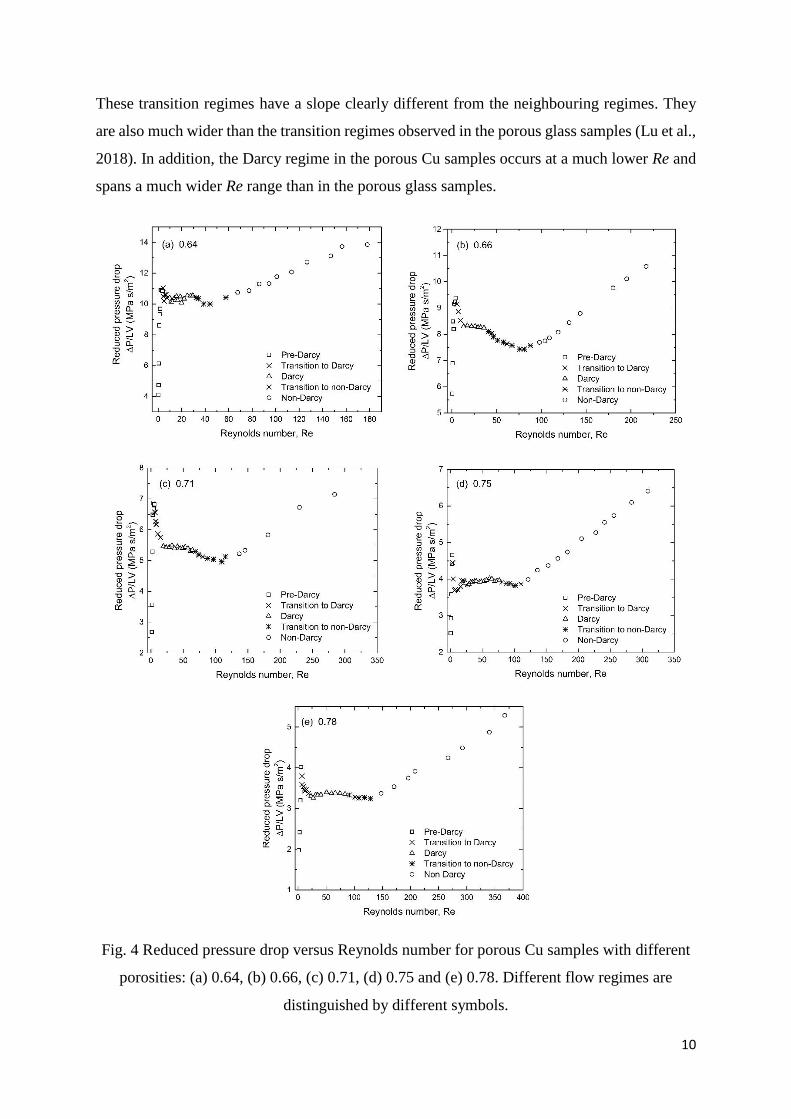
Fig. 4 plots ΔP/LV against Re for the porous Cu samples with different porosities. Five
different flow regimes can be identified: (i) pre-Darcy, (ii) transition to Darcy, (iii) Darcy, (iv)
transition to non-Darcy and (v) non-Darcy. The flow behaviour is similar to that reported in a
previous study (Lu et al., 2018) on porous glass samples with similar porous structure as the
LCS porous Cu samples. However, there are several differences between the porous Cu and
the porous glass samples in terms of flow regimes. The flow in the porous glass samples
showed four well-defined flow regimes: pre-Darcy, Darcy, Forchheimer and turbulent (Lu et
al., 2018). The slope difference between the Forchheimer regime and the turbulent regime in
the porous Cu samples is quite small. Therefore, these two flow regimes are combined and
designated as non-Darcy regime in the current analysis. Fig. 4 shows that there are extended
transitions from pre-Darcy to Darcy and from Darcy to non-Darcy in the porous Cu samples.
10
These transition regimes have a slope clearly different from the neighbouring regimes. They
are also much wider than the transition regimes observed in the porous glass samples (Lu et al.,
2018). In addition, the Darcy regime in the porous Cu samples occurs at a much lower Re and
spans a much wider Re range than in the porous glass samples.
Fig. 4 Reduced pressure drop versus Reynolds number for porous Cu samples with different
porosities: (a) 0.64, (b) 0.66, (c) 0.71, (d) 0.75 and (e) 0.78. Different flow regimes are
distinguished by different symbols.
11
A pre-Darcy regime is observed in all porous Cu samples at low Re (< 10). In the pre-Darcy
regime, fluid velocity increases more rapidly than the increase in pressure gradient. Very
limited information is available in the literature to explain this deviation from the Darcy
linearity. One mechanism proposed by Polubarinova-Koch (Polubarinova-Koch, 2015) to
explain the pre-Darcy regime is that water has a polar molecule which tends to orient itself in
an electrostatic field. Static water molecules can become oriented around pore surface, forming
a quasi-crystalline structure that effectively narrows the pores. As an increasing pressure
gradient is applied to the water in the porous medium, the weak inter-molecular bonds are
progressively overcome. In effect, the water flow channels in the porous medium are widened.
The permeability of the porous medium therefore increases with water velocity until the quasi-
crystalline water structure is all broken down and Darcy linearity is reached. Some researchers
(Fand et al., 1987; Swartzendruber, 1962) attributed the existence of the pre-Darcy regime to
non-Newtonian behaviour of fluids.
A Darcy regime is evident in all porous Cu samples. Darcy regime is also called creeping
flow regime as the flow is dominated by viscous forces. A purely viscous Darcy regime is
identified by a horizontal line in Fig. 4, i.e., a constant ΔP/LV value, which signifies a zero
value of the second term on the right hand side of Eq. 8 and the applicability of the Darcy
equation (Eq. 1). It is observed that increasing porosity leads to a later onset of Darcy regime
and a wider Darcy regime.
The non-Darcy flow regime in the porous Cu samples includes the Forchheimer and
turbulent regimes, which are not clearly distinguishable. As the fluid velocity increases beyond
the Darcy regime, deviation from the Darcian relationship occurs. In the early stage of the
Forchheimer regime, the flow within this type of porous media remains steady and laminar (Lu
et al., 2018). However, kinetic energy degradation begins due to pore constrictions and changes
in the flow direction around the solid phase. As a consequence, both viscous and inertial drags
contribute to the flow energy consumption. According to the study of Dybbs and Edwards
(Dybbs and Edwards, 1984), in Forchheimer flow regime, the boundary layer begins to develop
and becomes more pronounced as the flow rate increases, resulting in the formation of an
“inertial core”. The non-linear relationship between pressure drop and flow rate results from
these core flows outside the boundary layer. The interactions between the inertial and viscous
effects lead to the deformation of the streamlines, thereby creating the non-Darcy flow regime.
As the velocity increases further to a higher value, the inertial effect becomes more dominant
and the flow enters into the turbulent regime.
12
3.1.3. Effect of porosity
It is observed in Fig. 3 that the pressure drop in the porous Cu samples depends strongly on the
porosity of the samples. The pressure drop across the sample decreases with increasing porosity
due to the lower fraction of solid matrix impeding the fluid flow and the lower tortuosity (Diao
et al., 2017).
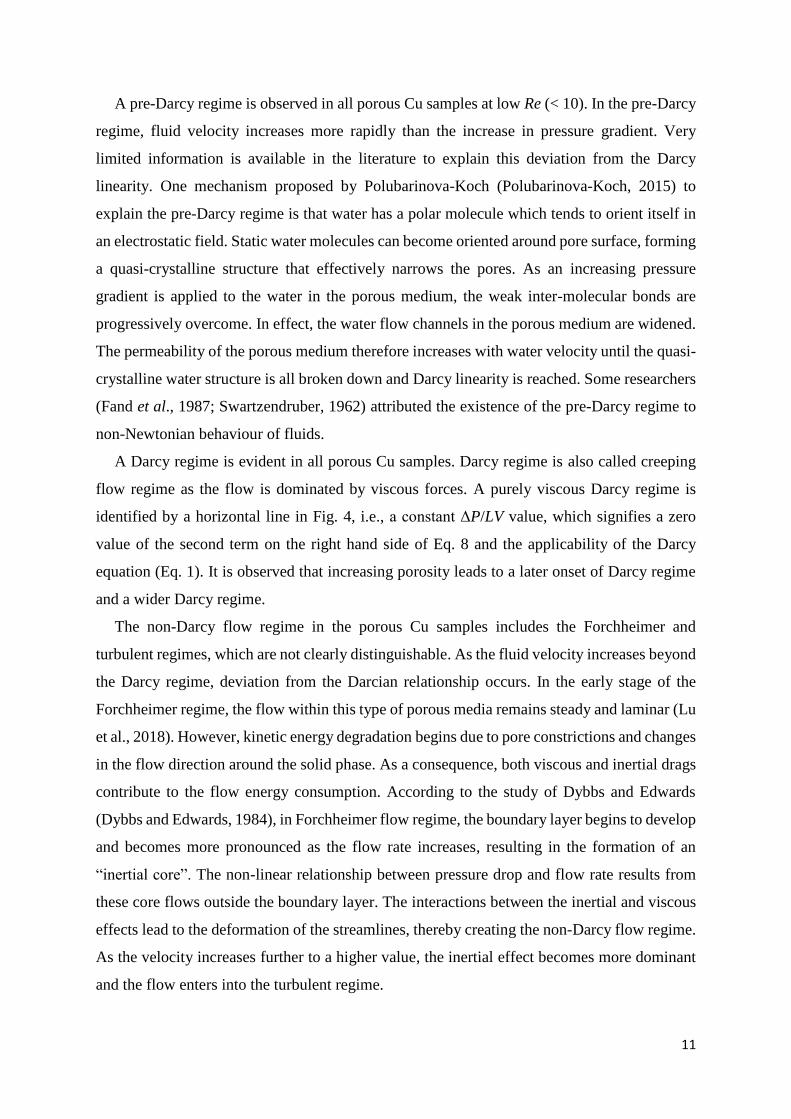
Fig. 5 shows the permeability (K) and form drag coefficient (C) as a function of porosity of
the porous Cu samples. The permeability for the Darcy regime was obtained by fitting the
experimental data within the Darcy regime to the Darcy equation (Eq. 1), while the
permeability and from drag coefficient for the non-Darcy regime were obtained by fitting the
experimental data within the non-Darcy regime to the extended Darcy-Forchheimer equation
(Eq. 2). Fig. 5 shows that increasing porosity leads to dramatic increase in permeability and
dramatic decrease in form drag coefficient. For the porous Cu sample, the permeability in the
Darcy regime is approximately one third lower than the permeability in the non-Darcy regime.
Fig. 5 Relationships of (a) permeability (K) and (b) from drag coefficient (C) with porosity in
porous copper samples.
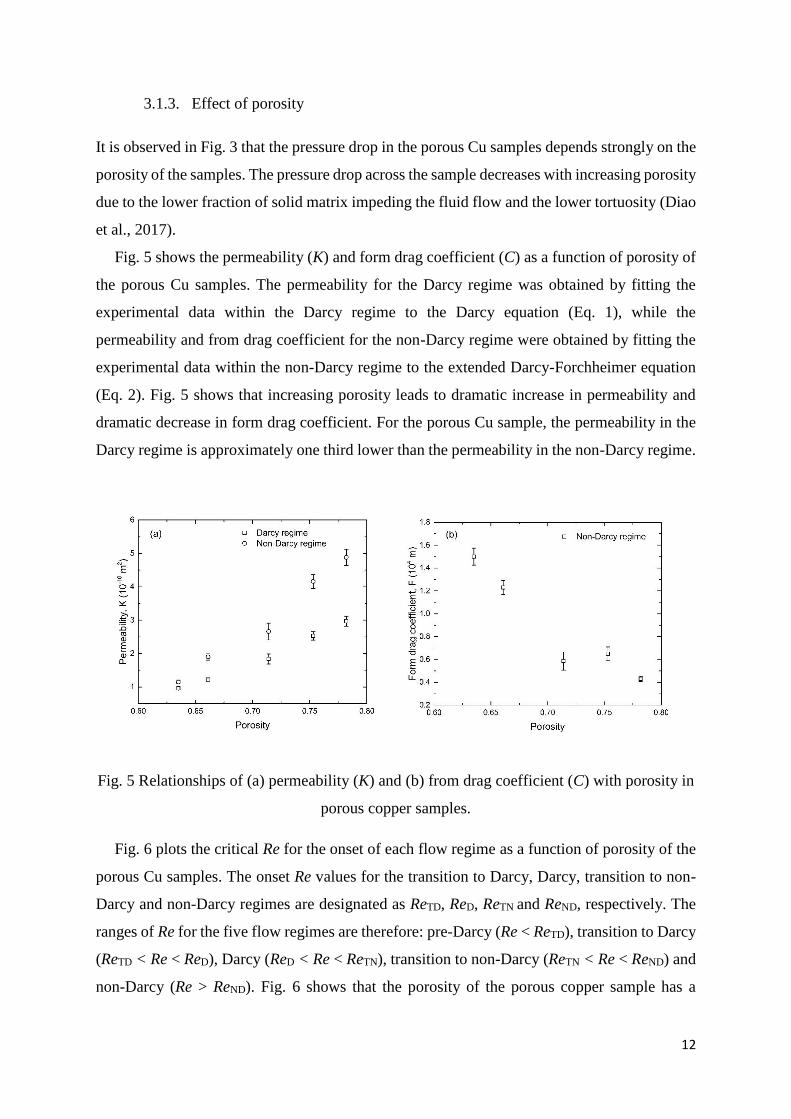
Fig. 6 plots the critical Re for the onset of each flow regime as a function of porosity of the
porous Cu samples. The onset Re values for the transition to Darcy, Darcy, transition to non-
Darcy and non-Darcy regimes are designated as ReTD, ReD, ReTN and ReND, respectively. The
ranges of Re for the five flow regimes are therefore: pre-Darcy (Re < ReTD), transition to Darcy
(ReTD < Re < ReD), Darcy (ReD < Re < ReTN), transition to non-Darcy (ReTN < Re < ReND) and
non-Darcy (Re > ReND). Fig. 6 shows that the porosity of the porous copper sample has a
13
significant effect on the onset and range of the flow regimes. The onset Re for each regime
increases nearly linearly with porosity. For example, non-Darcy flow starts at ReND = 65 in the
sample with a porosity of 0.64 and is delayed at a higher onset value of ReND = 150 in the
sample with a porosity of 0.78. The Re range for each regime also becomes wider with
increasing porosity, especially markedly for the Darcy regime. The higher permeability and
lower form drag coefficient for high porosity samples are likely the cause of the increased
critical Re values, or the delayed transitions.
Fig. 6 Relationship between critical Reynolds numbers and porosity of the porous Cu
samples.
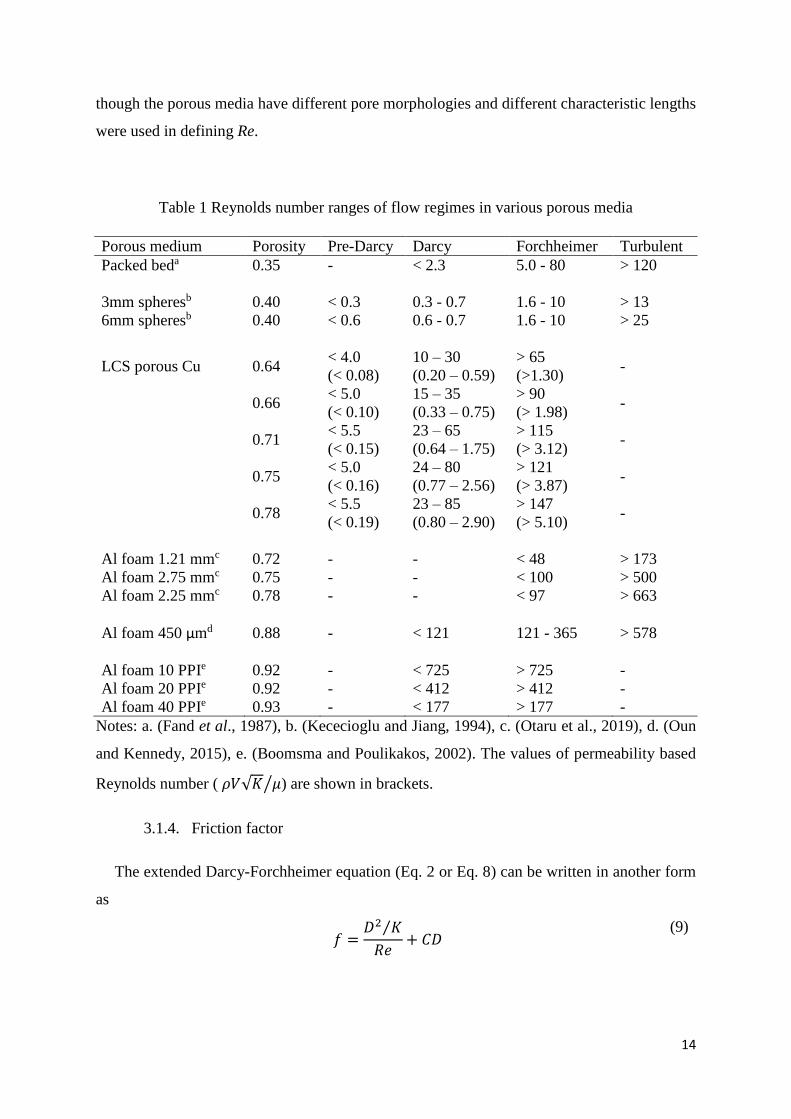
Table 1 compares the flow regime bounds of the porous Cu samples with several porous
media reported in the literature. Critical Reynolds number values are not always available for
all the regime bounds in the literature. For example, Otaru et al. (2019) provided the bounds
between Darcy, Forchheimer and turbulent regimes, while Boomsma and Poulikakos (2002)
provided the bounds between pre-Darcy, Darcy and Forchheimer regimes. Since the
experimental data on the flow regime bounds for porous metals is relatively limited,
experimental data for packed sphere beds are also included for comparison. Table 1 shows that
the flow regime bounds differ significantly among these porous media. However, a general
trend can be observed that the onset Re for each flow regime increases with porosity, even
14
though the porous media have different pore morphologies and different characteristic lengths
were used in defining Re.
Table 1 Reynolds number ranges of flow regimes in various porous media
Porous medium Porosity Pre-Darcy Darcy Forchheimer Turbulent
Packed beda 0.35 - < 2.3 5.0 - 80 > 120
3mm spheresb 0.40 < 0.3 0.3 - 0.7 1.6 - 10 > 13
6mm spheresb 0.40 < 0.6 0.6 - 0.7 1.6 - 10 > 25
LCS porous Cu 0.64 < 4.0
(< 0.08)
10 – 30
(0.20 – 0.59)
> 65
(>1.30) -
0.66 < 5.0
(< 0.10)
15 – 35
(0.33 – 0.75)
> 90
(> 1.98) -
0.71 < 5.5
(< 0.15)
23 – 65
(0.64 – 1.75)
> 115
(> 3.12) -
0.75 < 5.0
(< 0.16)
24 – 80
(0.77 – 2.56)
> 121
(> 3.87) -
0.78 < 5.5
(< 0.19)
23 – 85
(0.80 – 2.90)
> 147
(> 5.10) -
Al foam 1.21 mmc 0.72 - - < 48 > 173
Al foam 2.75 mmc 0.75 - - < 100 > 500
Al foam 2.25 mmc 0.78 - - < 97 > 663
Al foam 450 μmd 0.88 - < 121 121 - 365 > 578
Al foam 10 PPIe 0.92 - < 725 > 725 -
Al foam 20 PPIe 0.92 - < 412 > 412 -
Al foam 40 PPIe 0.93 - < 177 > 177 -
Notes: a. (Fand et al., 1987), b. (Kececioglu and Jiang, 1994), c. (Otaru et al., 2019), d. (Oun
and Kennedy, 2015), e. (Boomsma and Poulikakos, 2002). The values of permeability based
Reynolds number ( 𝜌𝑉√𝐾 𝜇⁄ ) are shown in brackets.
3.1.4. Friction factor
The extended Darcy-Forchheimer equation (Eq. 2 or Eq. 8) can be written in another form
as
𝑓 =
𝐷2 𝐾⁄
𝑅𝑒+ 𝐶𝐷
(9)
15
where 𝑓 =∆𝑃
𝐿∙
𝐷
𝜌𝑉2 is defined as friction factor. The dimensionless friction factor is therefore
expected to be a function of the pore size based Re, as well as the pore size, permeability and
form drag coefficient of the porous Cu sample.
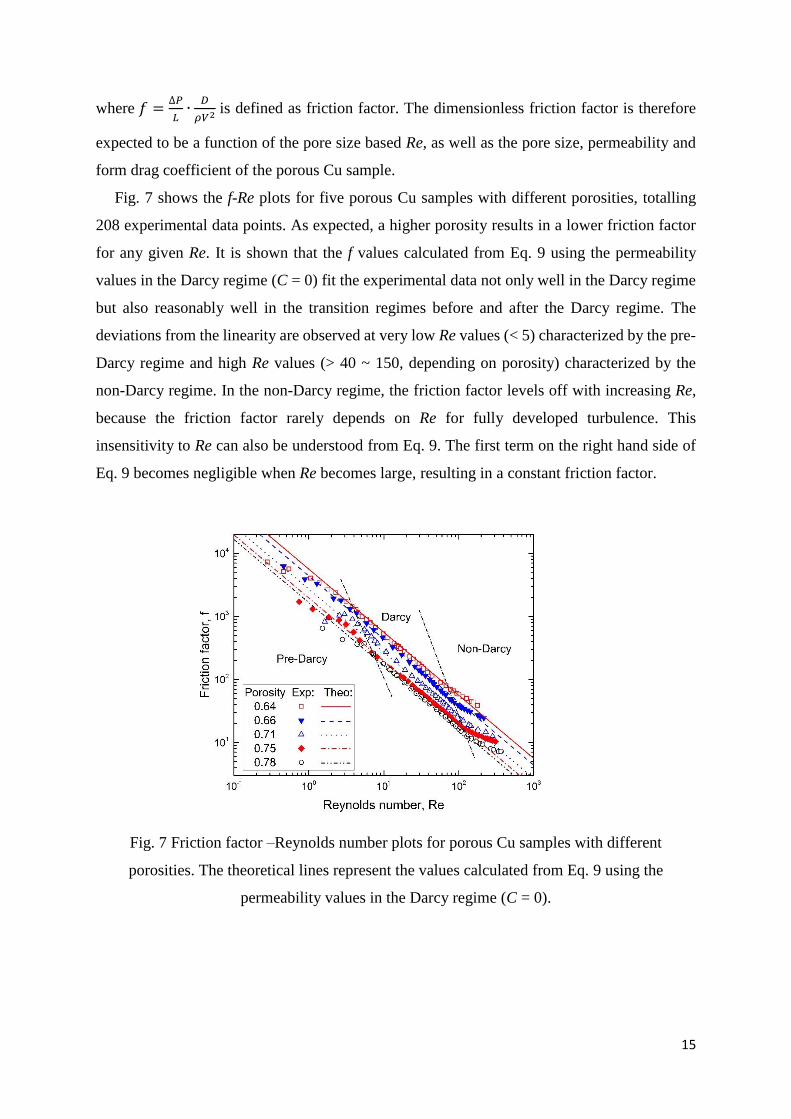
Fig. 7 shows the f-Re plots for five porous Cu samples with different porosities, totalling
208 experimental data points. As expected, a higher porosity results in a lower friction factor
for any given Re. It is shown that the f values calculated from Eq. 9 using the permeability
values in the Darcy regime (C = 0) fit the experimental data not only well in the Darcy regime
but also reasonably well in the transition regimes before and after the Darcy regime. The
deviations from the linearity are observed at very low Re values (< 5) characterized by the pre-
Darcy regime and high Re values (> 40 ~ 150, depending on porosity) characterized by the
non-Darcy regime. In the non-Darcy regime, the friction factor levels off with increasing Re,
because the friction factor rarely depends on Re for fully developed turbulence. This
insensitivity to Re can also be understood from Eq. 9. The first term on the right hand side of
Eq. 9 becomes negligible when Re becomes large, resulting in a constant friction factor.
Fig. 7 Friction factor –Reynolds number plots for porous Cu samples with different
porosities. The theoretical lines represent the values calculated from Eq. 9 using the
permeability values in the Darcy regime (C = 0).
16
3.2 Heat transfer performance
3.2.1. Heat transfer coefficient
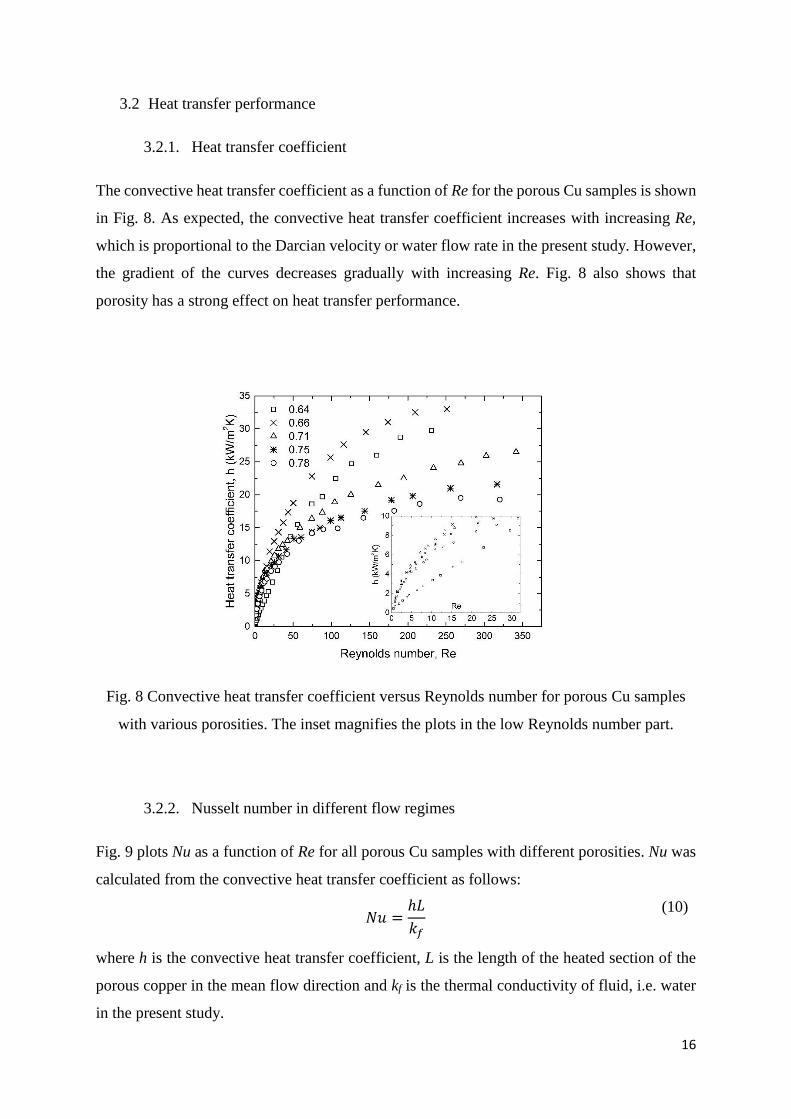
The convective heat transfer coefficient as a function of Re for the porous Cu samples is shown
in Fig. 8. As expected, the convective heat transfer coefficient increases with increasing Re,
which is proportional to the Darcian velocity or water flow rate in the present study. However,
the gradient of the curves decreases gradually with increasing Re. Fig. 8 also shows that
porosity has a strong effect on heat transfer performance.
Fig. 8 Convective heat transfer coefficient versus Reynolds number for porous Cu samples
with various porosities. The inset magnifies the plots in the low Reynolds number part.
3.2.2. Nusselt number in different flow regimes
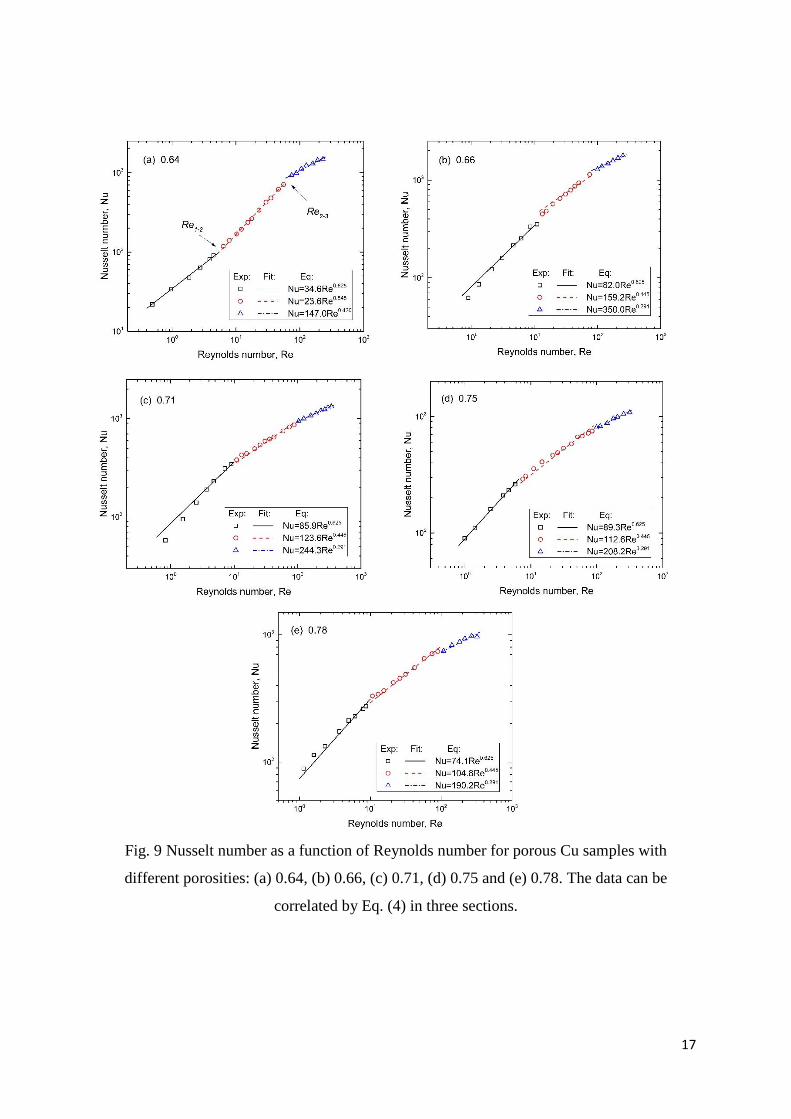
Fig. 9 plots Nu as a function of Re for all porous Cu samples with different porosities. Nu was
calculated from the convective heat transfer coefficient as follows:
𝑁𝑢 =
ℎ𝐿
𝑘𝑓
(10)
where h is the convective heat transfer coefficient, L is the length of the heated section of the
porous copper in the mean flow direction and kf is the thermal conductivity of fluid, i.e. water
in the present study.
17
Fig. 9 Nusselt number as a function of Reynolds number for porous Cu samples with
different porosities: (a) 0.64, (b) 0.66, (c) 0.71, (d) 0.75 and (e) 0.78. The data can be
correlated by Eq. (4) in three sections.
18
Fig. 9 shows that each plot can be divided into three sections, with each section fitting well
with Eq. (4). The slope of the fitted lines, i.e. the exponent n (Table 2), decreases from the first
section (low Re) to the second section (medium Re) and further to the third section (high Re),
except the sample with a porosity of 0.64, in which n increases from the first section to the
second section. Although the three sections for each plot have different relations, the value of
the exponent n for each section tends to be a constant for all porous Cu samples except the one
with a porosity of 0.64. In other words, n is largely independent of porosity, except at the
relatively low porosity of 0.64.
Table 2 Exponent n values for different sections of Nu – Re plots.
Porosity First section
(low Re)
Second section
(medium Re)
Third section
(high Re)
0.64 0.625 0.848 0.430
0.66, 0.71, 0.75 and 0.78 0.625 0.445 0.291
The value of n depends not only on the flow state (flow regime) but also on the porous
structure. In packed beds, the reported values of n were 0.6 (Wakao et al., 1979) and 1.35 (Re
< 100) and 1.04 (Re > 100) (Hwang and Chao, 1994), depending on the particle sizes used. In
sintered fibrous media, the value was found to be 1 (Hunt and Tien, 1988). In high porosity
metal foams, the value was 0.5 (Calmidi and Mahajan, 2000). In comparison, the LCS porous
Cu has n values ranging from 0.29 to 0.85, depending mainly on flow regime.
3.2.3. Effect of porosity
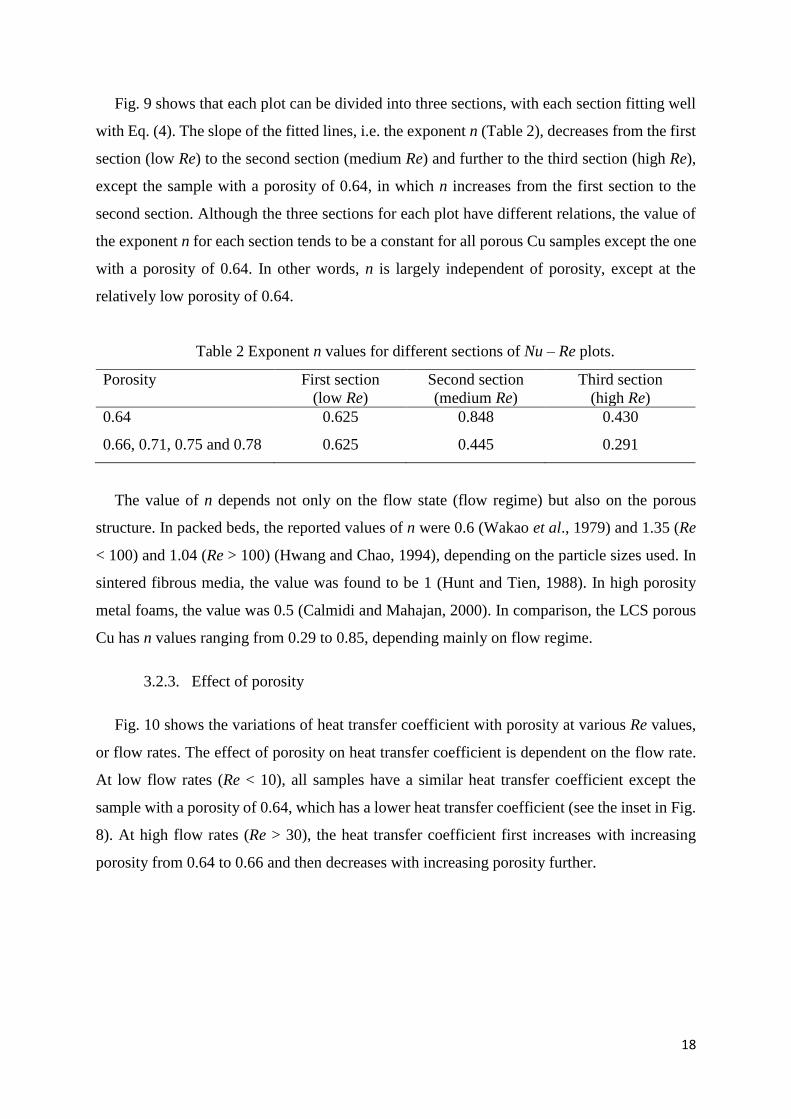
Fig. 10 shows the variations of heat transfer coefficient with porosity at various Re values,
or flow rates. The effect of porosity on heat transfer coefficient is dependent on the flow rate.
At low flow rates (Re < 10), all samples have a similar heat transfer coefficient except the
sample with a porosity of 0.64, which has a lower heat transfer coefficient (see the inset in Fig.
8). At high flow rates (Re > 30), the heat transfer coefficient first increases with increasing
porosity from 0.64 to 0.66 and then decreases with increasing porosity further.
19
Fig. 10 Convective heat transfer coefficient versus porosity at various Reynolds numbers.
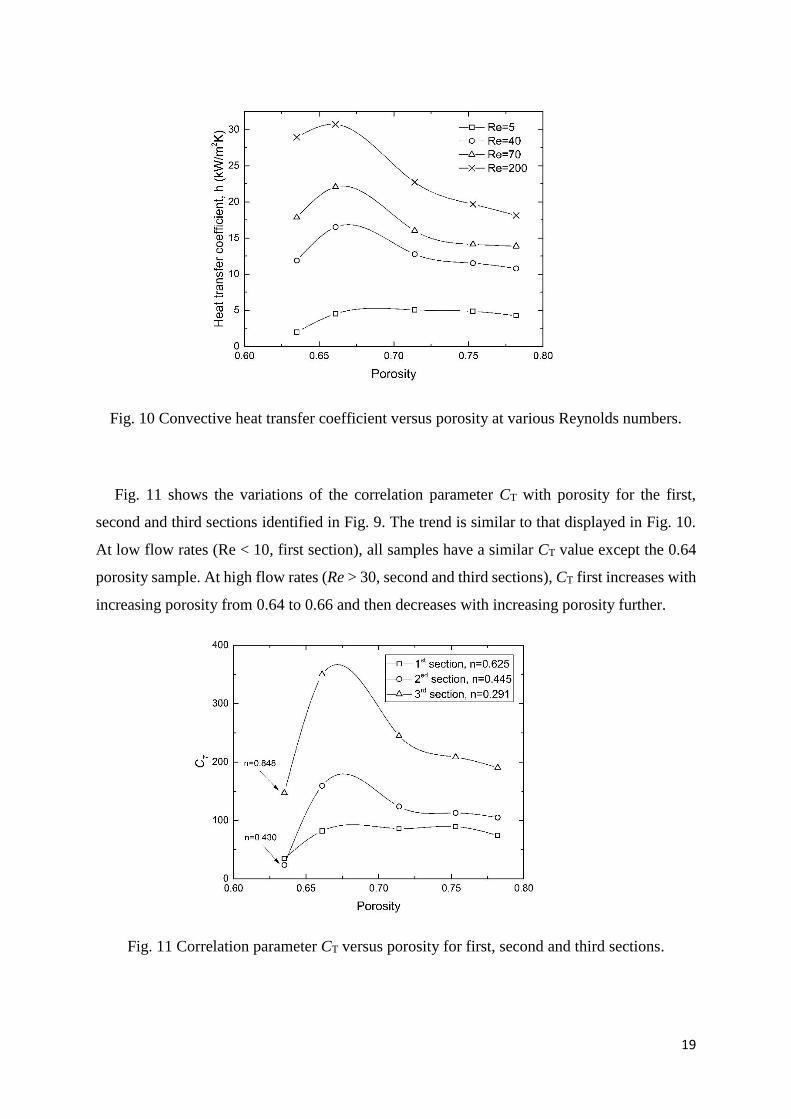
Fig. 11 shows the variations of the correlation parameter CT with porosity for the first,
second and third sections identified in Fig. 9. The trend is similar to that displayed in Fig. 10.
At low flow rates (Re < 10, first section), all samples have a similar CT value except the 0.64
porosity sample. At high flow rates (Re > 30, second and third sections), CT first increases with
increasing porosity from 0.64 to 0.66 and then decreases with increasing porosity further.
Fig. 11 Correlation parameter CT versus porosity for first, second and third sections.
20
The effect of porosity on heat transfer coefficient or Nu can be understood by considering
heat conduction through the solid matrix and heat convection in the fluid flow. Either
conduction or convection can be the main factor limiting the overall heat transfer. Conduction
is largely determined by porosity, with the thermal conductivity approximately proportional to
(1 − 𝜀)2 according to (Ashby et al., 2000; Thewsey and Zhao, 2008). Convection is not only
dependent on porosity, e.g., related to 𝜀/(1 − 𝜀) in packed beds (Walker and Glover, 2010),
but also affected by flow rate. The heat transfer performance depends on the coupled effect of
porosity and flow rate.
At very low flow rates (Re < 10), the convective heat transfer at the solid-fluid interface
would be the limiting factor. Increasing porosity can increase convection through the fluid,
because of the increased amount of fluid, and therefore can increase overall heat transfer in the
porous media. However, the heat transfer from the near wall layer to the centre core within the
fluid flow is mainly through conduction because of no wakes or vortices to help transfer heat.
Therefore, increasing porosity beyond a certain level has no major influence on the convective
heat transfer.
At high flow rates (Re > 10), either conduction in the solid matrix or convection in the fluid
flow can be the limiting factor. The samples with a low porosity have a superior thermal
conductivity due to the high proportion of solid matrix (Thewsey and Zhao, 2008). However,
they have low internal surface area and low fluid permeability (Diao et al., 2015), which reduce
the convective heat transfer from the solid to the coolant. The overall heat transfer coefficient
or Nu is limited by the convection contribution and can be low. Conversely, although the
samples with a high porosity have good convective heat transfer from the solid to the coolant
and by the moving coolant, they have poor thermal conductivity, which limits the overall heat
transfer. As thermal conductivity decreases exponentially with porosity, the overall heat
transfer coefficient or Nu decreases rapidly with porosity.
Figs. 10 and 11 suggest that the optimum porosity to give the best heat transfer performance
is 0.66 in the current research. At this critical porosity, heat conduction through the solid matrix
matches heat convection in the fluid flow, resulting in the best overall heat transfer performance.
3.2.4. Critical Reynolds numbers
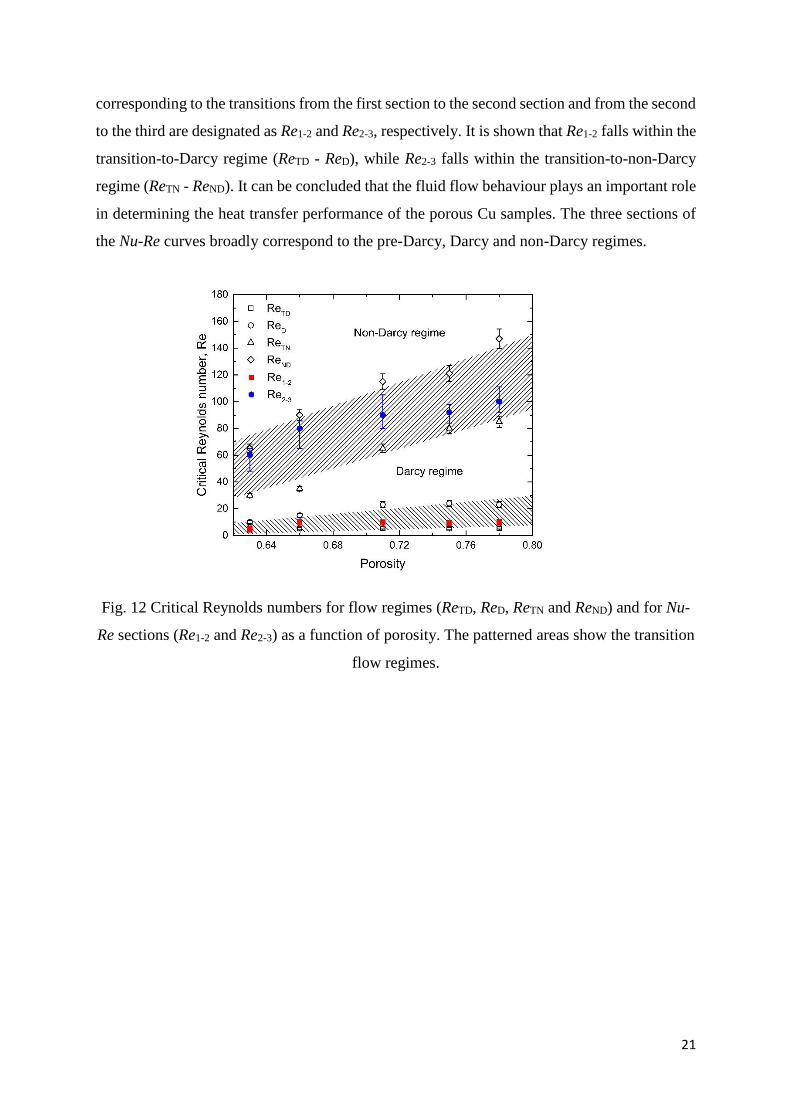
Fig. 12 shows the values of the critical Re for the flow regimes and for the three sections of
the Nu-Re curve identified in Fig. 9, as a function of porosity. The critical Re values
21
corresponding to the transitions from the first section to the second section and from the second
to the third are designated as Re1-2 and Re2-3, respectively. It is shown that Re1-2 falls within the
transition-to-Darcy regime (ReTD - ReD), while Re2-3 falls within the transition-to-non-Darcy
regime (ReTN - ReND). It can be concluded that the fluid flow behaviour plays an important role
in determining the heat transfer performance of the porous Cu samples. The three sections of
the Nu-Re curves broadly correspond to the pre-Darcy, Darcy and non-Darcy regimes.
Fig. 12 Critical Reynolds numbers for flow regimes (ReTD, ReD, ReTN and ReND) and for Nu-
Re sections (Re1-2 and Re2-3) as a function of porosity. The patterned areas show the transition
flow regimes.
22
4. Conclusions
1) Five flow regimes, namely pre-Darcy, transition to Darcy, Darcy, transition to non-Darcy
and non-Darcy, have been identified from the ∆𝑃 𝐿𝑉 − 𝑅𝑒⁄ plots. The Re values for the
flow regime boundaries increased nearly linearly with porosity.
2) The permeability increased and form drag coefficient decreased with increasing porosity of
the porous Cu samples. The friction factor decreased dramatically with flow rate.
3) The heat transfer coefficient of the porous Cu samples depended strongly on the flow rate.
The Nu-Re curves had three sections, with each followed the correlation 𝑁𝑢 = 𝐶𝑇𝑅𝑒𝑛 with
different CT and n values. The value of n was largely independent of porosity, except at the
relatively low porosity of 0.64.
4) The flow regimes had a strong effect on the heat transfer performance. The three sections
of the Nu-Re curves broadly corresponded to the pre-Darcy, Darcy and non-Darcy regimes.
Acknowledgment
This work has been supported by the Engineering and Physical Sciences Research Council
(Grant No. EP/N006550/1). X. K. Lu would like to thank the University of Liverpool and the
Chinese Scholarship Council for a PhD studentship.
23
Nomenclature
A cross-sectional area of the sample (m2)
C form drag coefficient (m)
C1, C2, CT constants
D average pore size (m)
d distance (m)
F form drag coefficient
f friction factor
h heat transfer coefficient (kW/m2 K)
J heat flux (W)
K permeability (m2)
kCu thermal conductivity of copper (W/m K)
kf thermal conductivity of water (W/m K)
L length of sample (m)
Lc length of channel (m)
Nu Nusselt number
n exponent
Re Reynolds number
ReTD onset of transition to Darcy regime
ReD onset of Darcy regime
ReTN onset of transition to non-Darcy regime
ReN onset of non-Darcy regime
Tb temperature of copper bar, bottom (K)
Tt temperature of copper bar, top (K)
Tin temperature of inlet water (K)
Tout temperature of outlet water(K)
V Darcian velocity (m/s)
Greek symbols
ΔP pressure drop (kPa)
μ fluid viscosity (Pa s)
ρ fluid density (kg/m3)
24
References
Ashby, M.F., Evans, T., Fleck, N.A., Hutchinson, J., Wadley, H., Gibson, L., 2000. Metal foams: a design guide. Elsevier. Bear, J., 1972. Dynamics of fluids in porous media–American Elsevier pub. Comp., inc. New York, 764p. Bejan, A., 2013. Convection heat transfer. John wiley & sons. Boomsma, K., Poulikakos, D., 2002. The effects of compression and pore size variations on the liquid flow characteristics in metal foams. Journal of fluids engineering 124, 263-272. Calmidi, V., Mahajan, R., 2000. Forced convection in high porosity metal foams. Journal of heat transfer 122, 557-565. Diani, A., Bodla, K.K., Rossetto, L., Garimella, S.V., 2015. Numerical investigation of pressure drop and heat transfer through reconstructed metal foams and comparison against experiments. International Journal of Heat and Mass Transfer 88, 508-515. Diao, K., Zhang, L., Zhao, Y., 2017. Measurement of tortuosity of porous Cu using a diffusion diaphragm cell. Measurement 110, 335-338. Diao, K.K., Xiao, Z., Zhao, Y.Y., 2015. Specific surface areas of porous Cu manufactured by Lost Carbonate Sintering: Measurements by quantitative stereology and cyclic voltammetry. Materials Chemistry and Physics 162, 571-579. Dukhan, N., Bağcı, Ö., Özdemir, M., 2014. Metal foam hydrodynamics: Flow regimes from pre-Darcy to turbulent. International Journal of Heat and Mass Transfer 77, 114-123. Dybbs, A., Edwards, R.V., 1984. A New Look at Porous Media Fluid Mechanics — Darcy to Turbulent, in: Bear, J., Corapcioglu, M.Y. (Eds.), Fundamentals of Transport Phenomena in Porous Media. Springer Netherlands, Dordrecht, pp. 199-256. Fand, R., Kim, B., Lam, A., Phan, R., 1987. Resistance to the flow of fluids through simple and complex porous media whose matrices are composed of randomly packed spheres. J. Fluids Eng 109, 268-274. Forchheimer, P., 1901. Wasserbewegung durch boden. Z. Ver. Deutsch, Ing. 45, 1782-1788. Goodall, R., Mortensen, A., 2014. 24 - Porous Metals, in: Laughlin, D.E., Hono, K. (Eds.), Physical Metallurgy (Fifth Edition). Elsevier, Oxford, pp. 2399-2595. Hetsroni, G., Gurevich, M., Rozenblit, R., 2006. Sintered porous medium heat sink for cooling of high-power mini-devices. International Journal of Heat and Fluid Flow 27, 259-266. Hunt, M.L., Tien, C.L., 1988. Effects of thermal dispersion on forced convection in fibrous media. International Journal of Heat and Mass Transfer 31, 301-309. Hwang, G., Chao, C., 1994. Heat transfer measurement and analysis for sintered porous channels. Journal of heat transfer 116, 456-464. Kececioglu, I., Jiang, Y., 1994. Flow through porous media of packed spheres saturated with water. J. Fluids Eng 116, 164-170. Lu, X., Zhao, Y., Dennis, D.J.C., 2018. Flow measurements in microporous media using micro-particle image velocimetry. Physical Review Fluids 3, 104202. Moffat, R.J., 1988. Describing the uncertainties in experimental results. Experimental Thermal and Fluid Science 1, 3-17. Nie, Z., Lin, Y., Tong, Q., 2017. Numerical investigation of pressure drop and heat transfer through open cell foams with 3D Laguerre-Voronoi model. International Journal of Heat and Mass Transfer 113, 819-839. Otaru, A., Morvan, H., Kennedy, A., 2019. Airflow measurement across negatively infiltration processed porous aluminum structures. AIChE Journal 65, 1355-1364. Oun, H., Kennedy, A., 2015. Tailoring the pressure-drop in multi-layered open-cell porous inconel structures. Journal of Porous Materials 22, 1627-1633. Polubarinova-Koch, P.I., 2015. Theory of ground water movement. Princeton University Press.
25
Swartzendruber, D., 1962. Non‐Darcy flow behavior in liquid‐saturated porous media. Journal of Geophysical Research 67, 5205-5213. Thewsey, D.J., Zhao, Y.Y., 2008. Thermal conductivity of porous copper manufactured by the lost carbonate sintering process. physica status solidi (a) 205, 1126-1131. Wakao, N., Kaguei, S., Funazkri, T., 1979. Effect of fluid dispersion coefficients on particle-to-fluid heat transfer coefficients in packed beds: Correlation of nusselt numbers. Chemical Engineering Science 34, 325-336. Walker, E., Glover, P.W., 2010. Permeability models of porous media: Characteristic length scales, scaling constants and time-dependent electrokinetic coupling. Geophysics 75, 235-246. Xiao, Z., Zhao, Y., 2013. Heat transfer coefficient of porous copper with homogeneous and hybrid structures in active cooling. Journal of Materials Research 28, 2545-2553. Zhang, L., Mullen, D., Lynn, K., Zhao, Y., 2009. Heat Transfer Performance of Porous Copper Fabricated by Lost Carbonate Sintering Process. MRS Online Proceedings Library Archive 1188. Zhao, Y.Y., Fung, T., Zhang, L.P., Zhang, F.L., 2005. Lost carbonate sintering process for manufacturing metal foams. Scripta Materialia 52, 295-298. Zhao, Y.Y., Zhang, L.P., 2008. Fabrication of high melting-point porous metals by lost carbonate sintering process via decomposition route. Proceedings of the Institution of Mechanical Engineers, Part B: Journal of Engineering Manufacture 222, 267-271.