Embed Size (px)
Citation preview
Effect of Pulling Rate on Bubbles Distribution in Sapphire CrystalsGrown by the Micropulling Down (μ-PD) TechniqueE. A. Ghezal,† H. Li,† A. Nehari,‡ G. Alombert-Goget,† A. Brenier,† K. Lebbou,*,† M. F. Joubert,†
and M. T. Soltani#
†Universite de Lyon, Universite Lyon 1, CNRS, UMR5620, Laboratoire de Physico-Chimie des Materiaux Luminescents, F-69622Villeurbanne Cedex, France‡RSA le rubis SA, BP 16, 38560 Jarrie/Grenoble, France#Laboratoire de Chimie Appliquee, Equipe: Verres et Materiaux Photoniques, Universite Mohamed Khider de Biskra, Biskra, Algeria
ABSTRACT: Bubbles defects have been always observed in sapphirecrystals. Their distribution and size are strongly dependent on thegrowth conditions. We have studied the effect of the pulling rate on thebubbles' size and their distribution in sapphire rods grown by themicropulling down (μ-PD) technique. Using a central circular capillarydie of shape factor 0.33, the bubbles' diameter decreased as a functionof the pulling rate. The transmission decreased at a pulling rate greaterthan 1 mm/min.
I. INTRODUCTIONBecause of their excellent properties, sapphire crystals (α-Al2O3) remain a strategic material for a large range of civil andmilitary applications. They have a high refractive index, transmitlight from the ultraviolet to 3−5 μm infrared region, and havevery good thermal conductivity, tensile strength, and thermalshock resistance.1−4 Because of their chemical stability andresistance to corrosion at high temperature, sapphire crystalsare applied as an envelope in high pressure gas-discharge lampsthat use a discharge in alkali-metal vapor.5 Sapphire crystalsdoped by Ti3+ and Cr3+ are excellent laser materials.6−8 Theyare used as substrate materials in blue, green, ultraviolet, andwhite light-emitting diodes (LED).9 Chemical simplicity andcongruent melting allowed sapphire crystal growth by differenttechnologies including Czochralski (Cz), Kyropoulos (KY),heat exchanger method (HEM), edge defined film fed growth(EFG), and micropulling down (μ-PD).10−14 In spite ofsapphire properties and the progress in crystal growthtechnology, it is difficult to shape sapphire because of its highhardness and crystallographic anisotropy related to itshexagonal crystal structure. Therefore, the optimization ofcontrolled crystal growth process and development of newtechnologies are necessary in order to increase the crystal sizes(production yield), improve the quality, and reduce the cost(crystals and alumina raw materials).Regarding shaped sapphire crystals grown from the melt,
bubbles are one of the major defects.15−17 One of the reasonsfor bubble formation is the thermal dissociation of the liquidallowing liberation of diluted gases. This problem is not yetresolved and not completely understood. The main aim of thispaper is to study the bubbles' propagation in shaped sapphirerod crystals grown by the micropulling down (μ-PD) method
as a function of the pulling rate. The bubbles' dimensions,behaviors, and direct effect on the optical properties arediscussed here in some detail. In addition, growth phenomenaobserved in sapphire crystal grown by the μ-PD technique andthe crystals' characterization are reported.
II. EXPERIMENTAL PROCEDURESSapphire-shaped crystals have been grown by the μ-PD technique.18
The initial raw material was alumina (α-Al2O3) powder of sphericalgeometry, micrometer-scale dimensions, and the structure correspond-ing to JSPDS File No. 46-1212. A radio frequency (RF) heated μ-PDsystem has been used to pull the crystals. The alumina powder wasmelted in an iridium crucible, and thereafter the melt was pulled downcontinuously through a capillary channel made at the bottom of thecrucible. The die used had cylindrical geometry of 3 mm in diameter.The liquid flowed through the channel of 1 mm in diameter. Thediameter (ϕ) and the height (h) of the capillary die were stronglydependent on the liquid proprieties following the Jurin law (h = (4σ)/(ϕρg)), where σ is superficial tension, ρ is liquid density, and g isgravitational acceleration. Iridium after heater and alumina ceramicinsulation installed around the hot zone have been used to controlthermal gradients and to visualize the melt meniscus and the growingcrystal with a CCD camera. Table 1 summarizes the experimentalparameters used in this study. The crystals were grown in argonatmosphere (2 L/min) to protect the crucible from oxidation anddamage. The temperature distribution in the melt and the capillary diewas measured by an Ircon pyrometer. Seed of orientation ⟨0001⟩ hasbeen dipped into the melt at the bottom of the crucible in the capillarychannel, and the melt temperature was adjusted to obtain the desired
Received: May 1, 2012Revised: June 18, 2012Published: June 21, 2012
Article
pubs.acs.org/crystal
© 2012 American Chemical Society 4098 dx.doi.org/10.1021/cg300589h | Cryst. Growth Des. 2012, 12, 4098−4103
meniscus shape. The seed was pulled down continuously with a pullingrate ranging from 0.25 to 3 mm/min.
III. RESULTSIII-1. Crystal Growth. Different pulling rates have been
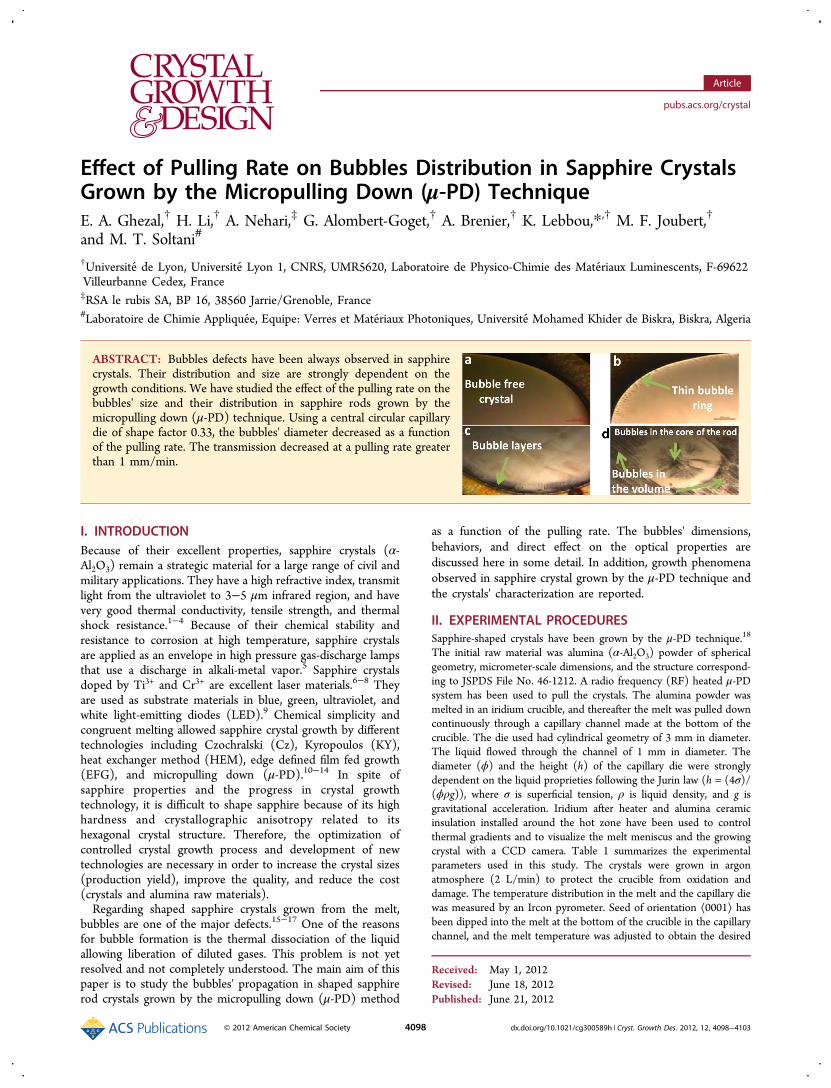
used, and their effect on the crystal quality and meniscus lengthhas been inspected. In all growths, 100% of the melt wassolidified into the rods. The meniscus shape and length as wellas the grown sapphire rod diameter were affected by the melthigh and the pulling rate. The shape observed by the CCDcamera was symmetric, but for low pulling rate (v ≤ 1 mm/min), the wetting line at the melt die junction was not clearlydetected which made it difficult to resolve the CCD image.Figure 1 shows the relationship between the meniscus lengthand the pulling rate. With increasing the pulling rate, themeniscus length also increased due to greater release of the heatof solidification that resulted in smaller rod diameter. Accordingto Figure 1, the measured meniscus height varied between 100μm ± 10 (v = 0.5 mm/min) and 1000 μm ± 10 μm (v = 2.5mm/min). When the solid rod started to grow, the solid-ification interface was fed with the melt passed through thecentral channel of the capillary die. Behavior of the capillary dieis characterized by the Reynolds numbers (Recap) in thecapillary channel and Reynolds number in the meniscus(Remen). The flow Reynolds number ranged from 10.6 ×10⁻¹² to 1.02 × 10⁻⁶ depending on the pulling rate. Because ofthe low fluid speed and the low growth rate, the liquid flow wascharacterized by a low Reynolds number giving a laminar liquidflow. Figure 2 shows the as-grown rods as a function of pullingrate. The crystals were transparent and colorless. Nomodification of the melt composition resulting in a second-phase formation was detected during the growth experiments.The best rod cross-section uniformity was obtained in crystalgrown with the diameter close to the diameter of the capillarydie at low pulling rate (V ≤ 1.5 mm/min). The length of thecrystals was up to 500 mm depending on the quantity of thestarting raw materials. The best reproducibility of the growthresults was found at a pulling rate ≤ 1 mm/min. Thetransparency of the crystals slightly decreased when the pullingrate was greater than 2 mm/min. At the rates above 3.5 mm/min, it was difficult to produce crystals under stationary stableregime, and the rods are opaque (Figure 3). In a such case, thecrystallization interface was strongly perturbed, and instabilityoccurred preferentially at a regions of maximum curvature of
Table 1
properties parameters
alumina powder (α) JSPDS File No. 46-1212 (a = 4.7570 Å,c = 12.9898 Å)
melting temperature (°C) 2050 ± 10outer radius of the die (mm) 1.5capillary channel radius(mm)
0.5
shape factor (Rhole/Rcapillary die)
0.33
meniscus length (h) (μm) 60−1000 (depending on pulling rate)pulling rate (mm/min) 0.25−3solid density (g/cm3) 3.97melt density (g/cm3) 3.06Reynolds (Recap) capillarydie
Recap = (ρRcap)Vcap/μ
Reynolds (Remen) meniscus Remen = (ρhmeniscus)Vh/μμ dynamic viscosity (kg m−1
s−1)3 × 10⁻²
Figure 1. Meniscus length evolution as a function of the pulling rate(V). (a) v = 0.75 mm/min, (b) v = 1.5 mm/min, and (c) v = 2 mm/min.
Figure 2. View of the as-grown sapphire rods as a function of thepulling rate.
Figure 3. Sapphire rod grown with high pulling rate (v = 3 mm/min).
Crystal Growth & Design Article
dx.doi.org/10.1021/cg300589h | Cryst. Growth Des. 2012, 12, 4098−41034099
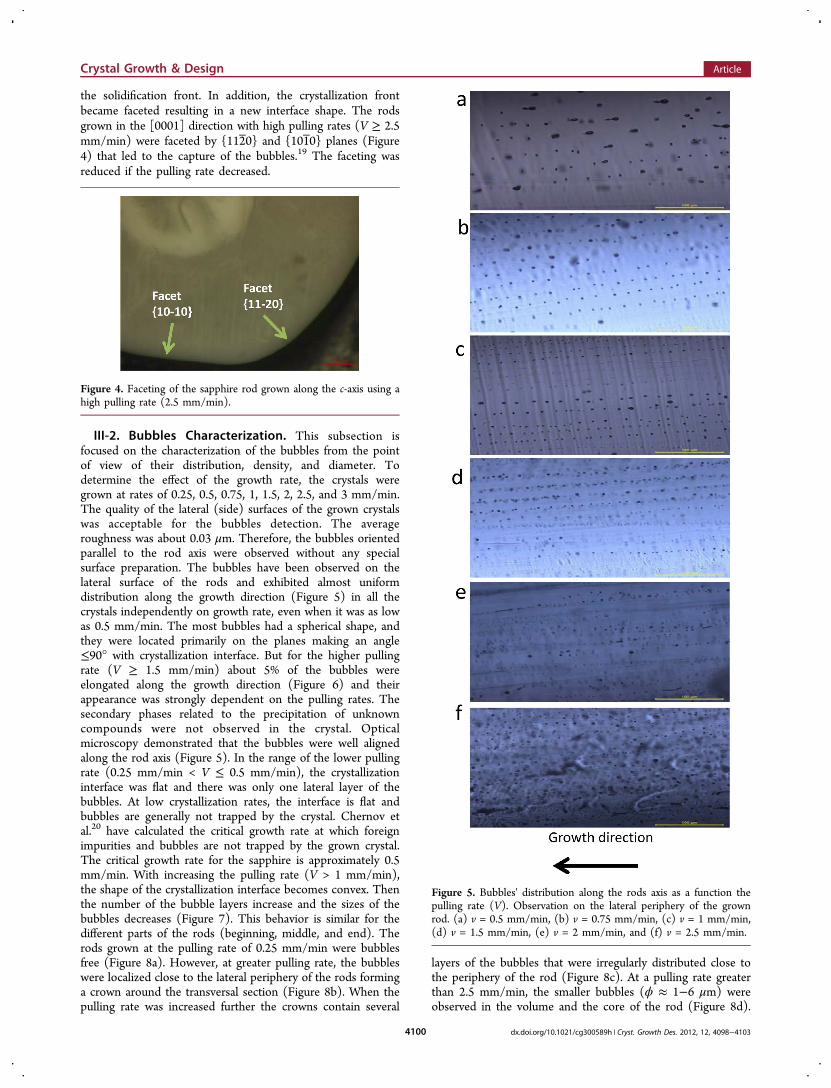
the solidification front. In addition, the crystallization frontbecame faceted resulting in a new interface shape. The rodsgrown in the [0001] direction with high pulling rates (V ≥ 2.5mm/min) were faceted by {112 0} and {1010} planes (Figure4) that led to the capture of the bubbles.19 The faceting wasreduced if the pulling rate decreased.
III-2. Bubbles Characterization. This subsection isfocused on the characterization of the bubbles from the pointof view of their distribution, density, and diameter. Todetermine the effect of the growth rate, the crystals weregrown at rates of 0.25, 0.5, 0.75, 1, 1.5, 2, 2.5, and 3 mm/min.The quality of the lateral (side) surfaces of the grown crystalswas acceptable for the bubbles detection. The averageroughness was about 0.03 μm. Therefore, the bubbles orientedparallel to the rod axis were observed without any specialsurface preparation. The bubbles have been observed on thelateral surface of the rods and exhibited almost uniformdistribution along the growth direction (Figure 5) in all thecrystals independently on growth rate, even when it was as lowas 0.5 mm/min. The most bubbles had a spherical shape, andthey were located primarily on the planes making an angle≤90° with crystallization interface. But for the higher pullingrate (V ≥ 1.5 mm/min) about 5% of the bubbles wereelongated along the growth direction (Figure 6) and theirappearance was strongly dependent on the pulling rates. Thesecondary phases related to the precipitation of unknowncompounds were not observed in the crystal. Opticalmicroscopy demonstrated that the bubbles were well alignedalong the rod axis (Figure 5). In the range of the lower pullingrate (0.25 mm/min < V ≤ 0.5 mm/min), the crystallizationinterface was flat and there was only one lateral layer of thebubbles. At low crystallization rates, the interface is flat andbubbles are generally not trapped by the crystal. Chernov etal.20 have calculated the critical growth rate at which foreignimpurities and bubbles are not trapped by the grown crystal.The critical growth rate for the sapphire is approximately 0.5mm/min. With increasing the pulling rate (V > 1 mm/min),the shape of the crystallization interface becomes convex. Thenthe number of the bubble layers increase and the sizes of thebubbles decreases (Figure 7). This behavior is similar for thedifferent parts of the rods (beginning, middle, and end). Therods grown at the pulling rate of 0.25 mm/min were bubblesfree (Figure 8a). However, at greater pulling rate, the bubbleswere localized close to the lateral periphery of the rods forminga crown around the transversal section (Figure 8b). When thepulling rate was increased further the crowns contain several
layers of the bubbles that were irregularly distributed close tothe periphery of the rod (Figure 8c). At a pulling rate greaterthan 2.5 mm/min, the smaller bubbles (ϕ ≈ 1−6 μm) wereobserved in the volume and the core of the rod (Figure 8d).
Figure 4. Faceting of the sapphire rod grown along the c-axis using ahigh pulling rate (2.5 mm/min).
Figure 5. Bubbles' distribution along the rods axis as a function thepulling rate (V). Observation on the lateral periphery of the grownrod. (a) v = 0.5 mm/min, (b) v = 0.75 mm/min, (c) v = 1 mm/min,(d) v = 1.5 mm/min, (e) v = 2 mm/min, and (f) v = 2.5 mm/min.
Crystal Growth & Design Article
dx.doi.org/10.1021/cg300589h | Cryst. Growth Des. 2012, 12, 4098−41034100
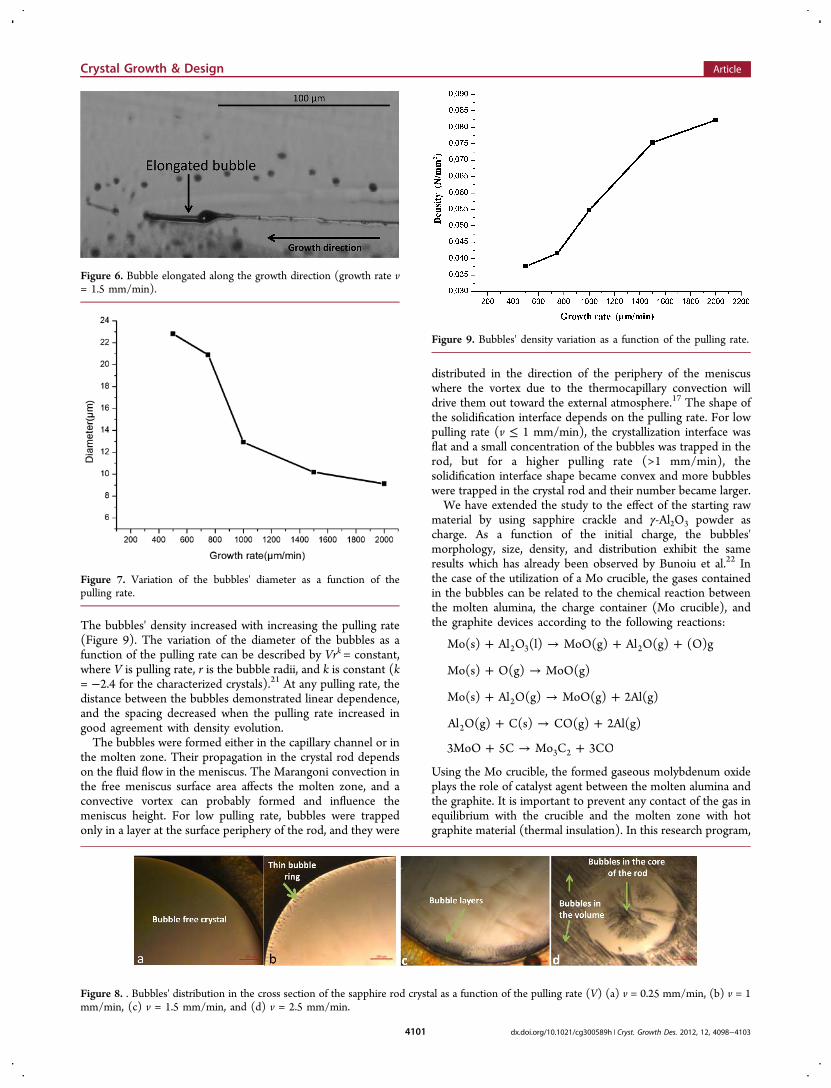
The bubbles' density increased with increasing the pulling rate(Figure 9). The variation of the diameter of the bubbles as afunction of the pulling rate can be described by Vrk = constant,where V is pulling rate, r is the bubble radii, and k is constant (k= −2.4 for the characterized crystals).21 At any pulling rate, thedistance between the bubbles demonstrated linear dependence,and the spacing decreased when the pulling rate increased ingood agreement with density evolution.The bubbles were formed either in the capillary channel or in
the molten zone. Their propagation in the crystal rod dependson the fluid flow in the meniscus. The Marangoni convection inthe free meniscus surface area affects the molten zone, and aconvective vortex can probably formed and influence themeniscus height. For low pulling rate, bubbles were trappedonly in a layer at the surface periphery of the rod, and they were
distributed in the direction of the periphery of the meniscuswhere the vortex due to the thermocapillary convection willdrive them out toward the external atmosphere.17 The shape ofthe solidification interface depends on the pulling rate. For lowpulling rate (v ≤ 1 mm/min), the crystallization interface wasflat and a small concentration of the bubbles was trapped in therod, but for a higher pulling rate (>1 mm/min), thesolidification interface shape became convex and more bubbleswere trapped in the crystal rod and their number became larger.We have extended the study to the effect of the starting raw
material by using sapphire crackle and γ-Al2O3 powder ascharge. As a function of the initial charge, the bubbles'morphology, size, density, and distribution exhibit the sameresults which has already been observed by Bunoiu et al.22 Inthe case of the utilization of a Mo crucible, the gases containedin the bubbles can be related to the chemical reaction betweenthe molten alumina, the charge container (Mo crucible), andthe graphite devices according to the following reactions:
+ → + +Mo(s) Al O (l) MoO(g) Al O(g) (O)g2 3 2
+ →Mo(s) O(g) MoO(g)
+ → +Mo(s) Al O(g) MoO(g) 2Al(g)2
+ → +Al O(g) C(s) CO(g) 2Al(g)2
+ → +3MoO 5C Mo C 3CO3 2
Using the Mo crucible, the formed gaseous molybdenum oxideplays the role of catalyst agent between the molten alumina andthe graphite. It is important to prevent any contact of the gas inequilibrium with the crucible and the molten zone with hotgraphite material (thermal insulation). In this research program,
Figure 6. Bubble elongated along the growth direction (growth rate v= 1.5 mm/min).
Figure 7. Variation of the bubbles' diameter as a function of thepulling rate.
Figure 8. . Bubbles' distribution in the cross section of the sapphire rod crystal as a function of the pulling rate (V) (a) v = 0.25 mm/min, (b) v = 1mm/min, (c) v = 1.5 mm/min, and (d) v = 2.5 mm/min.
Figure 9. Bubbles' density variation as a function of the pulling rate.
Crystal Growth & Design Article
dx.doi.org/10.1021/cg300589h | Cryst. Growth Des. 2012, 12, 4098−41034101
we have used an iridium crucible and high purity argon gasatmosphere to overcome the reaction cited below. But thecomposition of aluminum oxide melt strongly depends on thetemperature in the crucible and the molten zone. At low meltoverheating (T < 2100 °C),23,24 the following dissociationreactions were observed:
→ +Al O AlO AlO2 3 2
→ +2Al O Al 3AlO2 3 2
At more significant overheating (T ≈ 2100 °C) the followingreactions may be possible:
→ +AlO AlO 0.5O2 2
→ +Al O Al O 0.5O2 3 2 2 2
→ +Al O Al O O2 3 2 2
→ +Al O AlO Al2
But at very high overheating (T > 2150 °C) the followingreactions can be also possible
→ +Al O 2Al 3/2O2 3 2
→ +AlO Al 0.5O2
→ +AlO Al O2 2
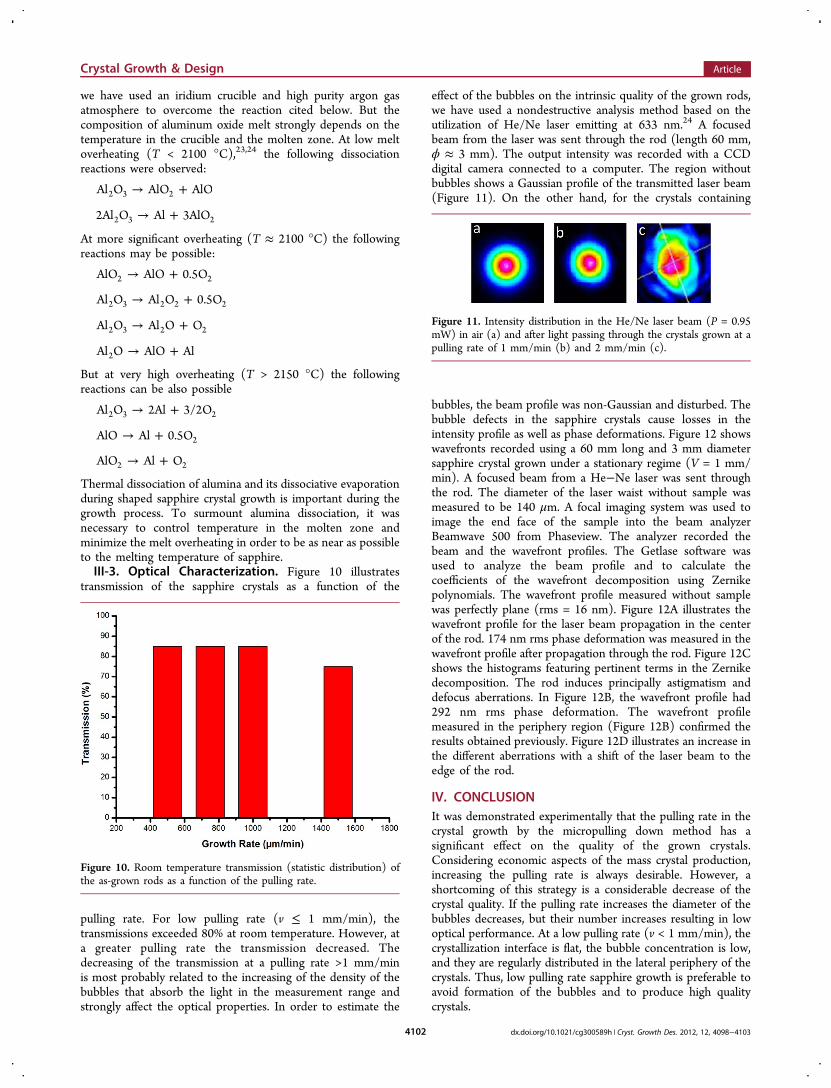
Thermal dissociation of alumina and its dissociative evaporationduring shaped sapphire crystal growth is important during thegrowth process. To surmount alumina dissociation, it wasnecessary to control temperature in the molten zone andminimize the melt overheating in order to be as near as possibleto the melting temperature of sapphire.III-3. Optical Characterization. Figure 10 illustrates
transmission of the sapphire crystals as a function of the
pulling rate. For low pulling rate (v ≤ 1 mm/min), thetransmissions exceeded 80% at room temperature. However, ata greater pulling rate the transmission decreased. Thedecreasing of the transmission at a pulling rate >1 mm/minis most probably related to the increasing of the density of thebubbles that absorb the light in the measurement range andstrongly affect the optical properties. In order to estimate the
effect of the bubbles on the intrinsic quality of the grown rods,we have used a nondestructive analysis method based on theutilization of He/Ne laser emitting at 633 nm.24 A focusedbeam from the laser was sent through the rod (length 60 mm,ϕ ≈ 3 mm). The output intensity was recorded with a CCDdigital camera connected to a computer. The region withoutbubbles shows a Gaussian profile of the transmitted laser beam(Figure 11). On the other hand, for the crystals containing
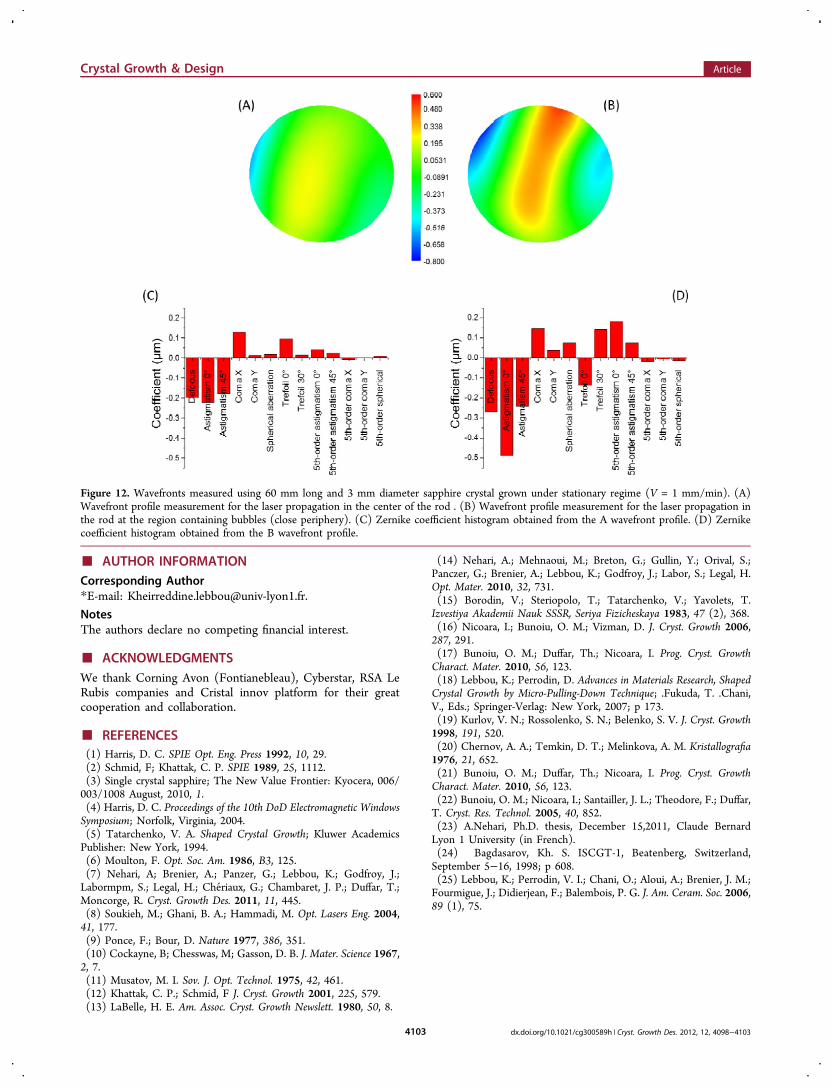
bubbles, the beam profile was non-Gaussian and disturbed. Thebubble defects in the sapphire crystals cause losses in theintensity profile as well as phase deformations. Figure 12 showswavefronts recorded using a 60 mm long and 3 mm diametersapphire crystal grown under a stationary regime (V = 1 mm/min). A focused beam from a He−Ne laser was sent throughthe rod. The diameter of the laser waist without sample wasmeasured to be 140 μm. A focal imaging system was used toimage the end face of the sample into the beam analyzerBeamwave 500 from Phaseview. The analyzer recorded thebeam and the wavefront profiles. The Getlase software wasused to analyze the beam profile and to calculate thecoefficients of the wavefront decomposition using Zernikepolynomials. The wavefront profile measured without samplewas perfectly plane (rms = 16 nm). Figure 12A illustrates thewavefront profile for the laser beam propagation in the centerof the rod. 174 nm rms phase deformation was measured in thewavefront profile after propagation through the rod. Figure 12Cshows the histograms featuring pertinent terms in the Zernikedecomposition. The rod induces principally astigmatism anddefocus aberrations. In Figure 12B, the wavefront profile had292 nm rms phase deformation. The wavefront profilemeasured in the periphery region (Figure 12B) confirmed theresults obtained previously. Figure 12D illustrates an increase inthe different aberrations with a shift of the laser beam to theedge of the rod.
IV. CONCLUSIONIt was demonstrated experimentally that the pulling rate in thecrystal growth by the micropulling down method has asignificant effect on the quality of the grown crystals.Considering economic aspects of the mass crystal production,increasing the pulling rate is always desirable. However, ashortcoming of this strategy is a considerable decrease of thecrystal quality. If the pulling rate increases the diameter of thebubbles decreases, but their number increases resulting in lowoptical performance. At a low pulling rate (v < 1 mm/min), thecrystallization interface is flat, the bubble concentration is low,and they are regularly distributed in the lateral periphery of thecrystals. Thus, low pulling rate sapphire growth is preferable toavoid formation of the bubbles and to produce high qualitycrystals.
Figure 10. Room temperature transmission (statistic distribution) ofthe as-grown rods as a function of the pulling rate.
Figure 11. Intensity distribution in the He/Ne laser beam (P = 0.95mW) in air (a) and after light passing through the crystals grown at apulling rate of 1 mm/min (b) and 2 mm/min (c).
Crystal Growth & Design Article
dx.doi.org/10.1021/cg300589h | Cryst. Growth Des. 2012, 12, 4098−41034102
■ AUTHOR INFORMATIONCorresponding Author*E-mail: [email protected].
NotesThe authors declare no competing financial interest.
■ ACKNOWLEDGMENTSWe thank Corning Avon (Fontianebleau), Cyberstar, RSA LeRubis companies and Cristal innov platform for their greatcooperation and collaboration.
■ REFERENCES(1) Harris, D. C. SPIE Opt. Eng. Press 1992, 10, 29.(2) Schmid, F; Khattak, C. P. SPIE 1989, 25, 1112.(3) Single crystal sapphire; The New Value Frontier: Kyocera, 006/003/1008 August, 2010, 1.(4) Harris, D. C. Proceedings of the 10th DoD Electromagnetic WindowsSymposium; Norfolk, Virginia, 2004.(5) Tatarchenko, V. A. Shaped Crystal Growth; Kluwer AcademicsPublisher: New York, 1994.(6) Moulton, F. Opt. Soc. Am. 1986, B3, 125.(7) Nehari, A; Brenier, A.; Panzer, G.; Lebbou, K.; Godfroy, J.;Labormpm, S.; Legal, H.; Cheriaux, G.; Chambaret, J. P.; Duffar, T.;Moncorge, R. Cryst. Growth Des. 2011, 11, 445.(8) Soukieh, M.; Ghani, B. A.; Hammadi, M. Opt. Lasers Eng. 2004,41, 177.(9) Ponce, F.; Bour, D. Nature 1977, 386, 351.(10) Cockayne, B; Chesswas, M; Gasson, D. B. J. Mater. Science 1967,2, 7.(11) Musatov, M. I. Sov. J. Opt. Technol. 1975, 42, 461.(12) Khattak, C. P.; Schmid, F J. Cryst. Growth 2001, 225, 579.(13) LaBelle, H. E. Am. Assoc. Cryst. Growth Newslett. 1980, 50, 8.
(14) Nehari, A.; Mehnaoui, M.; Breton, G.; Gullin, Y.; Orival, S.;Panczer, G.; Brenier, A.; Lebbou, K.; Godfroy, J.; Labor, S.; Legal, H.Opt. Mater. 2010, 32, 731.(15) Borodin, V.; Steriopolo, T.; Tatarchenko, V.; Yavolets, T.Izvestiya Akademii Nauk SSSR, Seriya Fizicheskaya 1983, 47 (2), 368.(16) Nicoara, I.; Bunoiu, O. M.; Vizman, D. J. Cryst. Growth 2006,287, 291.(17) Bunoiu, O. M.; Duffar, Th.; Nicoara, I. Prog. Cryst. GrowthCharact. Mater. 2010, 56, 123.(18) Lebbou, K.; Perrodin, D. Advances in Materials Research, ShapedCrystal Growth by Micro-Pulling-Down Technique; .Fukuda, T. .Chani,V., Eds.; Springer-Verlag: New York, 2007; p 173.(19) Kurlov, V. N.; Rossolenko, S. N.; Belenko, S. V. J. Cryst. Growth1998, 191, 520.(20) Chernov, A. A.; Temkin, D. T.; Melinkova, A. M. Kristallografia1976, 21, 652.(21) Bunoiu, O. M.; Duffar, Th.; Nicoara, I. Prog. Cryst. GrowthCharact. Mater. 2010, 56, 123.(22) Bunoiu, O. M.; Nicoara, I.; Santailler, J. L.; Theodore, F.; Duffar,T. Cryst. Res. Technol. 2005, 40, 852.(23) A.Nehari, Ph.D. thesis, December 15,2011, Claude BernardLyon 1 University (in French).(24) Bagdasarov, Kh. S. ISCGT-1, Beatenberg, Switzerland,September 5−16, 1998; p 608.(25) Lebbou, K.; Perrodin, V. I.; Chani, O.; Aloui, A.; Brenier, J. M.;Fourmigue, J.; Didierjean, F.; Balembois, P. G. J. Am. Ceram. Soc. 2006,89 (1), 75.
Figure 12. Wavefronts measured using 60 mm long and 3 mm diameter sapphire crystal grown under stationary regime (V = 1 mm/min). (A)Wavefront profile measurement for the laser propagation in the center of the rod . (B) Wavefront profile measurement for the laser propagation inthe rod at the region containing bubbles (close periphery). (C) Zernike coefficient histogram obtained from the A wavefront profile. (D) Zernikecoefficient histogram obtained from the B wavefront profile.
Crystal Growth & Design Article
dx.doi.org/10.1021/cg300589h | Cryst. Growth Des. 2012, 12, 4098−41034103