Embed Size (px)
Citation preview
EG1003: Introduction to Engineering and Design
Software for Engineers
Overview
Objectives
Materials
Background
Procedure
Report
Closing
Objective
Familiarization with relevant software
Explore Microsoft software tools
Word
Excel
Software Tasks
Microsoft Word
Copy generic document
Personalize copied version
Record information
Microsoft Excel
Replicate table of values
Create computed values column
Plot graph based on tabulated data
Embed excel into other documents
Background Information
Word
For lab reports, proposals, documents
Excel
For tables, charts/graphs, data analysis
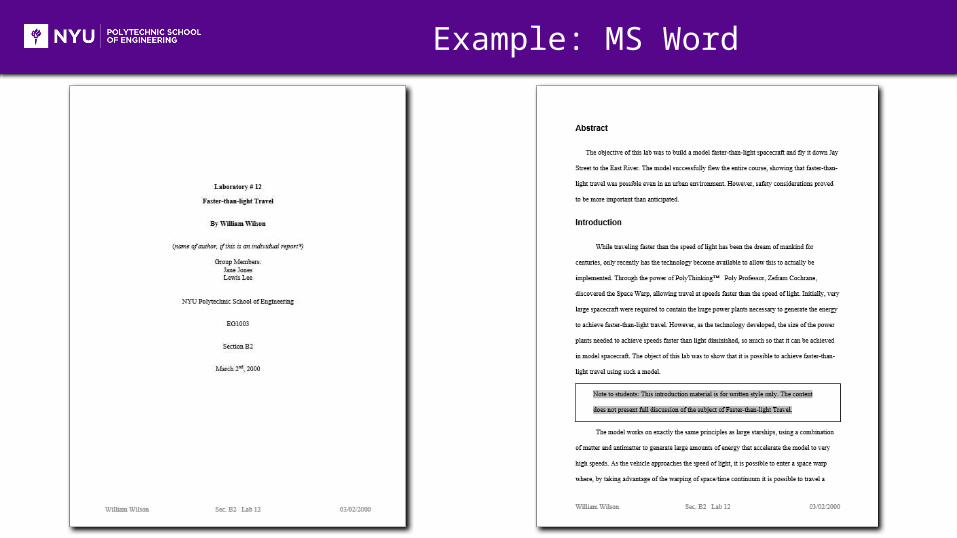
Example: MS Word
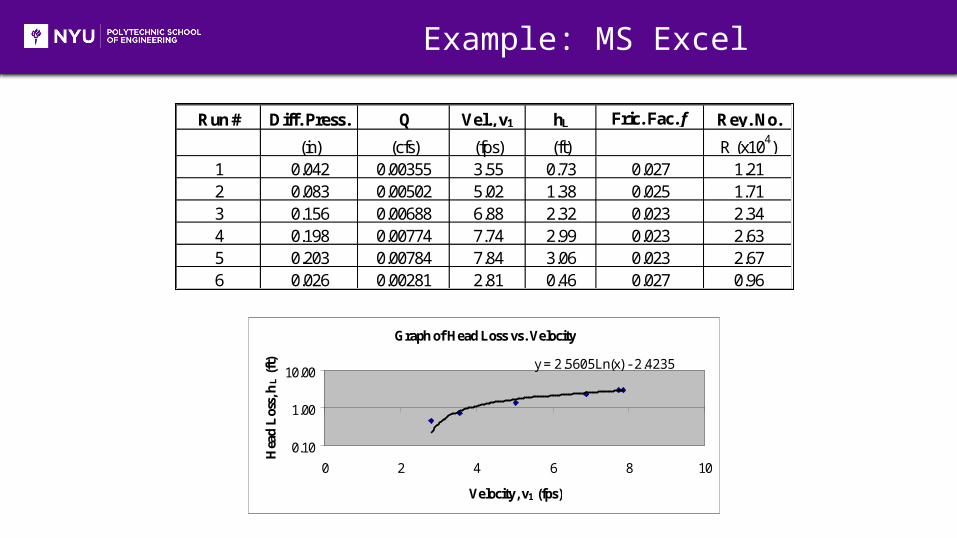
Example: MS Excel
Run # Diff. Press. Q Vel., v1 hL Fric. Fac. f Rey. No.
(in) (cfs) (fps) (ft) R (x104)1 0.042 0.00355 3.55 0.73 0.027 1.212 0.083 0.00502 5.02 1.38 0.025 1.713 0.156 0.00688 6.88 2.32 0.023 2.344 0.198 0.00774 7.74 2.99 0.023 2.635 0.203 0.00784 7.84 3.06 0.023 2.676 0.026 0.00281 2.81 0.46 0.027 0.96
Graph of Head Loss vs. Velocity
y = 2.5605Ln(x) - 2.4235
0.10
1.00
10.00
0 2 4 6 8 10
Velocity, v1 (fps)
Hea
d L
oss,
hL (f
t)
Procedure: MS Word
Copy generic document
Information includes name, address, schedule, etc.
Manual has exact specifications
Edit document to include your information
Save original and updated files for submittal and presentation
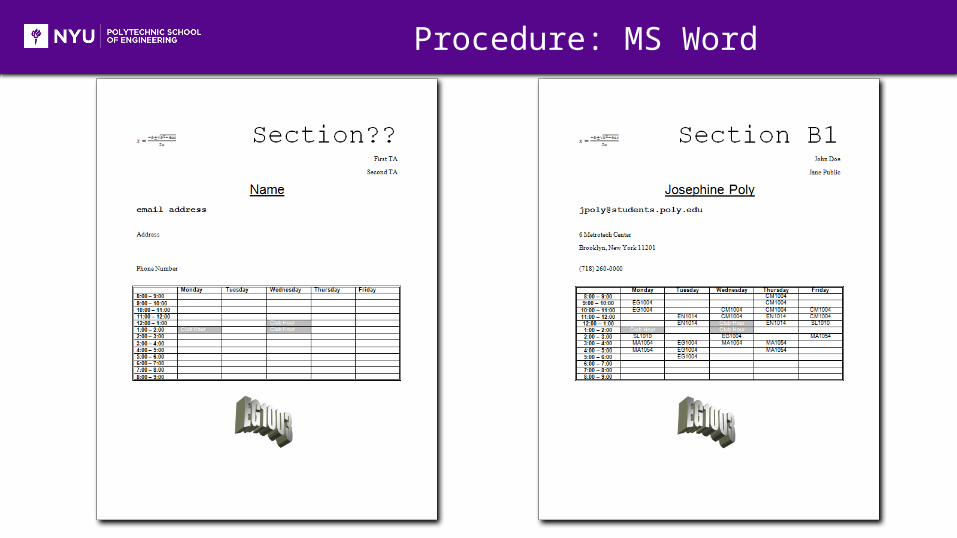
Procedure: MS Word
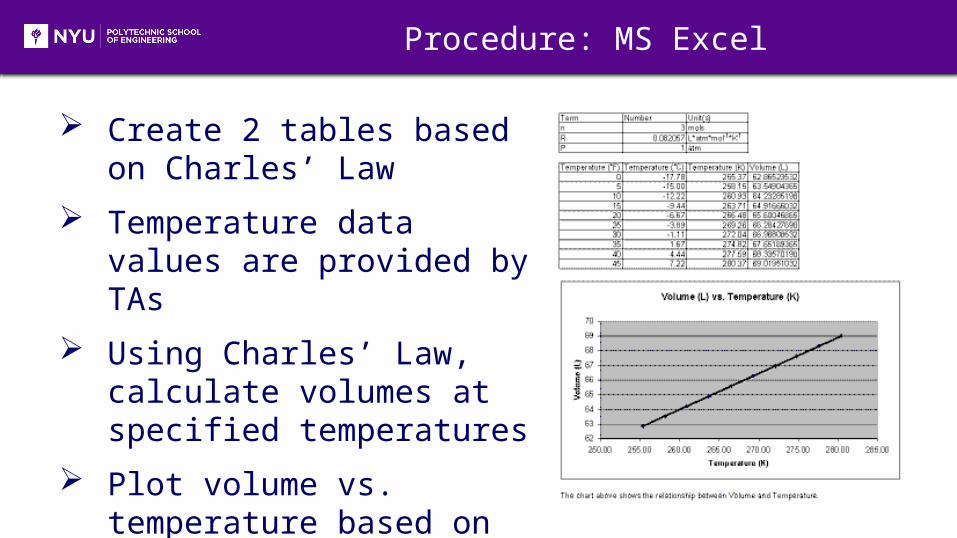
Procedure: MS Excel
Create 2 tables based on Charles’ Law
Temperature data values are provided by TAs
Using Charles’ Law, calculate volumes at specified temperatures
Plot volume vs. temperature based on generated tables
Assignment: Written Report
Independent report (one report per student) Standard lab report submission Submit online (eg.poly.edu) before midnight
of day of Lab #2 One Word Document Containing:
Title Page (MS Word: name, partner, lab title, etc.)
Generic Schedule Personalized Schedule Mousetrap competition report
Excel File: Two tables & graph
Closing
Each team member must use software
Submit all work electronically by 11:59pm before Lab #2
Work together with your partner
TA is always available for assistance
Mousetrap Car Competition
Following MS Office Exercise