Embed Size (px)
Citation preview

Semi-automatic characterization of fractured rock massesusing 3D point clouds
discontinuity orientation, spacing and SMR geomechanical classification
A.Riquelmea1 R.Tomása2 A.Abellánb3 M.Cano a4 M.Jaboyedoffb5
a Civil Engineering Department, University of Alicante, Spain
b Center for Research on Terrestrial Environment, University of Lausanne, Switzerland
{[email protected], [email protected], [email protected],[email protected], [email protected]}
April 13, 2015
A. Riquelme et al; [email protected] EGU General Assembly 2015, Vienna (Austria)
Applied methodologyCase study
Conclusions
Index
1 Applied methodologyA brief descriptionDiscontinuity sets extractionSpacing analysisSMRTool
2 Case studySources of informationMean planes and spacing analysisSMR results
3 Conclusions
A. Riquelme et al; [email protected] EGU General Assembly 2015, Vienna (Austria)
Applied methodologyCase study
Conclusions
A brief descriptionDiscontinuity sets extractionSpacing analysisSMRTool
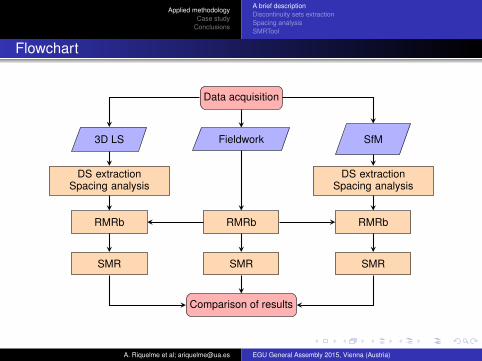
Flowchart
Data acquisition
Fieldwork3D LS SfM
DS extractionSpacing analysis
DS extractionSpacing analysis
RMRb RMRb RMRb
SMRSMR SMR
Comparison of results
A. Riquelme et al; [email protected] EGU General Assembly 2015, Vienna (Austria)
Applied methodologyCase study
Conclusions
A brief descriptionDiscontinuity sets extractionSpacing analysisSMRTool
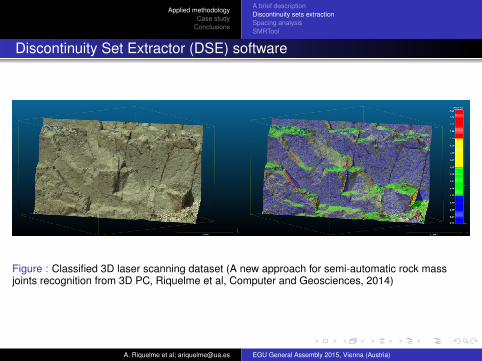
Discontinuity Set Extractor (DSE) software
Figure : Classified 3D laser scanning dataset (A new approach for semi-automatic rock massjoints recognition from 3D PC, Riquelme et al, Computer and Geosciences, 2014)
A. Riquelme et al; [email protected] EGU General Assembly 2015, Vienna (Austria)
Applied methodologyCase study
Conclusions
A brief descriptionDiscontinuity sets extractionSpacing analysisSMRTool
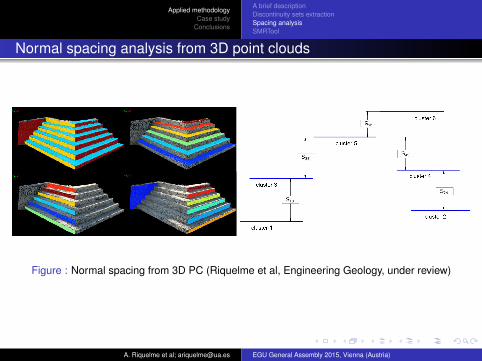
Normal spacing analysis from 3D point clouds
Figure : Normal spacing from 3D PC (Riquelme et al, Engineering Geology, under review)
A. Riquelme et al; [email protected] EGU General Assembly 2015, Vienna (Austria)
Applied methodologyCase study
Conclusions
A brief descriptionDiscontinuity sets extractionSpacing analysisSMRTool
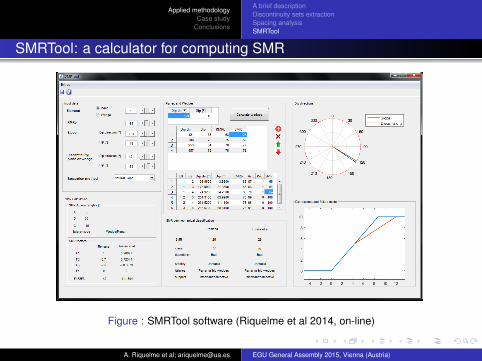
SMRTool: a calculator for computing SMR
Figure : SMRTool software (Riquelme et al 2014, on-line)
A. Riquelme et al; [email protected] EGU General Assembly 2015, Vienna (Austria)

Applied methodologyCase study
Conclusions
Sources of informationMean planes and spacing analysisSMR results
Index
1 Applied methodologyA brief descriptionDiscontinuity sets extractionSpacing analysisSMRTool
2 Case studySources of informationMean planes and spacing analysisSMR results
3 Conclusions
A. Riquelme et al; [email protected] EGU General Assembly 2015, Vienna (Austria)
Applied methodologyCase study
Conclusions
Sources of informationMean planes and spacing analysisSMR results
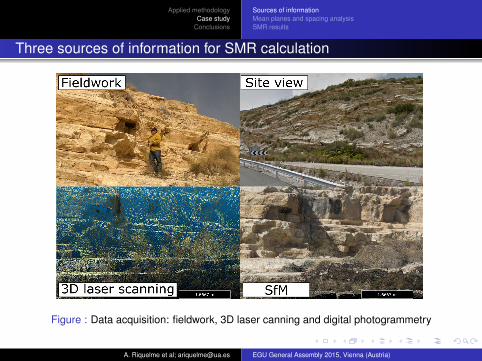
Three sources of information for SMR calculation
Figure : Data acquisition: fieldwork, 3D laser canning and digital photogrammetry
A. Riquelme et al; [email protected] EGU General Assembly 2015, Vienna (Austria)
Applied methodologyCase study
Conclusions
Sources of informationMean planes and spacing analysisSMR results
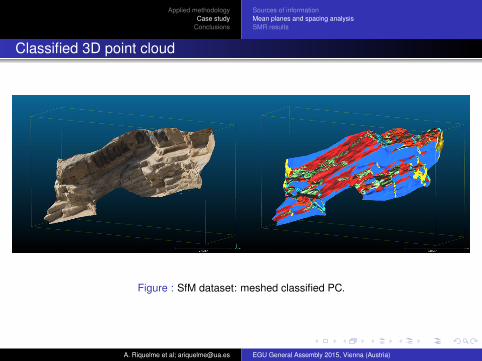
Classified 3D point cloud
Figure : SfM dataset: meshed classified PC.
A. Riquelme et al; [email protected] EGU General Assembly 2015, Vienna (Austria)
Applied methodologyCase study
Conclusions
Sources of informationMean planes and spacing analysisSMR results
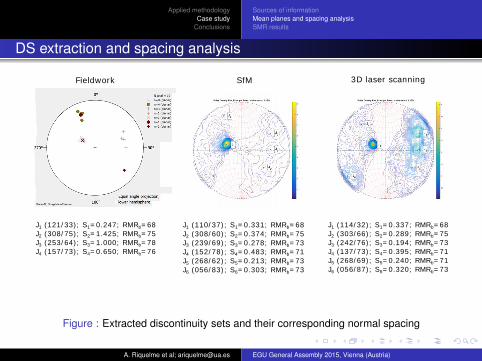
DS extraction and spacing analysis
J1 (121/33); S1=0.247; RMRb=68J2 (308/75); S2=1.425; RMRb=75J3 (253/64); S3=1.000; RMRb=78J4 (157/73); S4=0.650; RMRb=76
J1 (110/37); S1=0.331; RMRb=68J2 (308/60); S2=0.374; RMRb=75J3 (239/69); S3=0.278; RMRb=73J4 (152/78); S4=0.483; RMRb=71J5 (268/62); S5=0.213; RMRb=73J6 (056/83); S6=0.303; RMRb=73
J1 (114/32); S1=0.337; RMRb=68J2 (303/66); S2=0.289; RMRb=75J3 (242/76); S3=0.194; RMRb=73J4 (137/73); S4=0.395; RMRb=71J5 (268/69); S5=0.240; RMRb=71J6 (056/87); S6=0.320; RMRb=73
Fieldwork SfM 3D laser scanning
Figure : Extracted discontinuity sets and their corresponding normal spacing
A. Riquelme et al; [email protected] EGU General Assembly 2015, Vienna (Austria)
Applied methodologyCase study
Conclusions
Sources of informationMean planes and spacing analysisSMR results
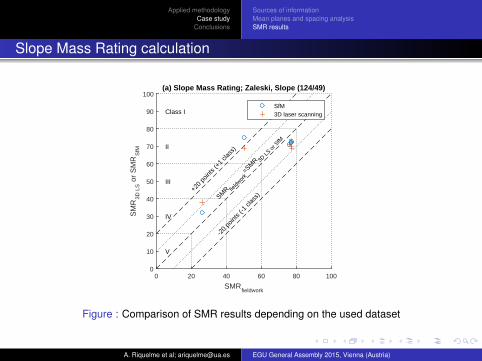
Slope Mass Rating calculation
SMRfieldwork
0 20 40 60 80 100
SM
R3D
LS o
r S
MR
SfM
0
10
20
30
40
50
60
70
80
90
100
SMR fie
ldwor
k=S
MR 3D
LS o
r SfM
+20
points (+
1 clas
s)
-20
points (-
1 clas
s)
V
IV
III
II
Class I
(a) Slope Mass Rating; Zaleski, Slope (124/49)
SfM
3D laser scanning
Figure : Comparison of SMR results depending on the used dataset
A. Riquelme et al; [email protected] EGU General Assembly 2015, Vienna (Austria)
Applied methodologyCase study
Conclusions
Index
1 Applied methodologyA brief descriptionDiscontinuity sets extractionSpacing analysisSMRTool
2 Case studySources of informationMean planes and spacing analysisSMR results
3 Conclusions
A. Riquelme et al; [email protected] EGU General Assembly 2015, Vienna (Austria)
Applied methodologyCase study
Conclusions
ConclusionsThe 3D dataset was classified and its DS were extracted. The use of 3D PCallowed to identify more mean orientations.
Normal spacing was calculated automatically using the classified PC. Using 3Ddataset, spacing was minor or closer to those obtained through classicalapproach.
The results comparison of SMR evidenced some deviations, up to 1 class.
A. Riquelme et al; [email protected] EGU General Assembly 2015, Vienna (Austria)
Semi-automatic characterization of fractured rock massesusing 3D point clouds
discontinuity orientation, spacing and SMR geomechanical classification
A.Riquelmea1 R.Tomása2 A.Abellánb3 M.Cano a4 M.Jaboyedoffb5
a Civil Engineering Department, University of Alicante, Spain
b Center for Research on Terrestrial Environment, University of Lausanne, Switzerland
{[email protected], [email protected], [email protected],[email protected], [email protected]}
April 13, 2015
A. Riquelme et al; [email protected] EGU General Assembly 2015, Vienna (Austria)