Embed Size (px)
Citation preview
Electronic Supplementary Information (ESI)Spectral properties of ionic benzotristhiazole based donor-acceptor NLO-phores in polymer matrices and their one- and two-photon cellular imaging ability
Martin Danko1,*, Pavol Hrdlovič1, Andrea Martinická2, Aleš Benda3 and Marek Cigáň4,*
1 Polymer Institute, Slovak Academy of Sciences, Dúbravská cesta 9, 845 41 Bratislava, Slovak Republic2 Department of Organic Chemistry, Faculty of Natural Sciences, Comenius University, Mlynská dolina, Ilkovičova 6, 842 15 Bratislava, Slovak Republic3 Imaging methods core facility BIOCEV, Faculty of Sciences, Charles University, Průmyslová 595, 252 42 Vestec, Czech Republic4 Institute of Chemistry, Faculty of Natural Sciences, Comenius University, Mlynská dolina, Ilkovičova 6, 842 15 Bratislava, Slovak Republic
* [email protected]; [email protected]
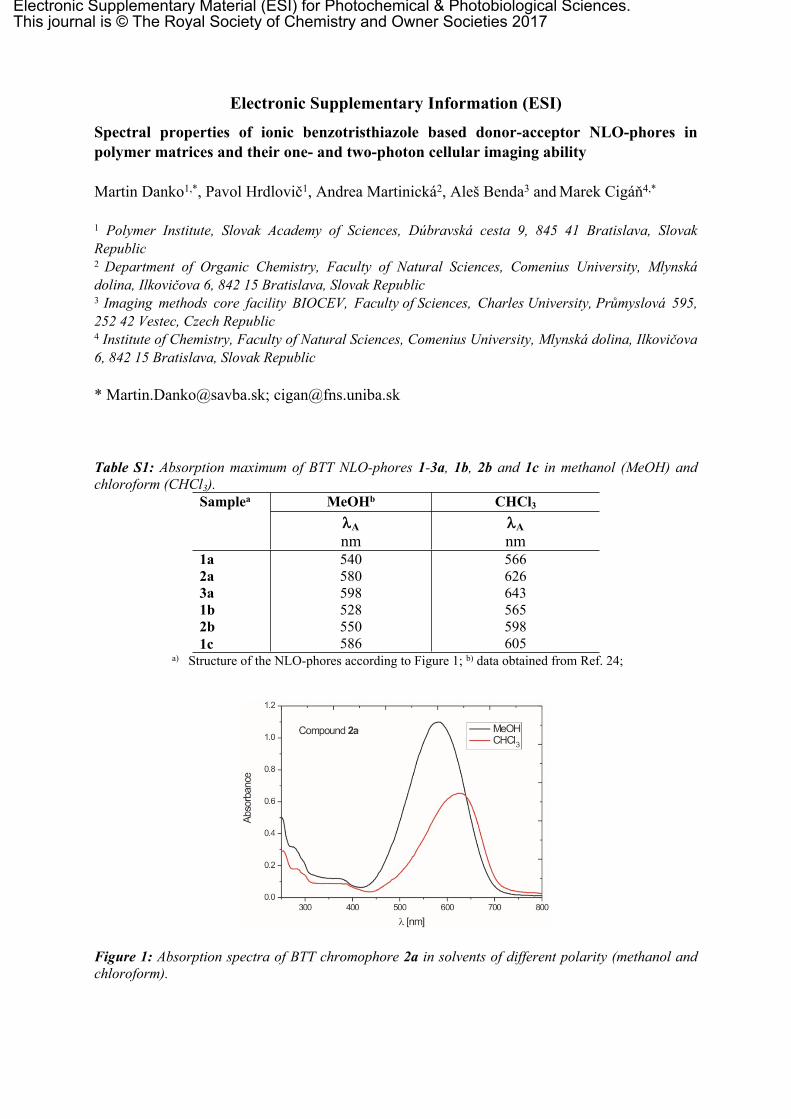
Table S1: Absorption maximum of BTT NLO-phores 1-3a, 1b, 2b and 1c in methanol (MeOH) and chloroform (CHCl3).
MeOHb CHCl3Samplea
Anm
Anm
1a2a3a1b2b1c
540580598528550586
566626643565598605
a) Structure of the NLO-phores according to Figure 1; b) data obtained from Ref. 24;
Figure 1: Absorption spectra of BTT chromophore 2a in solvents of different polarity (methanol and chloroform).
Electronic Supplementary Material (ESI) for Photochemical & Photobiological Sciences.This journal is © The Royal Society of Chemistry and Owner Societies 2017
Light absorption characteristics
As typical for increased π-conjugation length in push-pull systems, the long-wavelength band shifts bathochromically with increasing length of the conjugated bridge in both polymer matrices (Table S2; Figures 2 and 3 in the main manuscript). Weaker ICT character in diphenylamino derivatives 1b and 2b due to resonance delocalization (-M effect) and thus weaker electron density at –NPh2 nitrogen manifests itself in hypsochromically shifted A values compared to NLO-phores 1a-3a with -NMe2 donor. Compared to NLO-phores 1a and 1b with the same length of conjugated bridge, compound 1c with the julolidine donor exhibits the largest red-shift of absorption maximum (A = 609 and 623 nm in PVC and PSS, respectively). Contrary to -NMe2 and –NPh2 donors in 1a and 1b, nitrogen in julolidine substituent is rigidized and rehybridized from pyramidal to planar configuration and thus enables better conjugation and more effective charge transfer. Extinction coefficient () of NLO-phores in polymer matrices follows the trend observed in methanol (Table S2).
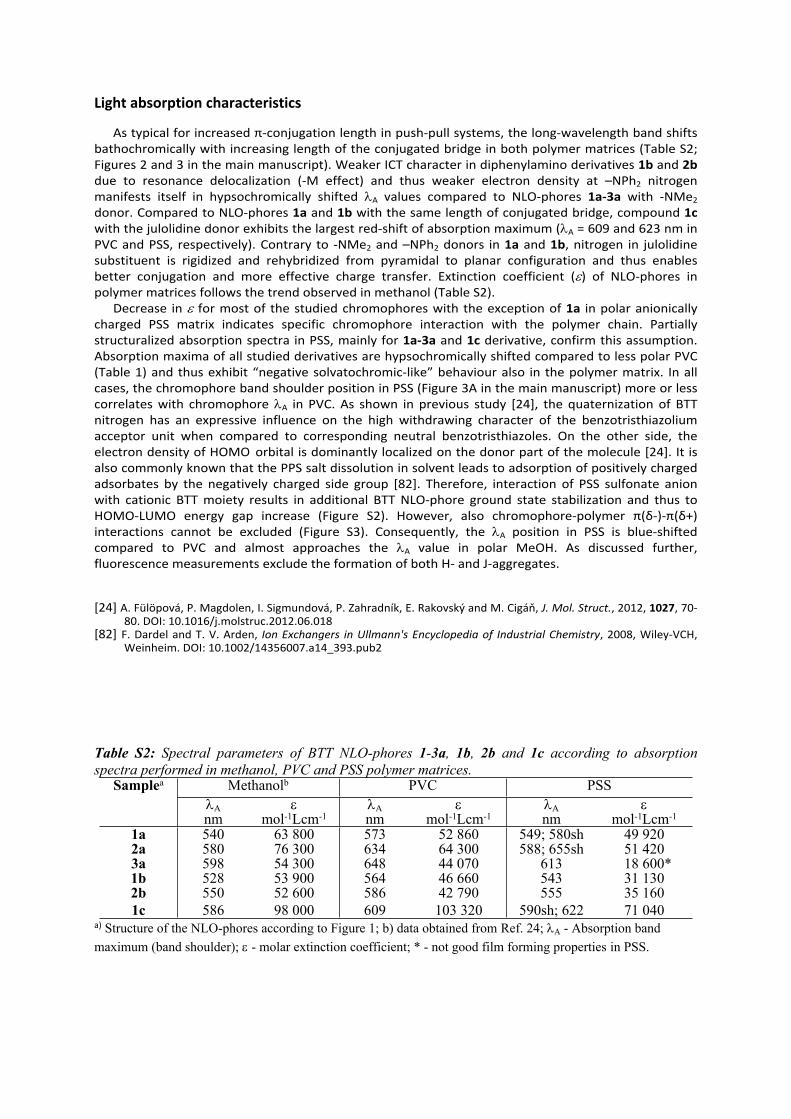
Decrease in for most of the studied chromophores with the exception of 1a in polar anionically charged PSS matrix indicates specific chromophore interaction with the polymer chain. Partially structuralized absorption spectra in PSS, mainly for 1a-3a and 1c derivative, confirm this assumption. Absorption maxima of all studied derivatives are hypsochromically shifted compared to less polar PVC (Table 1) and thus exhibit “negative solvatochromic-like” behaviour also in the polymer matrix. In all cases, the chromophore band shoulder position in PSS (Figure 3A in the main manuscript) more or less correlates with chromophore A in PVC. As shown in previous study [24], the quaternization of BTT nitrogen has an expressive influence on the high withdrawing character of the benzotristhiazolium acceptor unit when compared to corresponding neutral benzotristhiazoles. On the other side, the electron density of HOMO orbital is dominantly localized on the donor part of the molecule [24]. It is also commonly known that the PPS salt dissolution in solvent leads to adsorption of positively charged adsorbates by the negatively charged side group [82]. Therefore, interaction of PSS sulfonate anion with cationic BTT moiety results in additional BTT NLO-phore ground state stabilization and thus to HOMO-LUMO energy gap increase (Figure S2). However, also chromophore-polymer π(δ-)-π(δ+) interactions cannot be excluded (Figure S3). Consequently, the A position in PSS is blue-shifted compared to PVC and almost approaches the A value in polar MeOH. As discussed further, fluorescence measurements exclude the formation of both H- and J-aggregates.
[24] A. Fülöpová, P. Magdolen, I. Sigmundová, P. Zahradník, E. Rakovský and M. Cigáň, J. Mol. Struct., 2012, 1027, 70-80. DOI: 10.1016/j.molstruc.2012.06.018
[82] F. Dardel and T. V. Arden, Ion Exchangers in Ullmann's Encyclopedia of Industrial Chemistry, 2008, Wiley-VCH, Weinheim. DOI: 10.1002/14356007.a14_393.pub2
Table S2: Spectral parameters of BTT NLO-phores 1-3a, 1b, 2b and 1c according to absorption spectra performed in methanol, PVC and PSS polymer matrices.
Methanolb PVC PSSSamplea
Anm
mol-1Lcm-1
Anm
mol-1Lcm-1
Anm
mol-1Lcm-1
1a 540 63 800 573 52 860 549; 580sh 49 9202a 580 76 300 634 64 300 588; 655sh 51 4203a 598 54 300 648 44 070 613 18 600*1b 528 53 900 564 46 660 543 31 1302b 550 52 600 586 42 790 555 35 1601c 586 98 000 609 103 320 590sh; 622 71 040
a) Structure of the NLO-phores according to Figure 1; b) data obtained from Ref. 24; A - Absorption band maximum (band shoulder); - molar extinction coefficient; * - not good film forming properties in PSS.
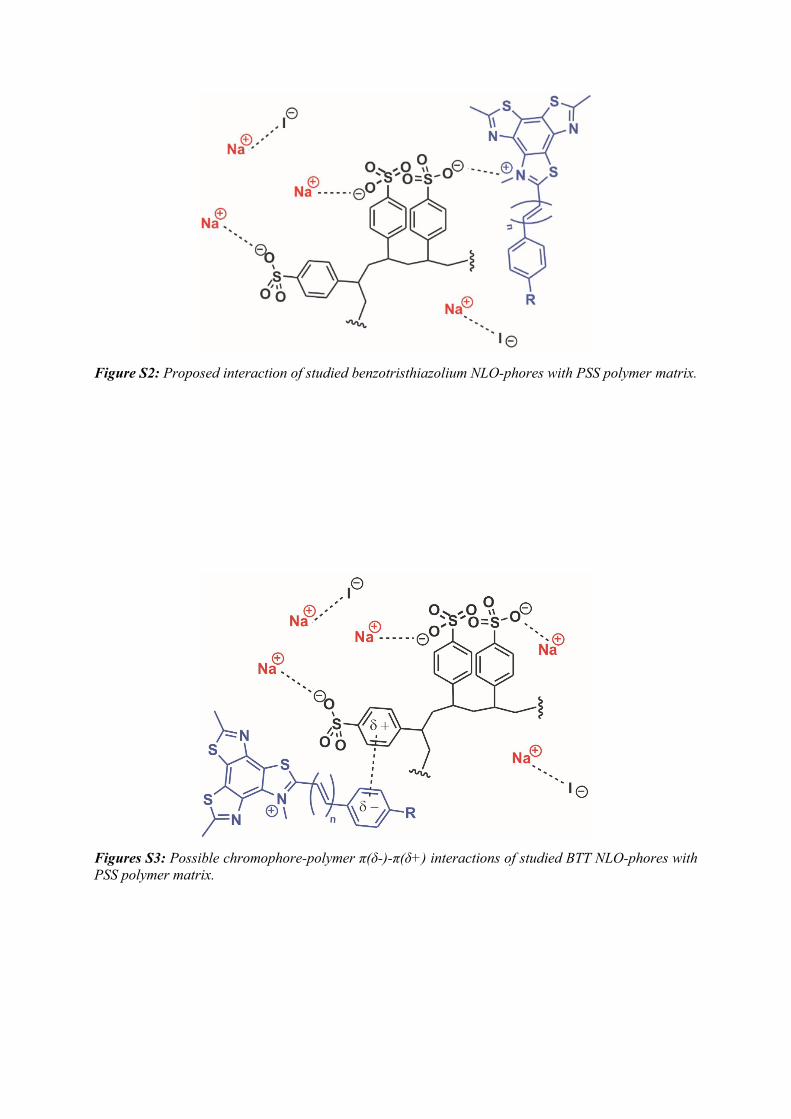
Figure S2: Proposed interaction of studied benzotristhiazolium NLO-phores with PSS polymer matrix.
Figures S3: Possible chromophore-polymer π(δ-)-π(δ+) interactions of studied BTT NLO-phores with PSS polymer matrix.
S4 S5
Figures S4 and S5: Normalized absorption, excitation and emission spectra of investigated BTT chromophores 1a and 2a in PSS matrix at concentration of 2 10–4 mol kg-1.
S6 S7
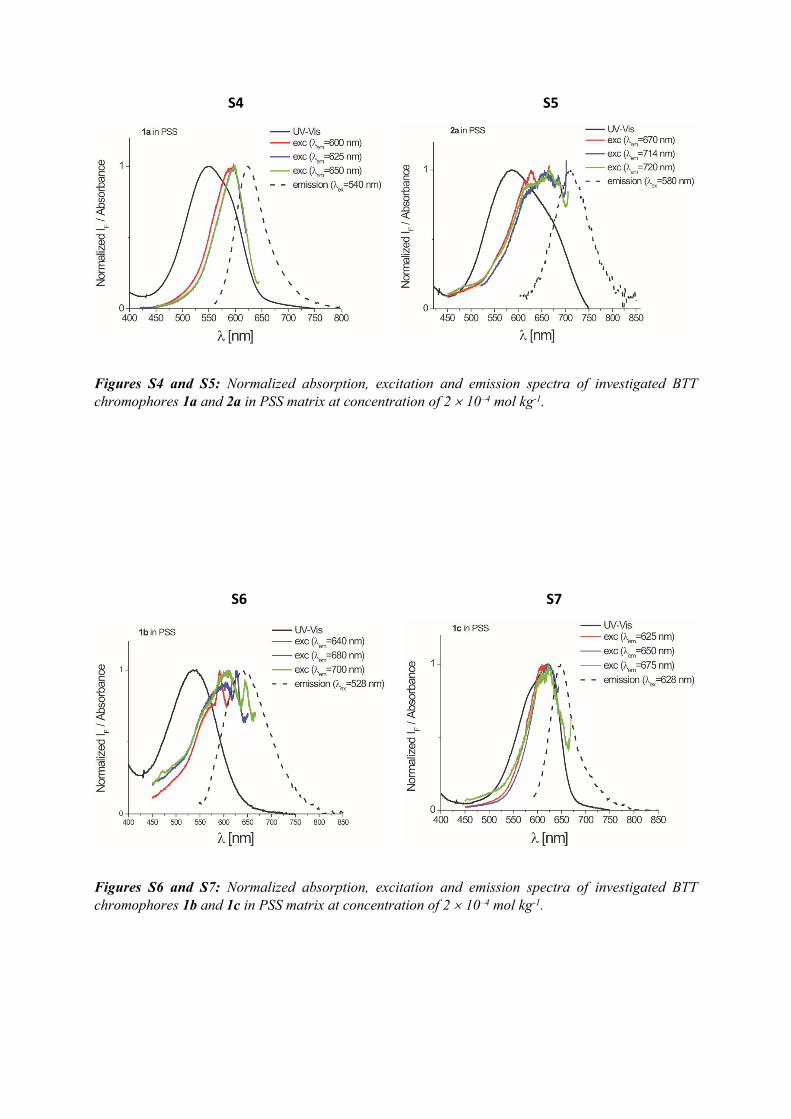
Figures S6 and S7: Normalized absorption, excitation and emission spectra of investigated BTT chromophores 1b and 1c in PSS matrix at concentration of 2 10–4 mol kg-1.
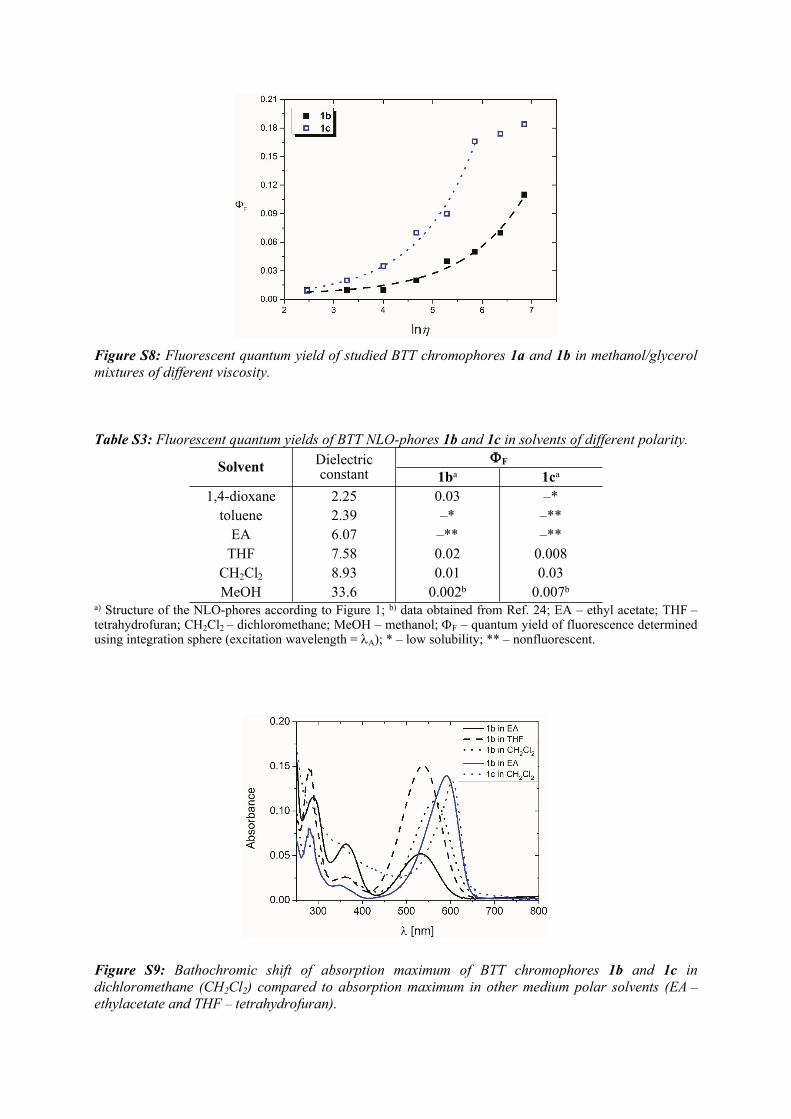
Figure S8: Fluorescent quantum yield of studied BTT chromophores 1a and 1b in methanol/glycerol mixtures of different viscosity.
Table S3: Fluorescent quantum yields of BTT NLO-phores 1b and 1c in solvents of different polarity.FSolvent Dielectric
constant 1ba 1ca
1,4-dioxane 2.25 0.03 –*toluene 2.39 –* –**
EA 6.07 –** –**THF 7.58 0.02 0.008
CH2Cl2 8.93 0.01 0.03MeOH 33.6 0.002b 0.007b
a) Structure of the NLO-phores according to Figure 1; b) data obtained from Ref. 24; EA – ethyl acetate; THF – tetrahydrofuran; CH2Cl2 – dichloromethane; MeOH – methanol; F – quantum yield of fluorescence determined using integration sphere (excitation wavelength = A); * – low solubility; ** – nonfluorescent.
Figure S9: Bathochromic shift of absorption maximum of BTT chromophores 1b and 1c in dichloromethane (CH2Cl2) compared to absorption maximum in other medium polar solvents (EA – ethylacetate and THF – tetrahydrofuran).
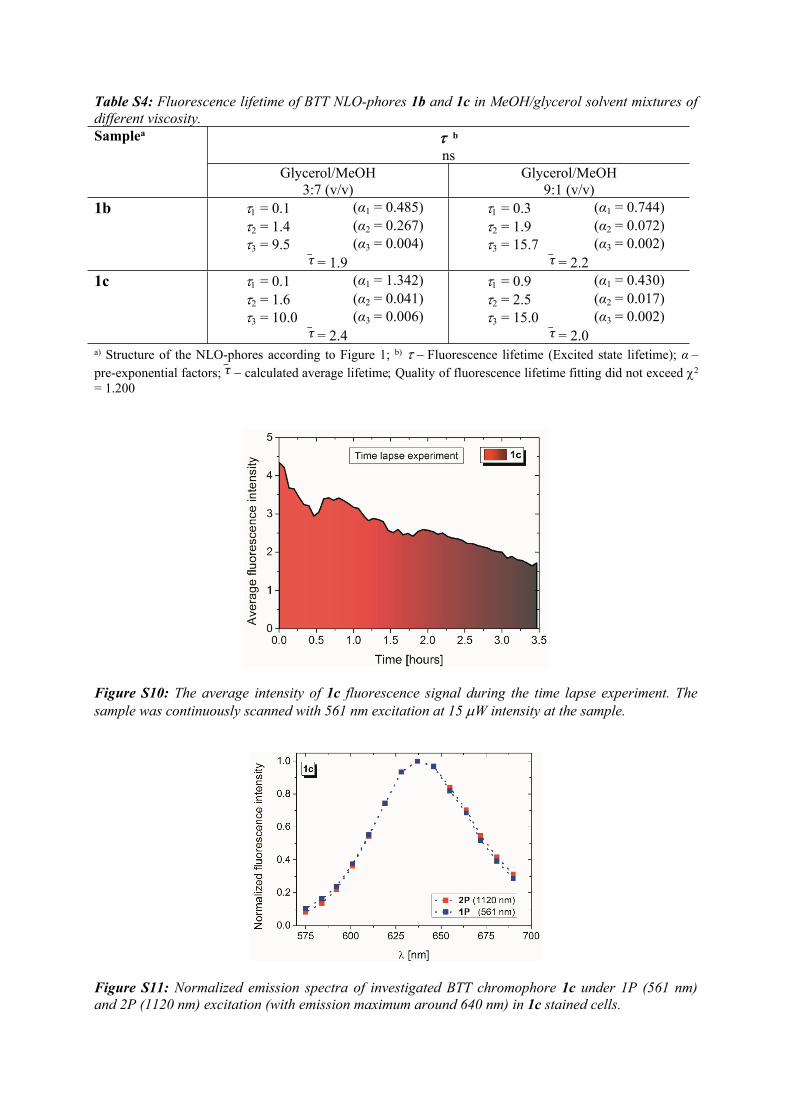
Table S4: Fluorescence lifetime of BTT NLO-phores 1b and 1c in MeOH/glycerol solvent mixtures of different viscosity.Samplea b
nsGlycerol/MeOH
3:7 (v/v)Glycerol/MeOH
9:1 (v/v)1b = 0.1 (α1 = 0.485) = 0.3 (α1 = 0.744)
= 1.4 (α2 = 0.267) = 1.9 (α2 = 0.072) = 9.5 (α3 = 0.004) = 15.7 (α3 = 0.002)
= 1.9�̅� = 2.2�̅� 1c = 0.1 (α1 = 1.342) = 0.9 (α1 = 0.430)
= 1.6 (α2 = 0.041) = 2.5 (α2 = 0.017) = 10.0 (α3 = 0.006) = 15.0 (α3 = 0.002)
= 2.4�̅� = 2.0�̅� a) Structure of the NLO-phores according to Figure 1; b) Fluorescence lifetime (Excited state lifetime); α – pre-exponential factors; calculatedaverage lifetimeQuality of fluorescence lifetimefitting did not exceed 2 �̅�= 1.200
Figure S10: The average intensity of 1c fluorescence signal during the time lapse experiment. The sample was continuously scanned with 561 nm excitation at 15 W intensity at the sample.
Figure S11: Normalized emission spectra of investigated BTT chromophore 1c under 1P (561 nm) and 2P (1120 nm) excitation (with emission maximum around 640 nm) in 1c stained cells.
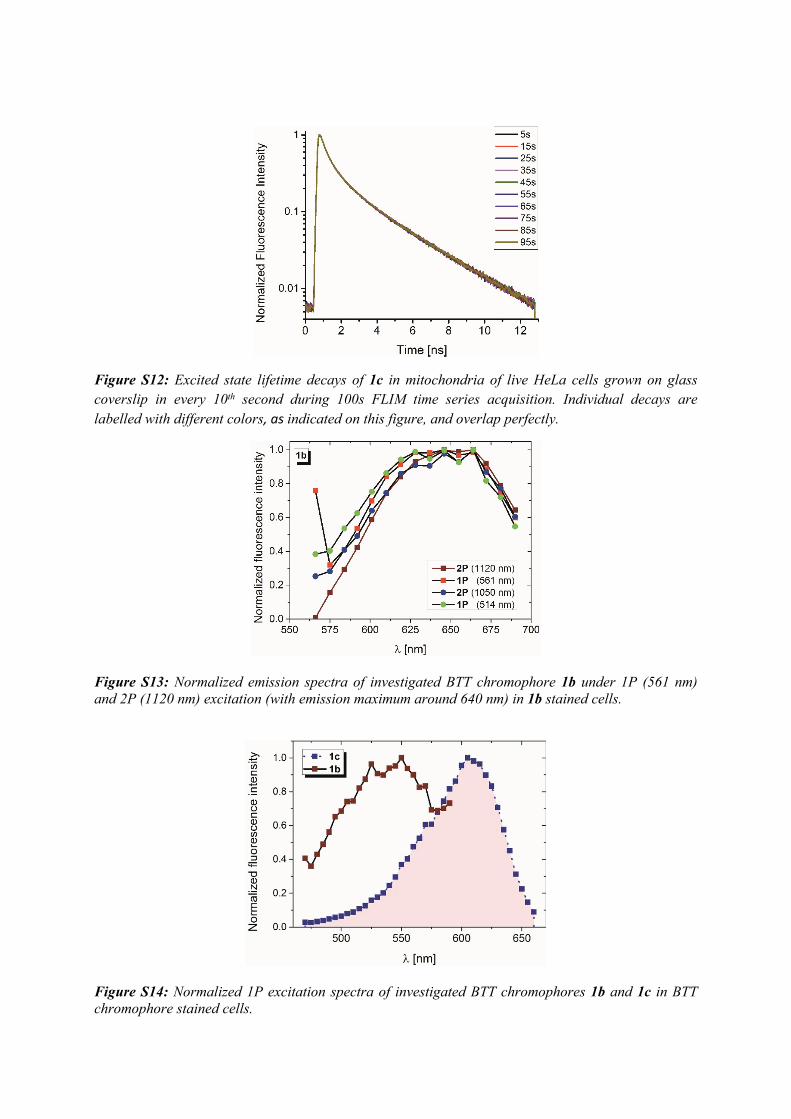
Figure S12: Excited state lifetime decays of 1c in mitochondria of live HeLa cells grown on glass coverslip in every 10th second during 100s FLIM time series acquisition. Individual decays are labelled with different colors, as indicated on this figure, and overlap perfectly.
Figure S13: Normalized emission spectra of investigated BTT chromophore 1b under 1P (561 nm) and 2P (1120 nm) excitation (with emission maximum around 640 nm) in 1b stained cells.
Figure S14: Normalized 1P excitation spectra of investigated BTT chromophores 1b and 1c in BTT chromophore stained cells.
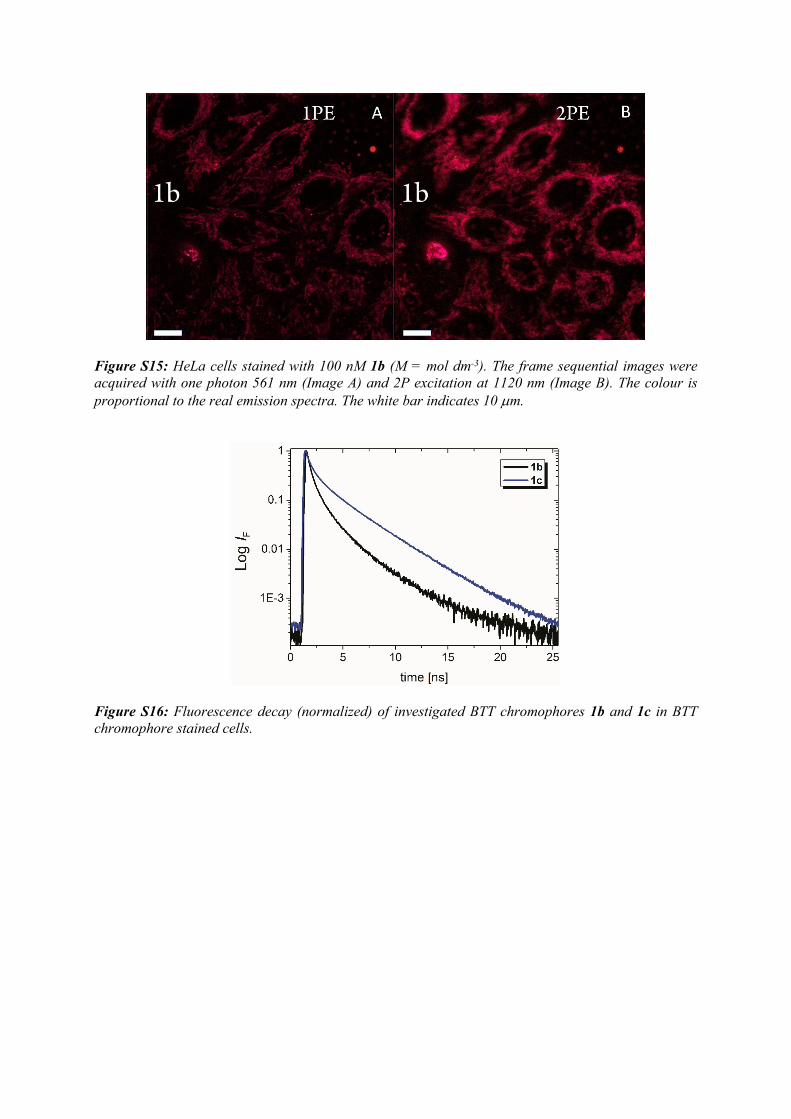
Figure S15: HeLa cells stained with 100 nM 1b (M = mol dm-3). The frame sequential images were acquired with one photon 561 nm (Image A) and 2P excitation at 1120 nm (Image B). The colour is proportional to the real emission spectra. The white bar indicates 10 m.
Figure S16: Fluorescence decay (normalized) of investigated BTT chromophores 1b and 1c in BTT chromophore stained cells.


![Electronic Supplementary Information (ESI) for · 2016. 10. 10. · S1 Electronic Supplementary Information (ESI) for Stereoselective photoreaction in P-stereogenic dithiazolylbenzo[b]phosphole](https://img.pdfslide.tips/doc/110x75/60d94a5bcd01870cf40fb448/electronic-supplementary-information-esi-2016-10-10-s1-electronic-supplementary.jpg)


![Electronic Supplementary Information (ESI) Polymorphs, … · 2009-01-22 · 1 Electronic Supplementary Information (ESI) Polymorphs, enantiomorphs, chirality and helicity in [Rh{N,O}(η4-cod)]](https://img.pdfslide.tips/doc/110x75/5e85bcb7e9df187d8204e5b8/electronic-supplementary-information-esi-polymorphs-2009-01-22-1-electronic.jpg)