Embed Size (px)
Citation preview
S1
Electronic Supporting Information
Multivalent Polyrotaxane Vectors as Adaptive Cargo Complexes for Gene
Therapy
Rodinel Ardeleanua, Andrei I. Dascalua, Andrei Neamtua,b, Dragos Peptanariua, Cristina M.
Uritua, Stelian S. Maiera,c, Alina Nicolescua, Bogdan C. Simionescua,d, Mihail Barboiue,
Mariana Pintealaa*
Table of contents
1. Chemical syntheses ………………………………………………………………… S4
1.1. Synthesis and characterization of acrylated β-cyclodextrin β-CD …………….. S4
Figure S1. Schematic representation of β-CD esterification with acryloyl chloride........ S4
Figure S2. 1H-NMR spectra of native β-CD (bottom) and of acrylated β-CD (top)…… S5
Figure S3. 1H, 13C-HSQC spectrum of the acrylated β-CD, recorded in DMSO-d6....... S6
Figure S4. 13C-NMR spectra of native β-CD (bottom) and of acrylated β-CD (top, recorded on a 10 mm probe), recorded in DMSO-d6…………………………………… S7
Figure S5. FT-IR spectra of the unmodified β-CD and of the acrylated β-CD…………. S8
1.2. Preparation of α,ω-bis(propargyloxy)poly(ethylene glycol) …………………… S8
Figure S6. Schematic representation of PEG etherification with propargyl bromide….. S8
Figure S7. 1H-NMR spectrum of α,ω-bis-(propargyloxy)-PEG1000 recorded in DMSO-d6………………………………………………………………………………... S9
Figure S8. 13C-NMR spectrum of α,ω-bis-(propargyloxy)-PEG1000 recorded in DMSO-d6………………………………………………………………………………... S10
Figure S9. FT-IR spectra of α,ω-bis-(propargyloxy)-PEG1000………………………… S10
1.3. Synthesis of 1-(3-bromopropyl)silatrane and 1(3-azidopropyl)silatrane ……… S11
1.3.1. Synthesis of 1-(3-bromopropyl)silatrane ……………………………………… S11
Figure S10. Schematic representation of 1-(3-bromopropyl)silatrane synthesis……….. S11
Figure S11. 1H-NMR spectrum of 1-(3-bromopropyl)silatrane, recorded in DMSO-d6.. S12
Figure S12. 13C-NMR spectrum of 1-(3-bromopropyl)silatrane, recorded in DMSO-d6………………………………………………………………………………………… S12
Electronic Supplementary Material (ESI) for Polymer Chemistry.This journal is © The Royal Society of Chemistry 2017
S2
Figure S13. FT-IR spectra of 1-(3-bromopropyl)silatrane……………………………… S13
1.3.2. Synthesis of 1-(3-azidopropyl)silatrane………………………………………… S13
Figure S14. Schematic representation of 1-(3-azidopropyl)silatrane synthesis………… S13
Figure S15. 1H-NMR spectrum of 1-(3-azidopropyl)silatrane recorded in DMSO-d6… S14
Figure S16. 13C-NMR spectrum of 1-(3-azidopropyl)silatrane recorded in DMSO-d6... S15
Figure S17. FT-IR spectra of 1-(3-azidopropyl)silatrane……………………………….. S15
1.4. Synthesis of α,ω-bis(propargyloxy)poly(ethylene glycol)/acrylated β-CD poly(pseudorotaxane)…………………………………………………………………... S16
Figure S18. Schematic representation of α,ω-bis-(propargyloxy)-PEG1000/acrylated β-CD poly(pseudorotaxane) preparation………………………………………………… S16
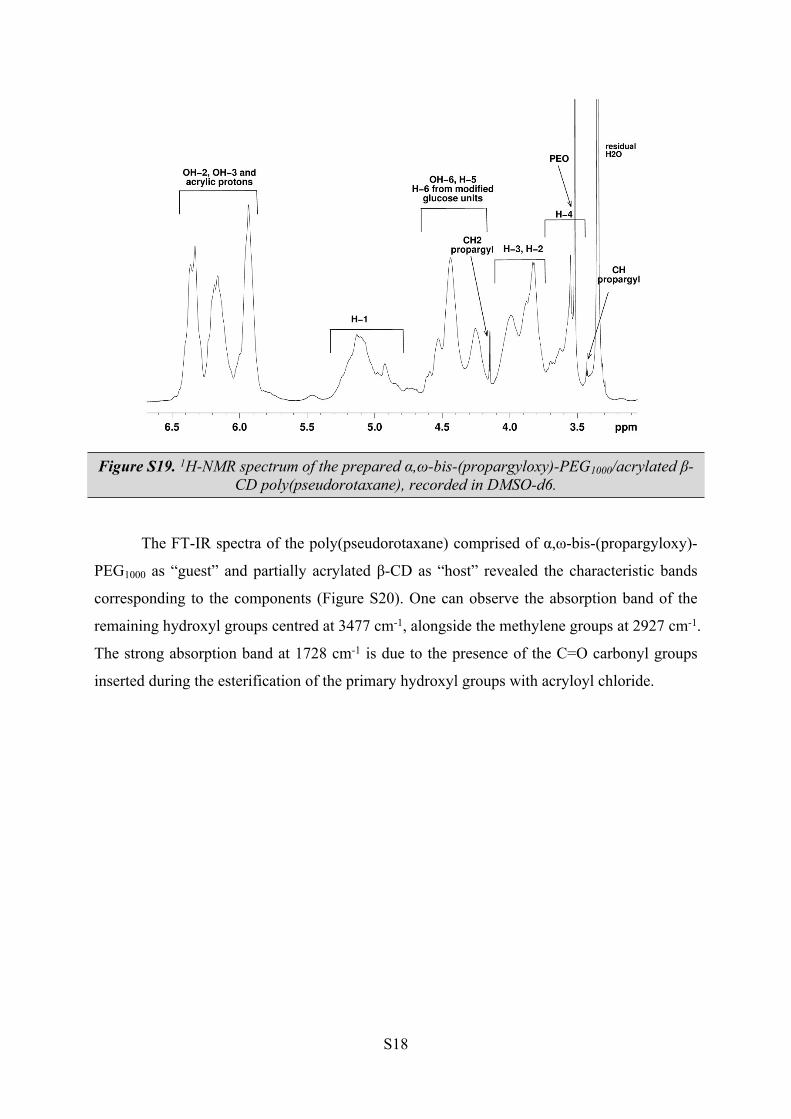
Figure S19. 1H-NMR spectrum of the prepared α,ω-bis-(propargyloxy)-PEG1000/acrylated β-CD poly(pseudorotaxane), recorded in DMSO-d6………………... S17
Figure S20. FT-IR spectra of α,ω-bis-(propargyloxy)-PEG1000/acrylated β-CD poly(pseudorotaxane)……………………………………………………………………. S18
1.5. Preparation of α,ω-bis-{1-[3-(silatranyl)prop-1-yl]-1H-1,2,3-triazol-5-yl}-PEG1000/acrylated β-CD polyrotaxane (ROT)………………………………………… S18
Figure S21. Schematic representation of α,ω-bis-{1-[3-(silatranyl)prop-1-yl]-1H-1,2,3-triazol-5-yl}-PEG1000/acrylated β-CD polyrotaxane synthesis procedure………………………………………………… S18
Figure S22. 1H-NMR spectrum of the capped ROT, recorded in DMSO-d6…………... S19
Figure S23. FT-IR spectra of α,ω-bis-{1-[3-(silatranyl)prop-1-yl]-1H-1,2,3-triazol-5-yl}-PEG1000/acrylated β-CD polyrotaxane……………………………………………………………………………… S19
1.6. Preparation of PEI decorated polyrotaxane (ROT-PEI)………………………… S20
Figure S24. Schematic representation of ROT-PEI preparation………………………… S20
Figure S25. 1H-NMR spectrum of ROT-PEI, recorded in D2O………………………… S20
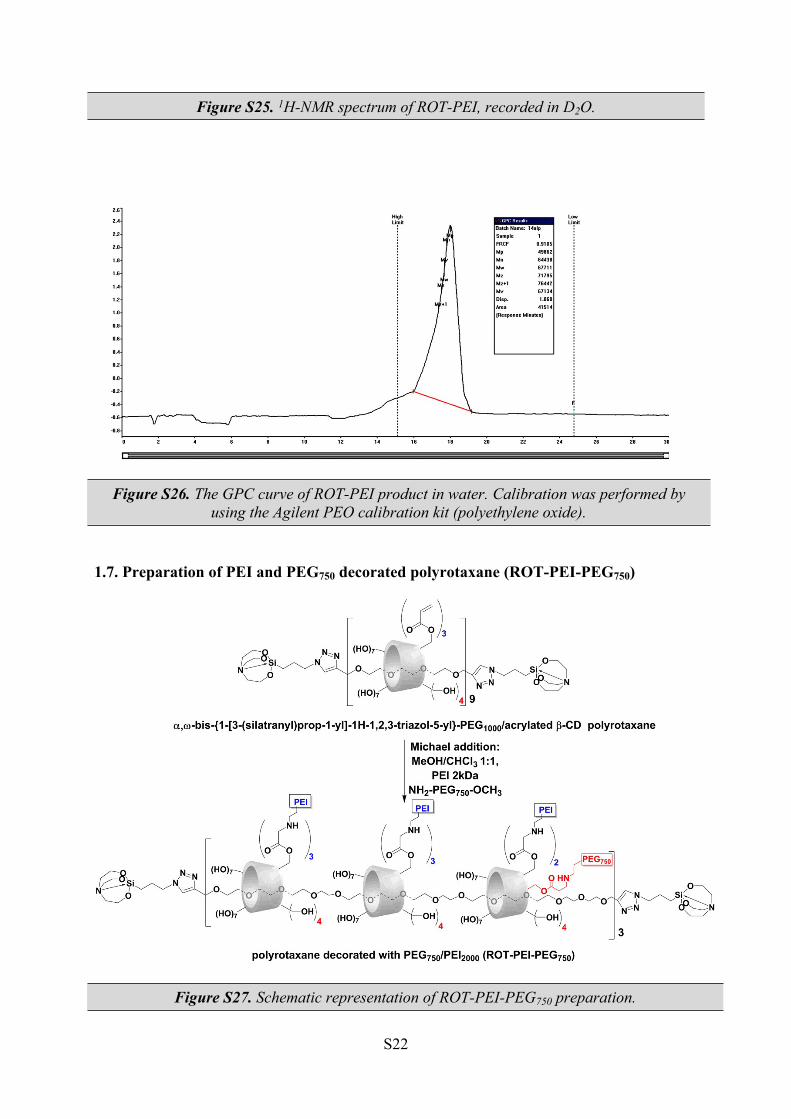
Figure S26. The GPC curve of ROT-PEI product in water……………………………… S21
1.7. Preparation of PEI and PEG750 decorated polyrotaxane (ROT-PEI-PEG750)…. S21
Figure S27. Schematic representation of ROT-PEI-PEG750 preparation………………. S21
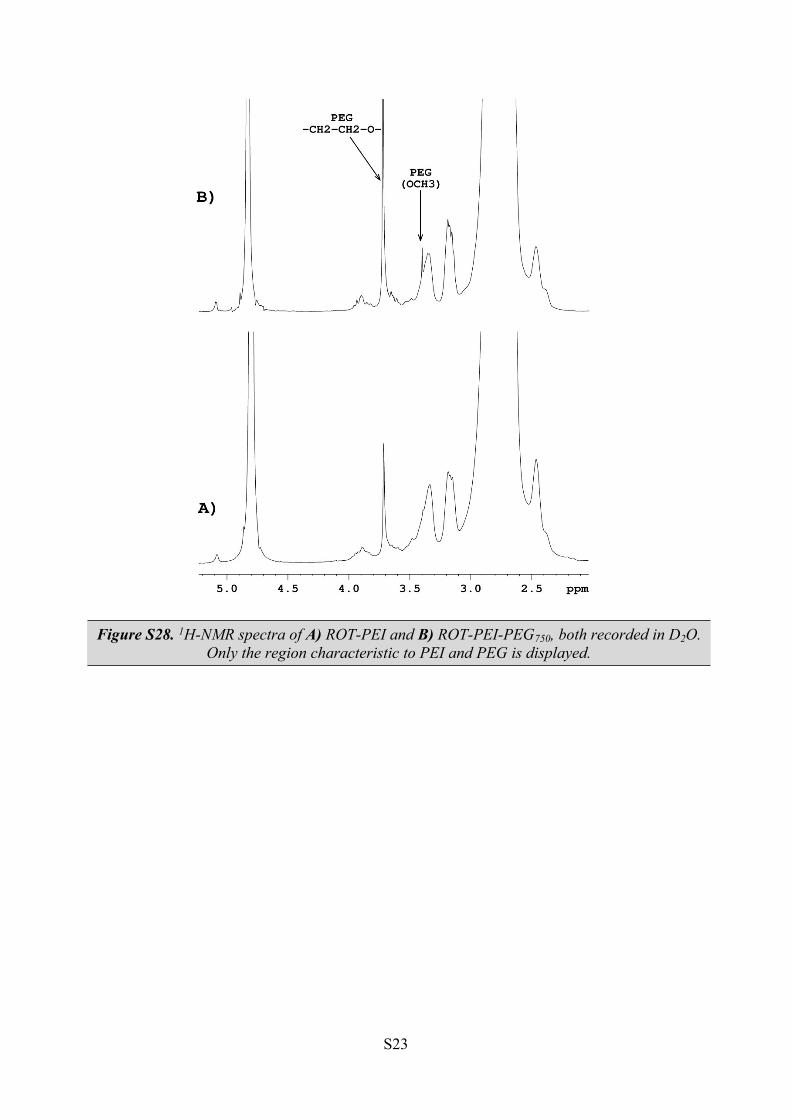
Figure S28. 1H-NMR spectra of A) ROT-PEI and B) ROT-PEI-PEG750, both recorded in D2O……………………………………………………………………………………. S22
S3
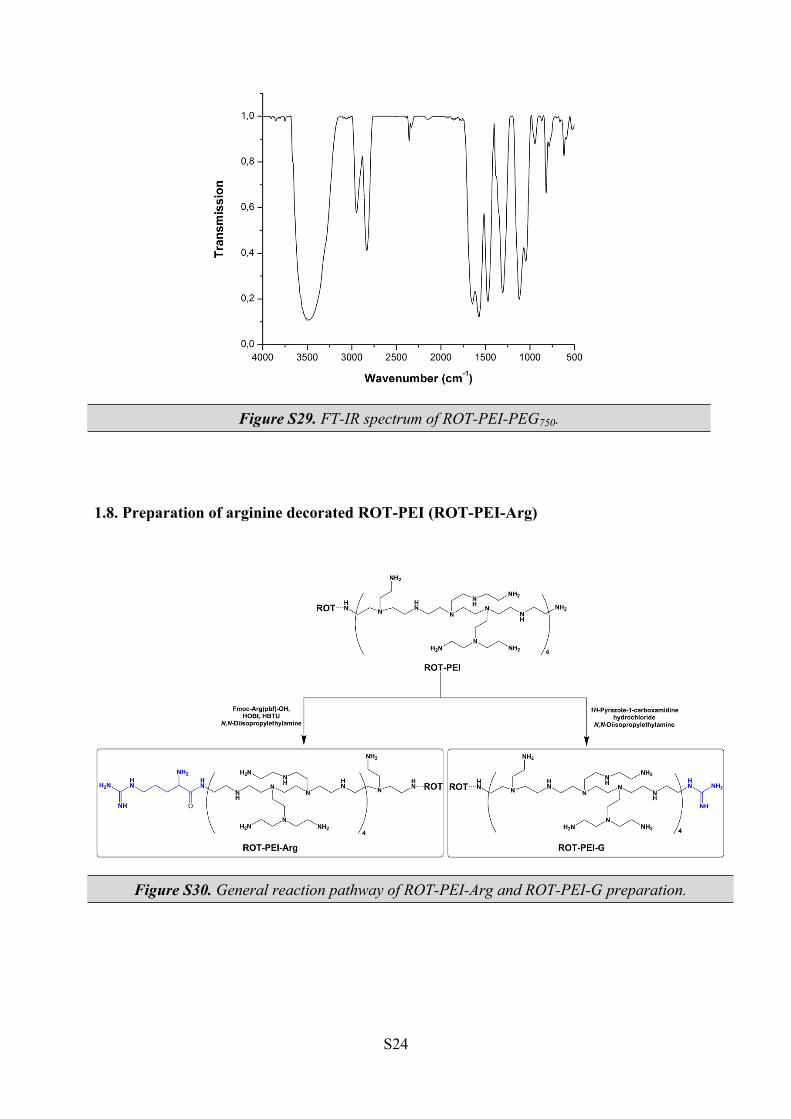
Figure S29. FT-IR spectrum of ROT-PEI-PEG750………………………………………. S23
1.8. Preparation of arginine decorated ROT-PEI (ROT-PEI-Arg)…………………. S23
Figure S30. General reaction pathway of ROT-PEI-Arg and ROT-PEI-G preparation… S23
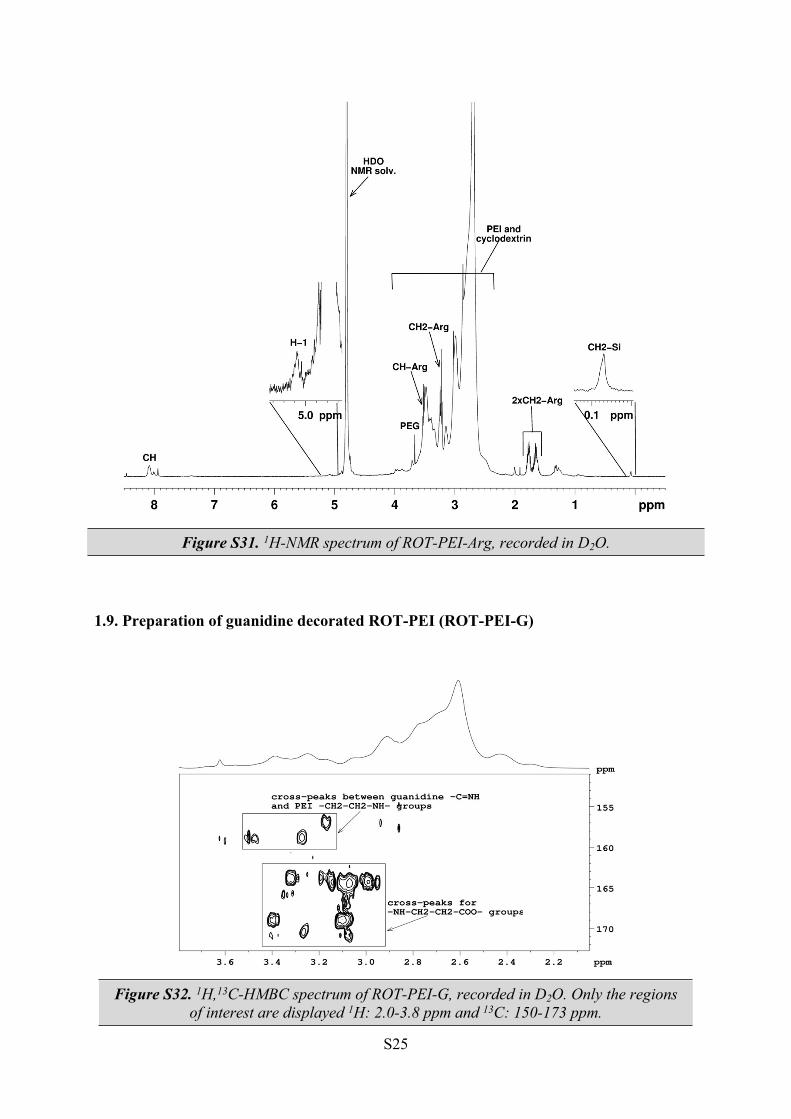
Figure S31. 1H-NMR spectrum of ROT-PEI-Arg, recorded in D2O……………………. S24
1.9. Preparation of guanidine decorated ROT-PEI (ROT-PEI-G)………………….. S24
Figure S32. 1H, 13C-HMBC spectrum of ROT-PEI-G, recorded in D2O……………….. S24
2. Elemental analysis of the investigated carriers…………………………………….. S25
Table S1. Elemental composition of the investigated carriers [mass %]………………... S25
3. In silico chemical modeling …………………………………………………………. S26
Figure S33. (A) Moment of inertia (MOI) variation during the production molecular dynamics simulation, as a measure of system equilibration. (B) Snapshot of the structure of the polyrotaxane aggregate at the end of the 10 ns MD simulation………… S26
4. The efficacy of carriers – dsDNA electrostatic complexation (Gel retardation assay)…………………………………………………………………………………….. S27
Figure S34. Gel retardation assay of ROT-PEI/pDNA, ROT PEI PEG750/pDNA, ROT PEI-G/pDNA, ROT PEI Arg/pDNA polyplexes at various N/P ratios from 1 to 60……. S27
5. Cytotoxicity assay……………………………………………………………………. S28
Figure S35. The results of cytotoxicity tests in the series of investigated transfection agents…………………………………………………………………………………….. S28
6. Transfection efficacy tests…………………………………………………………… S29
Figure S36. Fluorescence microcopy images of GFP-transfected cells, using ROT-PEI/pGFP, ROT-PEI-PEG750/pGFP, ROT-PEI-G/pGFP, ROT-PEI-Arg/pGFP and PEI (2 kDa)/pGFP as transfection agents, at all tested N/P ratios (from 5 to 80)……………. S29
7. Zeta potential measurements of polyplexes………………………………………… S30
Figure S37. The zeta potential variation of ROT-PEI/pDNA, ROT-PEI-PEG750/pDNA, ROT-PEI-G/pDNA and ROT-PEI-Arg/pDNA polyplexes…..………………………….. S30
8. Transmission electron microscopy (TEM)…………………………………………. S31
Figure S38. TEM images of ROT-PEI/pDNA, ROT-PEI-PEG750/pDNA, ROT-PEI-G/pDNA and ROT-PEI-Arg/pDNA polyplexes…………………………………………. S31
Figure S39. Size distribution of polyplex particles, obtained at N/P ratios of maximum transfection efficiency, according to TEM data………………………………………….. S32
9. Size measurements by Dynamic Light Scattering (DLS) analysis……………….. S33
S4
Table S2. Sizes of ROT-PEI/pDNA, ROT-PEI-PEG750/pDNA, ROT-PEI-G/pDNA and ROT-PEI-Arg/pDNA polyplexes obtained by DLS……………………………………... S33
10. The in silico estimation of the volume of cargocomplexes……………………….. S34
Figure S40. The results of the calculation Van der Waals lateral surfaces enclosing the ROT-PEI polyrotaxane carrier, and the Dickerson-Drew DNA dodecamer...................... S34
1. Chemical syntheses
1.1. Synthesis and characterization of acrylated β-cyclodextrin β-CD
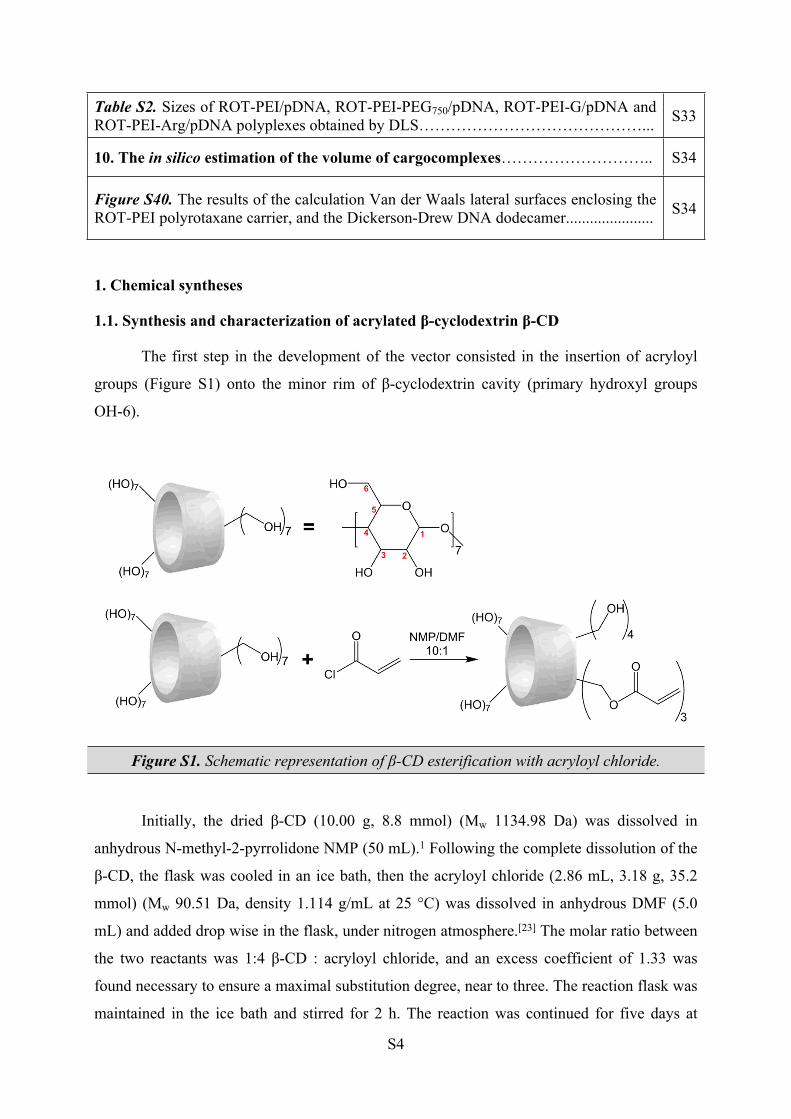
The first step in the development of the vector consisted in the insertion of acryloyl
groups (Figure S1) onto the minor rim of β-cyclodextrin cavity (primary hydroxyl groups
OH-6).
Figure S1. Schematic representation of β-CD esterification with acryloyl chloride.
Initially, the dried β-CD (10.00 g, 8.8 mmol) (Mw 1134.98 Da) was dissolved in
anhydrous N-methyl-2-pyrrolidone NMP (50 mL).1 Following the complete dissolution of the
β-CD, the flask was cooled in an ice bath, then the acryloyl chloride (2.86 mL, 3.18 g, 35.2
mmol) (Mw 90.51 Da, density 1.114 g/mL at 25 °C) was dissolved in anhydrous DMF (5.0
mL) and added drop wise in the flask, under nitrogen atmosphere.[23] The molar ratio between
the two reactants was 1:4 β-CD : acryloyl chloride, and an excess coefficient of 1.33 was
found necessary to ensure a maximal substitution degree, near to three. The reaction flask was
maintained in the ice bath and stirred for 2 h. The reaction was continued for five days at
S5
room temperature. Further, the reaction mixture was added drop wise in a buffer solution (250
mL, pH 7.0) to precipitate the acrylated product. Following the complete precipitation, the
solid product was filtered, washed twice with deionized water and dried under vacuum. The
crude solid product was twice recrystallized from methanol and dried under vacuum. The
final product (9.48 g; yield 83.0 %) is soluble in methanol, acetone and tetrahydrofuran.
According to elemental analysis, 42.85% of the primary hydroxyl groups (OH-6) of β-CD
were esterified in the final product, which is equivalent to a substitution degree of 3.0 (Mw
1297 Da).
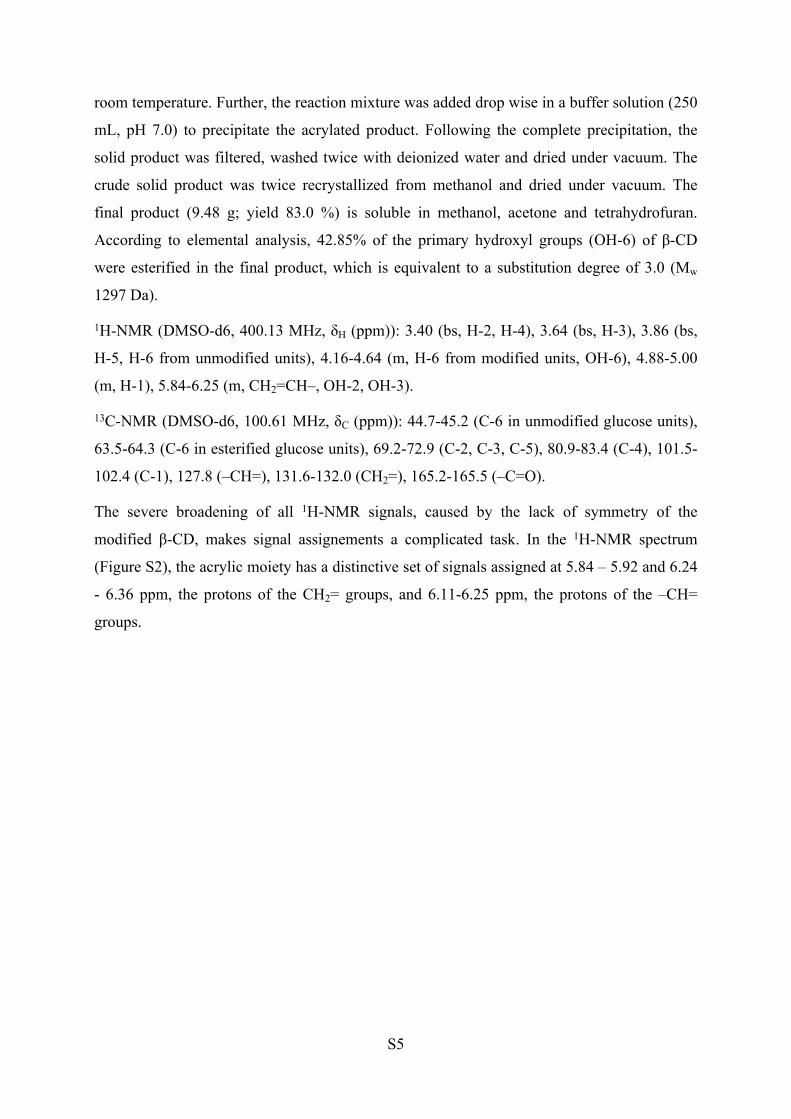
1H-NMR (DMSO-d6, 400.13 MHz, δH (ppm)): 3.40 (bs, H-2, H-4), 3.64 (bs, H-3), 3.86 (bs,
H-5, H-6 from unmodified units), 4.16-4.64 (m, H-6 from modified units, OH-6), 4.88-5.00
(m, H-1), 5.84-6.25 (m, CH2=CH–, OH-2, OH-3).
13C-NMR (DMSO-d6, 100.61 MHz, δC (ppm)): 44.7-45.2 (C-6 in unmodified glucose units),
63.5-64.3 (C-6 in esterified glucose units), 69.2-72.9 (C-2, C-3, C-5), 80.9-83.4 (C-4), 101.5-
102.4 (C-1), 127.8 (–CH=), 131.6-132.0 (CH2=), 165.2-165.5 (–C=O).
The severe broadening of all 1H-NMR signals, caused by the lack of symmetry of the
modified β-CD, makes signal assignements a complicated task. In the 1H-NMR spectrum
(Figure S2), the acrylic moiety has a distinctive set of signals assigned at 5.84 – 5.92 and 6.24
- 6.36 ppm, the protons of the CH2= groups, and 6.11-6.25 ppm, the protons of the –CH=
groups.
S6
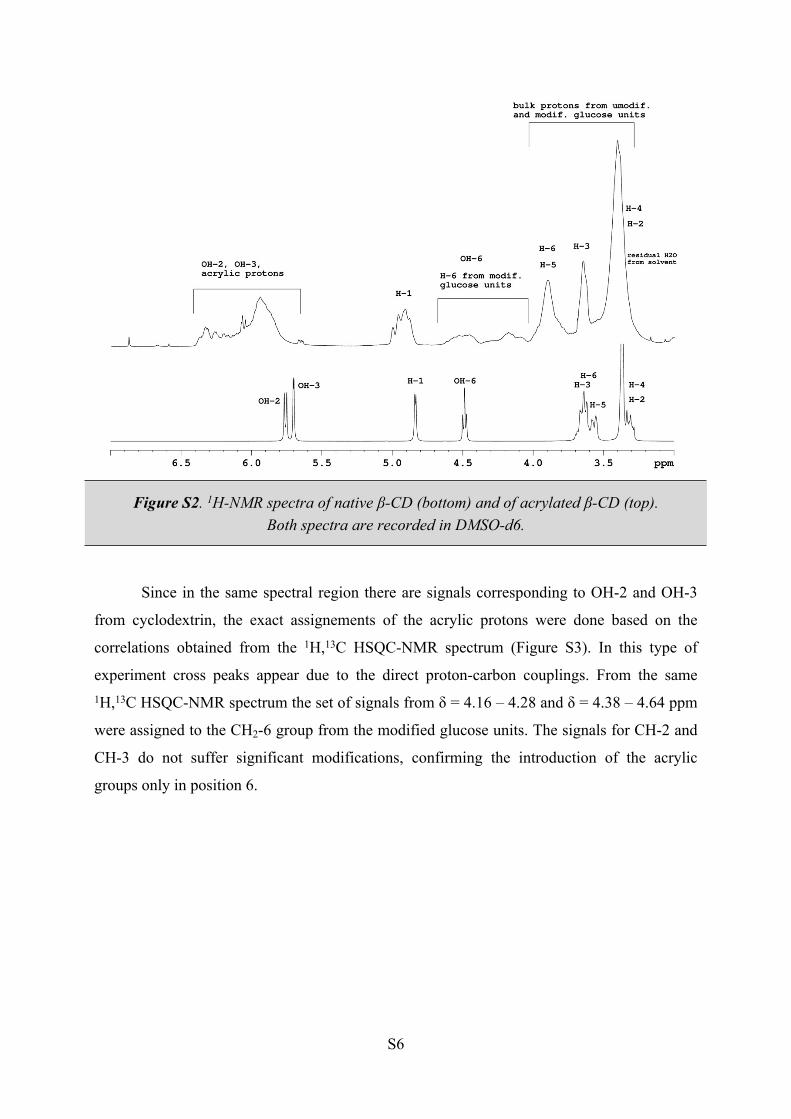
Figure S2. 1H-NMR spectra of native β-CD (bottom) and of acrylated β-CD (top).Both spectra are recorded in DMSO-d6.
Since in the same spectral region there are signals corresponding to OH-2 and OH-3
from cyclodextrin, the exact assignements of the acrylic protons were done based on the
correlations obtained from the 1H,13C HSQC-NMR spectrum (Figure S3). In this type of
experiment cross peaks appear due to the direct proton-carbon couplings. From the same 1H,13C HSQC-NMR spectrum the set of signals from δ = 4.16 – 4.28 and δ = 4.38 – 4.64 ppm
were assigned to the CH2-6 group from the modified glucose units. The signals for CH-2 and
CH-3 do not suffer significant modifications, confirming the introduction of the acrylic
groups only in position 6.
S7
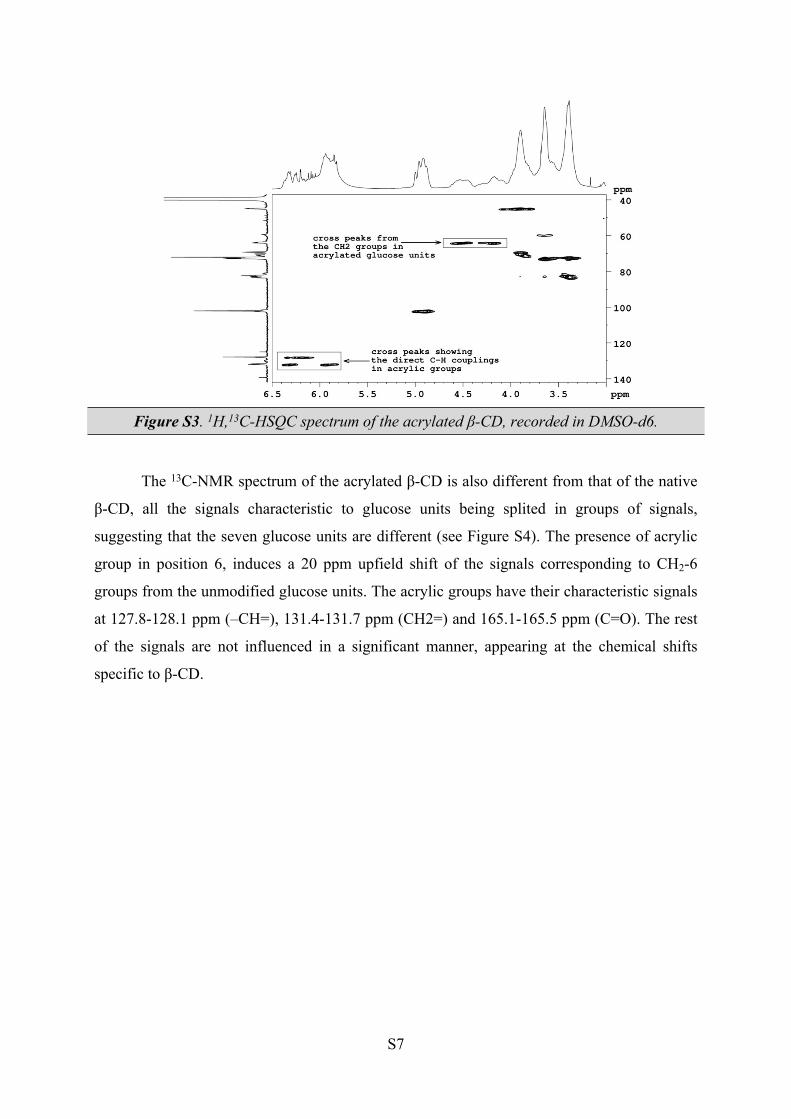
Figure S3. 1H,13C-HSQC spectrum of the acrylated β-CD, recorded in DMSO-d6.
The 13C-NMR spectrum of the acrylated β-CD is also different from that of the native
β-CD, all the signals characteristic to glucose units being splited in groups of signals,
suggesting that the seven glucose units are different (see Figure S4). The presence of acrylic
group in position 6, induces a 20 ppm upfield shift of the signals corresponding to CH2-6
groups from the unmodified glucose units. The acrylic groups have their characteristic signals
at 127.8-128.1 ppm (–CH=), 131.4-131.7 ppm (CH2=) and 165.1-165.5 ppm (C=O). The rest
of the signals are not influenced in a significant manner, appearing at the chemical shifts
specific to β-CD.
S8
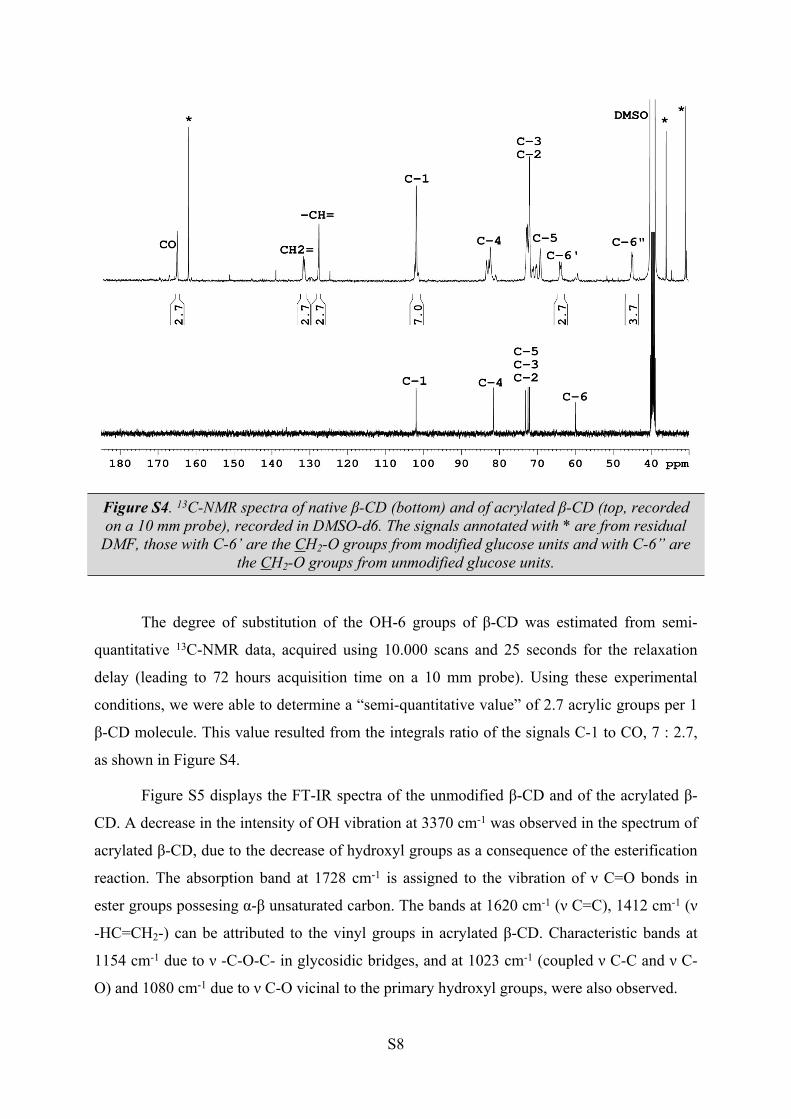
Figure S4. 13C-NMR spectra of native β-CD (bottom) and of acrylated β-CD (top, recorded on a 10 mm probe), recorded in DMSO-d6. The signals annotated with * are from residual
DMF, those with C-6’ are the CH2-O groups from modified glucose units and with C-6” are the CH2-O groups from unmodified glucose units.
The degree of substitution of the OH-6 groups of β-CD was estimated from semi-
quantitative 13C-NMR data, acquired using 10.000 scans and 25 seconds for the relaxation
delay (leading to 72 hours acquisition time on a 10 mm probe). Using these experimental
conditions, we were able to determine a “semi-quantitative value” of 2.7 acrylic groups per 1
β-CD molecule. This value resulted from the integrals ratio of the signals C-1 to CO, 7 : 2.7,
as shown in Figure S4.
Figure S5 displays the FT-IR spectra of the unmodified β-CD and of the acrylated β-
CD. A decrease in the intensity of OH vibration at 3370 cm-1 was observed in the spectrum of
acrylated β-CD, due to the decrease of hydroxyl groups as a consequence of the esterification
reaction. The absorption band at 1728 cm-1 is assigned to the vibration of ν C=O bonds in
ester groups possesing α-β unsaturated carbon. The bands at 1620 cm-1 (ν C=C), 1412 cm-1 (ν
-HC=CH2-) can be attributed to the vinyl groups in acrylated β-CD. Characteristic bands at
1154 cm-1 due to ν -C-O-C- in glycosidic bridges, and at 1023 cm-1 (coupled ν C-C and ν C-
O) and 1080 cm-1 due to ν C-O vicinal to the primary hydroxyl groups, were also observed.
S9
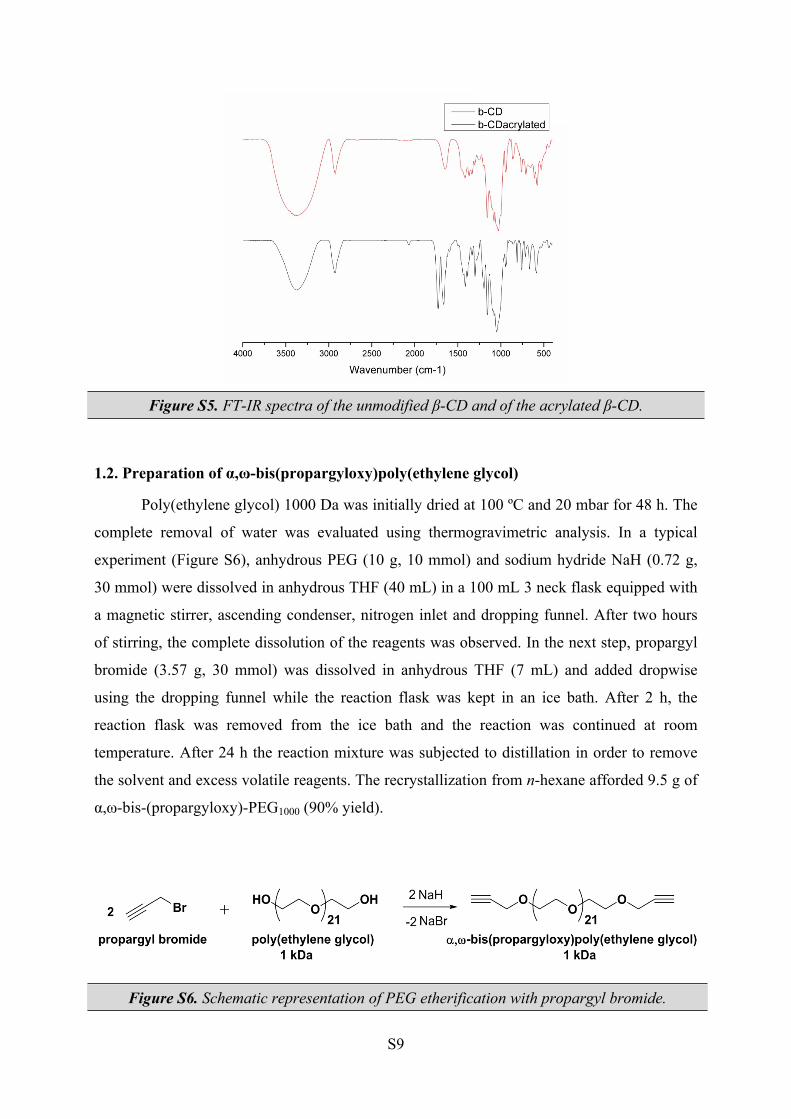
Figure S5. FT-IR spectra of the unmodified β-CD and of the acrylated β-CD.
1.2. Preparation of α,ω-bis(propargyloxy)poly(ethylene glycol)
Poly(ethylene glycol) 1000 Da was initially dried at 100 ºC and 20 mbar for 48 h. The
complete removal of water was evaluated using thermogravimetric analysis. In a typical
experiment (Figure S6), anhydrous PEG (10 g, 10 mmol) and sodium hydride NaH (0.72 g,
30 mmol) were dissolved in anhydrous THF (40 mL) in a 100 mL 3 neck flask equipped with
a magnetic stirrer, ascending condenser, nitrogen inlet and dropping funnel. After two hours
of stirring, the complete dissolution of the reagents was observed. In the next step, propargyl
bromide (3.57 g, 30 mmol) was dissolved in anhydrous THF (7 mL) and added dropwise
using the dropping funnel while the reaction flask was kept in an ice bath. After 2 h, the
reaction flask was removed from the ice bath and the reaction was continued at room
temperature. After 24 h the reaction mixture was subjected to distillation in order to remove
the solvent and excess volatile reagents. The recrystallization from n-hexane afforded 9.5 g of
α,ω-bis-(propargyloxy)-PEG1000 (90% yield).
Figure S6. Schematic representation of PEG etherification with propargyl bromide.
S10
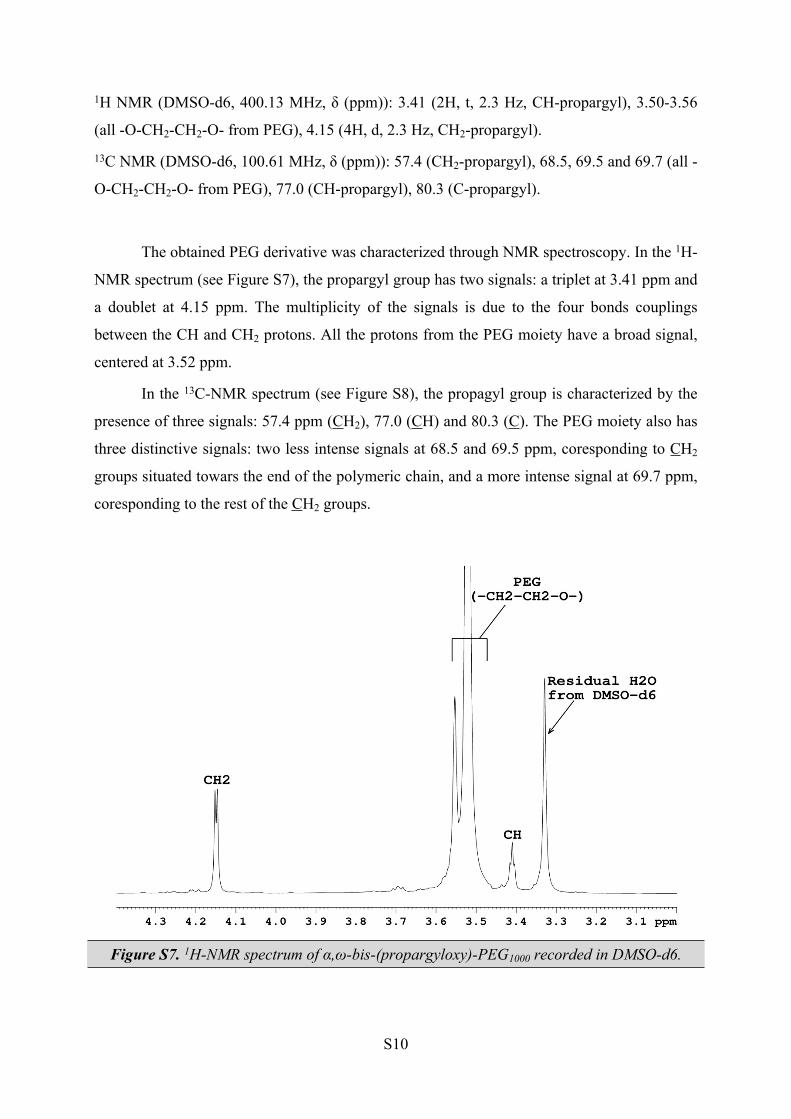
1H NMR (DMSO-d6, 400.13 MHz, δ (ppm)): 3.41 (2H, t, 2.3 Hz, CH-propargyl), 3.50-3.56
(all -O-CH2-CH2-O- from PEG), 4.15 (4H, d, 2.3 Hz, CH2-propargyl).
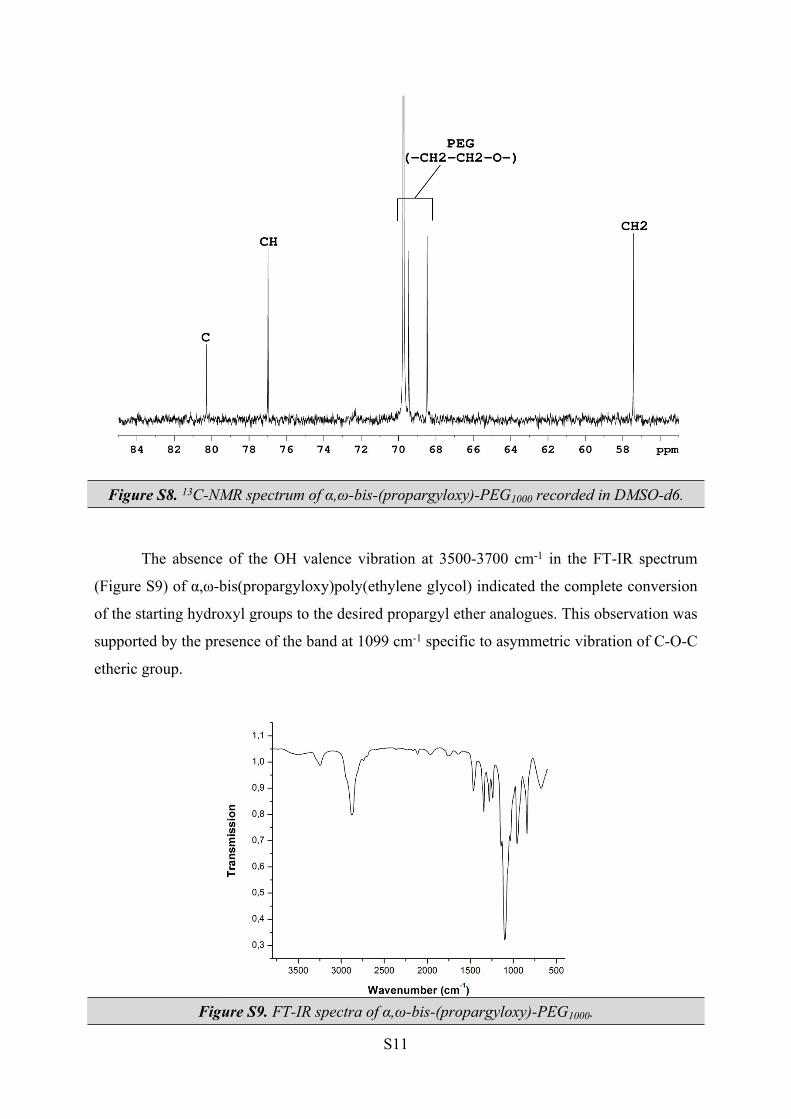
13C NMR (DMSO-d6, 100.61 MHz, δ (ppm)): 57.4 (CH2-propargyl), 68.5, 69.5 and 69.7 (all -
O-CH2-CH2-O- from PEG), 77.0 (CH-propargyl), 80.3 (C-propargyl).
The obtained PEG derivative was characterized through NMR spectroscopy. In the 1H-
NMR spectrum (see Figure S7), the propargyl group has two signals: a triplet at 3.41 ppm and
a doublet at 4.15 ppm. The multiplicity of the signals is due to the four bonds couplings
between the CH and CH2 protons. All the protons from the PEG moiety have a broad signal,
centered at 3.52 ppm.
In the 13C-NMR spectrum (see Figure S8), the propagyl group is characterized by the
presence of three signals: 57.4 ppm (CH2), 77.0 (CH) and 80.3 (C). The PEG moiety also has
three distinctive signals: two less intense signals at 68.5 and 69.5 ppm, coresponding to CH2
groups situated towars the end of the polymeric chain, and a more intense signal at 69.7 ppm,
coresponding to the rest of the CH2 groups.
Figure S7. 1H-NMR spectrum of α,ω-bis-(propargyloxy)-PEG1000 recorded in DMSO-d6.
S11
Figure S8. 13C-NMR spectrum of α,ω-bis-(propargyloxy)-PEG1000 recorded in DMSO-d6.
The absence of the OH valence vibration at 3500-3700 cm-1 in the FT-IR spectrum
(Figure S9) of α,ω-bis(propargyloxy)poly(ethylene glycol) indicated the complete conversion
of the starting hydroxyl groups to the desired propargyl ether analogues. This observation was
supported by the presence of the band at 1099 cm-1 specific to asymmetric vibration of C-O-C
etheric group.
Figure S9. FT-IR spectra of α,ω-bis-(propargyloxy)-PEG1000.
S12
1.3. Synthesis of 1-(3-bromopropyl)silatrane and 1(3-azidopropyl)silatrane
1.3.1. Synthesis of 1-(3-bromopropyl)silatrane
1-(3-bromopropyl)silatrane and 1-(3-azidopropyl)silatrane were prepared according
with the procedures described in the literature.2 In a typical experiment (Figure S10),
triethanoleamine (10 g, 67 mmol) and potassium hydroxide (0.2 g, 3.5 mmol) were dissolved
in toluene (40 ml) and mixed with 1-(3-bromopropyl)-trimethoxysilane (16.3 g, 67 mmol) at
80 ºC. The desired product 1-(3-bromopropyl)silatrane was separated by vacuum distillation
and subsequent recrystallization from chloroform, affording 10.52 g of transparent crystals
(53% yield).
Figure S10. Schematic representation of 1-(3-bromopropyl)silatrane synthesis.
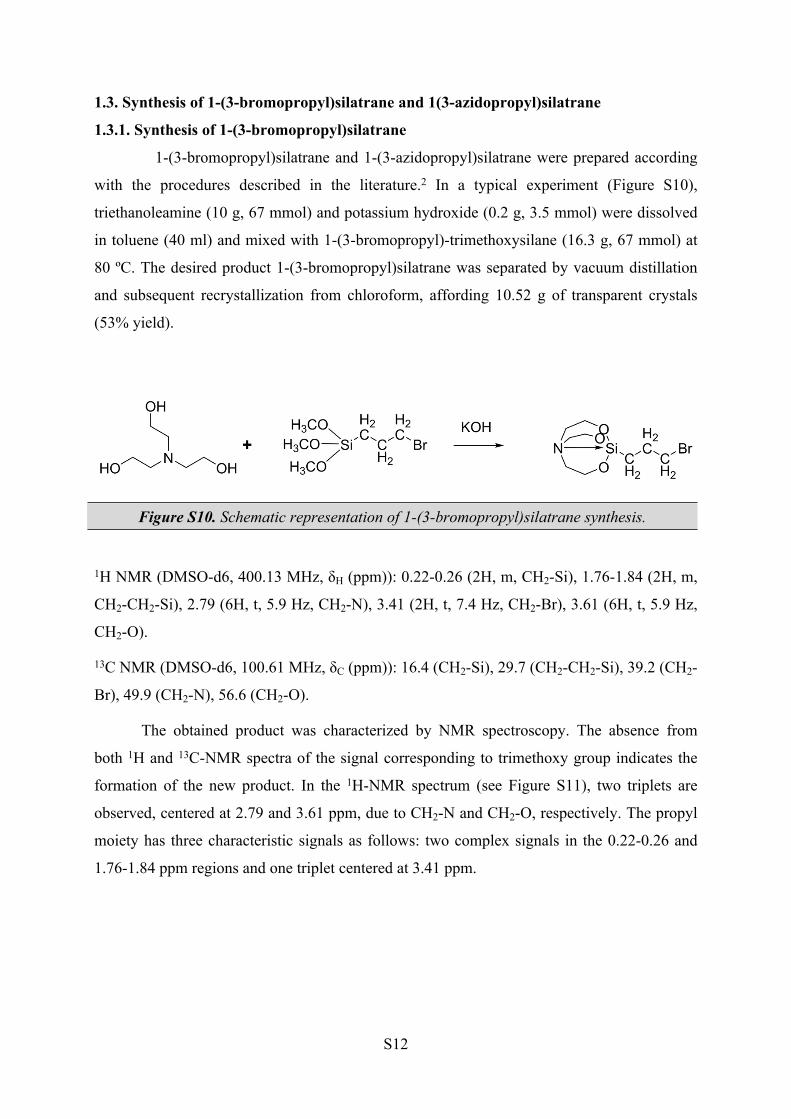
1H NMR (DMSO-d6, 400.13 MHz, δH (ppm)): 0.22-0.26 (2H, m, CH2-Si), 1.76-1.84 (2H, m,
CH2-CH2-Si), 2.79 (6H, t, 5.9 Hz, CH2-N), 3.41 (2H, t, 7.4 Hz, CH2-Br), 3.61 (6H, t, 5.9 Hz,
CH2-O).
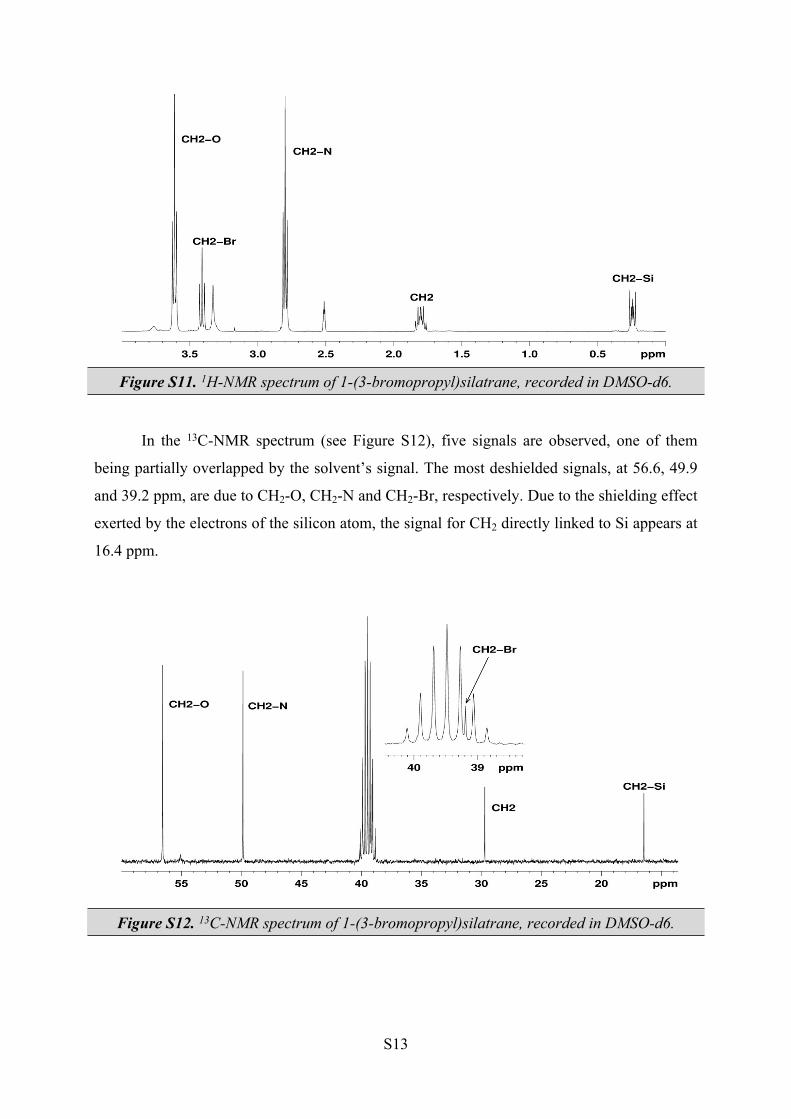
13C NMR (DMSO-d6, 100.61 MHz, δC (ppm)): 16.4 (CH2-Si), 29.7 (CH2-CH2-Si), 39.2 (CH2-
Br), 49.9 (CH2-N), 56.6 (CH2-O).
The obtained product was characterized by NMR spectroscopy. The absence from
both 1H and 13C-NMR spectra of the signal corresponding to trimethoxy group indicates the
formation of the new product. In the 1H-NMR spectrum (see Figure S11), two triplets are
observed, centered at 2.79 and 3.61 ppm, due to CH2-N and CH2-O, respectively. The propyl
moiety has three characteristic signals as follows: two complex signals in the 0.22-0.26 and
1.76-1.84 ppm regions and one triplet centered at 3.41 ppm.
S13
Figure S11. 1H-NMR spectrum of 1-(3-bromopropyl)silatrane, recorded in DMSO-d6.
In the 13C-NMR spectrum (see Figure S12), five signals are observed, one of them
being partially overlapped by the solvent’s signal. The most deshielded signals, at 56.6, 49.9
and 39.2 ppm, are due to CH2-O, CH2-N and CH2-Br, respectively. Due to the shielding effect
exerted by the electrons of the silicon atom, the signal for CH2 directly linked to Si appears at
16.4 ppm.
Figure S12. 13C-NMR spectrum of 1-(3-bromopropyl)silatrane, recorded in DMSO-d6.
S14
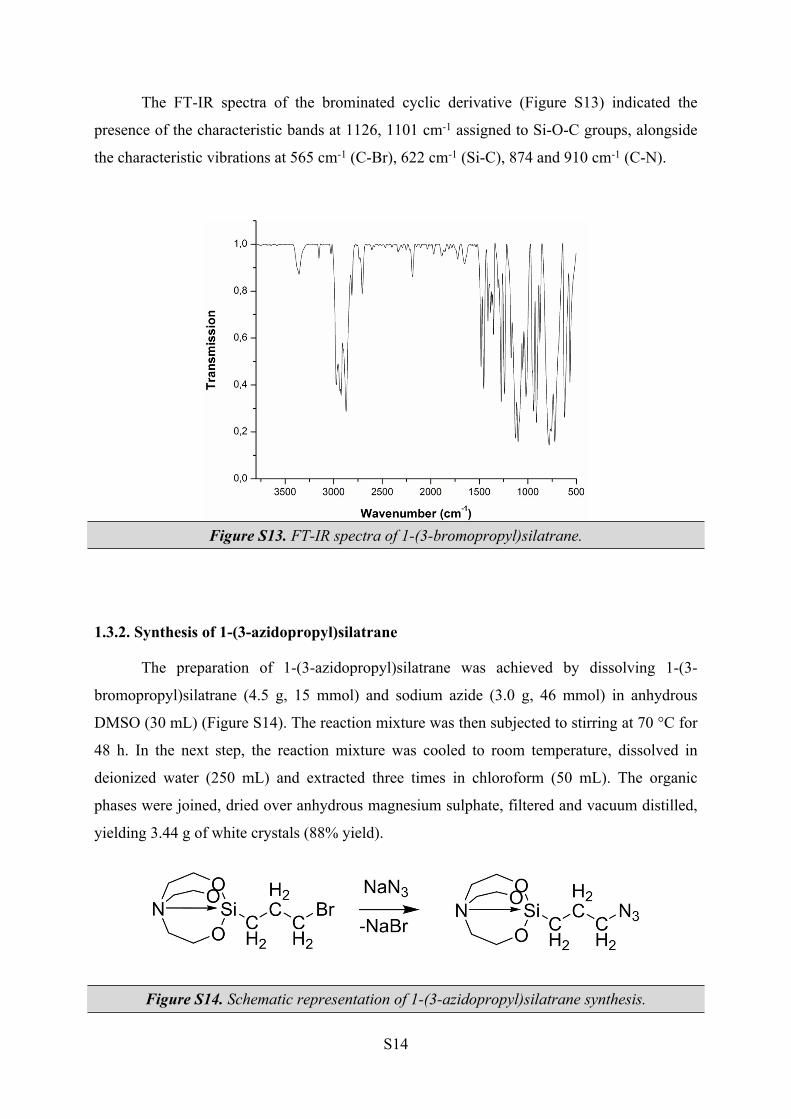
The FT-IR spectra of the brominated cyclic derivative (Figure S13) indicated the
presence of the characteristic bands at 1126, 1101 cm-1 assigned to Si-O-C groups, alongside
the characteristic vibrations at 565 cm-1 (C-Br), 622 cm-1 (Si-C), 874 and 910 cm-1 (C-N).
Figure S13. FT-IR spectra of 1-(3-bromopropyl)silatrane.
1.3.2. Synthesis of 1-(3-azidopropyl)silatrane
The preparation of 1-(3-azidopropyl)silatrane was achieved by dissolving 1-(3-
bromopropyl)silatrane (4.5 g, 15 mmol) and sodium azide (3.0 g, 46 mmol) in anhydrous
DMSO (30 mL) (Figure S14). The reaction mixture was then subjected to stirring at 70 °C for
48 h. In the next step, the reaction mixture was cooled to room temperature, dissolved in
deionized water (250 mL) and extracted three times in chloroform (50 mL). The organic
phases were joined, dried over anhydrous magnesium sulphate, filtered and vacuum distilled,
yielding 3.44 g of white crystals (88% yield).
Figure S14. Schematic representation of 1-(3-azidopropyl)silatrane synthesis.
S15
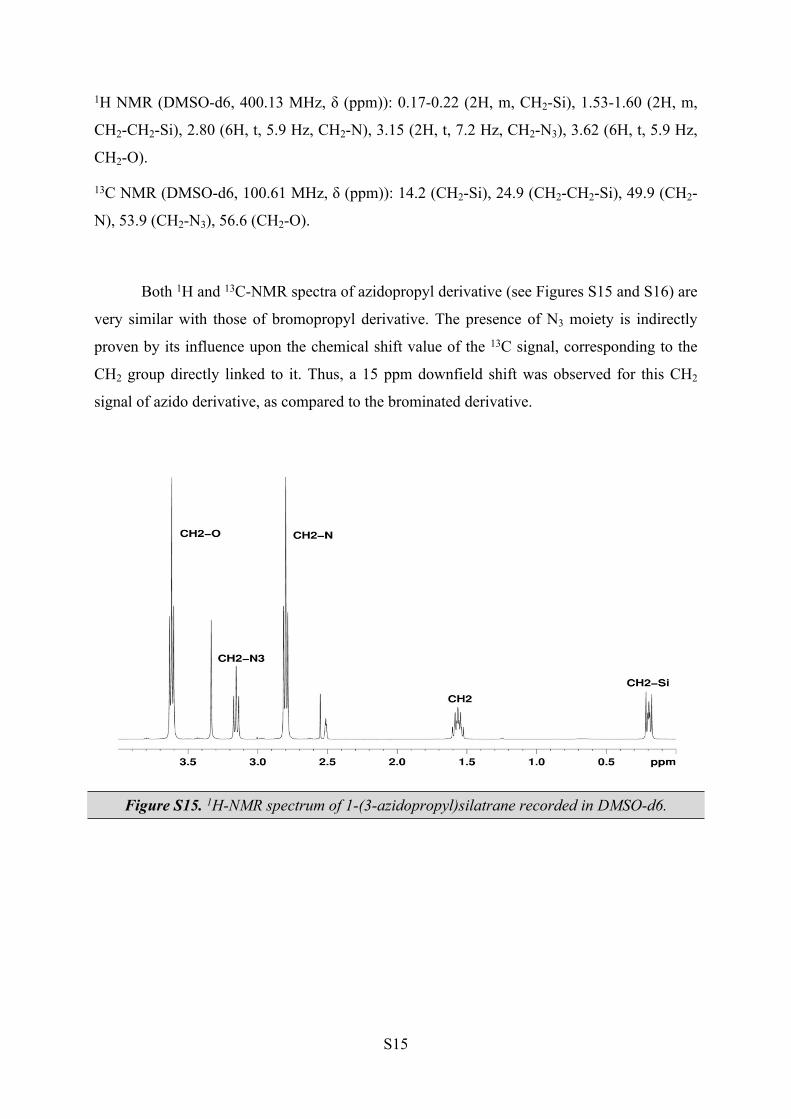
1H NMR (DMSO-d6, 400.13 MHz, δ (ppm)): 0.17-0.22 (2H, m, CH2-Si), 1.53-1.60 (2H, m,
CH2-CH2-Si), 2.80 (6H, t, 5.9 Hz, CH2-N), 3.15 (2H, t, 7.2 Hz, CH2-N3), 3.62 (6H, t, 5.9 Hz,
CH2-O).
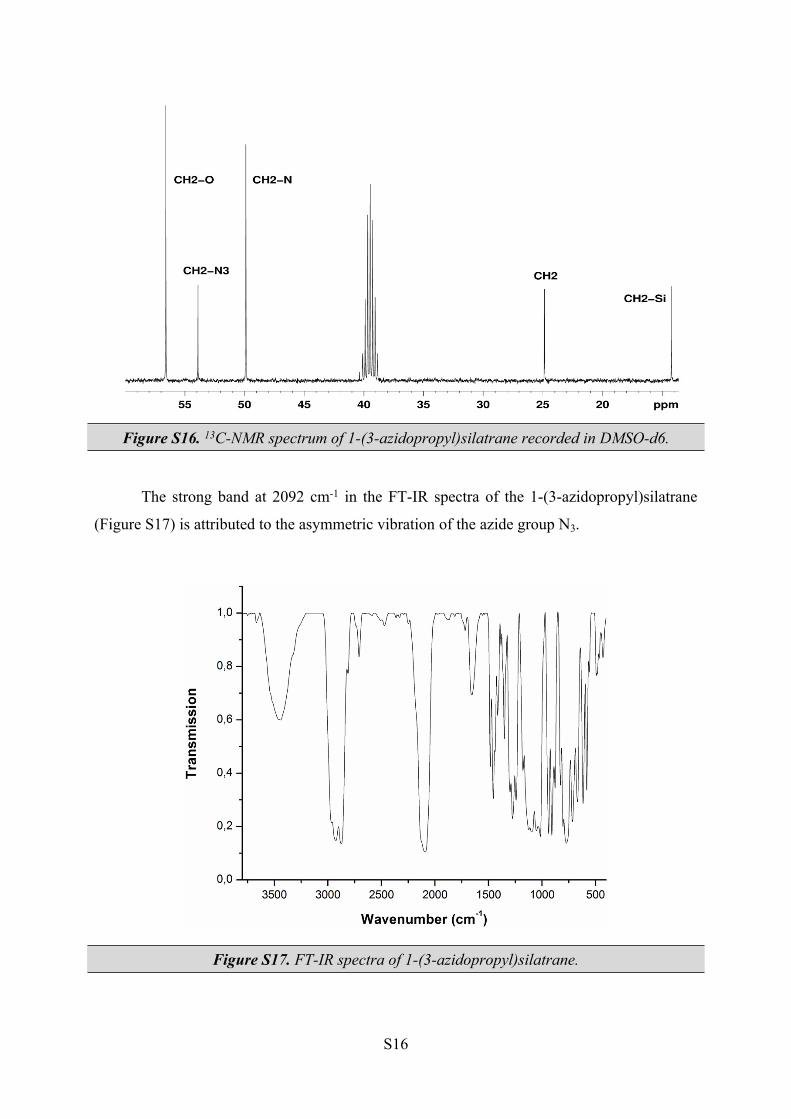
13C NMR (DMSO-d6, 100.61 MHz, δ (ppm)): 14.2 (CH2-Si), 24.9 (CH2-CH2-Si), 49.9 (CH2-
N), 53.9 (CH2-N3), 56.6 (CH2-O).
Both 1H and 13C-NMR spectra of azidopropyl derivative (see Figures S15 and S16) are
very similar with those of bromopropyl derivative. The presence of N3 moiety is indirectly
proven by its influence upon the chemical shift value of the 13C signal, corresponding to the
CH2 group directly linked to it. Thus, a 15 ppm downfield shift was observed for this CH2
signal of azido derivative, as compared to the brominated derivative.
Figure S15. 1H-NMR spectrum of 1-(3-azidopropyl)silatrane recorded in DMSO-d6.
S16
Figure S16. 13C-NMR spectrum of 1-(3-azidopropyl)silatrane recorded in DMSO-d6.
The strong band at 2092 cm-1 in the FT-IR spectra of the 1-(3-azidopropyl)silatrane
(Figure S17) is attributed to the asymmetric vibration of the azide group N3.
Figure S17. FT-IR spectra of 1-(3-azidopropyl)silatrane.
S17
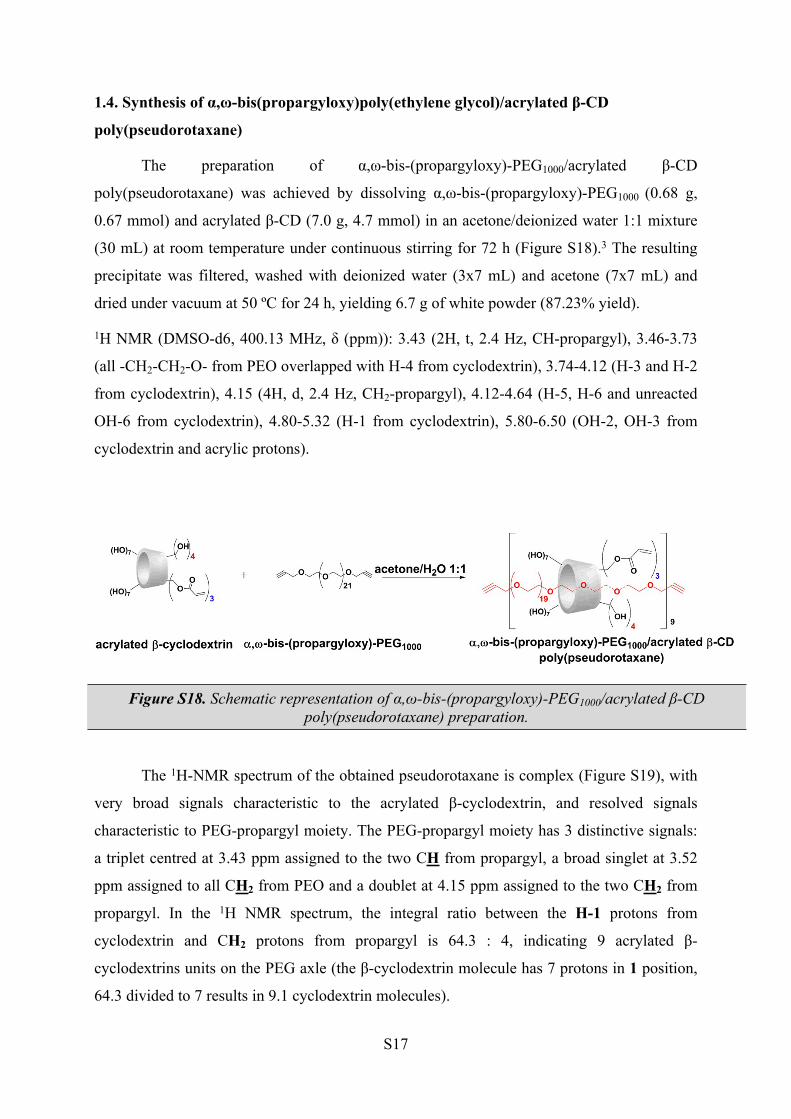
1.4. Synthesis of α,ω-bis(propargyloxy)poly(ethylene glycol)/acrylated β-CD
poly(pseudorotaxane)
The preparation of α,ω-bis-(propargyloxy)-PEG1000/acrylated β-CD
poly(pseudorotaxane) was achieved by dissolving α,ω-bis-(propargyloxy)-PEG1000 (0.68 g,
0.67 mmol) and acrylated β-CD (7.0 g, 4.7 mmol) in an acetone/deionized water 1:1 mixture
(30 mL) at room temperature under continuous stirring for 72 h (Figure S18).3 The resulting
precipitate was filtered, washed with deionized water (3x7 mL) and acetone (7x7 mL) and
dried under vacuum at 50 ºC for 24 h, yielding 6.7 g of white powder (87.23% yield).
1H NMR (DMSO-d6, 400.13 MHz, δ (ppm)): 3.43 (2H, t, 2.4 Hz, CH-propargyl), 3.46-3.73
(all -CH2-CH2-O- from PEO overlapped with H-4 from cyclodextrin), 3.74-4.12 (H-3 and H-2
from cyclodextrin), 4.15 (4H, d, 2.4 Hz, CH2-propargyl), 4.12-4.64 (H-5, H-6 and unreacted
OH-6 from cyclodextrin), 4.80-5.32 (H-1 from cyclodextrin), 5.80-6.50 (OH-2, OH-3 from
cyclodextrin and acrylic protons).
Figure S18. Schematic representation of α,ω-bis-(propargyloxy)-PEG1000/acrylated β-CD poly(pseudorotaxane) preparation.
The 1H-NMR spectrum of the obtained pseudorotaxane is complex (Figure S19), with
very broad signals characteristic to the acrylated β-cyclodextrin, and resolved signals
characteristic to PEG-propargyl moiety. The PEG-propargyl moiety has 3 distinctive signals:
a triplet centred at 3.43 ppm assigned to the two CH from propargyl, a broad singlet at 3.52
ppm assigned to all CH2 from PEO and a doublet at 4.15 ppm assigned to the two CH2 from
propargyl. In the 1H NMR spectrum, the integral ratio between the H-1 protons from
cyclodextrin and CH2 protons from propargyl is 64.3 : 4, indicating 9 acrylated β-
cyclodextrins units on the PEG axle (the β-cyclodextrin molecule has 7 protons in 1 position,
64.3 divided to 7 results in 9.1 cyclodextrin molecules).
S18
Figure S19. 1H-NMR spectrum of the prepared α,ω-bis-(propargyloxy)-PEG1000/acrylated β-CD poly(pseudorotaxane), recorded in DMSO-d6.
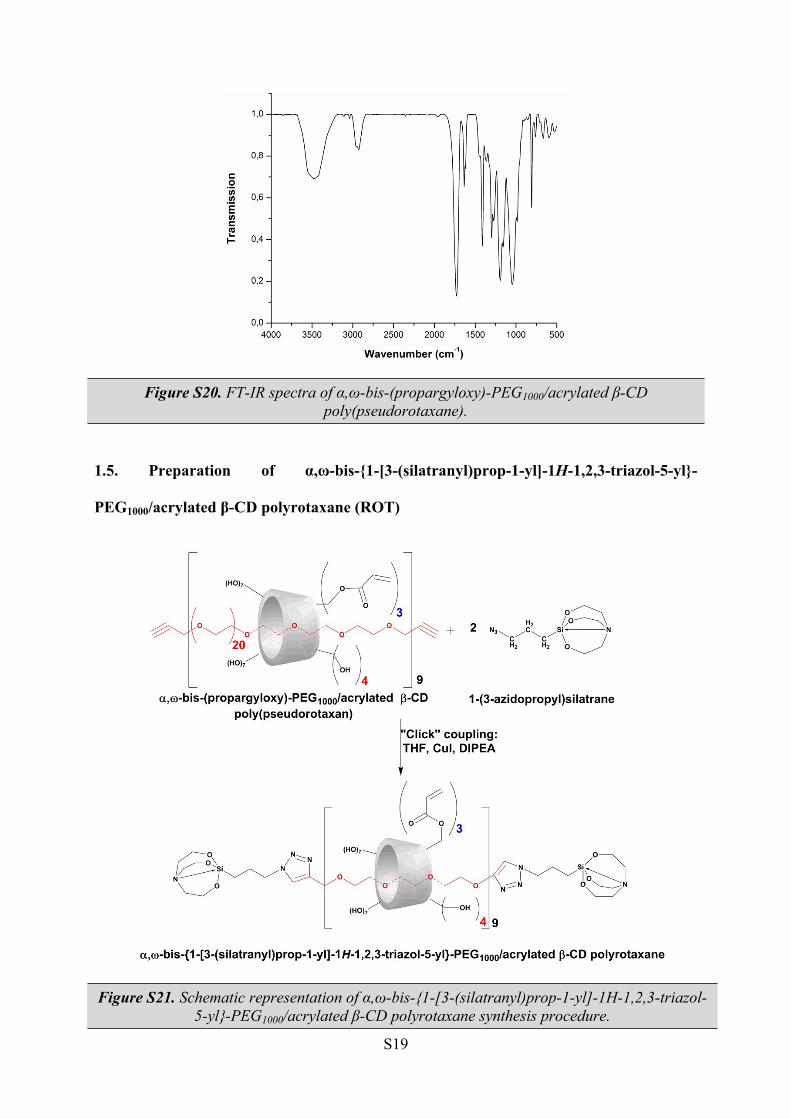
The FT-IR spectra of the poly(pseudorotaxane) comprised of α,ω-bis-(propargyloxy)-
PEG1000 as “guest” and partially acrylated β-CD as “host” revealed the characteristic bands
corresponding to the components (Figure S20). One can observe the absorption band of the
remaining hydroxyl groups centred at 3477 cm-1, alongside the methylene groups at 2927 cm-1.
The strong absorption band at 1728 cm-1 is due to the presence of the C=O carbonyl groups
inserted during the esterification of the primary hydroxyl groups with acryloyl chloride.
S19
Figure S20. FT-IR spectra of α,ω-bis-(propargyloxy)-PEG1000/acrylated β-CD poly(pseudorotaxane).
1.5. Preparation of α,ω-bis-{1-[3-(silatranyl)prop-1-yl]-1H-1,2,3-triazol-5-yl}-
PEG1000/acrylated β-CD polyrotaxane (ROT)
Figure S21. Schematic representation of α,ω-bis-{1-[3-(silatranyl)prop-1-yl]-1H-1,2,3-triazol-5-yl}-PEG1000/acrylated β-CD polyrotaxane synthesis procedure.
S20
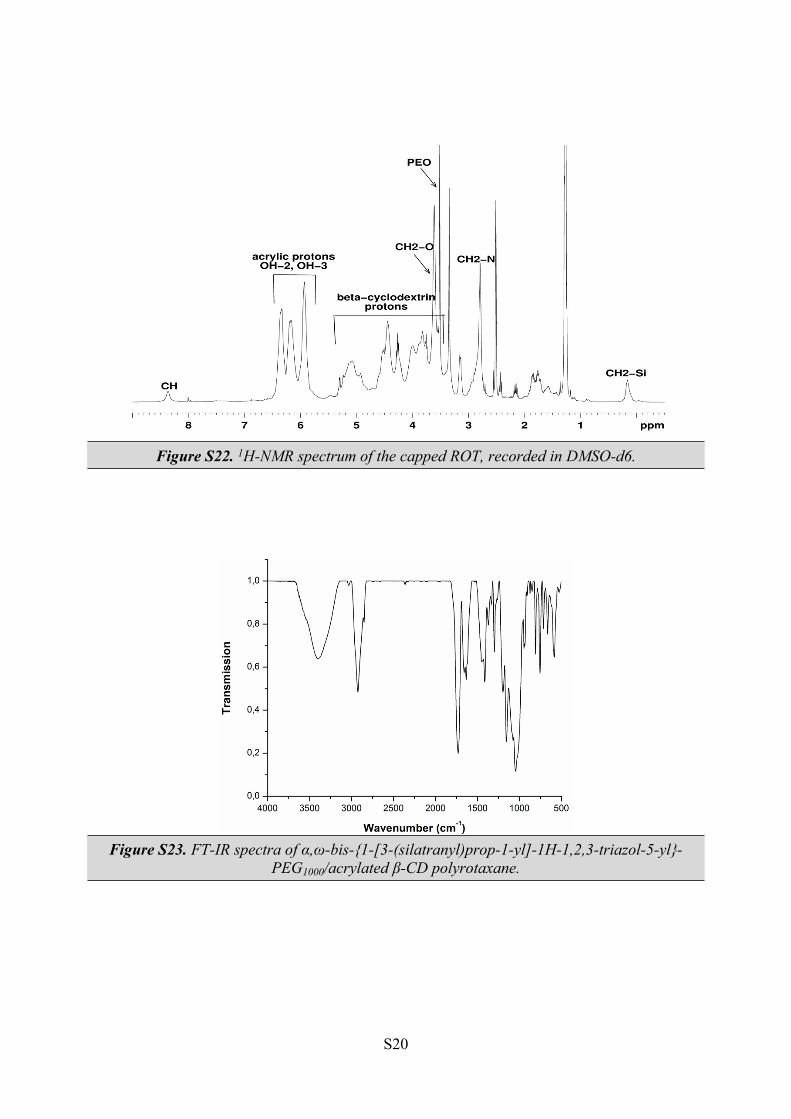
Figure S22. 1H-NMR spectrum of the capped ROT, recorded in DMSO-d6.
Figure S23. FT-IR spectra of α,ω-bis-{1-[3-(silatranyl)prop-1-yl]-1H-1,2,3-triazol-5-yl}-PEG1000/acrylated β-CD polyrotaxane.
S21
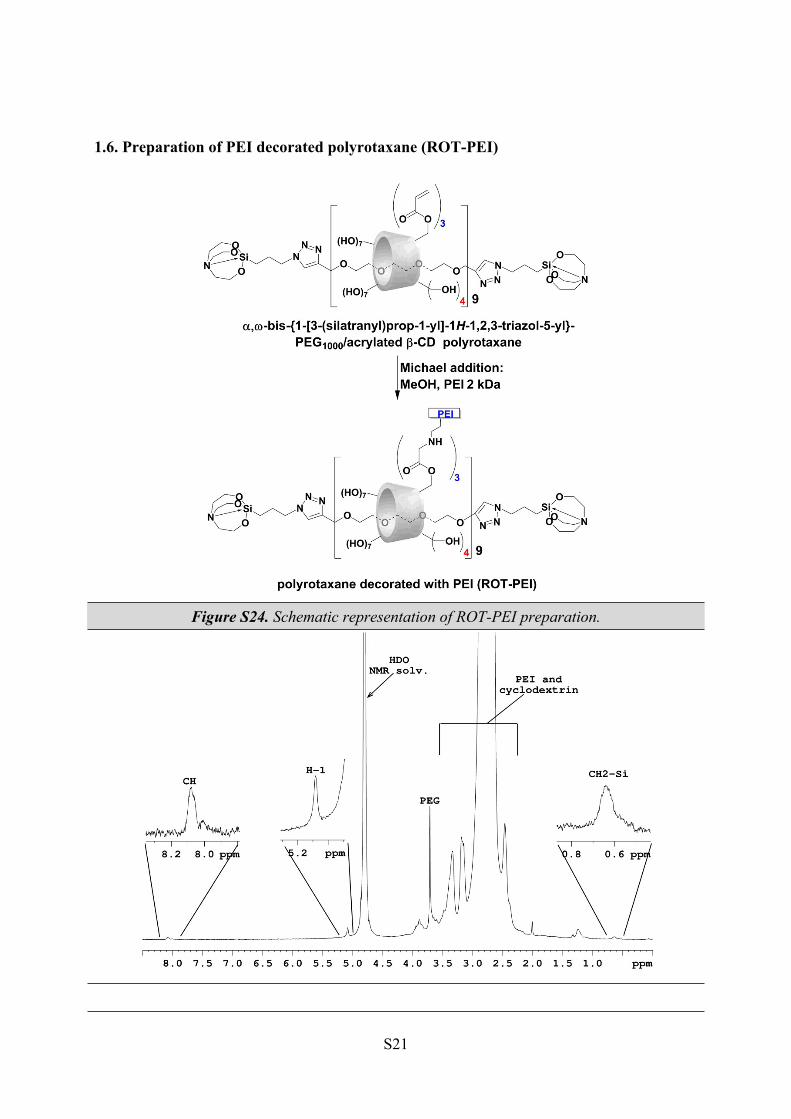
1.6. Preparation of PEI decorated polyrotaxane (ROT-PEI)
Figure S24. Schematic representation of ROT-PEI preparation.
S22
Figure S25. 1H-NMR spectrum of ROT-PEI, recorded in D2O.
Figure S26. The GPC curve of ROT-PEI product in water. Calibration was performed by using the Agilent PEO calibration kit (polyethylene oxide).
1.7. Preparation of PEI and PEG750 decorated polyrotaxane (ROT-PEI-PEG750)
Figure S27. Schematic representation of ROT-PEI-PEG750 preparation.
S23
Figure S28. 1H-NMR spectra of A) ROT-PEI and B) ROT-PEI-PEG750, both recorded in D2O. Only the region characteristic to PEI and PEG is displayed.
S24
Figure S29. FT-IR spectrum of ROT-PEI-PEG750.
1.8. Preparation of arginine decorated ROT-PEI (ROT-PEI-Arg)
Figure S30. General reaction pathway of ROT-PEI-Arg and ROT-PEI-G preparation.
S25
Figure S31. 1H-NMR spectrum of ROT-PEI-Arg, recorded in D2O.
1.9. Preparation of guanidine decorated ROT-PEI (ROT-PEI-G)
Figure S32. 1H,13C-HMBC spectrum of ROT-PEI-G, recorded in D2O. Only the regions of interest are displayed 1H: 2.0-3.8 ppm and 13C: 150-173 ppm.
S26
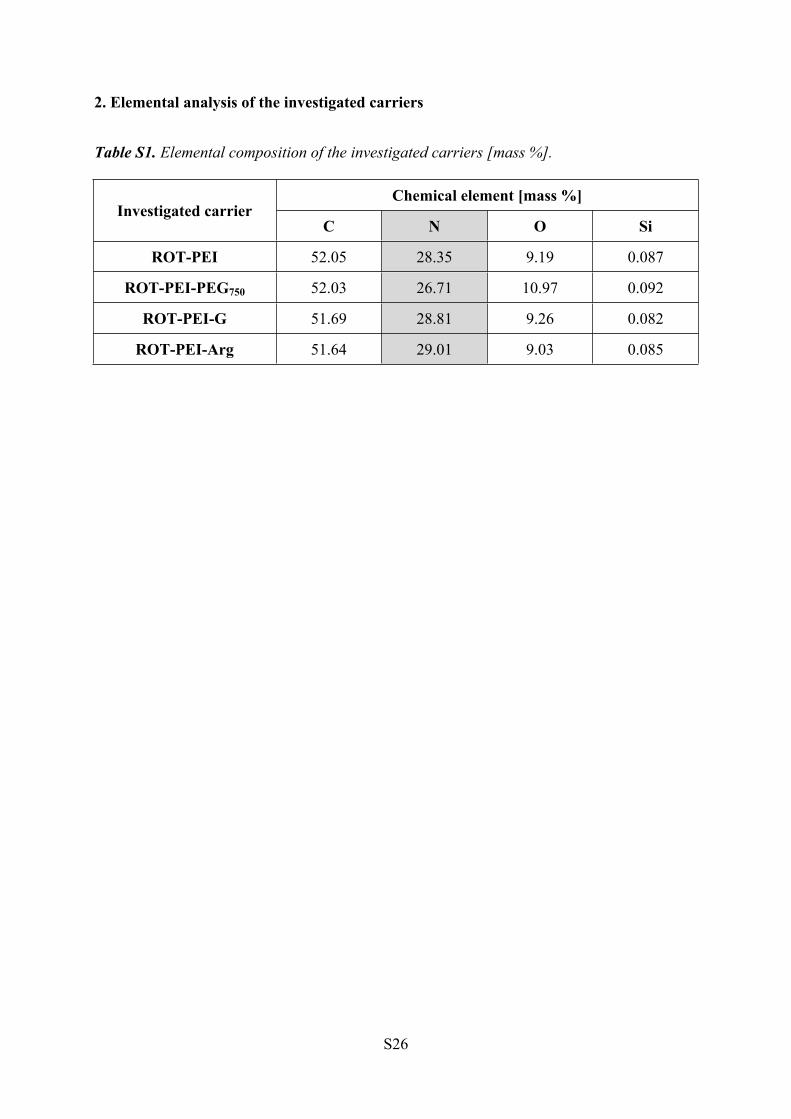
2. Elemental analysis of the investigated carriers
Table S1. Elemental composition of the investigated carriers [mass %].
Chemical element [mass %]Investigated carrier
C N O Si
ROT-PEI 52.05 28.35 9.19 0.087
ROT-PEI-PEG750 52.03 26.71 10.97 0.092
ROT-PEI-G 51.69 28.81 9.26 0.082
ROT-PEI-Arg 51.64 29.01 9.03 0.085
S27
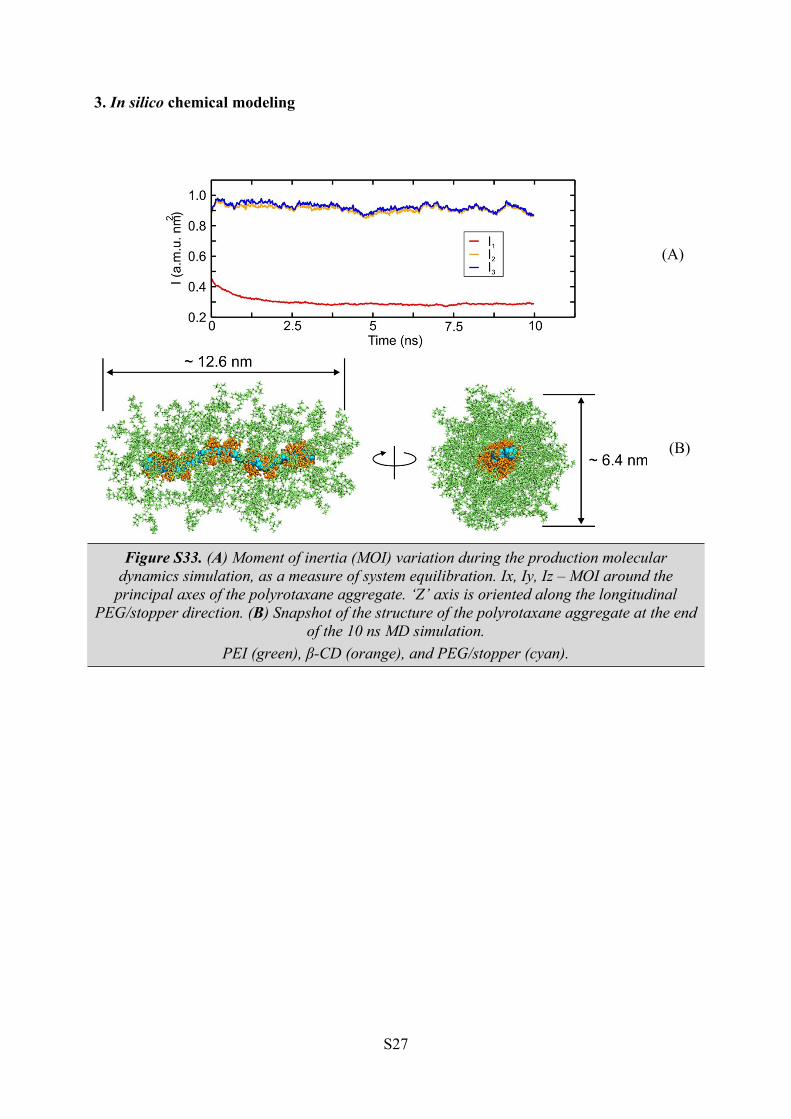
3. In silico chemical modeling
(A)
(B)
Figure S33. (A) Moment of inertia (MOI) variation during the production molecular dynamics simulation, as a measure of system equilibration. Ix, Iy, Iz – MOI around the
principal axes of the polyrotaxane aggregate. ‘Z’ axis is oriented along the longitudinal PEG/stopper direction. (B) Snapshot of the structure of the polyrotaxane aggregate at the end
of the 10 ns MD simulation.PEI (green), β-CD (orange), and PEG/stopper (cyan).
S28
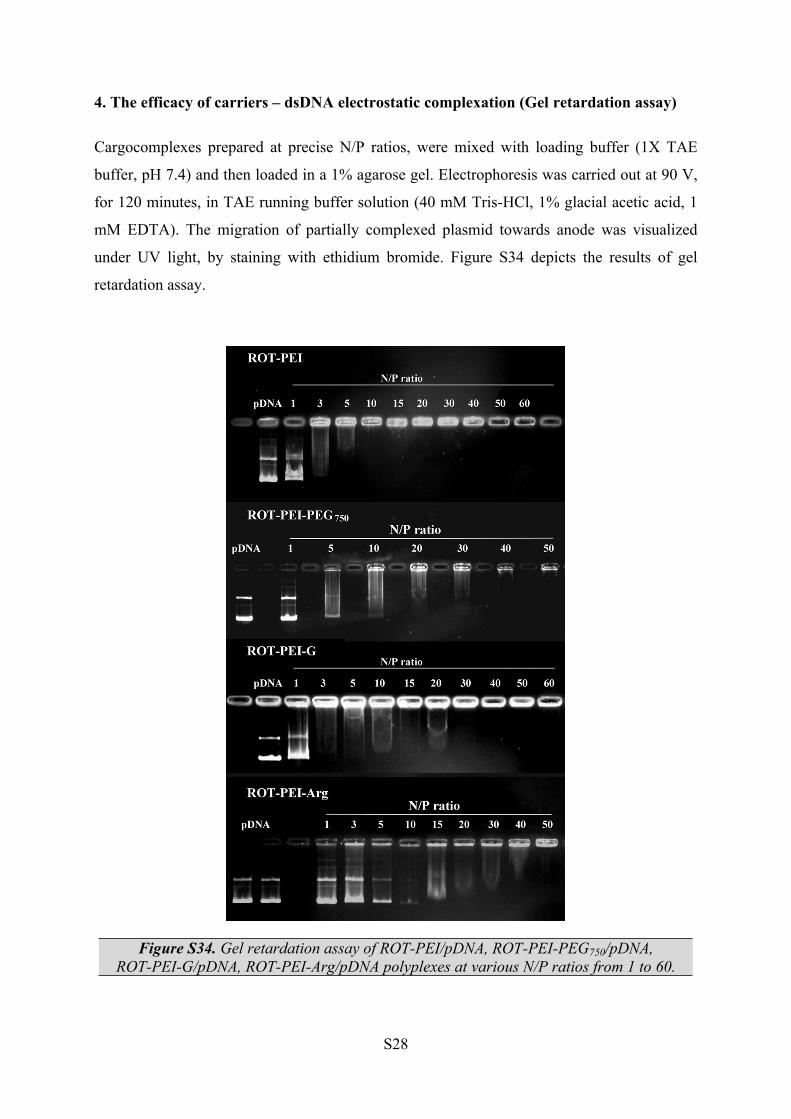
4. The efficacy of carriers – dsDNA electrostatic complexation (Gel retardation assay)
Cargocomplexes prepared at precise N/P ratios, were mixed with loading buffer (1X TAE
buffer, pH 7.4) and then loaded in a 1% agarose gel. Electrophoresis was carried out at 90 V,
for 120 minutes, in TAE running buffer solution (40 mM Tris-HCl, 1% glacial acetic acid, 1
mM EDTA). The migration of partially complexed plasmid towards anode was visualized
under UV light, by staining with ethidium bromide. Figure S34 depicts the results of gel
retardation assay.
Figure S34. Gel retardation assay of ROT-PEI/pDNA, ROT-PEI-PEG750/pDNA, ROT-PEI-G/pDNA, ROT-PEI-Arg/pDNA polyplexes at various N/P ratios from 1 to 60.
S29
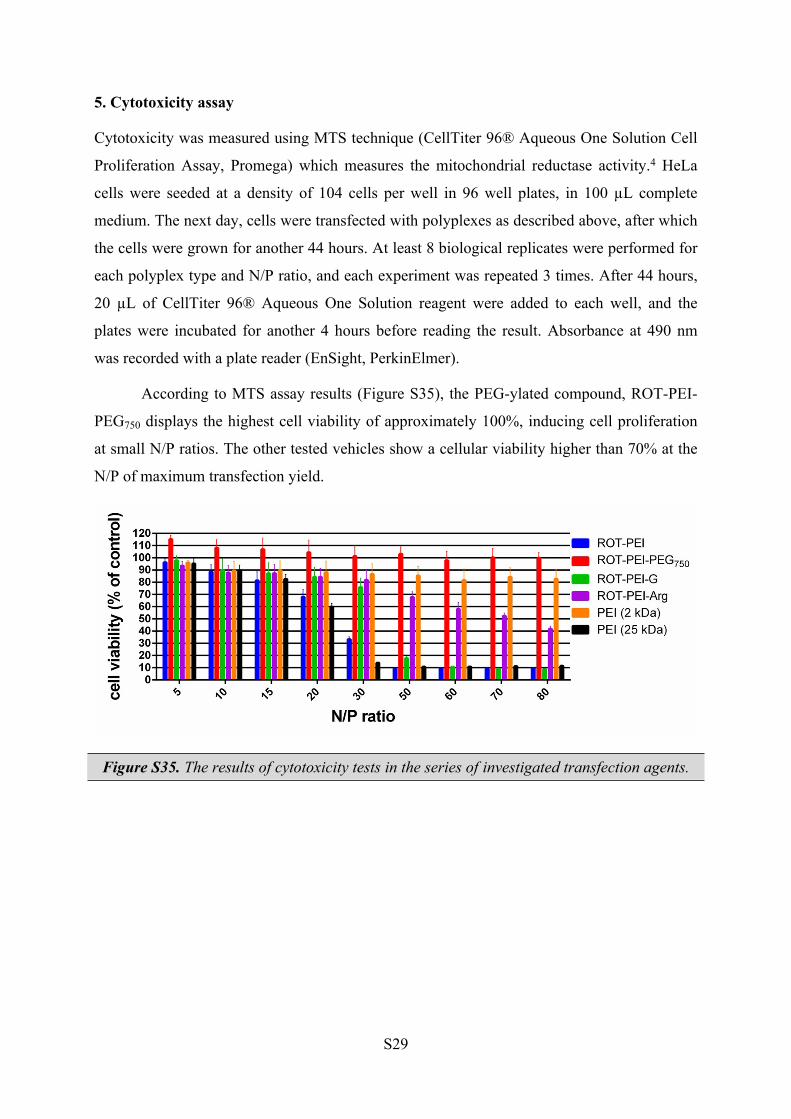
5. Cytotoxicity assay
Cytotoxicity was measured using MTS technique (CellTiter 96® Aqueous One Solution Cell
Proliferation Assay, Promega) which measures the mitochondrial reductase activity.4 HeLa
cells were seeded at a density of 104 cells per well in 96 well plates, in 100 µL complete
medium. The next day, cells were transfected with polyplexes as described above, after which
the cells were grown for another 44 hours. At least 8 biological replicates were performed for
each polyplex type and N/P ratio, and each experiment was repeated 3 times. After 44 hours,
20 µL of CellTiter 96® Aqueous One Solution reagent were added to each well, and the
plates were incubated for another 4 hours before reading the result. Absorbance at 490 nm
was recorded with a plate reader (EnSight, PerkinElmer).
According to MTS assay results (Figure S35), the PEG-ylated compound, ROT-PEI-
PEG750 displays the highest cell viability of approximately 100%, inducing cell proliferation
at small N/P ratios. The other tested vehicles show a cellular viability higher than 70% at the
N/P of maximum transfection yield.
Figure S35. The results of cytotoxicity tests in the series of investigated transfection agents.
S30
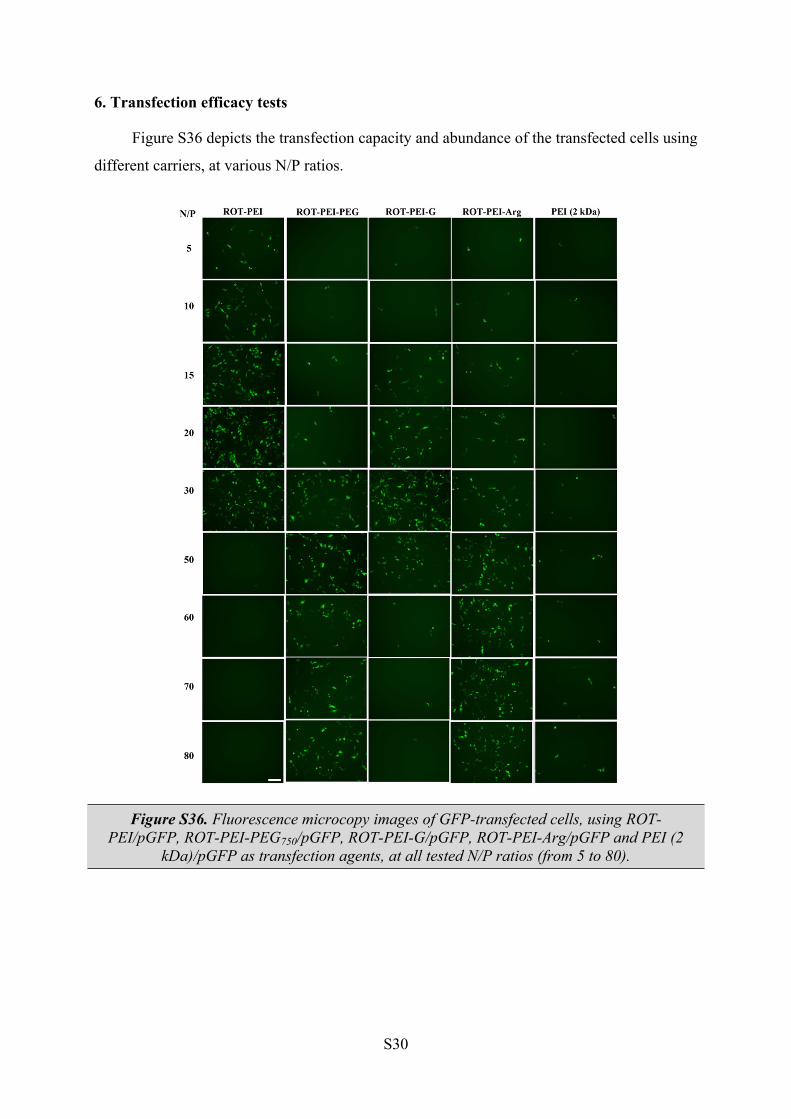
6. Transfection efficacy tests
Figure S36 depicts the transfection capacity and abundance of the transfected cells using
different carriers, at various N/P ratios.
Figure S36. Fluorescence microcopy images of GFP-transfected cells, using ROT-PEI/pGFP, ROT-PEI-PEG750/pGFP, ROT-PEI-G/pGFP, ROT-PEI-Arg/pGFP and PEI (2
kDa)/pGFP as transfection agents, at all tested N/P ratios (from 5 to 80).
S31
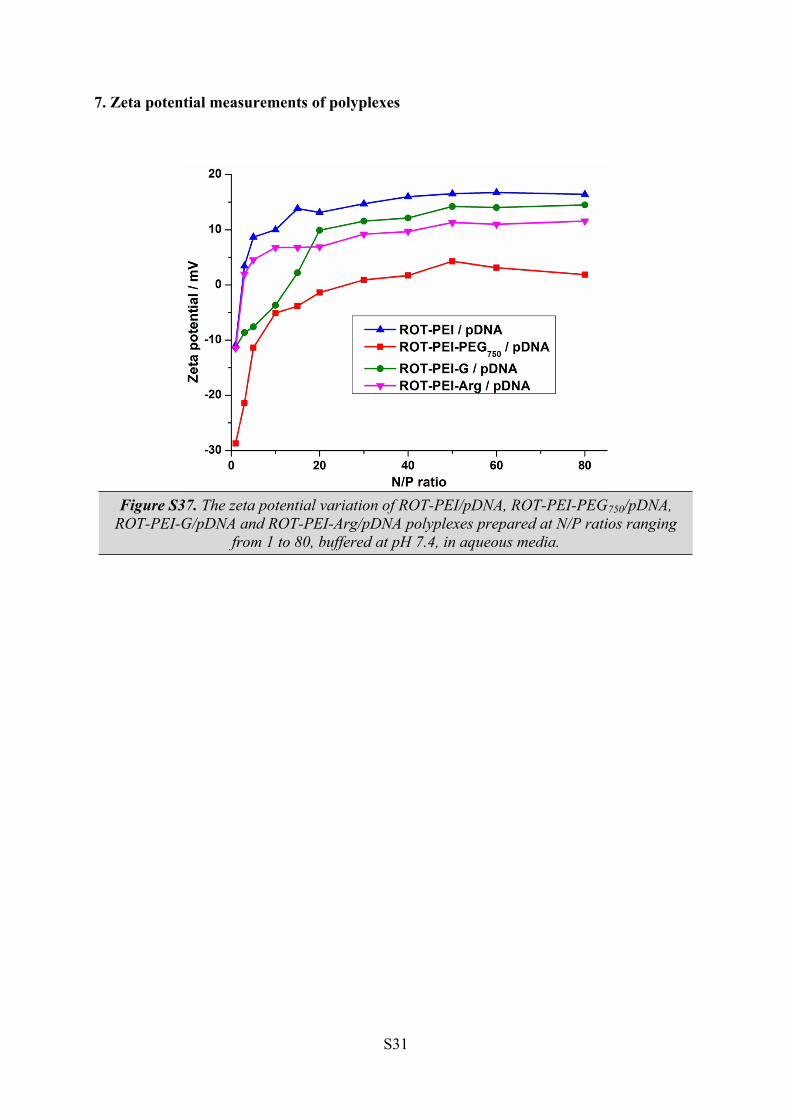
7. Zeta potential measurements of polyplexes
Figure S37. The zeta potential variation of ROT-PEI/pDNA, ROT-PEI-PEG750/pDNA, ROT-PEI-G/pDNA and ROT-PEI-Arg/pDNA polyplexes prepared at N/P ratios ranging
from 1 to 80, buffered at pH 7.4, in aqueous media.
S32
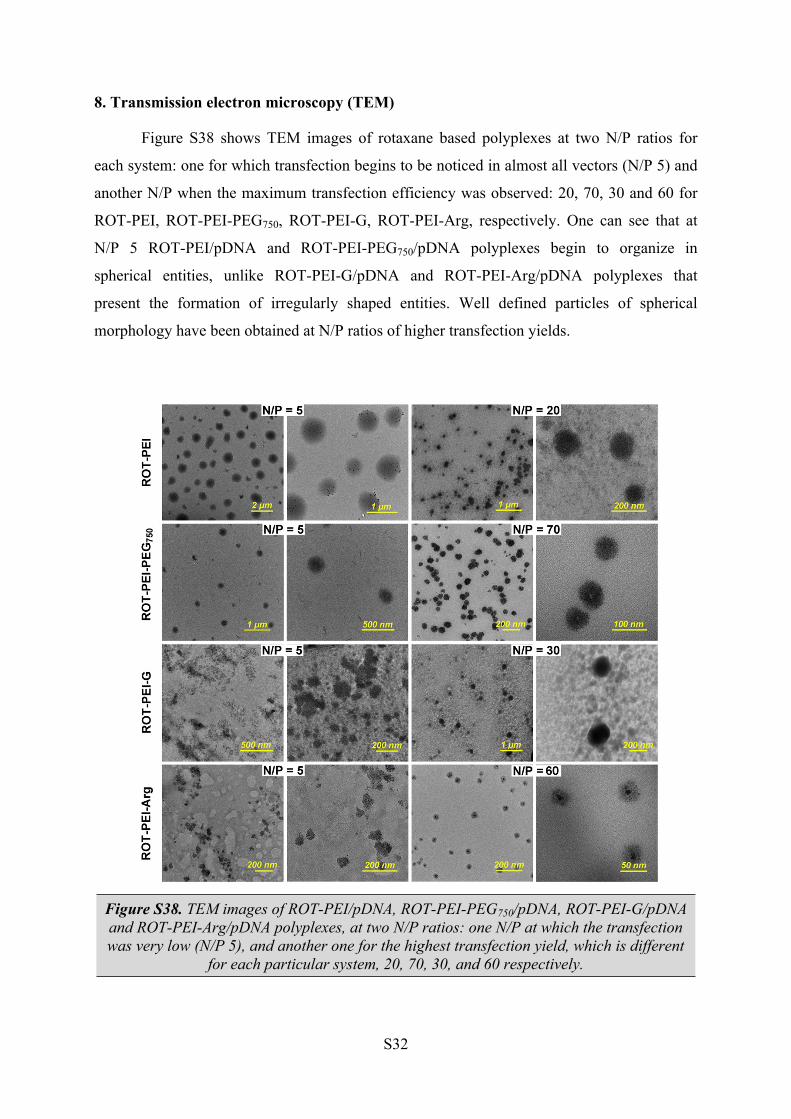
8. Transmission electron microscopy (TEM)
Figure S38 shows TEM images of rotaxane based polyplexes at two N/P ratios for
each system: one for which transfection begins to be noticed in almost all vectors (N/P 5) and
another N/P when the maximum transfection efficiency was observed: 20, 70, 30 and 60 for
ROT-PEI, ROT-PEI-PEG750, ROT-PEI-G, ROT-PEI-Arg, respectively. One can see that at
N/P 5 ROT-PEI/pDNA and ROT-PEI-PEG750/pDNA polyplexes begin to organize in
spherical entities, unlike ROT-PEI-G/pDNA and ROT-PEI-Arg/pDNA polyplexes that
present the formation of irregularly shaped entities. Well defined particles of spherical
morphology have been obtained at N/P ratios of higher transfection yields.
Figure S38. TEM images of ROT-PEI/pDNA, ROT-PEI-PEG750/pDNA, ROT-PEI-G/pDNA and ROT-PEI-Arg/pDNA polyplexes, at two N/P ratios: one N/P at which the transfection was very low (N/P 5), and another one for the highest transfection yield, which is different
for each particular system, 20, 70, 30, and 60 respectively.
S33
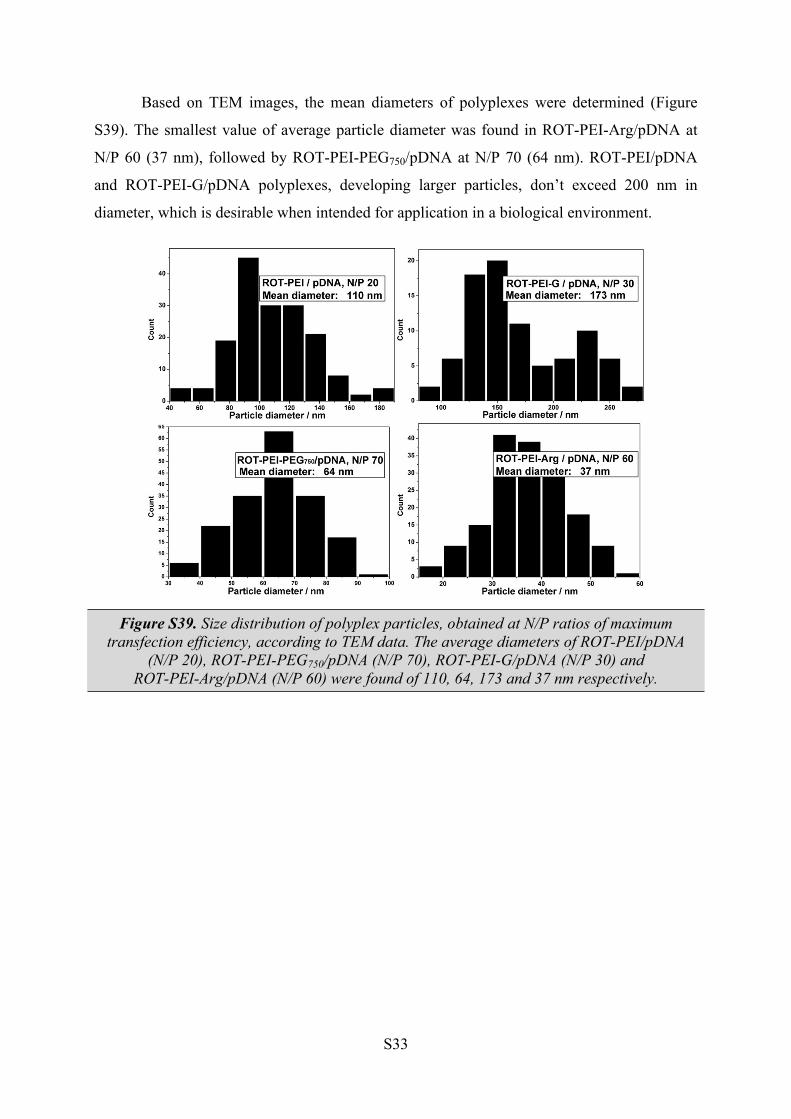
Based on TEM images, the mean diameters of polyplexes were determined (Figure
S39). The smallest value of average particle diameter was found in ROT-PEI-Arg/pDNA at
N/P 60 (37 nm), followed by ROT-PEI-PEG750/pDNA at N/P 70 (64 nm). ROT-PEI/pDNA
and ROT-PEI-G/pDNA polyplexes, developing larger particles, don’t exceed 200 nm in
diameter, which is desirable when intended for application in a biological environment.
Figure S39. Size distribution of polyplex particles, obtained at N/P ratios of maximum transfection efficiency, according to TEM data. The average diameters of ROT-PEI/pDNA
(N/P 20), ROT-PEI-PEG750/pDNA (N/P 70), ROT-PEI-G/pDNA (N/P 30) and ROT-PEI-Arg/pDNA (N/P 60) were found of 110, 64, 173 and 37 nm respectively.
S34
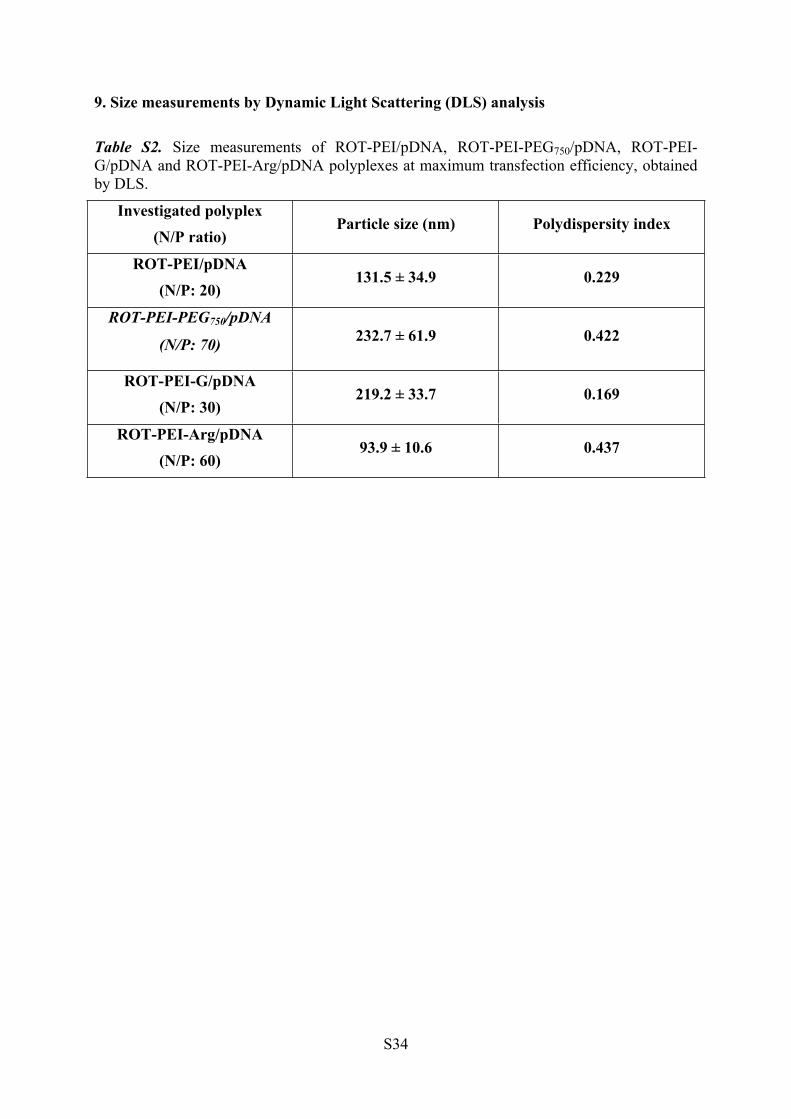
9. Size measurements by Dynamic Light Scattering (DLS) analysis
Table S2. Size measurements of ROT-PEI/pDNA, ROT-PEI-PEG750/pDNA, ROT-PEI-G/pDNA and ROT-PEI-Arg/pDNA polyplexes at maximum transfection efficiency, obtained by DLS.
Investigated polyplex(N/P ratio)
Particle size (nm) Polydispersity index
ROT-PEI/pDNA(N/P: 20)
131.5 ± 34.9 0.229
ROT-PEI-PEG750/pDNA
(N/P: 70) 232.7 ± 61.9 0.422
ROT-PEI-G/pDNA(N/P: 30)
219.2 ± 33.7 0.169
ROT-PEI-Arg/pDNA(N/P: 60)
93.9 ± 10.6 0.437
S35
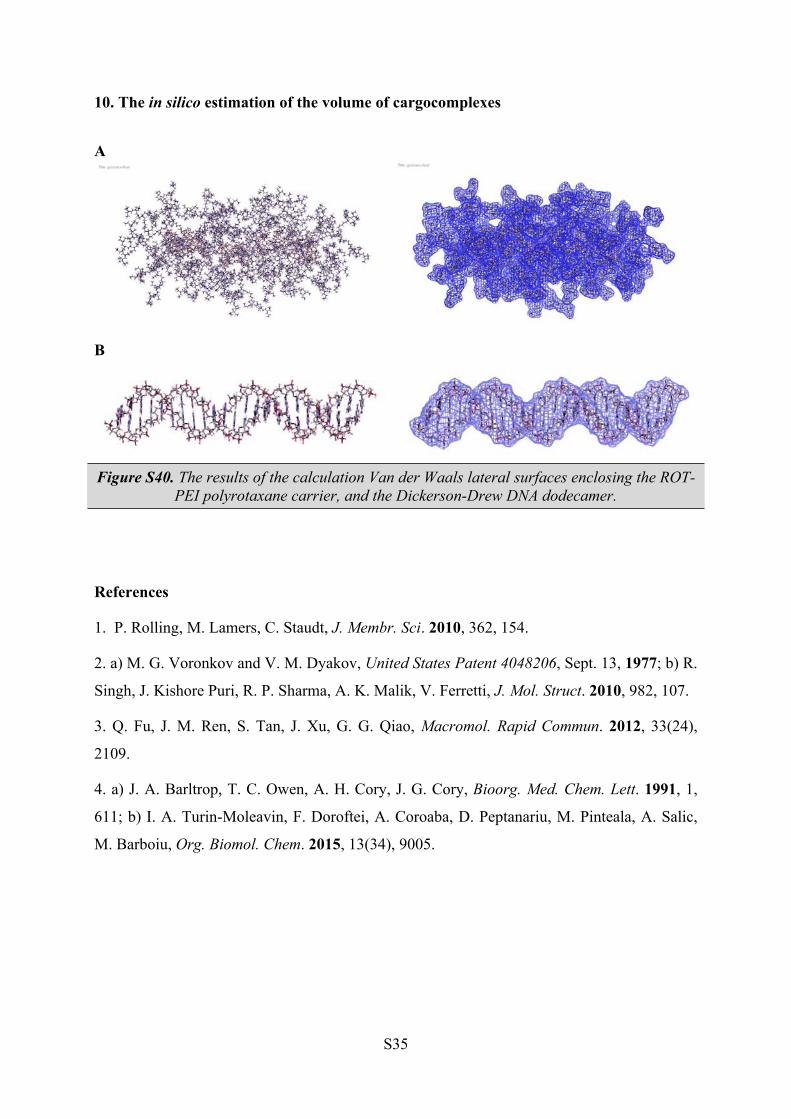
10. The in silico estimation of the volume of cargocomplexes
A
B
Figure S40. The results of the calculation Van der Waals lateral surfaces enclosing the ROT-PEI polyrotaxane carrier, and the Dickerson-Drew DNA dodecamer.
References
1. P. Rolling, M. Lamers, C. Staudt, J. Membr. Sci. 2010, 362, 154.
2. a) M. G. Voronkov and V. M. Dyakov, United States Patent 4048206, Sept. 13, 1977; b) R.
Singh, J. Kishore Puri, R. P. Sharma, A. K. Malik, V. Ferretti, J. Mol. Struct. 2010, 982, 107.
3. Q. Fu, J. M. Ren, S. Tan, J. Xu, G. G. Qiao, Macromol. Rapid Commun. 2012, 33(24),
2109.
4. a) J. A. Barltrop, T. C. Owen, A. H. Cory, J. G. Cory, Bioorg. Med. Chem. Lett. 1991, 1,
611; b) I. A. Turin-Moleavin, F. Doroftei, A. Coroaba, D. Peptanariu, M. Pinteala, A. Salic,
M. Barboiu, Org. Biomol. Chem. 2015, 13(34), 9005.