Embed Size (px)
Citation preview
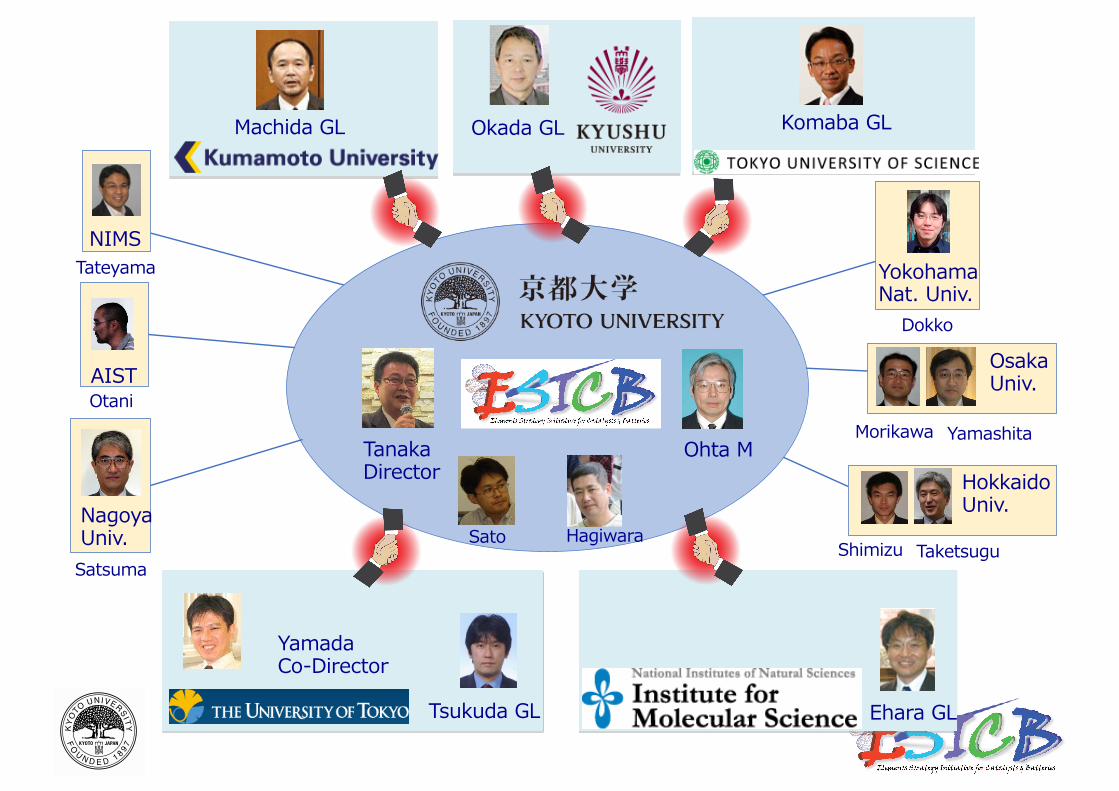
Elements Strategy Initiative for Catalysts and Batteries (ESICB)
別図第1 本学のエンブレムは、クスノキをモチーフとした標章・記章をさす。
エンブレム
Kyoto University Emblem
別図第2 本学のロゴタイプは、「京都大学」及び「Kyoto University」を図案化した文字をさす。
ロゴタイプ縦組み
Kanji Logotype (Vertical)
ロゴタイプ横組み
Kanji Logotype (Horizontal)
英文ロゴタイプ
Logotype (English)
別図第3 スクールカラー
スクールカラー
University Color
PANTONE 281 C
(CMYK 参考値:C100, M75, Y5, K35) ※スクールカラーの色指定は、一定条件下における参考値
であるため、表示媒体、使用環境等を考慮の上、使用上の
ルールその他諸規定に合わせ、数値を調整すること。

AIM of ESICBTWC
CO HC
NOx
CO2
H2O N2
candidates
◆Development of high performance catalysts with less use of and without use of critical-elements
◆Development of critical-elements-free rechargeable batteries of high performance
Contribution to the realization of sustainable society
◆Elucidation of guidance principles and description of processes during catalysis and battery operation
Deepening the science of interface and surface of complex and composite systems
◆Development of human resources for next generation
別図第1 本学のエンブレムは、クスノキをモチーフとした標章・記章をさす。
エンブレム
Kyoto University Emblem
別図第2 本学のロゴタイプは、「京都大学」及び「Kyoto University」を図案化した文字をさす。
ロゴタイプ縦組み
Kanji Logotype (Vertical)
ロゴタイプ横組み
Kanji Logotype (Horizontal)
英文ロゴタイプ
Logotype (English)
別図第3 スクールカラー
スクールカラー
University Color
PANTONE 281 C
(CMYK 参考値:C100, M75, Y5, K35) ※スクールカラーの色指定は、一定条件下における参考値
であるため、表示媒体、使用環境等を考慮の上、使用上の
ルールその他諸規定に合わせ、数値を調整すること。
Ehara GL
TanakaDirector
YamadaCo-Director
Hagiwara
HokkaidoUniv.
OsakaUniv.
NagoyaUniv.
YokohamaNat. Univ.
NIMS
Shimizu Taketsugu
Morikawa Yamashita
Dokko
Satsuma
Tateyama
Otani
Tsukuda GL
Sato
Machida GL Okada GL
AIST
Ohta M
Komaba GL
別図第1 本学のエンブレムは、クスノキをモチーフとした標章・記章をさす。
エンブレム
Kyoto University Emblem
別図第2 本学のロゴタイプは、「京都大学」及び「Kyoto University」を図案化した文字をさす。
ロゴタイプ縦組み
Kanji Logotype (Vertical)
ロゴタイプ横組み
Kanji Logotype (Horizontal)
英文ロゴタイプ
Logotype (English)
別図第3 スクールカラー
スクールカラー
University Color
PANTONE 281 C
(CMYK 参考値:C100, M75, Y5, K35) ※スクールカラーの色指定は、一定条件下における参考値
であるため、表示媒体、使用環境等を考慮の上、使用上の
ルールその他諸規定に合わせ、数値を調整すること。

Kyoto U., U.TokyoInst. Mol. Sci.,Kyushu U., Kumamoto U. ,Tokyo U. Sci.,
Hokkaido U., NIMS,Nagoya U., AIST,Tohoku U., Osaka U.Waseda U., Kobe U. , Nagoya Inst.Technol.,Tokyo Metropolitan U.,Yokohama Nat. U., etc.
Group leaders
Labs:40Researchers : 120T. Tanaka
DirectorCatalysts(Kyoto U.)
A. YamadaCo-DirectorBatteries(U. Tokyo)
K. OhtaProjectManager(Kyoto U.)
M. EharaElectronic Theory(Inst. Mol. Sci.)
T. TsukudaAnalysis & Evaluation(U. Tokyo)
S. OkadaPost LIB(Kyushu U.)
M. MachidaTW Catalysts(Kumamoto U.)
S. KomabaNa Batteries(Tokyo U. Sci.)
Fundamental Material Synthesis
Kyoto University
別図第1 本学のエンブレムは、クスノキをモチーフとした標章・記章をさす。
エンブレム
Kyoto University Emblem
別図第2 本学のロゴタイプは、「京都大学」及び「Kyoto University」を図案化した文字をさす。
ロゴタイプ縦組み
Kanji Logotype (Vertical)
ロゴタイプ横組み
Kanji Logotype (Horizontal)
英文ロゴタイプ
Logotype (English)
別図第3 スクールカラー
スクールカラー
University Color
PANTONE 281 C
(CMYK 参考値:C100, M75, Y5, K35) ※スクールカラーの色指定は、一定条件下における参考値
であるため、表示媒体、使用環境等を考慮の上、使用上の
ルールその他諸規定に合わせ、数値を調整すること。
ESICB Organization
Target elements
in catalysts and batteries
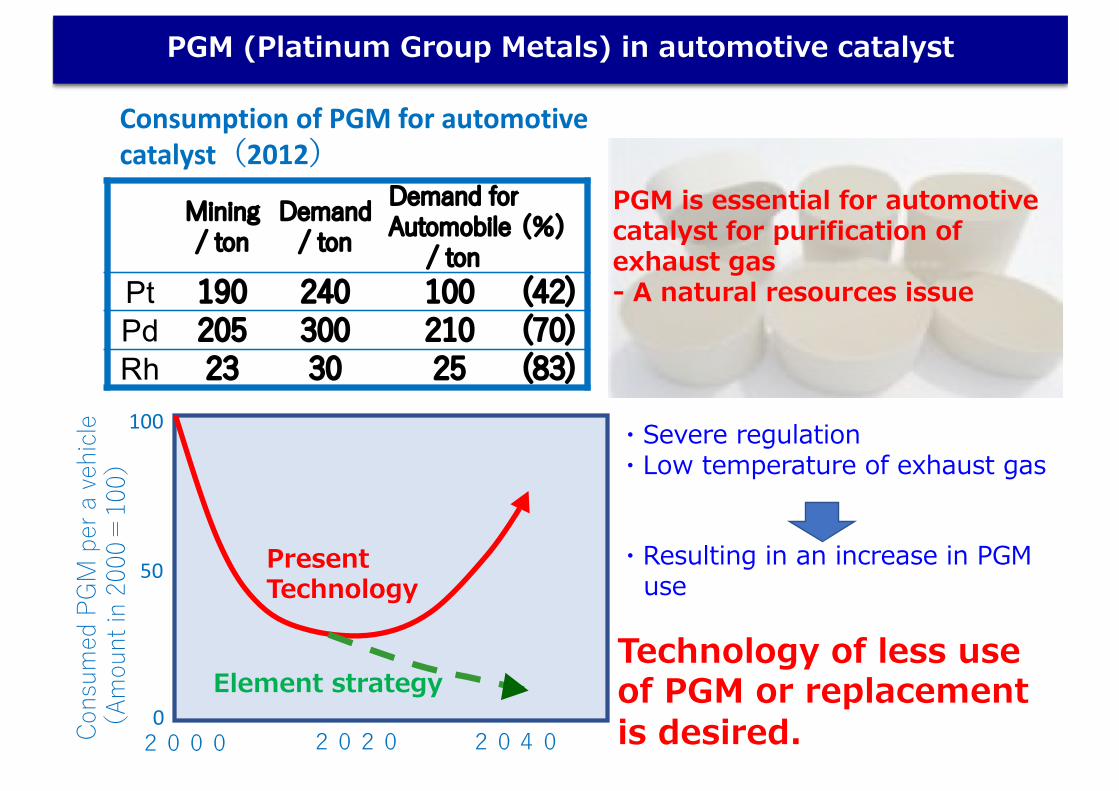
Consumption of PGM for automotivecatalyst(2012)
PGM is essential for automotive catalyst for purification of exhaust gas- A natural resources issue
Present Technology
2000 2020 2040Cons
umed
PGM
per
a ve
hicle
(Am
ount
in 2
000=
100)
100
50
0Element strategy
・Severe regulation・Low temperature of exhaust gas
・Resulting in an increase in PGM use
Technology of less use of PGM or replacement is desired.
Mining/ ton
Demand/ ton
Demand for Automobile
/ ton(%)
Pt 190 240 100 (42)Pd 205 300 210 (70)Rh 23 30 25 (83)
3/32PGM (Platinum Group Metals) in automotive catalyst
Part 2
Catalysing energy technology transformations Chapter 5
Steering transport towards sustainability 223
© OECD/IEA, 2017.
hen looking at costs, the cumulative 2017‐60 costs of transport total expenditures on vehicles, infrastructure and fuels in the RTS are 130 trillion United States dollars USD higher than those of the 2DS, and USD 110 trillion higher than those of the B2DS in 2015 USD PPP . Figure 5.16 . Fuels savings make up the ma ority of the savings in the decarbonisation policy scenarios: cumulative expenditures of about USD 220 trillion on fuels in the RTS can be cut by 41 in the 2DS and by 48 in the B2DS. Additional savings accrue from a reduction in total road vehicle purchases and from reduced road and parking infrastructure investments.
LDVs Achieving the B2DS targets requires the LDV fleet to minimise GHG emissions through technology transformations, which occur on top of large contributions from the avoid and modal shift components in the B2DS see the sections on public transport and on 2‐ and 3‐wheelers that follow . In the case of the LDV fleet, which includes PLDVs and LCVs, substantial improvements in fuel economy would be needed in the short to medium term, in parallel with actions that enable the sector s transition towards ultra-low or zero-emission technologies in the long term. In the B2DS, technologies delivering fuel economy improvements and ultra-low or zero-emission solutions require a rapid scale‐up:
� By 2020, 2.3 of all PLDVs on the road have ultra-low or zero-emission powertrains of three types: 0.9 PHEVs, 1.3 battery-electric vehicles BEVs and 0.05 fuel cell electric vehicles FCEVs .
� By 2040, less than half of all PLDVs on the road have conventional combustion engines: 39 are PEVs10 and 1.2 are FCEVs. The remaining shares around 10 are conventional HEVs11 or natural gas vehicles.
Figure 5.3. Global technology penetrations in LDV stock by scenario, 2015-
60
Note: CNG compressed natural gas LPG liquid petroleum gas.
Source: IEA 2017a , obility odel, arch 2017 version, database and simulation model, www.iea.org/etp/etpmodel/transport/.
Key point By 2060, the share of alternative powertrain vehicles in the global LDV stock will reach 94 in the B2DS and 77 in the 2DS.
10. Including BEVs and PHEVs.
11. HEVs exclude start-and-stop technologies and refer to serial or parallel hybrid powertrain architectures combining ICEs and electric
propulsion.
Non-UrbanUrban
Mill
ion
vehi
cles
2015 2060
EV
PHV
HVDiesel
Gasoline
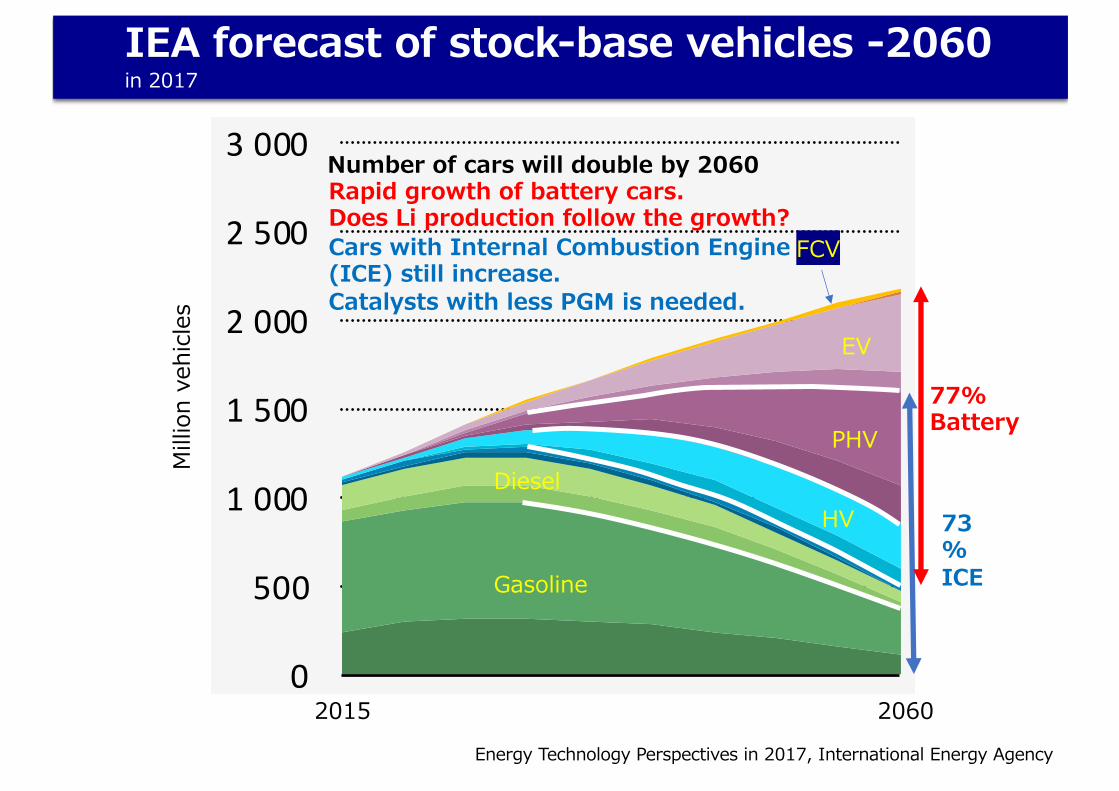
IEA forecast of stock-base vehicles -2060in 2017
Energy Technology Perspectives in 2017, International Energy Agency
FCV
Number of cars will double by 2060
73%ICE
77%Battery
Rapid growth of battery cars.Does Li production follow the growth?Cars with Internal Combustion Engine (ICE) still increase.Catalysts with less PGM is needed.
Lithium Productionリチウム資源需給構造 4
埋蔵量(84,600千tLCE) 生産量(217千tLCE)-原料ベース2017年に豪州がチリを逆転
用途別消費量(197千tLCE)
市場規模:2020年には?2025年には?
・国別消費量中国5割、EU・日本・韓国1割
出典:USGS,Industrial Minerals等
tLCE:炭酸リチウム換算t
化合物ベース(炭酸リチウムなど)では?
2013年市場規模160千tLCE二次電池向け:30%
2006年の市場規模70千tLCE二次電池向け:わずか5%
EV向け需要に大きく依存
主要生産企業:Albemarle, SQM,Tianqi,FMC(7割のシェア)
埋蔵量・生産量ともに偏在ただし中国以外はカントリー
リスク低い
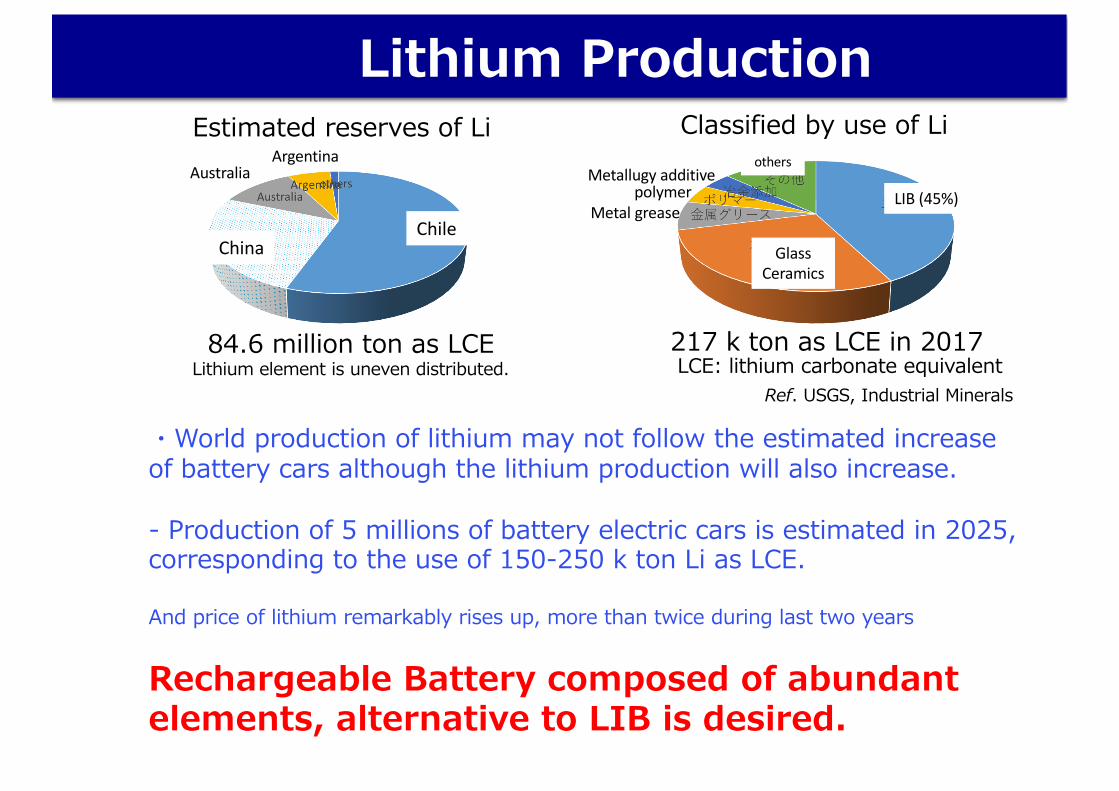
217 k ton as LCE in 201784.6 million ton as LCE
Estimated reserves of Li Classified by use of Li
・World production of lithium may not follow the estimated increase of battery cars although the lithium production will also increase.
- Production of 5 millions of battery electric cars is estimated in 2025, corresponding to the use of 150-250 k ton Li as LCE.
And price of lithium remarkably rises up, more than twice during last two years
Rechargeable Battery composed of abundant elements, alternative to LIB is desired.
LCE: lithium carbonate equivalentLithium element is uneven distributed.
リチウム資源需給構造 4
埋蔵量(84,600千tLCE) 生産量(217千tLCE)-原料ベース2017年に豪州がチリを逆転
用途別消費量(197千tLCE)
市場規模:2020年には?2025年には?
・国別消費量中国5割、EU・日本・韓国1割
出典:USGS,Industrial Minerals等
tLCE:炭酸リチウム換算t
化合物ベース(炭酸リチウムなど)では?
2013年市場規模160千tLCE二次電池向け:30%
2006年の市場規模70千tLCE二次電池向け:わずか5%
EV向け需要に大きく依存
主要生産企業:Albemarle, SQM,Tianqi,FMC(7割のシェア)
埋蔵量・生産量ともに偏在ただし中国以外はカントリー
リスク低い
ChileChina
LIB (45%)
GlassCeramics
Metal greasepolymer
Metallugy additiveothers
AustraliaArgentina
Ref. USGS, Industrial Minerals
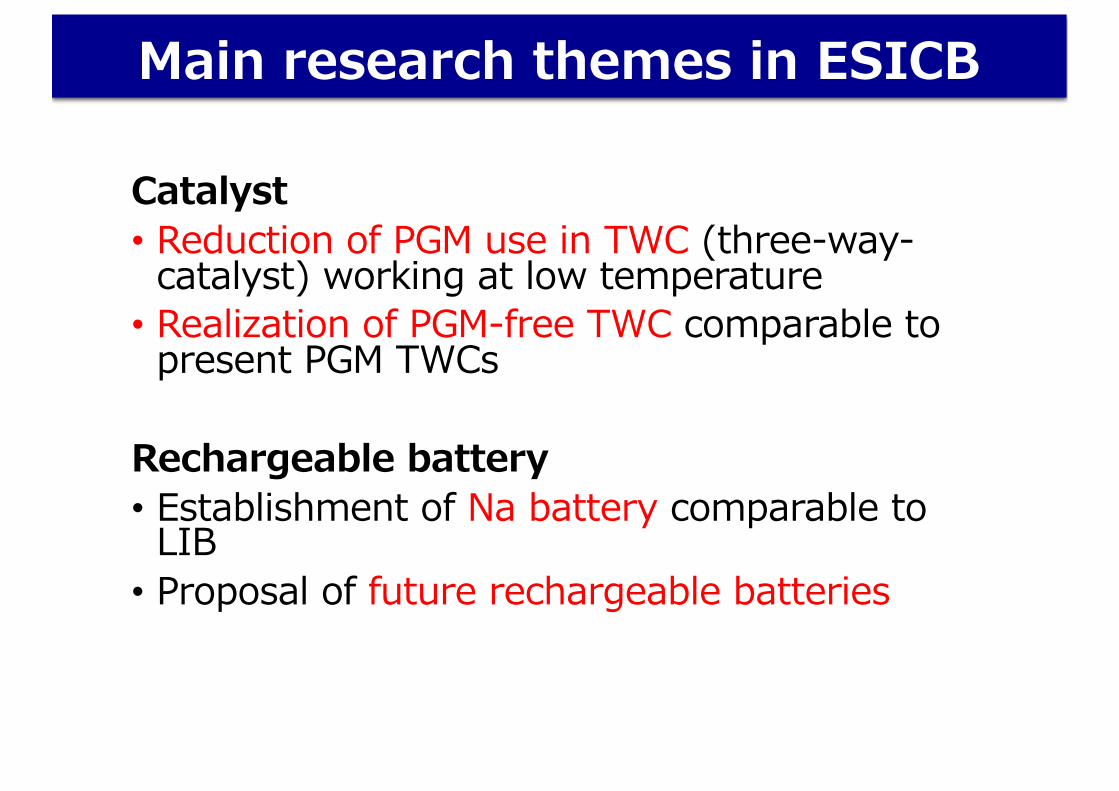
Main research themes in ESICB
Catalyst• Reduction of PGM use in TWC (three-way-
catalyst) working at low temperature• Realization of PGM-free TWC comparable to
present PGM TWCs
Rechargeable battery• Establishment of Na battery comparable to
LIB• Proposal of future rechargeable batteries

Purification of exhaust gas from gasoline engine
HC (Hydrocarbon) H2O + CO2
CO CO2
NO N2
78 Pt
45 Rh
46 Pd
O2
O2
HC, CO
To save PGM in Three-Way-Catalysts
NO
N N O O
metal oxide support
dissociativeadsorption
Rh
reco
mbin
atio
n
& deso
rptio
n N2
CO
CO2✔ deNOx takes place on PGM surface.
General policy to save PGM✔ Stabilization of fine PGM nanoparticles and prevention of sintering of particles to maintain high specific surface areahave been the way to save PGM.
support support�
Prevention of sintering growth
Fine particles: active Large particles: less active
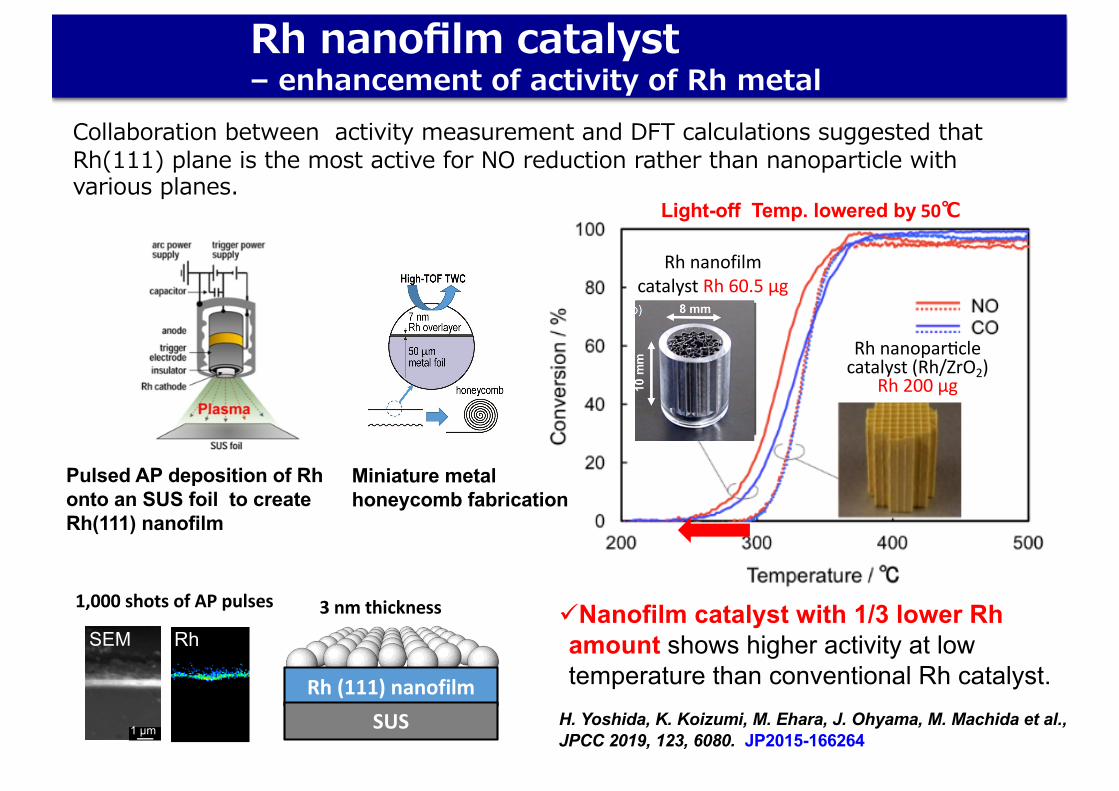
H. Yoshida, K. Koizumi, M. Ehara, J. Ohyama, M. Machida et al., JPCC 2019, 123, 6080. JP2015-166264
üNanofilm catalyst with 1/3 lower Rh amount shows higher activity at low temperature than conventional Rh catalyst.
Rh nanofilm catalyst – enhancement of activity of Rh metal
Collaboration between activity measurement and DFT calculations suggested that Rh(111) plane is the most active for NO reduction rather than nanoparticle with various planes.
Pulsed AP deposition of Rh onto an SUS foil to create Rh(111) nanofilm
RhAl
1 μm
SEM RhAl Zr
1,000 shots of AP pulses
Rh (111) nanofilmSUS
3 nm thickness
2019/09/27 12(251-s2.0-S0169433217319657-fx1_lrg.jpg 2,213×886ピクセル
1 / 1 ページhttps://ars.els-cdn.com/content/image/1-s2.0-S0169433217319657-fx1_lrg.jpg
Rh nanofilmcatalyst Rh 60.5 µg
Rh nanoparMclecatalyst (Rh/ZrO2)
Rh 200 µg
Light-off Temp. lowered by 50℃
Miniature metal honeycomb fabrication
100
80
60
40
20
0
NO c
onve
rsio
n to
N2 (
%)
500400300200100Reaction temperature / °C
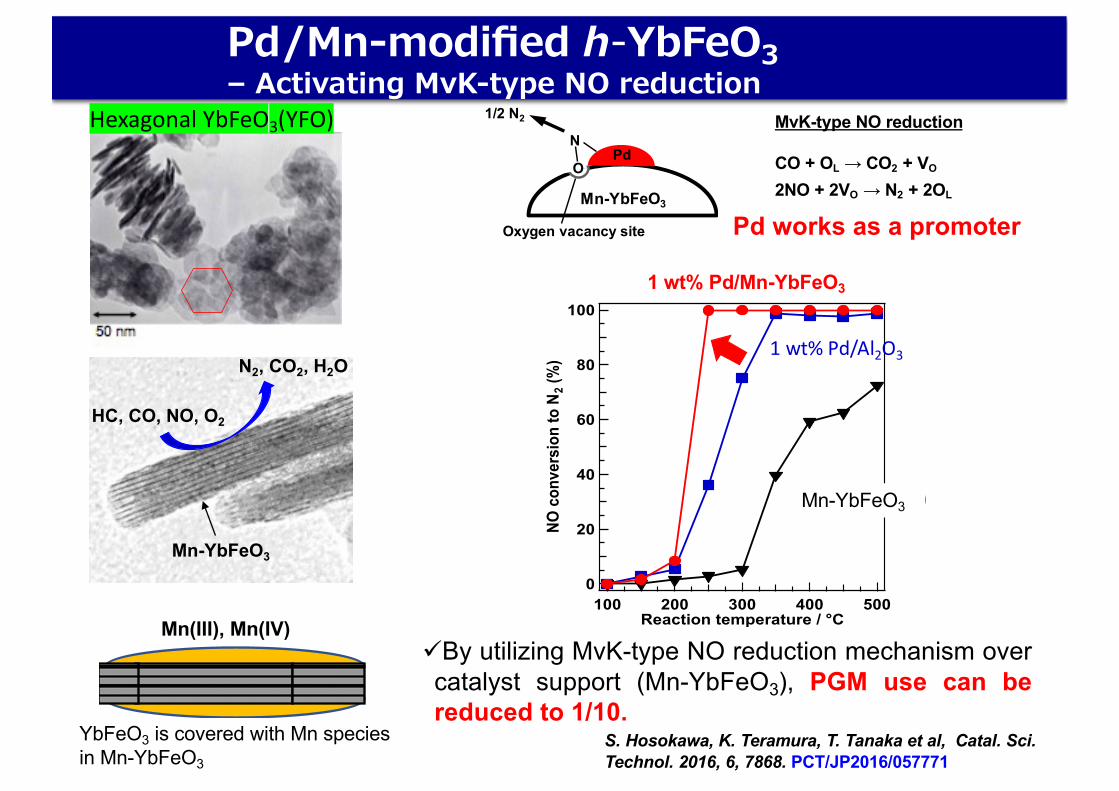
1 wt% Pd/Mn-YbFeO3
1 wt% Pd/Al2O3
Mn-YbFeO3(ST)
Oxygen vacancy site
Mn-YbFeO3
PdN
O
1/2 N2 MvK-type NO reduction
CO + OL → CO2 + VO
2NO + 2VO → N2 + 2OL
üBy utilizing MvK-type NO reduction mechanism overcatalyst support (Mn-YbFeO3), PGM use can bereduced to 1/10.
S. Hosokawa, K. Teramura, T. Tanaka et al, Catal. Sci. Technol. 2016, 6, 7868. PCT/JP2016/057771
Mn-YbFeO3
1 wt% Pd/Mn-YbFeO3
Pd/Mn-modified h-YbFeO3– Activating MvK-type NO reduction
Hexagonal YbFeO3(YFO)
Mn(III), Mn(IV)
YbFeO3 is covered with Mn speciesin Mn-YbFeO3
Mn-YbFeO3
HC, CO, NO, O2
N2, CO2, H2O
Pd works as a promoter
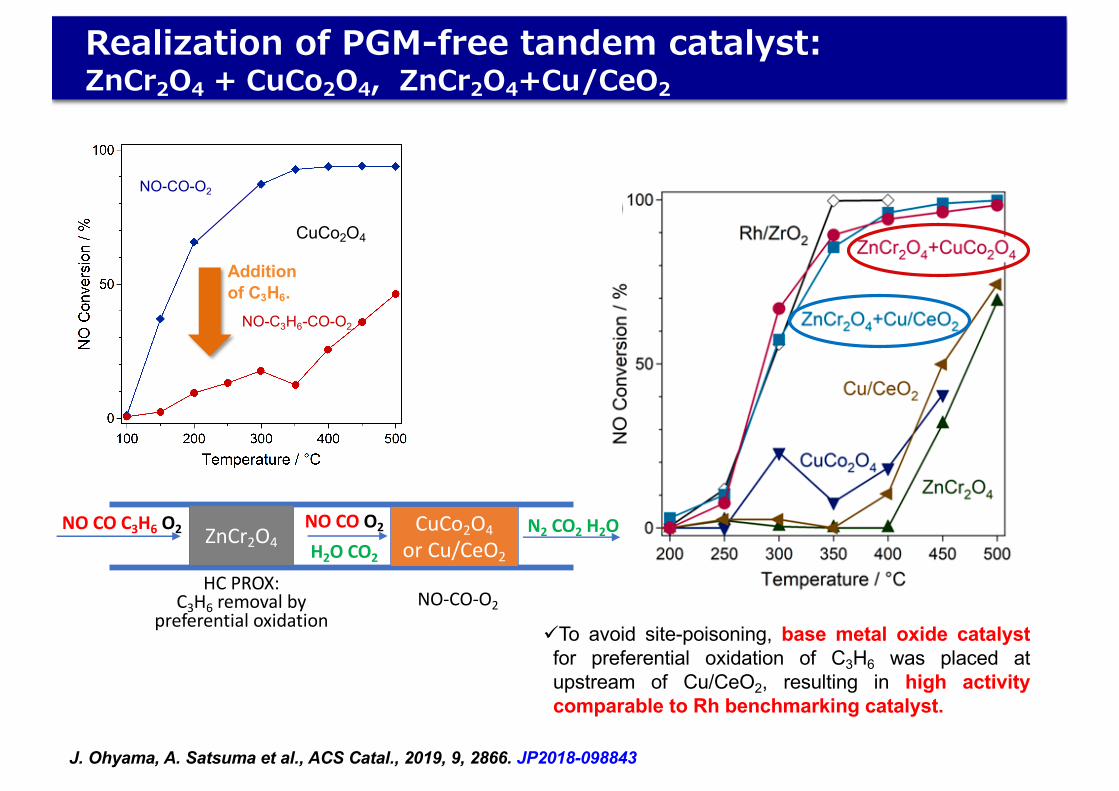
üTo avoid site-poisoning, base metal oxide catalystfor preferential oxidation of C3H6 was placed atupstream of Cu/CeO2, resulting in high activitycomparable to Rh benchmarking catalyst.
J. Ohyama, A. Satsuma et al., ACS Catal., 2019, 9, 2866. JP2018-098843
NO-CO-O2
NO-C3H6-CO-O2
CuCo2O4
Additionof C3H6.
versions of the chromium oxides. Whereas an incorporation ofmetal with high reduction potential17 (Cu, Co) into chromiumoxide lattice promoted the undesired CO oxidation, that ofmetal with low reduction potential17 (Mg, Zn) suppressed theCO oxidation (reduction potentials and ratios of C3H6oxidation rate to CO oxidation rate are presented in TableS2 in the Supporting Information), especially ZnCr2O4exhibited high C3H6 oxidation conversion at 300 °C (93%),while the CO conversion is still low (5.2%).High NO reduction activity by CO in the presence of O2 is
required for the downstream catalyst. Also, since N2O is anundesired product of the NO reduction, because of its highglobal warming potential, the NO reduction catalyst is requiredto selectively produce N2. Many base-metal catalysts have beenreported to exhibit high NO reduction activity by CO at lowtemperature, such as Cu-containing oxides,16,18−20 and metal-supported CeO2.
15,21−23 Their low formation energy of oxygenvacancy was thought to be attributed to their high activity andN2 selectivity.
23,24 As presented in Figure S2 in the SupportingInformation, CuCo2O4 and Cu/CeO2 exhibited high NOreduction activity and N2 selectivity at low temperature duringthe NO−CO−O2 reaction. These catalysts should be suitablefor the downstream catalyst.The two catalysts which play different roles (ZnCr2O4 for
C3H6−PROX, and CuCo2O4 and Cu/CeO2 for NO−CO−O2)are combined with tandem configuration. The concept of thetandem catalyst is shown in Figure 2. After the reaction gases
pass through the upstream catalyst, the concentration of C3H6is supposed to be lowered, and thus the downstream catalystefficiently reduces NO with CO.These catalysts (ZnCr2O4 and CuCo2O4) were placed on
either side of a U-shaped tube, respectively, as shown in theSupporting Information (Figure S3). A catalytic run of thetandem catalyst was performed using a fixed-bed flow reactor.Stoichiometric reaction gases (GHSV = 102 857 mL g−1 h−1)including NO, C3H6, CO, and O2 were fed to a catalyst (35.0mg) and the effluent gas was measured by a NOx/CO/CO2(Horiba, Model VIA-3100) analyzer for NO and CO, and a
micro gas chromatograph (Agilent Model 490 Micro GC,equipped with MS-5A and PoraPLOT Q columns, and a TCDdetector) for N2O and C3H6. Detailed conditions weredescribed in our previous reports.11,14 Figure 3 presents NO
reduction activity and N2 yield of the tandem catalysts(ZnCr2O4 + CuCo2O4 and ZnCr2O4 + Cu/CeO2) and Rh/ZrO2 catalyst as a benchmarking catalyst with regard to NOreduction. The tandem catalysts exhibited equivalent NOreduction activity and higher N2 yield, compared to 1 wt %Rh/ZrO2 catalyst at 300 °C. Unlike other PGM-free catalysts,the tandem catalyst exhibited the high NO conversion over awide temperature range. Either of the tandem catalysts alonewas not able to reduce NO at low temperature, indicating thatthe tandem catalysts cooperatively purified NO efficiently. Asfor the oxidation of C3H6 and CO, the activity of the tandemcatalyst exceeded that of Rh catalyst (Figure S4 in theSupporting Information). Although the concentration of COdiminished to some extent by the upstream catalyst (Figure1B), CO passing through the upstream catalyst was sufficient(more than 1000 ppm) to reduce 1000 ppm of NO completelyuntil 400 °C. Therefore, CO was involved in the NO reductionmainly on the downstream catalyst at low temperature. At hightemperature, where the CO concentration is lowered to <1000ppm, because the upstream catalyst (ZnCr2O4) alone exhibitedNO reduction ability (Figure 3A), CO or C3H6 might havetaken part in the NO reduction on the upstream catalyst.In order to verify that the tandem catalyst works well, in situ
IR measurements of the downstream catalyst (NO reductioncatalyst) were performed. We used NiFe2O4 catalyst as thedownstream catalyst instead of CuCo2O4 or Cu/CeO2. NOreduction activity of NiFe2O4 was also enhanced by theupstream catalyst (Figure S6 in the Supporting Information).Without ZnCr2O4, partially oxidized hydrocarbon species(acetate (1549 and 1430 cm−1),25−27 formate (1360cm−1),25,26 and carbonate (1310 cm−1)28) were dominantlyobserved on NiFe2O4 (Figure 4, spectrum a). In highwavenumber region, the band at 2193 cm−1 appeared. It canbe assigned to the CN species, based on DFT-based frequencycalculation (see the Supporting Information). Species having aC−N bond were generated from the reaction between NO andC3H6 oxidized species.29,30 When the reaction gas passedthrough ZnCr2O4 (Figure 4, spectrum b), the intensity of allhydrocarbon-derived species attenuated and the same band asthat be visible under NO and CO reaction (spectrum c)
Figure 1. (A) C3H6 conversion and (B) CO conversion of chromiumoxides in NO−C3H6−CO−O2. (Gas composition 1000 ppm of NO,1000 ppm of C3H6, 4000 ppm of CO, 6000 ppm of O2, and Arbalance; catalyst amount = 17.5 mg; total flow rate = 60 mL/min; gashourly space velocity (GHSV) = 205 714 mL g−1 h−1.)
Figure 2. Schematic illustration of the tandem concept.
Figure 3. Temperature-dependent (A) NO conversion and (B) N2yield of tandem catalysts (ZnCr2O4 + CuCo2O4, and ZnCr2O4 + Cu/CeO2), upstream and downstream catalyst alone and 1 wt % Rh/ZrO2catalyst during NO−C3H6−CO−O2 reaction. (Gas composition 1000ppm of NO, 1000 ppm of C3H6, 4000 ppm of CO, 6000 ppm of O2,and Ar balance; catalyst amount = 35.0 mg (the tandem catalysts andRh/ZrO2 catalyst), or 17.5 mg (either of the tandem catalyst alone);total flow rate 60 mL/min; GHSV = 102 857 mL g−1 h−1.)
ACS Catalysis Letter
DOI: 10.1021/acscatal.9b00526ACS Catal. 2019, 9, 2866−2869
2867
ZnCr2O4CuCo2O4
or Cu/CeO2
NO CO C3H6 O2 N2 CO2 H2ONO CO O2
H2O CO2
HC PROX:C3H6 removal by
preferential oxidationNO-CO-O2
Realization of PGM-free tandem catalyst:ZnCr2O4 + CuCo2O4, ZnCr2O4+Cu/CeO2
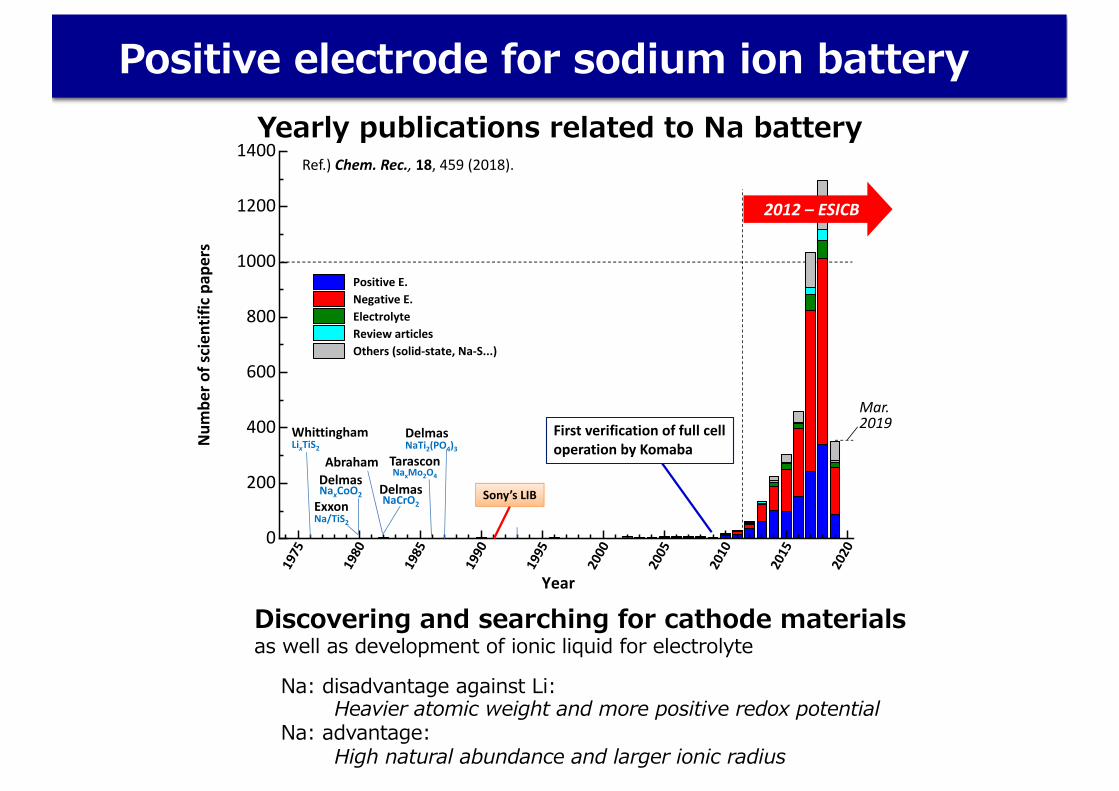
Positive electrode for sodium ion battery
1975
1980
1985
1990
1995
2000
2005
2010
2015
2020
0
200
400
600
800
1000
1200
1400
Num
ber o
f scien
tific pap
ers
Year
Positive E. Negative E. Electrolyte Review articles Others (solid‐state, Na‐S...)
3
DelmasNaCrO2Exxon
Na/TiS2
WhittinghamLixTiS2
DelmasNaTi2(PO4)3
Abraham TarasconNaxMo2O4Delmas
NaxCoO2 Sony’s LIB
Ref.) Chem. Rec., 18, 459 (2018).
Mar.2019
2012 – ESICB
ナトリウムイオン電池: 年間の発表論文数(全世界)
駒場G @ TUSÆ全電池の初実証
TUSの実験ノウハウÆ多くの設備⾒学者受⼊
Ref.) Our group, Adv. Funct. Mater. (2011), Chem. Rev. (2014), Electrochem. (2019).
4
駒場グループ: 年間の引用数
2012 – ESICB
First verification of full cell operation by Komaba
Yearly publications related to Na battery
Na: disadvantage against Li: Heavier atomic weight and more positive redox potential
Na: advantage:High natural abundance and larger ionic radius
Discovering and searching for cathode materialsas well as development of ionic liquid for electrolyte

crystal field splitting for the 3d orbital of iron ions. Recently,Prussian blue analogues, which have a similar frameworkstructure to that of perovskite as shown in Figure 24b, havebeen studied as the Na insertion host structures. The iron andmanganese system with potassium ions, KFe2(CN)6 andKMnFe(CN)6,
234 and the iron(III) system without alkalinemetal ions, Fe2(CN)6,
235 shows 80−120 mAh g−1 of reversiblecapacity as positive electrode materials in Na cells. Polarizationof Prussian blue analogues in the Na cells is much smaller thanthat of the perovskite system with fluoride ions. Goodenough’sresearch group has reported the Na-enriched iron manganesesystem, Na1.72MnFe(CN)6 (an ideal crystal structure withoutsodium vacancies is illustrated in Figure 24b), as a potentialpositive electrode material for NIBs.233 Magnetic measure-
ments of Na1.72MnFe(CN)6 suggest the presence of low-spinFe(II) coordinated by carbon, and the low-spin Fe(II)/Fe(III)is redox active in Na cells.233 Reversible capacity reaches 130mAh g−1 with an average operating voltage of 3.2 V. Thesample also shows excellent rate capability in the Na cell asshown in Figure 25b. The electrode performance of a similarsodium manganese ferrocyanide has been also recentlyreported.236 The activation energy of the charge transferreaction for Na insertion into Prussian blue analogues highlydepends on the electrolyte solution used, and an extremelysmall activation energy (5 kJ mol−1) in water-based electrolytesolution has been reported.237 Additionally, sodium ferrocya-nide, Na4Fe(CN)6, was reported to be electrochemically activein Na cells. The sample delivers ∼90 mAh g−1 of reversiblecapacity with a flat voltage plateau at 3.4 V.238 This reversiblecapacity nearly corresponds to the capacity defined by one-electron redox reaction of iron for Na4Fe(CN)6.Pyrite, FeS2, which is the most common sulfide minerals, is
also utilized as an electrode material for Na cells even thoughits reaction mechanism is not classified as an insertionreaction.239 FeS2 consists of Fe2+ and S22− (persulfide ions),and clear evidence for the presence of a S−S bond is found inthe structure as shown in Figure 24c. On the reduction processin Na cells, Fe2+ is reduced to metallic Fe and S22− is potentiallyreduced to form Na2S. If this reaction (so-called conversionreaction139) is a reversible process, the theoretical capacityexceeds 950 mAh g−1. Although a large initial discharge capacitywas obtained (Figure 25c), reversibility is insufficient as anelectrode material. Use of the conversion reaction could be onestrategy to design the battery system with a high energy densityprovided that round trip efficiencies and capacity retentionupon cycling can be improved.In this section, many different positive electrode materials
have been reviewed. The energy density of selected materials,oxides and polyanionic compounds, are plotted in Figure 26.Here, the energy density was estimated by calculation with theassumption of 300 mAh g−1 for hard carbon as a negativeelectrode material as full cells, as further discussed in the nextsection. Combined with hard carbon, the estimated energy
Figure 25. Electrode performance of (a) FeF3, (b) NaxMnFe(CN)6,and (c) FeS2 (pyrite) in Na cells. (a) Reprinted with permission fromref 231. Copyright 2009 Elsevier. (b) Reprinted with permission fromref 233. Copyright 2013 WILEY-VCH Verbg GmbH&Co. KGaA,Weinheim. (c) Reprinted with permission from ref 239. Copyright2007 Elsevier.
Figure 26. Average voltage (Vave) and energy density (Wh kg−1)versus gravimetric capacity (mAh g−1) for selected positive electrodematerials for NIBs. Energy density was calculated with the hard carbon(reversible capacity of 300 mAh g−1 with Vave = 0.3 V vs Na metal, seeFigure 27) as negative electrode materials. Data derived from refs 51,61, 67, 71, 96, 117, 119, 125, 131, 137, 190, 197, 199, 203, 209, 212,220, and 222−225.
Chemical Reviews Review
dx.doi.org/10.1021/cr500192f | Chem. Rev. XXXX, XXX, XXX−XXXX
Energy Density / Wh (kg-1 of positive & negative)
P2-Na2/3Mg0.28Mn0.72O2
P2-Na2/3Ni11/36Mn23/36Al1/16O2
Variety of cathodes for Na batteryEffective cathode materials reported till 2015
ESICBʼs list of cathode materials is at the level of international database.
: layered oxide: phosphate/sulfate salt
Revision of Fig. 26 in Yabuuchi, Kubota, Dahbi, Komaba, Chem. Rev., 2014, 114, 11636
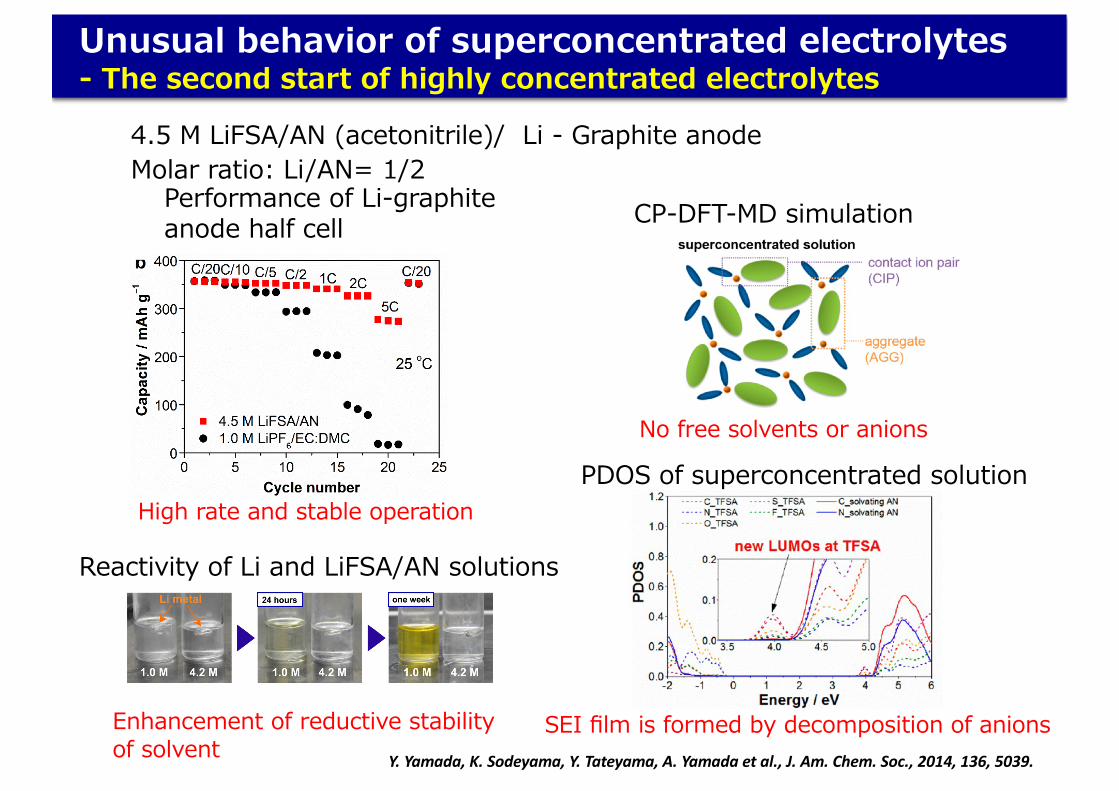
Unusual behavior of superconcentrated electrolytes- The second start of highly concentrated electrolytes
those originating from graphite and its surface functionalgroups (e.g., sp2, sp3, and C−O). The CF3 peak is also observedin the F 1s spectrum as the main chemical state of F element.The CF3 component arises from decomposition products of aTFSA anion (and partially a residual LiTFSA salt). The F 1sspectrum also shows the presence of LiF, which should beformed by the decomposition of a LiTFSA salt. The S 2pspectrum, deconvoluted with spin−orbit split doublets (S 2p3/2and S 2p1/2), shows the presence of −SO2− and SOx withtraces of S and sulfide. Since the only source of S is a TFSAanion in this system, all the species are from decompositionproducts of a TFSA anion. Less informative N 1s and O 1sspectra are presented in Figure S5, from which we could notidentify their accurate chemical states due to the overlapping ofseveral peaks at the almost same binding energy. Overall, thereare plenty of evidence for the formation of a TFSA-derivedsurface film on the graphite electrode in the superconcentratedelectrolyte. During the first lithium intercalation into graphite,the TFSA anion, instead of the AN solvent, is predominantlyreduced to form a stable surface film, which corresponds to theirreversible capacity in the first cycle (Figure 2). Judging fromthe high Coulombic efficiency in the following cycle, the TFSA-derived surface film works as a protective layer to kineticallysuppress further reductive decompositions of TFSA anions aswell as AN solvents. In other words, due to the presence of theTFSA-derived protective surface film, the electrochemicalwindow is kinetically widened to a cathodic direction in thesuperconcentrated AN solution. It is this situation that allowsfor reversible lithium intercalation/deintercalation at a graphiteelectrode by suppressing continuous reductive decompositionsof AN solvents. This enhanced reductive stability, arising frommodified film-forming ability, is unique to such a super-concentrated solution and contrary to the conventional belief
that an AN-based electrolyte is never stable during lithiumintercalation into graphite.
Solution Structure. To identify the solution structureproviding the unusual reductive stability with a TFSA-derivedsurface film, Raman spectra were obtained for LiTFSA/ANsolutions at various Li salt concentrations (Figure 4a,b). TheRaman spectrum of pure AN in Figure 4a shows a CNstretching band (v2 mode) at 2258 cm−1 deriving from free ANmolecules (i.e., without coordinating to Li+).39,40 At 1.0 moldm−3 concentration, another v2 band appears at 2282 cm−1
arising from Li+-solvating AN molecules.39,40 In such dilutesolutions, a stable solvation structure around Li+ is reported tobe 3- or 4-fold coordination (Figure 4c).40,41 Further increasingthe Li-salt concentration decreases free AN molecules andinstead increases the Li+-solvating AN molecules. At 4.2 moldm−3 superhigh concentration, where unusual reductivestability was observed, there is only a peak for Li+-solvatingAN molecules, indicating that all the AN molecules coordinateto Li+. Since the molar ratio of LiTFSA:AN is ca. 1:2 in 4.2 moldm−3 LiTFSA/AN, Li+ should have 2-fold AN coordination onaverage (Figure 4c). Further upshift of the v2 band at 4.2 moldm−3 concentration indicates much stronger CN bond ofAN, suggesting a peculiar coordination structure totallydifferent from those in dilute solutions.Turning to the vibration mode of TFSA− (i.e., S−N
stretching, C−S stretching, and CF3 bending) in Figure 4b, adeconvolution analysis shows that the Raman band consists ofthree peaks at 740, 745, and 750 cm−1, arising from free anions,contact ion pairs (CIPs, TFSA− coordinating to a single Li+
cation), and aggregates (AGGs, TFSA− coordinating to two ormore Li+ cations), respectively.40 At 1.0 mol dm−3 concen-tration, the majority of TFSA− exists as free anions with smallamount of CIPs and AGGs, due to the high salt dissociation
Figure 5. Supercells used and projected density of states (PDOS) obtained in quantum mechanical DFT-MD simulations on (a and b) dilute (1-LiTFSA/43-AN corresponding to 0.4 mol dm−3) and (c) spuerconcentrated (10-LiTFSA/20-AN corresponding to 4.2 mol dm−3) LiTFSA/ANsolutions. The illustrated structures are the snapshots in equilibrium trajectories. For a dilute solution, both situations of LiTFSA salt (i.e., (a) fulldissociation and (b) CIP) were considered. Atom color: Li, purple; C, dark gray; H, light gray; O, red; N, blue; S, yellow; F, green. Li atoms arehighlighted in size. Insets in the PDOS profiles are magnified figures of the lowest energy-level edge of the conduction band.
Journal of the American Chemical Society Article
dx.doi.org/10.1021/ja412807w | J. Am. Chem. Soc. 2014, 136, 5039−50465043
Figure 3. (a) Wide-scan XPS spectra for the natural graphite electrode before (just immersed in the electrolyte for 24 h) and after one-cycle chargeand discharge in 4.2 mol dm−3 LiTFSA/AN electrolyte at C/10 rate. (b) Atomic ratio of C, O, F, S, and N on the surface of the natural graphiteelectrode obtained by the XPS spectra. (c) C 1s, F 1s, and S 2p spectra of the natural graphite electrode after one-cycle charge−discharge test (C/10rate) in 4.2 mol dm−3 LiTFSA/AN electrolyte. Points and solid lines denote experimental spectra and fitting curves, respectively.
Figure 4. Raman spectra of LiTFSA/AN solutions in (a) 2230−2310 cm−1 (CN stretching mode of AN molecules) and (b) 720−780 cm−1 (S−Nstretching, C−S stretching, and CF3 bending mode of TFSA−). Points and solid lines denote experimental spectra and fitting curves, respectively. (c)Representative environment of Li+ in a conventional dilute solution (i.e., ∼1 mol dm−3) and a salt-superconcentrated solution (i.e., 4.2 mol dm−3).
Journal of the American Chemical Society Article
dx.doi.org/10.1021/ja412807w | J. Am. Chem. Soc. 2014, 136, 5039−50465042
Molar ratio: Li/AN= 1/24.5 M LiFSA/AN (acetonitrile)/ Li - Graphite anode
No free solvents or anions
CP-DFT-MD simulation
SEI film is formed by decomposition of anionsY. Yamada, K. Sodeyama, Y. Tateyama, A. Yamada et al., J. Am. Chem. Soc., 2014, 136, 5039.
superconcentrated solution overcomes the inherent poorreductive stability of AN solvent to exhibit enhanced tolerancetoward reduction. The unusual reductive stability was furtherproved by reversible lithium−metal deposition/dissolutionreaction in 4.2 mol dm−3 LiTFSA/AN electrolyte (FigureS2). Although the reversibility is not good enough, this is thefirst to enable lithium metal to function as a reversible electrodein an AN-based electrolyte. Since the reaction is thoroughlyirreversible in 3.0 mol dm−3 solution (Figure S3), the unusualreductive stability is unique to such superconcentratedsolutions as 4.2 mol dm−3. Note that oxidative stability isretained over 5 V vs Li/Li+ reflecting AN’s inherent hightolerance against oxidation (Figure S4).Lithium Intercalation into Graphite. Having confirmed
the enhanced reductive stability of the superconcentrated ANsolution, we studied electrochemical lithium intercalation/deintercalation reaction at graphite electrode, which occurs at aquite low potential close to 0 V vs Li/Li+. To ensure thepractical validity of this superconcentrated electrolyte, theexperiment is conducted under one of the most severeconditions; we used natural graphite without any surfacetreatment, which is quite inexpensive but difficult to obtainreversibility compared to widely used surface-treated naturalgraphite or synthetic graphite,29 and also did not rely on anyother techniques such as functional binders30 or electrolyteadditives31−33 to facilitate reversible lithium intercalation.Figure 2 shows charge−discharge curves of a natural graph-ite/lithium metal coin cell using the 4.2 mol dm−3 LiTFSA/ANelectrolyte. In the charge−discharge curves, several voltageplateaus appear in 0.05−0.25 V, which are characteristic of the
sequential formation of several stage structures of lithium-graphite intercalation compound (Li-GIC).34,35 The obtainedreversible capacity was ca. 330 mAh g−1, which is close to thetheoretical capacity (372 mAh g−1) based on fully lithiatedLiC6. These results clearly indicate the reversible lithiumintercalation reaction at the natural graphite electrode. Withoutrelying on any technique to facilitate lithium intercalation, we,for the first time, observed a reversible operation of a graphitenegative electrode in an AN-based electrolyte. The successfullithium intercalation into graphite in one of the most reduction-vulnerable solvents validates our “salt-concentrating” strategy asa powerful and effective method of expanding the graphitenegative-electrode reaction for a wide variety of organicsolvents other than EC. To universalize this phenomenon, itis of critical significance to shed light on the mechanism ofenhanced reductive stability in a superconcentrated solution.Generally, a surface film (i.e., solid electrolyte interphase,
SEI36) is a key to reversible lithium intercalation intographite.37,38 Therefore, we studied the surface atomiccomposition of the natural graphite electrode before and aftera charge−discharge test in 4.2 mol dm−3 LiTFSA/ANelectrolyte by XPS (Figure 3a,b). Unfortunately, we could nothelp avoiding a comparison with the SEI composition in adilute 1.0 mol dm−3 electrolyte, because the experiment ishighly dangerous due to the potential generation of freecyanide. Before a charge−discharge test (i.e., just immersed in4.2 mol dm−3 LiTFSA/AN for 24 h, and washed with DMC),the major surface element was C from the natural graphite andpartially from the PVdF binder. A small amount of F elementshould derive from the PVdF binder and the residual LiTFSAsalt. The ratio of S and N elements, which are exclusively fromLiTFSA or AN, is quite low compared to C element, suggestingthat the residual electrolyte component is negligible after thewash with DMC. On the other hand, after one-cycle dischargeand charge in the superconcentrated 4.2 mol dm−3 LiTFSA/AN electrolyte, the C element was remarkably decreased andthe other elements, F, O, S, and N, became the main surfacecomponents. This indicates that the graphite electrode wascovered with a surface film, whose composition is mainly F andO elements with non-negligible presence of S and N elements.From these results, the main component of the surface film inthe superconcentrated system is reasonably regarded asdecomposition products of a TFSA anion.A detailed analysis on the surface film of the natural graphite
cycled in 4.2 mol dm−3 LiTFSA/AN is shown in Figure 3c. TheC1s spectrum displays five peaks representing graphite (sp2),C−H/C−C (sp3), C−O, CO3/PVdF, and CF3. It is character-istic of the present case that a large amount of CF3 exists as oneof the main chemical states of carbon element, in addition to
Figure 1. Reactivity of lithium metal foil and LiTFSA/AN solutions at 1.0 and 4.2 mol dm−3 concentrations at room temperature.
Figure 2. Charge−discharge curves of natural graphite/lithium metalcell with 4.2 mol dm−3 LiTFSA/AN electrolyte at C/10 rate.
Journal of the American Chemical Society Article
dx.doi.org/10.1021/ja412807w | J. Am. Chem. Soc. 2014, 136, 5039−50465041
Enhancement of reductive stability of solvent
Reactivity of Li and LiFSA/AN solutions
PDOS of superconcentrated solution
the superconcentrated LiFSA/AN electrolyte exhibited much higher charging rate capability than not only a currently used com-mercial EC-based electrolyte but also a superconcentrated ether electrolyte we recently reported.15 We postulate that the ultrafast lithium intercalation should arise from several possible factors characteristic to the superconcentrated acetonitrile electrolyte: i) high ionic transport properties (ionic conductivity and Li+ transfer-ence number), ii) high pre-exponential factor of lithium intercala-tion due to high interfacial Li+ concentration, iii) a good surface film facilitating lithium intercalation, and iv) de-complexation ki-netics of CIPs and AGGs different from de-solvation. The detailed mechanism of ultrafast lithium intercalation is under investigation and will be reported elsewhere. Our finding of ultrafast lithium intercalation into graphite in a superconcentrated AN electrolyte will be an important breakthrough toward fast-charging lithium-ion batteries with expanding application to automobiles.
Figure 6 a) Discharge curves of a natural graphite / lithium metal half cell with superconcentrated 4.5 mol dm−3 LiFSA/AN and commercial 1.0 mol dm−3 LiPF6/EC:DMC (dimethyl carbonate) (1:1 by vol.) elec-trolytes at various C-rates (C/10, C/2, 1C, and 2C) at 25 oC. b) Re-versible capacity of natural graphite in the two electrolytes at various C-rates and 25 oC. Charge and discharge were conducted at the same C-rate without using a constant-voltage mode at both ends of charge and discharge, and the charge (lithium de-intercalation) capacity was plot-ted.
Conclusions and perspective
In summary, we have found enhanced reductive stability and ultrafast-charging character in a superconcentrated organic electro-lyte for lithium-ion batteries. As an example, a superconcentrated AN solution suppresses the inherent low reductive stability of AN
solvent to allow for reversible lithium intercalation into a graphite electrode. More importantly, the intercalation kinetics is much faster than in a currently used commercial electrolyte and hence, the superconcentrated electrolyte can be an important break-through toward fast-charging lithium-ion batteries. The origin of enhanced reductive stability at superhigh Li-salt concentrations was clarified by both experimental and theoretical approaches. A super-concentrated solution has a unique networking structure of Li+ cations and TFSA− anions with Li+-solvating AN solvents, which modifies frontier orbital characters in the solution; the LUMOs, which dominate the behavior of its reduction reaction, shift from AN solvents to TFSA− anions. Consequently, the TFSA− anions, instead of AN solvents, are predominantly reduced to form a TFSA-derived surface film on a graphite electrode during first lithi-um intercalation, which suppresses further decompositions of the electrolyte. The modified surface-film character, arising from the peculiar frontier orbitals, is the origin of the enhanced reductive stability of a superconcentrated solution that allows for reversible lithium intercalation into a graphite electrode without EC solvents. This work ensures the practical validity of superconcentrated or-ganic solutions as a promising electrolyte for advanced batteries.
In the future, our superconcentrating strategy will open a new research avenue in a functional electrolyte for advanced electro-chemical technologies. In particular, the present breakthrough based on the superconcentrated AN electrolyte will be an im-portant step toward high-voltage Li-ion batteries utilizing graphite negative electrode and 5 V-class positive electrode, since the elec-trolyte allows for a reversible graphite negative-electrode reaction with retaining high oxidation potential over 5 V inherent to AN. Furthermore, the superconcentrated organic electrolyte can con-tribute to fast-charging lithium-ion batteries which are urgently required for automobile application. However, there are several problems to be overcome before consideration to practical applica-tions. First, the coulombic efficiency and cycle performance of a graphite electrode should be further improved. However, it should be noted that the present results are obtained under a severe condi-tion; we used as-received natural graphite without any surface treatment,29 functional binder,30 or electrolyte additive.31-33 Relying on these techniques facilitating reversible lithium intercalation will remarkably improve the coulombic efficiency and cycle perfor-mance. Second, the corrosion of an aluminum current collector by a LiTFSA salt might be a problem. This side reaction will easily be suppressed by simple addition of a small amount of another salt such as LiPF6.2 Although it will be a long way to realize a supercon-centrated electrolyte in practical application after resolving all above problems and also the issue of cost, we believe that the pecu-liar electrochemical feature and its detailed mechanism presented herein will be of great value not only in the development of next-generation advanced batteries but also in the fundamental research in electrochemistry and solution chemistry.
ASSOCIATED CONTENT Supporting Information. Total energy profiles of DFT-MD simula-tion step, lithium metal deposition/dissolution, oxidative stability, N 1s and O 1s spectra, PDOS of different DFT-MD trajectories or different initial configuration convergence, rate-performance, physicochemical properties of LiFSA/AN, and charge-discharge curves in LiFSA/AN. This material is available free of charge via the Internet at http://pubs.acs.org.
High rate and stable operation
Performance of Li-graphite anode half cell
REVIEW ARTICLENATURE ENERGY
0 100 200 300 400
0
1
2
3Graphite|Li C/5
1,000th
Vol
tage
(V
)
5.3 M LiFSA/TMP
Capacity (mAh g−1)
7th
High level of safetyFire-extinguishing,
non-volatile·
Sal
t-der
ived S
EI · High transport number ·
LiBF4 /PC:HFE 65
LiTFSA/glyme:HFE29
LiFSA:LiPF6 /EA 19
NaFSA/DME 85
2002
LiFSA/SL 60
LiFSA/SL:HFE 62
Wide voltage window · N
o fre
e so
lven
t
Multiple functionalities
Advanced batteries
Graph
ite
inter
calat
ionMeta
l
platin
g
Stoppin
g
Li 2S x
shutt
le
Suppr
essin
g
Al cor
rosio
n High
rate High
stabil
ity. ..
Fire-
extin
guish
ing
Dilutin
g
Aqueo
us
2011
LiTFSA/glyme 12
2008 LiBETA/PC 57
LiBETA/PC 58
2013
2014
2015
2016
2017
2018
2012
Yea
r
5 V-cl
ass
oper
ation
LiFSA/DME 18
LiFSA/DMC 20
LiFSA/TMP 21
LiTFSA/DME:DOL 28
LiTFSA/EC:DEC 27
LiFSA/SL60
LiFSA/DME 18
LiFSA/AN 14
LiFSA/DME 31
LiFSA/TEP 45
NaFSA/DME 85
LiFSA/TMP 21
NaFSA/TMP 21
LiTFSA/H2O 46
LiTFSA:LiBETA/H2O 47
LiTFSA:LiOTf/H2O:PVA 48,102
LiFSA/DMC 20
LiFSA/EMC 20
LiFSA/DEC 20
LiFSA:LiPF6 /EA 19
LiFSA:LiPF6 /EA 19
LiTFSA/EC 16
LiFSA/DMC 20
LiFSA/EMC 20
LiFSA/DEC 20
LiFSA/PC 20
LiFSA/EC 20
LiFSA/EC:DMC 20
LiPF6 /PC 98
LiFSA/SL 60
LiTFSA/DOL 100
LiTFSA/SL 15
LiTFSA/THF 15
LiTFSA/DMSO 15
LiFSA/TMP 21 LiFSA/FEC 84
LiTFSA/AN:HFE 95
LiFSA/TEP:BTFE 106
LiFSA/DMC:BTFE 64
LiFSA/FEC 84
LiFSA/DMC 103
LiFSA/EC:DMC 103
LiTFSA/AN:HFE 95
LiTFSA:LiOTf/H2O 99
ZnTFSA:LiTFSA/H2O 105
2019
.
.
.
LiTFSA/DME:DOL 28
LiFSA/DMC 20
LiFSA/EMC 20
LiFSA/DEC 20
LiFSA/PC 20
LiFSA/EC 20
LiFSA/EC:DMC 20
LiFSA/DME 97
LiFSA/TFEP 101
LiFSA/TEP 45
LiFSA/SL 60
LiFSA/SL:HFE 62
LiFSA/TMP 21
LiFSA/DMC:BTFE 64
LiFSA/TEP:BTFE 106
ZnTFSA:LiTFSA/H2O 105
NaFSA/DME:BTFE 104
LiFSA/SL:HFE 62
NaFSA/DME:BTFE 104
Oxidati
on
stabil
ity
LiCTFSA/glyme 107LiTFSA/DMSO 108
LiTFSA/H2O 46
NaFSA/DME:BTFE 104
Technical achievements
b
LiFSA/AN 14
LiTFSA/AN
LiTFSA/glyme:HFE29
LiTFSA/glyme96
NaFSA/DME 85 LiPF6/PC 98
LiFSA/AN 59
LiTFSA:LiOTf/H2O:PVA 102
Metal anode realityDendrite suppression
High voltage operationStable 5 V full-cell
High rateSmall polarization
at graphite
High stabilityLong calender life, wide
operating temperature range
Elimination of side reactionsAnti-corrosion,
shuttle prevention
a
3.3 MNaFSA/TMP
1.0 MNaPF6/EC:
DEC
Li2S8 dissolution inLiTFSA/DME:DOL
0 M 2 M 4 M 7 M
0 30 60 90 1203.5
4.0
4.5
5.0LNMO|graphite
40 °C C/5
5.5 M LiFSA/DMC
2nd100th
Capacity (mAh g−1)
Vol
tage
(V
)0 5 10 15 20 25
0
100
200
300
400
1.0 M LiPF6/EC:DMC4.5 M LiFSA/AN
C/20
5C2C1CC/2C/5C/10
Graphite|Li
C/20
Cap
acity
(mA
h g−1
)Cycle number
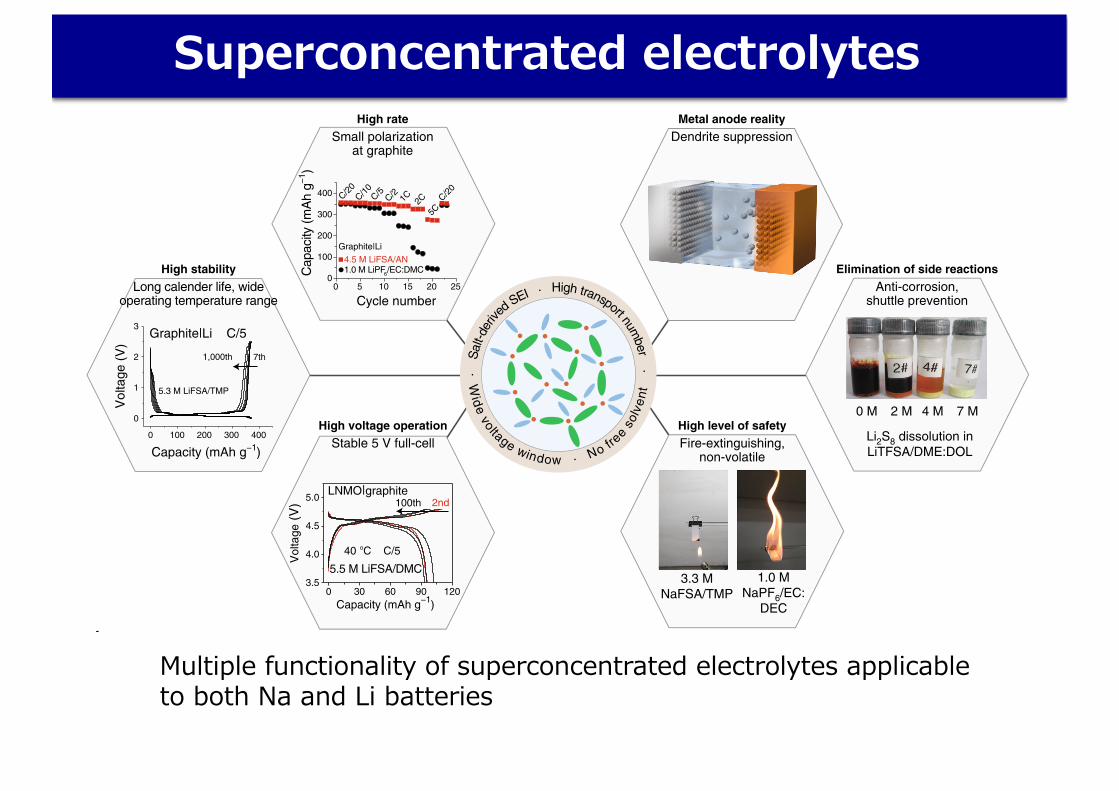
Fig. 2 | Advanced battery functions realized by concentrated electrolytes. a, The central circle (pale blue) encloses a representative structure of a concentrated electrolyte surrounded by an outer circle containing the essential material properties (pale brown) that determine the physicochemical and electrochemical properties. The outer hexagons list the various advanced battery functions: high rate (reproduced from ref. 14, American Chemical Society), high stability (reproduced from ref. 21, Springer Nature Ltd), high-voltage operation (reproduced from ref. 20, Springer Nature Ltd), high level of safety (reproduced from ref. 21, Springer Nature Ltd), metal anode reality, and elimination of side reactions (reproduced from ref. 28, Springer Nature Ltd). LNMO, LiNi0.5Mn1.5O4. b, Concentrated electrolytes and relevant technical achievements summarized according to publication year. The abbreviations of salts and solvents are as follows: BTFE, bis(2,2,2-trifluoroethyl) ether; SL, sulfolane; DOL, 1,3-dioxolane; FEC, fluoroethylene carbonate; THF, tetrahydrofuran; EMC, ethyl methyl carbonate; PC, propylene carbonate; DMSO, dimethyl sulfoxide; DEC, diethyl carbonate; LiOTf, LiCF3SO3; LiBETA, LiN(SO2C2F5)2; LiCTFSA, (LiN(C2F4S2O4); PVA, polyvinyl alcohol. The colour code is based on a group of solvents: red, carbonates; orange, nitriles; purple, water; pink, phosphates; blue, ethers; black, others. A variety of compositions in each solvent group are denoted as light and dark in a same colour group12,14–16,18–21,27–29,32,46–49,31,58,59,60,62,64,65,85,95–108.
NATURE ENERGY | www.nature.com/natureenergy
Superconcentrated electrolytes
Multiple functionality of superconcentrated electrolytes applicable to both Na and Li batteries

Publications and Patent Applications
Original papers Patent applicationsTotal
publications 5<I.F.<10 10<I.F.
2012 18 6 02013 97 20 42014 272 57 142015 200 41 162016 204 54 122017 245 58 112018 254 44 27
Domestic Inter-National
2012 2 02013 5 12014 4 12015 4 62016 6 12017 9 32018 4 5
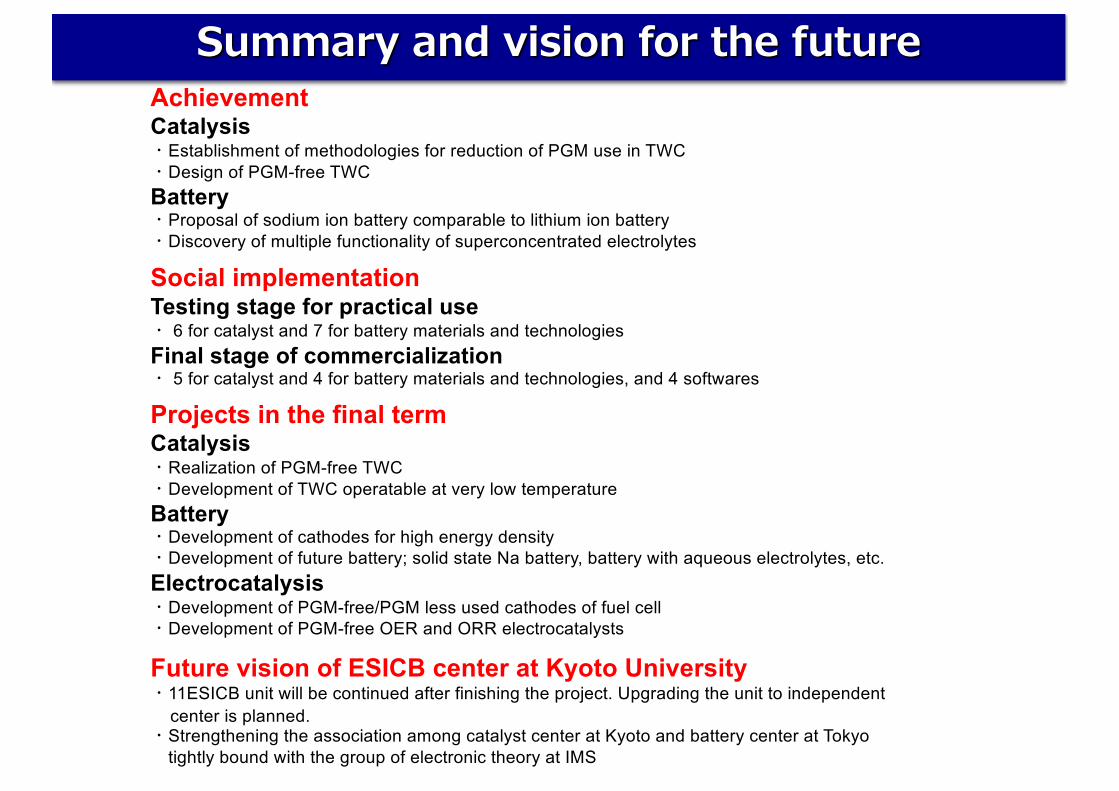
Summary and vision for the futureAchievementCatalysis・Establishment of methodologies for reduction of PGM use in TWC・Design of PGM-free TWCBattery・Proposal of sodium ion battery comparable to lithium ion battery・Discovery of multiple functionality of superconcentrated electrolytes
Projects in the final termCatalysis・Realization of PGM-free TWC・Development of TWC operatable at very low temperatureBattery・Development of cathodes for high energy density・Development of future battery; solid state Na battery, battery with aqueous electrolytes, etc.Electrocatalysis・Development of PGM-free/PGM less used cathodes of fuel cell・Development of PGM-free OER and ORR electrocatalysts
Future vision of ESICB center at Kyoto University・11ESICB unit will be continued after finishing the project. Upgrading the unit to independent
center is planned.・Strengthening the association among catalyst center at Kyoto and battery center at Tokyo
tightly bound with the group of electronic theory at IMS
Social implementationTesting stage for practical use・ 6 for catalyst and 7 for battery materials and technologiesFinal stage of commercialization・ 5 for catalyst and 4 for battery materials and technologies, and 4 softwares