Embed Size (px)
Citation preview
Journal of Natural Gas Chemistry 13(2004)23–35
Screening of MgO- and CeO2-Based Catalysts for Carbon Dioxide
Oxidative Coupling of Methane to C2+ Hydrocarbons
Istadi∗, Nor Aishah Saidina Amin∗∗
Chemical Reaction Engineering Group (CREG), Faculty of Chemical and Natural Resources Engineering,
Universiti Teknologi Malaysia, UTM Skudai, Johor Bahru, 81310 Malaysia
[Manuscript received February 13, 2004; revised March 16, 2004]
Abstract: The catalyst screening tests for carbon dioxide oxidative coupling of methane (CO2-OCM)have been investigated over ternary and binary metal oxide catalysts. The catalysts are prepared by dopingMgO- and CeO2-based solids with oxides from alkali (Li2O), alkaline earth (CaO), and transition metalgroups (WO3 or MnO). The presence of the peroxide (O2−
2 ) active sites on the Li2O2, revealed by Ramanspectroscopy, may be the key factor in the enhanced performance of some of the Li2O/MgO catalysts.The high reducibility of the CeO2 catalyst, an important factor in the CO2-OCM catalyst activity, may
be enhanced by the presence of manganese oxide species. The manganese oxide species increases oxygenmobility and oxygen vacancies in the CeO2 catalyst. Raman and Fourier Transform Infra Red (FT-IR)spectroscopies revealed the presence of lattice vibrations of metal-oxygen bondings and active sites in whichthe peaks corresponding to the bulk crystalline structures of Li2O, CaO, WO3 and MnO are detected. Theperformance of 5%MnO/15%CaO/CeO2 catalyst is the most potential among the CeO2-based catalysts,although lower than the 2%Li2O/MgO catalyst. The 2%Li2O/MgO catalyst showed the most promisingC2+ hydrocarbons selectivity and yield at 98.0% and 5.7%, respectively.
Key words: catalyst screening, carbon dioxide, oxidative coupling, methane, ternary metal oxide, binarymetal oxide, MgO, CeO2, C2+ hydrocarbons
1. Introduction
The direct conversion of methane to ethane, ethy-
lene and acetylene (C2+ hydrocarbons) is considered
to be one of the most effective uses of natural gas as
a chemical resource. The compositions of natural gas
from the Natuna’s fields contains up to 71% carbon
dioxide and 28% methane [1]. The high CO2/CH4
ratio in Natuna’s natural gas compositions should
be strategically utilized for the production of higher
hydrocarbons and other important chemicals. It is
highly desirable from the environmental point of view
to utilize and convert both methane and carbon diox-
ide from natural gas into higher value-added chemicals
without having to separate the carbon dioxide first.
Carbon dioxide rather than oxygen may be the al-
ternative oxidant for the catalytic reaction of methane
to produce C2+ hydrocarbons due to the fact that
in the gas phase the methyl radicals are induced by
the presence of oxygen and not by carbon dioxide
[2,3]. Recently, the conversion of natural gas us-
ing carbon dioxide as the oxidant has received con-
siderable attention [2–8]. Among 30 metal oxides
studied, praseodymium and terbium oxides showed
potential [2,3,5] for catalyzing the CO2-OCM reac-
tion to produce C2+ hydrocarbons. Carbon dioxide
showed a positive role in the formation of C2+ hydro-
∗∗ Corresponding author. Tel: 607-5535588; Fax: 607-5581463; E-mail: [email protected];∗ Present address: Dept. of Chemical Engineering, Diponegoro University, J1. Prof. H. Sudharto, SH., Tembalang, Semarang,
50239 Indonesia.
24 Istadi et al./ Journal of Natural Gas Chemistry Vol. 13 No. 1 2004
carbons in the oxidative coupling of methane over a
PbO-MgO catalyst [5]. A series of binary metal ox-
ide catalysts based on CaO-CeO2 [5], CaO-ZnO [7]
and La2O3-ZnO [9] were developed, but the catalytic
performance was not satisfactory. The modification
of binary metal oxide system was also developed by
combining MnO2 with alkaline earth (CaO, SrO and
BaO), while Cr2O3, CeO2 and ZnO were also used to
replace MnO2 [4], but the catalytic performance was
again not satisfactory. In a more recent development,
C2+ hydrocarbons selectivity approached 79.1% over
Mn-SrCO3 catalyst with a C2+ hydrocarbons yield of
4.5% [8] that closely resembled the results achieved
by previous researchers [4,5,7].
Table 1 compares the screening results reported
by previous researchers [4,6,8]. Most of the cata-
lysts reported gave a lower methane conversion and a
smaller C2+ hydrocarbons yield relatively when car-
bon dioxide, instead of oxygen, is the oxidant for
oxidative coupling of methane. Previously, most re-
searchers concluded that the oxidation/reduction re-
actions of Ce4+/Ce3+ or Mn3+/Mn2+ are effective to
activate carbon dioxide to form oxygen active species,
while the C2+ selectivity is related to the basicity of a
catalyst due to enhanced CO2 chemisorptions on the
catalyst surface [4,5,8].
Table 1. Catalysts performance results from previous researchers
C2+ hydrocarbonsCatalysts CH4 conversion (%) CO selectivity (%)
Selectivity (%) Yield (%)Ref.
CeO2 12 — 0.5 0.1 [6]
CaO-CeO2(Ca/Ce=0.1) 5.1 — 46 2.3 [6]
CaO-CeO2(Ca/Ce=0.2) 4.9 — 55 2.7 [6]
CaO-CeO2(Ca/Ce=0.5) 5 — 62 3.2 [6]
CaO-CeO2(Ca/Ce=1) 3.4 — 46 1.6 [6]
CaO 0.3 — 36 0.1 [6]
CaO-ZnO(Ca/Zn=0.5) 3.4 18 82 2.8 [7]
CaO-MnO(Ca/Mn=1) 3.9 32 68 2.7 [4]
SrO-MnO(Sr/Mn=1) 3.9 15 85 3.3 [4]
BaO-MnO(Ba/Mn=0.5) 3.8 33 67 2.6 [4]
BaO-MnO(Ba/Mn=1) 2.3 15 85 1.9 [4]
MnO-SrCO3(Mn/Sr=0.2) 5.7 79.1 20.9 4.5 [8]
MnO-SrCO3(Mn/Sr=0.1) 4.9 87.9 12.1 4.3 [8]
Thermodynamic calculations for the overall re-
action of CO2-OCM demonstrated the equilibrium
yields of ethane and ethylene formed by the reactions
between methane and carbon dioxide were 15% and
25%, respectively, at temperature equal to and above
800 � for CO2/CH4 ratio of 2 [4]. In another study,
the equilibrium conversions of methane to ethane and
ethylene were about 6% each at the same CO2/CH4
ratio but temperature of 600 � [5]. Equations (1) and
(2) are the two main reaction schemes for CO2-OCM
to produce C2+ hydrocarbons with carbon monoxide
and water as the by-products.
2CH4 + CO2 ⇐⇒ C2H6 + CO + H2O
∆ H0298 = +17 kJ/mol (1)
2CH4 + 2CO2 ⇐⇒ C2H4 + 2CO + 2H2O
∆ H0298 = +176 kJ/mol (2)
Although lithium-doped magnesium oxide cata-
lyst, Li2O/MgO, is one of the most extensively stud-
ied catalysts for methane oxidative coupling by oxy-
gen (O2-OCM) [10,11], its potential in the catalytic
CO2-OCM process has not been widely studied. Ac-
cording to previous researchers, one of the active
sites for initial abstraction of hydrogen atom from
methane were believed to be [Li+O−] (=[Li’MgO•O])
centers formed by the substitution of Li+ at lattice
sites normally occupied by Mg2+ which was observed
by EPR and XPS [11–13]. The Li+-ion was incor-
porated into the MgO lattice as substitutional ions
on magnesium sites with oxygen vacancies for charge
compensation. The oxygen vacancies are then substi-
tuted by oxygen or carbon dioxide producing oxygen
active species. Besides, it was also suggested [12,13]
that a diatomic species of peroxide (O2−2 ) ion is also an
active species on this catalyst. Since the O-O stretch-
ing mode is Raman active, Raman spectroscopy is
Journal of Natural Gas Chemistry Vol. 13 No. 1 2004 25
particularly suitable for investigating peroxide species
on the catalysts. However, the peroxide (O2−2 ) ions
cannot be detected by EPR because they are diamag-
netic.
CeO2 is a basic oxide having excellent redox prop-
erties owing to the very fast reduction of Ce4+ to Ce3+
associated with the formation of oxygen vacancies at
the surface and in the solid. The oxygen mobility, re-
ducibility and ionic conductivity of CeO2-based cata-
lyst can be enhanced by doping CeO2 with transition
metal oxide (MnO or WO3). The catalyst surface
with a high basicity lead to the adsorption and ac-
tivation of carbon dioxide to produce oxygen active
species which in turn activate methane to produce
methyl radicals (CH∗3). A highly basic catalyst is pro-
posed to be able to enhance carbon dioxide adsorption
which is then activated on oxygen vacancies to form
oxygen active species and gaseous carbon monoxide
according to Equations (3) and (4) using the Kroger-
Vink notation [13].
V••o + 2CO2(gas) ⇐⇒ 2O•
o + 2CO(gas) (3)
V••o + 2CO2(gas) ⇐⇒2Ox
o+2CO(gas) + 2h• (4)
In reactions (3) and (4), V••o denotes doubly ionized
oxygen vacancies, h• denotes electron holes, Ox
o de-
notes oxygen ion on neutral lattice positions and O•o
denotes single ionized oxygen on oxygen vacancies as
active oxygen species. The reducibility and existence
of defect sites on CeO2 structures enhanced by dop-
ing CeO2 with transition metals such as Zn, W or Mn
increased oxygen vacancy centers which may be re-
sponsible for CO2 activation to oxygen active species
and, moreover, improved the catalyst surface area due
to reduced CeO2 crystal sizes [7].
In this paper, highly basic MgO- and CeO2-based
catalysts are screened to investigate their potentials
in catalyzing CO2-OCM process to produce C2+ hy-
drocarbons. Solutions of W, Mn, Ca and/or Li are
impregnated on either MgO or CeO2 to form binary
and ternary metal oxide catalysts and tested for CO2-
OCM reactions. The adsorbed carbon dioxide is pro-
posed to be activated on the oxygen vacancies to form
gaseous CO and oxygen active species by reduced
cerium, manganese and/or tungsten ions and also the
active centers of the Li2O/MgO catalyst. The cat-
alysts performances for the CO2-OCM are discussed
based on their catalytic activities. In addition, the
presence and the structures of metal oxides as well as
the active sites on the catalyst surface are investigated
by Raman and FT-IR spectroscopies.
2. Experimental
2.1. Catalyst preparation
All binary and ternary metal oxide cata-
lysts used in this study were prepared by the
conventional wet-impregnation method. CeO2
(MERCK) or MgO (97%, MERCK) powder
were used as catalyst supports, while LiNO3
(99.995%, MERCK), (NH4)6W12O40 · xH2O (85%,
FLUKA), Mn(NO3)2·4H2O (98.5%, FLUKA) and/or
Ca(NO3)2·4H2O (99%, ALDRICH) were used as pre-
cursors. Powdery CeO2 or MgO were first immersed
into an aqueous solution of M(NO3)n ·xH2O (M=Ca,
Li and Mn) or (NH4)6W12O40 · xH2O for 6 h at
ambient temperature. The water was then evap-
orated overnight in an oven (MEMMERT) at 120
� . Next, the powder was calcined at 850 � in
a muffle furnace (CARBOLITE) for 4 h and then
crushed into the desired size (45–60 mesh). The
ternary metal oxides were prepared by sequen-
tial wet-impregnation technique. The CeO2-based
catalysts tested were pure CeO2, 5%MnO/CeO2,
15%CaO/CeO2, 5%MnO/15%CaO/CeO2 and
3%WO3/15%CaO/CeO2 catalysts. The amount of
MnO, CaO and WO3 loaded on the catalysts are
based on previous studies [4–7] and pre-exploratory
tests in which the promising catalytic performances
were reported over the catalysts with these composi-
tions. Meanwhile, pure MgO and MgO doped with
1%, 2%, 5% and 10% of Li2O as well as 3% and 5% of
WO3 and MnO, respectively were also tested. These
catalysts were also prepared according to the previ-
ous study [12] in which Li loading range of 0.5%–7.5%
gave more promising results for O2-OCM due to the
suitable formation of [Li+O−] or peroxide ions active
centers.
2.2. Catalytic reaction
All the catalytic performances were tested us-
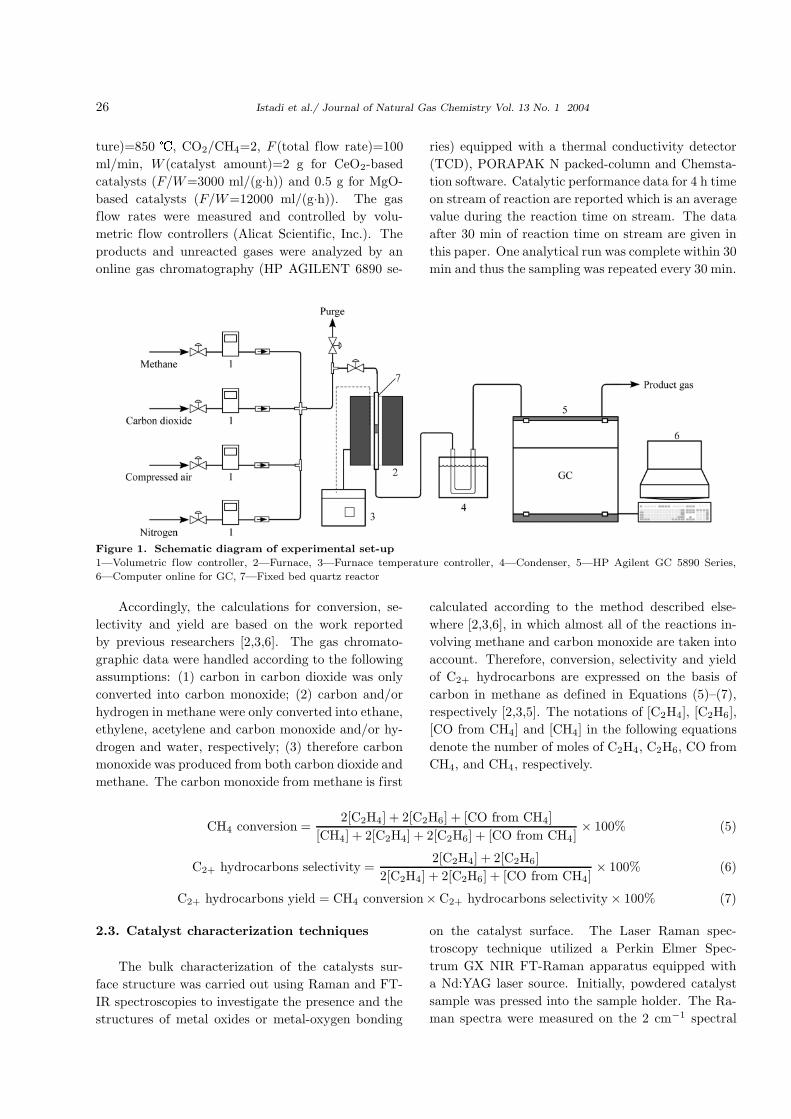
ing a fixed-bed quartz reactor. The schematic di-
agram of the experimental set-up is shown in Fig-
ure 1. Before reaction, the catalyst was recalcined at
850 � in air flow (100 ml/min) for 1 h and flushed
with high purity nitrogen (>99.999%, 100 ml/min)
at 850 � for another 1 h. The reaction was ini-
tiated by feeding methane (>99.999%) and carbon
dioxide (>99.995%) to the reactor. The following
inlet conditions were used for the CO2-OCM reac-
tion during catalyst screening: T (reactor tempera-
26 Istadi et al./ Journal of Natural Gas Chemistry Vol. 13 No. 1 2004
ture)=850 � , CO2/CH4=2, F (total flow rate)=100
ml/min, W (catalyst amount)=2 g for CeO2-based
catalysts (F/W=3000 ml/(g·h)) and 0.5 g for MgO-
based catalysts (F/W=12000 ml/(g·h)). The gas
flow rates were measured and controlled by volu-
metric flow controllers (Alicat Scientific, Inc.). The
products and unreacted gases were analyzed by an
online gas chromatography (HP AGILENT 6890 se-
ries) equipped with a thermal conductivity detector
(TCD), PORAPAK N packed-column and Chemsta-
tion software. Catalytic performance data for 4 h time
on stream of reaction are reported which is an average
value during the reaction time on stream. The data
after 30 min of reaction time on stream are given in
this paper. One analytical run was complete within 30
min and thus the sampling was repeated every 30 min.
Figure 1. Schematic diagram of experimental set-up
1—Volumetric flow controller, 2—Furnace, 3—Furnace temperature controller, 4—Condenser, 5—HP Agilent GC 5890 Series,
6—Computer online for GC, 7—Fixed bed quartz reactor
Accordingly, the calculations for conversion, se-
lectivity and yield are based on the work reported
by previous researchers [2,3,6]. The gas chromato-
graphic data were handled according to the following
assumptions: (1) carbon in carbon dioxide was only
converted into carbon monoxide; (2) carbon and/or
hydrogen in methane were only converted into ethane,
ethylene, acetylene and carbon monoxide and/or hy-
drogen and water, respectively; (3) therefore carbon
monoxide was produced from both carbon dioxide and
methane. The carbon monoxide from methane is first
calculated according to the method described else-
where [2,3,6], in which almost all of the reactions in-
volving methane and carbon monoxide are taken into
account. Therefore, conversion, selectivity and yield
of C2+ hydrocarbons are expressed on the basis of
carbon in methane as defined in Equations (5)–(7),
respectively [2,3,5]. The notations of [C2H4], [C2H6],
[CO from CH4] and [CH4] in the following equations
denote the number of moles of C2H4, C2H6, CO from
CH4, and CH4, respectively.
CH4 conversion =2[C2H4] + 2[C2H6] + [CO from CH4]
[CH4] + 2[C2H4] + 2[C2H6] + [CO from CH4]× 100% (5)
C2+ hydrocarbons selectivity =2[C2H4] + 2[C2H6]
2[C2H4] + 2[C2H6] + [CO from CH4]× 100% (6)
C2+ hydrocarbons yield = CH4 conversion× C2+ hydrocarbons selectivity × 100% (7)
2.3. Catalyst characterization techniques
The bulk characterization of the catalysts sur-
face structure was carried out using Raman and FT-
IR spectroscopies to investigate the presence and the
structures of metal oxides or metal-oxygen bonding
on the catalyst surface. The Laser Raman spec-
troscopy technique utilized a Perkin Elmer Spec-
trum GX NIR FT-Raman apparatus equipped with
a Nd:YAG laser source. Initially, powdered catalyst
sample was pressed into the sample holder. The Ra-
man spectra were measured on the 2 cm−1 spectral
Journal of Natural Gas Chemistry Vol. 13 No. 1 2004 27
resolution with an absolute accuracy of ±0.1 cm−1.
Meanwhile, the excitation line was set at 514.4 nm
and the excitation power was constant at 350 mW for
all samples except for the Mn-based samples. For the
Mn-based samples, the power attempted was in the
range of 25–500 mW in order to detect the peak mea-
surement. The Raman shift band of the sample was
initially performed in the range of 4000 cm−1 up to
100 cm−1and later to 1200–100 cm−1, depending on
the metal oxide catalyst.
The infra red spectra were recorded on a Perkin
Elmer Spectrum GX NIR FT-Raman using the KBr
film technique. IR spectra were acquired in the ab-
sorbance mode at 25 � and resolution of 2 cm−1. The
IR wavenumber of the sample was initially performed
in the range of 4000-400 cm−1 which was then focused
in the range of 1000–400 cm−1. The film was made by
pressing about 10 mg of fine catalyst powder mixed
physically with about 350 mg KBr powder. Finally,
the transparent film was placed in a ring type sample
holder and transferred into the IR cell.
The FT-IR and Raman spectroscopies are able
to characterize the molecular structure of the sur-
face metal oxides, the surface coverage of the metal
oxide and the structure of the active surface metal
oxide species during catalytic reactions. Thus, Ra-
man spectroscopy is better suited than infra red spec-
troscopy to detect the molecular vibration of surface
metal oxide species on certain oxide supports in the
lower wavenumber region (location of M-O and M-
O-M bonds). Fortunately, both Raman and infra
red spectroscopy can generally provide complemen-
tary molecular vibrational information about the sur-
face metal oxide species on the oxide supports in the
higher wavenumber region (location of M=O bonds)
[14,15].
3. Results and discussion
3.1. MgO-based catalysts screening for CO2-
OCM
The performances of selected binary and ternary
metal oxide catalysts for CO2-OCM over MgO-based
catalysts are presented in Table 2. Among all the
MgO-based catalysts tested, the highest C2+ hydro-
carbons yield is achieved over the 2%Li2O/MgO cat-
alyst. For pure MgO catalyst, the methane conver-
sion, C2+ hydrocarbons selectivity and yield are 5.3%,
67.3% and 3.6%, respectively. Addition of 1%Li2O to
pure MgO markedly improves the selectivity and yield
of C2+ hydrocarbons to 90.7% and 5.3%, respectively,
as revealed in Table 2. Further increase of the Li2O
content to 2%, increase the C2+ hydrocarbons selec-
tivity and yield to 98.0% and 5.7%, respectively, while
the methane conversion remains at 5.8%.
Table 2. Catalysts performance results of MgO-based catalyst
C2+ hydrocarbonsCatalysts CH4 conversion (%) CO selectivity (%)
Selectivity (%) Yield (%)
MgO 5.3 32.7 67.3 3.6
1%Li2O/MgO 5.8 9.3 90.7 5.3
2%Li2O/MgO 5.8 2.0 98.0 5.7
5%Li2O/MgO 3.6 2.7 97.3 3.5
10%Li2O/MgO 1.2 24.9 75.1 0.9
5%MnO/MgO 8.2 81.1 23.9 1.9
5%MnO/1%Li2O/MgO 7.2 86.0 14.0 1.0
5%MnO/5%Li2O/MgO 5.4 27.7 72.3 3.9
3%WO3/1%Li2O/MgO 1.7 21.6 78.4 1.4
A further increment of the Li2O content from 2%
to 5% resulted in a slight decrease in the C2+ hydro-
carbons selectivity from 98.0% to 97.3%. Likewise,
the methane conversion and C2+ hydrocarbons yield
also decrease from 5.8% to 3.6% for methane conver-
sion and from 5.7% to 3.5% for C2+ hydrocarbons
yield. Finally, when the Li2O content is increased to
10%, the methane conversion, C2+ hydrocarbons se-
lectivity and yield decrease drastically to 1.2%, 75.1%
and 0.9%, respectively.
The impact of various metal oxides doping onto
the MgO-based catalysts on the catalytic perfor-
mances is further presented in Table 2. The dop-
ing of 5%MnO to the pure MgO catalyst helps to
increase the conversion from 5.3% to 8.2% but the
yield of the C2+ hydrocarbons is low at 1.9% ow-
28 Istadi et al./ Journal of Natural Gas Chemistry Vol. 13 No. 1 2004
ing to a low C2+ selectivity at 23.9%. The effects
of loading a third metal oxide to the binary metal
catalyst on the catalyst activity vary. The addition of
transition metals species (tungsten or manganese) to
the Li2O/MgO catalyst may distort the defect struc-
ture of the catalysts due to the large differences in
the ionic radii of the manganese (0.091 nm) and the
tungsten (0.065 nm) ions to that of the lithium (0.078
nm) and the magnesium (0.078 nm) ions. As a result,
the amount of tungsten or manganese oxides added
to the 1%Li2O/MgO catalyst may cause a decrease
in the active species concentration of [Li+O−] centers
or peroxide (O2−2 ) ions [11]. Tungsten addition to
the Li2O/MgO catalyst however, gives better C2+ hy-
drocarbons selectivity than that of manganese species
probably due to the proximity of the tungsten ionic
radius with lithium and magnesium ionic radii com-
pared with the manganese ionic radius. From Table
2, doping 3%WO3 to the 1%Li2O/MgO catalyst dras-
tically decrease the methane conversion from 5.8%
to 1.7% and the C2+ hydrocarbons selectivity from
90.7% to 78.4%. In contrast, doping 5% of MnO to
the 1%Li2O/MgO catalyst increase the methane con-
version slightly from 5.8% to 7.2%, but the C2+ hy-
drocarbons selectivity decrease from 90.7% to 14%.Although the highest methane conversion is
achieved over the 5%MnO/MgO catalyst, possibly
due to the role of Mn species, the selectivity and
consequently the yield of the C2+ hydrocarbons are
very low over the binary and ternary metal ox-
ide catalyst containing MnO. The low amount of
1%Li2O content and the presence of MnO in the
5%MnO/1%Li2O/MgO catalyst possibly distort the
active sites for oxygen vacancies and fails to improve
the C2+ hydrocarbons yield and selectivity consid-
erably. At higher concentration of Li content in
the ternary metal oxide catalyst, the C2+ selectivity
and yield improve significantly indicating an optimum
amount of the Li2O content is needed to activate the
ternary metal oxide catalyst. For example, increasing
the Li2O content to 5% in the 5%MnO/5%Li2O/MgO
improves the C2+ selectivity from 14% to 72.3% and
the yield from 1% to 3.9% although the conversion
decreases slightly from 7.2% to 5.4% over the ternary
metal oxide catalyst. The addition of Mn species
to the Li2O/MgO however, is not able to improve
the selectivity and the yield of the C2+ hydrocar-
bons. This is apparent in the decrement of the C2+
selectivity and yield after 5%MnO is added to the
5%Li2O/MgO catalyst. Indeed, based on the C2+
hydrocarbons yield and selectivity, the 2%Li2O/MgO
and the 5%MnO/1%Li2O/MgO catalysts exhibit the
highest and lowest performances, respectively as re-
vealed in Table 2.
The presence and structures of surface metal ox-
ides and the peroxide (O2−2 ) ions centers, believed
to be one of the active site species [12,16], are in-
dicated by Raman and FT-IR spectroscopies. The
Raman and FT-IR results of MgO-based catalysts in-
cluding the corresponding vibration modes are briefly
listed in Table 3 and are presented in Figures 2–
5. Figure 2 reveals the Raman spectra of fresh and
used 2%Li2O/MgO catalyst as well as pure MgO
in the band region of 1200–200 cm−1, while Figure
3 compares the peaks of fresh and used tungsten
oxide-doped Li2O/MgO catalysts including their re-
lationships with pure MgO and Li2O/MgO catalysts.
This comparison is aimed to investigate the effect of
WO3 doping on the catalyst structure. The FT-IR
spectra of pure MgO, 1%Li2O/MgO, 2%Li2O/MgO
and 5%Li2O/MgO catalysts are compared in Fig-
ure 4, while the tungsten oxide doping effect on
1%Li2O/MgO catalyst are presented in Figure 5.
The promising performance given by the
2%Li2O/MgO catalyst in producing C2+ hydrocar-
bons may be due to increasing oxygen vacancies from
the peroxide (O2−2 ) ions and [Li+O−] centers formed
by incorporation of Li+-ions into the MgO lattice.
The Li+-ions took action as substitutional ions on
Mg sites with oxygen vacancies for charge compensa-
tion with the closely ionic radius of Li+ (0.078 nm) to
Mg2+ (0.078 nm). In the Kroger-Vink notation this
can be written in Equation (8) [13].
"Li2O"+2Mgx
Mg+Ox
o ⇐⇒ 2Li’Mg+V••o +2"MgO" (8)
where "Li2O" and "MgO" represent the incoming
lithium oxide and the displaced magnesium oxide, re-
spectively. It is proposed that adsorption of gaseous
carbon dioxide on oxygen vacancies give active oxy-
gen species and gaseous carbon monoxide as above-
mentioned in Equations (3) and (4). From the pos-
sible mechanism Li’Mg means Li+ dopant ions substi-
tuted on Mg sites, while O•o means oxygen dopant
ion on O sites. In terms of defect, the notation of
[Li’MgO•o] which is preferred to denote as [Li+O−], is
the associated pair of one Li+-ion and one O−-ion that
is thought to be responsible for the catalytic activity
by the hydrogen atom abstraction from methane. In
order to make Li2O/MgO catalyst catalytically active
the presence of oxygen atom is necessary. In terms of
defect chemistry this means that in the oxidation of
the oxygen vacancies, holes states are formed accord-
Journal of Natural Gas Chemistry Vol. 13 No. 1 2004 29
ing to Equations (3) or (4) [13] using Kroger-Vink no-
tation. The localized hole states may be described as
or 2(O−=O•o) or O2−
2 =(O2)••o [13]. The most prob-
able origin of the electron is the contribution of an
electron from lattice oxygen, Ox
o , under the formation
of an electron hole, present as an O•o-ion.
Table 3. Resume of Raman and FT-IR spectra of 2%Li2O/MgO and 3%WO3/1%Li2O/MgO catalysts
Band positions (cm−1)Materials
Raman FT-IRVibration modes Structures Ref.
2%Li2O/MgO 689, 1086 — CO2−3
symmetric stretching crystalline Li2CO3 [12]
761 — CO2−3
antisymmetric bending crystalline Li2CO3 [12]
860–794, 259 — O-O stretching of O2−2
crystalline Li2O2 [12]
426, 500, 575 — — crystalline Li2O [12]
— 460–430 Li-O antisymmetric stretching [LiO4] tetrahedral [19,21]
— 546, 507 — crystalline Li2O [19,21]
3%WO3/1%Li2O/MgO 798, 816 — O-O stretching of O2−2
crystalline Li2O2 [12]
422, 510, 520 — — crystalline Li2O [12]
751 — — crystalline Li2CO3 [12]
918 — W-O symmetric stretching [WO4] tetrahedral [17]
279 — W-O-W deformation crystalline WO3 [17,20]
553 862–817 W=O stretching [WO6] octahedral [17,22]
980 — W-O symmetric stretching crystalline MgWO4 [17]
353, 355 — W-O bending distorted [WO4] tetrahedral [17]
— 688 O-W-O stretching — [22]
— 432 Li-O stretching [LiO4] tetrahedral [19,21]
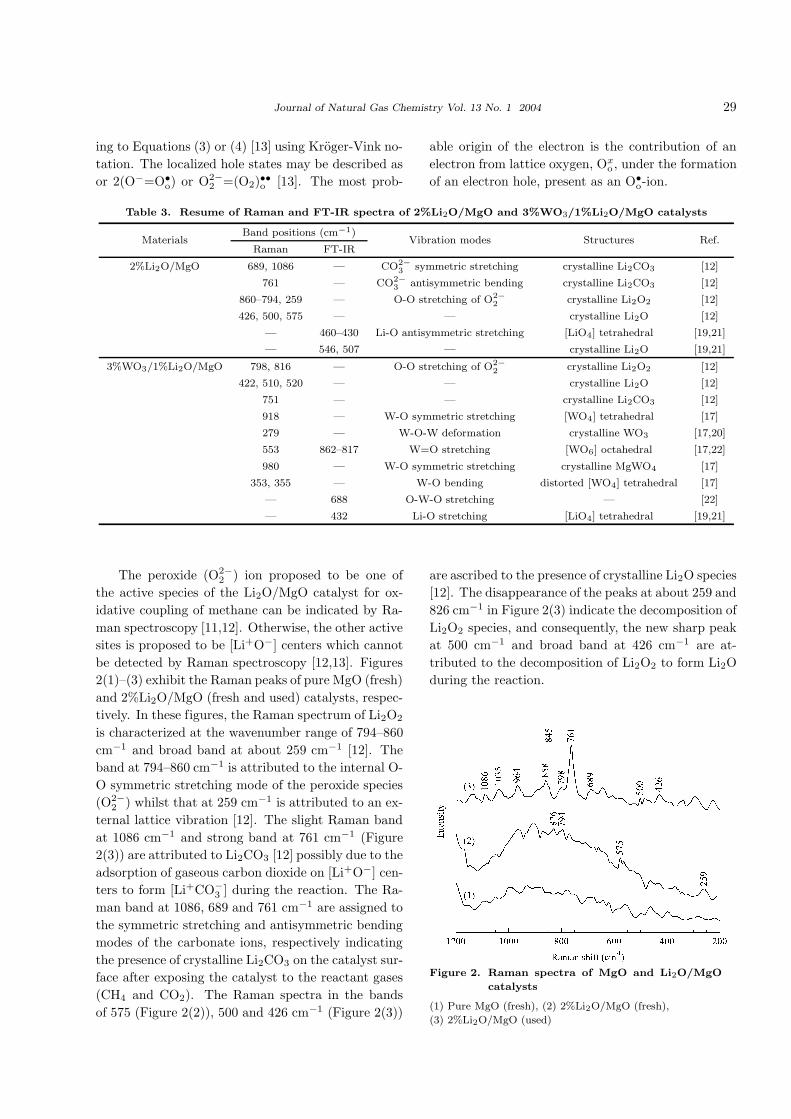
The peroxide (O2−2 ) ion proposed to be one of
the active species of the Li2O/MgO catalyst for ox-
idative coupling of methane can be indicated by Ra-
man spectroscopy [11,12]. Otherwise, the other active
sites is proposed to be [Li+O−] centers which cannot
be detected by Raman spectroscopy [12,13]. Figures
2(1)–(3) exhibit the Raman peaks of pure MgO (fresh)
and 2%Li2O/MgO (fresh and used) catalysts, respec-
tively. In these figures, the Raman spectrum of Li2O2
is characterized at the wavenumber range of 794–860
cm−1 and broad band at about 259 cm−1 [12]. The
band at 794–860 cm−1 is attributed to the internal O-
O symmetric stretching mode of the peroxide species
(O2−2 ) whilst that at 259 cm−1 is attributed to an ex-
ternal lattice vibration [12]. The slight Raman band
at 1086 cm−1 and strong band at 761 cm−1 (Figure
2(3)) are attributed to Li2CO3 [12] possibly due to the
adsorption of gaseous carbon dioxide on [Li+O−] cen-
ters to form [Li+CO−3 ] during the reaction. The Ra-
man band at 1086, 689 and 761 cm−1 are assigned to
the symmetric stretching and antisymmetric bending
modes of the carbonate ions, respectively indicating
the presence of crystalline Li2CO3 on the catalyst sur-
face after exposing the catalyst to the reactant gases
(CH4 and CO2). The Raman spectra in the bands
of 575 (Figure 2(2)), 500 and 426 cm−1 (Figure 2(3))
are ascribed to the presence of crystalline Li2O species
[12]. The disappearance of the peaks at about 259 and
826 cm−1 in Figure 2(3) indicate the decomposition of
Li2O2 species, and consequently, the new sharp peak
at 500 cm−1 and broad band at 426 cm−1 are at-
tributed to the decomposition of Li2O2 to form Li2O
during the reaction.
Figure 2. Raman spectra of MgO and Li2O/MgO
catalysts
(1) Pure MgO (fresh), (2) 2%Li2O/MgO (fresh),
(3) 2%Li2O/MgO (used)
30 Istadi et al./ Journal of Natural Gas Chemistry Vol. 13 No. 1 2004
Figure 3 reveals the presence of active sites and
metal oxides structures on 3%WO3/1%Li2O/MgO
catalyst using Raman scattering. In this figure the
fresh and used 3%WO3/1%Li2O/MgO catalyst are
compared to both 1%Li2O/MgO and pure MgO cat-
alysts. The Raman spectrum of Li2O2 is character-
ized by the very slight peak at 798 cm−1 and the
stronger peak at 816 cm−1 corresponding to the ac-
tive species of O2−2 on all the catalysts [12]. Next, the
presence of crystalline Li2O on the catalyst surface is
detected at the Raman shifts of 422 (sharp), 510 and
520 cm−1 for ternary metal oxides as exhibited in Fig-
ures 3(3) and (4). Li2CO3 is detected to be present
on the used catalyst (Figure 3(4)) at slight shift of
about 751 cm−1 due to the interaction of Li2O and
gaseous CO2 during the reaction. The strong Raman
band at 918 cm−1 due to symmetric W-O stretching
vibration [17] revealed the presence of [WO4] tetrahe-
dral species, while the slight band at about 279 cm−1
showed W-O-W deformation attributed to the crys-
talline WO3. The Raman band at 553 cm−1 shows a
W=O stretching vibration which is attributed to the
[WO6] octahedral unit [17]. The weak peak at 980
cm−1 is also attributed to W-O stretching vibration
which may be assigned to the crystalline MgWO4 [17].
The W-O bending vibration detected at 355 (Figure
3(3)) and 353 cm−1 (Figure 3(4)) are probably due to
the distortion of the [WO4] tetrahedral structure.
Figure 3. Raman spectra of MgO, Li2O/MgO and
WO3/Li2O/MgO catalysts
(1) Pure MgO (fresh), (2) 1%Li2O/MgO (fresh), (3)
3%WO3/1%Li2O/MgO (fresh), (4) 3%WO3/1%Li2O/MgO
(used)
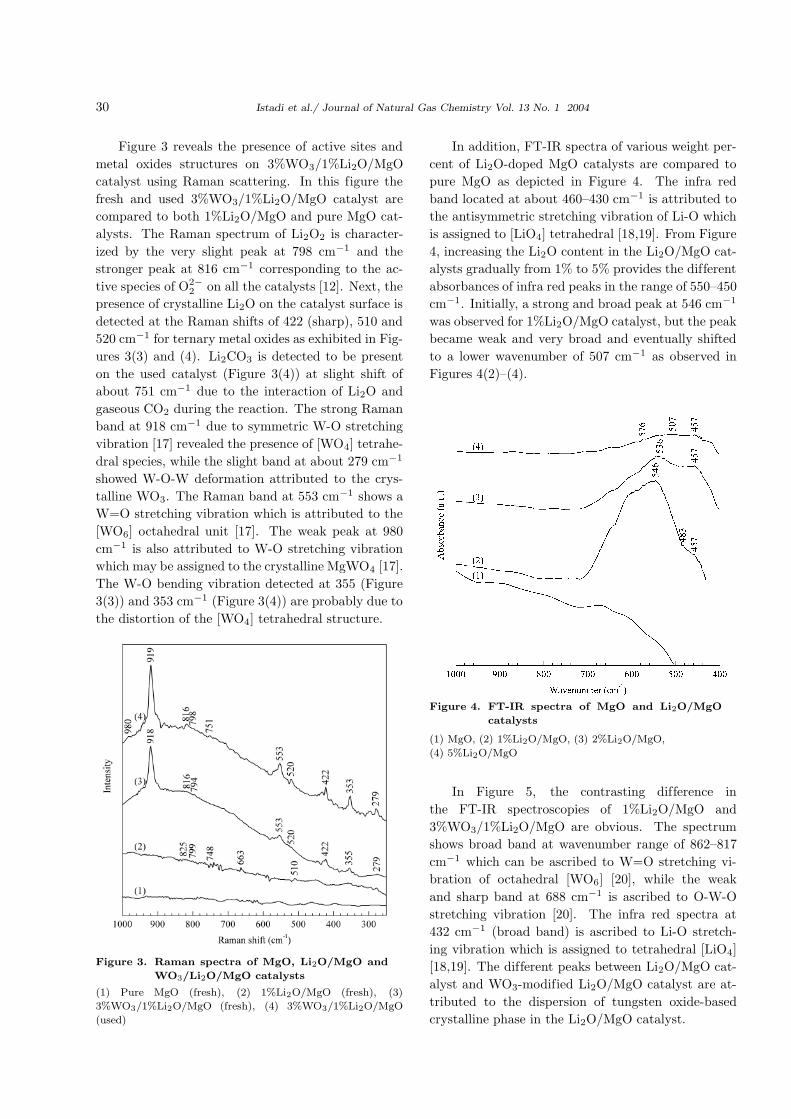
In addition, FT-IR spectra of various weight per-
cent of Li2O-doped MgO catalysts are compared to
pure MgO as depicted in Figure 4. The infra red
band located at about 460–430 cm−1 is attributed to
the antisymmetric stretching vibration of Li-O which
is assigned to [LiO4] tetrahedral [18,19]. From Figure
4, increasing the Li2O content in the Li2O/MgO cat-
alysts gradually from 1% to 5% provides the different
absorbances of infra red peaks in the range of 550–450
cm−1. Initially, a strong and broad peak at 546 cm−1
was observed for 1%Li2O/MgO catalyst, but the peak
became weak and very broad and eventually shifted
to a lower wavenumber of 507 cm−1 as observed in
Figures 4(2)–(4).
Figure 4. FT-IR spectra of MgO and Li2O/MgO
catalysts
(1) MgO, (2) 1%Li2O/MgO, (3) 2%Li2O/MgO,
(4) 5%Li2O/MgO
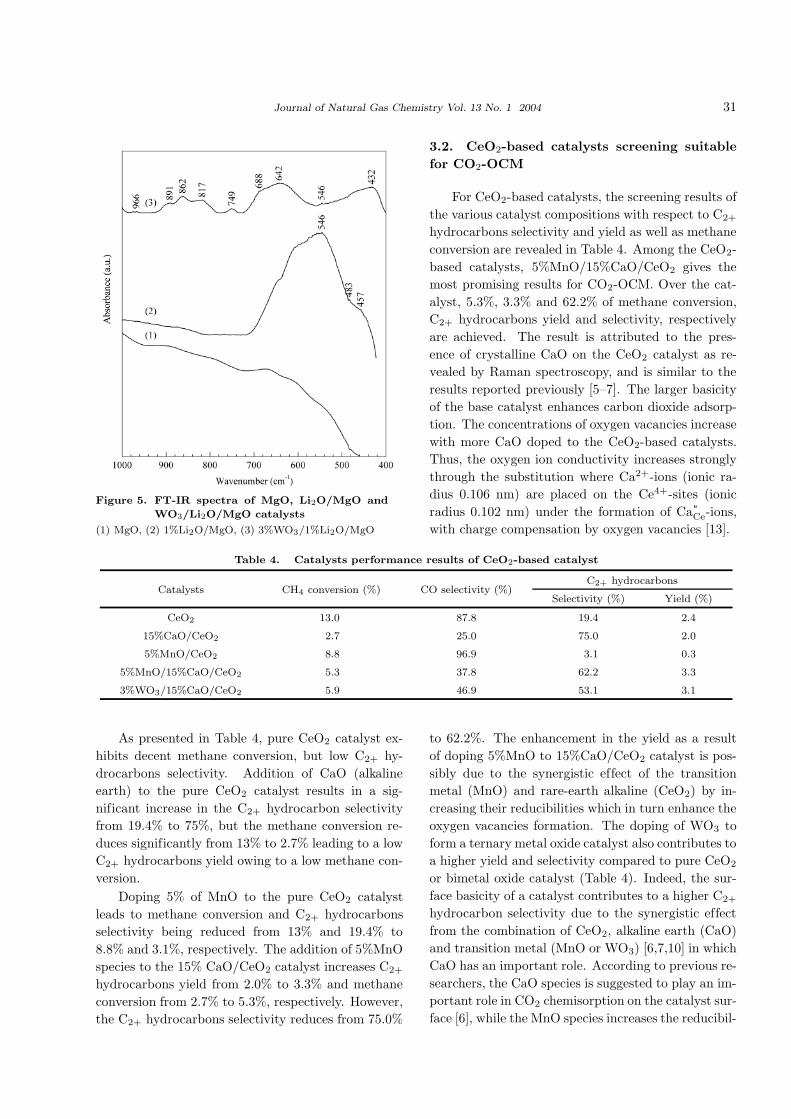
In Figure 5, the contrasting difference in
the FT-IR spectroscopies of 1%Li2O/MgO and
3%WO3/1%Li2O/MgO are obvious. The spectrum
shows broad band at wavenumber range of 862–817
cm−1 which can be ascribed to W=O stretching vi-
bration of octahedral [WO6] [20], while the weak
and sharp band at 688 cm−1 is ascribed to O-W-O
stretching vibration [20]. The infra red spectra at
432 cm−1 (broad band) is ascribed to Li-O stretch-
ing vibration which is assigned to tetrahedral [LiO4]
[18,19]. The different peaks between Li2O/MgO cat-
alyst and WO3-modified Li2O/MgO catalyst are at-
tributed to the dispersion of tungsten oxide-based
crystalline phase in the Li2O/MgO catalyst.
Journal of Natural Gas Chemistry Vol. 13 No. 1 2004 31
Figure 5. FT-IR spectra of MgO, Li2O/MgO and
WO3/Li2O/MgO catalysts
(1) MgO, (2) 1%Li2O/MgO, (3) 3%WO3/1%Li2O/MgO
3.2. CeO2-based catalysts screening suitable
for CO2-OCM
For CeO2-based catalysts, the screening results of
the various catalyst compositions with respect to C2+
hydrocarbons selectivity and yield as well as methane
conversion are revealed in Table 4. Among the CeO2-
based catalysts, 5%MnO/15%CaO/CeO2 gives the
most promising results for CO2-OCM. Over the cat-
alyst, 5.3%, 3.3% and 62.2% of methane conversion,
C2+ hydrocarbons yield and selectivity, respectively
are achieved. The result is attributed to the pres-
ence of crystalline CaO on the CeO2 catalyst as re-
vealed by Raman spectroscopy, and is similar to the
results reported previously [5–7]. The larger basicity
of the base catalyst enhances carbon dioxide adsorp-
tion. The concentrations of oxygen vacancies increase
with more CaO doped to the CeO2-based catalysts.
Thus, the oxygen ion conductivity increases strongly
through the substitution where Ca2+-ions (ionic ra-
dius 0.106 nm) are placed on the Ce4+-sites (ionic
radius 0.102 nm) under the formation of Ca"Ce-ions,
with charge compensation by oxygen vacancies [13].
Table 4. Catalysts performance results of CeO2-based catalyst
C2+ hydrocarbonsCatalysts CH4 conversion (%) CO selectivity (%)
Selectivity (%) Yield (%)
CeO2 13.0 87.8 19.4 2.4
15%CaO/CeO2 2.7 25.0 75.0 2.0
5%MnO/CeO2 8.8 96.9 3.1 0.3
5%MnO/15%CaO/CeO2 5.3 37.8 62.2 3.3
3%WO3/15%CaO/CeO2 5.9 46.9 53.1 3.1
As presented in Table 4, pure CeO2 catalyst ex-
hibits decent methane conversion, but low C2+ hy-
drocarbons selectivity. Addition of CaO (alkaline
earth) to the pure CeO2 catalyst results in a sig-
nificant increase in the C2+ hydrocarbon selectivity
from 19.4% to 75%, but the methane conversion re-
duces significantly from 13% to 2.7% leading to a low
C2+ hydrocarbons yield owing to a low methane con-
version.
Doping 5% of MnO to the pure CeO2 catalyst
leads to methane conversion and C2+ hydrocarbons
selectivity being reduced from 13% and 19.4% to
8.8% and 3.1%, respectively. The addition of 5%MnO
species to the 15% CaO/CeO2 catalyst increases C2+
hydrocarbons yield from 2.0% to 3.3% and methane
conversion from 2.7% to 5.3%, respectively. However,
the C2+ hydrocarbons selectivity reduces from 75.0%
to 62.2%. The enhancement in the yield as a result
of doping 5%MnO to 15%CaO/CeO2 catalyst is pos-
sibly due to the synergistic effect of the transition
metal (MnO) and rare-earth alkaline (CeO2) by in-
creasing their reducibilities which in turn enhance the
oxygen vacancies formation. The doping of WO3 to
form a ternary metal oxide catalyst also contributes to
a higher yield and selectivity compared to pure CeO2
or bimetal oxide catalyst (Table 4). Indeed, the sur-
face basicity of a catalyst contributes to a higher C2+
hydrocarbon selectivity due to the synergistic effect
from the combination of CeO2, alkaline earth (CaO)
and transition metal (MnO or WO3) [6,7,10] in which
CaO has an important role. According to previous re-
searchers, the CaO species is suggested to play an im-
portant role in CO2 chemisorption on the catalyst sur-
face [6], while the MnO species increases the reducibil-
32 Istadi et al./ Journal of Natural Gas Chemistry Vol. 13 No. 1 2004
ity of CeO2 due to increasing oxygen mobility of CeO2
catalyst which enhances its reducibility and produces
more oxygen vacancies [7]. In general, MnOx are com-
pounds with a berthollide structure that contain la-
bile lattice oxygen [21]. Their catalytic properties are
attributed to the capacity for manganese to form ox-
ides with variable oxidation states (MnO2, Mn2O3,
Mn3O4 or MnO) and to their oxygen storage capacity
in the crystalline lattice. Due to its labile oxidation
state, Mn is capable of playing the role of either a
reducing agent or an oxidizing agent, acting in both
cases as an active component of the redox system. In-
crease dispersion of the MnOx on the support surface
led to significant enhancement in the catalytic activ-
ity [21].
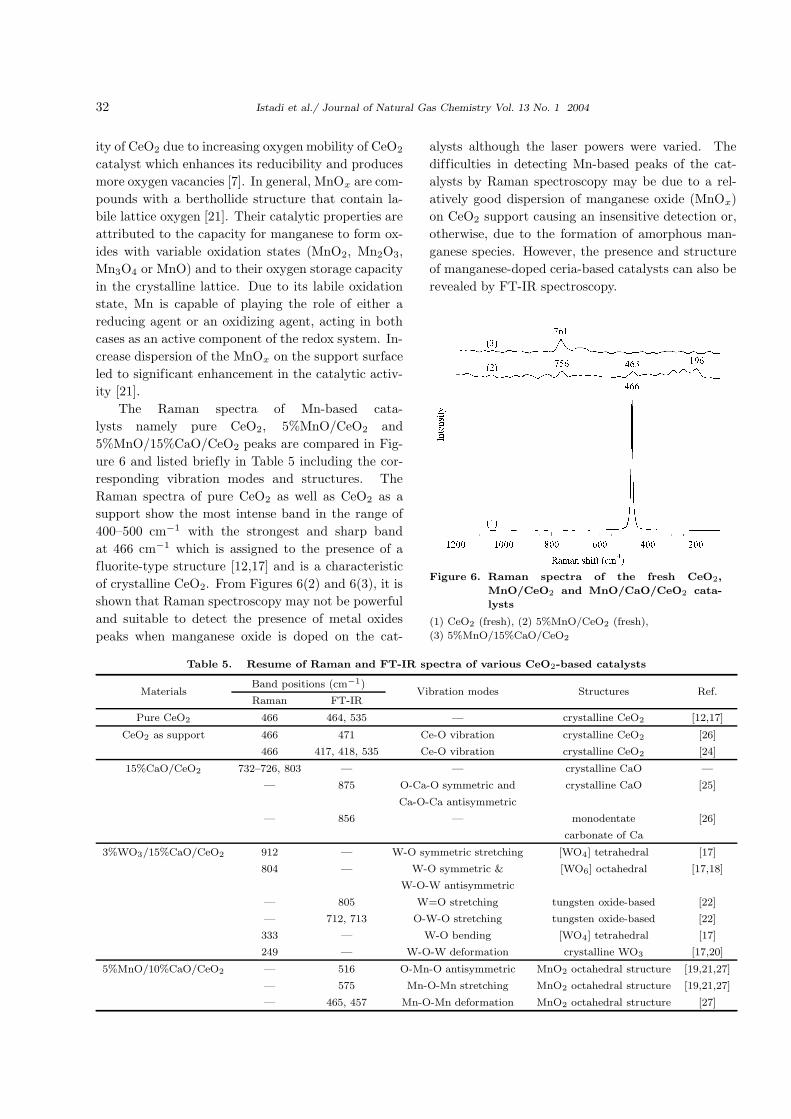
The Raman spectra of Mn-based cata-
lysts namely pure CeO2, 5%MnO/CeO2 and
5%MnO/15%CaO/CeO2 peaks are compared in Fig-
ure 6 and listed briefly in Table 5 including the cor-
responding vibration modes and structures. The
Raman spectra of pure CeO2 as well as CeO2 as a
support show the most intense band in the range of
400–500 cm−1 with the strongest and sharp band
at 466 cm−1 which is assigned to the presence of a
fluorite-type structure [12,17] and is a characteristic
of crystalline CeO2. From Figures 6(2) and 6(3), it is
shown that Raman spectroscopy may not be powerful
and suitable to detect the presence of metal oxides
peaks when manganese oxide is doped on the cat-
alysts although the laser powers were varied. The
difficulties in detecting Mn-based peaks of the cat-
alysts by Raman spectroscopy may be due to a rel-
atively good dispersion of manganese oxide (MnOx)
on CeO2 support causing an insensitive detection or,
otherwise, due to the formation of amorphous man-
ganese species. However, the presence and structure
of manganese-doped ceria-based catalysts can also be
revealed by FT-IR spectroscopy.
Figure 6. Raman spectra of the fresh CeO2,
MnO/CeO2 and MnO/CaO/CeO2 cata-
lysts
(1) CeO2 (fresh), (2) 5%MnO/CeO2 (fresh),
(3) 5%MnO/15%CaO/CeO2
Table 5. Resume of Raman and FT-IR spectra of various CeO2-based catalysts
Band positions (cm−1)Materials
Raman FT-IRVibration modes Structures Ref.
Pure CeO2 466 464, 535 — crystalline CeO2 [12,17]
CeO2 as support 466 471 Ce-O vibration crystalline CeO2 [26]
466 417, 418, 535 Ce-O vibration crystalline CeO2 [24]
15%CaO/CeO2 732–726, 803 — — crystalline CaO —
— 875 O-Ca-O symmetric and crystalline CaO [25]
Ca-O-Ca antisymmetric
— 856 — monodentate [26]
carbonate of Ca
3%WO3/15%CaO/CeO2 912 — W-O symmetric stretching [WO4] tetrahedral [17]
804 — W-O symmetric & [WO6] octahedral [17,18]
W-O-W antisymmetric
— 805 W=O stretching tungsten oxide-based [22]
— 712, 713 O-W-O stretching tungsten oxide-based [22]
333 — W-O bending [WO4] tetrahedral [17]
249 — W-O-W deformation crystalline WO3 [17,20]
5%MnO/10%CaO/CeO2 — 516 O-Mn-O antisymmetric MnO2 octahedral structure [19,21,27]
— 575 Mn-O-Mn stretching MnO2 octahedral structure [19,21,27]
— 465, 457 Mn-O-Mn deformation MnO2 octahedral structure [27]

Journal of Natural Gas Chemistry Vol. 13 No. 1 2004 33
The Raman peaks of manganese oxides are very
weak even for well-crystallized compounds of MnO2,
Mn2O3 and MnO, in which the Raman spectra of
756, 761 and 530 cm−1 are assigned to MnO2, while
the Raman peak of 196 cm−1is attributed to MnO as
revealed in Figures 6(2) and (3) [22]. The main con-
tributions are attributed to the stretching mode of oc-
tahedral [MnO6]. The Raman peaks at lower frequen-
cies are attributed to the deformation modes of metal-
oxygen chain of Mn-O-Mn in the octahedral structure
of MnO2 lattice. The weak and sharp infra red spec-
tra at wavenumber of 516 and 575 cm−1as revealed in
Figures 7(2) and (3) are assigned to the antisymmetric
stretching vibration modes of O-Mn-O and Mn-O vi-
bration for MnO2 octahedral structure, respectively
[18,19,22,23]. The bulk phases of manganese oxide
can also be identified physically by color. In fact, the
black catalyst powder was identified to be the MnO2
phase of fresh catalysts which changed to grey MnO
and/or brown Mn3O4 during the CO2-OCM reaction
[23]. The physical identification of the manganese
phases coincides with the results from FT-IR char-
acterization in Figure 7. The lower wavenumber of
Figure 7. FT-IR spectra of CeO2, MnO/CeO2 and
MnO/CaO/CeO2 catalysts
(1) CeO2, (2) 5%MnO/CeO2, (3) 5%MnO/15%CaO/CeO2
465 and 457 cm−1are due to the deformation vibra-
tion mode of Mn-O-Mn which is assigned to the oc-
tahedral structure of MnO2 lattice [22]. The calcium
ions incorporation into the channels provide the lat-
tice distortion and partial reduction of the manganese
ions which results in a shifting of the vibrational mode
frequencies from 465 to 457 cm−1 as depicted in Fig-
ures 7(2) and (3) [22]. The weak and sharp IR band
at 875 cm−1 is assigned to the symmetric stretching
vibration of O-Ca-O and antisymmetric stretching of
Ca-O-Ca which is attributed to the presence of crys-
talline CaO [24].The effect of adding tungsten oxide to
15%CaO/CeO2 catalyst is also tested in the CO2-
OCM reaction as revealed in Table 4. The 3%WO3
doping on the 15%CaO/CeO2 catalyst decreases the
C2+ hydrocarbons selectivity from 75.0% to 53.1%,
while the yield is improved significantly due to a
significant improvement in methane conversion from
2.7% to 5.9%. The results imply that tungsten may
have a lower basicity than manganese species in which
the catalyst basicity has an important role in C2+
hydrocarbons selectivity. Doping transition metals
such as tungsten (0.065 nm) or manganese (0.091
nm) on CeO2 (Ce4+ ionic radius of 0.102 nm) is
suggested to cause a decrease in the crystal size of
ceria thus, prevents sintering at high temperatures
and at the same time increases the surface and bulk
reducibility due to increasing oxygen mobility lead-
ing to a higher methane oxidation activity. However,
the details of the interaction between ceria and tung-
sten/manganese species are not revealed in this study.
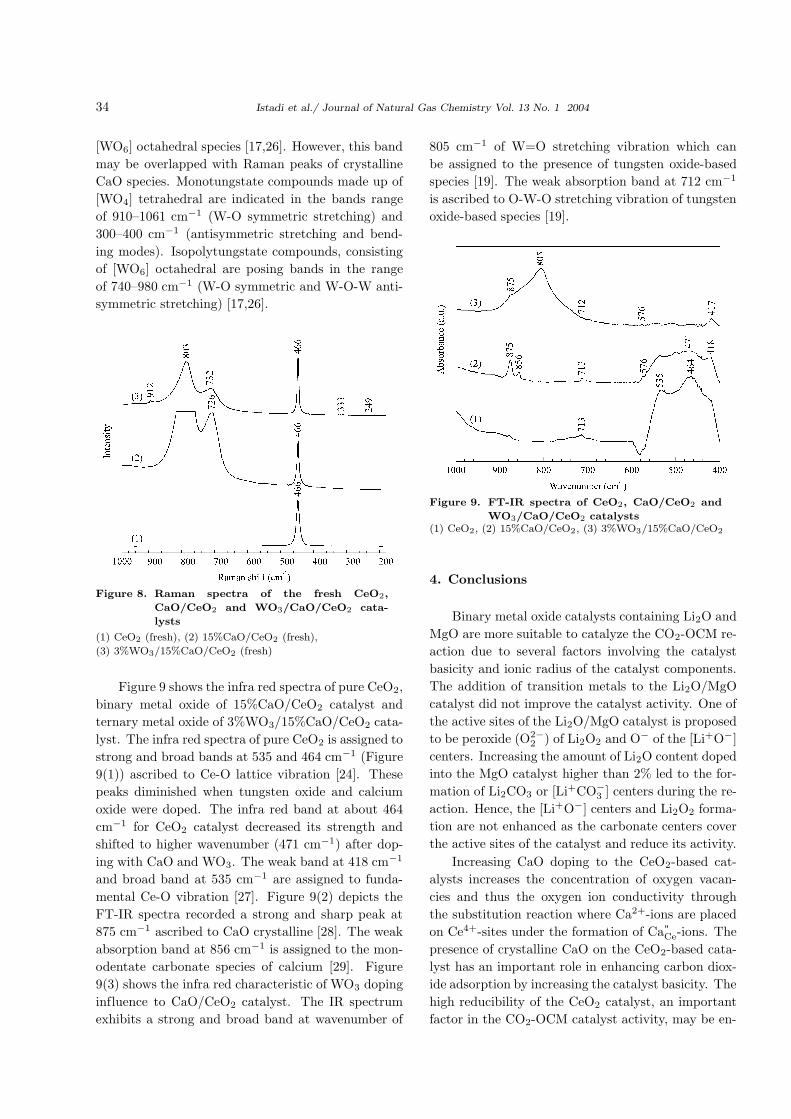
Figure 8 exhibits Raman spectra for CeO2-based
catalysts including their effect of tungsten doping.
The Raman spectra for pure CeO2 and CeO2 as a
support show the most intense band between 400–
500 cm−1 with the strongest and sharp band at 466
cm−1 assigned to the presence of a fluorite type
structure [12,17], and is a characteristic of crystalline
CeO2. Intensities of the Raman spectra for the crys-
talline Ca-based oxides are presented in the band
range of 700–850 cm−1 (Figures 8(2) and (3)). The
characteristic bands at 726, 732 and 803 cm−1 are
ascribed to the crystalline CaO based on compar-
ison between CaO/CeO2 and pure CeO2 catalysts.
From Figure 8(3), the Raman bands at 912 and 333
cm−1 are due to W-O symmetric stretching and W-
O bending vibrations modes, respectively [17], while
the slight band at 249 cm−1 corresponds to W-O-
W deformation vibration mode [25]. Consequently,
the stretching band at 912 and 333 cm−1 are com-
monly used to characterize [WO4] tetrahedral species,
while the slight band at 249 cm−1 is ascribed to the
crystalline WO3 [17]. The W-O symmetric and W-
O-W antisymmetric stretching are characterized at
Raman band of 804 cm−1 which is ascribed to the
34 Istadi et al./ Journal of Natural Gas Chemistry Vol. 13 No. 1 2004
[WO6] octahedral species [17,26]. However, this band
may be overlapped with Raman peaks of crystalline
CaO species. Monotungstate compounds made up of
[WO4] tetrahedral are indicated in the bands range
of 910–1061 cm−1 (W-O symmetric stretching) and
300–400 cm−1 (antisymmetric stretching and bend-
ing modes). Isopolytungstate compounds, consisting
of [WO6] octahedral are posing bands in the range
of 740–980 cm−1 (W-O symmetric and W-O-W anti-
symmetric stretching) [17,26].
Figure 8. Raman spectra of the fresh CeO2,
CaO/CeO2 and WO3/CaO/CeO2 cata-
lysts
(1) CeO2 (fresh), (2) 15%CaO/CeO2 (fresh),
(3) 3%WO3/15%CaO/CeO2 (fresh)
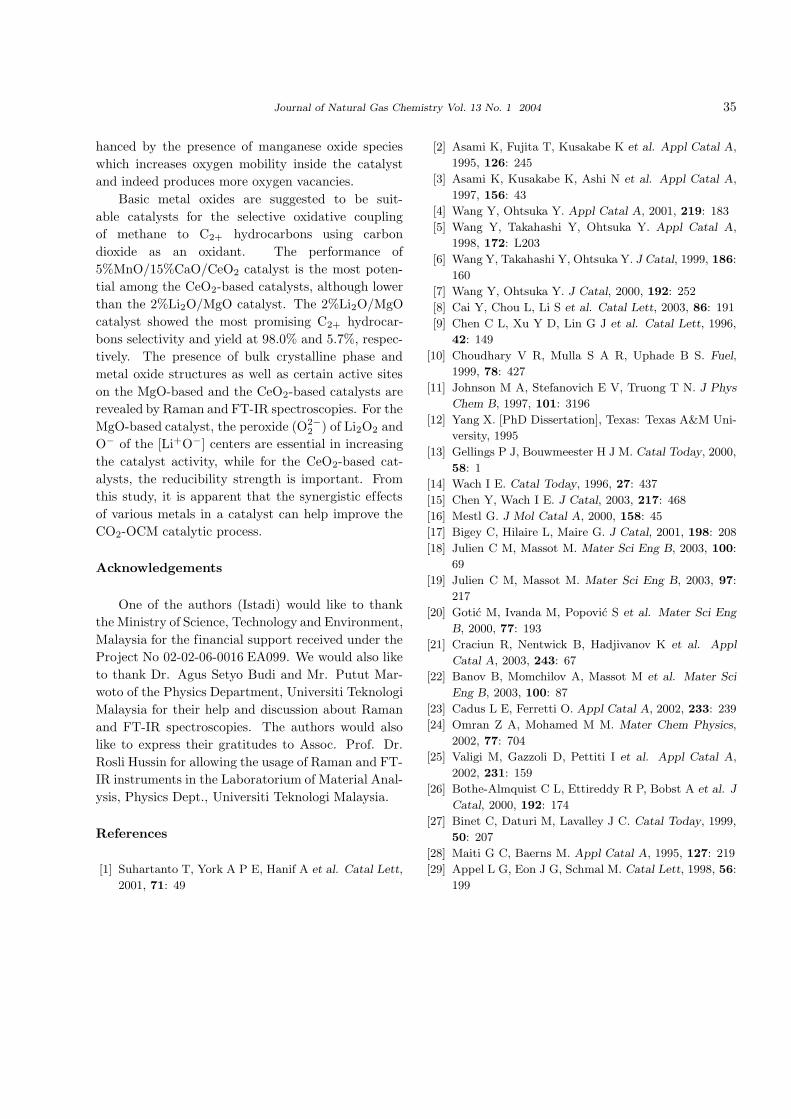
Figure 9 shows the infra red spectra of pure CeO2,
binary metal oxide of 15%CaO/CeO2 catalyst and
ternary metal oxide of 3%WO3/15%CaO/CeO2 cata-
lyst. The infra red spectra of pure CeO2 is assigned to
strong and broad bands at 535 and 464 cm−1 (Figure
9(1)) ascribed to Ce-O lattice vibration [24]. These
peaks diminished when tungsten oxide and calcium
oxide were doped. The infra red band at about 464
cm−1 for CeO2 catalyst decreased its strength and
shifted to higher wavenumber (471 cm−1) after dop-
ing with CaO and WO3. The weak band at 418 cm−1
and broad band at 535 cm−1 are assigned to funda-
mental Ce-O vibration [27]. Figure 9(2) depicts the
FT-IR spectra recorded a strong and sharp peak at
875 cm−1 ascribed to CaO crystalline [28]. The weak
absorption band at 856 cm−1 is assigned to the mon-
odentate carbonate species of calcium [29]. Figure
9(3) shows the infra red characteristic of WO3 doping
influence to CaO/CeO2 catalyst. The IR spectrum
exhibits a strong and broad band at wavenumber of
805 cm−1 of W=O stretching vibration which can
be assigned to the presence of tungsten oxide-based
species [19]. The weak absorption band at 712 cm−1
is ascribed to O-W-O stretching vibration of tungsten
oxide-based species [19].
Figure 9. FT-IR spectra of CeO2, CaO/CeO2 and
WO3/CaO/CeO2 catalysts(1) CeO2, (2) 15%CaO/CeO2, (3) 3%WO3/15%CaO/CeO2
4. Conclusions
Binary metal oxide catalysts containing Li2O and
MgO are more suitable to catalyze the CO2-OCM re-
action due to several factors involving the catalyst
basicity and ionic radius of the catalyst components.
The addition of transition metals to the Li2O/MgO
catalyst did not improve the catalyst activity. One of
the active sites of the Li2O/MgO catalyst is proposed
to be peroxide (O2−2 ) of Li2O2 and O− of the [Li+O−]
centers. Increasing the amount of Li2O content doped
into the MgO catalyst higher than 2% led to the for-
mation of Li2CO3 or [Li+CO−3 ] centers during the re-
action. Hence, the [Li+O−] centers and Li2O2 forma-
tion are not enhanced as the carbonate centers cover
the active sites of the catalyst and reduce its activity.
Increasing CaO doping to the CeO2-based cat-
alysts increases the concentration of oxygen vacan-
cies and thus the oxygen ion conductivity through
the substitution reaction where Ca2+-ions are placed
on Ce4+-sites under the formation of Ca"Ce-ions. The
presence of crystalline CaO on the CeO2-based cata-
lyst has an important role in enhancing carbon diox-
ide adsorption by increasing the catalyst basicity. The
high reducibility of the CeO2 catalyst, an important
factor in the CO2-OCM catalyst activity, may be en-
Journal of Natural Gas Chemistry Vol. 13 No. 1 2004 35
hanced by the presence of manganese oxide species
which increases oxygen mobility inside the catalyst
and indeed produces more oxygen vacancies.
Basic metal oxides are suggested to be suit-
able catalysts for the selective oxidative coupling
of methane to C2+ hydrocarbons using carbon
dioxide as an oxidant. The performance of
5%MnO/15%CaO/CeO2 catalyst is the most poten-
tial among the CeO2-based catalysts, although lower
than the 2%Li2O/MgO catalyst. The 2%Li2O/MgO
catalyst showed the most promising C2+ hydrocar-
bons selectivity and yield at 98.0% and 5.7%, respec-
tively. The presence of bulk crystalline phase and
metal oxide structures as well as certain active sites
on the MgO-based and the CeO2-based catalysts are
revealed by Raman and FT-IR spectroscopies. For the
MgO-based catalyst, the peroxide (O2−2 ) of Li2O2 and
O− of the [Li+O−] centers are essential in increasing
the catalyst activity, while for the CeO2-based cat-
alysts, the reducibility strength is important. From
this study, it is apparent that the synergistic effects
of various metals in a catalyst can help improve the
CO2-OCM catalytic process.
Acknowledgements
One of the authors (Istadi) would like to thank
the Ministry of Science, Technology and Environment,
Malaysia for the financial support received under the
Project No 02-02-06-0016 EA099. We would also like
to thank Dr. Agus Setyo Budi and Mr. Putut Mar-
woto of the Physics Department, Universiti Teknologi
Malaysia for their help and discussion about Raman
and FT-IR spectroscopies. The authors would also
like to express their gratitudes to Assoc. Prof. Dr.
Rosli Hussin for allowing the usage of Raman and FT-
IR instruments in the Laboratorium of Material Anal-
ysis, Physics Dept., Universiti Teknologi Malaysia.
References
[1] Suhartanto T, York A P E, Hanif A et al. Catal Lett,
2001, 71: 49
[2] Asami K, Fujita T, Kusakabe K et al. Appl Catal A,
1995, 126: 245
[3] Asami K, Kusakabe K, Ashi N et al. Appl Catal A,
1997, 156: 43
[4] Wang Y, Ohtsuka Y. Appl Catal A, 2001, 219: 183
[5] Wang Y, Takahashi Y, Ohtsuka Y. Appl Catal A,
1998, 172: L203
[6] Wang Y, Takahashi Y, Ohtsuka Y. J Catal, 1999, 186:
160
[7] Wang Y, Ohtsuka Y. J Catal, 2000, 192: 252
[8] Cai Y, Chou L, Li S et al. Catal Lett, 2003, 86: 191
[9] Chen C L, Xu Y D, Lin G J et al. Catal Lett, 1996,
42: 149
[10] Choudhary V R, Mulla S A R, Uphade B S. Fuel,
1999, 78: 427
[11] Johnson M A, Stefanovich E V, Truong T N. J Phys
Chem B, 1997, 101: 3196
[12] Yang X. [PhD Dissertation], Texas: Texas A&M Uni-
versity, 1995
[13] Gellings P J, Bouwmeester H J M. Catal Today, 2000,
58: 1
[14] Wach I E. Catal Today, 1996, 27: 437
[15] Chen Y, Wach I E. J Catal, 2003, 217: 468
[16] Mestl G. J Mol Catal A, 2000, 158: 45
[17] Bigey C, Hilaire L, Maire G. J Catal, 2001, 198: 208
[18] Julien C M, Massot M. Mater Sci Eng B, 2003, 100:
69
[19] Julien C M, Massot M. Mater Sci Eng B, 2003, 97:
217
[20] Gotic M, Ivanda M, Popovic S et al. Mater Sci Eng
B, 2000, 77: 193
[21] Craciun R, Nentwick B, Hadjivanov K et al. Appl
Catal A, 2003, 243: 67
[22] Banov B, Momchilov A, Massot M et al. Mater Sci
Eng B, 2003, 100: 87
[23] Cadus L E, Ferretti O. Appl Catal A, 2002, 233: 239
[24] Omran Z A, Mohamed M M. Mater Chem Physics,
2002, 77: 704
[25] Valigi M, Gazzoli D, Pettiti I et al. Appl Catal A,
2002, 231: 159
[26] Bothe-Almquist C L, Ettireddy R P, Bobst A et al. J
Catal, 2000, 192: 174
[27] Binet C, Daturi M, Lavalley J C. Catal Today, 1999,
50: 207
[28] Maiti G C, Baerns M. Appl Catal A, 1995, 127: 219
[29] Appel L G, Eon J G, Schmal M. Catal Lett, 1998, 56:
199