Embed Size (px)
Citation preview
Energy Outlook of Northeast Asiaand
Regional Energy Cooperation
June 9, 2006
Kensuke KanekiyoManaging Director
The Institute of Energy Economics, Japan
The Institute of Energy Economics, Japan 財団法人日本エネルギー経済研究所 Copyright IEEJ 2006
Seminar on EU Russia Energy RelationsAleksanteri Institute, University of Helsinki
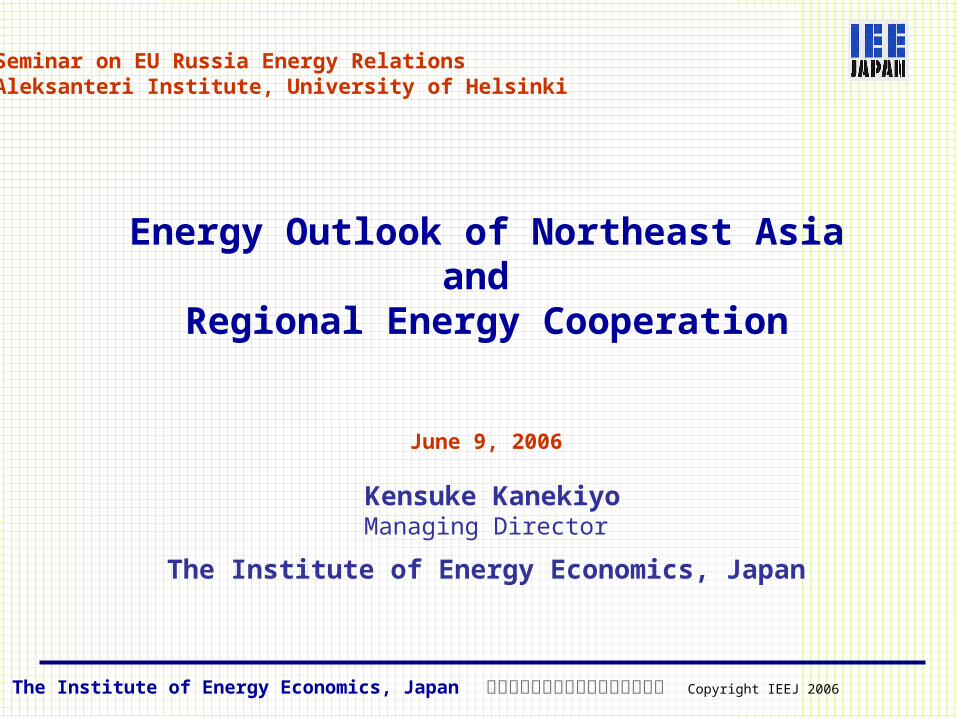
1.1 Oil Price Skyrocketing
1
1. Strong demand surge US plus Emerging economies(China, India, Brazil) 2. Shrinkage of surplus supply capacity in upstream,
downstream and US gas & power market. 3. Speculation by money funds.
The Institute of Energy Economics, Japan 財団法人日本能源経済研究所 Copyright IEEJ 2006
10
20
30
40
50
60
70
80
Sep-
01
Nov
-01
Jan-
02
Mar
-02
May
-02
Jul-
02
Sep-
02
Nov
-02
Jan-
03
Mar
-03
May
-03
Jul-
03
Sep-
03
Nov
-03
Jan-
04
Mar
-04
May
-04
Jul-
04
Sep-
04
Nov
-04
Jan-
05
Mar
-05
May
-05
Jul-
05
Sep-
05
Nov
-05
Jan-
06
Mar
-06
May
-06
General Strike in Venezuela
Iraqi War Terroist attack onSaudi oil sector
Hurricane "Ivan"
Deterioration of Iraqi sequrity
Yukos supply thretened
Nigerian tumult
Hurricane"Katorina"
$/Bbl
9-11 New YorkTerrorist Attack
Iranian CrisisWTI Futures at NYMEX
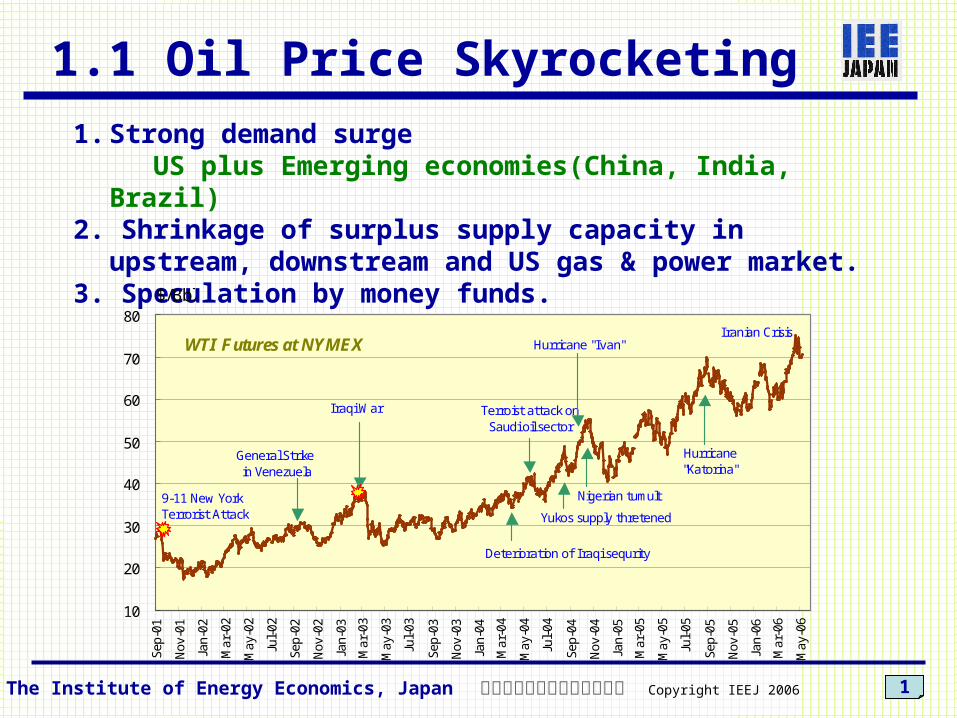
1.2 Energy Outlook of Asia1. Japan: Leveling off while fossil energy consumption
decreases.2. Developing Asia: More than double by 2030 as
China’s presence and import dependence greatly increase.
2The Institute of Energy Economics, Japan 財団法人日本能源経済研究所 Copyright IEEJ 2006
0
1000
2000
3000
4000
5000
6000
1971 1980 1990 2003 2010 2020 2030
Actual <= => Forecast
plus 3.1bill.toe1.1
1.5
0.40.10.0
Japan Korea China India Others
Bill.toe
Increase from 2003 to 2030
21%
13%
38%
8%20%
28%
13%
44%
6% 9%
Other Asia
India
China
KoreaJapan
April 2006, IEEJ
Million toe
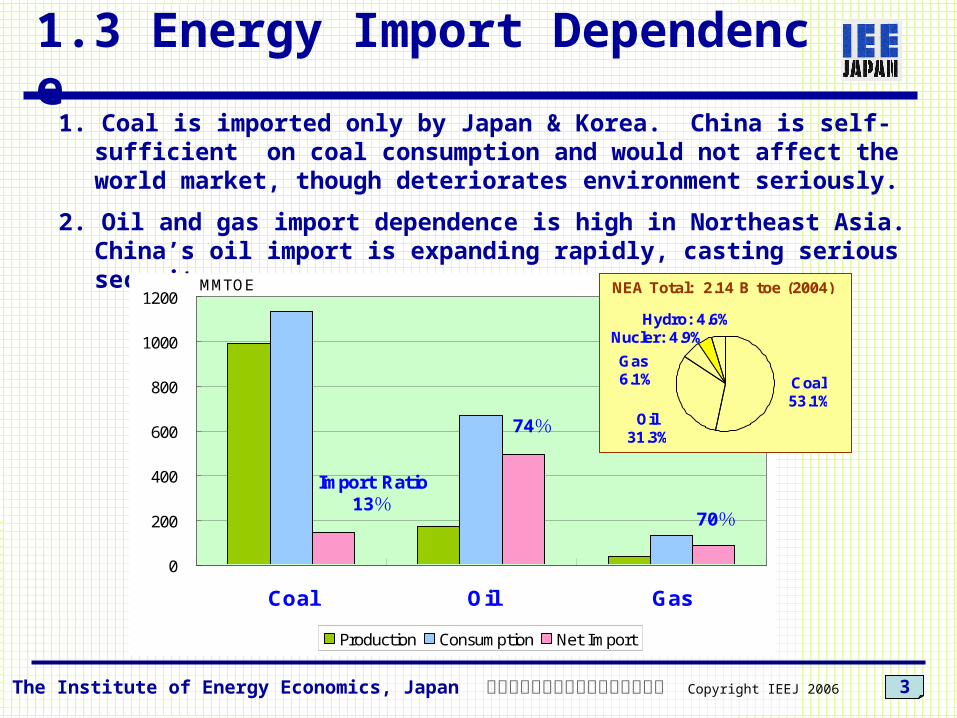
1.3 Energy Import Dependence1. Coal is imported only by Japan & Korea. China is self-
sufficient on coal consumption and would not affect the world market, though deteriorates environment seriously.
2. Oil and gas import dependence is high in Northeast Asia. China’s oil import is expanding rapidly, casting serious security concern.
3
0
200
400
600
800
1000
1200
Coal Oil Gas
Production Consumption Net Import
MMTOE
Import Ratio13%
74%
70%
NEA Total: 2.14 B toe (2004)
Coal53.1%
Oil31.3%
Gas6.1%
Hydro: 4.6%Nucler: 4.9%
The Institute of Energy Economics, Japan 財団法人日本エネルギー経済研究所 Copyright IEEJ 2006
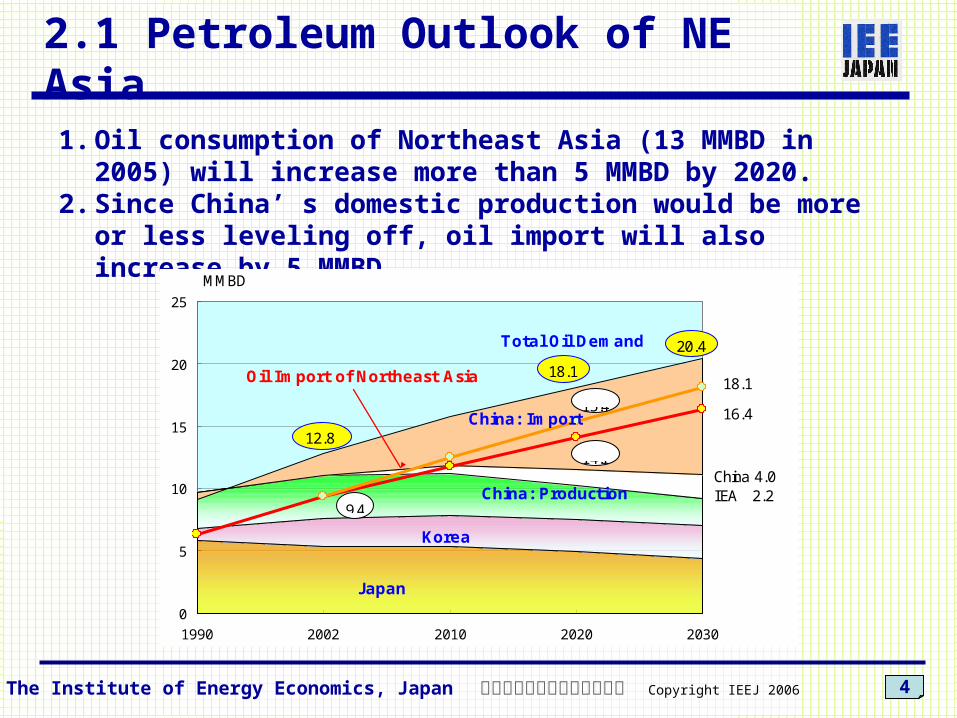
2.1 Petroleum Outlook of NE Asia1. Oil consumption of Northeast Asia (13 MMBD in
2005) will increase more than 5 MMBD by 2020.2. Since China’ s domestic production would be more or
less leveling off, oil import will also increase by 5 MMBD.
4The Institute of Energy Economics, Japan 財団法人日本能源経済研究所 Copyright IEEJ 2006
0
5
10
15
20
25
1990 2002 2010 2020 2030
14.1
15.4
Japan
Korea
China: Production
China: Import
Oil Import of Northeast Asia
MMBD
18.1
16.4
China 4.0IEA 2.2
9.4
12.8
18.1
20.4Total Oil Demand

0
50
100
150
200
250
300
2002 2003 2004 2002 2003 2004 2002 2003 2004
Japan Korea China
ME Ratio78.1%
ME Ratio45.4%
ME:74.1%SE Asia:8.9%
Others:17.0%
20048.9MMBD
Total Northeast Asia
Million KL
ME Ratio88.9%
2.2 Middle East Dependency of Oil
5
1. Northeast Asia depends on the Middle East 3/4 of oil Import
2. This causes vulnerability of supply and other issues such as the Asian Premium of the Middle East crude oils.
Source: National statistics
The Institute of Energy Economics, Japan 財団法人日本エネルギー経済研究所 Copyright IEEJ 2006
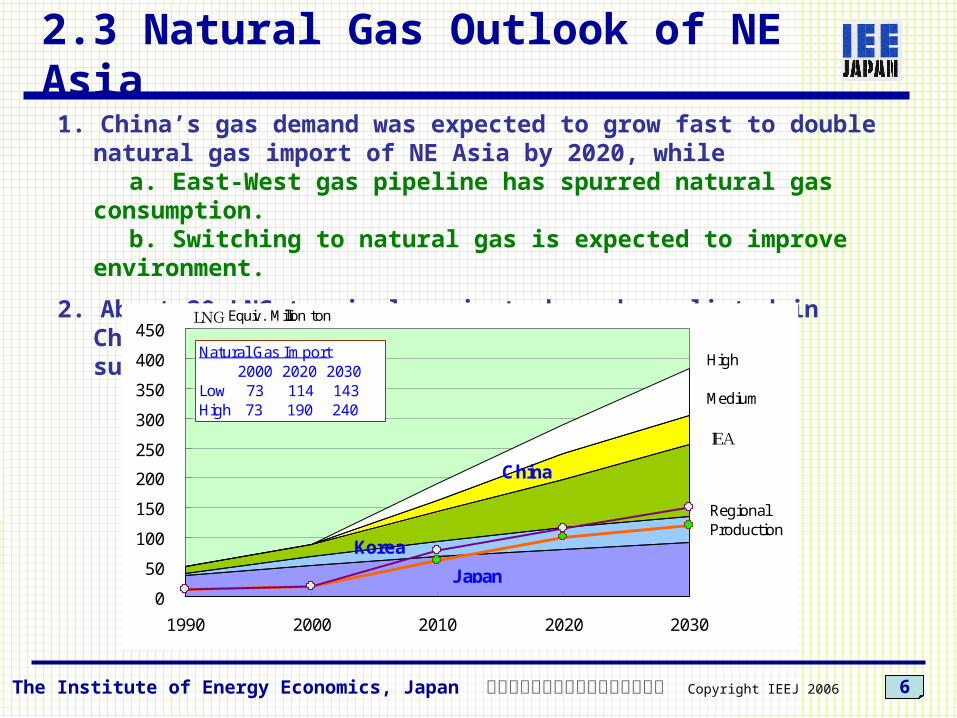
2.3 Natural Gas Outlook of NE Asia1. China’s gas demand was expected to grow fast to double
natural gas import of NE Asia by 2020, while a. East-West gas pipeline has spurred natural gas
consumption. b. Switching to natural gas is expected to improve
environment.
2. About 20 LNG terminal projects have been listed in China. However, skyrocketing gas price may cause substantial delay.
6
0
50
100
150
200
250
300
350
400
450
1990 2000 2010 2020 2030
High
Medium
IEA
RegionalProduction
LNG Equiv. Million ton
Natural Gas Import 2000 2020 2030Low 73 114 143High 73 190 240
J apan
Korea
China
The Institute of Energy Economics, Japan 財団法人日本エネルギー経済研究所 Copyright IEEJ 2006

3.1 Status of Energy Cooperation
1. Institutions discussing on energy cooperation APEC, ASEAN+3, SOM, Asia Pacific Partnership, etc
2. Active Projects only for Information Exchange 1) APERC (Energy Outlook and other research work) 2) JODI (Joint Oil Data Initiative) 3) RTEIS (Real-Time Emergency Information Sharing)
3. Candidate Energy Projects for Regional Cooperation 1) Joint Oil Stock Piling 2) Siberian Oil/Gas Pipelines 3) New Asian Oil Market 4) Rationalization of Energy Use / Energy Conservation 5) CDM/JI/ETS 6) Nuclear Power Development
No specific institution to talk on Northeast Asian Energy Cooperation, yet !!
7The Institute of Energy Economics, Japan 財団法人日本エネルギー経済研究所 Copyright IEEJ 2006

3.2 Russia and Northeast AsiaStranded oil & gas resources in eastern Russia will bean important answer to energy security of Northeast
Asia.
8
East Siberian Fields
West Siberian Fields
For EuropeOver 6000km
For Northeast Asia2000 - 3000km
Caspian oil fields(Major competitor for Russia)
2000km
3000km
4000km
6000km
The Institute of Energy Economics, Japan 財団法人日本エネルギー経済研究所 Copyright IEEJ 2006

3.3 Potential Energy Flow from Eastern Russia
9The Institute of Energy Economics, Japan 財団法人日本エネルギー経済研究所 Copyright IEEJ 2005
Phase-1:Taishet – Skovorodino Distance: 2400km Capacity: 0.6 MMBD Investment:$ 8 Billion Completion: End of 2008
Mohe
Branch Line ??
Phase-2: Skovorodino - Perevoznaya Distance: 2000km Capacity: 1.6MMBD (Whole line) Investments: $6 Billion Completion: 2012?
East Siberian Oil & Gas Fields(For Development)
Hydro Power
Offshore Sakhalin Fields(Under Development)

3.4 Petroleum Resources of Eastern Russia
Probable Possible Total
OilEast Siberia
Billion Barrels
6.1Billion Barrels
15.3Billion Barrels
21.4
Krasnoyarsk & Irkutsk 4.1 14.8 18.9
Sakha Republic 2.0 0.5 2.5
Sakhalin 4.3 5.6 9.9
Eastern Russia 10.4 20.9 31.3
Natural GasEast Siberia
Tcf106.2
Tcf91.6
Tcf197.8
Krasnoyarsk Krai 22.2 23.0 45.2
Irkutsk Oblast 41.0 31.0 72.0
Sakha Republic 42.9 37.6 80.5
Sakhalin 21.1 8.4 29.5
Eastern Russia 127.3 100.1 227.4
The Institute of Energy Economics, Japan 財団法人日本エネルギー経済研究所 Copyright IEEJ 2006
Source: IEEJ World Bank Report “Northeast Asia Natural Gas Trade”
10
Oil and gas reserves located in eastern Russia are yet to be developed except those in Sakhalin.

Siberian Trap
Siberian PlatformWest-Siberian Basin
West-Siberian Basin
Siberian Platform
Early Mesozoic
Present
Oil & Gas Fields
200 Ma – PresentMesozoic – Cenozoicclastics
250 Ma Triassic basaltic Lava
540 - 440 MaPaleozoic clasticsCarbonate, salt
640 – 540 MaVendian carbonate,Salt bedsUpper Proterozoic
1650 – 640 MaRephean carbonate, shaleProterozoic
2000 –1650 MaRephean basal sand,Eroded/weathered basement surface3000 – 2000 MaArchaen crystallineBasement rocks
Bazhenov Fm.
11
3.5 Geology of Siberia
Lava flew out
↑↑
↑↑
The Institute of Energy Economics, Japan 財団法人日本エネルギー経済研究所 Copyright IEEJ 2006
Geology of east Siberia is old, peculiar and difficult to interpret.
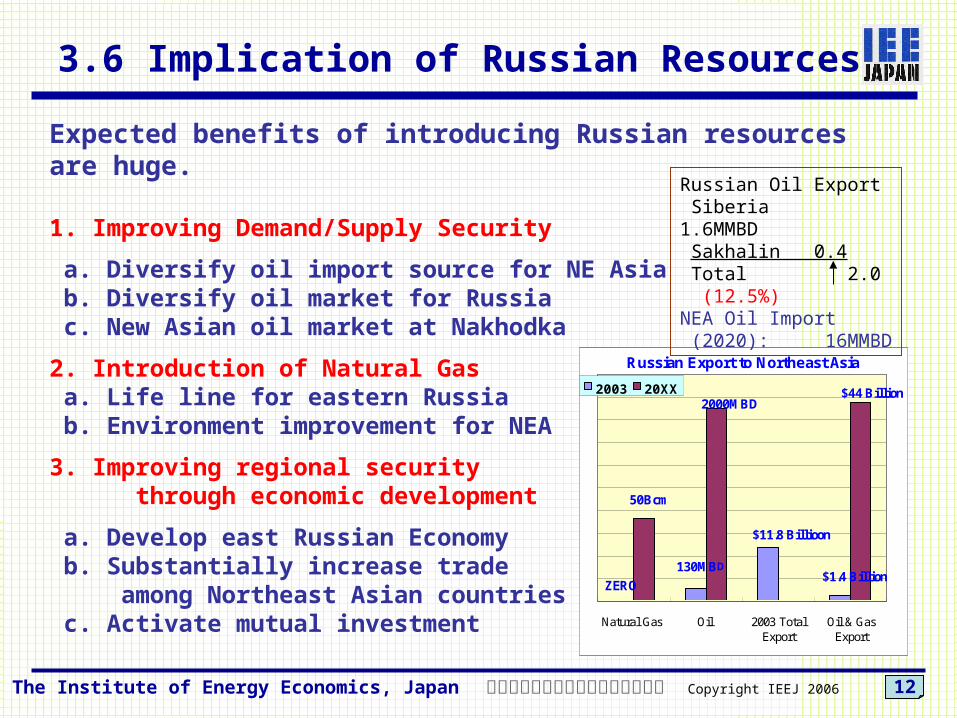
3.6 Implication of Russian Resources
Expected benefits of introducing Russian resources are huge.
1. Improving Demand/Supply Security
a. Diversify oil import source for NE Asia b. Diversify oil market for Russia c. New Asian oil market at Nakhodka
2. Introduction of Natural Gas a. Life line for eastern Russia b. Environment improvement for NEA
3. Improving regional security through economic development
a. Develop east Russian Economy b. Substantially increase trade among Northeast Asian countries c. Activate mutual investment Natural Gas Oil 2003 Total
ExportOil & Gas
Export
2003 20XX
ZERO
50Bcm
130MBD
2000MBD
$11.8 Billioon
$1.4 Billion
$44 Billion
Russian Export to Northeast Asia
Russian Oil Export Siberia 1.6MMBD Sakhalin 0.4 Total 2.0 (12.5%)NEA Oil Import (2020): 16MMBD
12The Institute of Energy Economics, Japan 財団法人日本エネルギー経済研究所 Copyright IEEJ 2006
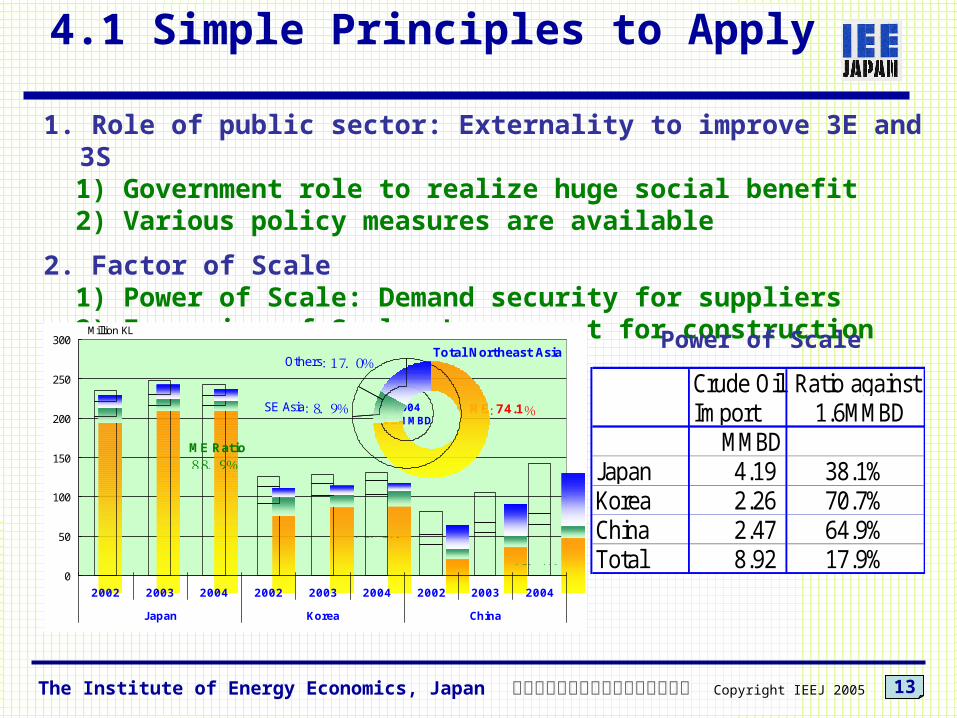
4.1 Simple Principles to Apply
13The Institute of Energy Economics, Japan 財団法人日本エネルギー経済研究所 Copyright IEEJ 2005
1. Role of public sector: Externality to improve 3E and 3S 1) Government role to realize huge social benefit 2) Various policy measures are available
2. Factor of Scale 1) Power of Scale: Demand security for suppliers 2) Economics of Scale: Lower cost for construction
Power of Scale
0
50
100
150
200
250
300
2002 2003 2004 2002 2003 2004 2002 2003 2004
Japan Korea China
ME Ratio78.1%
ME Ratio45.4%
ME:74.1%SE Asia:8.9%
Others:17.0%
20048.9MMBD
Total Northeast Asia
Million KL
ME Ratio88.9%
Crude Oil Ratio againstImport 1.6MMBD
MMBDJapan 4.19 38.1%Korea 2.26 70.7%China 2.47 64.9%Total 8.92 17.9%

4.2 Pipeline Economics
14The Institute of Energy Economics, Japan 財団法人日本エネルギー経済研究所 Copyright IEEJ 2005
1. Economics of Scale works greatly in long distance pipeline.
2. Pipeline tariff can be lowered by policy consideration, such as long term credit, lower tax, or subsidy.
0.00
2.00
4.00
6.00
8.00
10.00
12.00
0.8 1.2 1.6
Pipeline Capacity:MMBD
Pipeline Tariff: $/Bbl
Economics of Scale
0.0
2.0
4.0
6.0
8.0
10.0
12.0
10 15 20 25 30
$/Bbl
5.3
1.9
Project Period
Commercial Tariff(ROE=12%)
ROE=7%
Profit
Tax 35%
Interest
OPEX
CAPEX
TechnicalCost
Pipeline Economics
4.3 East-West Dialogue
15The Institute of Energy Economics, Japan 財団法人日本エネルギー経済研究所 Copyright IEEJ 2005
1. Supplier/Consumer Dialogue
x Energy development and transaction with Russia, CIS and Middle East countries x International cooperation and rational order in energy development x Technology development, energy transit issues, etc.
2. Consumer/Consumer Dialogue
x Energy conservation and rational use x Rational market design and government role x Technology development
3. Global Energy-Environment System: Post Kyoto Protocol
x Participation of every stakeholders Integration of KP(Top-down) and APP(Bottom-up) approaches x Harmonizing interests of developed and developing countries.
Thank You