Embed Size (px)
Citation preview
Joseph DiRenzo
Sara Trajchevska
Erlend McDougall
Sophie Borge
IT’S A WIND WIN!
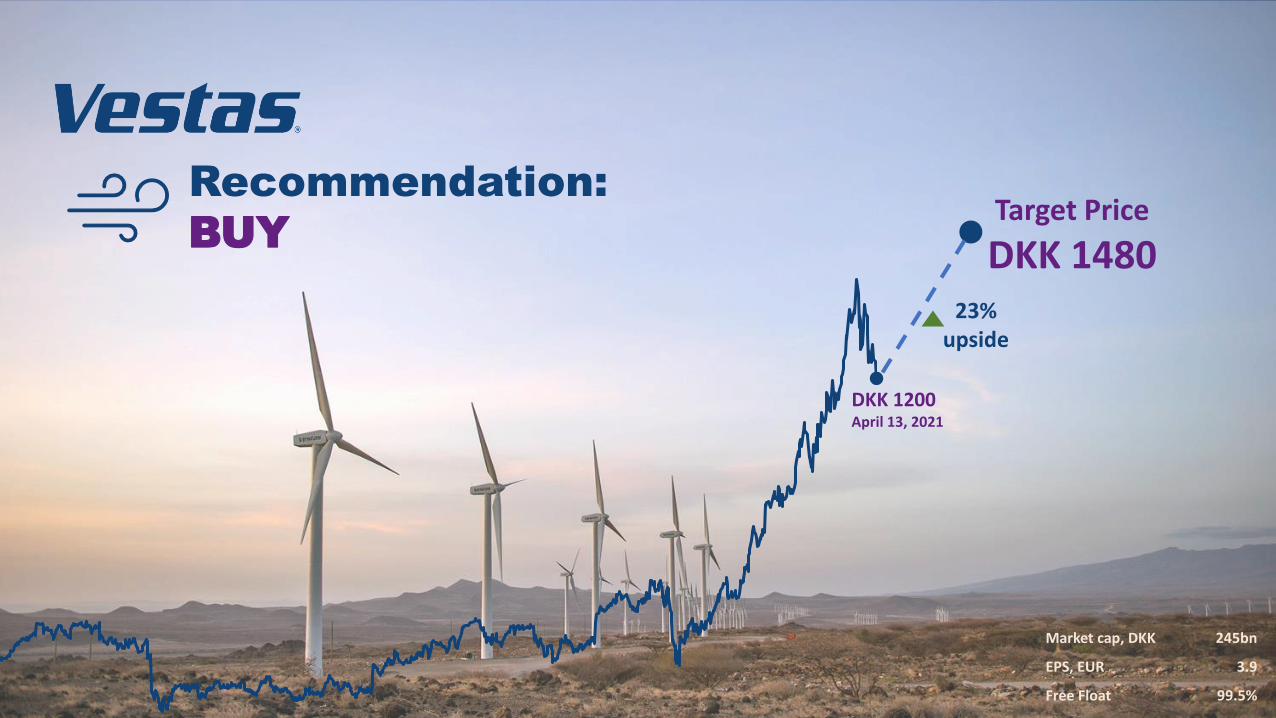
Target Price
DKK 1480
DKK 1200April 13, 2021
Market cap, DKK 245bn
EPS, EUR 3.9
Free Float 99.5%
23% upside
Recommendation:
BUY
OVERVIEW ESG TECHNOLOGICAL MOAT OFFSHORE EXPANSION GREEN INVESTMENT RECIPIENT FINANCIALS VALUATION RISKS
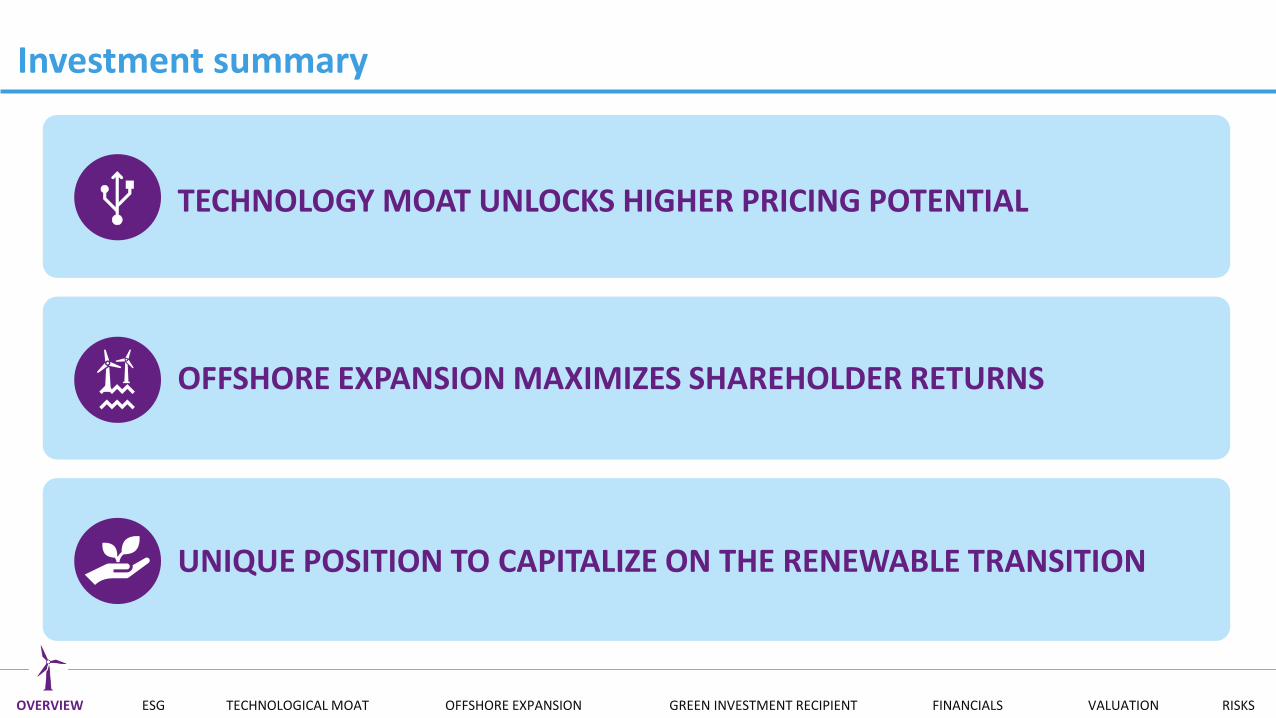
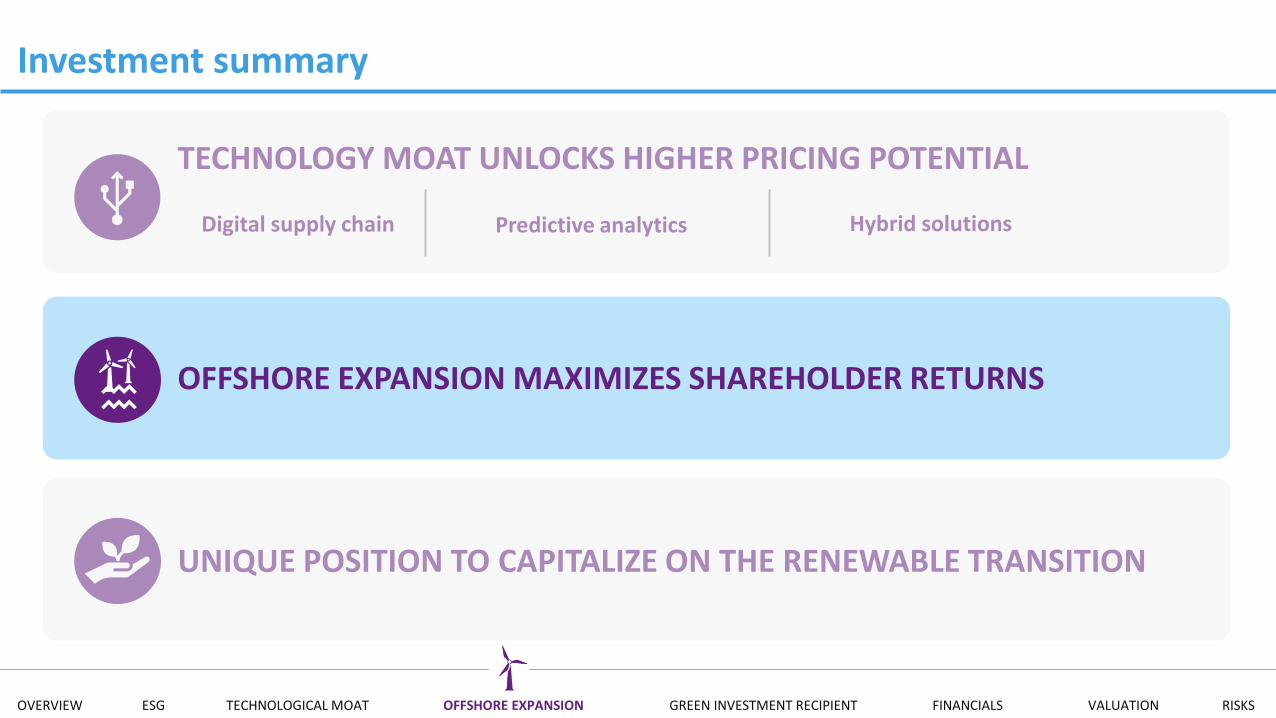
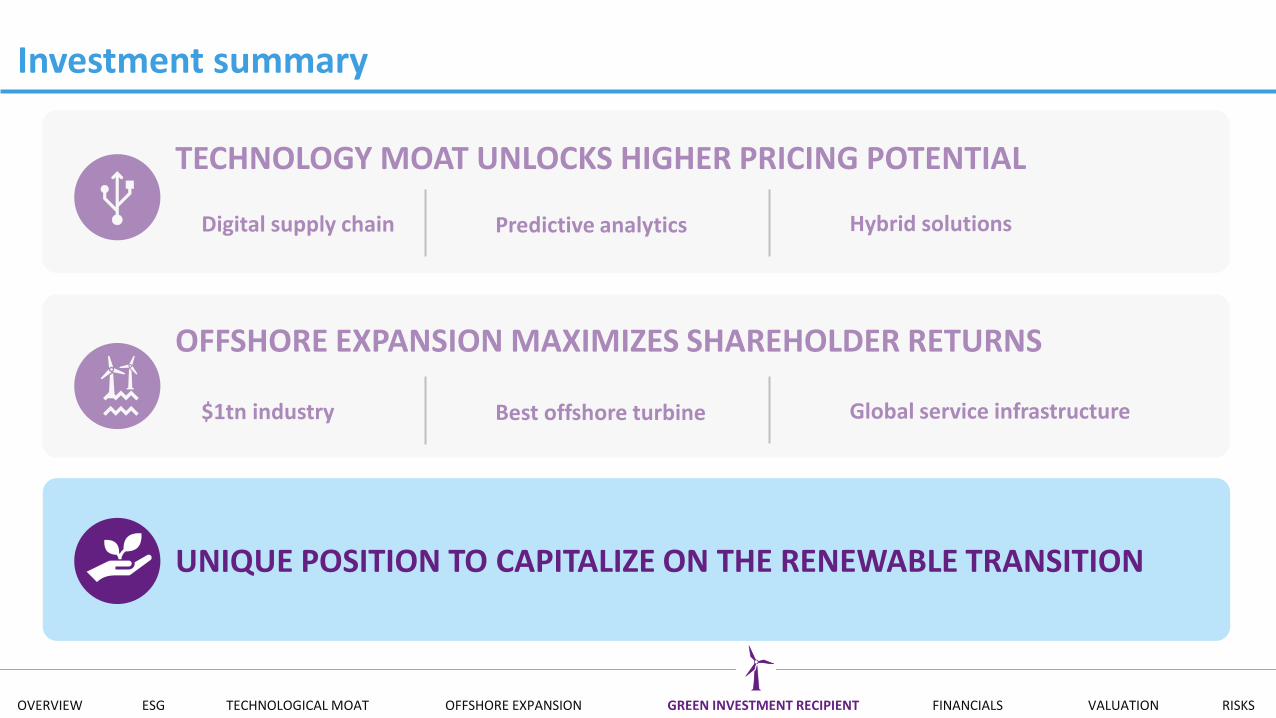
TECHNOLOGY MOAT UNLOCKS HIGHER PRICING POTENTIAL
OFFSHORE EXPANSION MAXIMIZES SHAREHOLDER RETURNS
UNIQUE POSITION TO CAPITALIZE ON THE RENEWABLE TRANSITION
Investment summary
OVERVIEW ESG TECHNOLOGICAL MOAT OFFSHORE EXPANSION GREEN INVESTMENT RECIPIENT FINANCIALS VALUATION RISKS
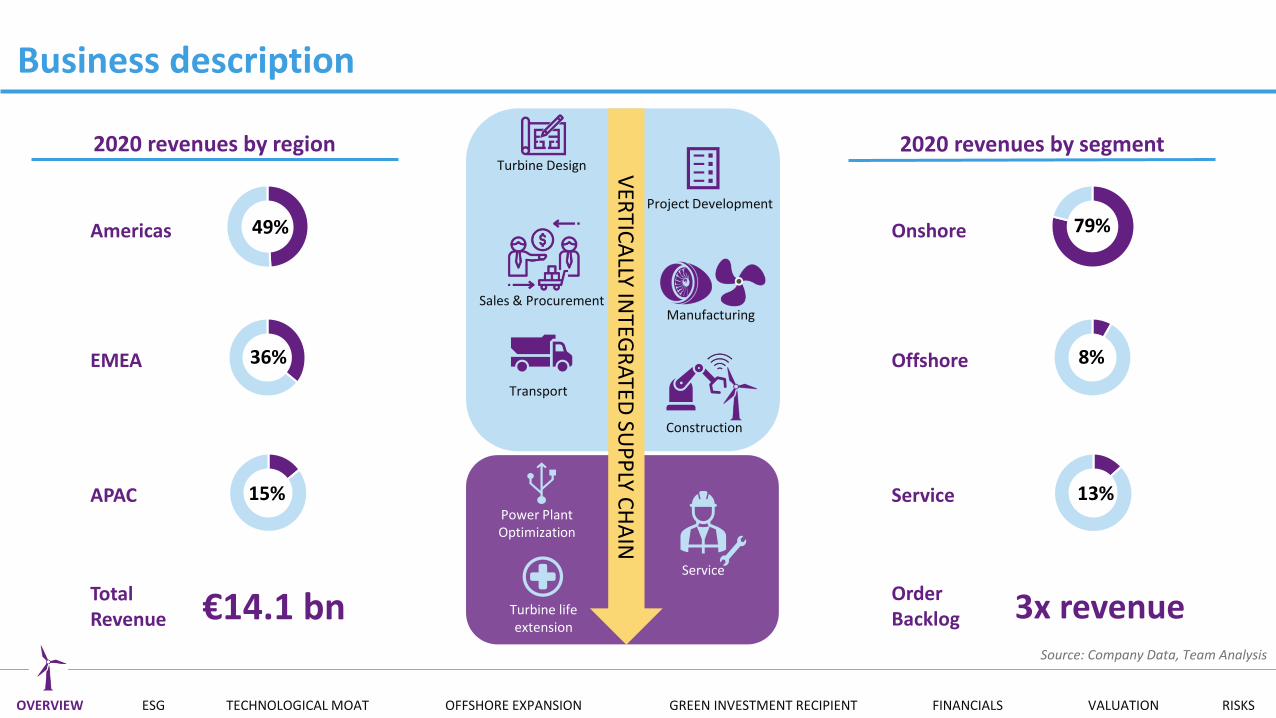
79%
8%
13%
3x revenue
Business description
Turbine Design
Project Development
Manufacturing
Transport
Construction
Service
Power Plant Optimization
Sales & Procurement
VER
TICA
LLY INTEG
RATED
SUP
PLY C
HA
IN
Turbine life extension
Offshore
Service
2020 revenues by segment
Onshore49%
36%
15%
€14.1 bn
EMEA
APAC
2020 revenues by region
Americas
Total Revenue
OrderBacklog
Source: Company Data, Team Analysis
OVERVIEW ESG TECHNOLOGICAL MOAT OFFSHORE EXPANSION GREEN INVESTMENT RECIPIENT FINANCIALS VALUATION RISKS
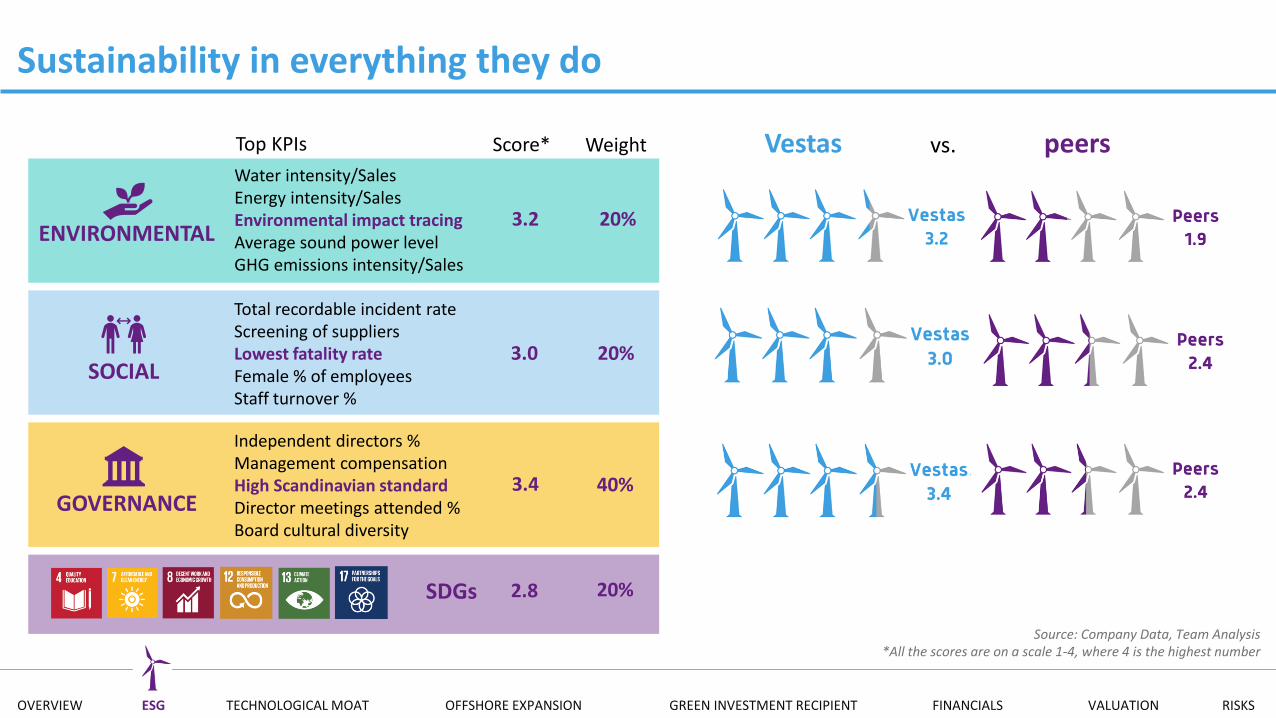
Sustainability in everything they do
Vestas vs. peers
Source: Company Data, Team Analysis*All the scores are on a scale 1-4, where 4 is the highest number
SDGs
40%3.4GOVERNANCE
20%3.0SOCIAL
ENVIRONMENTAL
Score* Weight
3.2 20%
20%2.8
Water intensity/SalesEnergy intensity/SalesEnvironmental impact tracingAverage sound power levelGHG emissions intensity/Sales
Independent directors %Management compensationHigh Scandinavian standardDirector meetings attended %Board cultural diversity
Total recordable incident rateScreening of suppliersLowest fatality rateFemale % of employeesStaff turnover %
Top KPIs
OVERVIEW ESG TECHNOLOGICAL MOAT OFFSHORE EXPANSION GREEN INVESTMENT RECIPIENT FINANCIALS VALUATION RISKS
40%3.4GOVERNANCE
20%3.0SOCIAL
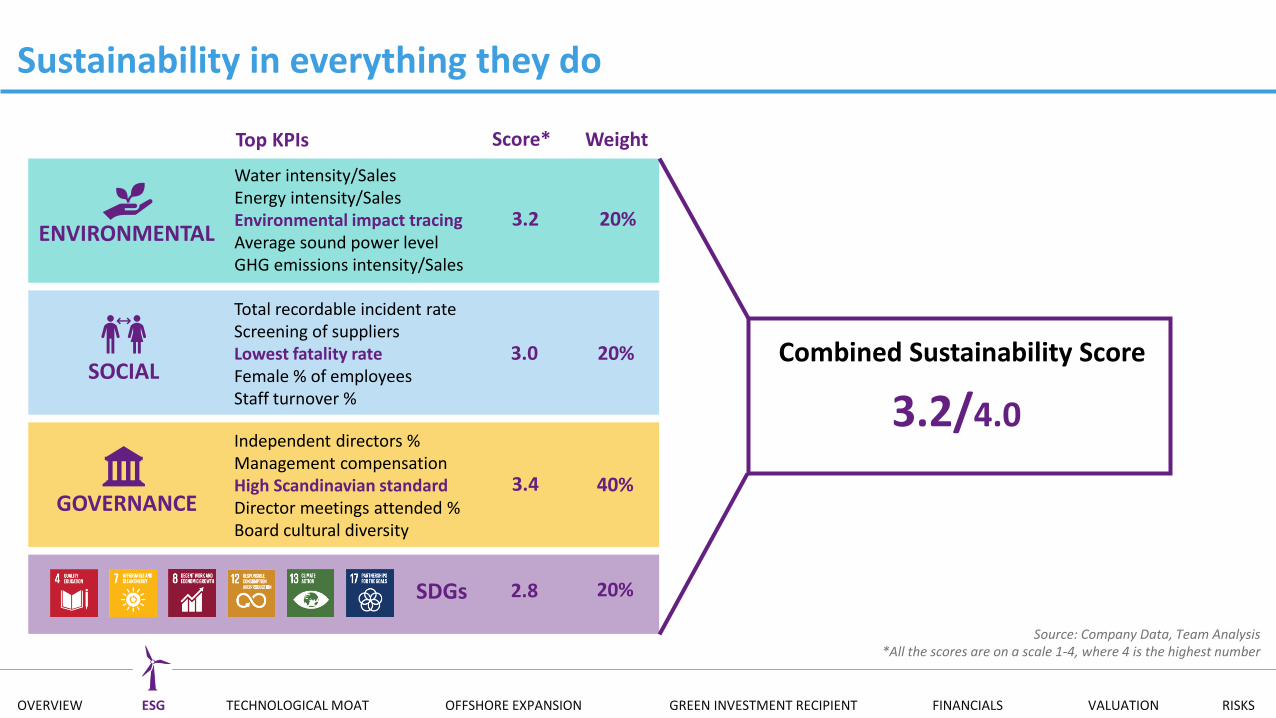
Sustainability in everything they do
ENVIRONMENTAL3.2 20%
20%2.8
Source: Company Data, Team Analysis*All the scores are on a scale 1-4, where 4 is the highest number
Water intensity/SalesEnergy intensity/SalesEnvironmental impact tracingAverage sound power levelGHG emissions intensity/Sales
Combined Sustainability Score
3.2/4.0Independent directors %Management compensationHigh Scandinavian standardDirector meetings attended %Board cultural diversity
Total recordable incident rateScreening of suppliersLowest fatality rateFemale % of employeesStaff turnover %
SDGs
Score* WeightTop KPIs
OVERVIEW ESG TECHNOLOGICAL MOAT OFFSHORE EXPANSION GREEN INVESTMENT RECIPIENT FINANCIALS VALUATION RISKS
Investment summary
TECHNOLOGY MOAT UNLOCKS HIGHER PRICING POTENTIAL
OFFSHORE EXPANSION MAXIMIZES SHAREHOLDER RETURNS
UNIQUE POSITION TO CAPITALIZE ON THE RENEWABLE TRANSITION
OVERVIEW ESG TECHNOLOGICAL MOAT OFFSHORE EXPANSION GREEN INVESTMENT RECIPIENT FINANCIALS VALUATION RISKS
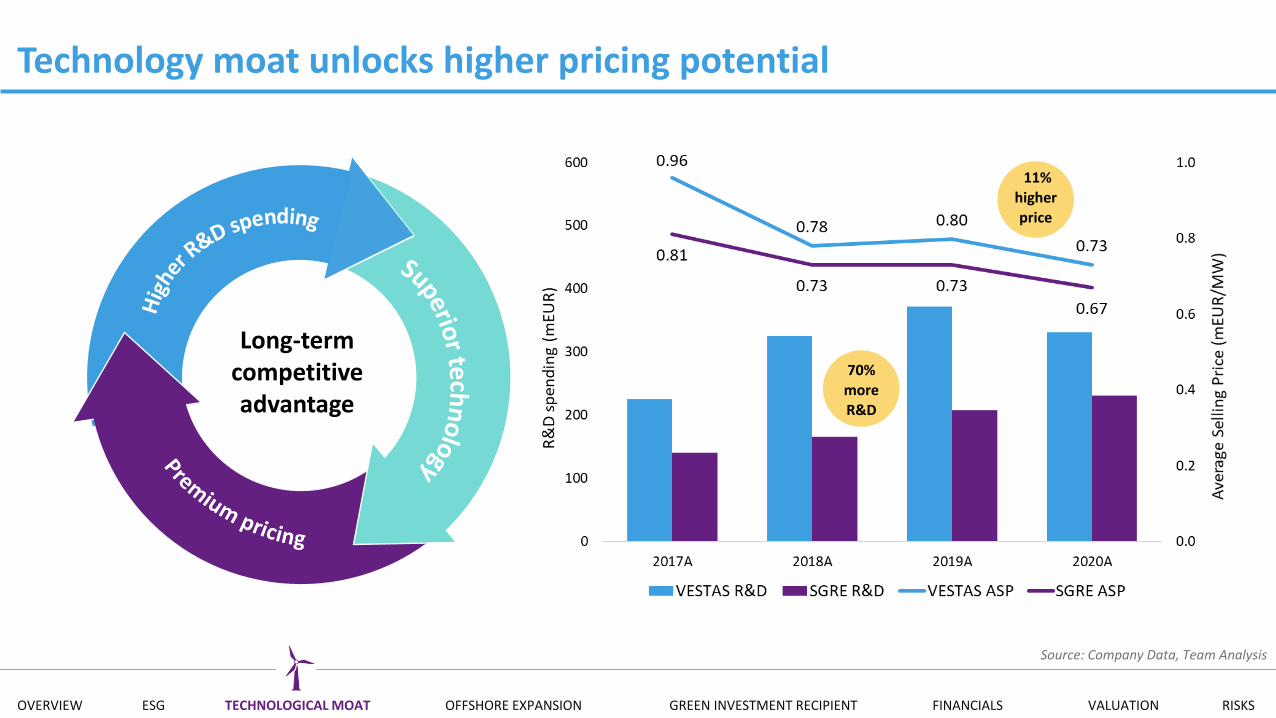
Technology moat unlocks higher pricing potential
11% higher price
Long-term competitive advantage
70% more R&D
Source: Company Data, Team Analysis
OVERVIEW ESG TECHNOLOGICAL MOAT OFFSHORE EXPANSION GREEN INVESTMENT RECIPIENT FINANCIALS VALUATION RISKS
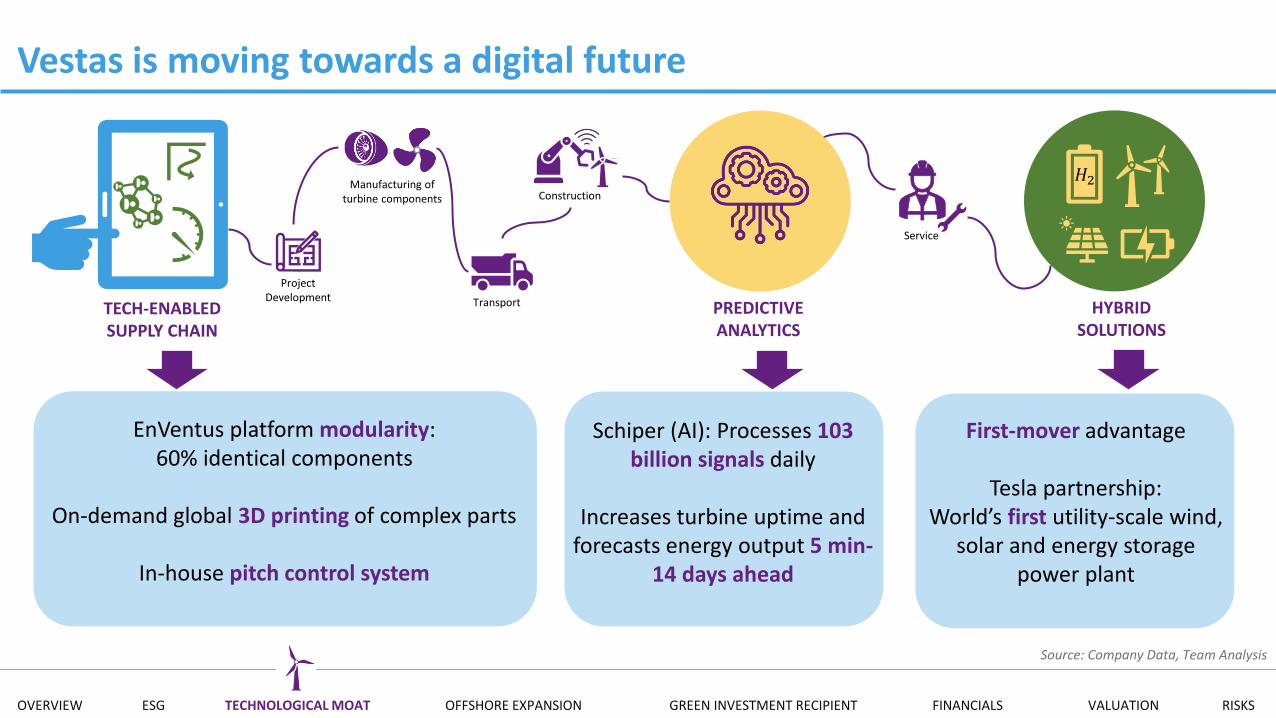
Vestas is moving towards a digital future
Project Development
Manufacturing of turbine components
Transport
Construction
Service
HYBRIDSOLUTIONS
PREDICTIVEANALYTICS
TECH-ENABLED SUPPLY CHAIN
𝐻2
EnVentus platform modularity:60% identical components
On-demand global 3D printing of complex parts
In-house pitch control system
Schiper (AI): Processes 103 billion signals daily
Increases turbine uptime and forecasts energy output 5 min-
14 days ahead
First-mover advantage
Tesla partnership: World’s first utility-scale wind,
solar and energy storage power plant
Source: Company Data, Team Analysis
OVERVIEW ESG TECHNOLOGICAL MOAT OFFSHORE EXPANSION GREEN INVESTMENT RECIPIENT FINANCIALS VALUATION RISKS
Hybrid solutionsPredictive analyticsDigital supply chain
Investment summary
OFFSHORE EXPANSION MAXIMIZES SHAREHOLDER RETURNS
UNIQUE POSITION TO CAPITALIZE ON THE RENEWABLE TRANSITION
TECHNOLOGY MOAT UNLOCKS HIGHER PRICING POTENTIAL
OVERVIEW ESG TECHNOLOGICAL MOAT OFFSHORE EXPANSION GREEN INVESTMENT RECIPIENT FINANCIALS VALUATION RISKS
2010 2015 2020 2025 2030 2035 2040 2045 2050
Est.
cu
mu
lati
ve in
stal
led
cap
acit
y o
ffsh
ore
(G
W)
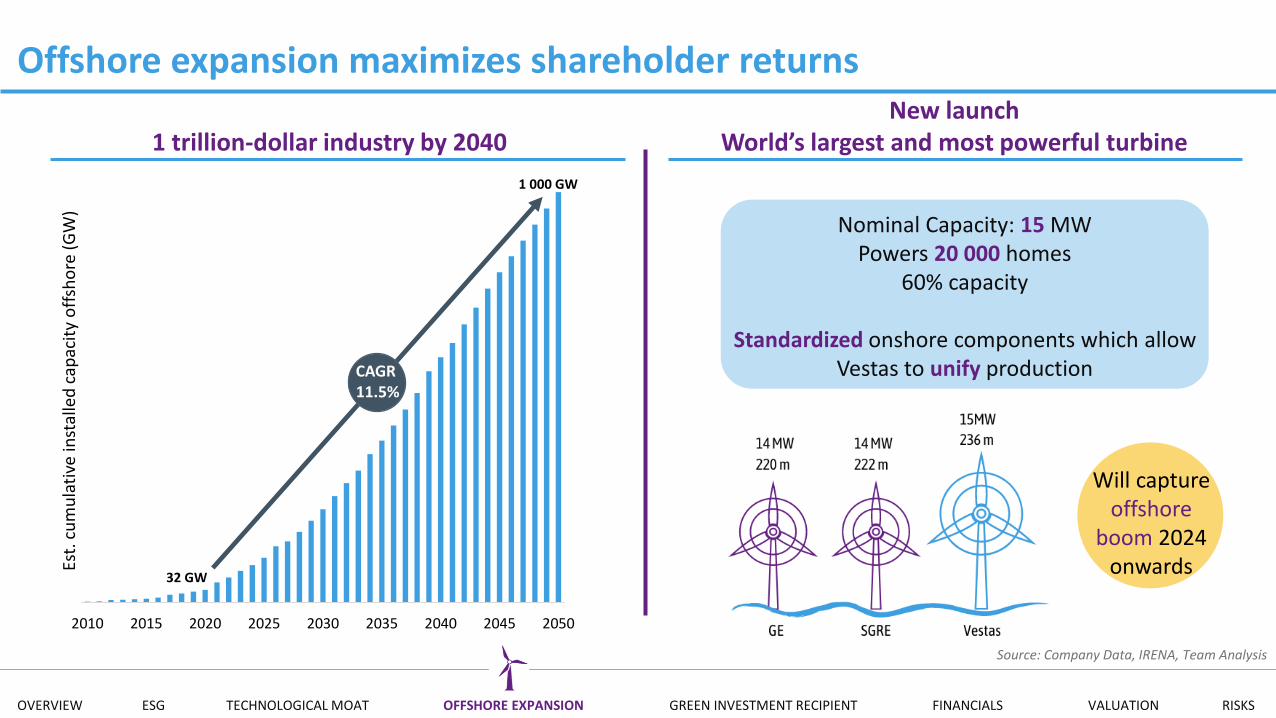
Offshore expansion maximizes shareholder returns
1 trillion-dollar industry by 2040
Nominal Capacity: 15 MWPowers 20 000 homes
60% capacity
Standardized onshore components which allow Vestas to unify production
New launchWorld’s largest and most powerful turbine
Will capture offshore
boom 2024 onwards
CAGR11.5%
Source: Company Data, IRENA, Team Analysis
32 GW
1 000 GW
OVERVIEW ESG TECHNOLOGICAL MOAT OFFSHORE EXPANSION GREEN INVESTMENT RECIPIENT FINANCIALS VALUATION RISKS
2010 2015 2020 2025 2030 2035 2040 2045 2050
Est.
cu
mu
lati
ve in
stal
led
cap
acit
y o
ffsh
ore
(G
W)
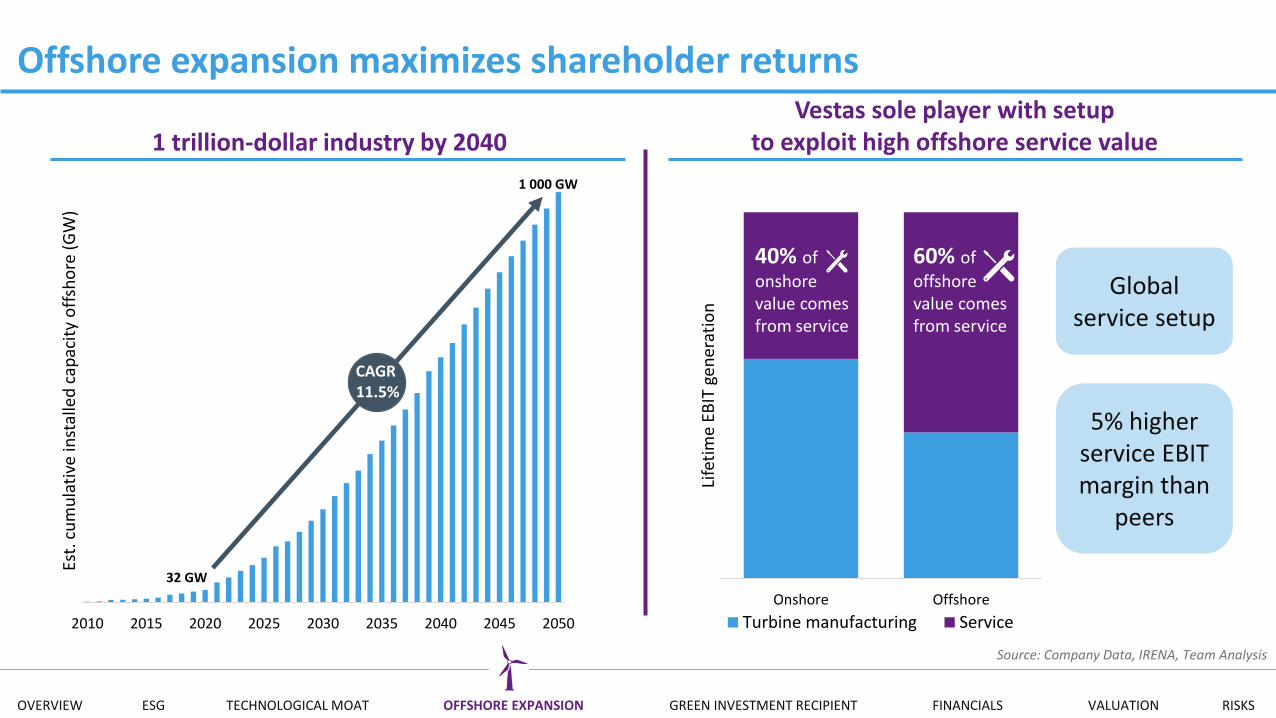
Offshore expansion maximizes shareholder returnsVestas sole player with setup
to exploit high offshore service value
1 000 GW
Global service setup
5% higher service EBIT margin than
peers
Onshore Offshore
Life
tim
e EB
IT g
ener
atio
n
Turbine manufacturing Service
40% of
onshore value comes from service
60% of
offshore value comes from service
1 trillion-dollar industry by 2040
CAGR11.5%
Source: Company Data, IRENA, Team Analysis
32 GW
OVERVIEW ESG TECHNOLOGICAL MOAT OFFSHORE EXPANSION GREEN INVESTMENT RECIPIENT FINANCIALS VALUATION RISKS
Investment summary
OFFSHORE EXPANSION MAXIMIZES SHAREHOLDER RETURNS
UNIQUE POSITION TO CAPITALIZE ON THE RENEWABLE TRANSITION
$1tn industry Best offshore turbine Global service infrastructure
Hybrid solutionsPredictive analyticsDigital supply chain
TECHNOLOGY MOAT UNLOCKS HIGHER PRICING POTENTIAL
OVERVIEW ESG TECHNOLOGICAL MOAT OFFSHORE EXPANSION GREEN INVESTMENT RECIPIENT FINANCIALS VALUATION RISKS
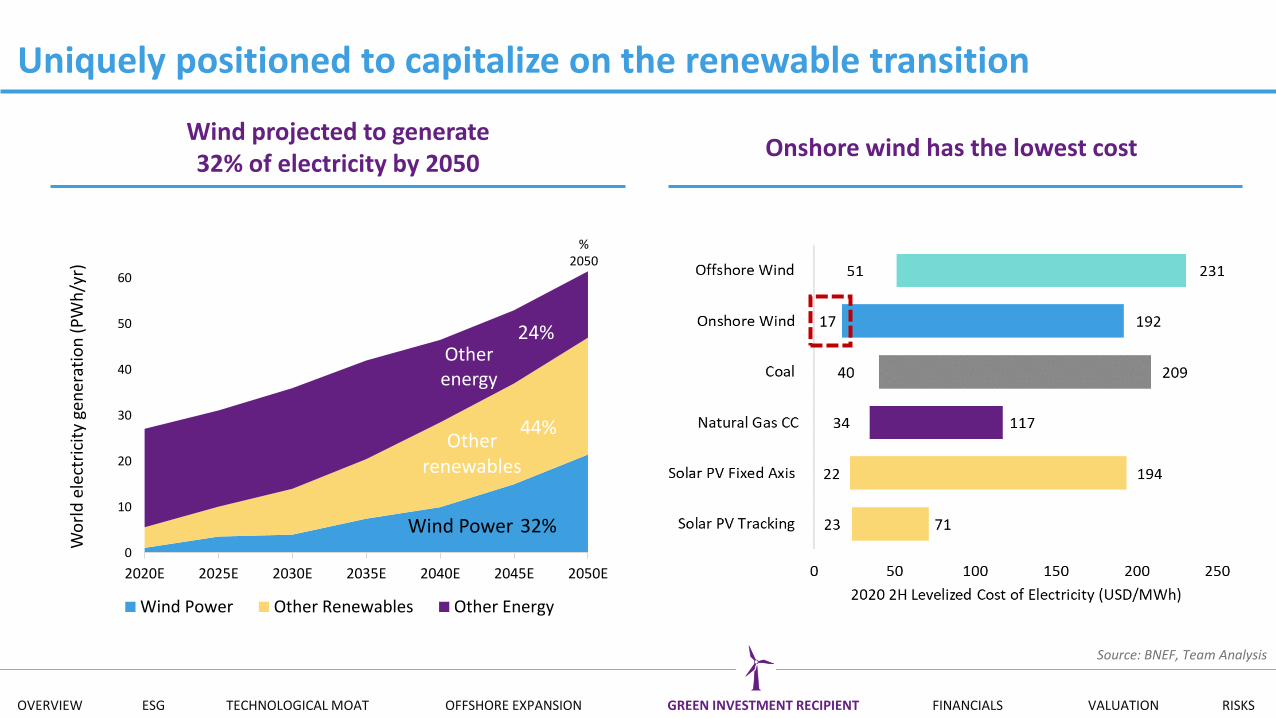
Uniquely positioned to capitalize on the renewable transition
Wind projected to generate32% of electricity by 2050
0
10
20
30
40
50
60
2020E 2025E 2030E 2035E 2040E 2045E 2050E
Wo
rld
ele
ctri
city
gen
erat
ion
(P
Wh
/yr)
Wind Power Other Renewables Other Energy
Wind Power
Other renewables
Otherenergy
24%
44%
32%
Onshore wind has the lowest cost
%2050
Source: BNEF, Team Analysis
OVERVIEW ESG TECHNOLOGICAL MOAT OFFSHORE EXPANSION GREEN INVESTMENT RECIPIENT FINANCIALS VALUATION RISKS
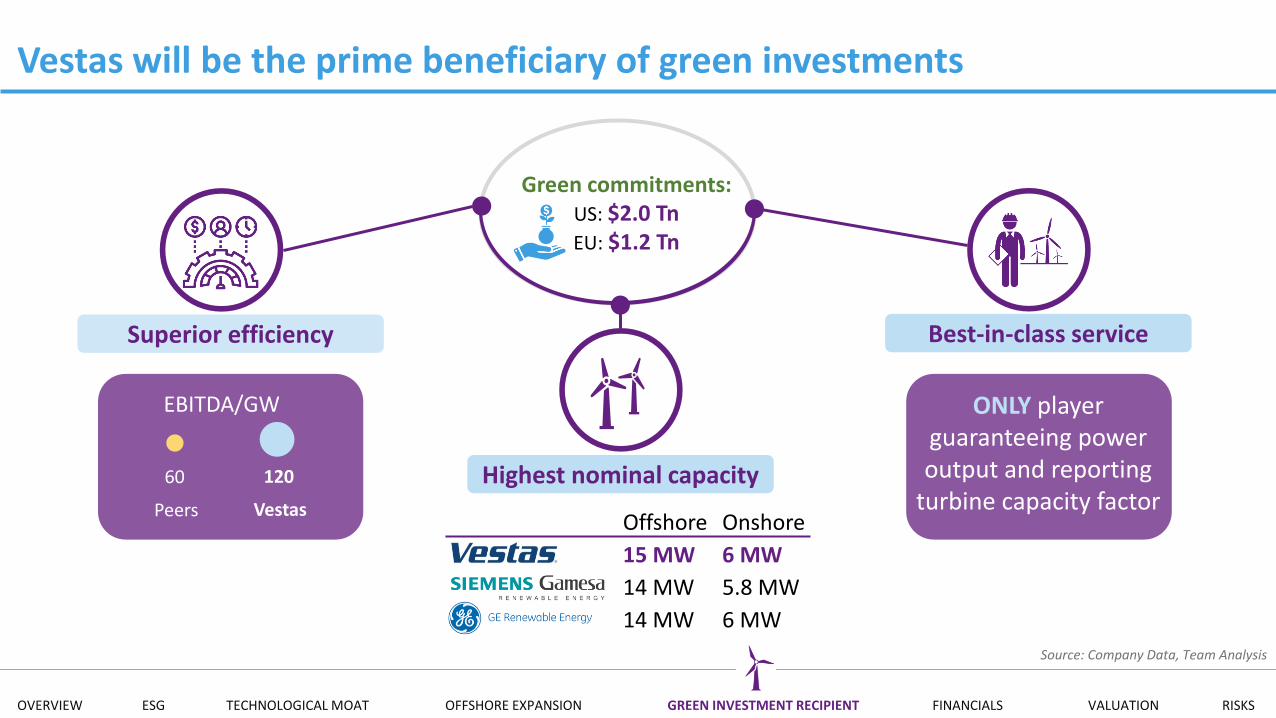
Offshore Onshore
15 MW 6 MW
14 MW 5.8 MW
14 MW 6 MW
Vestas will be the prime beneficiary of green investments
Green commitments:US: $2.0 TnEU: $1.2 Tn
Superior efficiency
Highest nominal capacity
Best-in-class service
Peers
60
EBITDA/GW ONLY player guaranteeing power output and reporting
turbine capacity factor
Source: Company Data, Team Analysis
Vestas
120
OVERVIEW ESG TECHNOLOGICAL MOAT OFFSHORE EXPANSION GREEN INVESTMENT RECIPIENT FINANCIALS VALUATION RISKS
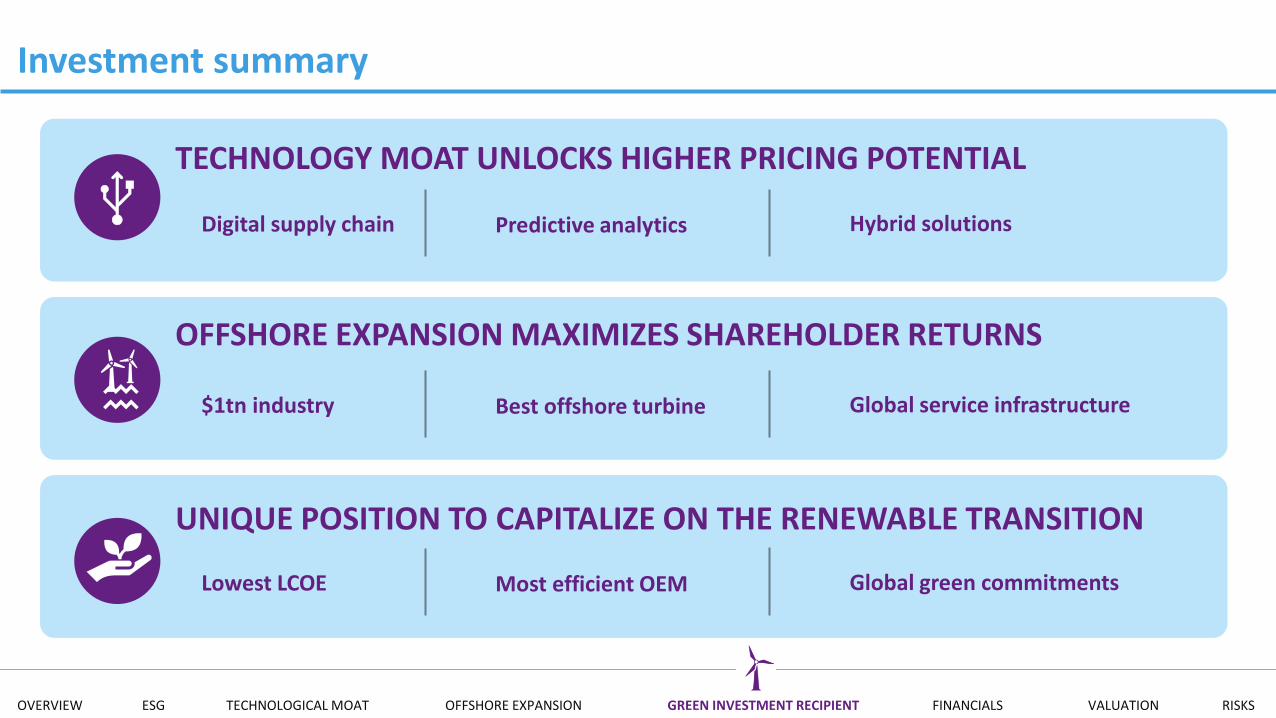
Investment summary
OFFSHORE EXPANSION MAXIMIZES SHAREHOLDER RETURNS
UNIQUE POSITION TO CAPITALIZE ON THE RENEWABLE TRANSITION
$1tn industry Best offshore turbine Global service infrastructure
Hybrid solutionsPredictive analyticsDigital supply chain
TECHNOLOGY MOAT UNLOCKS HIGHER PRICING POTENTIAL
Lowest LCOE Most efficient OEM Global green commitments
OVERVIEW ESG TECHNOLOGICAL MOAT OFFSHORE EXPANSION GREEN INVESTMENT RECIPIENT FINANCIALS VALUATION RISKS
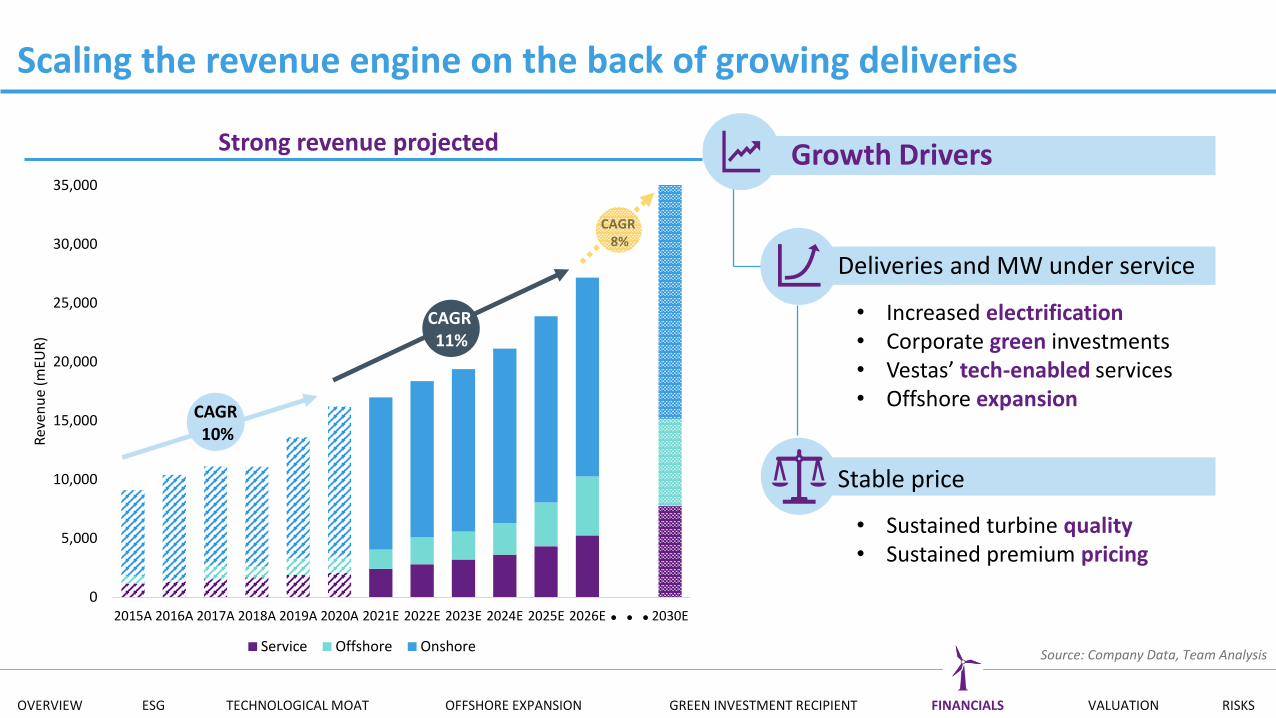
Scaling the revenue engine on the back of growing deliveries
• Increased electrification• Corporate green investments• Vestas’ tech-enabled services• Offshore expansion
• Sustained turbine quality• Sustained premium pricing
Strong revenue projected Growth Drivers
Deliveries and MW under service
Stable price
Source: Company Data, Team Analysis
0
5,000
10,000
15,000
20,000
25,000
30,000
35,000
2015A 2016A 2017A 2018A 2019A 2020A 2021E 2022E 2023E 2024E 2025E 2026E 2030E
Rev
enu
e (m
EUR
)
Service Offshore Onshore
CAGR10%
CAGR11%
OVERVIEW ESG TECHNOLOGICAL MOAT OFFSHORE EXPANSION GREEN INVESTMENT RECIPIENT FINANCIALS VALUATION RISKS
0%
5%
10%
15%
20%
25%
30%
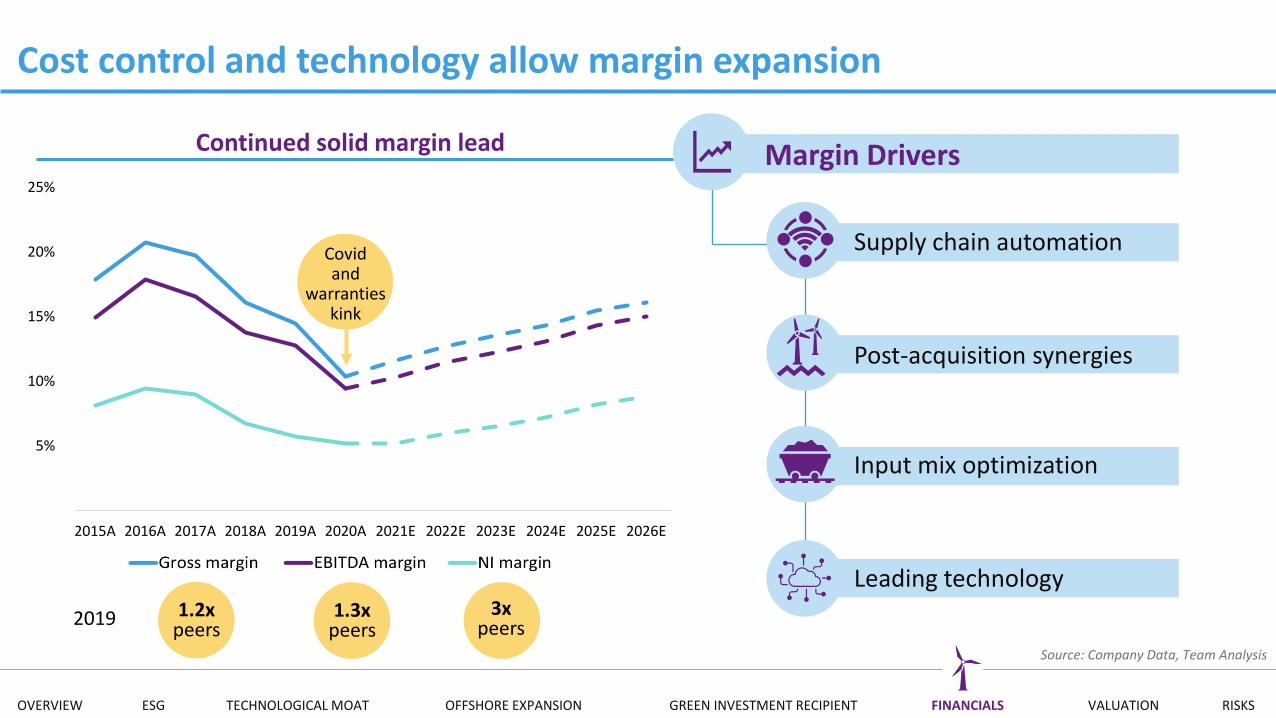
2015A 2016A 2017A 2018A 2019A 2020A 2021E 2022E 2023E 2024E 2025E 2026E
Cost control and technology allow margin expansion
Supply chain automation
Input mix optimization
Post-acquisition synergies
Leading technology1.3x
peers3x
peers
Margin Drivers
1.2xpeers
2019
Source: Company Data, Team Analysis
Continued solid margin lead
Covidand
warranties kink
OVERVIEW ESG TECHNOLOGICAL MOAT OFFSHORE EXPANSION GREEN INVESTMENT RECIPIENT FINANCIALS VALUATION RISKS
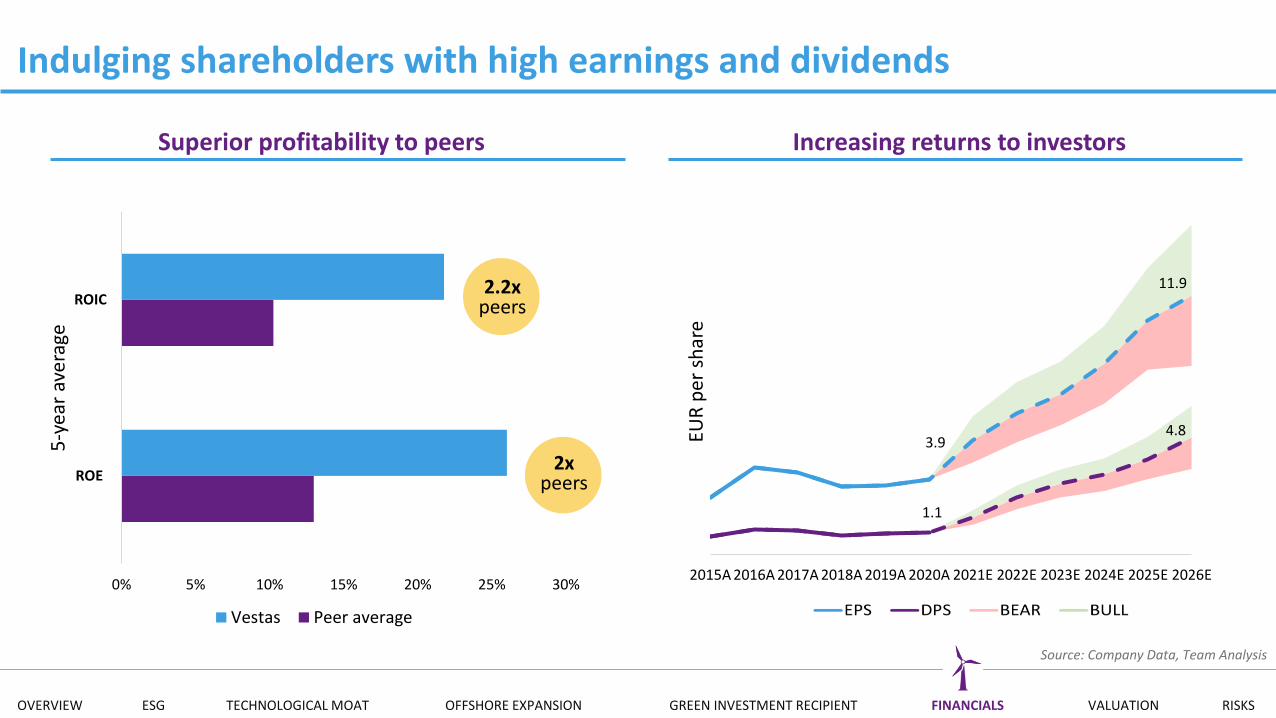
Indulging shareholders with high earnings and dividends
0% 5% 10% 15% 20% 25% 30%
ROE
ROIC
5-y
ear
aver
age
Vestas Peer average
2.2xpeers
2xpeers
Superior profitability to peers Increasing returns to investors
2015A 2016A 2017A 2018A 2019A 2020A 2021E 2022E 2023E 2024E 2025E 2026E
EUR
per
sh
are
3.9
11.9
1.1
4.8
Source: Company Data, Team Analysis
OVERVIEW ESG TECHNOLOGICAL MOAT OFFSHORE EXPANSION GREEN INVESTMENT RECIPIENT FINANCIALS VALUATION RISKS
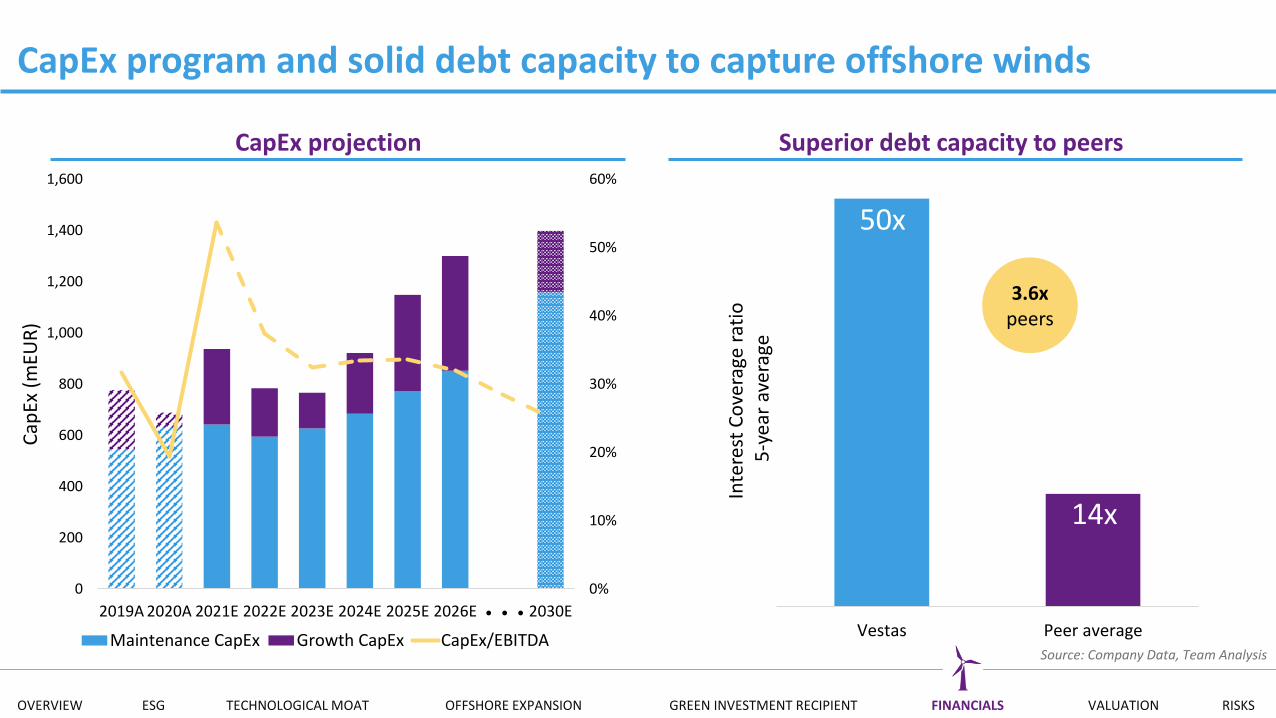
CapEx program and solid debt capacity to capture offshore winds
3.6xpeers
CapEx projection Superior debt capacity to peers
Vestas Peer average
Inte
rest
Co
vera
ge r
atio
5-y
ear
aver
age
50x
14x
Source: Company Data, Team Analysis
0%
10%
20%
30%
40%
50%
60%
0
200
400
600
800
1,000
1,200
1,400
1,600
2019A 2020A 2021E 2022E 2023E 2024E 2025E 2026E 2030E
Cap
Ex (
mEU
R)
Maintenance CapEx Growth CapEx CapEx/EBITDA
OVERVIEW ESG TECHNOLOGICAL MOAT OFFSHORE EXPANSION GREEN INVESTMENT RECIPIENT FINANCIALS VALUATION RISKS
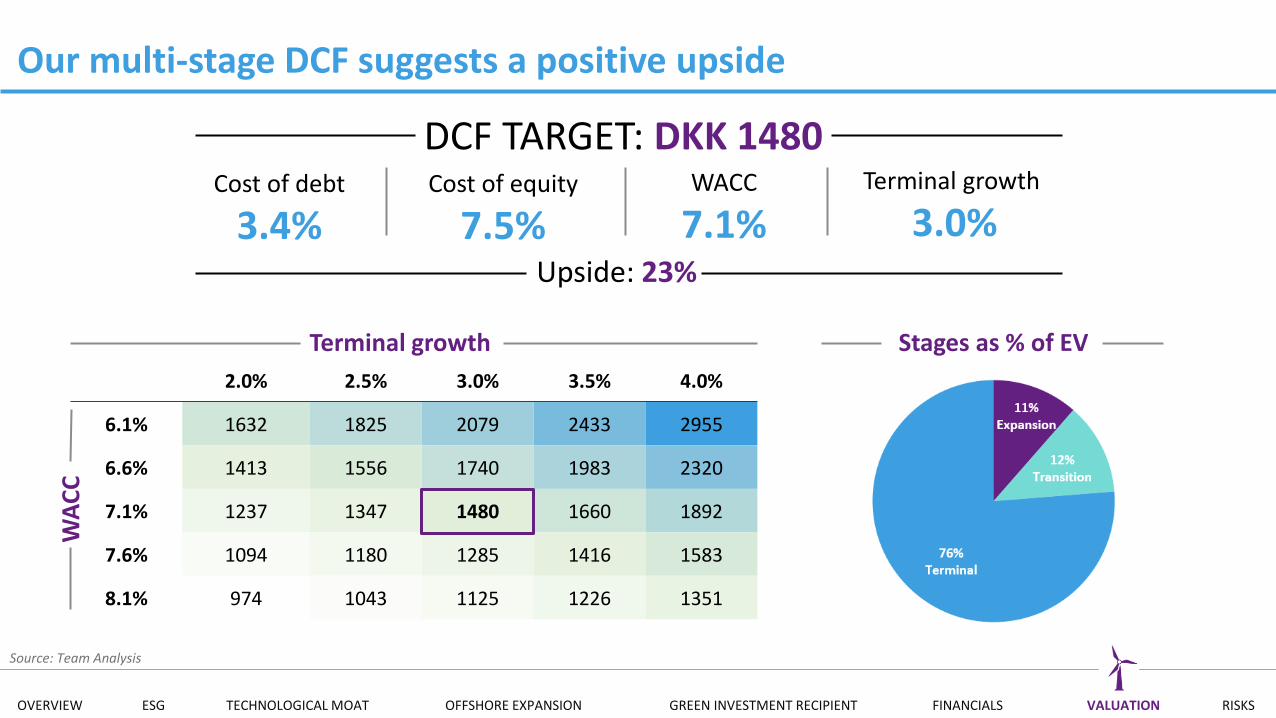
2.0% 2.5% 3.0% 3.5% 4.0%
6.1% 1632 1825 2079 2433 2955
6.6% 1413 1556 1740 1983 2320
7.1% 1237 1347 1480 1660 1892
7.6% 1094 1180 1285 1416 1583
8.1% 974 1043 1125 1226 1351
Our multi-stage DCF suggests a positive upside
Cost of debt
3.4%Cost of equity
7.5%WACC
7.1%Terminal growth
3.0%
DCF TARGET: DKK 1480
Upside: 23%
Source: Team Analysis
Stages as % of EV
WA
CC
Terminal growth
OVERVIEW ESG TECHNOLOGICAL MOAT OFFSHORE EXPANSION GREEN INVESTMENT RECIPIENT FINANCIALS VALUATION RISKS
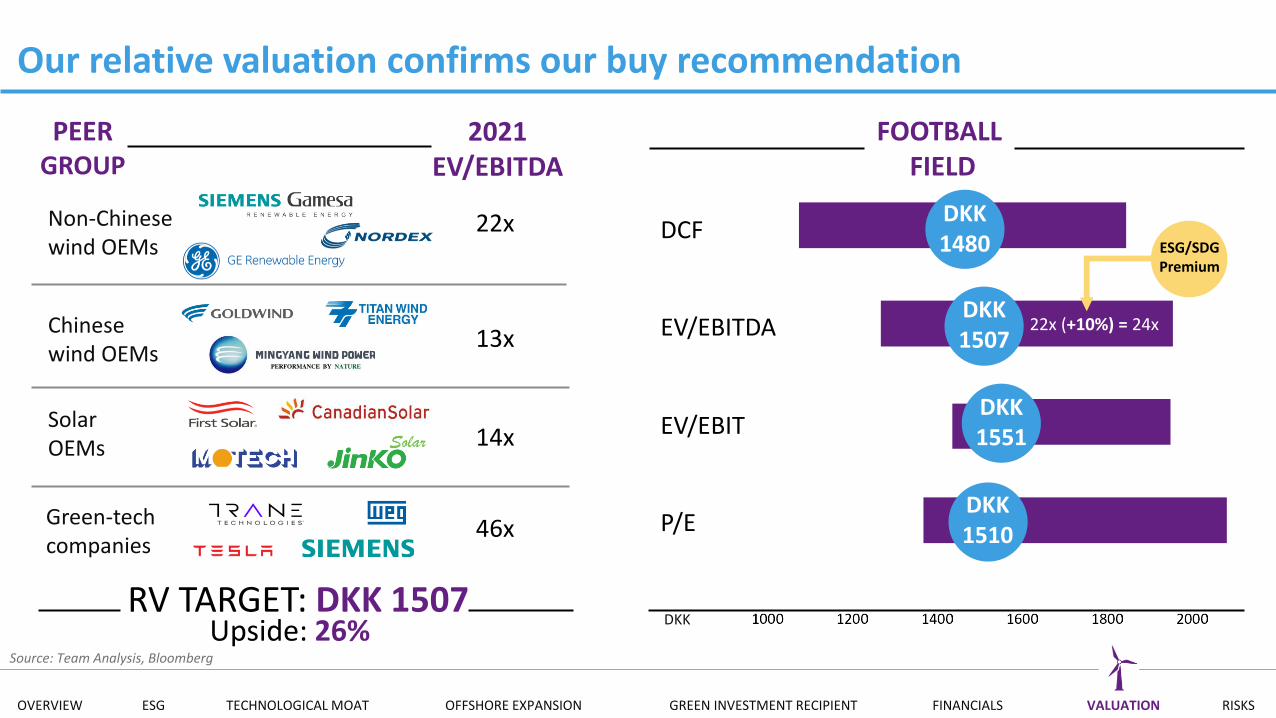
800 900 1000 1100 1200 1300 1400 1500 1600 1700 1800 1900 2000 2100 2200
Our relative valuation confirms our buy recommendation
RV TARGET: DKK 1507Upside: 26%
Non-Chinese wind OEMs
Green-techcompanies
Chinese wind OEMs
SolarOEMs
FOOTBALLFIELD
DCF
EV/EBITDA
EV/EBIT
P/E
DKK 1480
DKK 1507
DKK 1551
DKK 1510
DKK
PEER GROUP
2021 EV/EBITDA
22x
13x
14x
46x
22x (+10%) = 24x
Source: Team Analysis, Bloomberg
ESG/SDGPremium
OVERVIEW ESG TECHNOLOGICAL MOAT OFFSHORE EXPANSION GREEN INVESTMENT RECIPIENT FINANCIALS VALUATION RISKS
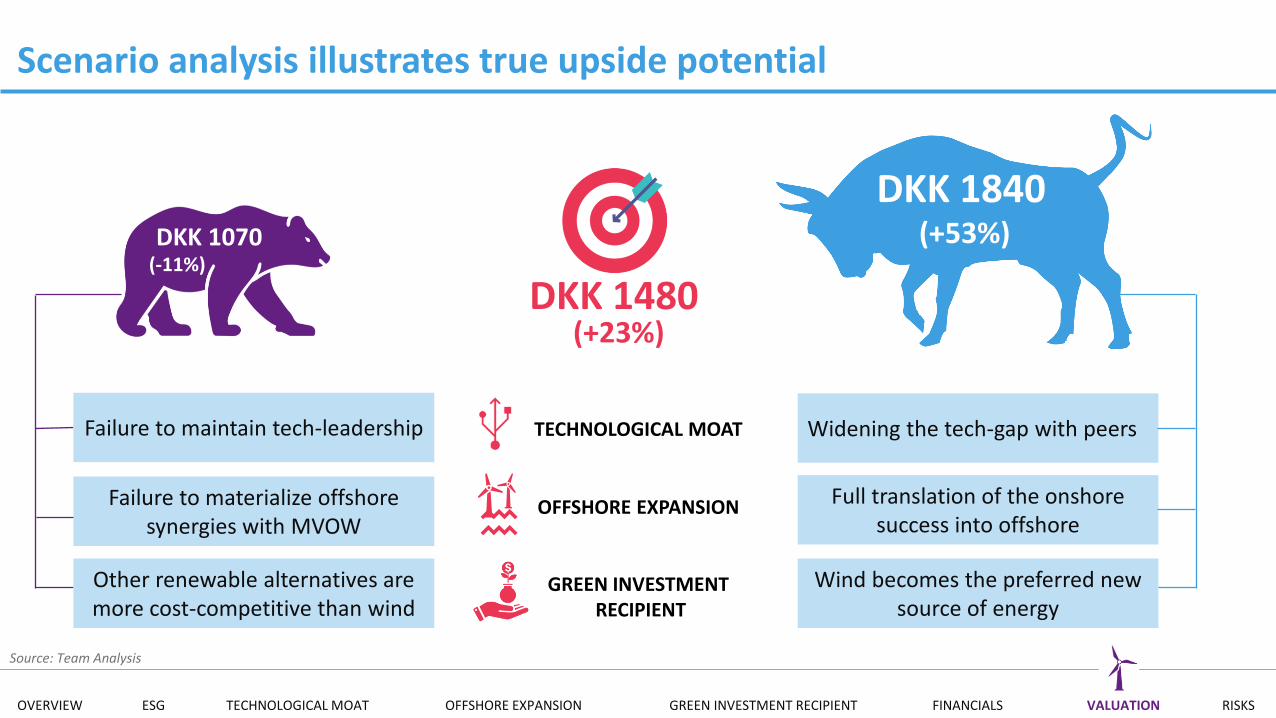
Scenario analysis illustrates true upside potential
DKK 1480
DKK 1070 (-11%)
(+23%)
DKK 1840(+53%)
Failure to maintain tech-leadership Widening the tech-gap with peers
Failure to materialize offshore synergies with MVOW
Other renewable alternatives are more cost-competitive than wind
Full translation of the onshore success into offshore
Wind becomes the preferred new source of energy
TECHNOLOGICAL MOAT
OFFSHORE EXPANSION
GREEN INVESTMENTRECIPIENT
Source: Team Analysis
OVERVIEW ESG TECHNOLOGICAL MOAT OFFSHORE EXPANSION GREEN INVESTMENT RECIPIENT FINANCIALS VALUATION RISKS
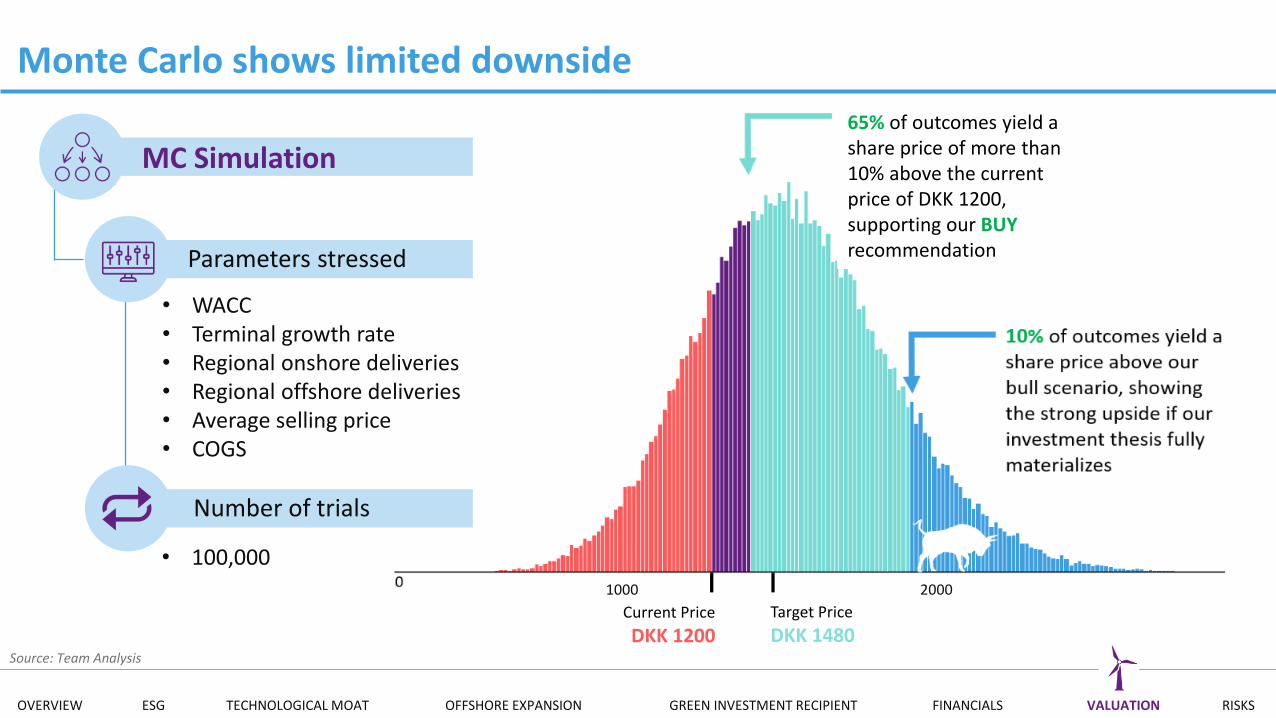
Monte Carlo shows limited downside
MC Simulation
• WACC • Terminal growth rate • Regional onshore deliveries• Regional offshore deliveries• Average selling price• COGS
Parameters stressed
Number of trials
• 100,00020001000
Source: Team Analysis
Current Price
DKK 1200Target Price
DKK 1480
65% of outcomes yield a share price of more than 10% above the current price of DKK 1200, supporting our BUYrecommendation
OVERVIEW ESG TECHNOLOGICAL MOAT OFFSHORE EXPANSION GREEN INVESTMENT RECIPIENT FINANCIALS VALUATION RISKS
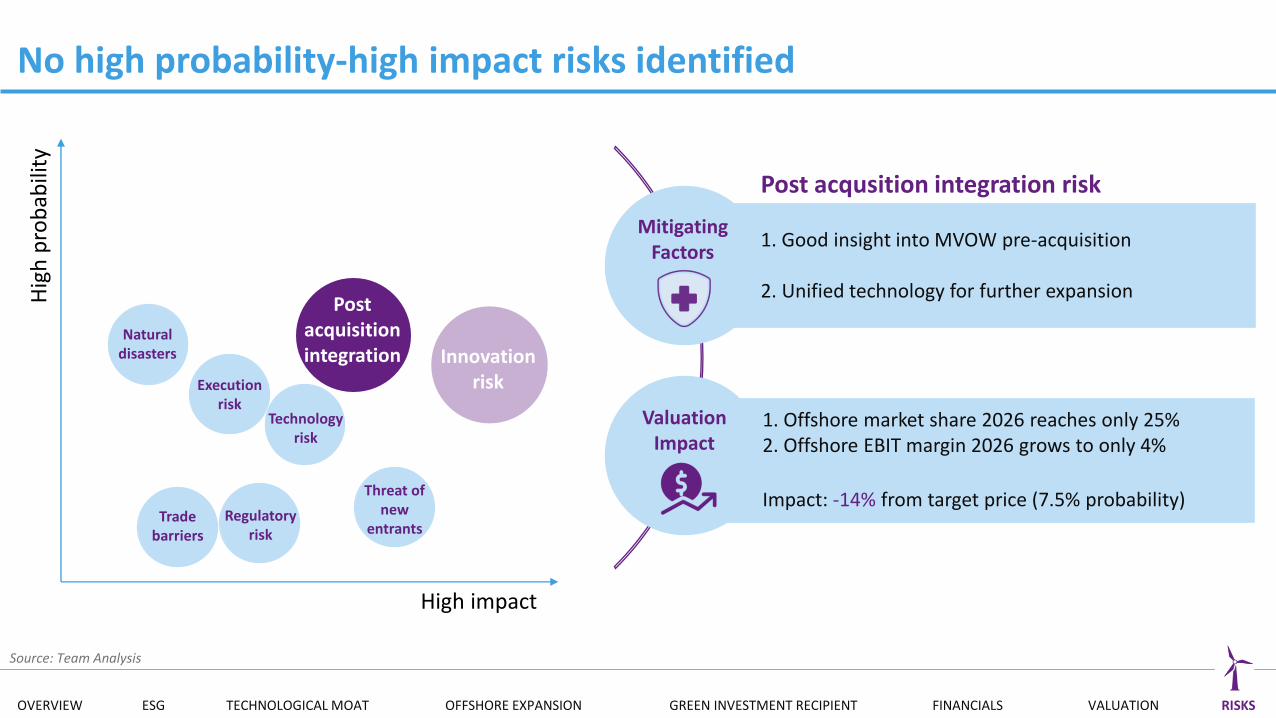
No high probability-high impact risks identified
Valuation Impact
High impact
Hig
h p
rob
abili
ty
Post acquisition integration Innovation
riskExecution risk
Regulatory risk
Technology risk
Trade barriers
Threat of new
entrants
Source: Team Analysis
Mitigating Factors
1. Good insight into MVOW pre-acquisition
2. Unified technology for further expansion
Post acqusition integration risk
1. Offshore market share 2026 reaches only 25%2. Offshore EBIT margin 2026 grows to only 4%
Impact: -14% from target price (7.5% probability)
Naturaldisasters
OVERVIEW ESG TECHNOLOGICAL MOAT OFFSHORE EXPANSION GREEN INVESTMENT RECIPIENT FINANCIALS VALUATION RISKS
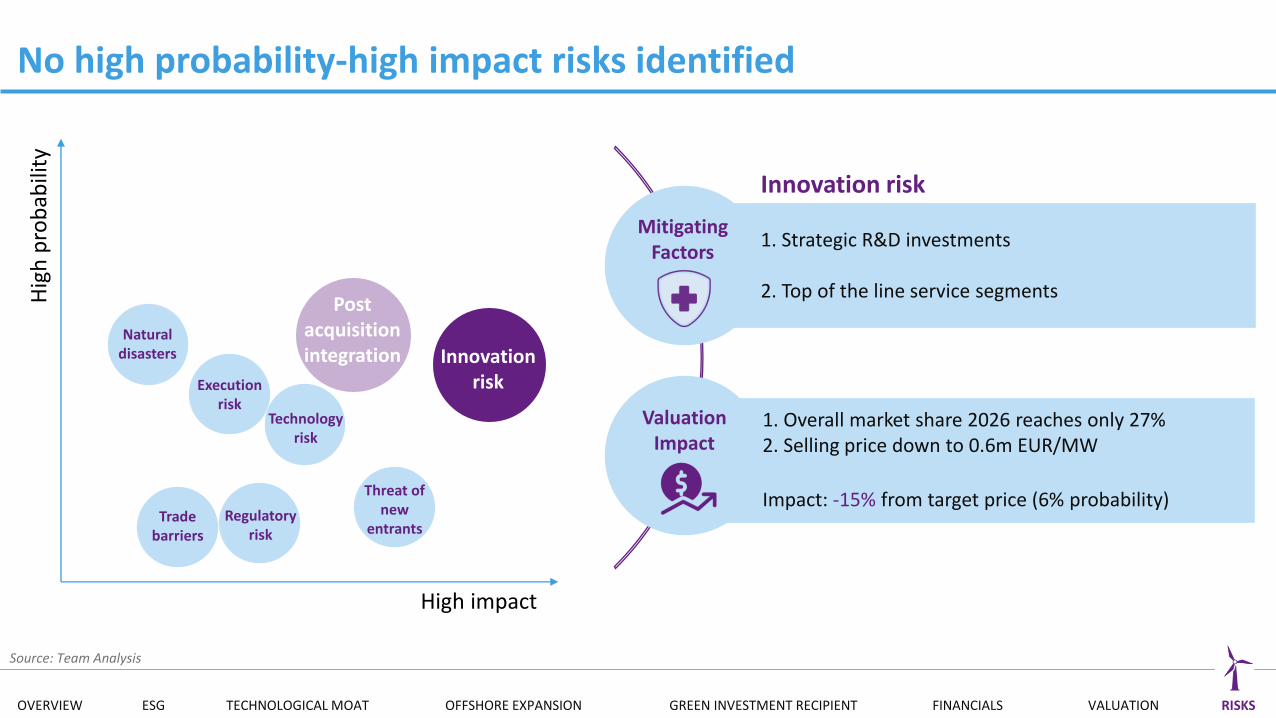
No high probability-high impact risks identified
High impact
Hig
h p
rob
abili
ty
Innovation riskExecution
risk
Naturaldisasters
Regulatory risk
Technology risk
Trade barriers
Threat of new
entrants
Source: Team Analysis
Innovation risk
Post acquisition integration
Mitigating Factors
Valuation Impact
1. Strategic R&D investments
2. Top of the line service segments
1. Overall market share 2026 reaches only 27%2. Selling price down to 0.6m EUR/MW
Impact: -15% from target price (6% probability)
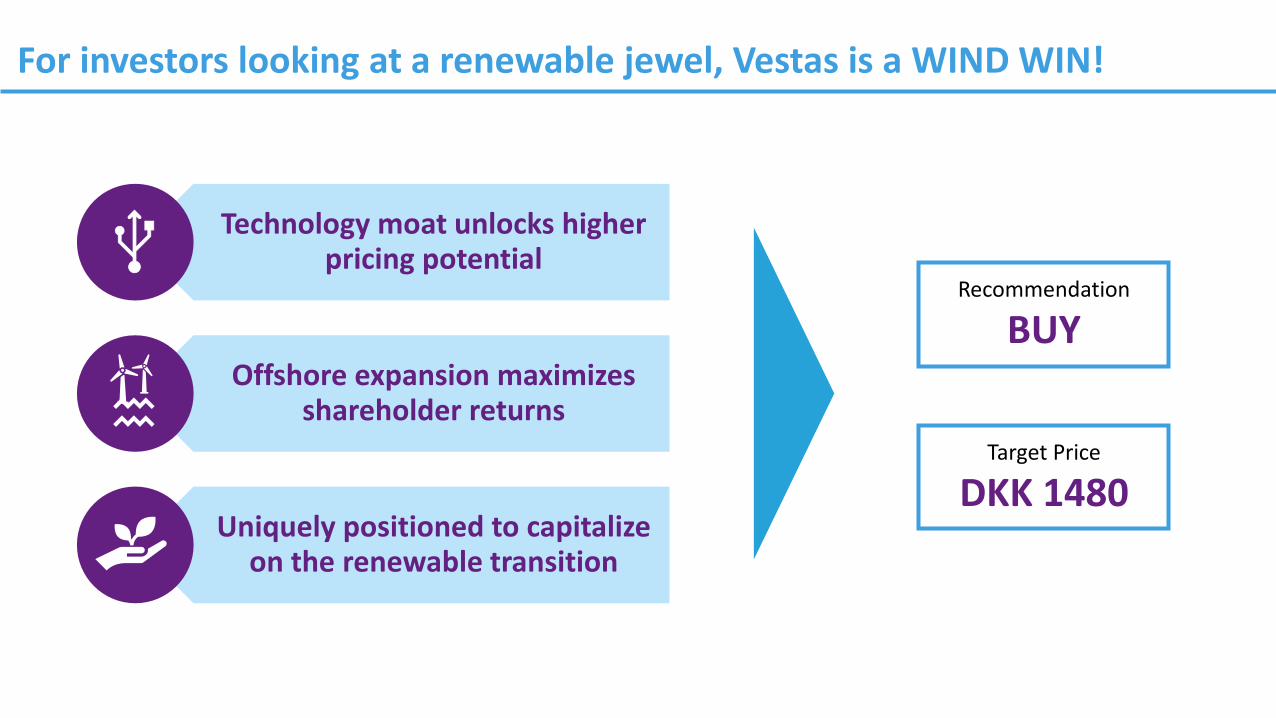
For investors looking at a renewable jewel, Vestas is a WIND WIN!
Technology moat unlocks higherpricing potential
Offshore expansion maximizes shareholder returns
Uniquely positioned to capitalizeon the renewable transition
Target Price
DKK 1480
Recommendation
BUY