Embed Size (px)
Citation preview
cells
Article
Establishment and Characterization of a SclerosingSpindle Cell Rhabdomyosarcoma Cell Line with aComplex Genomic Profile
Sabine Schleicher 1,*,† , Stefan Grote 1,† , Elke Malenke 1, Kenneth Chun-Ho Chan 1,Martin Schaller 2, Birgit Fehrenbacher 2 , Rosa Riester 3, Torsten Kluba 4, Leonie Frauenfeld 5,Hans Boesmueller 5, Gudrun Göhring 6, Brigitte Schlegelberger 6, Rupert Handgretinger 1,Hans-Georg Kopp 7, Frank Traub 8 and Karen A. Boehme 3,9
1 Department of Hematology and Oncology, Eberhard Karls University Tuebingen, Children’s Hospital,72076 Tuebingen, Germany; [email protected] (S.G.);[email protected] (E.M.); [email protected] (K.C.-H.C.);[email protected] (R.H.)
2 Department of Dermatology, Eberhard Karls University Tuebingen, 72076 Tuebingen, Germany;[email protected] (M.S.); [email protected] (B.F.)
3 Department of Orthopaedic Surgery, Eberhard Karls University Tuebingen, 72072 Tuebingen, Germany;[email protected] (R.R.); [email protected] (K.A.B.)
4 Department for Orthopaedic Surgery, Hospital Dresden-Friedrichstadt, 01067 Dresden, Germany;[email protected]
5 Institute of Pathology and Neuropathology, University Hospital Tuebingen, 72076 Tuebingen, Germany;[email protected] (L.F.); [email protected] (H.B.)
6 Department of Human Genetics, Hannover Medical School, 30625 Hannover, Germany;[email protected] (G.G.); [email protected] (B.S.)
7 Robert Bosch Cancer Center/RBCT Stuttgart, 70376 Stuttgart, Germany; [email protected] Department of Orthopedics and Traumatology, University Medical Centre Mainz, Johannes
Gutenberg-University Mainz, 55131 Mainz, Germany; [email protected] G.E.R.N. Center for Tissue Replacement, Regeneration & Neogenesis, Department of Orthopedics and
Trauma Surgery, Faculty of Medicine, Medical Center—University of Freiburg, Engesserstr. 4,79108 Freiburg, Germany
* Correspondence: [email protected]; Tel.: +49-07071-2981378† These authors contributed equally to this work.
Received: 14 October 2020; Accepted: 5 December 2020; Published: 11 December 2020�����������������
Abstract: Sclerosing spindle cell rhabdomyosarcoma (SSRMS) is a rare rhabdomyosarcomas (RMS)subtype. Especially cases bearing a myogenic differentiation 1 (MYOD1) mutation are characterizedby a high recurrence and metastasis rate, often leading to a fatal outcome. SSRMS cell lines arevaluable in vitro models for studying disease mechanisms and for the preclinical evaluation of newtherapeutic approaches. In this study, a cell line established from a primary SSRMS tumor of a24-year-old female after multimodal chemotherapeutic pretreatment has been characterized in detail,including immunohistochemistry, growth characteristics, cytogenetic analysis, mutation analysis,evaluation of stem cell marker expression, differentiation potential, and tumorigenicity in mice. The cellline which was designated SRH exhibited a complex genomic profile, including several translocationsand deletions. Array-comparative genomic hybridization (CGH) revealed an overall predominatingloss of gene loci. The mesenchymal tumor origin was underlined by the expression of mesenchymalmarkers and potential to undergo adipogenic and osteogenic differentiation. Despite myogenicmarker expression, terminal myogenic differentiation was inhibited, which might be elicited by theMYOD1 hotspot mutation. In vivo tumorigenicity could be confirmed after subcutaneous injectioninto NOD/SCID/γc
null mice. Summarized, the SRH cell line is the first adult SSRMS cell line availablefor preclinical research on this rare RMS subtype.
Cells 2020, 9, 2668; doi:10.3390/cells9122668 www.mdpi.com/journal/cells
Cells 2020, 9, 2668 2 of 26
Keywords: rhabdomyosarcoma; sclerosing; spindle cell; cell line establishment; stem cell; genetics;differentiation; MYOD1; p53; WNT
1. Introduction
Rhabdomyosarcomas (RMS) are rare mesenchymal tumors showing a partial striated musclecell differentiation [1]. While RMS are the most prevalent soft tissue sarcomas (STS) in children andadolescents, making up about 3% of all malignancies at that age [2], in adults liposarcomas andleiomyosarcomas are the dominating STS [3]. The worldwide age standardized RMS incidence rate is0.3/100,000 [3]. Several distinct histopathological RMS subtypes have been defined: young children aremost often affected by the embryonal RMS (ERMS) subtype, the proportion of alveolar RMS (ARMS)increases in older children and adolescents [4], whereas, in adults, the pleomorphic (PRMS) subtype ismost frequently diagnosed [5].
Pediatric RMS with spindle cell histotype were first described in 1992 [6], followed by adultspindle cell RMS in 1998 [7]. In addition, a sclerosing histotype in adults was discovered in 2000 [8].Later, the frequent coexistence of spindle cells with hyalinized sclerosing areas in the same tumorled to the definition of sclerosing spindle cell RMS (SSRMS) as an independent histopathologic RMSsubtype [9]. Unlike an infantile variant of SSRMS that is characterized by the presence of nuclearreceptor coactivator (NCOA) fusion proteins, which has a favorable prognosis [10,11], most SSRMS inadolescents and adults express myogenic differentiation 1 (MYOD1) and they are highly aggressivemarked by frequent recurrence and metastasis [12,13].
Additionally, desmin is frequently expressed by SSRMS and a focal positivity for myogenin(MYOG), combined with a high proliferative index (marker of proliferation Ki-67), has been reported,while the ARMS typic paired box (PAX)-forkhead box protein O1 (FOXO1) fusion proteins are absentin SSRMS [14–16]. Though expressing myogenic marker proteins, the completion of myogenicdifferentiation is inhibited in SSRMS, due to frequently observed recurrent MYOD1 mutations [16–19].
Several chromosomal aberrations have been reported for SSRMS tumors, including amplificationsof 12q13–15 coding for mouse double minute 2 (MDM2) and high mobility group AT-hook 2(HMGA2) [20], the loss of 10q22 along with gain of chromosome 18 [21], or a complex karyotypeincluding gain of chromosome 11 and loss of chromosome 22, which was associated with the gain ofthe whole chromosomes 16, 18, and 21, and a partial gain of chromosome 1 in a subset of cells [22].
Multimodal chemotherapy and radiation therapy are frequently applied upon the diagnosis ofSSRMS. Yet, inherent and acquired therapeutic resistance have been reported for several SSRMS cases,especially for those with MYOD1 mutations [12,23,24].
Stem cell features of ERMS have been explored during the recent years. Proposed cancerstem cell (CSC) markers are prominin-like protein 1 (PROM1), also known as CD133 [25],aldehyde dehydrogenase 1 (ALDH1) [26], as well as members of the ABC transporter family [26].In addition, pluripotency markers, like SRY-box transcription factor 2 (SOX2) and c-Myc (MYC),which is also an important oncogene, were found to be concomitantly elevated with ALDH1 [26].Specifically, for SSRMS, no stem cell marker analysis has been published so far.
The downregulation of the wingless-type (WNT) signaling concurrently with activation ofhedgehog (Hh) signaling, two pathways which are involved in stemness as well as myogenicdifferentiation, has been reported for ERMS and ARMS [27,28].
To date, the establishment of only one SSRMS cell line has been published recently [29]. The cellline designated SRH that is presented in this paper has been already included in RMS research showinga distinct drug response in vitro when compared to popular ERMS and ARMS cell lines [30,31].Here, we provide the detailed characterization of the SRH cell line, including histopathology andimmunohistochemistry, growth characteristics, cytogenetic analysis, mutation analysis, evaluation ofstem cell marker expression, differentiation potential, and tumorigenicity in mice.
Cells 2020, 9, 2668 3 of 26
2. Materials and Methods
2.1. Patient History
The SRH cell line was established at the University Hospital Tuebingen from a primary tumorthat was located in the left lower leg of a 24-year-old female. The initial diagnosis of a sclerosingspindle cell rhabdomyosarcoma with multiple osseous metastases was obtained six months beforeresection. Despite subsequent multimodal chemotherapy, including vincristine, adriamycin, ifosfamide,actinomycin-D, carboplatin and etoposide, upon resection, the progressive 23 × 11 × 12 cm largeprimary tumor contained >50% vital tumor cells. Twelve months after the initial diagnosis, the patientsuccumbed to metastatic disease affecting the lungs, skull, pelvis, spine, and right femoral neck.
The ethics committee of the medical faculty Tuebingen, project no. 612/2010 BO2, approved thestudy. The patient provided written informed consent to take part in the study.
2.2. Histopathology and Immunohistochemistry
Routine histological staining (H&E) was performed on 3–5 µm thick sections of formalin-fixedand paraffin-embedded samples of the original SRH tumor following standard protocols.Immunohistochemistry was carried out with an automated immunostainer (Ventana BenchmarkUltra, Roche Diagnostics, Mannheim, Germany), according to the manufacturer’s instructions with thefollowing antibodies: Desmin mouse mAb (clone D33, Agilent Technologies, Waldbronn, Germany),MyoD1 rabbit mAb (clone EP212, Roche Diagnostics, Mannheim, Germany), and Ki-67 mouse mAb(clone MIB-1, Agilent Technologies, Waldbronn, Germany). Appropriate positive and negative controlswere employed in order to confirm the adequacy of the staining. The enhancement, extent, and patternof specific antibody immunostaining within a tissue section were determined. The sections wereinspected at 50×, 100×, or 400×magnification by an expert pathologist.
2.3. Primary Cell Culture and Propagation of SRH Cells
A portion of the resected primary tumor was washed twice in phosphate-buffered saline (PBS)(Thermo Fisher Scientific, Waltham, MA, USA), cut into small pieces of 1–2 mm3 and initiallypropagated as outgrowth culture. Tissue fragments were placed in 25 cm2 cell culture flasks andcultured in Dulbecco’s minimal essential medium (DMEM) containing 4.5 g/L glucose (Thermo FisherScientific, Waltham, MA, USA) that was supplemented with 10% heat-inactivated fetal bovine serum(Thermo Fisher Scientific, Waltham, MA, USA) and 1× antibiotic-antimycotic solution (Thermo FisherScientific, Waltham, MA, USA) with 100 units/mL penicillin, 100 µg/mL streptomycin, and 0.25 µg/mLamphothericin B. The cells were maintained at 37 ◦C in a humidified 5% CO2 atmosphere.
An exchange of culture medium was performed twice weekly until stable cell growth wasestablished. Subsequently, cells were subcultured once a week by 0.025% trypsin/EDTA (Thermo FisherScientific, Waltham, MA, USA) dissociation. During the subsequent period of continuous propagation,the cells were cryopreserved in 90% FBS and 10% DMSO (Merck, Darmstadt, Germany) and thenstored in liquid nitrogen. Active culturing of the SRH cell line was performed until passage 75 withoutchanges in the growth rate or morphology. For all experiments, SRH cells of passage 5–10 were used.
The SRH cell line was regularly tested for the absence of mycoplasma contamination while usingthe PCR Mycoplasma Test Kit I/C (PromoCell, Heidelberg, Germany).
Phase contrast images were taken with an Olympus IX50 inverted microscope (Olympus,Tokyo, Japan) that was equipped with a Canon EOS 200D camera (Canon, Tokyo, Japan).
2.4. Routine Cell Culture
Bone marrow-derived mesenchymal stem cells (MSC) were isolated at the University HospitalTuebingen after written informed consent of the patients (approved by the ethics committee of themedical faculty, project no. 401/2013 BO2), propagated, as previously described [32], and confirmed
Cells 2020, 9, 2668 4 of 26
to represent multi-lineage differentiation potential toward chondrocytes, adipocytes, and osteocytes(data not shown).
Human skeletal muscle cells (SKMC) were purchased from PromoCell (Heidelberg, Germany)and then cultured in Dulbecco’s Modified Eagle Medium (DMEM) containing 2 mM GlutaMAX, 4.5 g/Lglucose, 1 mM sodium pyruvate (Thermo Fisher Scientific, Waltham, MA, USA) supplementedwith 10% heat-inactivated fetal bovine serum (Thermo Fisher Scientific, Waltham, MA, USA),and 1× antibiotic-antimycotic solution (Thermo Fisher Scientific, Waltham, MA, USA).
All of the cells were cultivated at 37 ◦C in a humidified atmosphere containing 5% CO2 and wereregularly tested for the absence of mycoplasma contamination while using the PCR Mycoplasma TestKit I/C (PromoCell, Heidelberg, Germany).
2.5. Ultrastructure Analysis
For electron microscopy, SRH cells were trypsinized and then washed twice with pre-warmedPBS. After centrifugation, the cell pellet was fixed with Karnovsky fixative (3% paraformaldehydeand 3.6% glutaraldehyde in 0.1 M sodium cacodylate buffer, Merck, Darmstadt, Germany) for 30 min.at room temperature and stored at 4 ◦C. Post-fixation was based on 1.0% osmium tetroxide containing1.5% potassium ferrocyanide for 2 h. According to standard methods, the blocks were embedded inglycidyl ether and cut while using an ultramicrotome (Ultracut, Reichert, Vienna, Austria). Ultra-thinsections (30 nm) were mounted on copper grids and analyzed using a Zeiss LIBRA 120 transmissionelectron microscope (Zeiss, Oberkochen, Germany) operating at 120 kV.
2.6. Proliferation Kinetics
The SRH cells were seeded into a 96-well plate at densities ranging from 2500 cells to 312 cellsper well in two-fold dilutions (six wells each) and then cultivated for 24 h before starting bright fieldimage acquisition and data analysis. The cells were counted daily over a period of seven days usingthe Celigo® S Imaging Cytometer (Nexcelom Bioscience, Lawrence, MA, USA). A growth curve wasplotted by algorithms of the raw data images and cell population doubling time was calculated.
2.7. Cell Cycle Analysis
The SRH cells were seeded into a 48-well plate at a density of 1 × 10⁴ cells per well and they werecultivated for 24 h. The proliferating cells were labeled with 10 µM EdU for 4 h, harvested and stainedaccording to the protocol for the Click-iT™ EdU Alexa Fluor 647 Flow Cytometry Assay Kit (ThermoFisher Scientific, Waltham, MA, USA). FxCycle™ PI/RNase Staining Solution (Thermo Fisher Scientific,Waltham, MA, USA) was used for the staining of cellular DNA before analyzing the cells by flowcytometry (BD FACSCanto™ II Cell Analyzer, BD Biotechnologies) for cell cycle distribution.
2.8. Multicolor Fluorescence In Situ Hybridization (mFISH) and Chromosomal Breakpoint Analysis
Multicolor fluorescence in situ hybridization (mFISH) analysis was carried out on metaphaseslides while using a human chromosome-specific mFISH kit (MetaSystems, Altlussheim, Germany).The mFISH procedure was performed according to the manufacturers’ instructions and as previouslydescribed [33]. Fluorochromes were sequentially captured using specific single-band pass filters ina Zeiss Axioplan 2 microscope (Zeiss, Oberkochen, Germany). mFISH ISIS software (MetaSystems,Altlussheim, Germany) was used for image analysis. At least five metaphases were analyzed.The karyotype was described according to the International System of Human CytogeneticNomenclature (ISCN) 2016. Chromosomal breakpoints were determined by G-banding analysiswhile using a standard protocol according to the ISCN nomenclature. The CyDAS software package(http://www.cydas.org/OnlineAnalysis/) was used to extract chromosomal gains and losses as well asbreakpoints from the karyotype.
Cells 2020, 9, 2668 5 of 26
2.9. Array-Comparative Genomic Hybridization (CGH) Analysis
Array-based comparative genomic hybridization (array-CGH) was performed by Miltenyi Biotec(Bergisch Gladbach, Germany) while using an Agilent Human Genome CGH Microarray 244K (AgilentTechnologies, Waldbronn, Germany) consisting of 244,000 in situ synthesized 60-mer oligonucleotidesspanning the entire human genome with an average probe spacing of 6.5 kb.
Genomic DNA of the SRH cell line and a female reference DNA (Promega, Mannheim, Germany)for control were labeled with Cy5-dCTP and Cy3-dCTP, respectively, and then hybridized to anoligonucleotide microarray, according to the Agilent oligonucleotide array-based CGH for genomicDNA analysis protocol v5.0 while using the Agilent Oligo aCGH Hybridization Kit. The fluorescencesignals of the hybridized microarray were detected using Agilent’s DNA microarray scanner.The Agilent Feature Extraction software was used in order to read out and process the microarrayimage file. Further analysis and the visualization of the hybridization result were performed with theAgilent CGH Analytics software v3.4 with the following aberration filter settings: a minimum numberof probes present in an aberrant region = 2; minimum absolute average log2 ratio for region = 0.4corresponding to a-fold change of 1.32; and, the ADM-2 algorithm was used for statistical analysis.
2.10. Ingenuity Pathway Analysis
Ingenuity pathway analysis (IPA, Qiagen, Hilden, Germany) was performed in order to determinethe possible interactions of gene products that are located in chromosomal regions with gains or losses,as identified by array-CGH, according to the manufacturer’s instructions.
2.11. DNA Preparation
Genomic DNA was isolated from the original primary tumor tissue, the established SRH cellline, and tumor xenografts while using the QiaAmp DNA Blood Mini Kit (Qiagen, Hilden, Germany).A NanoDrop™ 2000 microvolume spectrophotometer (Thermo Fisher Scientific, Waltham, MA, USA)was used in order to quantify and assess purity of DNA.
2.12. Mutation Analysis
Mutation analysis was performed for TP53 (exons 4–9) and MYOD1 (exon 1). Primers for thedetection of the MYOD1 p.L122R hot spot mutation were used according to Agaram et al. [17].The primers for TP53 were used according to Das et al. [34]. The direct sequencing of DNA ampliconswas performed on an ABI 3130xl Genetic Analyzer while using a BigDye Terminator v3.1 CycleSequencing Kit (Thermo Fisher Scientific, Waltham, MA, USA). The sequences were analyzed usingChromas-Pro v2.6.6 software (Technelysium Pty Ltd., South Brisbane, Australia) and verified againstsequences of human TP53 and MYOD1 deposited at the National Center for Biotechnology Information(NCBI) USA for reference.
2.13. RNA Isolation and Quantitative Real Time PCR
The total RNA was extracted from the newly established SRH cell line and human SKMC whileusing the RNeasy Plus Kit (Qiagen). The purity and concentration of RNA was analyzed with aNanoDrop™ 2000 microvolume spectrophotometer (Thermo Fisher Scientific, Waltham, MA, USA).Random-primed cDNA was synthesized from 1.0 µg of total RNA while using the SuperScript™VILO™ cDNA Synthesis Kit (Thermo Fisher Scientific, Waltham, MA, USA), according to themanufacturer’s instructions.
The following qRT-PCR primers were used, as previously published: fatty acid binding protein 4(FABP4) Köllmer et al. [35] and osteopontin (OPN) Wang-Rodriguez et al. [36].
Additional primer pairs that were purchased from Eurofins Genomics (Ebersberg, Germany,see Table 1) were designed with the Primer-BLAST software (National Center for Biotechnology
Cells 2020, 9, 2668 6 of 26
Information, NCBI), employing common design parameters. The specificity of the amplicons waschecked in silico while using the BLAT (UCSC Genome Browser) and BLAST (NCBI) alignment tools.
Table 1. Quantitative real time PCR (RT-PCR) primer sequences.
Primer Sequence (5′–3′)
TBP for TGCACAGGAGCCAAGAGTGAATBP rev CACATCACAGCTCCCCACCA
YWHAZ for ACCGTTACTTGGCTGAGGTTGCYWHAZ rev CCCAGTCTGATAGGATGTGTTGGABCB1 for GCTGTCAAGGAAGCCAATGCCTABCB1 rev TGCAATGGCGATCCTCTGCTTCABCC1 for CCGTGTACTCCAACGCTGACATABCC1 rev ATGCTGTGCGTGACCAAGATCCABCG2 for GTTCTCAGCAGCTCTTCGGCTTABCG2 rev TCCTCCAGACACACCACGGATA
ALDH1A1 for CGGGAAAAGCAATCTGAAGAGGGALDH1A1 rev GATGCGGCTATACAACACTGGC
BMI1 for GGTACTTCATTGATGCCACAACCBMI1 rev CTGGTCTTGTGAACTTGGACATCKLF4 for CATCTCAAGGCACACCTGCGAAKLF4 rev TCGGTCGCATTTTTGGCACTGGLIN28 for CCAGTGGATGTCTTTGTGCACCLIN28 rev GTGACACGGATGGATTCCAGACMSI1 for GCTCAGCCAAAGGAGGTGATGTMSI1 rev GCGTAGGTTGTGGCTTGGAAACMYC for CCTGGTGCTCCATGAGGAGACMYC rev CAGACTCTGACCTTTTGCCAGGMYF5 for CAGTCCTGTCTGGTCCAGAAAGMYF5 rev GTCCACTATGTTGGATAAGCAATCMYF6 for CCCTTCAGCTACAGACCCAAACMYF6 rev TCCTTAGCCGTTATCACGAGCCMYOD for CTCCAACTGCTCCGACGGCATMYOD rev ACAGGCAGTCTAGGCTCGACACMYOG for AGTGCCATCCAGTACATCGAGCMYOG rev AGGCGCTGTGAGAGCTGCATTCMYMK for ATGCGTCACGACATCCTGGAGTMYMK rev CAATGGTCAGGACGCCGAACATNANOG for CTCCAACATCCTGAACCTCAGCNANOG rev CGTCACACCATTGCTATTCTTCGPOU5F1 for CCTGAAGCAGAAGAGGATCACCPOU5F1 rev AAAGCGGCAGATGGTCGTTTGGPROM1 for CACTACCAAGGACAAGGCGTTCPROM1 rev CAACGCCTCTTTGGTCTCCTTG
SOX2 for GCTACAGCATGATGCAGGACCASOX2 rev TCTGCGAGCTGGTCATGGAGTTTANC1 for GTGTGTCTGCTGACCAAGAAGGTANC1 rev GACCACTCACAAGTCAGCAGGT
Gene expression analysis was performed by quantitative real time PCR (qRT-PCR) whileusing gene-specific primers and the SYBR Select Master Mix for CFX (Thermo Fisher Scientific,Waltham, MA, USA) on a CFX96 Real-Time PCR Detection System (Bio-Rad Laboratories,Hercules, CA, USA). For data analysis, the CFX Maestro™ software v2.0 (Bio-Rad Laboratories,Hercules, CA, USA) was used and the relative expression levels were calculated with the 2−∆∆Ct
method according to Livak et al. 2001 [37], with TATA box binding protein (TBP) or tyrosine3-monooxygenase/tryptophan 5-monooxygenase activation protein zeta (YWHAZ) as a referencegene [38].
Cells 2020, 9, 2668 7 of 26
2.14. Flow Cytometry Analysis of Cell Surface Markers
The cells were detached while using Accutase® (Stemcell Technologies, Vancouver, BC, Canada),washed twice in PBS, and then stained with fluorochrome-conjugated antibodies (using the antibodyconcentrations recommended by the manufacturer) in FACS buffer that is composed of PBSsupplemented with 2% FBS and 2 mM EDTA for 15 min. at 4 ◦C. After centrifugation at 300× g for5 min. at 4 ◦C, the cells were washed twice with cold FACS buffer before being subjected to flowcytometry. Cell analysis was performed on a BD FACSCanto™ II (BD Biosciences) flow cytometer whileusing BD FACSDIVA™ software v8.0.1 (BD Biosciences, Franklin Lakes, NJ, USA). FlowJo™ softwarev10.0.8 (BD Biosciences, Franklin Lakes, NJ, USA) was used for data analysis.
Antibodies against cell surface markers reflecting distinct cell fates and stages in the mesenchymaland/or hematopoietic lineage were used for cell labeling: CD10-PE (clone HI10a, BD Biosciences,Franklin Lakes, NJ, USA), CD14-PE (clone U52E, BD Biosciences, Franklin Lakes, NJ, USA), CD19-APC(clone HIB19, BioLegend, San Diego, CA, USA), CD34-APC (clone 581, BioLegend, San Diego, CA, USA),CD44-APC (clone BJ18, BioLegend, San Diego, CA, USA), CD45-APC (clone 5B1, Miltenyi Biotech,Bergisch-Gladbach, Germany), CD73-APC (clone AD2, BioLegend, San Diego, CA, USA), CD90-PE (clone5E10, BioLegend, San Diego, CA, USA), CD105-PE (clone 5N6, eBioscience, San Diego, CA, USA),CD146-PE (clone P1H12, BioLegend, San Diego, CA, USA), and CD166-PE (clone 3A6, eBioscience,San Diego, CA, USA). Matching isotype controls were included in each experiment.
2.15. Tumor Sphere Formation Assay
SRH single cell suspensions that were generated by trypsin-EDTA dissociation were prepared forsphere formation assays. The cells were seeded in NeuroCult™ NS-A Proliferation Medium (StemcellTechnologies, Vancouver, BC, Canada), supplemented with 20 ng/mL recombinant human EGF(Miltenyi Biotech Bergisch Gladbach, Germany), 10 ng/mL recombinant human bFGF (Miltenyi BiotechBergisch Gladbach, Germany), and 2 µg/mL heparin (Stemcell Technologies, Vancouver, BC, Canada)at a density of 10–1000 cells/well in Nunclon Sphera™ ultra-low attachment flat bottom 96-well plates(Thermo Fisher Scientific, Waltham, MA, USA). SRH spheres were cultured at 37 ◦C in humidifiedair containing 5% CO2 for seven days before being scored with the Celigo® S Imaging Cytometer(Nexcelom Bioscience, Lawrence, MA, USA). The sphere forming efficiency (%) was calculated as thenumber of tumor spheres divided by number of cells seeded × 100.
2.16. Osteogenic and Adipogenic Differentiation
SRH cells were maintained in osteogenic and adipogenic differentiation media for 21 days.The osteogenic induction medium consisted of DMEM high glucose (4.5 g/L), supplemented with 10%fetal bovine serum, 0.1 µM dexamethasone, 10 mM β-glycerol phosphate, and 50 µM L-ascorbic acid(Merck, Darmstadt, Germany). Adipogenic differentiation medium was purchased from PromoCell(Heidelberg, Germany). Alizarin Red S (Carl Roth, Karlsruhe, Germany) and Oil Red O (Thermo FisherScientific, Waltham, MA, USA) were utilized according to the manufacturer’s instructions to depictosteogenic and adipogenic differentiation, respectively.
Intracellular lipid accumulation after adipogenic differentiation was detected by staining withthe HCS LipidTOX™ Green neutral lipid stain (Thermo Fisher Scientific, Waltham, MA, USA),according to the manufacturer’s instructions. The cells were mounted in VectaShield® HardSet™antifade mounting medium with 4′,6-diamidino-2-phenylindole (DAPI) (Vector Laboratories,Burlingame, CA, USA), before being visualized while using an Axio Imager Z1 phase contrastfluorescence microscope (Zeiss, Oberkochen, Germany) that was equipped with an AxioCam MRmcamera (Zeiss, Oberkochen, Germany) and AxioVision software v4.8 (Zeiss, Oberkochen, Germany).Cell differentiation and staining was performed in three independent experiments with a representativeimage shown.
Cells 2020, 9, 2668 8 of 26
2.17. Tumorigenicity in Mice
Animal experiments were performed with the authorization of the Institutional Animal Careand Use Committee of the University of Tuebingen, according to German federal and stateregulations (approval no. M04/09). Female NOD/SCID/γc
null (NSG) mice (n = 3), six weeks ofage, were subcutaneously inoculated with 5 × 10⁶ SRH tumor cells in cold Matrigel™ (BD Biosciences,Franklin Lakes, NJ, USA). The mice were sacrificed after 8–10 weeks when the tumors had reached amaximum volume of 1000 mm3.
2.18. Assessment of Cell Line Identity
DNA profiling was performed for the verification of human cell line identity between the originalprimary tumor tissue from the patient, the established SRH cell line, and a tumor xenograft of SRHcells that were propagated in NOD/SCID/γc
null mice while using the StemElite™ ID System (Promega,Mannheim, Germany). DNA was extracted and amplified according to the manufacturer’s instructions.The StemElite™ ID System uses short tandem repeat (STR) analysis of specific loci in the humangenome through co-amplification and three-color detection of ten loci: nine autosomal loci (D21S11,TH01, TPOX, vWA, CSF1P0, D16S539, D7S820, D13S317, D5S818) and amelogenin (AMEL) for genderidentification. Additionally, the StemElite™ ID System includes a sensitive marker that specificallydetects the presence of DNA from mouse (Mus musculus). Electrophoretic analysis was carried out whileusing a performance optimized polymer (POP-4TM) with an ABI 3130xl Genetic Analyzer (AppliedBiosystems, Foster City, CA, USA). Each electrophoretic run was analyzed with the GeneMapperv4.0 software (Applied Biosystems, Waltham, MA, USA) and then compared with the StemElite™ IDallelic ladders.
The resulting STR profiles were compared with cell lines in public databases, including theAmerican Type Tissue Culture Collection (ATCC), the Children’s Oncology Group (COG) Cell Cultureand Xenograft Repository, the Deutsche Sammlung von Mikroorganismen und Zellkulturen (DMSZ),and the Japanese Collection of Research Bioresources (JCRB) while using the Cell Line IntegratedMolecular Authentication Database (CLIMA) 2.1.
3. Results
3.1. Histopathology and Immunohistochemistry of the Original Tumor
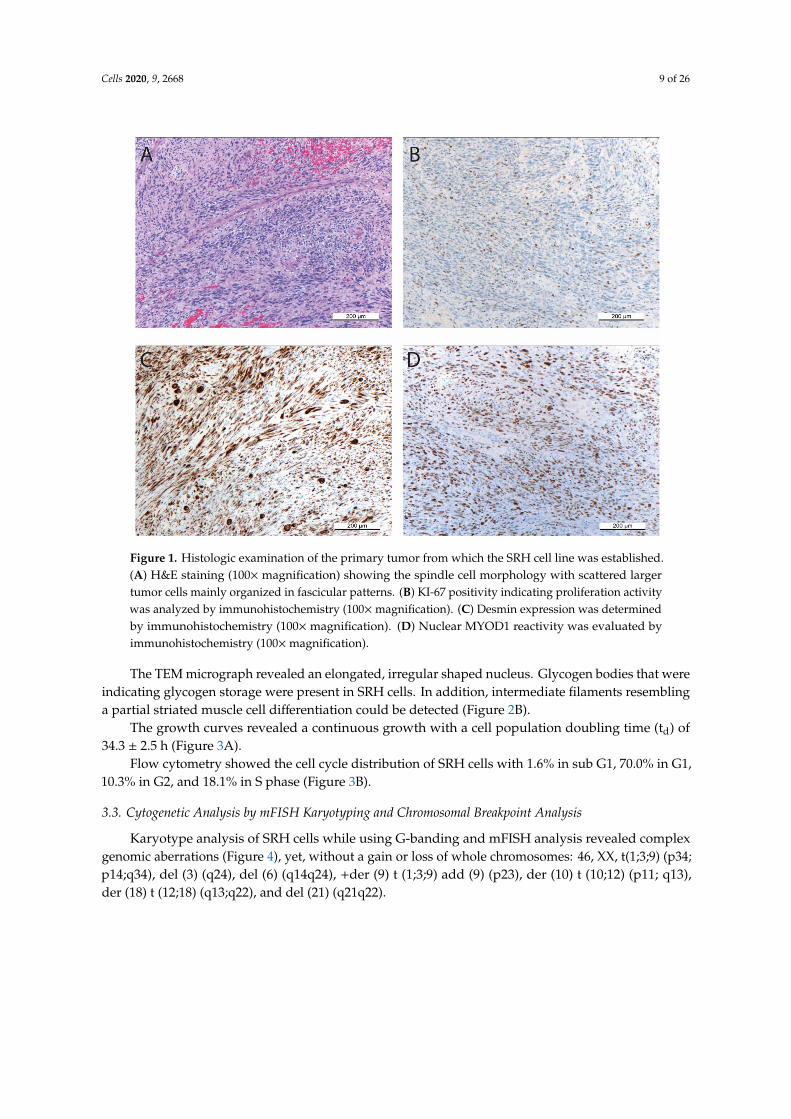
The primary tumor from which the SRH cell line was established predominantly consisted ofspindle cell parts with scattered larger tumor cells in a sclerosing matrix (Figure 1A).
Despite multimodal chemotherapeutic pretreatment, up to five mitoses were detectable perHPF. The proliferation activity was also confirmed by Ki-67 positivity (Figure 1B) in 10–20% ofcells. Desmin and MYOD1 positivity (Figure 1C,D) of most cells, irrespective of their morphology,indicated the myogenic origin of the tumor.
3.2. Morphology of the SRH Cell Line and Growth Characteristics
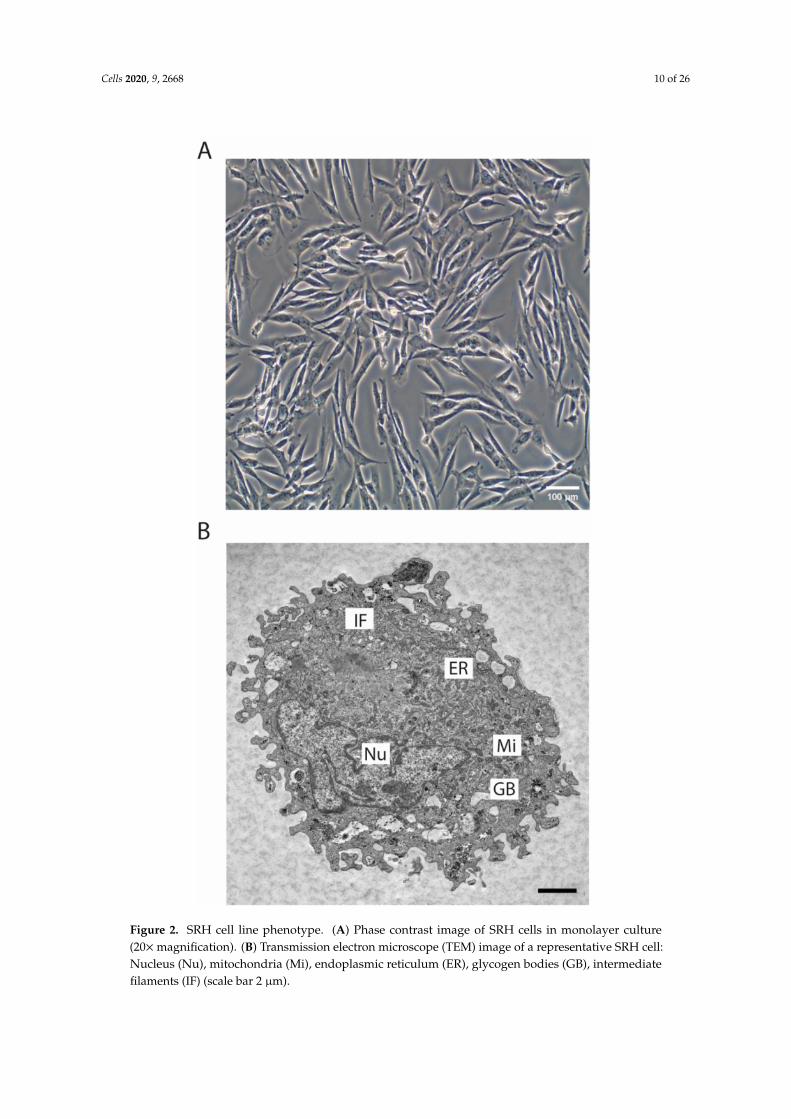
The SRH cell line was established as outgrowth culture of the original primary tumor. The phasecontrast image (Figure 2A) showed the spindle cell morphology of the SRH cell line that was propagatedas monolayer culture.
Cells 2020, 9, 2668 9 of 26
Figure 1. Histologic examination of the primary tumor from which the SRH cell line was established.(A) H&E staining (100× magnification) showing the spindle cell morphology with scattered largertumor cells mainly organized in fascicular patterns. (B) KI-67 positivity indicating proliferation activitywas analyzed by immunohistochemistry (100×magnification). (C) Desmin expression was determinedby immunohistochemistry (100× magnification). (D) Nuclear MYOD1 reactivity was evaluated byimmunohistochemistry (100×magnification).
The TEM micrograph revealed an elongated, irregular shaped nucleus. Glycogen bodies that wereindicating glycogen storage were present in SRH cells. In addition, intermediate filaments resemblinga partial striated muscle cell differentiation could be detected (Figure 2B).
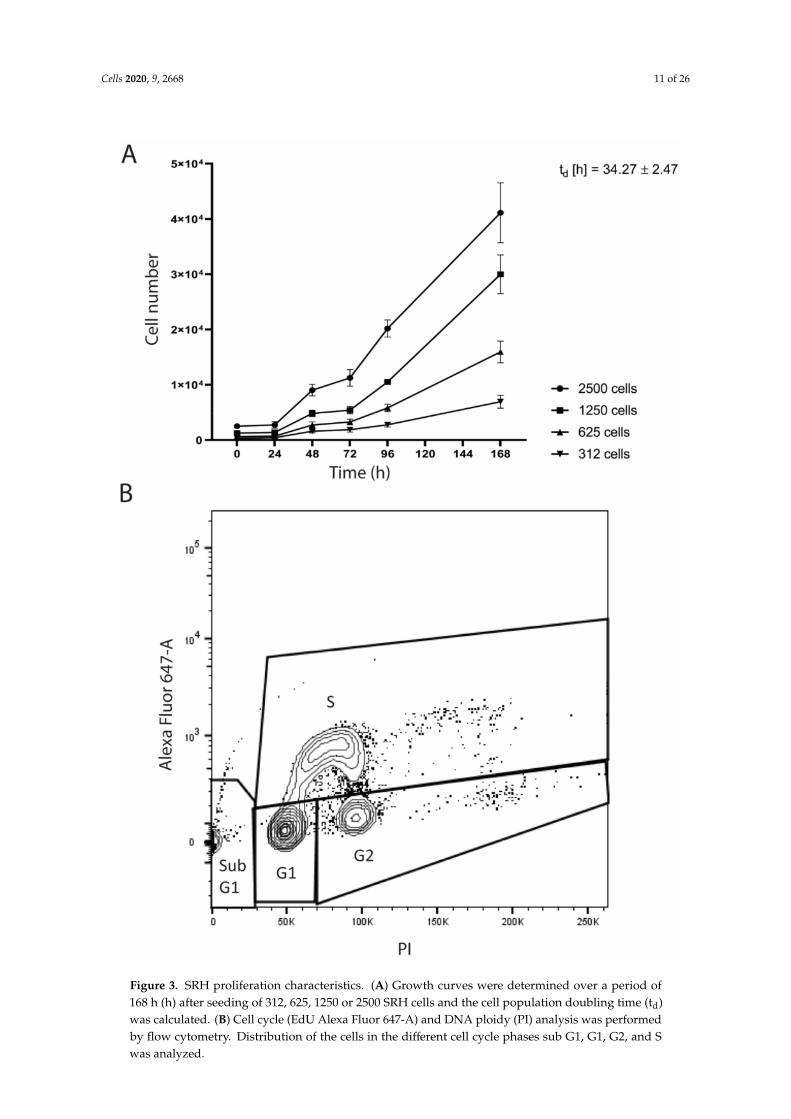
The growth curves revealed a continuous growth with a cell population doubling time (td) of34.3 ± 2.5 h (Figure 3A).
Flow cytometry showed the cell cycle distribution of SRH cells with 1.6% in sub G1, 70.0% in G1,10.3% in G2, and 18.1% in S phase (Figure 3B).
3.3. Cytogenetic Analysis by mFISH Karyotyping and Chromosomal Breakpoint Analysis
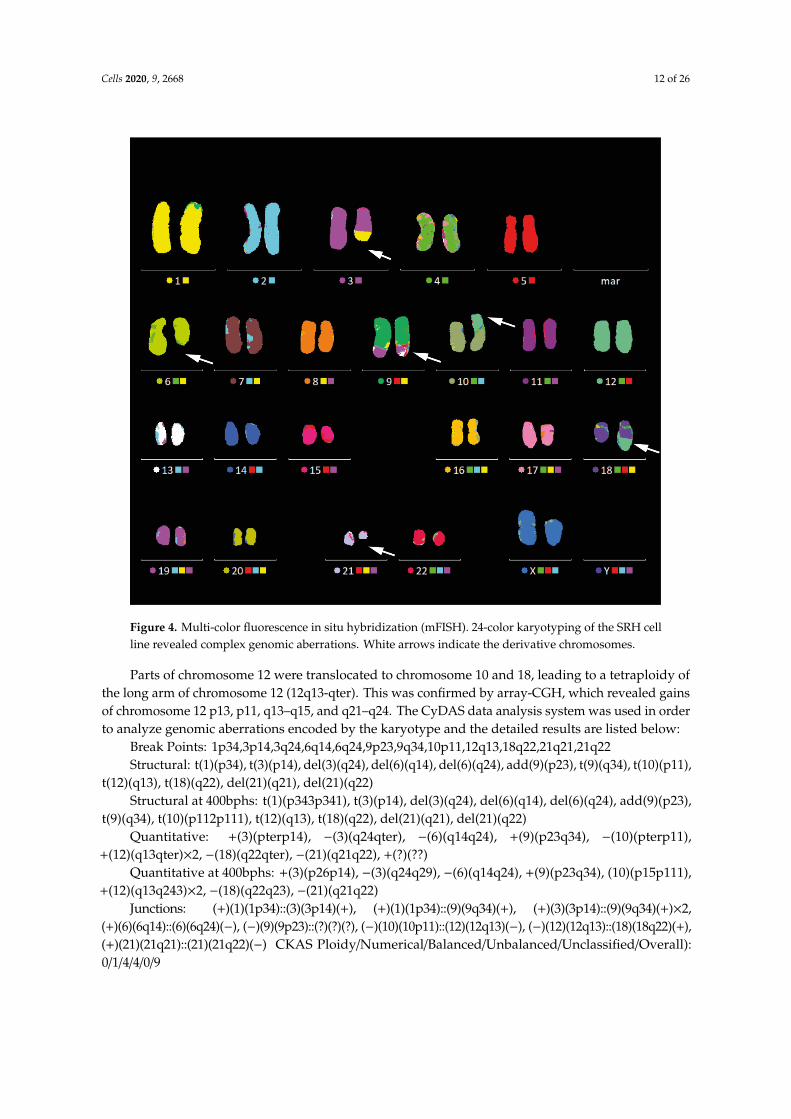
Karyotype analysis of SRH cells while using G-banding and mFISH analysis revealed complexgenomic aberrations (Figure 4), yet, without a gain or loss of whole chromosomes: 46, XX, t(1;3;9) (p34;p14;q34), del (3) (q24), del (6) (q14q24), +der (9) t (1;3;9) add (9) (p23), der (10) t (10;12) (p11; q13),der (18) t (12;18) (q13;q22), and del (21) (q21q22).
Cells 2020, 9, 2668 10 of 26
Figure 2. SRH cell line phenotype. (A) Phase contrast image of SRH cells in monolayer culture(20×magnification). (B) Transmission electron microscope (TEM) image of a representative SRH cell:Nucleus (Nu), mitochondria (Mi), endoplasmic reticulum (ER), glycogen bodies (GB), intermediatefilaments (IF) (scale bar 2 µm).
Cells 2020, 9, 2668 11 of 26
Figure 3. SRH proliferation characteristics. (A) Growth curves were determined over a period of168 h (h) after seeding of 312, 625, 1250 or 2500 SRH cells and the cell population doubling time (td)was calculated. (B) Cell cycle (EdU Alexa Fluor 647-A) and DNA ploidy (PI) analysis was performedby flow cytometry. Distribution of the cells in the different cell cycle phases sub G1, G1, G2, and Swas analyzed.
Cells 2020, 9, 2668 12 of 26
Figure 4. Multi-color fluorescence in situ hybridization (mFISH). 24-color karyotyping of the SRH cellline revealed complex genomic aberrations. White arrows indicate the derivative chromosomes.
Parts of chromosome 12 were translocated to chromosome 10 and 18, leading to a tetraploidy ofthe long arm of chromosome 12 (12q13-qter). This was confirmed by array-CGH, which revealed gainsof chromosome 12 p13, p11, q13–q15, and q21–q24. The CyDAS data analysis system was used in orderto analyze genomic aberrations encoded by the karyotype and the detailed results are listed below:
Break Points: 1p34,3p14,3q24,6q14,6q24,9p23,9q34,10p11,12q13,18q22,21q21,21q22Structural: t(1)(p34), t(3)(p14), del(3)(q24), del(6)(q14), del(6)(q24), add(9)(p23), t(9)(q34), t(10)(p11),
t(12)(q13), t(18)(q22), del(21)(q21), del(21)(q22)Structural at 400bphs: t(1)(p343p341), t(3)(p14), del(3)(q24), del(6)(q14), del(6)(q24), add(9)(p23),
t(9)(q34), t(10)(p112p111), t(12)(q13), t(18)(q22), del(21)(q21), del(21)(q22)Quantitative: +(3)(pterp14), −(3)(q24qter), −(6)(q14q24), +(9)(p23q34), −(10)(pterp11),
+(12)(q13qter)×2, −(18)(q22qter), −(21)(q21q22), +(?)(??)Quantitative at 400bphs: +(3)(p26p14), −(3)(q24q29), −(6)(q14q24), +(9)(p23q34), (10)(p15p111),
+(12)(q13q243)×2, −(18)(q22q23), −(21)(q21q22)Junctions: (+)(1)(1p34)::(3)(3p14)(+), (+)(1)(1p34)::(9)(9q34)(+), (+)(3)(3p14)::(9)(9q34)(+)×2,
(+)(6)(6q14)::(6)(6q24)(−), (−)(9)(9p23)::(?)(?)(?), (−)(10)(10p11)::(12)(12q13)(−), (−)(12)(12q13)::(18)(18q22)(+),(+)(21)(21q21)::(21)(21q22)(−) CKAS Ploidy/Numerical/Balanced/Unbalanced/Unclassified/Overall):0/1/4/4/0/9
Cells 2020, 9, 2668 13 of 26
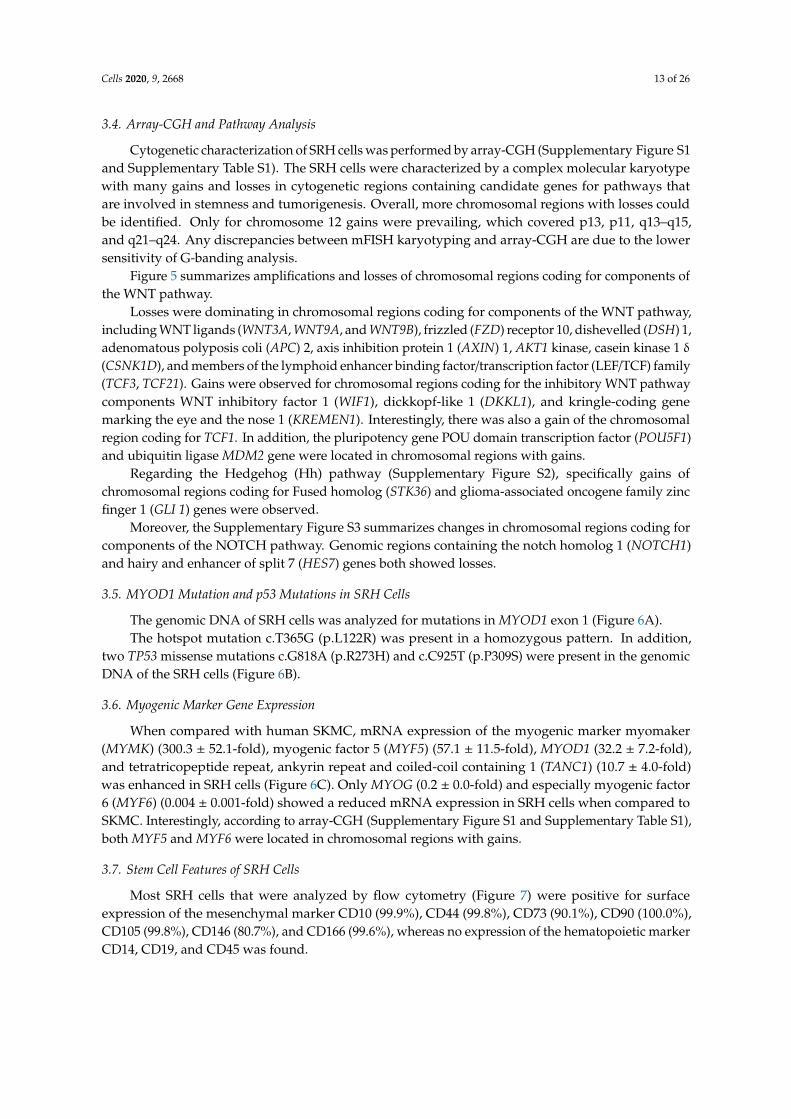
3.4. Array-CGH and Pathway Analysis
Cytogenetic characterization of SRH cells was performed by array-CGH (Supplementary Figure S1and Supplementary Table S1). The SRH cells were characterized by a complex molecular karyotypewith many gains and losses in cytogenetic regions containing candidate genes for pathways thatare involved in stemness and tumorigenesis. Overall, more chromosomal regions with losses couldbe identified. Only for chromosome 12 gains were prevailing, which covered p13, p11, q13–q15,and q21–q24. Any discrepancies between mFISH karyotyping and array-CGH are due to the lowersensitivity of G-banding analysis.
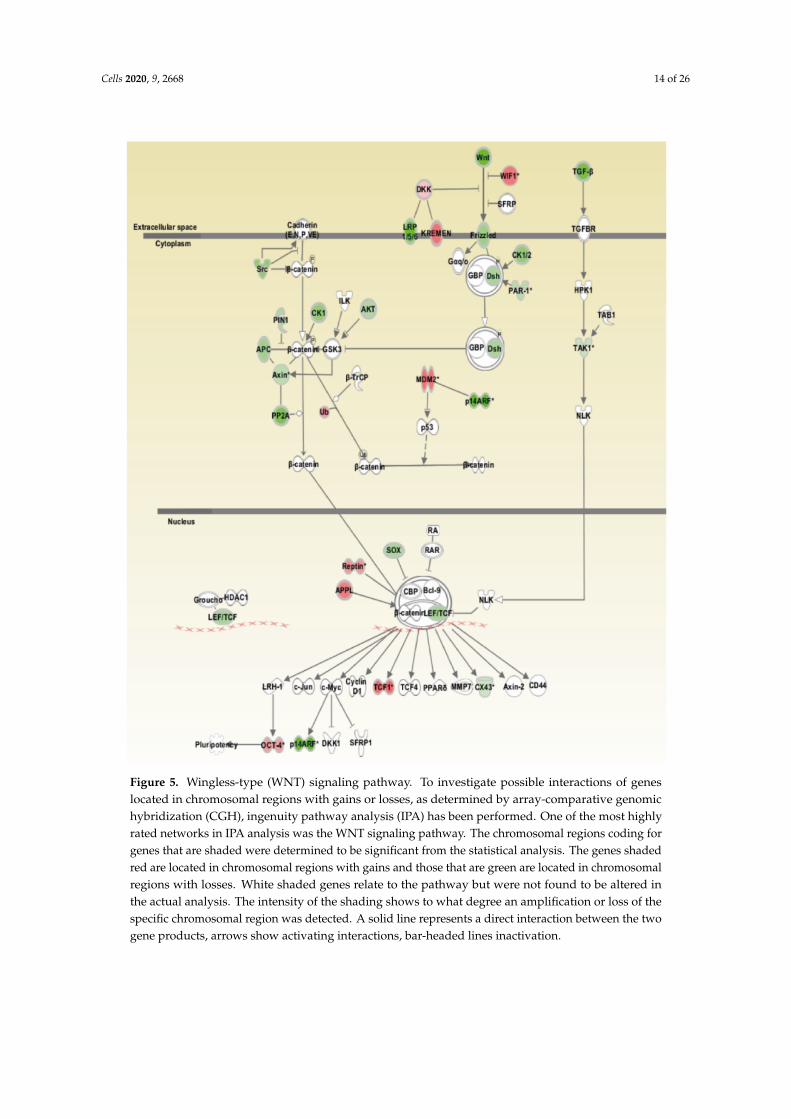
Figure 5 summarizes amplifications and losses of chromosomal regions coding for components ofthe WNT pathway.
Losses were dominating in chromosomal regions coding for components of the WNT pathway,including WNT ligands (WNT3A, WNT9A, and WNT9B), frizzled (FZD) receptor 10, dishevelled (DSH) 1,adenomatous polyposis coli (APC) 2, axis inhibition protein 1 (AXIN) 1, AKT1 kinase, casein kinase 1 δ
(CSNK1D), and members of the lymphoid enhancer binding factor/transcription factor (LEF/TCF) family(TCF3, TCF21). Gains were observed for chromosomal regions coding for the inhibitory WNT pathwaycomponents WNT inhibitory factor 1 (WIF1), dickkopf-like 1 (DKKL1), and kringle-coding genemarking the eye and the nose 1 (KREMEN1). Interestingly, there was also a gain of the chromosomalregion coding for TCF1. In addition, the pluripotency gene POU domain transcription factor (POU5F1)and ubiquitin ligase MDM2 gene were located in chromosomal regions with gains.
Regarding the Hedgehog (Hh) pathway (Supplementary Figure S2), specifically gains ofchromosomal regions coding for Fused homolog (STK36) and glioma-associated oncogene family zincfinger 1 (GLI 1) genes were observed.
Moreover, the Supplementary Figure S3 summarizes changes in chromosomal regions coding forcomponents of the NOTCH pathway. Genomic regions containing the notch homolog 1 (NOTCH1)and hairy and enhancer of split 7 (HES7) genes both showed losses.
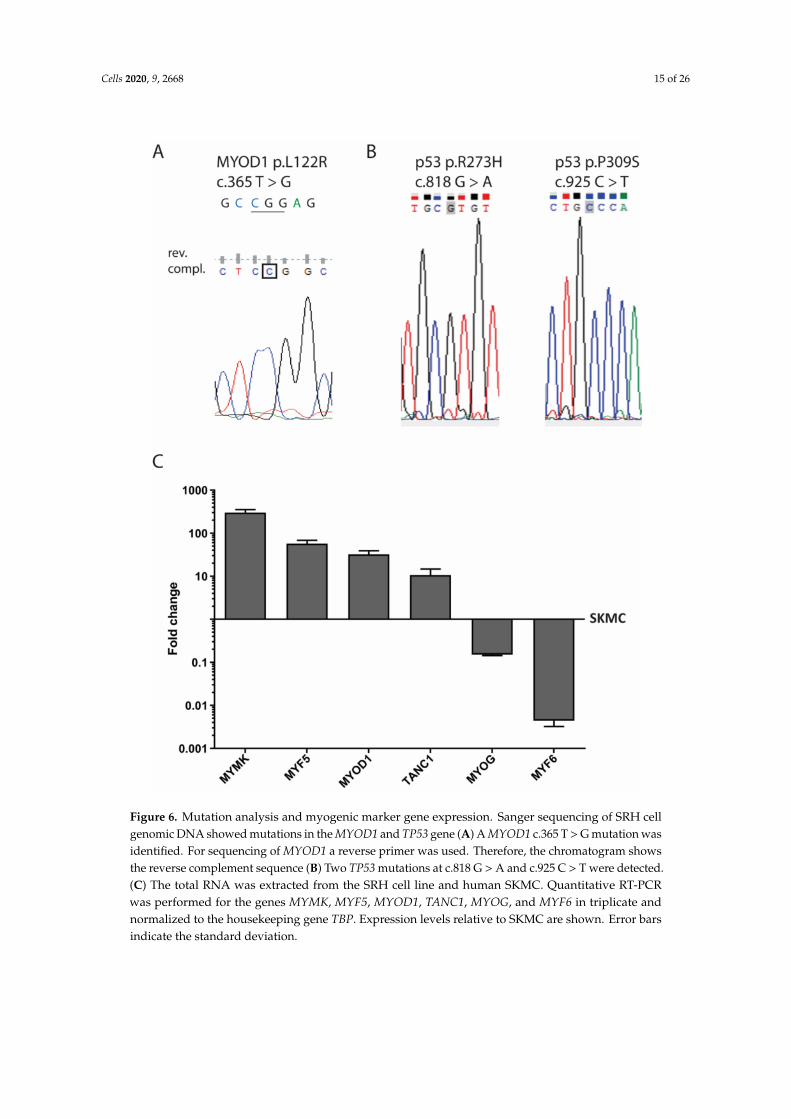
3.5. MYOD1 Mutation and p53 Mutations in SRH Cells
The genomic DNA of SRH cells was analyzed for mutations in MYOD1 exon 1 (Figure 6A).The hotspot mutation c.T365G (p.L122R) was present in a homozygous pattern. In addition,
two TP53 missense mutations c.G818A (p.R273H) and c.C925T (p.P309S) were present in the genomicDNA of the SRH cells (Figure 6B).
3.6. Myogenic Marker Gene Expression
When compared with human SKMC, mRNA expression of the myogenic marker myomaker(MYMK) (300.3 ± 52.1-fold), myogenic factor 5 (MYF5) (57.1 ± 11.5-fold), MYOD1 (32.2 ± 7.2-fold),and tetratricopeptide repeat, ankyrin repeat and coiled-coil containing 1 (TANC1) (10.7 ± 4.0-fold)was enhanced in SRH cells (Figure 6C). Only MYOG (0.2 ± 0.0-fold) and especially myogenic factor6 (MYF6) (0.004 ± 0.001-fold) showed a reduced mRNA expression in SRH cells when compared toSKMC. Interestingly, according to array-CGH (Supplementary Figure S1 and Supplementary Table S1),both MYF5 and MYF6 were located in chromosomal regions with gains.
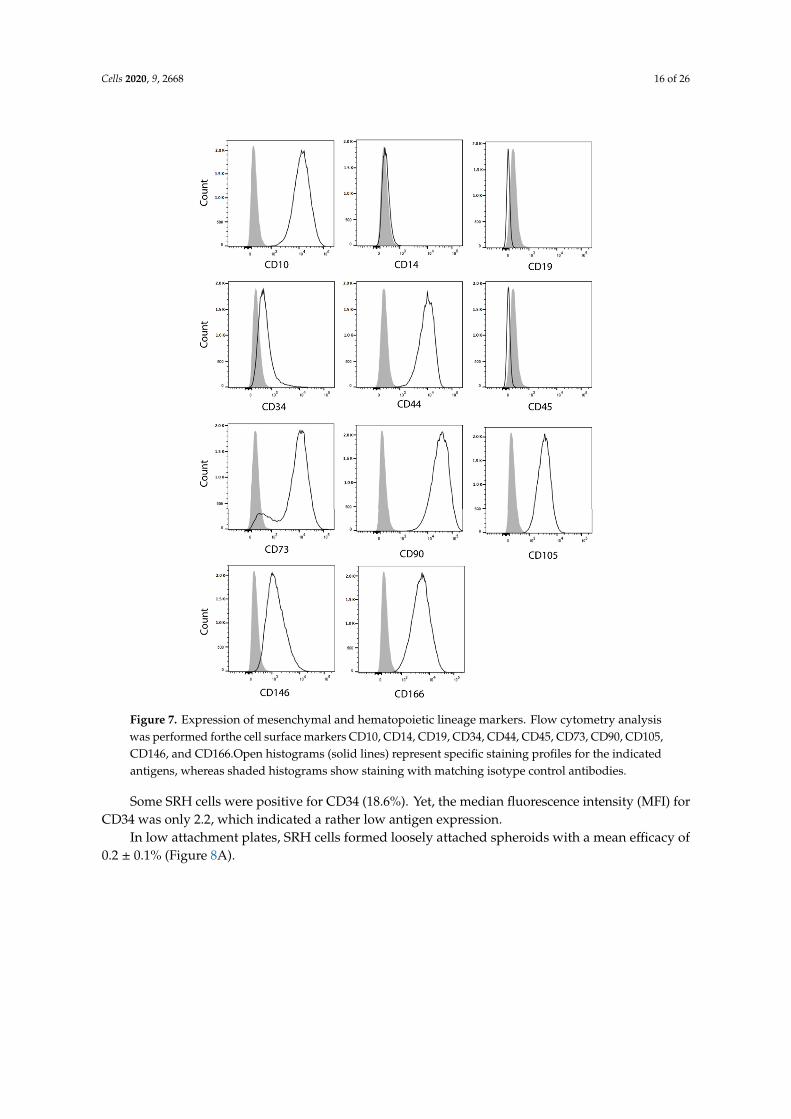
3.7. Stem Cell Features of SRH Cells
Most SRH cells that were analyzed by flow cytometry (Figure 7) were positive for surfaceexpression of the mesenchymal marker CD10 (99.9%), CD44 (99.8%), CD73 (90.1%), CD90 (100.0%),CD105 (99.8%), CD146 (80.7%), and CD166 (99.6%), whereas no expression of the hematopoietic markerCD14, CD19, and CD45 was found.
Cells 2020, 9, 2668 14 of 26
Figure 5. Wingless-type (WNT) signaling pathway. To investigate possible interactions of geneslocated in chromosomal regions with gains or losses, as determined by array-comparative genomichybridization (CGH), ingenuity pathway analysis (IPA) has been performed. One of the most highlyrated networks in IPA analysis was the WNT signaling pathway. The chromosomal regions coding forgenes that are shaded were determined to be significant from the statistical analysis. The genes shadedred are located in chromosomal regions with gains and those that are green are located in chromosomalregions with losses. White shaded genes relate to the pathway but were not found to be altered inthe actual analysis. The intensity of the shading shows to what degree an amplification or loss of thespecific chromosomal region was detected. A solid line represents a direct interaction between the twogene products, arrows show activating interactions, bar-headed lines inactivation.
Cells 2020, 9, 2668 15 of 26
Figure 6. Mutation analysis and myogenic marker gene expression. Sanger sequencing of SRH cellgenomic DNA showed mutations in the MYOD1 and TP53 gene (A) A MYOD1 c.365 T > G mutation wasidentified. For sequencing of MYOD1 a reverse primer was used. Therefore, the chromatogram showsthe reverse complement sequence (B) Two TP53 mutations at c.818 G > A and c.925 C > T were detected.(C) The total RNA was extracted from the SRH cell line and human SKMC. Quantitative RT-PCRwas performed for the genes MYMK, MYF5, MYOD1, TANC1, MYOG, and MYF6 in triplicate andnormalized to the housekeeping gene TBP. Expression levels relative to SKMC are shown. Error barsindicate the standard deviation.
Cells 2020, 9, 2668 16 of 26
Cells 2020, 9, x; doi: www.mdpi.com/journal/cells
Article
Establishment and Characterization of a Sclerosing Spindle Cell Rhabdomyosarcoma Cell Line with a Complex Genomic Profile
Figure 7. Expression of mesenchymal and hematopoietic lineage markers. Flow cytometry analysiswas performed forthe cell surface markers CD10, CD14, CD19, CD34, CD44, CD45, CD73, CD90, CD105,CD146, and CD166.Open histograms (solid lines) represent specific staining profiles for the indicatedantigens, whereas shaded histograms show staining with matching isotype control antibodies.
Some SRH cells were positive for CD34 (18.6%). Yet, the median fluorescence intensity (MFI) forCD34 was only 2.2, which indicated a rather low antigen expression.
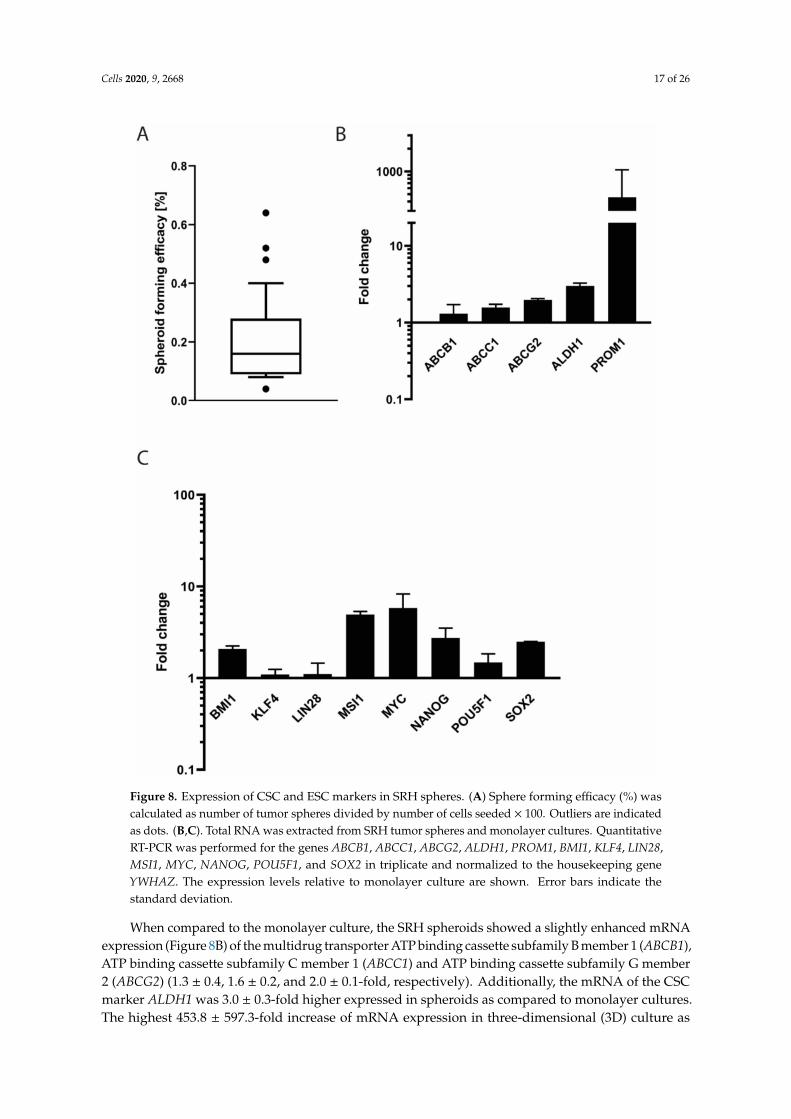
In low attachment plates, SRH cells formed loosely attached spheroids with a mean efficacy of0.2 ± 0.1% (Figure 8A).
Cells 2020, 9, 2668 17 of 26
Figure 8. Expression of CSC and ESC markers in SRH spheres. (A) Sphere forming efficacy (%) wascalculated as number of tumor spheres divided by number of cells seeded × 100. Outliers are indicatedas dots. (B,C). Total RNA was extracted from SRH tumor spheres and monolayer cultures. QuantitativeRT-PCR was performed for the genes ABCB1, ABCC1, ABCG2, ALDH1, PROM1, BMI1, KLF4, LIN28,MSI1, MYC, NANOG, POU5F1, and SOX2 in triplicate and normalized to the housekeeping geneYWHAZ. The expression levels relative to monolayer culture are shown. Error bars indicate thestandard deviation.
When compared to the monolayer culture, the SRH spheroids showed a slightly enhanced mRNAexpression (Figure 8B) of the multidrug transporter ATP binding cassette subfamily B member 1 (ABCB1),ATP binding cassette subfamily C member 1 (ABCC1) and ATP binding cassette subfamily G member2 (ABCG2) (1.3 ± 0.4, 1.6 ± 0.2, and 2.0 ± 0.1-fold, respectively). Additionally, the mRNA of the CSCmarker ALDH1 was 3.0 ± 0.3-fold higher expressed in spheroids as compared to monolayer cultures.The highest 453.8 ± 597.3-fold increase of mRNA expression in three-dimensional (3D) culture as
Cells 2020, 9, 2668 18 of 26
compared to two-dimensional (2D) culture was found for the CSC marker PROM1, also known asCD133. The embryonic stem cell (ESC) marker (Figure 8C) lymphoma Mo-MLV insertion region1 (BMI1) was expressed 2.1± 0.2-fold when compared to monolayer culture. Almost no differentialmRNA expression compared with the 2D culture was observed for the ESC transcription factorkruppel like factor 4 (KLF4) (1.1 ± 0.2-fold) and the RNA binding protein lin-28 homolog A (LIN28)(1.1 ± 0.3-fold). The musashi RNA binding protein 1 (MSI1) mRNA was expressed 4.9 ± 0.4-fold higherin the spheroids when compared to control. The expression of the mRNA of the proto-oncogene MYCand the pluripotency factors POU5F1, homeobox transcription factor nanog (NANOG), and SOX2 wasincreased 5.8 ± 2.5, 1.5 ± 0.4, 2.7 ± 0.8, and 2.5 ± 0.0-fold, respectively.
3.8. Adipogenic and Osteogenic Differentiation
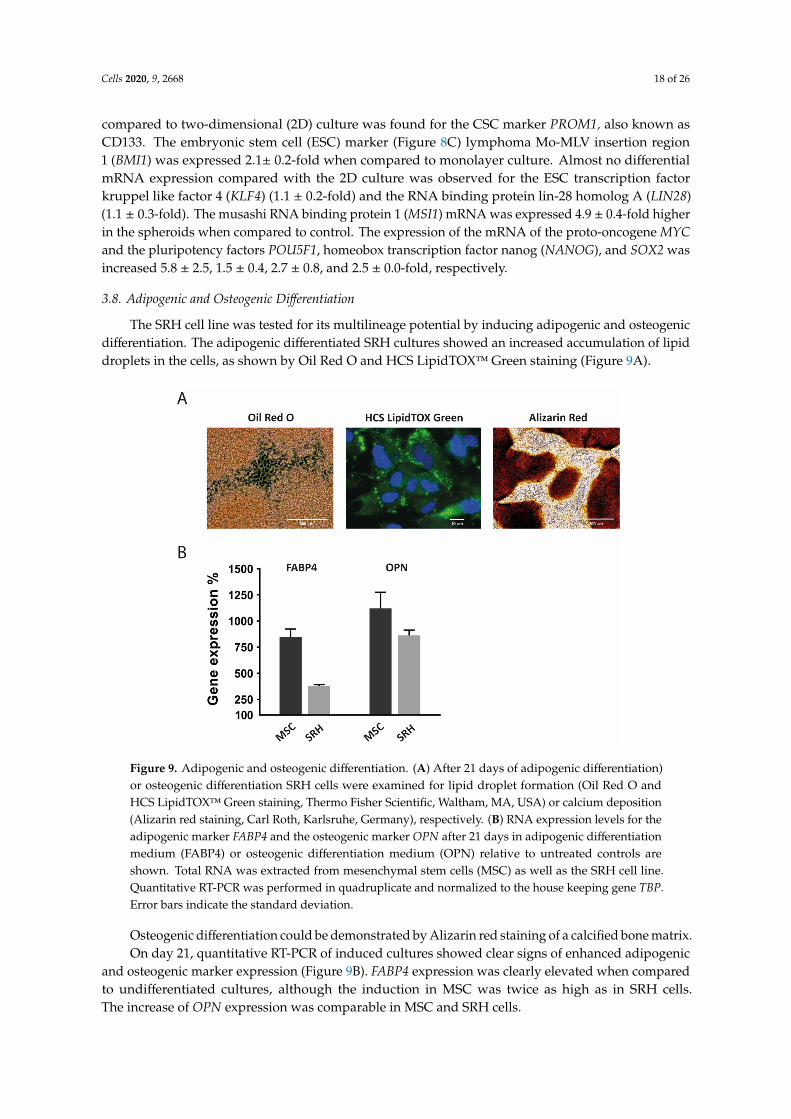
The SRH cell line was tested for its multilineage potential by inducing adipogenic and osteogenicdifferentiation. The adipogenic differentiated SRH cultures showed an increased accumulation of lipiddroplets in the cells, as shown by Oil Red O and HCS LipidTOX™ Green staining (Figure 9A).
Figure 9. Adipogenic and osteogenic differentiation. (A) After 21 days of adipogenic differentiation)or osteogenic differentiation SRH cells were examined for lipid droplet formation (Oil Red O andHCS LipidTOX™ Green staining, Thermo Fisher Scientific, Waltham, MA, USA) or calcium deposition(Alizarin red staining, Carl Roth, Karlsruhe, Germany), respectively. (B) RNA expression levels for theadipogenic marker FABP4 and the osteogenic marker OPN after 21 days in adipogenic differentiationmedium (FABP4) or osteogenic differentiation medium (OPN) relative to untreated controls areshown. Total RNA was extracted from mesenchymal stem cells (MSC) as well as the SRH cell line.Quantitative RT-PCR was performed in quadruplicate and normalized to the house keeping gene TBP.Error bars indicate the standard deviation.
Osteogenic differentiation could be demonstrated by Alizarin red staining of a calcified bone matrix.On day 21, quantitative RT-PCR of induced cultures showed clear signs of enhanced adipogenic
and osteogenic marker expression (Figure 9B). FABP4 expression was clearly elevated when comparedto undifferentiated cultures, although the induction in MSC was twice as high as in SRH cells.The increase of OPN expression was comparable in MSC and SRH cells.
Cells 2020, 9, 2668 19 of 26
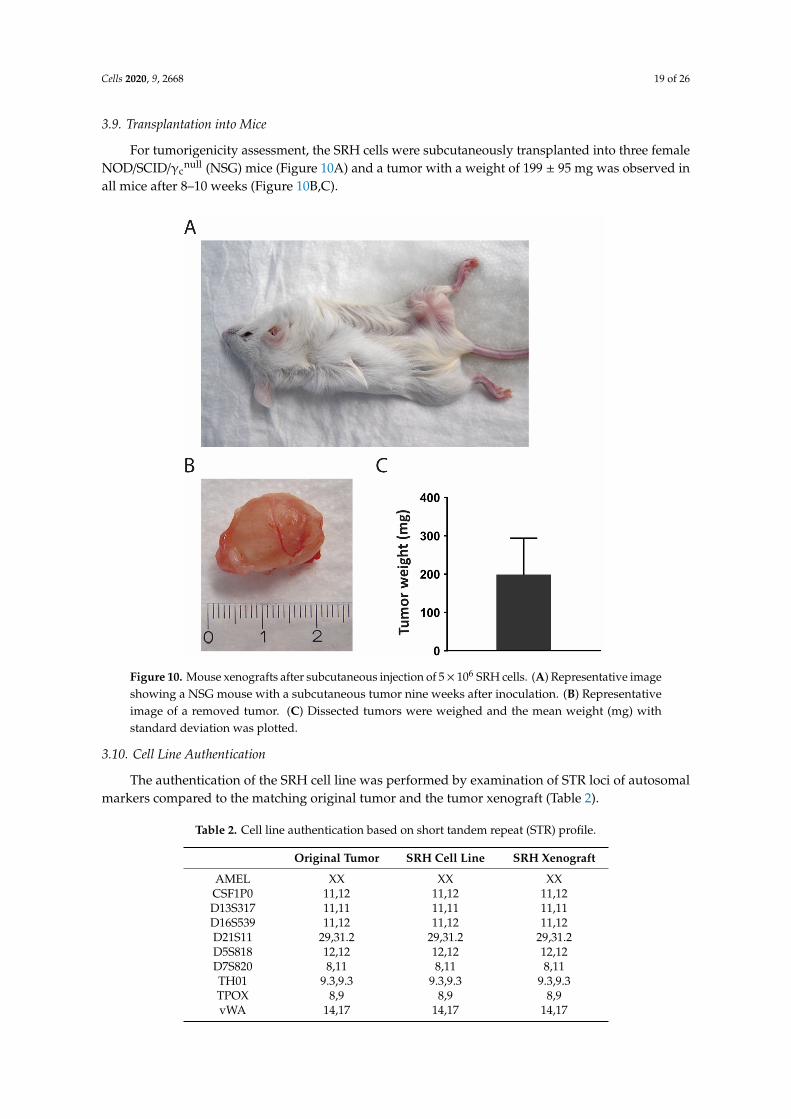
3.9. Transplantation into Mice
For tumorigenicity assessment, the SRH cells were subcutaneously transplanted into three femaleNOD/SCID/γc
null (NSG) mice (Figure 10A) and a tumor with a weight of 199 ± 95 mg was observed inall mice after 8–10 weeks (Figure 10B,C).
Figure 10. Mouse xenografts after subcutaneous injection of 5× 10⁶ SRH cells. (A) Representative imageshowing a NSG mouse with a subcutaneous tumor nine weeks after inoculation. (B) Representativeimage of a removed tumor. (C) Dissected tumors were weighed and the mean weight (mg) withstandard deviation was plotted.
3.10. Cell Line Authentication
The authentication of the SRH cell line was performed by examination of STR loci of autosomalmarkers compared to the matching original tumor and the tumor xenograft (Table 2).
Table 2. Cell line authentication based on short tandem repeat (STR) profile.
Original Tumor SRH Cell Line SRH Xenograft
AMEL XX XX XXCSF1P0 11,12 11,12 11,12D13S317 11,11 11,11 11,11D16S539 11,12 11,12 11,12D21S11 29,31.2 29,31.2 29,31.2D5S818 12,12 12,12 12,12D7S820 8,11 8,11 8,11TH01 9.3,9.3 9.3,9.3 9.3,9.3TPOX 8,9 8,9 8,9vWA 14,17 14,17 14,17
Cells 2020, 9, 2668 20 of 26
In addition, the presence of the AMEL locus confirmed the female identity of the patient tissueand cell line. The STR patterns of the SRH cell line were unique compared to any other cell line usingthe CLIMA v2.1 database. The xenograft was exclusively positive for the murine marker that wasincluded in the StemElite™ ID System.
4. Discussion
Cell lines are valuable model systems for the investigation of RMS genesis as well as preclinicalexamination of new treatment options. While several ERMS and ARMS cell lines are available forresearch [39], the establishment of the first SSRMS cell line from an adolescent was only recentlyreported [29]. Indeed, SSRMS is a rare RMS subtype that is often characterized by aggressive progress,especially when exhibiting a MYOD1 mutation [16–19].
The primary tumor from which the SRH cell line was established showed the typical SSRMSmorphology with spindle cells in fascicular patterns and scattered larger tumor cells in a sclerosingmatrix [14–16,24]. Prevalent desmin positivity was found, irrespective of cell morphology, while nuclearMYOD1 reactivity was abundant, yet not ubiquitously present, features that have been alreadyreported for other SSRMS tumors [14–16,24]. A TEM micrograph of a SRH cell depicted an elongated,irregular shaped nucleus. Glycogen storage characteristic for myogenic cells, but also a variety ofcancer cell lines was present in SRH cells [40]. In addition, structures that resemble intermediatefilaments, which are typical for muscle sarcomeres, could be detected [41].
Growth curves of SRH cells revealed a continuous growth with a doubling time of approximately34 h, which is somewhat faster when compared to the SSRMS cell line established by Yoshimatsu et al. [29].Most SRH cells (70%) were situated in the G1 phase of cell cycle.
The karyotype of SRH cells revealed several translocations, deletions, and derivative chromosomes,especially affecting chromosomes 3, 6, 9, 10, 12, 18, and 21. Due to translocation of the long arm ofchromosome 12 to chromosome 10 and 18, a tetraploidy of this part occurred. Complex chromosomalaberrations are typical for SSRMS, which are lacking a fusion gene [20–22]. Additionally, in 25–50% ofERMS chromosomal aberrations including gains of chromosome 2, 8, 12, and 13 can be observed [1,42].In fusion gene, positive ARMS changes are typically restricted to amplifications of specific genomicregions without gross chromosomal alterations [42].
Array-CGH showed several gains and losses of individual chromosomal regions in SRH cells.With the exception of chromosome 12, which exhibited a large proportion of gains in q13–q15 andq21–q24, losses were dominating. To obtain an overview about the possible interactions of geneproducts located in chromosomal regions with aberrations an ingenuity pathway analysis (IPA) hasbeen performed. Regarding pathways that are involved in stemness and differentiation, especially theWNT pathway of SRH cells was affected by loss of chromosomal regions coding for several components,while gains were basically restricted to regions coding for inhibitory proteins. In the NOTCH pathway,the NOTCH1 and HES7 genes were specifically located in chromosomal regions with losses. In contrast,in the Hh pathway, the transcription factor GLI1 and STK36 genes were located in regions with gains.Yet, GLI1 mRNA and protein expression in SRH cells was rather restricted when compared with severalERMS and ARMS cell lines, some of which also bear amplifications of the corresponding genomic region12q13.3 [31,43]. Similarly, ERMS and ARMS tumors frequently show amplifications of the correspondingregion, including the adjacent MDM2 gene, which is also covered by the gains in SRH cells [44].Although NOTCH signaling has been implicated in RMS motility and stemness [27], this pathway isnot significantly affected by chromosomal gains or losses in SRH cells. The downregulation of theWNT pathway concurrently with the activation of the Hh pathway has been likewise reported forERMS and ARMS [27,28]. The impairment of WNT signaling concomitantly with GLI1 overexpressionprobably contributes to the restraint of myogenic differentiation, which is also restricted by the MYOD1hotspot mutation that is present in SRH [16–19,27]. Remarkably, mRNA expression of the myogenicmarker MYMK, MYF5, MYOD1, and TANC1 was enhanced in SRH cells, whereas the expression ofMYOG and especially MYF6 mRNA was significantly decreased in SRH cells. The impaired myogenic
Cells 2020, 9, 2668 21 of 26
differentiation despite the expression of myogenic transcription factors being a hallmark of all RMSsubtypes [45] and it may by caused by different incidents including the presence of fusion proteinsin ARMS or inhibiting MYOD1 mutations. The substantial loss of MYF6 mRNA expression is evenmore astonishing, since the chromosomal region coding for both MYF5 and MYF6 is amplified inSRH cells. However, MYF6 is transactivated by several other myogenic transcription factors duringlate myogenesis with the highest impact of MYOD1, which may be one reason for the impairmentof its expression [46,47]. The gene of Cyclin dependent kinase 4 (CDK4) implicated in G1 phase ofcell cycle was located in an amplified genomic region, a feature of SRH cells that is shared by ARMSand ERMS [44,48]. Together with a loss of chromosomal regions coding for the genes of the CDK4inhibitors CDKN2B and CDKN2A observed in SRH cells, G1 progression may be accelerated [49].Yet, additionally, the gene of checkpoint kinase 2 (CHEK2), involved in a G1 cell cycle arrest [50],was located in a chromosomal region with gains. Moreover, the amplification of the chromosomalregion coding for cyclin dependent kinase 2 associated protein 1 (CDK2AP1), a negative regulator ofCDK2 [51], was revealed by array-CGH. Finally, the CDK5 and ABL1 enzyme substrate (CABLES)1 and 2 genes, which both negatively regulate CDK2 [52], were located in chromosomal regions withamplifications, which may decelerate entry into S phase. Because the gain or loss of a chromosomalregion does not necessarily indicate the amplification of a specific gene located therein or a change ofprotein expression, the impact of these chromosomal alterations on SRH cell cycle and other pathwaysremains speculative.
The two TP53 missense mutations found in SRH cells interfere with p53 function [53]. The R273Hand P309S mutations change p53 transactivation, yet, they do not prevent DNA binding [54]. Instead,these mutations apparently elicit a shift in p53 isoform expression [55]. In sporadic RMS, TP53 mutationsare found with a low frequency in about 5–15% of tumors [56–58]. For SSRMS, no TP53 mutations havebeen reported previously [23]. While TP53 mutations often increase p53 protein stability, the observedgain of the chromosomal region harboring the MDM2 gene in SRH cells may lead to increased MDM2protein abundance and the subsequent repression p53 protein amount [59]. Whether the observed p53mutations of the SRH cell line were induced during multimodal chemotherapy or have occurred in theprimary tumor prior to therapy is unknown.
The SRH cell line is derived from a mesenchymal tumor that is reflected by cell surfaceexpression of mesenchymal markers, including CD10, CD44, CD73, CD90, CD105, CD146, and CD166concomitant with the lack of the hematopoietic lineage surface markers CD14, CD19, and CD45 [60–63].CD10 expression is probably restricted to a subset of human MSC [62]. Interestingly, CD10 expressionhas been also confirmed on human muscle progenitor cells [64]. Evidence regarding CD34 expressionin MSC is contradictory [65]. Indeed, CD34 positivity may be detected in different progenitorcells [66]. In contrast to two pediatric cases of spindle cell RMS with obvious CD34 expression [67],a low percentage of SRH cells showed a weak positivity for CD34, which may be attributed to asubpopulation with enhanced myogenic potential [68]. SRH cells were able to undergo adipogenic andosteogenic differentiation, in accordance with the mesenchymal origin and lack of terminal myogenicdifferentiation. A fact that has been already revealed in a previous publication [69].
CSC are associated with the formation, therapeutic resistance, and aggressiveness of sarcomasand other tumors [70,71]. SRH cell spheres exhibited mRNA expression of typical CSC markers,including ALDH1, PROM1, and multidrug transporters [72,73]. In addition, mRNA expression ofother stemness markers, like BMI1, MSI1, MYC, NANOG, POU5F1, and SOX2 [73], was upregulated inSRH spheres when compared to monolayer culture. The existence of stem cell populations positive forPOU5F1, NANOG, MYC, and SOX2 has been already shown for ERMS and ARMS [42]. PROM1 proteinexpression has been associated with poor overall survival in ERMS [25], whereas NANOG proteinexpression has been related with the self-renewal capacity of ERMS cells [74].
Tumor formation in vivo is a key property of cancer cell lines [75] interacting with other cell types,extracellular matrix (ECM), and biomechanical cues in humanized mouse models. Upon subcutaneousinjection in NOD/SCID/γc
null mice, SRH cells efficiently formed tumors underlining their tumorigenicity.
Cells 2020, 9, 2668 22 of 26
In previous publications, it could be shown that the SRH cell line underwent apoptosis inductionby arsenic trioxide (ATO) and lithium chloride (LiCl), though the sensitivity of SRH cells was restrictedcompared to other ERMS and ARMS cell lines tested [31].
In summary, the SRH cell line is the first adult SSRMS cell line available. We report theestablishment, genetic, and molecular characterization of the SRH cell line, which is a useful tool forpreclinical research for novel therapeutic strategies addressing the rare SSRMS tumor entity.
Supplementary Materials: The following are available online at http://www.mdpi.com/2073-4409/9/12/2668/s1.Figure S1: Array-CGH results; Figure S2: Hh signaling pathway; Figure S3: NOTCH signaling pathway, Table S1:Array-CGH tabular results by probe name.
Author Contributions: Conceptualization, S.S., H.-G.K. and K.A.B.; formal analysis, S.S., S.G., K.A.B.; investigation,S.S., S.G., E.M., K.C.-H.C., M.S., B.F., R.R., T.K., L.F., G.G.; writing—review and editing, S.S., S.G., H.K., M.S., G.G.,B.S., R.H., F.T. and K.A.B.; supervision, S.S., H.K., M.S., T.K., H.B., G.G., B.S., R.H., F.T., K.A.B.; project administration,S.S., F.T., K.A.B. All authors have read and agreed to the published version of the manuscript.
Funding: 70% of the article processing charge was funded by the Open Access Publishing Fund of the Universityof Tuebingen.
Conflicts of Interest: K.A.B. is employee of Erbe Elektromedizin GmbH, Tuebingen, Germany. All other authorsdeclare no conflict of interest.
References
1. Parham, D.M.; Barr, F.G. Classification of Rhabdomyosarcoma and Its Molecular Basis. Adv. Anat. Pathol.2013, 20, 387–397. [CrossRef] [PubMed]
2. Amer, K.M.; Thomson, J.E.; Congiusta, D.; Dobitsch, A.; Chaudhry, A.; Li, M.; Chaudhry, A.; Bozzo, A.;Siracuse, B.; Aytekin, M.N.; et al. Epidemiology, Incidence, and Survival of Rhabdomyosarcoma Subtypes:SEER and ICES Database Analysis. J. Orthop. Res. 2019, 37, 2226–2230. [CrossRef] [PubMed]
3. Ducimetière, F.; Lurkin, A.; Ranchère-Vince, D.; Decouvelaere, A.-V.; Péoc’H, M.; Istier, L.; Chalabreysse, P.;Muller, C.; Alberti, L.; Bringuier, P.-P.; et al. Incidence of Sarcoma Histotypes and Molecular Subtypes in aProspective Epidemiological Study with Central Pathology Review and Molecular Testing. PLoS ONE 2011,6, e20294. [CrossRef] [PubMed]
4. Huh, W.W.; Bejar, D.E. Rhabdomyosarcoma in adolescent and young adult patients: Current perspectives.Adolesc. Health Med. Ther. 2014, 5, 115–125. [CrossRef]
5. Bompas, E.; Campion, L.; Italiano, A.; Le Cesne, A.; Chevreau, C.; Isambert, N.; Toulmonde, M.; Mir, O.;Ray-Coquard, I.; Piperno-Neumann, S.; et al. Outcome of 449 adult patients with rhabdomyosarcoma: Anobservational ambispective nationwide study. Cancer Med. 2018, 7, 4023–4035. [CrossRef]
6. Cavazzana, A.O.; Schmidt, D.; Ninfo, V.; Harms, D.; Tollot, M.; Carli, M.; Treuner, J.; Betto, R.; Salviati, G.Spindle Cell Rhabdomyosarcoma. Am. J. Surg. Pathol. 1992, 16, 229–235. [CrossRef]
7. Rubin, B.P.; Hasserjian, R.P.; Singer, S.; Janecka, I.; Fletcher, J.A.; Fletcher, C.D. Spindle Cell Rhabdomyosarcoma(So-Called) in Adults. Am. J. Surg. Pathol. 1998, 22, 459–464. [CrossRef]
8. Mentzel, T.; Katenkamp, D. Sclerosing, pseudovascular rhabdomyosarcoma in adults. Clinicopathological andimmunohistochemical analysis of three cases. Virchows Arch. 2000, 436, 305–311. [CrossRef]
9. Zambo, I.; Veselý, K. WHO classification of tumours of soft tissue and bone 2013: The main changes comparedto the 3rd edition. Ceskoslovenska Patol. 2014, 50, 64.
10. Rudzinski, E.R.; Anderson, J.R.; Hawkins, D.S.; Skapek, S.X.; Parham, D.M.; Teot, L.A. The World HealthOrganization Classification of Skeletal Muscle Tumors in Pediatric Rhabdomyosarcoma: A Report From theChildren’s Oncology Group. Arch. Pathol. Lab. Med. 2015, 139, 1281–1287. [CrossRef]
11. Mosquera, J.M.; Sboner, A.; Zhang, L.; Kitabayashi, N.; Chen, C.-L.; Sung, Y.S.; Wexler, L.H.; Laquaglia, M.P.;Edelman, M.; Sreekantaiah, C.; et al. RecurrentNCOA2gene rearrangements in congenital/infantile spindlecell rhabdomyosarcoma. Geneschromosom. Cancer 2013, 52, 538–550. [CrossRef] [PubMed]
12. Nascimento, A.F.; Fletcher, C.D.M. Spindle cell rhabdomyosarcoma in adults. Am. J. Surg. Pathol. 2005,29, 1106–1113. [PubMed]
13. WHO Classification of Tumours Editorial Board. WHO Classification of Tumours of Soft Tissue and Bone, 5th ed.;IARC Press: Lyon, France, 2020.
Cells 2020, 9, 2668 23 of 26
14. Zhao, Z.; Yin, Y.; Zhang, J.; Qi, J.; Zhang, D.; Ma, Y.; Wang, Y.; Li, S.; Zhou, J. Spindle cell/sclerosingrhabdomyosarcoma: Case series from a single institution emphasizing morphology, immunohistochemistryand follow-up. Int. J. Clin. Exp. Pathol. 2015, 8, 13814–13820. [PubMed]
15. Rekhi, B.; Singhvi, T. Histopathological, immunohistochemical and molecular cytogenetic analysis of 21spindle cell/sclerosing rhabdomyosarcomas. APMIS 2014, 122, 1144–1152. [CrossRef] [PubMed]
16. Wang, Y.; Li, J.; Tian, Z.; Zhu, Y. Clinicopathologic features and molecular spectrum of spindle cell andsclerosing rhabdomyosarcomas in the head and neck region. Int. J. Clin. Exp. Pathol. 2018, 11, 3436–3444.[PubMed]
17. Agaram, N.P.; Chen, C.-L.; Zhang, L.; Laquaglia, M.P.; Wexler, L.; Antonescu, C.R. RecurrentMYOD1mutationsin pediatric and adult sclerosing and spindle cell rhabdomyosarcomas: Evidence for a common pathogenesis.Geneschromosom. Cancer 2014, 53, 779–787. [CrossRef]
18. Szuhai, K.; De Jong, D.; Leung, W.Y.; Fletcher, C.D.M.; Hogendoorn, P.C.W. Transactivating mutation of theMYOD1 gene is a frequent event in adult spindle cell rhabdomyosarcoma. J. Pathol. 2014, 232, 300–307.[CrossRef]
19. Tsai, J.; Changchien, Y.; Lee, J.; Kao, Y.; Li, W.; Liang, C.; Liao, I.; Chang, Y.; Wang, J.; Tsao, C.;et al. The expanding morphological and genetic spectrum ofMYOD1-mutant spindle cell/sclerosingrhabdomyosarcomas: A clinicopathological and molecular comparison of mutated and non-mutated cases.Histopathology 2019, 74, 933–943. [CrossRef]
20. Soglio, R.B.-D.; Rougemont, A.-L.; Absi, R.; Barrette, S.; Montpetit, A.; Fetni, R.; Fournet, J.-C. SNP genotypingof a sclerosing rhabdomyosarcoma: Reveals highly aneuploid profile and a specific MDM2/HMGA2amplification. Hum. Pathol. 2009, 40, 1347–1352. [CrossRef]
21. Kuhnen, C.; Herter, P.; Leuschner, I.; Mentzel, T.; Druecke, D.; Jaworska, M.; Johnen, G. Sclerosing pseudovascularrhabdomyosarcoma—Immunohistochemical, ultrastructural, and genetic findings indicating a distinct subtype ofrhabdomyosarcoma. Virchows Arch. 2006, 449, 572–578. [CrossRef]
22. Croes, R.; Debiec-Rychter, M.; Cokelaere, K.; De Vos, R.; Hagemeijer-Hausman, A.; Sciot, R. Adult sclerosingrhabdomyosarcoma: Cytogenetic link with embryonal rhabdomyosarcoma. Virchows Arch. 2005, 446, 64–67.[CrossRef] [PubMed]
23. Agaram, N.P.; Laquaglia, M.P.; Alaggio, R.; Zhang, L.; Fujisawa, Y.; Ladanyi, M.; Wexler, L.H.; Antonescu, C.R.MYOD1-mutant spindle cell and sclerosing rhabdomyosarcoma: An aggressive subtype irrespective of age.A reappraisal for molecular classification and risk stratification. Mod. Pathol. 2019, 32, 27–36. [CrossRef][PubMed]
24. Smith, M.H.; Atherton, D.; Reith, J.D.; Islam, N.M.; Bhattacharyya, I.; Cohen, D.M. Rhabdomyosarcoma,Spindle Cell/Sclerosing Variant: A Clinical and Histopathological Examination of this Rare Variant withThree New Cases from the Oral Cavity. Head Neck Pathol. 2017, 11, 494–500. [CrossRef] [PubMed]
25. Walter, D.; Satheesha, S.; Albrecht, P.; Bornhauser, B.C.; D’Alessandro, V.; Oesch, S.M.; Rehrauer, H.;Leuschner, I.; Koscielniak, E.; Gengler, C.; et al. CD133 Positive Embryonal Rhabdomyosarcoma Stem-LikeCell Population Is Enriched in Rhabdospheres. PLoS ONE 2011, 6, e19506. [CrossRef] [PubMed]
26. Nakahata, K.; Uehara, S.; Nishikawa, S.; Kawatsu, M.; Zenitani, M.; Oue, T.; Okuyama, H. Aldehyde Dehydrogenase1 (ALDH1) Is a Potential Marker for Cancer Stem Cells in Embryonal Rhabdomyosarcoma. PLoS ONE 2015,10, e0125454. [CrossRef]
27. Belyea, B.; Kephart, J.G.; Blum, J.; Kirsch, D.G.; Linardic, C.M. Embryonic Signaling Pathways andRhabdomyosarcoma: Contributions to Cancer Development and Opportunities for Therapeutic Targeting.Sarcoma 2012, 2012, 1–13. [CrossRef] [PubMed]
28. Roma, J.; Almazán-Moga, A.; De Toledo, J.S.; Gallego, S. Notch, Wnt, and Hedgehog Pathways inRhabdomyosarcoma: From Single Pathways to an Integrated Network. Sarcoma 2012, 2012, 1–7. [CrossRef]
29. Yoshimatsu, Y.; Noguchi, R.; Tsuchiya, R.; Sei, A.; Sugaya, J.; Iwata, S.; Sugiyama, M.; Yoshida, A.;Kawai, A.; Kondo, T. Establishment and characterization of NCC-ssRMS1-C1: A novel patient-derivedspindle-cell/sclerosing rhabdomyosarcoma cell line. Hum. Cell 2020, 33, 886–893. [CrossRef]
30. Schleicher, S.B.; Zaborski, J.J.; Riester, R.; Zenkner, N.; Handgretinger, R.; Kluba, T.; Traub, F.; Boehme, K.A.Combined application of arsenic trioxide and lithium chloride augments viability reduction and apoptosisinduction in human rhabdomyosarcoma cell lines. PLoS ONE 2017, 12, e0178857. [CrossRef]
Cells 2020, 9, 2668 24 of 26
31. Boehme, K.A.; Zaborski, J.J.; Riester, R.; Schweiss, S.K.; Hopp, U.; Traub, F.; Kluba, T.; Handgretinger, R.;Schleicher, S.B. Targeting hedgehog signalling by arsenic trioxide reduces cell growth and induces apoptosisin rhabdomyosarcoma. Int. J. Oncol. 2015, 48, 801–812. [CrossRef]
32. Battula, V.L.; Treml, S.; Bareiss, P.M.; Gieseke, F.; Roelofs, H.; De Zwart, P.; Müller, I.; Schewe, B.; Skutella, T.;Fibbe, W.E.; et al. Isolation of functionally distinct mesenchymal stem cell subsets using antibodies againstCD56, CD271, and mesenchymal stem cell antigen-1. Haematologica 2008, 94, 173–184. [CrossRef] [PubMed]
33. Lange, K.; Gadzicki, D.; Schlegelberger, B.; Göhring, G. Recurrent involvement of heterochromatic regions inmultiple myeloma—A multicolor FISH study. Leuk. Res. 2010, 34, 1002–1006. [CrossRef] [PubMed]
34. Das, P.; Kotilingam, D.; Korchin, B.; Liu, J.; Yu, D.; Lazar, A.J.F.; Pollock, R.E.; Lev, D. High prevalence ofp53exon 4 mutations in soft tissue sarcoma. Cancer 2007, 109, 2323–2333. [CrossRef] [PubMed]
35. Köllmer, M.; Buhrman, J.S.; Zhang, Y.; Gemeinhart, R.A. Markers are shared between adipogenic andosteogenic differentiated mesenchymal stem cells. J. Dev. Biol. Tissue Eng. 2013, 5, 18–25. [CrossRef][PubMed]
36. Wang-Rodriguez, J.; Urquidi, V.; Rivard, A.; Goodison, S. Elevated osteopontin and thrombospondinexpression identifies malignant human breast carcinoma but is not indicative of metastatic status.Breast Cancer Res. 2003, 5, R136–R143. [CrossRef] [PubMed]
37. Livak, K.J.; Schmittgen, T.D. Analysis of relative gene expression data using real-time quantitative PCR andthe 2(-Delta Delta C(T)) Method. Methods 2001, 25, 402–408. [CrossRef] [PubMed]
38. Lemma, S.; Avnet, S.; Salerno, M.; Chano, T.; Baldini, N. Identification and Validation of HousekeepingGenes for Gene Expression Analysis of Cancer Stem Cells. PLoS ONE 2016, 11, e0149481. [CrossRef]
39. Hinson, A.R.P.; Ejones, R.; Crose, L.E.S.; Belyea, B.C.; Barr, F.G.; Linardic, C.M. Human RhabdomyosarcomaCell Lines for Rhabdomyosarcoma Research: Utility and Pitfalls. Front. Oncol. 2013, 3, 183. [CrossRef]
40. Zois, C.E.; Harris, A. Glycogen metabolism has a key role in the cancer microenvironment and provides newtargets for cancer therapy. J. Mol. Med. 2016, 94, 137–154. [CrossRef]
41. Henderson, C.A.; Gomez, C.G.; Novak, S.M.; Mi-Mi, L.; Gregorio, C.C. Overview of the Muscle Cytoskeleton.Compr. Physiol. 2017, 7, 891–944. [CrossRef]
42. Sun, X.; Guo, W.; Shen, J.K.; Mankin, H.J.; Hornicek, F.J.; Duan, Z. Rhabdomyosarcoma: Advances inMolecular and Cellular Biology. Sarcoma 2015, 2015, 1–14. [CrossRef] [PubMed]
43. Forus, A.; Flørenes, V.A.; Maelandsmo, G.M.; Meltzer, P.S.; Fodstad, O.; Myklebost, O. Mapping ofamplification units in the q13-14 region of chromosome 12 in human sarcomas: Some amplica do not includeMDM. Cell Growth Differ Mol. Biol. J. Am. Assoc. Cancer Res. 1993, 4, 1065–1070.
44. Ragazzini, P.; Gamberi, G.; Pazzaglia, L.; Serra, M.; Magagnoli, G.; Ponticelli, F.; Ferrari, C.; Ghinelli, C.;Alberghini, M.; Bertoni, F.; et al. Amplification of CDK4, MDM2, SAS and GLI genes in leiomyosarcoma,alveolar and embryonal rhabdomyosarcoma. Histol. Histopathol. 2004, 19, 401–411. [PubMed]
45. Keller, C.; Guttridge, D.C. Mechanisms of impaired differentiation in rhabdomyosarcoma. FEBS J. 2013,280, 4323–4334. [CrossRef]
46. Black, B.L.; Martin, J.F.; Olson, E.N. The MouseMRF4Promoter Istrans-Activated Directly and Indirectly byMuscle-specific Transcription Factors. J. Biol. Chem. 1995, 270, 2889–2892. [CrossRef]
47. Weintraub, H.; Davis, R.; Tapscott, S.; Thayer, M.; Krause, M.; Benezra, R.; Blackwell, T.K.; Turner, D.;Rupp, R.; Hollenberg, S.; et al. The myoD gene family: Nodal point during specification of the muscle celllineage. Science 1991, 251, 761–766. [CrossRef]
48. Shern, J.F.; Chen, L.; Chmielecki, J.; Wei, J.S.; Patidar, R.; Rosenberg, M.; Ambrogio, L.; Auclair, D.; Wang, J.;Song, Y.K.; et al. Comprehensive Genomic Analysis of Rhabdomyosarcoma Reveals a Landscape ofAlterations Affecting a Common Genetic Axis in Fusion-Positive and Fusion-Negative Tumors. Cancer Discov.2014, 4, 216–231. [CrossRef]
49. Kohlmeyer, J.L.; Gordon, D.J.; Tanas, M.R.; Monga, V.; Dodd, R.D.; Quelle, D.E. CDKs in Sarcoma: Mediatorsof Disease and Emerging Therapeutic Targets. Int. J. Mol. Sci. 2020, 21, 3018. [CrossRef]
50. Zannini, L.; Delia, D.; Buscemi, G. CHK2 kinase in the DNA damage response and beyond. J. Mol. Cell Biol.2014, 6, 442–457. [CrossRef]
51. Wong, D.T.W.; Kim, J.J.; Khalid, O.; Sun, H.-H.B.; Kim, Y. Double Edge: CDK2AP1 in cell-cycle regulationand epigenetic regulation. J. Dent. Res. 2011, 91, 235–241. [CrossRef]
Cells 2020, 9, 2668 25 of 26
52. Wu, C.L.; Kirley, S.D.; Xiao, H.; Chuang, Y.; Chung, D.C.; Zukerberg, L.R. Cables enhances cdk2 tyrosine 15phosphorylation by Wee1, inhibits cell growth, and is lost in many human colon and squamous cancers.Cancer Res. 2001, 61, 7325–7332. [PubMed]
53. Muller, P.A.; Vousden, K.H. Mutant p53 in Cancer: New Functions and Therapeutic Opportunities. Cancer Cell2014, 25, 304–317. [CrossRef] [PubMed]
54. Rochette, P.J.; Bastien, N.; Lavoie, J.; Guérin, S.L.; Drouin, R. SW480, a p53 Double-mutant Cell Line RetainsProficiency for Some p53 Functions. J. Mol. Biol. 2005, 352, 44–57. [CrossRef] [PubMed]
55. Candeias, M.M.; Hagiwara, M.; Matsuda, M. Cancer-specific mutations in p53 induce the translation of∆160p53 promoting tumorigenesis. EMBO Rep. 2016, 17, 1542–1551. [CrossRef] [PubMed]
56. Kashi, V.P.; Hatley, M.E.; Galindo, R.L. Probing for a deeper understanding of rhabdomyosarcoma: Insightsfrom complementary model systems. Nat. Rev. Cancer 2015, 15, 426–439. [CrossRef]
57. Seki, M.; Nishimura, R.; Yoshida, K.; Shimamura, T.; Shiraishi, Y.; Sato, Y.; Kato, M.; Chiba, K.; Tanaka, H.;Hoshino, N.; et al. Integrated genetic and epigenetic analysis defines novel molecular subgroups inrhabdomyosarcoma. Nat. Commun. 2015, 6, 7557. [CrossRef]
58. Bs, A.C.T.; Shu, L.; Danks, M.K.; Ms, C.A.P.; Ms, S.S.; Thayer, M.J.; Houghton, P.J.; Harris, L.C. p53 mutation andMDM2 amplification frequency in pediatric rhabdomyosarcoma tumors and cell lines. Med. Pediatr. Oncol.2000, 35, 96–103. [CrossRef]
59. Senturk, E.; Manfredi, J.J. Mdm2 and Tumorigenesis: Evolving theories and unsolved mysteries. Genes Cancer2012, 3, 192–198. [CrossRef]
60. Lv, F.-J.; Tuan, R.S.; Cheung, K.M.C.; Leung, V.Y.L. Concise Review: The Surface Markers and Identity ofHuman Mesenchymal Stem Cells. Stem Cells 2014, 32, 1408–1419. [CrossRef]
61. Dominici, M.; Le Blanc, K.; Mueller, I.; Slaper-Cortenbach, I.; Marini, F.; Krause, D.; Deans, R.;Keating, A.; Prockop, D.; Horwitz, E. Minimal criteria for defining multipotent mesenchymal stromalcells. The International Society for Cellular Therapy position statement. Cytotherapy 2006, 8, 315–317.[CrossRef]
62. Bühring, H.-J.; Battula, V.L.; Treml, S.; Schewe, B.; Kanz, L.; Vogel, W. Novel Markers for the ProspectiveIsolation of Human MSC. Ann. N. Y. Acad. Sci. 2007, 1106, 262–271. [CrossRef] [PubMed]
63. Ramos, T.L.; Sánchez-Abarca, L.I.; Muntión, S.; Preciado, S.; Puig, N.; López-Ruano, G.;Hernández-Hernández, Á.; Redondo, A.; Ortega, R.; Rodríguez, C.; et al. MSC surface markers (CD44,CD73, and CD90) can identify human MSC-derived extracellular vesicles by conventional flow cytometry.Cell Commun. Signal. 2016, 14, 1–14. [CrossRef] [PubMed]
64. Hejbøl, E.K.; Hajjaj, M.A.; Nielsen, O.; Schrøder, H.D. Marker Expression of Interstitial Cells in HumanSkeletal Muscle: An Immunohistochemical Study. J. Histochem. Cytochem. 2019, 67, 825–844. [CrossRef][PubMed]
65. Lin, C.-S.; Xin, Z.-C.; Dai, J.; Lue, T.F. Commonly used mesenchymal stem cell markers and tracking labels:Limitations and challenges. Histol. Histopathol. 2013, 28, 1109–1116. [PubMed]
66. Sidney, L.E.; Branch, M.J.; Dunphy, S.E.; Dua, H.S.; Hopkinson, A. Concise Review: Evidence for CD34 as aCommon Marker for Diverse Progenitors. Stem Cells 2014, 32, 1380–1389. [CrossRef]
67. Kacar, A.; Demir, H.A.; Durak, H.; Dervisoglu, S. Spindle cell rhabdomyosarcoma displaying cd34 positivity:A potential diagnostic pitfall; report of two pediatric cases. Turk. J. Pathol. 2013, 29, 221–226. [CrossRef]
68. Dupas, T.; Rouaud, T.; Rouger, K.; Lieubeau, B.; Cario-Toumaniantz, C.; Fontaine-Pérus, J.; Gardahaut, M.-F.;Auda-Boucher, G. Fetal muscle contains different CD34+ cell subsets that distinctly differentiate intoadipogenic, angiogenic and myogenic lineages. Stem Cell Res. 2011, 7, 230–243. [CrossRef]
69. Wirths, S.; Malenke, E.; Kluba, T.; Rieger, S.; Müller, M.R.; Schleicher, S.; Von Weyhern, C.H.; Nagl, F.; Fend, F.;Vogel, W.; et al. Shared Cell Surface Marker Expression in Mesenchymal Stem Cells and Adult Sarcomas.Stem Cells Transl. Med. 2012, 2, 53–60. [CrossRef]
70. Trucco, M.; Loeb, D. Sarcoma Stem Cells: Do We Know What We Are Looking for? Sarcoma 2012, 2012, 1–8.[CrossRef]
71. Steinbichler, T.B.; Dudás, J.; Skvortsov, S.; Ganswindt, U.; Riechelmann, H.; Skvortsova, I.-I. Therapy resistancemediated by cancer stem cells. Semin. Cancer Biol. 2018, 53, 156–167. [CrossRef]
72. Genadry, K.C.; Pietrobono, S.; Rota, R.; Linardic, C.M. Soft Tissue Sarcoma Cancer Stem Cells: An Overview.Front. Oncol. 2018, 8, 475. [CrossRef] [PubMed]
Cells 2020, 9, 2668 26 of 26
73. Martínez-Delgado, P.; Lacerenza, S.; Obrador-Hevia, A.; Lopez-Alvarez, M.; Mondaza-Hernandez, J.L.;Blanco-Alcaina, E.; Sanchez-Bustos, P.; Hindi, N.; Moura, D.S.; Broto, J.M. Cancer Stem Cells in Soft-TissueSarcomas. Cells 2020, 9, 1449. [CrossRef] [PubMed]
74. Satheesha, S.; Manzella, G.; Bovay, A.; A Casanova, E.; Bode, P.-K.; Belle, R.; Feuchtgruber, S.; Jaaks, P.;Dogan, N.; Koscielniak, E.; et al. Targeting hedgehog signaling reduces self-renewal in embryonalrhabdomyosarcoma. Oncogene 2015, 35, 2020–2030. [CrossRef] [PubMed]
75. Goodspeed, A.; Heiser, L.M.; Gray, J.W.; Costello, J.C. Tumor-Derived Cell Lines as Molecular Models ofCancer Pharmacogenomics. Mol. Cancer Res. 2016, 14, 3–13. [CrossRef]
Publisher’s Note: MDPI stays neutral with regard to jurisdictional claims in published maps and institutionalaffiliations.
© 2020 by the authors. Licensee MDPI, Basel, Switzerland. This article is an open accessarticle distributed under the terms and conditions of the Creative Commons Attribution(CC BY) license (http://creativecommons.org/licenses/by/4.0/).