Embed Size (px)
Citation preview

Aus der Abteilung Neurogenetik
(Direktor: Prof. K.-A. Nave, Ph.D.)
des Max-Planck-Instituts für experimentelle Medizin
in Göttingen
___________________________________________________________
Establishment of a novel technique
to study G protein-coupled receptor activation
INAUGURAL – DISSERTATION
zur Erlangung des Doktorgrades
der Medizinischen Fakultät der
Georg-August-Universität zu Göttingen
vorgelegt von
Minou Susan Djannatian
aus
Wilhelmshaven
Göttingen 2010

Dekan: Prof. Dr. med. C. Frömmel
I. Berichterstatter: Prof. Dr. med. M. Simons
II. Berichterstatter/in: Prof. Dr. med. W.-H. Zimmermann
III. Berichterstatter/in: Prof. Dr. rer. nat. B. Schwappach
Tag der mündlichen Prüfung: 17.08.2011

Table of contents
1 Introduction ............................................................................................................1
1.1 G protein-coupled receptors ....................................................................................1
1.1.1 Activation of G protein-coupled receptors .................................................1
1.1.2 Signaling of G protein-coupled receptors ..................................................2
1.1.3 Transcriptional regulation through G protein-coupled receptor
signaling ....................................................................................................3
1.1.4 Desensitization of G protein-coupled receptors ........................................4
1.1.5 Roles of arrestins in receptor desensitization and signal transduction......4
1.1.6 A closer look at GPCR family members: vasopressin, dopamine and
beta-adrenergic receptors .........................................................................6
1.1.6.1 Vasopressin receptors .......................................................................... 6
1.1.6.2 Dopamine receptors ............................................................................. 6
1.1.6.3 Beta-adrenergic receptors .................................................................... 7
1.2 Signal transduction revised......................................................................................8
1.3 Challenges in drug discovery...................................................................................9
1.4 GPCR assays ........................................................................................................10
1.5 The split-TEV system.............................................................................................10
1.6 Aim of the study: Development of a split-TEV assay for G protein-coupled
receptors ................................................................................................................13
2 Materials ...............................................................................................................14
2.1 Chemicals and reagents ........................................................................................14
2.2 Consumables .........................................................................................................16
2.3 Equipment..............................................................................................................16
2.4 Ready-made reaction systems ..............................................................................17
2.5 Enzymes ................................................................................................................17
2.6 Solutions and buffers .............................................................................................17
2.6.1 Molecular biological solutions .................................................................17
2.6.2 Solutions for luciferase assays................................................................19
2.6.3 Cell culture solutions ...............................................................................21
2.7 Oligonucleotides ....................................................................................................22
2.8 Plasmids ................................................................................................................24
2.9 Bacteria strains ......................................................................................................26
2.10 Eucaryotic cell lines ...............................................................................................26
3 Methods ................................................................................................................27
3.1 Molecular biological techniques .............................................................................27
3.1.1 The GATEWAY Technology ...................................................................27
3.1.2 Cloning strategy ......................................................................................29
3.1.3 Polymerase Chain Reaction....................................................................30
3.1.4 Extraction of DNA fragments from agarose gels.....................................31
3.1.5 DNA purification by precipitation with polyethylene glycol (PEG) ...........31
3.1.6 BP and LR reactions ...............................................................................31
3.1.7 Transformation of DNA into chemocompetent bacteria ..........................32
3.1.8 Transformation of DNA into electrocompetent bacteria ..........................32
3.1.9 Preparation of plasmid DNA....................................................................32
3.1.10 Restriction digests...................................................................................33
3.2 Cell culture techniques...........................................................................................33
3.2.1 Basic cell culture techniqes.....................................................................33
3.2.2 Primary cell culture..................................................................................34
3.2.3 Transfection of mammalian cells by lipofection.......................................35
3.3 Reporter gene assays............................................................................................35
3.3.1 Luciferase reporter gene assays.............................................................35
3.3.2 Dose response curves ............................................................................37
3.3.3 Fluorescence-based reporter gene assays.............................................38
3.3.4 Flow cytometry ........................................................................................38

4 Results ..................................................................................................................39
4.1 Design of split-TEV assays for GPCR activation ...................................................39
4.2 Cleavage of GPCR fusion constructs by TEV protease.........................................42
4.3 Evaluation of different readouts for split-TEV assays ............................................45
4.4 Evaluation of different cleavage sites for split-TEV and full-TEV assays...............46
4.5 Comparison of split-TEV and full-TEV assays for GPCR activation ......................47
4.5.1 Use of a Arr2 truncation mutant for split-TEV and full-TEV assays.......47
4.5.2 Performance of split-TEV and full-TEV assays in U2OS cells ................49
4.5.3 Split-TEV and full-TEV assays in primary cultured cells .........................51
4.6 Dose-dependence of split-TEV GPCR activation assays ......................................53
4.7 Cellular Signaling by tagged AVPR1a and AVPR2 receptors................................55
5 Discussion............................................................................................................60
5.1 Cleavage of GPCR constructs by TEV protease ...................................................60
5.2 Influence of the cleavage site on split-TEV and full-TEV assay performance .......61
5.3 Use of a Arr2 truncation mutant for split-TEV and full-TEV assays .....................61
5.4 Flexibility of split-TEV assay readout .....................................................................62
5.5 Cell type-dependent differences in split-TEV assay performance .........................62
5.6 Split-TEV dose-response assays for GPCR activation ..........................................63
5.7 Cellular signaling by differently tagged GPCRs .....................................................63
5.8 Advantages and disadvantages of split-TEV assays for GPCR activation ............64
5.9 Outlook: Possible implementation of GPCR split-TEV assays into multiplexed
assays....................................................................................................................65

6 Summary...............................................................................................................66
7 References............................................................................................................67

List of figures and tables
Fig. 1. Signaling network reconstruction. .........................................................................9
Fig. 2. Principle of split-TEV with the membrane-bound, transcription-coupled
reporter system. ..................................................................................................12
Fig. 3. GATEWAY cloning procedure. ...........................................................................28
Fig. 4. Time frames for luciferase reporter gene assays................................................37
Fig. 5. Design of split-TEV and full-TEV assays to monitor GPCR activation................40
Fig. 6. Cleavage of GPCR constructs by TEV protease. ...............................................43
Fig. 7. Cleavage of GPCR constructs monitored by a fluorescent readout. ..................44
Fig. 8. Comparison of luciferase and fluorescence readouts for split-TEV assays. .......45
Fig. 9. Performance of different TEV protease cleavage sites in split-TEV and full-
TEV assays.........................................................................................................46
Fig. 10. Comparison of full-TEV and split-TEV assays to monitor GPCR activation in
PC12 cells...........................................................................................................48
Fig. 11. Comparison of full-TEV and split-TEV assays to monitor GPCR activation in
U2OS cells. .........................................................................................................50
Fig. 12. Comparison of full-TEV and split-TEV assays to monitor GPCR activation in
primary cultured neurons and astrocytes............................................................52
Fig. 13. Dose-response analysis with split-TEV GPCR activation assays in
heterologous and primary cells. ..........................................................................54
Fig. 14. Principle of cis-reporter assays to monitor cellular signaling. .............................55
Fig. 15. Specific responsiveness of the cre-luciferase and nfat-luciferase reporter for
db-cAMP and PMA/ionomycin responses...........................................................56
Fig. 16. Cellular signaling by differently tagged AVPR1a and AVPR2 receptors.............58
Table 1. Overview of GPCR constructs used in cleavage assays, split-TEV and full-
TEV activation assays and signaling assays. .....................................................41

Abbreviations
5’-AMP 5’-adenosine monophosphate
aa amino acids
ADRB2 beta-2 adrenergic receptor
AKAP A kinase-anchoring protein
Akt Akt serine/threonine kinase
AmpR ampicillin resistance
AP-1 activator protein 1
AP-2 adaptor protein complex AP-2
AVPR1a arginine vasopressin receptor 1a
AVPR1b arginine vasopressin receptor 1b
AVPR2 arginine vasopressin receptor 2
ATP adenosine trisphosphate
AVP arginine vasopressin
Arr2 -arrestin 2
ARR2∆ -arrestin 2 truncation mutant (aa 1-382)Bcr-Abl breakpoint cluster region-abelson oncogene
BME Basal Medium Eagle
BRET Bioluminescence Resonance Energy Transfer
BSA Bovine Serum Albumin
Ca2+ calcium ions
cAMP cyclic adenosine monophosphate
CBP CREB binding protein
ccdB controlling cell death B gene
CML chronic myeloic leukemia
CMV cytomegalovirus
cre cAMP-responsive element
CREB cAMP-responsive element binding protein
C-TEV C-terminal aa 119-221 of the TEV protease
DAG diacylglycerol
db-cAMP dibutyryl cyclic adenosine monophosphate
DMEM Dulbecco’s modified Eagle Medium
DMSO dimethyl sulfoxide
DNA deoxyribonucleic acid
dNTP deoxynucleotide trisphosphate
DRD1 dopamine receptor 1
DRD2 dopamine receptor 2
DRD3 dopamine receptor 3

DRD4 dopamine receptor 4
DRD5 dopamine receptor 5
DTT 1,4-dithiothreitol
EC50 agonist concentration which results in a half-maximal response
E.coli Escherichia coli
EGFP enhanced green fluorescent protein
ErbB family of receptor tyrosine kinases
ERK extracellular-signal regulated kinase
EYFPnuc nuclear localized anhanced yellow fluorescent protein
FBS fetal bovine serum
Fig. figure
FRET Fluorescence Resonance Energy Transfer
FSC Forward Scatter
g gram
G5 5-fold Gal4-responsive element
Gal4 yeast DNA binding domain
GDP guanosine diphosphate
GentaR gentamycin resistance
GFP green fluorescent protein
GPCR G protein-coupled receptor
GRK G protein-coupled receptor kinase
GTP guanosine triphosphate
GV artificial transcription factor, composed of the yeast Gal4 DNA-
binding domain and the herpes simplex VP16 transactivation
domain
h hour
HBSS Hank's Buffered Salt Solution
HEK human embryonic kidney cell line
HS horse serum
IGF-1 Insulin-like Growth Factor 1
IHF integration host factor, encoded by E.coli
IL-2 interleukin-2
Int integrase, encoded by bacteriophage λ
IP3 inositol 1,4,5-trisphosphate
JAK Janus kinase
KanR kanamycin resistance
l liter
LB Luria Bertani
µ micro
m milli

M molar
MAPK mitogen-activated protein kinase
n number of samples, nano
NEAA non-essential amino acids
NFAT nuclear factor of activated T cells
NF-B nuclear factor kappa-light-chain-enhancer of activated B cells
N-TEV N-terminal aa 1-118 of the TEV protease
PBS phosphate buffered saline
PC12 rat pheochromocytoma cell line
PCR polymerase chain reaction
PDE phosphodiesterase
PEG polyethylene glycol
pH negative logarithm of the hydrogen ion concentration
P1’ amino acid carboxyterminally of a protease cleavage site
PI3K phosphatidylinositol 3-kinase
PIP2 phosphatidylinositol 4,5-bisphosphate
PKA protein kinase A
PKC protein kinase C
PLCβ phospholipase Cβ
PLL poly-L-lysine
PLO poly-L-ornithine
PMA phorbol myristate acetate
PPI protein-protein interaction
Ras Ras family of small GTPases
RLUs relative light units
RNA ribonucleic acid
rpm rotations per minute
RPMI Roswell Park Memorial Institute
[35S]GTPS guanosine 5´-[γ-[35S]thio]triphosphate
Src Src non-receptor tyrosine kinase
SSC Side Scatter
STAT Signal Transducers and Activators of Transcription
SV40 monkey virus Simian Virus 40
TE Tris/EDTA
TEV NIa protease of the tobacco etch virus
tevS TEV protease cleavage site ENLYFQ’G
tevS* TEV protease cleavage site ENLYFQ’L
TFIID transcription factor IID
TK thymidine kinase

TM-GV GV coupled to the transmembrane domain of the human PDGFα
receptor
TNF tumor necrosis factor
TRIS Tris(hydroxymethyl)aminomethane
TRP transient receptor potential
U unit
U2OS human osteosarcoma cell line
VC C-terminal aa 343-371 of the AVPR2 receptor
VP16 Herpes simplex transactivation domain
w/v weight per volume
Xis excisionase, encoded by bacteriophage λ
ZeoR zeocin resistance
INTRODUCTION 1
1 Introduction
1.1 G protein-coupled receptors
Mammalian cells integrate extracellular signals into distinct cellular responses via signal
transduction pathways. Receptors located at the cell surface transduce the extracellular
stimulus to specific signaling cascades in the cytoplasm by activating specific effector
proteins. The largest family of these receptors in mammals is represented by G protein-
coupled receptors (GPCRs) which include more than 800 members in the human genome
(Lagerstrom and Schioth 2008). GPCRs are an extremely diverse receptor family, reacting
to as different signals as hormones, neurotransmitters, chemokines, odorants, calcium,
and light. They direct or modulate diverse physiologic processes including cell growth,
inflammation, neurotransmission and hormone signaling under normal and pathological
conditions. Currently, about 25% of all approved drugs are targeted against GPCRs
highlighting the clinical importance of this protein family (Overington et al. 2006).
All GPCRs have a similar structure in that they consist of seven transmembrane α helices
which are bundled together and connected by three extracellular and three intracellular
loops. The transmembrane ‘central core’ is preceeded by an extracellular N-terminal
domain and followed by an intracellular C-terminal domain. Activation of GPCRs leads to a
conformational change in the ‘central core’.
1.1.1 Activation of G protein-coupled receptors
GPCRs are coupled to guanine nucleotide-binding proteins (G proteins) which serve as
intracellular signal transducers. G proteins are heterotrimeric, consisting of an α subunit
and a βγ subunit under physiological conditions. Several G proteins exist which differ in
their α subunits (αs, αi/o, αq, α12, and others) and couple to different downstream signaling
pathways. In the resting state, when no ligand is bound to the receptor, the α subunit binds
guanosine diphosphate (GDP) and is closely associated with the βγ-subunit. Receptor
conformation changes during activation by an agonist allow binding of the G protein.
GPCRs then catalyze the exchange of GDP by guanosine triphosphate (GTP) and thereby
promote the dissociation of α and βγ subunit. The α, and in some cases the βγ, subunit
modulates effectors which catalyse the synthesis of second messenger molecules and
thus initiate downstream signaling.

INTRODUCTION 2
Termination of GPCR-activated signaling cascades takes place within tens of seconds
through GTP hydrolysis by the G subunit itself. Desensitization is another mechanism to
end GPCR signaling (see 1.1.4).
1.1.2 Signaling of G protein-coupled receptors
Classical GPCR signaling takes place via three main signaling pathways which depend on
the G protein family involved. Signaling via Gs involves activation of the effector molecule
adenylate cyclase by the Gsubunit which leads to the synthesis of cyclic adenosine
monophosphate (cAMP). Binding of two cAMP molecules to the regulatory subunits of
protein kinase A (PKA) releases the catalytic subunits of PKA which then display catalytic
activity. Substrates of serine/threonine-specific PKA are enzymes of the glucose and
glycogen metabolism, lipase, calcium channels in skeletal muscle as well as a number of
neuronal proteins.
GI/o inhibits adenylate cyclase and therefore cAMP production via both the and the βγ
subunit. βγ subunits of these G proteins can furthermore directly activate potassium
channels, phospholipase Cβ (PLCβ) and phosphatidylinositol 3-kinase (PI3K) (Neves et
al. 2002).
Gq activates PLC-β which cleaves phophatidylinositol 4,5-bisphosphate (PIP2) into two
second messengers: the membrane-bound, lipophilic diacylglycerol (DAG) and the
cytosolic inositol 1,4,5-trisphosphate (IP3). DAG activates protein kinase C (PKC) after
calcium-dependent translocation to the plasma membrane. PKC in turn phosphorylates
and thereby activates a number of proteins involved in cell growth and metabolism,
smooth muscle contraction and neuronal excitation. IP3 induces a transient release of
calcium ions (Ca2+) from the endoplasmatic reticulum into the cytoplasm. Influx of
extracellular calcium is initiated through binding of the IP3-gated Ca2+ channels to transient
receptor potential (TRP) channels once the Ca2+ stores of the endoplasmatic reticulum are
depleted (Boulay et al. 1999). Calcium signaling is important for muscle activity,
neurotransmitter release, modulation of Ca2+-dependent ion channels, metabolism, cell
proliferation, and apoptosis (Berridge et al. 2000).
Signal amplification on all levels is a hallmark of these signaling pathways (e.g. synthesis
of several hundreds of cAMPs follows the activation of a single receptor molecule).
However, signaling by second messengers occurs in local microdomains and is thus
spatially well controlled. This allows the cell to react to multiple extracellular stimuli and to
run a number of different intracellular signaling processes at the same time while

INTRODUCTION 3
maintaining specificity of these processes. For example, compartmentalization of cAMP
signaling is achieved in form of cAMP gradients. These gradients are shaped by
phosphodiesterases (PDEs) which degrade cAMP to 5’-adenosine monophosphate (5’-
AMP) and are positioned at discrete locations in the cytoplasm, partly in association with
organelles. PDEs can even act as ‘sinks’ in which cAMP is drained while the concentration
is maintained at more distant locations, thus creating multiple cAMP gradients at the same
time. Since both PDEs and PKA are anchored to defined intracellular sites by A kinase-
anchoring proteins (AKAPs), cAMP molecules can be ‘guided’ towards their effector
proteins in a very specific way (Baillie 2009).
GPCR signaling is highly dependent on cellular environment, meaning that the activation
of the same receptor can have a certain effect in one cell type but a completely different
one in another cell type. The influence of cell ‘phenotype’ originates from a variety of
factors like receptor density, receptor trafficking, receptor dimerization, presence of
receptor-modulating proteins, stoichiometry of receptors to G proteins, and availability of
effector molecules (Kenakin 2003).
1.1.3 Transcriptional regulation through G protein-coupled receptor
signaling
It has been long established that extracellular signals influence gene regulation through
common signaling pathways. Gene transcription can be regulated by the action of
transcription factors which are subjected to phosphorylation during signaling. Activation of
transcription factors can be achieved by 1) direct phosphorylation of the transcription
factor at the membrane or in the cytoplasm followed by its translocation into the nucleus
(e.g. in Janus kinase-Signal Transducers and Activators of Transcription (JAK-STAT)
pathways), 2) nuclear translocation of kinases followed by phosphorylation of a resident
transcription factor (e.g. in mitogen-activated protein kinase (MAPK) pathways), or 3)
release of the transcription factor from an inhibitory protein by phosphorylation with
subsequent nuclear translocation (e.g. nuclear factor kappa-light-chain-enhancer of
activated B cells (NF-B)) (Edwards 1994; Hill and Treisman 1995). One of the most
investigated examples of transcriptional regulation is mediated via cAMP-responsive
element (cre) binding protein (CREB). CREB recognizes and binds to the cre consensus
site TGACGTCA (Montminy et al. 1986) which is a cis element positioned in the promoter
region of a variety of genes. As described above, cAMP releases the catalytic subunits of
PKA from the regulatory subunits and thus enables them to translocate into the nucleus.
Phosphorylation of CREB by PKA enhances its ability to recruit the transcriptional

INTRODUCTION 4
machinery. CREB builds a complex with the general transcription factor TFIID and CREB
binding protein (CBP) which confers gene transactivation through association with RNA-
polymerase II complexes (Mayr and Montminy 2001; Nakajima et al. 1997).
A well-characterized example for transcriptional regulation by calcium signaling is the
nuclear factor of activated T cells (NFAT). An increase of intracellular calcium levels can
activate the phosphatase calcineurin which dephosphorylates cytosolic NFAT proteins.
This unmasks a nuclear localization signal and allows nuclear translocation of NFAT,
binding to the nfat cis element and subsequent transactivation of target genes, e.g. tumor
necrosis factor (TNF. Some target genes of NFAT require the convergence of different
signaling pathways, which provides further specificity. Concomitant activation of NFAT by
calcium and of activator protein 1 (AP-1) by PKC/Ras pathways is needed for binding of
NFAT/AP-1 complexes to nfat binding sites and transactivation of e.g. interleukin-2 (IL-2)
(Crabtree and Olson 2002; Macian et al. 2001).
1.1.4 Desensitization of G protein-coupled receptors
A remarkable characteristic of GPCRs is their desensitization, resulting in a reduced
response to the agonist over time. Desensitization includes different mechanisms varying
in onset and duration, namely uncoupling of the receptor from G proteins, receptor
internalization, and downregulation of the receptor mRNA and protein content. Uncoupling
from G proteins is achieved through phosphorylation of the receptor by second
messenger-dependent kinases (PKA and PKC) and G protein-coupled receptor kinases
(GRKs). Both second messenger-dependent kinases and GRKs phosphorylate serine and
threonine residues within the third intracellular loop and the C-terminal tail. However, in
contrast to second messenger-dependent kinases, GRKs selectively phosphorylate
agonist-activated receptors. GRKs furthermore promote the binding of arrestins, leading to
a sterical uncoupling of G proteins from the receptor (Ferguson 2001).
1.1.5 Roles of arrestins in receptor desensitization and signal transduction
Arrestins are a protein family that consists of four members, namely visual and cone
arrestin, and β-arrestin 1 and 2. Visual and cone arrestin are predominantly found in the
retina, whereas β-arrestins are ubiquitously expressed outside the retina. The structure of
arrestins is characterized by an N and a C domain which are each composed of a seven
stranded β-sandwich and linked by a phosphate sensor domain. Upon receptor activation,
interaction of the phosphorylated receptor tail with arrestin leads to a reorientation of the

INTRODUCTION 5
arrestin N and C domains, thereby promoting arrestin binding to the receptor (Hirsch et al.
1999). β-arrestin 2 mutants with a point mutation of aa 169 from arginine to glutamine or a
deletion of aa 383-409 result in “constitutively active” variants, which bind to GPCRs in a
phosphorylation-independent manner and exhibit even stronger stimulation-dependent
receptor desensitization than wild-type β-arrestins (Kovoor et al. 1999). Besides the
physical uncoupling of GPCRs from G proteins, β-arrestins promote the degradation of
second messengers by recruiting the appropriate enzymes (Nelson et al. 2007; Perry et al.
2002).
Moreover, β-arrestins target GPCRs to clathrin-mediated endocytosis by interacting with
both clathrin and the AP-2 adaptor complex. Internalization of GPCRs allows their
degradation in lysosomes, but apparently also plays a role in receptor resensitization
(Zhang et al. 1997) and coupling of desensitized GPCRs to G protein-independent
signaling pathways (Luttrell et al. 1999). The trafficking pattern of internalized GPCRs is
strongly associated with their interaction with β-arrestins. Two classes of GPCRs have
been identified which differ in their interaction with arrestins and their fate upon
internalization (Oakley et al. 2000). ‘Class A’ GPCRs show a stronger affinity for β-arrestin
2 than for β-arrestin 1 and do not interact with visual arrestin. Upon internalization, β-
arrestin dissociates from the receptor and recycles to the plasma membrane. This allows
receptors to become dephosphorylated by a GPCR-specific phosphatase (Pitcher et al.
1995), which is important for receptor recycling to the cell surface, and thus, for
resensitization. ‘Class B’ GPCRs, in contrast, bind to both β-arrestins with equal affinities,
do interact with visual arrestin, and form stable complexes with β-arrestin which are
targeted to endosomes.
β-arrestins are not only important for GPCR desensitization but have recently been
recognized to mediate signaling on their own. This is connected to their role as scaffold
proteins, recruiting intracellular signaling molecules like Src tyrosine kinase family
members and MAPK to complexes. Interestingly, it has been described that β-arrestin-
mediated extracellular signal-regulated kinase (ERK) 1 and 2 activation is a very distinct
mechanism from G protein-mediated ERK activation with respect to kinetics, subcellular
targeting, and cellular effects (Ahn et al. 2004). These different mechanisms can be
targeted by ‘biased’ agonists which promote either one or the other mechanism. Moreover,
ERK activation by β-arrestin seems not to be dependent on GPCR stimulation, but rather
on the translocation of β-arrestin to the membrane (Terrillon and Bouvier 2004). The
universal role of β-arrestin for MAPK signaling can be estimated from the findings that β-
arrestin as well mediates signaling from tyrosine kinase receptors (as described for the

INTRODUCTION 6
Insulin-like Growth Factor 1 (IGF-1) receptor) (Rakhit et al. 2001) and ligand-gated ion
channels (as described for the nicotinic cholinergic receptor) (Dasgupta et al. 2006) to
MAP kinases. Additionally to their functions at the plasma membrane and in the
cytoplasm, β-arrestins translocate to the nucleus where they regulate gene expression,
e.g. by inhibiting NF-B-dependent nuclear transcription (Gao H et al. 2004) and by
facilitating histone deacetylation at specific gene promoters (Kang et al. 2005).
In summary, β-arrestin functions turned out to be by far more diverse than initially
expected, since they are involved in the regulation of a variety of physiological functions,
like chemotaxis, cytoskeletal reorganization, metastasis, apoptosis, and behaviour
(Lefkowitz et al. 2006).
1.1.6 A closer look at GPCR family members: vasopressin, dopamine and
beta-adrenergic receptors
1.1.6.1 Vasopressin receptors
The vasopression receptor family contains three members, AVPR1a, AVPR1b and
AVPR2, which are largely diverse in localization and function. AVPR1a is expressed in
vascular smooth muscle cells, liver, kidney, heart, adrenal gland and brain and is
important for vasoconstriction, aldosterone and corticosterone secretion, glucose
metabolism and platelet aggregation. AVPR1b is found in the anterior pituitary and
throughout the brain and is mostly known for regulation of the hypothalamic-pituitary-
adrenal axis. AVPR2 is mainly localized in the kidney where it induces the insertion of
aquaporin-2 water channels into the plasma membrane of collecting duct cells, allowing
water reabsorption and thereby urine concentration (Harmar et al. 2009). AVPR2
pathologies lead to nephrogenic diabetes insipidus (Pan et al. 1992). AVPR1a and
AVPR1b mainly employ Gq to stimulate phospholipase C whereas AVPR2 causes cAMP
accumulation via Gs (Schoneberg et al. 1998). AVPR2 furthermore signals to ERK via a G
protein-independent, -arrestin 2-mediated pathway (Tohgo et al. 2003).
1.1.6.2 Dopamine receptors
Among the dopamine receptors, 5 different receptors have been identified which can be
classified into D1-like (DRD1 and DRD5) and D2-like (DRD2, DRD3, DRD4) receptors
according to their structural, pharmacological and biochemical features. Dopaminergic
neurons are organized in different pathways throughout the brain: the nigrostriatal pathway
(from the substantia nigra in the midbrain to the striatum), the mesolimbic and

INTRODUCTION 7
mesocortical pathway (from the ventral tegmental area to the nucleus accumbens and the
frontal cortex) and the tuberoinfundibular pathway (from the hypothalamus to the pituitary
gland). Peripheral dopaminergic neurons can be found in kidney, heart and adrenal cortex
(Harmar et al. 2009).
Dopamine receptors are typical examples of GPCRs which are linked to multiple effectors
and can therefore confer highly complex and context-dependent signaling. While D1-like
receptors typically initiate Gs-dependent cAMP signaling (Brown and Makman 1972) and
regulate a variety of ion channels via PKA (Neve et al. 2004), Gq-mediated PLC
activation is employed in some cases (Mahan et al. 1990). Most D2-like receptors inhibit
adenylate cyclase via Gi/o (Jiang et al. 2001), but subunits can alternatively activate
PLC, MAPK, phospholipase A2 or K+ channels (Neve et al. 2004).
Dopamine receptor pathologies in the central nervous system are linked to a variety of
neuropsychiatric disorders such as Parkinson’s disease (Fuxe et al. 2006), schizophrenia
(Lewis and Lieberman 2000), attention-deficit hyperactivity disorder (Tripp and Wickens
2009), and drug addiction (Di Chiara et al. 2004).
1.1.6.3 Beta-adrenergic receptors
Beta-adrenergic receptors are found in a wide variety of tissues throughout the body. The
three subtypes identified so far differ in localization, pharmacological characteristics (such
as sensitivity to their natural ligands, noradrenaline and adrenaline, or response to
antagonists), and function. The beta-2 adrenergic receptor subtype (ADRB2) is mainly
found in lung, kidney, heart, skeletal muscle, liver and brain (Harmar et al. 2009). Major
physiological actions are bronchodilation, blood vessel dilation, increase of cardiac output
due to positive chronotropy and inotropy, and glycogenolysis. In the brain, neuronal
ADRB2 is involved in learning and memory (Gray and Johnston 1987) whereas astrocytic
ADRB2 plays an important role in energy supply and regulation of brain inflammatory
processes (Laureys et al. 2010). ADRB2 is the classical example of a Gs-coupling GPCR.
However, as an example of dual signalling, additional coupling to Gi in cardiac myocytes
seems to restrict cAMP accumulations to local microdomains (Kuschel et al. 1999), and
signaling through its subunit promotes cell survival via a PI3K-Akt pathway (Zhu et al.
2001). ADRB2 furthermore evokes G protein-independent signaling to ERK via a -
arrestin 2-mediated complex with Src kinase (Luttrell et al. 1999).
INTRODUCTION 8
1.2 Signal transduction revised
Until the last two decades, signal transduction has been believed to be the sum of a great
number of linear pathways. Pathways were thought to be organized in a strictly
hierarchical way with a fixed sequence of molecular interactions once the pathway was
initiated. In this paradigm, chemical compounds would initiate the same pathway in every
tissue at any time given. In line with this, it was assumed that diseases are caused by
single defects within signaling pathways and that compensating the respective defect
would cure the disease. There are indeed diseases for which this holds true and in which
selective drugs represent a valuable therapy. For example, almost all of the cases of
chronic myeloic leukemias (CML) are characterized by formation of the Bcr-Abl fusion
protein due to a chromosomal translocation, and unregulated activity of the Abl tyrosine
kinase has been identified as the single cause of the disease (Konopka et al. 1985).
Selective inhibition of tyrosine kinase activity with imatinib turned out to be an efficient
therapy for CML (Druker et al. 1996).
However, it has become apparent that signaling pathways intersect on various levels,
building huge signaling networks (Fig. 1). How is it now possible that distinct pathways use
the same components but still result in different outputs? Roles as signaling molecules can
be assigned to proteins through posttranslational modifications such as phosphorylation,
ubiquitination or acetylation (Scott and Pawson 2009). Signaling can be spatially confined
by compartmentalization in cellular subspaces (Baillie 2009) or by scaffolds which recruit a
specific subset of proteins (Lefkowitz et al. 2006; Weng et al. 1999). Signal duration can
decide about cell fate by promoting either proliferation or differentiation, as has been
shown for ERK signaling in pheochromocytoma PC12 cells, thus adding complexity in a
temporal dimension (Kholodenko et al. 2010; Marshall 1995). Signaling components, e.g.
different MAPK, might require different thresholds for activation and therefore depend on
signal strength (Gong et al. 2001). Nonetheless, extensive crosstalk takes place among
signaling pathways, e.g. by transport between different subcellular compartments (Weng
et al. 1999) or by transactivation across receptor families (Daub et al. 1996). Furthermore,
cells adjust to ongoing signal processes by constantly modifying the molecular equipment
in feedback and feed-forward loops, e.g. by transcriptional regulation (Weng et al. 1999).

INTRODUCTION 9
Fig. 1. Signaling network reconstruction. The diverse connections between components of signaling networks can be described in terms of “nodes” which comprise all interactions of a given component (a), “modules” which group proteins functioning together (b), and “pathways” which describe the connection between a given signaling input and a signaling output (c). Adapted from Papin et al. (2005, p. 104).
Consequently, the function of a given protein results from its interplay with other proteins
within a network and can change depending on the network composition, the molecular
equipment of cells in different tissues, or time.
1.3 Challenges in drug discovery
Despite the sequencing of the human genome and the implementation of high-troughput
screening in drug discovery, the identification of new drug targets did not substantially
increase, as was believed to be essential for the development of new drugs. Moreover,
the number of drug targets does not necessarily translate into the number of newly
developed drugs. Indeed, the number of drug targets of all currently available drugs can
be pinned down to about 300, and the majority of new drugs is directed against targets
that have been known for quite a while (Overington et al. 2006; Yildirim et al. 2007). On
the other hand, many drugs in the pipeline fail in phase II and III trials due to the lack of
efficacy or safety (Hopkins 2008). Hence, traditional approaches in drug discovery need to
be revised by integrating current knowledge on the systems biology level.
Signaling networks where signaling molecules are interconnected in diverse ways are
protected against perturbance by redundancy of functions. Interactions between
components are in this sense more vulnerable than the single components themselves
(Boran and Iyengar 2010; Kitano 2007). Thorough evaluation of the diverse functions of a
drug target within signaling networks in a context-dependent manner is therefore a key for
future drug discovery. Moreover, multicomponent drugs or the sequential use of different
drugs as known from cancer treatment might be ways to target signaling networks. All this

INTRODUCTION 10
reinforces the call for the development of theoretical modeling systems as well as
assumption-free, complex assay systems (Hopkins 2008; Kenakin 2009; Kitano 2007;
Weng et al. 1999).
1.4 GPCR assays
GPCRs have been analyzed for several decades with a continuously growing spectrum of
tools. Several levels of GPCR signaling have been addressed: ligand-binding assays
which mainly use radioactive labelling of ligands to assess their affinity, assays to measure
GPCR/G protein association via binding of the radiolabeled, non-hydrolyzable GTP analog
[35S]GTPS, assays monitoring GPCR/-arrestin interactions, assays which measure
intracellular second messenger levels with various readouts or are coupled to second
messenger responsive elements, and label-free assays like electrical impedance
measurements and optical methods are available (extensive reviews on GPCR screening
assays can be found in Eglen et al. (2007), Fang et al. (2008) and Thomsen et al. (2005)).
The stimulation-dependent interaction between GPCRs and -arrestins has been widely
used in cell-based assays to monitor GPCR activation (Eglen et al. 2007; Lefkowitz et al.;
Thomsen et al. 2005). Current approaches include indirect measurements based on the
translocation of -arrestin2-green fluorescent protein (GFP) fusion proteins upon
stimulation by microscopy (Barak et al. 1997; Ghosh et al. 2005) and direct protein
interaction assays based on Bioluminescence Resonance Energy Transfer (BRET)
(Hamdan et al. 2005; Vrecl et al. 2004), Fluorescence Resonance Energy Transfer (FRET)
(Krasel et al. 2008), or complementation of β-galactosidase fragments (Yan et al. 2002;
Zhao et al. 2008). In addition, protease proximity assays termed Tango® have been
developed using a reporter gene system as readout (Barnea et al. 2008). In the Tango®
assay, the interaction of GPCR and -arrestin 2 (Arr2) fusion proteins brings the TEV
protease and its specific cleavage site into close proximity releasing a fused transcription
factor by proteolytic cleavage (Barnea et al. 2008). The transcription factor induces the
expression of reporter genes, such as firefly luciferase or -lactamase which can be
quantitatively analyzed using appropriate substrates (de Wet et al. 1987; Zlokarnik et al.
1998).
1.5 The split-TEV system
The split-TEV system is a novel technique which allows the monitoring of constitutive and
regulated protein-protein interactions (PPIs) at the membrane and in the cytosol of living

INTRODUCTION 11
mammalian cells (Fig. 2) (Wehr et al. 2006). This system combines the advantages of split
enzyme- and reporter gene-mediated assays. A major component of the technique is the
NIa protease of the tobacco etch virus (TEV protease), which shows high substrate
specificity and lacks endogenous substrates in mammalian cells. In split-TEV, the catalytic
triad of the TEV protease (His46, Asp81, and Cys 151) is split onto N- and C-terminal TEV
protease fragments (referred to as N-TEV and C-TEV), which on their own do not exhibit
any proteolytic activity. Split-TEV can be used to investigate specific PPIs, since TEV
protease activity is only reconstituted upon transcomplementation of N- and C-TEV fusion
proteins (Fig. 2a).
Previous assays have shown that the N-TEV(1-118)/C-TEV(119-242) pair is particularly
suited for transcomplementation, displaying ~30-40% proteolytic activity compared to the
full-length TEV protease (Wehr et al, 2006). Owing to the fact that the C-terminus of the
TEV protease can back-fold into the catalytic center of the protease (Nunn et al. 2005), C-
TEV was truncated deleting amino acids 222-242 and adding a point mutation at amino
acid position 219 (S219P). These modifications have increased the proteolytic activity of
the transcomplemented split-TEV, compared to the ‘native’ split-TEV fragments. Thus, N-
TEV(1-118)/C-TEV(119-221_S219P) is used as the preferred TEV pair in split-TEV
assays.
TEV protease activity is monitored by the release of a reporter, which is coupled to the
specific cleavage site of the TEV protease, ENLYFQ'G (tevS). As split-TEV reporter
systems, either inactivated reporter proteins (‘proteolysis-only’ reporters) or inactivated
transcription factors (‘transcription-coupled’ reporters) can be used. ‘Proteolysis-only’
reporters are directly activated upon TEV-protease cleavage. In contrast, ‘transcription-
coupled’ reporters require two subsequent steps: first, release of the transcription factor by
proteolytic cleavage, and second, transcriptional activation of the reporter (Fig. 2b). A
transcription factor, termed GV, has been designed for the split-TEV system by fusion of
the yeast Gal4 deoxyribonucleic acid (DNA)-binding domain to the herpes-simplex VP16
transactivation domain. GV can be used to activate reporters such as the Gal-4 responsive
Firefly luciferase or the Gal4-responsive EGFP. The flexible use of the split-TEV system
for different applications is given by the availability of both membrane-bound and cytosolic
reporter systems. To increase the sensitivity for membrane-localized PPIs, GV can be
fused to the C terminus of the membrane protein-TEV protease fragment. Thereby, the
TEV-protease substrate is brought into close proximity of the transcomplemented TEV
protease.

INTRODUCTION 12
An important feature of the split-TEV system is the implemented enzymatic amplification,
one for ‘proteolysis-only’ reporters and several for ‘transcription-coupled’ reporters. This
way, transient interactions can be converted into a permanent signal, thus enabling the
detection of weak PPIs.
The split-TEV system has been successfully implemented to monitor the interaction of
native membrane proteins as well as cytosolic proteins. Furthermore, it has been shown to
be sensitive to stimulus-dependent interactions. Finally, which was shown for ErbB
receptor tyrosine kinase signaling events, the split-TEV system is suited to analyze
signaling events at different levels (Wehr et al. 2006; Wehr et al. 2008).
Fig. 2. Principle of split-TEV with the membrane-bound, transcription-coupled reporter system. (a) The N-TEV and the C-TEV fragment of the TEV protease are coupled to two proteins of interest. Protein-protein interaction leads to the transcomplementation of the TEV protease and thus, to TEV protease activity. (b) (1) TEV protease activity localized to the membrane leads to the cleavage of the Gal4-VP16 transcription factor (GV). (2) GV translocates to the nucleus, (3) where it binds to its specific DNA-binding sequence (G5-promoter) und induces the transcription of the reporter gene (e.g., EGFP or Firefly luciferase. TM-GV: GV coupled to the transmembrane domain of the human PDGFα receptor; tevS: specific cleavage site of the TEV protease, ENLYFQ’G, G5: 5-fold Gal4-responsive element. Adapted from Wehr et al. (2006, p. 986-987).

INTRODUCTION 13
1.6 Aim of the study: Development of a split-TEV assay for G protein-
coupled receptors
The aim of the project was to develop a split-TEV assay to quantitatively measure the
activation of GPCRs. The split-TEV system was applied to measure the interaction of β-
arrestins with GPCRs, since this interaction is specific for activated GPCRs and can thus
be used as a correlate for GPCR activation.
A selection of GPCRs was examined which are coupled to different downstream signaling
pathways and show distinct interaction kinetics for β-arrestins. As examples, the
vasopressin receptors AVPR1a and AVPR2, the dopamine receptors DRD1 and DRD2
and the beta-adrenergic receptor ADRB2 were chosen. Among the β-arrestins, β-arrestin
2 (βArr2) was found to be particularly suited for split-TEV assays since its localization is
restricted to the cytosol.
β-arrestin-2 and GPCRs were implemented in the split-TEV system through the generation
of fusion proteins with the respective TEV fragments. Assays were performed using
transcription-coupled reporter systems, which activate the expression of Firefly luciferase.
To monitor GPCR activation, receptors were treated with their natural ligands during the
assays.
During development of the assay, several key questions were addressed:
- are GPCR constructs cleavable by TEV protease?
- do GPCR and Arr2 constructs interact and can this be measured with the
reporters?
- do GPCR constructs exhibit physiological behaviour?
- are GPCR split-TEV assays applicable in different cell types, including primary
cells?
- how sensitive are GPCR split-TEV assays in comparison to other GPCR assays?

MATERIALS 14
2 Materials
2.1 Chemicals and reagents
6x DNA Loading Dye Fermentas
Agarose Bio-Rad, FMC
Ampicillin Sigma
Arginine vasopressin (AVP) Sigma
ATP PJK
Bacto Agar BD Biosciences
Bacto Peptone BD Biosciences
Bacto Yeast Extract BD Biosciences
BME Invitrogen
BSA Sigma
Coelenteracin PJK
Coenzyme A PJK
db-cAMP Biolog, Bremen
DMSO Merck
DNA Ladders (100 bp, 1 kb) Fermentas
Dopamine hydrochloride Sigma
Dulbecco’s modified eagle medium (DMEM) Invitrogen
DTT PJK
EDTA Sigma
Ethidium bromide Sigma
Fetal bovine serum (FBS) Invitrogen
Gentamycin SIgma
Glacial acetic acid Merck

MATERIALS 15
L-Glutamine Invitrogen
GlutaMAXTM Invitrogen
Glycerin Sigma
Glycogen Roche
HBSS Invitrogen
Hoechst dye Sigma
Horse serum (HS) Sigma
Ionomycin Sigma
Isopropanol Merck
(-)-Isoproterenol hydrochloride Sigma
Kanamycin Sigma
KCl Merck
KH2PO4 Merck
KxPO4 Merck
D-Luciferin PJK
McCoy’s A Invitrogen
MgCl2 Merck
4(MgCO3)*Mg(OH)2*5H2O Merck
MgSO4 Merck
NaCl Merck
Na2-EDTA Merck
Na2HPO4*2H2O Merck
NaN3 Merck
NEAA Invitrogen
Opti-MEM® Invitrogen
Papain Worthington Biochemical Corp.
MATERIALS 16
PEG 8000 Promega
Penicillin/Streptavidin Sigma
Phorbol myristate acetate (PMA) Sigma
Poly-L-lysine Sigma
Poly-L-ornithine Sigma
RPMI Invitrogen
Tricine Merck
Tris Base Merck
Tris-HCl Merck
Trypsine Invitrogen
Zeocin Invivogen
2.2 Consumables
Cryo tubes Nunc
1.5 ml and 2 ml tubes Eppendorf
5 ml, 15 ml and 50 ml tubes Falcon
10 cm and 15 cm cell culture dishes Falcon
96-well flat-bottom plates Falcon
2.3 Equipment
Centrifuges Sorvall Du Pont, Heraeus, Eppendorf
Digital camera ProgRes C14 Jenoptik
FACSAria flow cytometer BD Biosciences
GenePulser Xcell Biorad
Luminometer MicroLumatPlus LB 96 V Berthold Technologies
Microscopes Leica DM IRBE (Invers)

MATERIALS 17
Leica DM RXA
PCR machines Biometra
Photometer (GenequantII, Ultraspec 3000) Pharmacia
Sterile hood Heraeus
Thermocycler T3 Biometra
UV-Illuminator Intas Systems
2.4 Ready-made reaction systems
GATEWAY Recombination System Invitrogen
NucleoSpin Plasmid Quick Pure Macherey-Nagel
NucleoBond PC100 Midiprep Macherey-Nagel
NucleoSpin Extract II Macherey-Nagel
2.5 Enzymes
Restriction enzymes New England Biolabs
HotStarTaq DNA Polymerase Qiagen
Pfu Ultra Advanced DNA Polymerase Stratagene
BP Clonase II Invitrogen
LR Clonase II Invitrogen
2.6 Solutions and buffers
2.6.1 Molecular biological solutions
PBS (Phosphate-buffered Saline)
NaCl 1.7 M
KCl 34 mM

MATERIALS 18
Na2HPO4*2H2O 40 mM
KH2PO4 18 mM
in H2O, adjusted to pH 7.2
Tris-EDTA (TE buffer)
Tris-HCl (pH 7.4) 10 mM
EDTA (0.5 M) 1 mM
TAE (50x)
Tris-Base 2M
EDTA 50 mM
adjusted to pH 8 with glacial acetic acid
filled up to 1000 ml with H2O
Ethidium bromide
Ethidium bromide 1% in H2O 10 mg/ml
Final concentration in gel 1 g/ml
PEG/MgCl2
40 g PEG 8000
in 100 ml of 30 mM MgCl2
LB medium (Luria and Bertani medium)
BactoTM Yeast Extract 0.5% (w/v)
BactoTM Peptone pH 7.5 1% (w/v)
NaCl 1% (w/v)
Low salt 0.5% (w/v)

MATERIALS 19
LB/Amp: 200 µg/ml ampicillin in LB medium
LB/Kan: 50 µg/ml kanamycin in LB medium
LB/Genta: 25 µg/ml gentamycin in LB medium
LB/Zeo: 30 µg/ml zeocin in low-salt LB medium
LB Agar Plates
BactoTM Yeast Extract 0.5% (w/v)
BactoTM Peptone pH 7.5 1% (w/v)
NaCl 1% (w/v)
Low salt 0.5% (w/v)
BactoTM Agar 1.5% (w/v)
Antibiotics were added as described for LB medium
2.6.2 Solutions for luciferase assays
Renilla luciferase plasmid mix
pRLuc/SV40 100 μg
phRLuc/TK 20 μg
phRLuc/CMV 10 μg
pEYFPnuc 130 μg
filled up to 1.3 ml with 10 mM Tris, pH 8.5
final concentration: 200 ng/µl (100 ng/µl Renilla luciferase plasmids, 100 ng/µl EYFPnuc)
Passive Lysis Buffer
Promega (5x), dilute in ddH2O

MATERIALS 20
Firefly Luciferase Substrate
In 500 ml
Tricine 20 mM
(MgCO3)4*Mg(OH)2*5H2O 1.07 mM
MgSO4 2.67 mM
EDTA 0.1 mM
DTT 33.3 mM
Coenzyme A 270 M
D-Luciferin, free acid 470 M
ATP 530 M
To dissolve magnesium carbonate, pH was titrated until the solutions turns clear. pH was
then adjusted to 7.8 using 5 M NaOH. Luciferin and coenzyme A were added in the end.
Storage under light protection at -20°C. Thawn at room temperature.
Renilla Luciferase Substrate
NaCl 1.1 M
Na2-EDTA 2.2 mM
KxPO4 (pH 5.1) 0.22 M
BSA 0.44 mg/ml
NaN3 1.3 mM
coelenterazine 1.43 mM
adjusted to pH 5.0, then coelenterazine (dissolved in ethanol) was added. Storage under
light protection at -20°C. Thawn at room temperature.

MATERIALS 21
2.6.3 Cell culture solutions
PLL 250x
Poly-L-lysine in H2O 5 mg/ml
Final concentration 20 µg/ml
PLO 100x
Poly-L-ornithine in H2O 1.5 mg/ml
Final concentration 15 µg/ml
PC12 tet-off Medium
DMEM (1 g/l glucose) 500ml
HS 10%
FBS 10%
GlutaMAXTM 2 mM
Penicillin/Streptomycin 100 U/ml each
U2OS Medium
McCoy’s 5A + L-glutamine 500ml
dialyzed FBS 10%
NEAA 0.1 mM
Penicillin/Streptomycin 100 U/ml each
HEK 293 Medium
DMEM (4.5 g/l glucose) 500ml
FBS 10%
GlutaMAXTM 2 mM

MATERIALS 22
Penicillin/Streptomycin 100 U/ml each
for stably transfected HEK 293-Arr2-C-TEV, 200 µg/ml G418 were added to maintain
selection
Medium for primary cultured neurons
RPMI 500 ml
FBS 10%
GlutaMAXTM 2 mM
Penicillin/Streptomycin 100 U/ml each
Medium for primary cultured astrocytes
BME 500 ml
FBS 10%
GlutaMAXTM 2 mM
Penicillin/Streptomycin 100 U/ml each
2x Freezing medium for eucaryotic cell lines
DMEM 40%
DMSO 20%
FBS 40%
2.7 Oligonucleotides
deoxynucleotide trisphosphates (dNTPs) Boehringer
GeneRulerTM 100bp und 1kb marker Fermentas

MATERIALS 23
Oligo name 5’-3’ sequence #
AVPR1a-B1 sense GGGGACAAGTTTGTACAAAAAAGCAGGCTCT
ACCATGGACAGCATGCGTCTCTCCGC
11989
AVPR1a-B2 antisense GGGGACCACTTTGTACAAGAAAGCTGGGTCA
GTTGAAACAGGAATGAATTTGATGGACTTGG
AAG
11990
AVPR2-B1 sense GGGGACAAGTTTGTACAAAAAAGCAGGCTCT
ACCATGCTCATGGCGTCCACCACTTC
9242
AVPR2-B2 antisense GGGGACCACTTTGTACAAGAAAGCTGGGTCC
GATGAAGTGTCCTTGGCCAGG
9243
DRD1-B1 sense GGGGACAAGTTTGTACAAAAAAGCAGGCTCT
ACCATGAGGACTCTGAACACCTCTGCCATG
12488
DRD1-B2 antisense GGGGACCACTTTGTACAAGAAAGCTGGGTC
GGTTGGGTGCTGACCGTTTTGTGTG
12489
DRD2-B1 sense GGGGACAAGTTTGTACAAAAAAGCAGGCTCT
ACCATGGATCCACTGAATCTGTCCTGGTATG
9236
DRD2-B2 antisense GGGGACCACTTTGTACAAGAAAGCTGGGTC
GCAGTGGAGG ATCTTCAGGAAGG
9237
ADRB2-B1 sense GGGGACAAGTTTGTACAAAAAAGCAGGCTCT
ACCATGGGGCAACCCGGGAACGG
11987
ADRB2-B2 antisense GGGGACCACTTTGTACAAGAAAGCTGGGTCT
AGCAGTGAGTCATTTGTACTACAATTCCTCC
11988
bARR2-B1 sense GGGGACAAGTTTGTACAAAAAAGCAGGCTCT
ACCATGGGGGAGAAACCCGGGACC
13930
bARR2-B2 antisense GGGGACCACTTTGTACAAGAAAGCGGGTCG
CAGAGTTGATCATCATAGTCGTCATCC
13931
bARR2∆-B1 antisense GGGGACCACTTTGTACAAGAAAGCTGGGTCT
GTGGCATAGTTGGTATCAAATTCAATGAGG
17925
VC-N-TEV_s sense ATATGGATCCGCCCGGGGACGCACCCC 3023TF
VC-N-TEV_as antisense GTTAACAATGCTTTTATATCCTGTAAAGAATC
CATTTTCAAAATCATGTCAAGGTCTTCTCGAG
G
15004

MATERIALS 24
N-TEV-tevS-
GV_s
sense AAAATGGATTCTTTACAGGATATAAAAGCATT
GTTAAC
15003
N-TEV-tevS-
GV_as
antisense CATTTAGGTGACACTATAGAATAGGGCCC 3065TF
KpnI_VC-N-
TEV-tevS-GV
sense ATATGGTACCGCCCGGGGACGCACCCCAA 15172
VC-N-TEV-
tevS-GV-SbfI
antisense ATATCCTGCAGGTTAATAATAAAAATCATAAA
TCATAAGACATTCGCCCG
15173
tevS*_s sense CGAGAACCTGTACTTCCAGCTTTCTAGAGAA
CAGAAGCTG
2978
tevS*_as antisense CAGCTTCTGTTCTCTAGAAAGCTGGAAGTAC
AGGTTCTCG
2979
2.8 Plasmids
Plasmid name Resistance
pcDNA3 AmpR
3xFlag-TEV AmpR
pG5-FireflyLuciferase AmpR
pG5-EYFPnuc KanR
pG5-tdTomato KanR
cre-luciferase AmpR
nfat-luciferase AmpR
pDONR 207 GentaR
pENTR_AVPR1a GentaR
pENTR_AVPR2 GentaR
pENTR_DRD1 GentaR
pENTR_DRD2 GentaR
pENTR_ADRB2 GentaR

MATERIALS 25
pENTR_Arr2 GentaR
pENTR_Arr2383 ZeoR
pDEST_EF5/FRT/V5 AmpR
pDEST_X-N-TEV-GV AmpR
pDEST_X-N-TEV-tevS*-GV AmpR
pDEST_X-VC-N-TEV-tevS-GV AmpR
pDEST_X-VC-N-TEV-tevS*-GV AmpR
pDEST_X-TEV KanR
pDEST_X-C-TEV KanR
pEXPR_Arr2-C-TEV KanR
pEXPR_Arr2-C-TEV KanR
pEXPR_Arr2-TEV AmpR
pEXPR_Arr2-TEV AmpR
pEXPR_AVPR1a-N-TEV-tevS-GV AmpR
pEXPR_AVPR1a-N-TEV-tevS*-GV AmpR
pEXPR_AVPR1a-VC-N-TEV-tevS-GV AmpR
pEXPR_AVPR1a-VC-N-TEV-tevS*-GV AmpR
pEXPR_AVPR2-N-TEV-tevS-GV AmpR
pEXPR_AVPR2-N-TEV-tevS*-GV AmpR
pEXPR_DRD1-VC-N-TEV-tevS-GV AmpR
pEXPR_DRD1-VC-N-TEV-tevS*-GV AmpR
pEXPR_DRD2-VC-N-TEV-tevS-GV AmpR
pEXPR_DRD1-VC-N-TEV-tevS*-GV AmpR
pEXPR_DRD2-N-TEV-tevS-GV AmpR
pEXPR_DRD2-VC-N-TEV-tevS-GV AmpR
pEXPR_DRD2-VC-N-TEV-tevS*-GV AmpR

MATERIALS 26
pEXPR_ADRB2-N-TEV-tevS-GV AmpR
pEXPR_ADRB2-N-TEV-tevS*-GV AmpR
AmpR: ampicillin resistance, GentaR: gentamycin resistence, KanR: kanamycin resistance,
ZeoR: zeocin resistance
2.9 Bacteria strains
MegaX DH10B TM (electrocompetent) Invitrogen
One Shot® Mach1TM (chemocompetent) Invitrogen
2.10 Eucaryotic cell lines
PC12 tet-off rat pheochromocytoma cell line carrying the Tet-off transactivator
protein
U2OS human osteosarcoma cell line
HEK 293 human embryonic kidney cell line
HEK-Arr2-C-TEV HEK 293 cell line stably transfected with Arr2-C-TEV

METHODS 27
3 Methods
3.1 Molecular biological techniques
3.1.1 The GATEWAY Technology
Cloning was done with the GATEWAY Cloning Technology (Invitrogen) which uses the
bacteriophage λ system for site-specific recombination in E.coli (Hartley et al. 2000).
Bacteriophage λ has four recombination sites, attB, attP, attL and attR, which recombine
specifically according to the scheme attB x attP ↔ attL x attR. Integration into the E.coli
genome (attB x attP reaction) is mediated by the proteins Int (integrase, encoded by
phage λ) and IHF (integration host factor, encoded by E.coli) whereas excision from the
genome (attL x attR rection) is mediated by Int, IHF, and Xis (excisionase, encoded by
phage λ). These recombination reactions are conservative, which means they occur
without net gain or loss of nucleotides.
The bacteriophage λ recombination system has been modified in the Gateway Cloning
Technology to maintain the orientation of the gene of interest throughout the
recombinations. Through mutations in the core regions of the recombination sites, specific
att sites (attB1, attB2, attP1, attP2, attL1, attL2, attR1, attR2) have been generated which
react only in the way attB1 x attP1, attB2 x attP2, attL1 x attR1, and attL2 x attR2. By
flanking the gene of interest by a pair of these specific att sites (e.g. attB1 at the N-
terminus and attB2 at the C-terminus), the orientation remains unaffected by
recombination. Isolation of the recombination product was made possible by positive
selection for resistance and negative selection against the lethal ccdB gene which
interferes with DNA gyrase.
Under these preconditions, a system with four kinds of vectors was built up (Fig. 3):
The transcriptionally silent Entry Vector (pENTR, GentaR or ZeoR) which contains the gene
of interest flanked by attL sites allows flexible transfer of this gene into various Expression
Vectors (pEXPR, AmpR or KanR) for the expression of native or fusion proteins (carrying
attB sites).
The Destination Vector (pDEST, AmpR or KanR) carries the “controlling cell death B”
(ccdB) gene flanked by attR sites and is used to recombine an Entry Clones (Vector +
gene of interest) to an Expression Clone in a so-called LR reaction.

METHODS 28
The Donor Vector (pDONR, GentaR or ZeoR) contains the ccdB gene flanked by attP sites
and mediates the back-recombination of an Expression Clone to an Entry Clone in a “BP
reaction”.
Entry Clones can be generated in different ways, including classical cloning and PCR. The
latter approach includes amplification of the gene of interest flanked by attB sites and a
subsequent BP reaction.
Fig. 3. GATEWAY cloning procedure. BP reaction (BP). The gene interest (available e.g. as PCR product) can be recombined with a donor vector to give rise to an entry clone. A by-product carrying the lethal ccdB gene is generated as well. LR reaction (LR). An entry clone can be recombined with a destination vector to an expression clone. Again, a byproduct carrying the ccdB gene is generated.

METHODS 29
The basis for the high efficiency of the Gateway technology can be exemplified by the LR
reaction: an Entry Clone is recombined with a Destination Vector to an Expression Vector.
The Entry Clone is gentamycin- or zeocin-resistant whereas the Destination Vector and
the Expression Clone carry an ampicillin- or kanamycin-resistance. The recombination
reaction is transformed in E.coli and selection for the recombination product is done on
Amp- or Kan-positive agar plates, respectively. Selection for resistance favors the
Destination Vector, intermediates of the recombination and the Expression Clone, but
since the ccdB gene lethal to E.coli is present in both the Destination Vector and reaction
intermediates, the Expression Clone is obtained with high efficiency.
3.1.2 Cloning strategy
All expression constructs were generated by Gateway cloning (Invitrogen). Human
AVPR1a (NM000706.3), AVPR2 (NM000054.4), DRD1 (NM000794), DRD2 (NM016574),
ADRB2 (NM000024) and ARR2 (-arrestin 2, BC067368) were amplified from a mix of
human liver, heart, uterus and fetal and adult brain cDNAs using proofreading
polymerases. Gateway-compatible PCR products were generated in a C-open form (N-
terminal Kozak sequence, no stop codon) by using the primer pairs 11989/11990,
9242/9243, 12488/12489, 9236/9237, 11987/11988, 13930/13931, respectively (see
section 2.7 for oligonucleotide sequences). The truncation mutant ARR2∆383 (ARR2∆)
was amplified using the primers 13930 and 17925.
PCR products were recombined with the pDONR 207 vector to obtain pENTR clones.
These were further recombined with a pDEST vector to produce pEXPR clones.
Customized pDEST vectors generated according to the manufacturer’s protocols were
used unless stated otherwise. pDEST_N-TEV-tevS-GV comprised aa 1-118 of the TEV
protease, the TEV protease cleavage site ENLYFQ’G and a fusion of yeast Gal4 DNA-
binding domain and the herpes simplex VP16 transactivation domain, as previously
described (Wehr et al. 2006). pDEST_X-C-TEV contained aa 119-221 of the TEV protease
including the point mutation S219P. pDEST_TEV contained the full-length TEV protease.
pDEST_X-VC-N-TEV-tevS-GV included aa 343-371 of the AVPR2 receptor C-tail (VC)
positioned N-terminally of the N-TEV fragment (Barnea et al. 2008). VC-N-TEV was
amplified from pEXPR_AVPR2-N-TEV-tevS-GV with the primers 3023 TF and 15004
whereas N-TEV-tevS-GV was amplified from pDEST_N-TEV-tevS-GV with the primers
15003 and 3065TF. A fusion PCR using the primers 3023TF and 3065TF yielded VC-N-
TEV-tevS-GV. This product was subjected to another PCR with the primers 15172 and

METHODS 30
15173 to attach a 5’terminal KpnI and a 3’SbfI site for subcloning into a pCMV vector. A
pDEST vector was generated from this final construct.
pDEST_X-N-TEV-tevS*-GV and pDEST_X-VC-N-TEV-tevS*-GV contained the mutated,
low-affinity TEV protease cleavage site ENLYFQ’L (tevS*). These vectors were created by
site-directed mutagenesis of pDEST_X-N-TEV-tevS-GV and pDEST_X-VC-N-TEV-tevS-
GV, respectively, using the primers 2978 and 2979.
Backbone expression vectors used were pBK-CMV (Stratagene) and pcDNA 3.1
(Invitrogen).
V5 epitope-tagged receptors (C-terminally attaching the amino acids GKPIPNPLLGLDST)
were obtained by recombination of pENTRs into the pEF5/FRT/V5-DEST vector.
Reporter gene constructs used were G5-luciferase (five clustered Gal4-responsive cis
elements coupled to the firefly luciferase gene, as described in (Wehr et al. 2006)), cre-
luciferase and nfat-luciferase.
All constructs were verified by sequencing of both strands (AG Benseler, MPI for
Experimental Medicine, Göttingen).
3.1.3 Polymerase Chain Reaction
Polymerase Chain Reaction (PCR) was performed using the following composition:
x μl DNA template (10 – 100 ng)
1 μl sense primer (10 pmol/μl)
1 μl anti-sense primer (10 pmol/μl)
5 μl 10x buffer (with MgCl2)
5 μl dNTPs (final concentration: 0.2 mM)
0,2 μl proofreading DNA Polymerase (2.5 U/μl)
ddH2O up to 50 µl
PCRs were performed using the following standard protocol, with a variable cycle number
of 25-35:
95°C, 3 min: initial denaturation
95°C, 30 s: denaturation (cycle)

METHODS 31
56°C, 30 s: annealing (cycle)
72°C, 60 s: extension (cycle, 3 min for long fragments)
72°C, 10 min: final extension
hold at 4°C.
PCR products were mixed with 6x Loading Dye and analyzed on 1.5% agarose gels
containing 1 µg/ml ethidium bromide. Gel electrophoresis was done at 100-160 V in a gel
chamber containing TAE buffer. DNA fragments were visualized with a UV illuminator.
3.1.4 Extraction of DNA fragments from agarose gels
DNA fragments were cut from agarose gels and extracted using the NucleoSpin Extract II
Kit (Macherey-Nagel) according to the manufacturer’s instructions. In principle, agarose
slices were solubilised and adjusted for binding to a silica membrane. Upon adsorption,
DNA was washed and eluted under low-salt conditions in 50 µl elution buffer.
3.1.5 DNA purification by precipitation with polyethylene glycol (PEG)
PEG precipitation was performed to clean plasmid DNA from small-size DNA fragments
(<300 bp), such as primer dimers or fragments originated from restriction digests. Plasmid
DNA was diluted 4-fold with TE buffer, mixed with ½ volume of PEG/MgCl2 and 1-3 µl
glycogen carrier, and centrifuged at room temperature for 15 min at 13000 rpm. After
removal of the supernatant, the pellet was resuspended in TE buffer, according to the final
concentration wanted.
3.1.6 BP and LR reactions
BP and LR reactions were set up in the following way:
BP reactions:
3 µl PCR product
1 µl pDONR vector (100 ng/µl)
1 µl BP clonase II

METHODS 32
LR reactions:
1 µl pENTR clone
1 µl pDEST vector (100 ng/µl)
0.5 µl LR clonase II
BP and LR reactions were incubated overnight at room temperature. Reactions were
stopped by proteinase K treatment for 10 min at 37°C with subsequent enzyme
inactivation for 10 min at 95°C. BP and LR reactions were transformed into DH10B
electrocompetent cells or One Shot® Mach1TM chemocompetent cells.
3.1.7 Transformation of DNA into chemocompetent bacteria
2 µl of recombination reaction were incubated with 25 µl of One Shot® Mach1TM cells for
30 min on ice. Cells were then heat-shocked for 30 s at 42°C and incubated on ice for
another 5 min. After addition of 250 µl of S.O.C. medium, the transformation reaction was
incubated on a shaker for 1 h at 37°C. The transformation reaction was spread on pre-
warmed selective agar plates and incubated overnight at 37°C.
3.1.8 Transformation of DNA into electrocompetent bacteria
20 µl of DH10B cells, diluted 1:4 in 10% glycerol in H2O, were incubated with 1.5 µl of
recombination reaction for 5 min on ice. Cells were transferred to a 1 mm-electroporation
cuvette and electroporated at 1700 kV, 25 µF, and 200 Ω. After addition of 1000 µl of cold
LB medium, the transformation reaction was incubated on a shaker for 1 h at 37°C. The
transformation reaction was spread on selective agar plates and incubated overnight at
37°C.
3.1.9 Preparation of plasmid DNA
Single bacterial colonies from LB agar plates were transferred into 4 ml of selection
medium and grown overnight in a shaking incubator at 37°C. Subsequently, bacteria were
harvested by centrifugation at 13000 rpm for 1 min. For the preparation of larger amounts
of plasmid DNA, 150 ml of bacterial cultures were inoculated, incubated overnight, and
harvested by centrifugation at 4000 rpm for 15 min at 4°C.

METHODS 33
Plasmid DNA was prepared by use of the NucleoSpin Plasmid Quick Pure (Macherey-
Nagel, for low amounts of plasmid) and the NucleoBond PC100 Midiprep kit (Macherey-
Nagel, for larger amounts of plasmid) according to the manufacturer’s instructions. In
principle, bacteria were lysed under alkaline conditions to denature plasmid and
chromosomal DNA, and proteins. Chromosomal DNA and proteins were then precipitated
under high-salt conditions. Plasmid DNA was adsorbed to a silica membrane (Miniprep
Kit) or an anion-exchange resin (Midi Kit), washed, and eluted under low-salt conditions in
100 µl (mini prep) or 1 ml (midi prep) elution buffer.
3.1.10 Restriction digests
All subclones generated throughout the described cloning procedure were analyzed by
digests with type II restriction enzymes. Analytical digests were done in an overall volume
of 20 µl, including 2 µl of 10x restriction buffer and 0.5 µl of enzyme. Plasmid DNA was
used in a concentration range of 0.5-1 µg. The respective restriction buffer for each
enzyme was chosen according to the manufacturer’s instructions. Double digests were
carried out with enzymes with matching restriction buffers, using 0.5 µl of each enzyme.
Digests were incubated at 37°C for 1-2 h and analyzed on an agarose gel.
3.2 Cell culture techniques
3.2.1 Basic cell culture techniqes
Early passages of mammalian cell lines (PC12-tetoff, U2OS) frozen in liquid nitrogen were
quickly thawn at 37°C. The cell suspension was transferred to a Falcon tube filled with 10
ml culture medium and centrifuged for 5 min at 800 rpm to remove DMSO. Cells were
resuspended in culture medium and plated on 15 cm-dishes. To allow better adherence,
PC12 cells were plated on poly-L-lysine (PLL) coated dishes (0.02 mg/ml PLL in H2O,
incubated for 30 min at room temperature).
PC12-tetoff cells were grown in DMEM (1g/l glucose), supplemented with 10% fetal bovine
serum (FBS), 10% horse serum (HS), 2 mM GlutaMAXTM, and 100 U/ml each of penicillin
and streptomycin. U2OS cells were grown in McCoy’s A medium, supplemented with 10%
dialyzed FBS, 0.1 mM non-essential amino acids (NEAA), and 100 U/ml of
penicillin/streptomycin. HEK 293 cells were grown in DMEM (4.5 g/l glucose),
supplemented with 10% FBS, 2 mM GlutaMAXTM, and 100 U/ml each of penicillin and

METHODS 34
streptomycin. HEK cells stably transfected with Arr2-C-TEV additionally received
200µg/ml G418 to maintain selection. Medium changes were performed every 2-3 days,
and cells were passaged at near confluency every 4-7 days.
During passaging, cells were washed with PBS and then treated with 2.5 ml
trypsine/EDTA for 1-3 min to break down cell contacts and cell adhesion. Trypsinization
was stopped by addition of cell-culture medium, and cells were dissociated to single cells
by pipetting up and down. Cells were spread on new dishes with fresh culture medium in a
ratio of 1:20 - 1:4, according to the actual requirements.
To plate cells for luciferase assays, cells were dissociated, transferred to a Falcon tube,
and centrifuged for 5 min at 800 rpm. Cells were resuspended in a defined volume of
culture medium, counted in a Neubauer counting chamber, and plated at the required
density.
For conservation in liquid nitrogen, cells were dissociated, centrifuged, and resuspended
in 500 µl culture medium per 5x10⁶ cells. Cells were transferred to cryo tubes in 500 µl
aliquots, and 500 µl of DMSO-supplemented 2x freezing medium were added to each
tube. Cryo tubes were frozen at -20°C for 1-2 hrs and subsequently at -80°C overnight,
and transferred to liquid nitrogen the next day.
3.2.2 Primary cell culture
For primary neuronal cell culture, brains from E18 Sprague Dawley rat embryos were
prepared as described (Wehr et al. 2006). Briefly, after removal of the meninges and the
cerebellum, cortex was isolated. Cortices were washed three times with fresh HBSS and
then incubated with 5 ml of papain solution for 10 min at 37°C. Cells were subsequently
washed three times with fresh HBSS and triturated in 5 ml RPMI medium (supplemented
with 10% FBS, 2 mM GlutaMAXTM, and 100 U/ml each of penicillin and streptomycin).
After centrifugation for 5 min at 800 rpm, cells were resuspended in RPMI medium and
plated on poly-L-ornithine (PLO) coated 96 well-plates (15 µg/ml PLO in H2O, incubated
overnight at 37°C) at a density of 105 cells/well.
Primary astrocytes were prepared from P0 C57BL/6 mice. Whole brains were isolated and
cut into pieces after removal of the cerebellum and the meninges. For dissociation, the
tissue was incubated with 4ml of trypsine-EDTA for 10 min at room temperature, and
gently triturated. The reaction was stopped with 10% serum and tissue pieces were
washed twice with HBSS + 10% MgSO4. After resuspension in 2 ml BME medium
(supplemented with 10% FBS, 2 mM GlutaMAXTM, and 100 U/ml each of penicillin and
METHODS 35
streptomycin), the tissue was further mechanically dissociated with a polished Pasteur
pipette. The cell suspension was distributed on poly-L-lysine-coated cell culture flasks and
cultivated in BME medium for 7-10 days yielding a confluent astrocyte layer with
oligodendrocyte precursor cells and microglia on top. During this time, medium was
changed every second day. Finally, cellular debris, growing microglia and oligodendrocyte
precursor cells were subsequently mobilized by shaking the flask. Supernatant was
exchanged by fresh BME medium. Primary astrocytes were then plated on poly-L-lysine-
coated 96 well-plates at a density of 5 x 10⁴ cells/well.
3.2.3 Transfection of mammalian cells by lipofection
Cells were transfected by lipofection with Lipofectamine 2000 reagent. Lipofection is
based on the formation of complexes between positively charged liposomes and the DNA
which interact with the cell membrane and are taken up into the cells by endocytosis.
Lipofectamine 2000 reagent was preincubated with serum- and antibiotic-free Opti-MEM®
medium for 5 min, mixed with the DNA, and incubated for another 20 min to allow complex
formation. Following a medium change, cells were treated with the Lipofectamine-DNA
mix. 1-4 hrs after transfection, culture medium with 2x serum concentration was added.
3.3 Reporter gene assays
3.3.1 Luciferase reporter gene assays
The luciferase reporter gene assay is based on the measurement of bioluminescence
generated by enzymatic conversion of the luciferase substrate. The amount of emitted
light is directly dependent on the amount of luciferase and can therefore be taken as
readout for reporter gene expression.
The Dual-Luciferase® Reporter Assay System (Promega) allows subsequent
measurement of the activities of two luciferases with different substrate specificities, Firefly
and Renilla luciferase. Firefly luciferase from the firefly Photinus pyralis catalyzes the
oxidation of D-luciferin involving the consumption of ATP and oxygen. Light emission
occurs at a wavelength of 575-600 nm. Renilla luciferase from the sea pansy Renilla
reniformis uses coelenterazine as a substrate and emits light at 475 nm during the Ca2+-
dependent reaction.

METHODS 36
The Dual-Luciferase® Reporter Assay is performed on lysed cells expressing Firefly and
Renilla luciferases. Addition of Firefly Luciferase Assay Buffer to the test preparation
provides the substrate for the Firefly luciferase reaction which can be quantitatively
measured with a luminometer. The Firefly luciferase reaction is then quenched by addition
of Renilla Luciferase Assay Buffer which simultaneously provides the substrate for the
Renilla luciferase reaction. In our assays, Firefly luciferase was used as an “experimental”
reporter to monitor expression levels of the reporter gene whereas Renilla luciferase
served as an internal control to compensate for variable transfection efficiencies.
Normalization of the Dual-Luciferase® Reporter Assay was done by calculating the ratios
of Firefly to Renilla values (relative light units, RLUs).
Luciferase reporter gene assays were performed in rat pheochromocytoma (PC12) and
human osteosarcoma (U2OS) cells as well as primary cultured neurons and astrocytes in
a 96-well plate format. Cells were seeded at densities of 104 cells/well (U2OS), 4 x 10⁴
cells/well (PC12), 5 x 10⁴ cells/well (primary astrocytes) and 105 cells/well (primary
neurons). Cells were transfected up to 24 h after plating, using Lipofectamine 2000
transfection reagent according to the manufacturer’s protocol. Transfection mixes
contained 10 ng each of the plasmids of interest as well as of the reporter plasmid (G5-
Firefly luciferase, if not stated otherwise, Fig. 4). A pcDNA backbone vector was used as
mock. To standardize for transfection variability, unspecific drug effects and cell death, we
additionally transfected a mixture of plasmids coding for renilla luciferase under the three
promoters SV40, TK, and CMV (10 SV40 : 2 TK : 1 CMV), along with a CMV-driven
nuclear localized enhanced yellow fluorescent protein (EYFPnuc) for optical transfection
control (Wehr et al. 2006).
Cells were stimulated 16-18 h after transfection by adding 1 volume of two-fold
concentrated test compounds in assay medium (DMEM, McCoy’s A, BME or RPMI,
depending on cell type, + 5% dialyzed FBS).
24 h after stimulation, if not specified otherwise, cells were lysed with 30 µl of 1x Passive
Lysis Buffer (Promega) for 20 min at room temperature on a shaker. Lysates were
transferred to an opaque 96-well microtiter plate for luciferase assays. Dual-Luciferase®
Reporter Assays were performed in an automated way in a Mithras LB 940 multimode
reader (Berthold Technologies). For each well, the following protocol was applied: injection
of 75 µl Firefly Luciferase Assay Buffer followed by a delay of 2 s, measurement over 10 s
and display of an integrated Firefly value, injection of 75 µl Renilla Luciferase Assay Buffer
followed by a delay of 2 s, measurement over 10 s and display of an integrated Renilla
value.

METHODS 37
Fig. 4. Time frames for luciferase reporter gene assays. Cells were transfected with 10 ng of each reporter plasmid, the respective split-TEV plasmids and Renilla Mix. Cells were stimulated 16 h after transfection and lysed after another 24 h. Luciferase assays and data analysis were performed thereafter.
Data were analysed in Excel (Microsoft) and Graphpad Prism® (GraphPad software).
Firefly values were divided by Renilla values to obtain Relative Light Units (RLUs). RLUs
were averaged over the number of replicates (n = 6), and the standard deviation was
calculated. Levels of significance (*: p<0.05; **: p<0.01; ***: p<0.001) were determined
with an unpaired, double-sided t-test.
3.3.2 Dose response curves
Dose responses of GPCR/beta-arrestin 2 interactions were carried out using a typical
agonist for each given GPCR. Agonists were subsequently diluted in assay medium from a
stock concentration and tested within a maximal range of 10-15 to 10-4 M. Data of 6
technical replicates were acquired per concentration. Cells were stimulated about 16 h
after transfection and lysed another 6 h later.
Dose response curves were generated in GraphPad Prism® (GraphPad Software, Inc).
Replicates were treated as separate data points. Curves were fitted assuming a sigmoidal
dose response according to the equation Y=Bottom + (Top-Bottom)/(1+10^((LogEC50-
X)*HillSlope), where X is the logarithm of the concentration. In the curve-fitting process,
EC50s (agonist concentration needed to evoke a response halfway between baseline and
maximum) and the R2 Pearson’s correlation coefficient (goodness of fit) were determined.
Dose responses were normalized by setting the lowest mean of the data array to 0 and the
highest mean to 100.

METHODS 38
3.3.3 Fluorescence-based reporter gene assays
Fluorescence-based reporter gene assays were carried out on the basis of a fluorescent
protein instead of luciferase, allowing an optical readout such as fluorescence microscopy
or flow cytometry. Similarly to the G5-luciferase construct, the gene coding for a
fluorescent protein such as tdTomato or EYFPnuc was coupled to a cluster of five Gal4-
responsive cis elements. The resulting constructs were termed G5-tdTomato and G5-
EYFPnuc, respectively. Assays were performed in the same manner and with the same
time frames as described for luciferase-based assays, but either G5-tdTomato or G5-
EYFPnuc were used as reporters. Assays were qualitatively analyzed using a
fluorescence microscope, and quantified by flow cytometry. For the latter - instead of lysis
- cell medium was exchanged by Hoechst dye, dissolved 1:500 in PBS. Cells were
incubated for 20 min at 37°C whereafter nuclear staining was checked under a
fluorescence microscope. Cells were then washed with PBS, treated with a 1:1-dilution of
trypsine in PBS for 5 min at 37°C and separated mechanically. After further dilution in 3
volumes of PBS, cells of each well were transferred to a separate 5 ml round-bottom tube
for flow cytometry.
3.3.4 Flow cytometry
Flow cytometry is suited to analyse cells with respect to their size, shape and inner
complexity, and to count and sort them according to distinct parameters. In principle, a
laser beam of a unique wavelength is directed onto the fluid stream of a cell suspension
which is focused in a way that cells pass the laser one at a time. While passing, cells lead
to a scattering of the laser light depending on their morphology. Several detectors in
different positions collect the scattered light as Forward Scatter (FSC, reflecting cell size)
and Side Scatter (SSC, reflecting granularity which is e.g. defined by the size and
structure of the cell nucleus and the presence of vesicles). Fluorescent labelling of cells
can be used as an additional parameter for characterization. By using gates with
thresholds and maximal cut-offs for FSC, SSC and fluorescent stainings, cell
subpopulations with distinct properties can subsequently be confined.
Recordings and analysis were done using a BD FACSAria flow cytometer and the BD
FACS Diva™ Software (Becton Dickinson, BD Biosciences). Subpopulations of Hoechst-
positive/EYFPnuc-positive or Hoechst-positive/tdTomato-positive cells were analysed with
respect to cell numbers and total fluorescence intensity. Data were normalized to the
number of cells measured in total.

RESULTS 39
4 Results
4.1 Design of split-TEV assays for GPCR activation
Split-TEV assays make use of inactive N- and C-terminal fragments of the TEV protease
which are coupled to two proteins of interest and are functionally complemented upon their
interaction (Wehr et al. 2006). The reconstituted active TEV protease recognizes its
specific cleavage site ENLYFQ’G (tevS), thereby releasing a fused transcriptional
activator. Here, the artificial transcription factor GV was used, which is composed of the
yeast Gal4 DNA-binding domain and the herpes simplex VP16 transactivation domain.
Release of GV allows its translocation to the nucleus, followed by the activation of a Gal4-
responsive firefly luciferase gene (G5-luciferase) (Wehr et al. 2006). Luciferase activity
finally serves as readout. To monitor GPCR activation, we made use of its stimulation-
dependent interaction with the adaptor protein Arr2 which mediates receptor
desensitization and internalization in a widely distributed manner throughout the GPCR
family (Ferguson 2001; Ferguson et al. 1996; Lohse et al. 1990). The aim was to establish
split-TEV based assays monitoring GPCR activation (i) of vasopressin receptors 1a
(AVPR1a) and 2 (AVPR2) regulated by the peptide hormone vasopressin (AVP), (ii) of
dopamine receptors 1 (DRD1) and 2 (DRD2) and the -adrenergic receptor 2B (ADRB2)
responding to the catecholamines dopamine and (nor)adrenaline, respectively (Harmar et
al. 2009).
Receptor constructs were designed in which the N-terminal fragment of TEV (N-TEV) was
coupled to GV via the specific TEV cleavage site ENLYFQ’G (tevS), and attached to
GPCRs at their respective C-termini (Fig. 5a). Complementary, Arr2 was coupled to the
C-terminal fragment of TEV (C-TEV). Split-TEV assays were compared to the previously
described Tango®/full-TEV proximity assays (referred to in this thesis as ‘full-TEV’) in
which the full-length TEV protease was coupled to Arr2 (Arr2-TEV) and a transcriptional
reporter was attached to the GPCR via the TEV protease cleavage site (Fig. 5b). In
contrast to split-TEV, these constructs were modified to contain the low-affinity cleavage
site ENLYFQ’L (tevS*) which has been shown to be essential for ‘full-TEV assays’ (Fig.
5b) (Barnea et al. 2008). AVPR1a, DRD1 and DRD2 constructs were further modified by
inserting aa 343-371 of the human AVPR2 receptor in between of the respective GPCR C-
termini and N-TEV (X-VC-X) thought to enhance Arr2 coupling as described previously
(Fig. 5c) (Barnea et al. 2008; Tohgo et al. 2003). A list of all GPCR constructs used in the
assays described below can be found inTable 1..

RESULTS 40
Fig. 5. Design of split-TEV and full-TEV assays to monitor GPCR activation. a,b) Illustration of split-TEV (a) and full-TEV (b) assays with functionally relevant domains depicted
schematically. Split-TEV as well as full-TEV assays rely on the interaction of modified GPCRs with Arr2 upon GPCR activation. Split-TEV assays are based on the functional reconstitution of inactive N- and C-terminal TEV fragments (N-TEV, C-TEV). N-TEV is fused to the C-terminus of the GPCR followed by a high-affinity
TEV cleavage site (tevS) and the artificial transcription factor GV while C-TEV is fused to Arr2 (a). Interaction
of the two fusion proteins leads to the reconstitution of the TEV protease activity releasing GV. Full-TEV
(Tango®) assays use a ‘proximity approach’ where the full-length TEV protease (TEV) is fused to Arr2 whereas the GPCR is coupled to GV via a low-affinity TEV protease cleavage site (tevS*) (b). Proximity of the two fusion proteins leads to TEV-mediated cleavage and release of the transcription factor. Common for both assays is the TEV-dependent release of GV that finally activates firefly luciferase as reporter gene (not shown). c) Domain structure of constructs used for split-TEV (left panel) and full-TEV assays (right panel). For
GPCR-N-TEV-tevS-GV and Arr2-C-TEV fusion constructs the following additionally modified constructs were
tested. GPCR-VC-N-TEV-tevS-GV, harbours a C-terminal tail of the human vasopressin AVPR2 receptor to
provide a stronger interaction with Arr2. Arr2∆-C-TEV, C-terminally truncated form of human Arr2. N-TEV: N-terminal fragment of TEV protease (aa 1-118), C-TEV: C-terminal fragment of TEV protease (aa119-221), TEV: full-length TEV protease, VC: C-terminus of the AVPR2 receptor (aa 343-371), tevS: natural TEV cleavage site ENLYFQ’G, tevS*: low-affinity TEV protease cleavage site ENLYFQ’L, GV: Gal4-VP16
transcription factor, Arr2: -arrestin 2, Arr2∆: truncated Arr2 (aa 1-382).

RESULTS 41
N-TEV-tevS-GV N-TEV-tevS*-GV VC-N-TEV-tevS-GV
VC-N-TEV-tevS*-GV
HEK 293
cleavage assay AVPR2 (7b,c)
DRD2 (7b,c)
ADRB2 (7b,c)
TEV site comparison AVPR1a (9) AVPR1a (9)
HEK 293-Arr2-C-TEV
readout comparison AVPR2 (8a,b,c)
PC12 tet-off
cleavage assay AVPR2 (6b) AVPR2 (6b) AVPR1a (6a) AVPR1a (6a)
ADRB2 (6e) ADRB2 (6e) DRD1 (6c) DRD1 (6c)
DRD2 (6d) DRD2 (6d)
split-TEV assay ADRB2 (10c) AVPR1a (10a)
DRD2 (10b)
dose response AVPR2 (13b) AVPR1a (13a)
full-TEV assay ADRB2 (10c) AVPR1a (10a)
DRD2 (10b)
signaling assay AVPR1a (16a,b) AVPR1a (16a,b)
AVPR2 (16a,b)
dose response AVPR1a (16d)
AVPR2 (16c)
U2OS
split-TEV assay ADRB2 (11c) AVPR1a (11a)
DRD2 (11b)
dose response ADRB2 (13e) DRD1 (13c)
DRD2 (13d)
full-TEV assay ADRB2 (11c) AVPR1a (11a)
DRD2 (11b)
primary neurons
split-TEV assay AVPR1a (12a)
DRD2 (12b)
full-TEV assay AVPR1a (12a)
DRD2 (12b)
primary astrocytes
split-TEV assay ADRB2 (12c)
dose response ADRB2 (13f)
full-TEV assay ADRB2 (12c)
V5 C-TEV
PC12 tet-off
signaling assay AVPR1a (16a,b) AVPR1a (16a,b)
AVPR2 (16a,b) AVPR2 (16a,b)
Table 1. Overview of GPCR constructs used in cleavage assays, split-TEV and full-TEV activation assays and signaling assays. Table shows in which cells each assay was performed and which tagged versions of GPCRs were used in a given assay. Citation of figures is given in brackets.

RESULTS 42
4.2 Cleavage of GPCR fusion constructs by TEV protease
Cleavage of GPCR fusion proteins by a co-expressed cytoplasmic TEV protease (TEV)
was tested to assess construct functionality and to estimate cleavage efficiency. TEV
cleavage was highly efficient for all receptor constructs containing the natural TEV
protease cleavage site ENLYFQ’G (tevS) (Fig. 6a-e). Cleavage was variable between
receptor constructs, ranging from 7-fold signal induction for DRD1-N-TEV-tevS-GV in the
presence of TEV to 110-fold induction for AVPR1a-N-TEV-tevS-GV. In contrast, receptor
constructs containing the mutated, low-affinity TEV cleavage site ENLYFQ’L (tevS*) were
not efficiently cleaved by TEV (Fig. 6a-e) which is in concordance with findings by Barnea
et al. (Barnea et al. 2008).
Additionally, a fluorescent readout was used to microscopically assess cleavage. Instead
of G5-luciferase, G5-EYFPnuc was used as a reporter. Therefore, release of GV and its
subsequent localization to the nucleus drives EYFPnuc expression. Here, cleavage of
AVPR1a-N-TEV-tevS-GV, DRD2-N-TEV-tevS-GV and ADRB2-N-TEV-tevS-GV was
tested in HEK 293 cells (Fig. 7). All of these receptors showed strong fluorescence in the
presence of TEV protease (Fig. 7a) which could clearly be distinguished from controls.
However, a considerable fluorescent background was observed in the ADRB2-N-TEV-
tevS-GV control. As this might impose problems to qualitatively evaluate less efficient
cleavages such as in protein interaction-dependent assays, quantification of fluorescence
was done in addition.
Flow cytometry was used to quantify EYFPnuc-positive cells as well as to measure total
fluorescence. TEV cleavage was reflected in signal inductions rates of 3 (ADRB2), 5
(DRD2) and 56 (AVPR1a) in the analysis of EYFPnuc-positive cells (Fig. 7b) and of 9
(ADRB2), 28 (DRD2) and 542 (AVPR1a) in the analysis of total fluorescence (Fig. 7c).
Ratios were mainly influenced by the amount of background while the percentage of
EYFPnuc-positive cells and the total fluorescence in the presence of TEV were about the
same among the tested receptor constructs. Analysis of fluorescence seemed to be more
sensitive than the analysis of EYFPnuc-positive cells.

RESULTS 43
Fig. 6. Cleavage of GPCR constructs by TEV protease. (a-e) Efficiency of a cytoplasmic TEV protease (TEV) to cleave low- (tevS*, left) and high-affinity (tevS, right) TEV cleavage sites of full-TEV and split-TEV GPCR reporter constructs. a) AVPR1a, vasopressin receptor 1a. b) AVPR2, vasopressin receptor 2. c) DRD1, dopamine receptor 1. d) DRD2, dopamine receptor 2. e) ADRB2, adrenergic receptor 2. Assays were performed in PC12 cells and lysed 24 h after transfection. Insets show data for full-TEV receptor constructs in a separate scale. Mock: pcDNA backbone vector. RLUs, relative light units. Date are given as means of n=6 ± s.d.

RESULTS 44
Fig. 7. Cleavage of GPCR constructs monitored by a fluorescent readout. (a-c) Cleavage of GPCR constructs by TEV protease in HEK 293 cells was qualitatively evaluated by fluorescence microscopy (a) and quantified by flow cytometry (b,c). G5-EYFPnuc was used as reporter. Both the number of EYFPnuc-positive cells (b) and total fluorescence (c) were quantified. As EYFPnuc-positive cells were analyzed as a subset of Hoechst-positive cells in each condition, data were normalized to 10000 cells counted in total. Mock: pcDNA backbone vector. Data are given as means of n=6 ± s.d.

RESULTS 45
4.3 Evaluation of different readouts for split-TEV assays
In order to evaluate the use of luciferase and fluorescence readouts for GPCR activation
assays, split-TEV assays for AVPR2 were simultaneously conducted with a G5-luciferase
and a G5-EYFPnuc reporter (Fig. 8). In this case, split-TEV assays were performed in
HEK 293 cells stably transfected with Arr2-C-TEV. Depending on the readout, assays
were analyzed with a luciferase assay or by flow cytometry 64 h after transfection.
Background in the absence of the receptor construct was low in both luciferase assay
(Fig. 8a) and flow cytometry (Fig. 8b,c). Transfection of the reporter construct raised the
background 16-fold in the luciferase assay (Fig. 8a), 32-fold regarding the amount of
tdTomato-positive cells in flow cytometry (Fig. 8b), and 257-fold regarding total
fluorescence in flow cytometry (Fig. 8c). Stimulation with the agonist AVP resulted in a
3.3-fold (luciferase assay, Fig. 8a), 3.2-fold (flow cytometry, number of tdTomato-positive
cells, Fig. 8b) and 2.7-fold (flow cytometry, total fluorescence, Fig. 8c) signal increase.
Thus, in this proof-of-principle split-TEV assay, the stimulation-dependent interaction
between arr2 and AVPR2 was reflected in a very similar way by the luciferase and the
fluorescence readout. Nevertheless, the fluorescence readout displayed more background
in the absence of stimulation. Mainly based on the easier handling of luciferase assays
and therefore a better applicability for larger-scale assays, we decided to use the
luciferase readout for all further assays.
Fig. 8. Comparison of luciferase and fluorescence readouts for split-TEV assays. (a-c) Luciferase (a) and fluorescence (b,c) readout were compared in parallel split-TEV assays for the AVPR2
receptor in HEK 293 cells stably transfected with Arr2-C-TEV. G5-luciferase served as a reporter for luciferase assays, whereas G5-tdTomato was used for the fluorescence readout which was quantified by flow cytometry. Cells were stimulated 24h and analyzed 64h after transfection. Both the number of tdTomato-positive cells (b) and total fluorescence are shown for the fluorescence readout. As tdTomato-positive cells were analyzed as a subset of Hoechst-positive cells in each condition, data were normalized to 3000 cells counted in total. Mock: pcDNA backbone vector. Data are given as means of n=6 ± s.d.

RESULTS 46
4.4 Evaluation of different cleavage sites for split-TEV and full-TEV
assays
In another proof-of-principle experiment, the use of different TEV protease cleavage sites
for split-TEV and full-TEV assays was evaluated. The mutated, low-affinity tev site
ENLYFQ’L has been described by Barnea et al. to perform better in full-TEV assays than
the natural tev site ENLYFQ’G. AVPR1a constructs which either contained ENLYFQ’G
(tevS) or ENLYFQ’L (tevS*) were therefore tested in both a split-TEV assay (with Arr2-C-
TEV) and a full-TEV assay (with Arr2-TEV) in HEK 293 cells (Fig. 9). The split-TEV
assay with tevS showed an induction rate of 2.7 (p<1.7x10⁻⁷) upon stimulation with the
agonist AVP. In the full-TEV assay, a significant induction was seen as well, although the
induction rate was lower (1.3-fold, p<0.0002). No significant induction occurred in the split-
TEV assay using tevS* (p< 0.25). In contrast, the full-TEV assay with tevS* showed a
significant induction with a higher ratio than observed for tevS (2-fold, p<10-5).
Remarkably, background interaction of AVPR1a and Arr2 in the absence of stimulation
was much higher when using tevS compared to tevS*.
Fig. 9. Performance of different TEV protease cleavage sites in split-TEV and full-TEV assays. The natural TEV cleavage site ENLYFQ’G and the low-affinity cleavage site ENLYFQ’L were tested in split-TEV and full-TEV assays for the AVPR1a receptor in HEK 293 cells. Split-TEV assays were performed with
Arr2-C-TEV whereas in full-TEV assays, Arr2-TEV was used. Mock: pcDNA backbone vector. Data are
given as means of n=6 ± s.d.*: p<0.01, **: p<0.001, ***: p<0.0001, two-sided t-test.
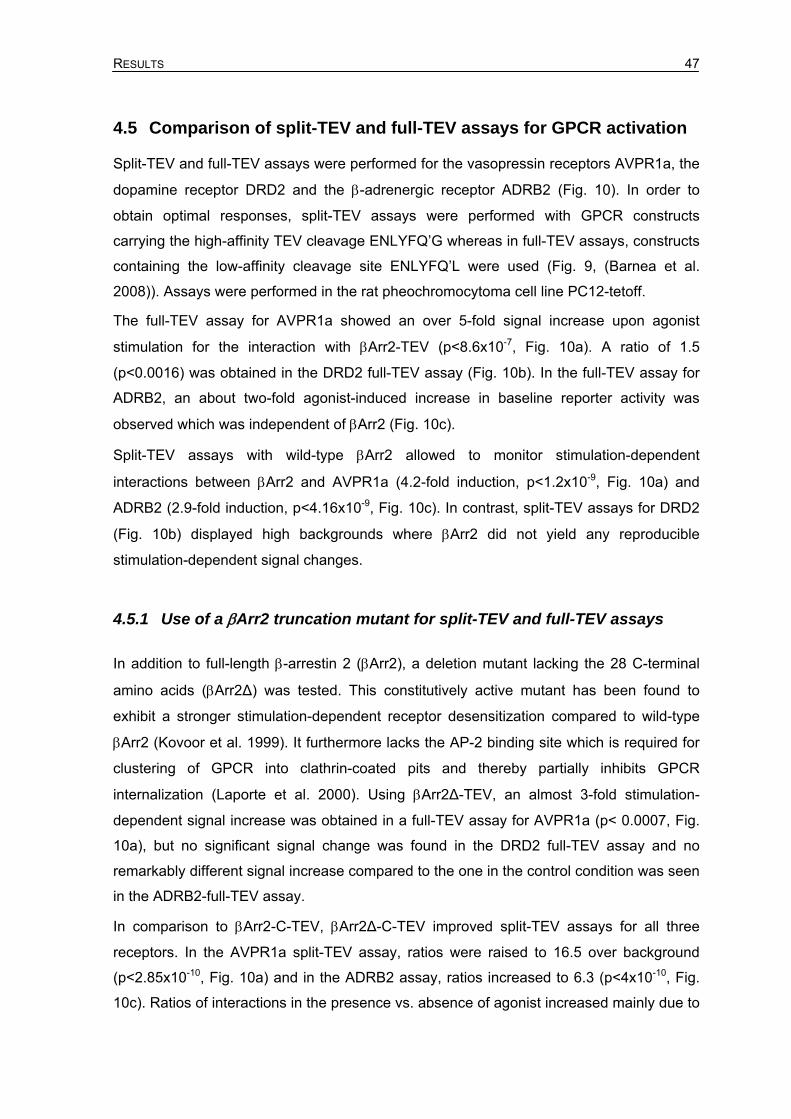
RESULTS 47
4.5 Comparison of split-TEV and full-TEV assays for GPCR activation
Split-TEV and full-TEV assays were performed for the vasopressin receptors AVPR1a, the
dopamine receptor DRD2 and the -adrenergic receptor ADRB2 (Fig. 10). In order to
obtain optimal responses, split-TEV assays were performed with GPCR constructs
carrying the high-affinity TEV cleavage ENLYFQ’G whereas in full-TEV assays, constructs
containing the low-affinity cleavage site ENLYFQ’L were used (Fig. 9, (Barnea et al.
2008)). Assays were performed in the rat pheochromocytoma cell line PC12-tetoff.
The full-TEV assay for AVPR1a showed an over 5-fold signal increase upon agonist
stimulation for the interaction with Arr2-TEV (p<8.6x10⁻⁷, Fig. 10a). A ratio of 1.5
(p<0.0016) was obtained in the DRD2 full-TEV assay (Fig. 10b). In the full-TEV assay for
ADRB2, an about two-fold agonist-induced increase in baseline reporter activity was
observed which was independent of Arr2 (Fig. 10c).
Split-TEV assays with wild-type Arr2 allowed to monitor stimulation-dependent
interactions between Arr2 and AVPR1a (4.2-fold induction, p<1.2x10⁻⁹, Fig. 10a) and
ADRB2 (2.9-fold induction, p<4.16x10⁻⁹, Fig. 10c). In contrast, split-TEV assays for DRD2
(Fig. 10b) displayed high backgrounds where Arr2 did not yield any reproducible
stimulation-dependent signal changes.
4.5.1 Use of a Arr2 truncation mutant for split-TEV and full-TEV assays
In addition to full-length -arrestin 2 (Arr2), a deletion mutant lacking the 28 C-terminal
amino acids (Arr2∆) was tested. This constitutively active mutant has been found to
exhibit a stronger stimulation-dependent receptor desensitization compared to wild-type
Arr2 (Kovoor et al. 1999). It furthermore lacks the AP-2 binding site which is required for
clustering of GPCR into clathrin-coated pits and thereby partially inhibits GPCR
internalization (Laporte et al. 2000). Using Arr2∆-TEV, an almost 3-fold stimulation-
dependent signal increase was obtained in a full-TEV assay for AVPR1a (p< 0.0007, Fig.
10a), but no significant signal change was found in the DRD2 full-TEV assay and no
remarkably different signal increase compared to the one in the control condition was seen
in the ADRB2-full-TEV assay.
In comparison to Arr2-C-TEV, Arr2∆-C-TEV improved split-TEV assays for all three
receptors. In the AVPR1a split-TEV assay, ratios were raised to 16.5 over background
(p<2.85x10⁻¹⁰, Fig. 10a) and in the ADRB2 assay, ratios increased to 6.3 (p<4x10⁻¹⁰, Fig.
10c). Ratios of interactions in the presence vs. absence of agonist increased mainly due to

RESULTS 48
a reduction of background. Importantly, use of Arr2∆-C-TEV provided stable readouts in
the DRD2 assay (1.3-fold induction, p<0.0004, Fig. 10b) which could not be obtained with
wild-type Arr2.
Fig. 10. Comparison of full-TEV and split-TEV assays to monitor GPCR activation in PC12 cells. (a-c) Full-TEV (left) and split-TEV (right) assays were performed for AVPR1a (a), DRD2 (b) and ADRB2 (c) in
PC12 cells. Arr2 was used in its wild-type form (Arr2) and in a constitutively active mutant form (Arr2).
Cells were stimulated 16 h after transfection and lysed 24 h later. Mock: pcDNA backbone vector. Data are given as means of n=6 ± s.d. *: p<0.01, **: p<0.001, ***: p<0.0001, two-sided t-test.

RESULTS 49
4.5.2 Performance of split-TEV and full-TEV assays in U2OS cells
Split-TEV and full-TEV assays for the same receptors were performed in another
heterologous cell line, the human osteosarcoma cell line U2OS, in order to check assay
performance in a different cellular background (Fig. 11).
Full-TEV assays for the AVPR1a receptor did not show any robust signal changes upon
stimulation compared to controls (Fig. 11a). A 1.6-fold signal increase in the DRD2 full-
TEV assay was observed with Arr2-TEV (p<0.005, Fig. 11b), but none was obtained with
Arr2∆-TEV. No stimulation-dependent signal change occurred in any of the ADRB2 full-
TEV assays (p<0.64 for Arr2-TEV and p<0.94 for Arr2∆-TEV, Fig. 11c).
Stimulation-dependent interactions between GPCRs and wild-type Arr2 could be
monitored in split-TEV assays for DRD2 (4.8-fold induction, p<2.7x10⁻⁸, Fig. 11b), and
ADRB2 (1.4-fold induction, p<0.011, Fig. 11c). In contrast, high backgrounds without
reproducible stimulation-dependent signal changes were observed in the AVPR1a split-
TEV assay (p<0.17, Fig. 11a).
However, use of the truncation mutant Arr2∆-C-TEV resulted in stable readouts, showing
a 2.8-fold induction (p<0.0001, Fig. 11a) upon stimulation. The ADRB2 split-TEV assay
was as well improved by Arr2∆ (3.7-fold induction, p<1.86 x 10⁻⁵, Fig. 11c) whereas no
major difference in split-TEV assay performance between wild-type and mutant Arr2 was
seen for DRD2 (5.2-fold induction, p<4x10⁻⁹, Fig. 11b). As already described for PC12
cells, a reduction of background was the main reason for better assay performance with
Arr2∆.

RESULTS 50
Fig. 11. Comparison of full-TEV and split-TEV assays to monitor GPCR activation in U2OS cells. (a-c) Full-TEV (left) and split-TEV (right) assays were performed for AVPR1a (a), DRD2 (b) and ADRB2 (c) in
U2OS cells. Arr2 was used in its wild-type form (Arr2) and in a constitutively active mutant form (Arr2). Cells were stimulated 16 h after transfection and lysed 24 h later. Mock: pcDNA backbone vector. Data are given as means of n=6 ± s.d. *: p<0.01, **: p<0.001, ***: p<0.0001, two-sided t-test.

RESULTS 51
In summary, the tested split-TEV GPCR activation assays are reliably applicable in the
heterologous PC12 and U2OS cell lines using transient transfection protocols, whereas
full-TEV assays may require further optimization and/or selected stable cell clones
(Hanson et al. 2009). By comparing only two cell lines, the pheochromocytoma ‘neuronal-
like’ PC12 cells and the osteosarcoma-derived U2OS cells, cell type-specific effects with
an impact on assay performance were observed.
4.5.3 Split-TEV and full-TEV assays in primary cultured cells
To assess the applicability of transient TEV-based GPCR activation assays in primary
cultured cells, primary cultured neurons and astrocytes were used as model systems (Fig.
12). Because of the known importance of dopamine- and vasopressin-mediated signaling
in neurons (Caldwell et al. 2008), DRD2 and AVPR1a assays were performed in primary
cultured neurons (Fig. 12a,b). Full-TEV assays did not show any significant stimulation-
dependent signal changes. Although split-TEV assays for AVPR1a and DRD2 in neurons
showed a generally higher variability and lower induction rates compared to heterologous
cell lines, clear agonist-dependent effects could be detected. Induction rates of 2
(p<0.0038) and 1.5 (p<0.00015) were obtained for AVPR1a and DRD2, respectively (Fig.
12a,b). Because astrocytes express adrenergic receptors and respond to adrenergic
signaling (Laureys et al. 2010), ADRB2 activation was monitored in astrocytes. The full-
TEV approach was not functional whereas robust ligand-dependent activation in
astrocytes could be detected with the split-TEV assay (1.6-fold induction, p<1.34 x 10⁻⁶,
Fig. 12c).

RESULTS 52
Fig. 12. Comparison of full-TEV and split-TEV assays to monitor GPCR activation in primary cultured neurons and astrocytes. (a-c) Full-TEV (left) and split-TEV (right) assays were performed for AVPR1a (a) and DRD2 (b) in primary neurons and for ADRB2 (c) in primary astrocytes. Cells were stimulated 16 h after transfection and lysed 24 h
later. Arr2 was used in its wild-type form (Arr2) and in a constitutively active mutant form (Arr2). Mock: pcDNA backbone vector. Data are given as means of n=6 ± s.d. *: p<0.01, **: p<0.001, ***: p<0.0001, two-sided t-test.

RESULTS 53
4.6 Dose-dependence of split-TEV GPCR activation assays
When describing drug effects, an important parameter to consider is drug concentration.
Most drug effects are elicited in a certain concentration range in which the response
appears almost linear. Below a certain threshold concentration, virtually no drug effect can
be monitored whereas, at the other end of the concentration range, the maximal possible
response cannot be further increased by higher drug concentrations. Dose-response
relationships have been widely used to characterize and compare drugs with respect to
their pharmacological properties. Conversely, dose-response curves of well-characterized
drugs are an excellent tool to evaluate assay systems which monitor concentration-
dependent biological processes.
Therefore, dose-response relationships for the GPCR/Arr2-interaction were analyzed
using split-TEV assays. As a remarkable cell type-dependent variation of split-TEV assay
performance has been observed, the best performing cell line/construct combination for a
given receptor was chosen to carry out selected dose-response experiments (Fig. 13).
Particular interest laid in the determination of the agonist concentration which evokes a
half-maximal response (EC50), a measure of potency of the respective drug.
AVPR1a-VC-N-TEV-tevS-GV and AVPR2-N-TEV-tevS-GV showed a dose-dependent
interaction with Arr2∆-C-TEV in PC12 cells with an EC50 of 0.4 nM and 3.6 nM,
respectively (Fig. 13a,b). Dose responses for the dopamine receptors DRD1 and DRD2
were performed in U2OS cells (Fig. 13c,d). The interaction of Arr2∆-C-TEV with either
DRD1-VC-N-TEV-tevS-GV or DRD2-VC-N-TEV-tevS-GV showed dose-response
characteristics with an EC50 of 1 µM and 2.8 µM, respectively. Dose-response analysis for
the interaction of Arr2∆-C-TEV with ADRB2-N-TEV-GV resulted in an EC50 of 33.8 nM in
U2OS cells (Fig. 13e). Because of the function of ADRB2 in astrocytes, this receptor was
chosen to further assess dose-dependence of the split-TEV assay in primary cultured
astrocytes. An EC50 of 18 nM was observed (Fig. 13f). Both dopamine and isoproterenol
elicited cytotoxic effects at concentrations above 10-4 M, imposing difficulties in
determining maximal responses.
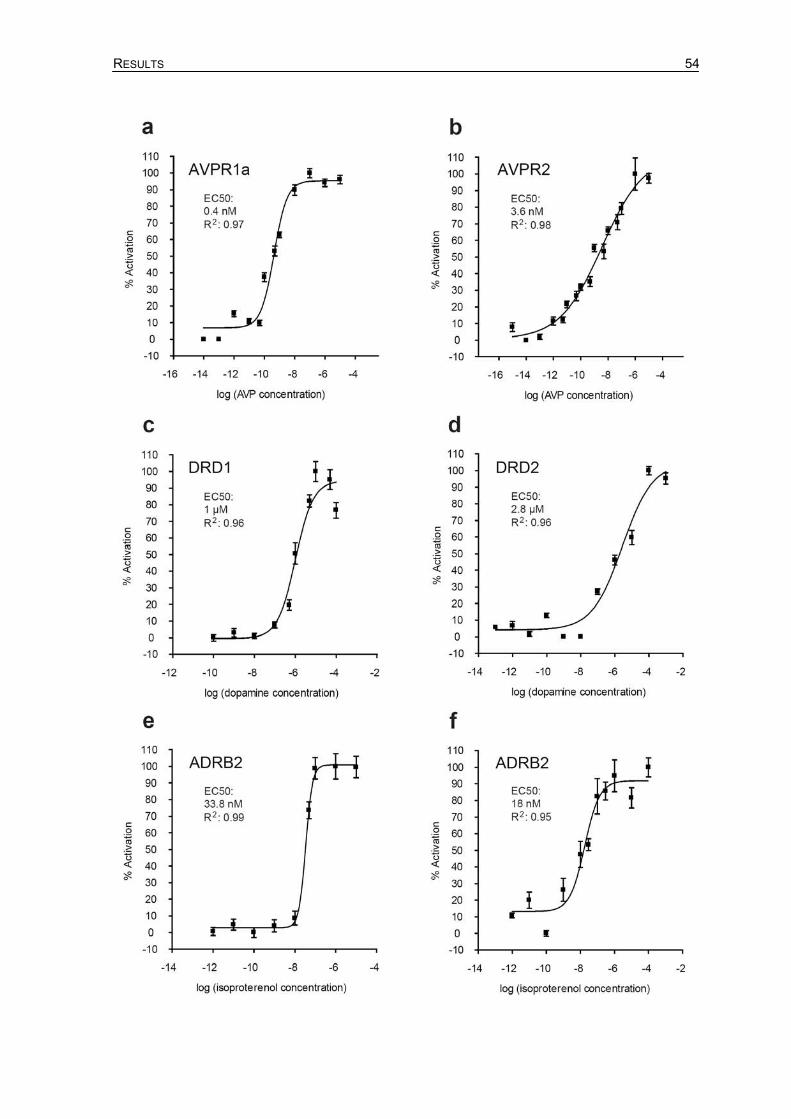
RESULTS 54

RESULTS 55
Fig. 13. Dose-response analysis with split-TEV GPCR activation assays in heterologous and primary cells.
a-f). Dose dependence of the interaction between Arr2 and GPCRs was tested using Arr2∆-C-TEV and
either of the receptor constructs AVPR1a-VC-N-TEV-tevS-GV (a), AVPR2-N-TEV-tevS-GV (b), DRD1-VC-N-TEV-tevS-GV (c), DRD2-VC-N-TEV-tevS-GV (d) and ADRB2-N-TEV-tevS-GV (e,f). Assays with vasopressin receptors were carried out in PC12 cells (a,b), assays with dopamine receptors were performed in U2OS cells (c,d) and the ADRB2 receptor in U2OS (e) and primary astrocytes (f). Cells were treated with agonists 24 h after transfection and lysed after 6 h. Indicated EC50 values and R2 Pearson’s correlation coefficients were determined by sigmoidal curve fitting algorithm using GraphPad Prism®. Data are given as means of n=6 ± s.d.
4.7 Cellular Signaling by tagged AVPR1a and AVPR2 receptors
Split-TEV as well as the other Arr2-based recruitment assays rely on tagged constructs
and it may be possible that modified receptors display altered signaling properties
(Thibonnier et al. 2001). In order to analyze signaling events in response to stimulation by
the modified GPCRs, reporter gene assays monitoring cAMP and calcium levels were
used. Vasopressin receptor constructs were used in this assay because the AVPR1a
receptor preferentially couples to Gq while AVPR2 mainly recruits Gs family members (Fig.
14) (Harmar et al. 2009; Thibonnier et al. 1998).
Fig. 14. Principle of cis-reporter assays to monitor cellular signaling. Ca2+ signaling of the AVPR1a receptor via Gq was monitored by using an NFAT-driven cis element (nfat) coupled to the firefly luciferase. cAMP signaling of the AVPR2 receptor was analyzed by using a CREB-driven cis element (cre) coupled to the luciferase gene. Cis-reporter assays were used to analyze signaling properties of differently tagged versions of these receptors. FFLuc: Firefly luciferase gene.

RESULTS 56
An nfat-luciferase reporter construct driven by a NFAT-responsive cis-element was used
to indirectly monitor a rise in Ca2+ levels and therefore serve as a readout for the Gq
pathway. In analogy to this, a cre-luciferase reporter driven by a CREB-responsive cis-
element was used to indirectly monitor changes in cAMP levels as a readout for the Gs
pathway (Fig. 14).
Functionality of cis reporters was tested by applying well characterized substances which
are known to lead to a substantial activation of the respective cis element (Fig. 15).
Dibutyryl cAMP (db-cAMP) is a cell-permeable cAMP analogue which can transactivate
cre (Montminy et al. 1986). Phorbol esters like phorbol myristate acetate (PMA) activate
protein kinase C (Castagna et al. 1982) whereas the ionophore ionomycin increases
intracellular calcium levels. Phorbol esters and ionophors act synergistically to activate
NFAT (Boss et al. 1998).
Pathway-specific responsiveness of cre- and nfat-luciferase reporters was further tested
by doing cross-controls in which the effect of PMA-ionomycin on cre-luciferase and of db-
cAMP on nfat-luciferase was monitored (Fig. 15). DMSO served as a carrier for PMA and
ionomycin and was therefore added to the control for PMA-ionomycin (Mock + DMSO).
Fig. 15. Specific responsiveness of the cre-luciferase and nfat-luciferase reporter for db-cAMP and PMA/ionomycin responses. (a,b) PC12 cells were transfected with cre- (a) or nfat-luciferase (b), respectively, treated with 1mM cAMP or 10ng/ml PMA + 1µM ionomycin after 16 h, and lysed after another 24 h. Mock + DMSO served as control for PMA-ionomcyin treatment. Mock: pcDNA backbone vector. Data are given as means of n=6 ± s.d. *: p<0.01, **: p<0.001, ***: p<0.0001, two-sided t-test.

RESULTS 57
Treatment of PC12 cells with 1mM db-cAMP led to a 6.6-fold activation of cre-luciferase
compared to controls (p<4x10-11, Fig. 15a). 10ng/ml PMA + 1µM ionomycin induced a 2.6-
fold activation of nfat-luciferase (p<5x10⁻⁶, Fig. 15b). However, addition of DMSO to Mock
led to a pronounced activation of cre-luciferase and treatment with PMA-ionomycin slightly
but significantly enhanced this (1.3-fold, p<10-5, Fig. 15a). Likewise, a significant activation
of nfat-luciferase by db-cAMP was observed (1.5-fold, p<5x10⁻⁶, Fig. 15b), although to a
lesser extent then by PMA-ionomycin. Thus, the tested cis reporters clearly respond in a
pathway-specific way with preferred activation of cre-luciferase by cAMP and of nfat-
luciferase by calcium-mediated signals. However, cross-activation by other intracellular
signals occurs to some extent. Additional application of AVP did not affect the db-cAMP or
PMA-ionomycin mediated effects indicating the absence of endogenous vasopressin
receptors, as seen by ratios between AVP-stimulated and non-stimulated conditions of
about 1 (Fig. 16a,b).
The AVPR1a receptor construct carrying solely a small V5 epitope tag activated cre-
luciferase 3.3-fold upon stimulation with AVP (p<2.3x10⁻⁸, Fig. 16a). This AVP effect was
similar for all other AVPR1a fusion constructs regardless of whether N-TEV-tevS-GV, VC-
N-TEV-tevS-GV or C-TEV were attached to the receptor (Fig. 16a). Stimulation of AVPR2
receptor constructs, however, resulted in 9- to 12-fold signal increases for all fusion
proteins proving the preferential Gs/cAMP coupling (Fig. 16a).
A 2.5-fold increase of nfat-luciferase activity was achieved by AVP stimulation of the
AVPR1a receptors carrying the V5 tag (p<6.3x10⁻⁷, Fig. 16b). Tagging of AVPR1a with N-
TEV-tevS-GV or C-TEV resulted in a less pronounced transcriptional activation of nfat-
luciferase (about 1.7-fold, p<2x10⁻⁶, for both constructs). Interestingly, AVP-dependent
nfat-reporter activation by AVPR1a-VC-N-TEV-tevS-GV was only subtle (1.3-fold,
p<0.0002, Fig. 16b). This construct differs from the corresponding N-TEV-tevS-GV variant
only by the C-terminal domain of AVPR2 (VC). In contrast to AVPR1a constructs, none of
the AVPR2 fusion constructs showed nfat-reporter activities which where significantly
enhanced by AVP (Fig. 16b). These data validate the preferred coupling of AVPR1a
receptors to Gq/Ca2+ but also indicate that the AVPR2 C-tail modification of AVPR1a
receptors can alter signaling properties.
Finally, the dose-response performance of AVPR2- and AVPR1a-N-TEV-tevS-GV
constructs was examined in cre- and nfat-reporter assays (Fig. 16c,d). Cre activation in
response to AVPR2-N-TEV-tevS-GV-mediated signaling yielded a sigmoidal dose
response with an EC50 of 89.5 pM (Fig. 16c).

RESULTS 58

RESULTS 59
Fig. 16. Cellular signaling by differently tagged AVPR1a and AVPR2 receptors. (a,b) Reporter gene assays in PC12 cells monitoring cre-luciferase (a) and nfat-luciferase (b) activation in response to control stimulation with 1mM db-cAMP (a) and 10ng/ml PMA + 1µM ionomycin (a) as well as stimulation of different AVPR1a (a,b) and AVPR2 (a,b) fusion proteins with 1µM AVP. Data are displayed as ratios between AVP-stimulated and non-stimulated conditions. Data are given as means of n=6 ± s.d. *: p<0.01, **: p<0.001, ***: p<0.0001, two-sided T-test. (c,d) Reporter gene assays in PC12 cells monitoring dose-response curves cre-reporter activities of AVP stimulated AVPR2-N-TEV-tevS-GV (c) and NFAT-reporter activities of AVPR1a-N-TEV-tevS-GV (d). Mock: pcDNA backbone vector. Indicated EC50 values and R2 Pearson’s correlation coefficients were determined by sigmoidal curve fitting algorithm using GraphPad Prism®. Data are given as means of n=6 ± s.d.
Nfat activation as a result of AVPR1a-N-TEV-tevS-GV signaling using the AVPR1a-N-
TEV-tevS-GV construct was as well dose-dependent following a typical sigmoidal
response curve with an EC50 of 0.16 nM (Fig. 16d). This further substantiates that the C-
terminal N-TEV-tevS-GV tag per se does not dramatically modify the signaling properties
of AVPR1a and -2 receptors.

DISCUSSION 60
5 Discussion
In this thesis, a method is presented to measure GPCR activation through the stimulation-
dependent interaction between GPCRs and Arr2. It represents a modified split-TEV
assay which uses the recomplementation of TEV protease fragments upon protein-protein
interaction and combines it with a transcription-coupled readout. Components of GPCR
split-TEV assays are 1) GPCR constructs which carry the GPCR, the N-terminal TEV
fragment, the TEV cleavage site and the transcription factor GV, 2) Arr2 constructs where
Arr2 is attached to the C-terminal TEV fragment, and 3) reporter constructs. To evaluate
the assay system, cleavage of the receptor constructs, use of different TEV cleavage sites
and transcription-coupled reporters as well as the physiological behaviour of GPCR
constructs and applicability of the assays in different cell types were tested. Split-TEV
assays were furthermore compared to the previously described full-TEV/Tango assays
which rely on the induced proximity of a full-length TEV protease with its substrate.
5.1 Cleavage of GPCR constructs by TEV protease
GPCR constructs containing the natural cleavage site ENLYFQ’G (tevS) were efficiently
cleaved by cytosolic TEV protease, proving sterical availability of the TEV cleavage site
despite the rather big C- and N-terminally attached N-TEV and GV. However, variable
levels of background were observed which were especially high for ADRB2. Thus,
transcriptional activation of the reporter gene by GV seems to occur at a distinct level
even in the absence of TEV protease. Possible scenarios are the cleavage of a C-terminal
fragment of the receptor by a membrane-associated or cytosolic protease followed by
translocation to the nucleus or nuclear localization of the receptor itself. Evidence for a
role of both scenarios in GPCR biology exists in the literature. For example, it has been
shown that the angiotensin II type 1 receptor undergoes cleavage and that the resulting C-
terminal fragment accumulates in the nucleus, eventually regulating gene expression
(Cook et al. 2007). On the other hand, localization at nuclear membranes and signaling by
a couple of GPCRs including beta-adrenergic receptors has recently emerged though this
could not be established for ADRB2 (Boivin et al. 2006; Boivin et al. 2008).
Cleavage of GPCR constructs by TEV was site-specific, as the low-affinity ENLYFQ’L
(tevS*) was not cleaved by cytosolic TEV, as previously described by Barnea et al.
(Barnea et al. 2008). It seems that random presentation of tevS* to TEV is not sufficient to
induce efficient cleavage.

DISCUSSION 61
5.2 Influence of the cleavage site on split-TEV and full-TEV assay
performance
Split-TEV assays sensitive for the stimulation-dependent interaction of GPCRs with Arr2
in transient transfections were established for vasopressin and dopamine receptors as well
as the beta-adrenergic receptor 2. In constrast, the full-TEV approach was in our hands
not sufficiently sensitive to monitor activation of most of the tested GPCRs, and less
sensitive than split-TEV in the case of AVPR1a. Different TEV cleavage sites have been
used in split-TEV and full-TEV assays to obtain optimal performance, as evaluated in a
separate experiment. The high-affinity tevS was used in split-TEV assays where it
provided a sensitive readout which could not be obtained with tevS*. Loss of specificity
due to the high-affinity tevS is not an issue in split-TEV assays because specificity is
mainly given by the functional complementation of inactive fragments which occurs only
upon protein-protein interaction. In contrast, the low-affinity cleavage tevS* was used for
full-TEV assays where no specific readouts could be obtained with tevS (Barnea et al.
2008). As cleavage of tevS by cytosolic TEV provides a high background, unspecific
random interactions between GPCR constructs carrying tevS and Arr2-TEV might affect
signal-to-noise ratios in such way that no window is left do discriminate real stimulation-
dependent interactions. In this case, use of a low-affinity cleavage site would provide the
necessary specificity. On the other hand, use of the low-affinity tevS* might at least
partially explain why full-TEV assays do not reliably work in transiently transfected cells. In
a recent report by Hanson et al., however, it was shown that the TEV-cleavage site with a
leucine carboxyterminally of the cleavage site (position P1’) is less efficient compared to
another version with a methionine at position P1’ (ENLYFQ’M) (Hanson et al. 2009).
Therefore, it cannot be excluded that full-TEV assays, when performed with reporters
harbouring a methionine at P1’, may also be successfully adapted for transient
transfection approaches.
5.3 Use of a Arr2 truncation mutant for split-TEV and full-TEV assays
Split-TEV and full-TEV assay performance was compared when using either a full-length
or a Arr2 deletion mutant (Arr2∆) lacking the entire C-terminal tail (aa 383-410) in fusion
with C-TEV. The C-terminus contains essential parts of the clathrin binding sites and is
likely to be important in keeping Arr2 in its inactive conformation thereby improving
phosphorylation- dependent recruitment (Han et al. 2001; Kovoor et al. 1999). The use of
Arr2∆ substantially improved split-TEV assays by increasing ratios mainly due to less

DISCUSSION 62
constitutive recruitment reducing the baseline values. In contrast, full-TEV assay
performance was even further reduced by Arr2∆ which is most likely due to the enhanced
selectivity of the mutant Arr2∆ version and the lower overall sensitivity of full-TEV assays.
5.4 Flexibility of split-TEV assay readout
The modular nature of split-TEV assays provides a high grade of flexibility, e.g. by
allowing to choose the most convenient readout out of a toolbox. Therefore, fluorescence
readouts were evaluated in addition to the mostly used luciferase readout. Taking an
AVPR2 split-TEV assay as example, we could show that analysis of number of fluorescent
cells carrying the reporter gene and of total fluorescence by flow cytometry were very
similar to what was measured in luciferase assays. Likewise, cleavage of GPCR
constructs was analyzed both in luciferase assays and by flow cytometry, and e.g. the
more efficient cleavage of AVPR2 compared to DRD2 and ADRB2 was reflected in both
readouts. However, assessment of cleavage in luciferase assays was done in separate
experiments for each GPCR and with slightly differently GPCR constructs and can thus
not be directly compared to the simultaneously performed fluorescence assays. In
general, fluorescence readout could nicely allow quick assessment of assay performance
under a fluorescence microscope, however, high throughput assays will pose a challenge
on quantification by flow cytometry.
5.5 Cell type-dependent differences in split-TEV assay performance
Split-TEV was previously described to be applicable in even hard-to-transfect primary
cells such as various neuronal cell types (Wehr et al. 2006; Wehr et al. 2008). Here, we
could show that split-TEV-based GPCR activation assays are applicable in different
heterologous cell types as well as in primary cultured neuronal and glial cells. The high
flexibility of split-TEV assays may be a helpful feature since contextual specificity, which is
mainly determined by the cell type used for a particular assay, appears to be of high
importance when studying GPCR pharmacology (Kenakin 2005; Kenakin 2009; Thomsen
et al. 2005). In line with the importance of considering the cell type used, marked
differences in assay performance were observed between different cellular systems. For
example, vasopressin receptor activation assays performed robustly in PC12 cells and
primary neurons, but not in U2OS cells. In contrast, dopamine receptor assays performed
well in U2OS cells and primary neurons, but did not reveal ligand-dependent differences
in reporter activation in PC12 cells. PC12 cells are known to secrete dopamine (Schubert
DISCUSSION 63
and Klier 1977) and it seems possible that the endogenous dopamine is already sufficient
to activate the exogenous dopamine receptors. This assumption is supported by the high
background levels of DRD1 receptor constructs when co-transfected with Arr2-C-TEV
expression cassettes. Assays in primary neurons and astrocytes showed higher signal-to-
noise ratios and more variability among biological replicates. This was possibly due to
lower efficiency of transfection with lipofectamine and higher vulnerability of primary cells
as well as a higher diversity among individual cells compared to immortalized cell lines.
In conclusion, assay performance does not only depend on the functionality of the sensor
system per se but can be influenced by the endogenous equipment of the cells. The
expression of endogenous ligands but also receptors as well as the set of G proteins,
GRKs and -arrestins may influence the measured response.
5.6 Split-TEV dose-response assays for GPCR activation
GPCR/Arr2-interactions were dose-dependent in split-TEV assays for all GPCRs tested.
EC50s as a measure of agonist potency were comparable to those reported from
radioligand-binding or other GPCR activation assays (Barnea et al. 2008; Breit et al. 2004;
Hammer et al. 2007; Hanson et al. 2009; Harmar et al. 2009; Oakley et al. 2002).
Importantly, very similar EC50s were obtained across different cell types, as shown for
ADRB2 in U2OS cells and primary cultured astrocytes.
5.7 Cellular signaling by differently tagged GPCRs
To improve assay sensitivity via enhanced Arr2 recruitment, Barnea et al. added the C-
terminal intracellular domain of AVPR2 to the GPCR reporter constructs (Barnea et al.
2008). This strategy was adopted for split-TEV assays and indeed led to an improved
assay performance for some receptors. It has, however, not been addressed so far
whether these modified receptors may be altered with respect to their signaling properties.
Therefore, downstream signaling of differently tagged AVPR1a and AVPR2 constructs
was monitored with cAMP- and calcium-responsive cis-element driven reporters.
Preferential coupling of AVPR1a to Gαq with elevation of intracellular Ca2+ and of AVPR2
to Gαs with increase of cAMP was validated in these assays. Interestingly, stimulation of
AVPR1a constructs led to a significant activation of cre-luciferase, though to a minor
extent than AVPR2 did. In cross-controls, cre-luciferase showed a slight but significant
response to stimulation with PMA + ionomycin, as did nfat-luciferase when stimulated with
db-cAMP. Indirect effects like cross-activation of downstream signaling by effector

DISCUSSION 64
molecules or direct activation of the respective cis element might explain this. Concerning
cre activation by AVPR1a, coupling of AVPR1a to Gs to a certain extent should not been
excluded.
The different split-TEV tags (N-TEV-tevS-GV and C-TEV) appeared to have no effect on
the cAMP signaling but seemed to reduce the AVPR1a mediated Ca2+-response. With an
additional AVPR2 C-terminal domain fused to the AVPR1a receptor to enhance Arr2
recruitment, however, the Ca2+-response was nearly completely abolished. It may
therefore be concluded that constructs harbouring potential signaling-competent
modifications should not be used to monitor cellular effects beyond receptor activation.
5.8 Advantages and disadvantages of split-TEV assays for GPCR
activation
Split-TEV assays for GPCR activation show high sensitivity for GPCR/Arr2 interactions
and transient transfections are sufficient to obtain robust readouts. Specificity is acquired
by recomplementation of the TEV protease so that coincidental proximity of the proteins of
interest would not be displayed in the final readout. Readouts of split-TEV assays can be
flexibly chosen. Transcription-coupled reporters can be employed to amplify weak signals.
Additionally, fluorescent reporters can be useful for measurements in living cells without
the requirement of cell lysis.
However, transcription-coupled readouts are relatively slow compared to the transient
nature of many signaling events and are not suited to monitor online kinetics.
Measurements reflect an integral of those events which led to transcriptional changes in
the time window between stimulation and measurement. Events which happen for only a
short time after stimulation, e.g. due to fast degradation of an agonist, might not turn up as
a significant change in reference to a control condition. Furthermore, no subcellular
resolution of signaling events within microdomains can be obtained, as could e.g. be the
case in FRET measurements (Gao X and Zhang 2010).
Split-TEV assays require tags containing the inactive protease fragments as well as the
transcription factor, and this could have an influence on receptor behaviour. In the
presented experiments, fusion proteins were properly expressed and reflected GPCR
activation including pharmacological properties, but downstream signaling might have
been compromised by the use of tagged receptors.
Split-TEV assays can in principle be applied in any cell type that allows genetic
modification and this was exemplarily shown in different heterologous cell lines as well as

DISCUSSION 65
primary cultured neurons and astrocytes. Especially the possibility to use primary cultured
cells which cannot be subjected to stable transfections is an attractive option if one wants
to assess GPCR pathology in the primary biological context. GPCR split-TEV assays
themselves were dependent on cellular context but this might not necessarily be a
drawback if it reflects actual biology.
Activation profiles of an array of GPCRs in response to a given substance would be an
interesting application of GPCR-split-TEV assays. As already mentioned, many drugs
affect more than one target and many targets are affected by more than one drug, so
receptor activation profiling could be useful to estimate therapeutic and adverse effects
(Boran and Iyengar 2010; Yildirim et al. 2007).
Additionally, split-TEV assays might be used to study orphan GPCRs for which no ligand
has been identified yet. Libraries of putative ligands could thus be screened independently
of the downstream signaling employed by these receptors (Wise et al. 2004).
Assays can be carried out in a 96-well format and are relatively easy to handle in terms of
expertise and equipment. They could moreover be adjusted to a high-throughput scale.
5.9 Outlook: Possible implementation of GPCR split-TEV assays into
multiplexed assays
Split-TEV assays for GPCR activation could be integrated into higher-level analyses of
GPCR signal transduction. Parallelized analyses e.g. of GPCR activation, internalization
and intracellular signaling including transcriptional regulation would mainly require a high
number of reporters of which each one stands for a specific process or signaling
component. Barcode reporters present a solution for this challenge by using unique
expressed oligonucleotide tags which can be coupled to transcription-encoded split-TEV
assays as well as to a variety of cis elements or potentially to split-TEV and be analyzed
with microarrays or high-throughput sequencing (Botvinnik et al. 2010).

SUMMARY 66
6 Summary
G protein-coupled receptors (GPCRs) constitute the largest receptor family in mammals
and represent important drug targets. Signaling through GPCRs mediates physiological
effects which are strongly dependent on the cellular context. Therefore, the availability of
assays monitoring GPCR activation applicable in different cell types could help to better
understand GPCR functions and to realize the potential of known as well as novel
substances. Here, we introduce a split-TEV assay to monitor GPCR activation through the
stimulation-dependent recruitment of β-arrestin 2. Inactive N- and C-terminal fragments of
the TEV protease are coupled to a GPCR and β-arrestin 2, respectively. Ligand-
dependent interaction of the two fusion proteins leads to functional complementation of
the TEV protease, followed by cleavage of an artificial transcription factor and successive
reporter gene activation. The presented split-TEV assay system is highly sensitive and
was successfully applied in heterologous cell lines as well as in primary cultured neuronal
and glial cells. We show that assay performance strongly depends on the endogenous
properties of different cell types. The sensitivity and flexibility makes split-TEV assays a
valuable tool to analyze GPCR activation in different cell types in a rapid and cost-
effective way.

REFERENCES 67
7 References
Ahn S, Shenoy SK, Wei H, Lefkowitz RJ (2004): Differential kinetic and spatial patterns of
beta-arrestin and G protein-mediated ERK activation by the angiotensin II receptor. J
Biol Chem 279, 35518-35525.
Baillie GS (2009): Compartmentalized signalling: spatial regulation of cAMP by the action
of compartmentalized phosphodiesterases. Febs J 276, 1790-1799.
Barak LS, Ferguson SS, Zhang J, Caron MG (1997): A beta-arrestin/green fluorescent
protein biosensor for detecting G protein-coupled receptor activation. J Biol Chem 272,
27497-27500.
Barnea G, Strapps W, Herrada G, Berman Y, Ong J, Kloss B, Axel R, Lee KJ (2008): The
genetic design of signaling cascades to record receptor activation. Proc Natl Acad Sci
U S A 105, 64-69.
Berridge MJ, Lipp P, Bootman MD (2000): The versatility and universality of calcium
signalling. Nat Rev Mol Cell Biol 1, 11-21.
Boivin B, Lavoie C, Vaniotis G, Baragli A, Villeneuve LR, Ethier N, Trieu P, Allen BG,
Hebert TE (2006): Functional beta-adrenergic receptor signalling on nuclear
membranes in adult rat and mouse ventricular cardiomyocytes. Cardiovasc Res 71,
69-78.
Boivin B, Vaniotis G, Allen BG, Hebert TE (2008): G protein-coupled receptors in and on
the cell nucleus: a new signaling paradigm? J Recept Signal Transduct Res 28, 15-28.
Boran AD, Iyengar R (2010): Systems approaches to polypharmacology and drug
discovery. Curr Opin Drug Discov Devel 13, 297-309.
Boss V, Wang X, Koppelman LF, Xu K, Murphy TJ (1998): Histamine induces nuclear
factor of activated T cell-mediated transcription and cyclosporin A-sensitive interleukin-
8 mRNA expression in human umbilical vein endothelial cells. Mol Pharmacol 54, 264-
272.
Botvinnik A, Wichert SP, Fischer TM, Rossner MJ (2010): Integrated analysis of receptor
activation and downstream signaling with EXTassays. Nat Methods 7, 74-80.
Boulay G, Brown DM, Qin N, Jiang M, Dietrich A, Zhu MX, Chen Z, Birnbaumer M,
Mikoshiba K, Birnbaumer L (1999): Modulation of Ca(2+) entry by polypeptides of the
inositol 1,4, 5-trisphosphate receptor (IP3R) that bind transient receptor potential
(TRP): evidence for roles of TRP and IP3R in store depletion-activated Ca(2+) entry.
Proc Natl Acad Sci U S A 96, 14955-14960.

REFERENCES 68
Breit A, Lagace M, Bouvier M (2004): Hetero-oligomerization between beta2- and beta3-
adrenergic receptors generates a beta-adrenergic signaling unit with distinct functional
properties. J Biol Chem 279, 28756-28765.
Brown JH, Makman MH (1972): Stimulation by dopamine of adenylate cyclase in retinal
homogenates and of adenosine-3':5'-cyclic monophosphate formation in intact retina.
Proc Natl Acad Sci U S A 69, 539-543.
Caldwell HK, Lee HJ, Macbeth AH, Young WS, 3rd (2008): Vasopressin: behavioral roles
of an "original" neuropeptide. Prog Neurobiol 84, 1-24.
Castagna M, Takai Y, Kaibuchi K, Sano K, Kikkawa U, Nishizuka Y (1982): Direct
activation of calcium-activated, phospholipid-dependent protein kinase by tumor-
promoting phorbol esters. J Biol Chem 257, 7847-7851.
Cook JL, Mills SJ, Naquin RT, Alam J, Re RN (2007): Cleavage of the angiotensin II type
1 receptor and nuclear accumulation of the cytoplasmic carboxy-terminal fragment. Am
J Physiol Cell Physiol 292, C1313-1322.
Crabtree GR, Olson EN (2002): NFAT signaling: choreographing the social lives of cells.
Cell 109 Suppl, S67-79.
Dasgupta P, Rastogi S, Pillai S, Ordonez-Ercan D, Morris M, Haura E, Chellappan S
(2006): Nicotine induces cell proliferation by beta-arrestin-mediated activation of Src
and Rb-Raf-1 pathways. J Clin Invest 116, 2208-2217.
Daub H, Weiss FU, Wallasch C, Ullrich A (1996): Role of transactivation of the EGF
receptor in signalling by G-protein-coupled receptors. Nature 379, 557-560.
de Wet JR, Wood KV, DeLuca M, Helinski DR, Subramani S (1987): Firefly luciferase
gene: structure and expression in mammalian cells. Mol Cell Biol 7, 725-737.
Di Chiara G, Bassareo V, Fenu S, De Luca MA, Spina L, Cadoni C, Acquas E, Carboni E,
Valentini V, Lecca D (2004): Dopamine and drug addiction: the nucleus accumbens
shell connection. Neuropharmacology 47 Suppl 1, 227-241.
Druker BJ, Tamura S, Buchdunger E, Ohno S, Segal GM, Fanning S, Zimmermann J,
Lydon NB (1996): Effects of a selective inhibitor of the Abl tyrosine kinase on the
growth of Bcr-Abl positive cells. Nat Med 2, 561-566.
Edwards DR (1994): Cell signalling and the control of gene transcription. Trends
Pharmacol Sci 15, 239-244.
Eglen RM, Bosse R, Reisine T (2007): Emerging concepts of guanine nucleotide-binding
protein-coupled receptor (GPCR) function and implications for high throughput
screening. Assay Drug Dev Technol 5, 425-451.

REFERENCES 69
Fang Y, Frutos AG, Verklereen R (2008): Label-free cell-based assays for GPCR
screening. Comb Chem High Throughput Screen 11, 357-369.
Ferguson SS (2001): Evolving concepts in G protein-coupled receptor endocytosis: the
role in receptor desensitization and signaling. Pharmacol Rev 53, 1-24.
Ferguson SS, Downey WE, 3rd, Colapietro AM, Barak LS, Menard L, Caron MG (1996):
Role of beta-arrestin in mediating agonist-promoted G protein-coupled receptor
internalization. Science 271, 363-366.
Fuxe K, Manger P, Genedani S, Agnati L (2006): The nigrostriatal DA pathway and
Parkinson's disease. J Neural Transm Suppl 70, 71-83.
Gao H, Sun Y, Wu Y, Luan B, Wang Y, Qu B, Pei G (2004): Identification of beta-arrestin2
as a G protein-coupled receptor-stimulated regulator of NF-kappaB pathways. Mol Cell
14, 303-317.
Gao X, Zhang J (2010): FRET-based activity biosensors to probe compartmentalized
signaling. Chembiochem 11, 147-151.
Ghosh RN, DeBiasio R, Hudson CC, Ramer ER, Cowan CL, Oakley RH (2005):
Quantitative cell-based high-content screening for vasopressin receptor agonists using
transfluor technology. J Biomol Screen 10, 476-484.
Gong Q, Cheng AM, Akk AM, Alberola-Ila J, Gong G, Pawson T, Chan AC (2001):
Disruption of T cell signaling networks and development by Grb2 haploid insufficiency.
Nat Immunol 2, 29-36.
Gray R, Johnston D (1987): Noradrenaline and beta-adrenoceptor agonists increase
activity of voltage-dependent calcium channels in hippocampal neurons. Nature 327,
620-622.
Hamdan FF, Audet M, Garneau P, Pelletier J, Bouvier M (2005): High-throughput
screening of G protein-coupled receptor antagonists using a bioluminescence
resonance energy transfer 1-based beta-arrestin2 recruitment assay. J Biomol Screen
10, 463-475.
Hammer MM, Wehrman TS, Blau HM (2007): A novel enzyme complementation-based
assay for monitoring G-protein-coupled receptor internalization. FASEB J 21, 3827-
3834.
Han M, Gurevich VV, Vishnivetskiy SA, Sigler PB, Schubert C (2001): Crystal structure of
beta-arrestin at 1.9 A: possible mechanism of receptor binding and membrane
Translocation. Structure 9, 869-880.

REFERENCES 70
Hanson BJ, Wetter J, Bercher MR, Kopp L, Fuerstenau-Sharp M, Vedvik KL, Zielinski T,
Doucette C, Whitney PJ, Revankar C (2009): A homogeneous fluorescent live-cell
assay for measuring 7-transmembrane receptor activity and agonist functional
selectivity through beta-arrestin recruitment. J Biomol Screen 14, 798-810.
Harmar AJ, Hills RA, Rosser EM, Jones M, Buneman OP, Dunbar DR, Greenhill SD, Hale
VA, Sharman JL, Bonner TI, Catterall WA, Davenport AP, Delagrange P, Dollery CT,
Foord SM, Gutman GA, Laudet V, Neubig RR, Ohlstein EH, Olsen RW, Peters J, Pin
JP, Ruffolo RR, Searls DB, Wright MW, Spedding M (2009): IUPHAR-DB: the IUPHAR
database of G protein-coupled receptors and ion channels. Nucleic Acids Res 37,
D680-685.
Hartley JL, Temple GF, Brasch MA (2000): DNA cloning using in vitro site-specific
recombination. Genome Res 10, 1788-1795.
Hill CS, Treisman R (1995): Transcriptional regulation by extracellular signals:
mechanisms and specificity. Cell 80, 199-211.
Hirsch JA, Schubert C, Gurevich VV, Sigler PB (1999): The 2.8 A crystal structure of visual
arrestin: a model for arrestin's regulation. Cell 97, 257-269.
Hopkins AL (2008): Network pharmacology: the next paradigm in drug discovery. Nat
Chem Biol 4, 682-690.
Jiang M, Spicher K, Boulay G, Wang Y, Birnbaumer L (2001): Most central nervous
system D2 dopamine receptors are coupled to their effectors by Go. Proc Natl Acad
Sci U S A 98, 3577-3582.
Kang J, Shi Y, Xiang B, Qu B, Su W, Zhu M, Zhang M, Bao G, Wang F, Zhang X, Yang R,
Fan F, Chen X, Pei G, Ma L (2005): A nuclear function of beta-arrestin1 in GPCR
signaling: regulation of histone acetylation and gene transcription. Cell 123, 833-847.
Kenakin T (2003): Predicting therapeutic value in the lead optimization phase of drug
discovery. Nat Rev Drug Discov 2, 429-438.
Kenakin T (2005): New concepts in drug discovery: collateral efficacy and permissive
antagonism. Nat Rev Drug Discov 4, 919-927.
Kenakin T (2009): Cellular assays as portals to seven-transmembrane receptor-based
drug discovery. Nat Rev Drug Discov 8, 617-626.
Kholodenko BN, Hancock JF, Kolch W (2010): Signalling ballet in space and time. Nat Rev
Mol Cell Biol 11, 414-426.
Kitano H (2007): A robustness-based approach to systems-oriented drug design. Nat Rev
Drug Discov 6, 202-210.

REFERENCES 71
Konopka JB, Watanabe SM, Singer JW, Collins SJ, Witte ON (1985): Cell lines and clinical
isolates derived from Ph1-positive chronic myelogenous leukemia patients express c-
abl proteins with a common structural alteration. Proc Natl Acad Sci U S A 82, 1810-
1814.
Kovoor A, Celver J, Abdryashitov RI, Chavkin C, Gurevich VV (1999): Targeted
construction of phosphorylation-independent beta-arrestin mutants with constitutive
activity in cells. J Biol Chem 274, 6831-6834.
Krasel C, Zabel U, Lorenz K, Reiner S, Al-Sabah S, Lohse MJ (2008): Dual role of the
beta2-adrenergic receptor C terminus for the binding of beta-arrestin and receptor
internalization. J Biol Chem 283, 31840-31848.
Kuschel M, Zhou YY, Cheng H, Zhang SJ, Chen Y, Lakatta EG, Xiao RP (1999): G(i)
protein-mediated functional compartmentalization of cardiac beta(2)-adrenergic
signaling. J Biol Chem 274, 22048-22052.
Lagerstrom MC, Schioth HB (2008): Structural diversity of G protein-coupled receptors
and significance for drug discovery. Nat Rev Drug Discov 7, 339-357.
Laporte SA, Oakley RH, Holt JA, Barak LS, Caron MG (2000): The interaction of beta-
arrestin with the AP-2 adaptor is required for the clustering of beta 2-adrenergic
receptor into clathrin-coated pits. J Biol Chem 275, 23120-23126.
Laureys G, Clinckers R, Gerlo S, Spooren A, Wilczak N, Kooijman R, Smolders I, Michotte
Y, De Keyser J (2010): Astrocytic beta(2)-adrenergic receptors: from physiology to
pathology. Prog Neurobiol 91, 189-199.
Lefkowitz RJ, Rajagopal K, Whalen EJ (2006): New roles for beta-arrestins in cell
signaling: not just for seven-transmembrane receptors. Mol Cell 24, 643-652.
Lewis DA, Lieberman JA (2000): Catching up on schizophrenia: natural history and
neurobiology. Neuron 28, 325-334.
Lohse MJ, Benovic JL, Codina J, Caron MG, Lefkowitz RJ (1990): beta-Arrestin: a protein
that regulates beta-adrenergic receptor function. Science 248, 1547-1550.
Luttrell LM, Ferguson SS, Daaka Y, Miller WE, Maudsley S, Della Rocca GJ, Lin F,
Kawakatsu H, Owada K, Luttrell DK, Caron MG, Lefkowitz RJ (1999): Beta-arrestin-
dependent formation of beta2 adrenergic receptor-Src protein kinase complexes.
Science 283, 655-661.
Macian F, Lopez-Rodriguez C, Rao A (2001): Partners in transcription: NFAT and AP-1.
Oncogene 20, 2476-2489.

REFERENCES 72
Mahan LC, Burch RM, Monsma FJ, Jr., Sibley DR (1990): Expression of striatal D1
dopamine receptors coupled to inositol phosphate production and Ca2+ mobilization in
Xenopus oocytes. Proc Natl Acad Sci U S A 87, 2196-2200.
Marshall CJ (1995): Specificity of receptor tyrosine kinase signaling: transient versus
sustained extracellular signal-regulated kinase activation. Cell 80, 179-185.
Mayr B, Montminy M (2001): Transcriptional regulation by the phosphorylation-dependent
factor CREB. Nat Rev Mol Cell Biol 2, 599-609.
Montminy MR, Sevarino KA, Wagner JA, Mandel G, Goodman RH (1986): Identification of
a cyclic-AMP-responsive element within the rat somatostatin gene. Proc Natl Acad Sci
U S A 83, 6682-6686.
Nakajima T, Uchida C, Anderson SF, Parvin JD, Montminy M (1997): Analysis of a cAMP-
responsive activator reveals a two-component mechanism for transcriptional induction
via signal-dependent factors. Genes Dev 11, 738-747.
Nelson CD, Perry SJ, Regier DS, Prescott SM, Topham MK, Lefkowitz RJ (2007):
Targeting of diacylglycerol degradation to M1 muscarinic receptors by beta-arrestins.
Science 315, 663-666.
Neve KA, Seamans JK, Trantham-Davidson H (2004): Dopamine receptor signaling. J
Recept Signal Transduct Res 24, 165-205.
Neves SR, Ram PT, Iyengar R (2002): G protein pathways. Science 296, 1636-1639.
Oakley RH, Laporte SA, Holt JA, Caron MG, Barak LS (2000): Differential affinities of
visual arrestin, beta arrestin1, and beta arrestin2 for G protein-coupled receptors
delineate two major classes of receptors. J Biol Chem 275, 17201-17210.
Oakley RH, Hudson CC, Cruickshank RD, Meyers DM, Payne RE, Jr., Rhem SM, Loomis
CR (2002): The cellular distribution of fluorescently labeled arrestins provides a robust,
sensitive, and universal assay for screening G protein-coupled receptors. Assay Drug
Dev Technol 1, 21-30.
Overington JP, Al-Lazikani B, Hopkins AL (2006): How many drug targets are there? Nat
Rev Drug Discov 5, 993-996.
Pan Y, Metzenberg A, Das S, Jing B, Gitschier J (1992): Mutations in the V2 vasopressin
receptor gene are associated with X-linked nephrogenic diabetes insipidus. Nat Genet
2, 103-106.
Papin JA, Hunter T, Palsson BO, Subramaniam S (2005): Reconstruction of cellular
signalling networks and analysis of their properties. Nat Rev Mol Cell Biol 6, 99-111.

REFERENCES 73
Perry SJ, Baillie GS, Kohout TA, McPhee I, Magiera MM, Ang KL, Miller WE, McLean AJ,
Conti M, Houslay MD, Lefkowitz RJ (2002): Targeting of cyclic AMP degradation to
beta 2-adrenergic receptors by beta-arrestins. Science 298, 834-836.
Pitcher JA, Payne ES, Csortos C, DePaoli-Roach AA, Lefkowitz RJ (1995): The G-protein-
coupled receptor phosphatase: a protein phosphatase type 2A with a distinct
subcellular distribution and substrate specificity. Proc Natl Acad Sci U S A 92, 8343-
8347.
Rakhit S, Pyne S, Pyne NJ (2001): Nerve growth factor stimulation of p42/p44 mitogen-
activated protein kinase in PC12 cells: role of G(i/o), G protein-coupled receptor kinase
2, beta-arrestin I, and endocytic processing. Mol Pharmacol 60, 63-70.
Schoneberg T, Kostenis E, Liu J, Gudermann T, Wess J (1998): Molecular aspects of
vasopressin receptor function. Adv Exp Med Biol 449, 347-358.
Schubert D, Klier FG (1977): Storage and release of acetylcholine by a clonal cell line.
Proc Natl Acad Sci U S A 74, 5184-5188.
Scott JD, Pawson T (2009): Cell signaling in space and time: where proteins come
together and when they're apart. Science 326, 1220-1224.
Terrillon S, Bouvier M (2004): Roles of G-protein-coupled receptor dimerization. EMBO
Rep 5, 30-34.
Thibonnier M, Berti-Mattera LN, Dulin N, Conarty DM, Mattera R (1998): Signal
transduction pathways of the human V1-vascular, V2-renal, V3-pituitary vasopressin
and oxytocin receptors. Prog Brain Res 119, 147-161.
Thibonnier M, Plesnicher CL, Berrada K, Berti-Mattera L (2001): Role of the human V1
vasopressin receptor COOH terminus in internalization and mitogenic signal
transduction. Am J Physiol Endocrinol Metab 281, E81-92.
Thomsen W, Frazer J, Unett D (2005): Functional assays for screening GPCR targets.
Curr Opin Biotechnol 16, 655-665.
Tohgo A, Choy EW, Gesty-Palmer D, Pierce KL, Laporte S, Oakley RH, Caron MG,
Lefkowitz RJ, Luttrell LM (2003): The stability of the G protein-coupled receptor-beta-
arrestin interaction determines the mechanism and functional consequence of ERK
activation. J Biol Chem 278, 6258-6267.
Tripp G, Wickens JR (2009): Neurobiology of ADHD. Neuropharmacology 57, 579-589.
Vrecl M, Jorgensen R, Pogacnik A, Heding A (2004): Development of a BRET2 screening
assay using beta-arrestin 2 mutants. J Biomol Screen 9, 322-333.

REFERENCES 74
Wehr MC, Laage R, Bolz U, Fischer TM, Grunewald S, Scheek S, Bach A, Nave KA,
Rossner MJ (2006): Monitoring regulated protein-protein interactions using split TEV.
Nat Methods 3, 985-993.
Wehr MC, Reinecke L, Botvinnik A, Rossner MJ (2008): Analysis of transient
phosphorylation-dependent protein-protein interactions in living mammalian cells using
split-TEV. BMC Biotechnol 8, 55.
Weng G, Bhalla US, Iyengar R (1999): Complexity in biological signaling systems. Science
284, 92-96.
Wise A, Jupe SC, Rees S (2004): The identification of ligands at orphan G-protein coupled
receptors. Annu Rev Pharmacol Toxicol 44, 43-66.
Yan YX, Boldt-Houle DM, Tillotson BP, Gee MA, D'Eon BJ, Chang XJ, Olesen CE, Palmer
MA (2002): Cell-based high-throughput screening assay system for monitoring G
protein-coupled receptor activation using beta-galactosidase enzyme complementation
technology. J Biomol Screen 7, 451-459.
Yildirim MA, Goh KI, Cusick ME, Barabasi AL, Vidal M (2007): Drug-target network. Nat
Biotechnol 25, 1119-1126.
Zhang J, Barak LS, Winkler KE, Caron MG, Ferguson SS (1997): A central role for beta-
arrestins and clathrin-coated vesicle-mediated endocytosis in beta2-adrenergic
receptor resensitization. Differential regulation of receptor resensitization in two distinct
cell types. J Biol Chem 272, 27005-27014.
Zhao X, Jones A, Olson KR, Peng K, Wehrman T, Park A, Mallari R, Nebalasca D, Young
SW, Xiao SH (2008): A homogeneous enzyme fragment complementation-based beta-
arrestin translocation assay for high-throughput screening of G-protein-coupled
receptors. J Biomol Screen 13, 737-747.
Zhu WZ, Zheng M, Koch WJ, Lefkowitz RJ, Kobilka BK, Xiao RP (2001): Dual modulation
of cell survival and cell death by beta(2)-adrenergic signaling in adult mouse cardiac
myocytes. Proc Natl Acad Sci U S A 98, 1607-1612.
Zlokarnik G, Negulescu PA, Knapp TE, Mere L, Burres N, Feng L, Whitney M, Roemer K,
Tsien RY (1998): Quantitation of transcription and clonal selection of single living cells
with beta-lactamase as reporter. Science 279, 84-88.

Acknowledgements
I would like to thank Prof. Dr. Mikael Simons for being available as referee and for
providing kind advice and help at any moment.
I furthermore thank Prof. Klaus-Armin Nave, PhD, for giving me the great opportunity
to work in his department.
I am deeply indebted to PD Dr. Moritz Rossner for great supervision and long and
fruitful discussions, and for teaching me careful troubleshooting. Furthermore, he
gave me the opportunity to write my own paper on the results of this thesis.
I would like to thank Dr. Anna Botvinnik, Dr. Tobias Fischer and Dr. Sven Wichert for
teaching me techniques, troubleshooting, discussing concepts and being available for
any urgent question.
I am very thankful for the excellent technical support by Ulli Bode who did
preparations for primary cell culture, and to Harry Scherer who assisted in flow
cytometry experiments.
Finally, I thank Sabrina Galinski and PD Dr. Moritz Rossner for proofreading this
thesis.

Curriculum vitae
I was born on 7th October 1984 in Wilhelmshaven where I grew up and attended school
until 2000. I then changed to CJD Christophorus School, Braunschweig, from where I
obtained the “Abitur” in 2002. In 2002 and 2003, I presented results of two lab rotations
in Braunschweig and Köln in the “Jugend forscht” young scientists competition and won
3rd prizes on a federal country level as well as a special prize by the “Bundesministerium
für Bildung und Forschung” (BmBF) in the BundesUmwelt-Wettbewerb 2002.
I started Medical School at the University of Göttingen in 2002 and accomplished the
“Physikum” in 2004. In 2005, I joined the MSc/PhD/MD-PhD program “Neurosciences”
(International Max Planck Research School) organized by the University of Göttingen
and the Max Planck Institutes in Göttingen where I achieved a “Master of Science” (MSc)
in October 2007. From 2005 to 2006, I obtained a stipend by the International Max
Planck Research School. From August 2008 to July 2009, I spend my “Practical Year” in
the Departments of Neurology and Surgery at the University Clinic Göttingen and in
Internal Medicine subspecialities at the University of San Diego, California. Throughout
my studies, I was pursuing own scientific projects in the Department of Neuroanatomy
(2003 to 2005) and the Department of Medical Psychology (2005 to 2006) at the
University of Göttingen and the Department of Neurogenetics (since 2006) at the Max
Planck Institute for Experimental Medicine in Göttingen.
I graduated from Medical School in December 2009 and afterwards proceeded with my
MD thesis in the lab of PD Dr. Moritz Rossner (Dept. of Neurogenetics) at the Max
Planck Institute for Experimental Medicine in Göttingen.

![Novel Stress-Inducible Antisense RNAs of Protein-Coding Loci Are … · Novel Stress-Inducible Antisense RNAs of Protein-Coding Loci Are Synthesized by RNA-Dependent RNA Polymerase1[OPEN]](https://img.pdfslide.tips/doc/110x75/612d20e01ecc51586941ff25/novel-stress-inducible-antisense-rnas-of-protein-coding-loci-are-novel-stress-inducible.jpg)


![Novel Stress-Inducible Antisense RNAs of Protein-Coding ...Novel Stress-Inducible Antisense RNAs of Protein-Coding Loci Are Synthesized by RNA-Dependent RNA Polymerase1[OPEN] Akihiro](https://img.pdfslide.tips/doc/110x75/5e55a965d46c5e2983693af9/novel-stress-inducible-antisense-rnas-of-protein-coding-novel-stress-inducible.jpg)