Embed Size (px)
Citation preview
Estimation of 3D reconstruction errors in a stereo-vision
system
Belhaoua A.a, Kohler S.b, Hirsch E.a
aLSIIT, Laboratoire des Sciences de l’Image, de l’Informatique et de la Teledetection UMR
7005, Pole API, Boulevard Sebastien Brant, BP 10413 - 67412 Illkirch Cedex, France;bMIPS, Laboratoire Modelisation Intelligence Processus Systemes EA 2332, 12, rue des freres
Lumiere 68093 - Mulhouse Cedex France
ABSTRACT
The paper presents an approach for error estimation for the various steps of an automated 3D vision-basedreconstruction procedure of manufactured workpieces. The process is based on a priori planning of the task andbuilt around a cognitive intelligent sensory system using so-called Situation Graph Trees (SGT) as a planningtool. Such an automated quality control system requires the coordination of a set of complex processes performingsequentially data acquisition, its quantitative evaluation and the comparison with a reference model (e.g., CADobject model) in order to evaluate quantitatively the object. To ensure efficient quality control, the aim is to beable to state if reconstruction results fulfill tolerance rules or not. Thus, the goal is to evaluate independentlythe error for each step of the stereo-vision based 3D reconstruction (e.g., for calibration, contour segmentation,matching and reconstruction) and then to estimate the error for the whole system. In this contribution, we analyzeparticularly the segmentation error due to localization errors for extracted edge points supposed to belong tolines and curves composing the outline of the workpiece under evaluation. The fitting parameters describingthese geometric features are used as quality measure to determine confidence intervals and finally to estimate thesegmentation errors. These errors are then propagated through the whole reconstruction procedure, enabling toevaluate their effect on the final 3D reconstruction result, specifically on position uncertainties. Lastly, analysisof these error estimates enables to evaluate the quality of the 3D reconstruction, as illustrated by the shownexperimental results.
Keywords: Quality Control, Stereo-vision, Segmentation, Error analysis, CAD Data, Planning, SGT
1. INTRODUCTION
In order to favor usage of industrial applications of computer vision, such as quality control and accuratemeasurement tasks leading to quantitative inspection of manufactured parts, it is necessary to develop fullyautomated tools for the accurate computation of 3D descriptions of the object of interest out of the imagecontents. The latter can then be compared with either ground truth or the CAD model of the object underinvestigation, in order to assess its quality.
In our institution, an autonomous cognitive vision system is currently being developed for the optimal 3Dreconstruction of manufactured parts, based on a priori planning of the task and built around a cognitive intel-ligent sensory system using so-called Situation Graph Trees as a planning / control tool.1 The planning systemhas been applied to structured light and stereo-vision based 3D reconstruction tasks,2–4 the aim being to deve-lop an automated quality control system for manufactured parts evaluating quantitatively their geometry. Thisrequires the coordination of a set of complex processes performing sequentially data acquisition, its quantita-tive evaluation (i.e., extraction of geometric features and their 3D reconstruction), and the comparison with areference model (e.g., CAD model of the object) in order to evaluate quantitatively the object. Stereo-vision isrecognized to be one of the techniques enabling to solve such tasks and is widely used for obtaining the required3D information after having processed a pair of images. In this case, the outline of the object can be determined,based on the set of contours defining this outline. As a result, such a contour based approach provides good
[email protected], Telephone: +33 (0)3 89 33 76 60
Modeling Aspects in Optical Metrology II, edited by Harald Bosse, Bernd Bodermann, Richard M. Silver,Proc. of SPIE Vol. 7390, 73900X · © 2009 SPIE · CCC code: 0277-786X/09/$18 · doi: 10.1117/12.827346
Proc. of SPIE Vol. 7390 73900X-1
(i.e., reasonable) reconstruction quality at low cost. The resulting accuracy of the three-dimensional positioninformation is a crucial point for quality control tasks. Accordingly, accuracy has to be optimized and, in fact,the quality of the 3D reconstruction depends not only on the quality of the acquired images but also of theirprocessing (e.g., segmentation, feature extraction, matching and reconstruction).
Over the last few years, some efforts have been spent on error analysis in stereo-vision based computer visionsystems.5–12 As an example, Blostein and Huang5 have investigated the accuracy in obtaining 3D positionalinformation based on triangulation using point correspondences derived using a stereoscopic camera setup. Theyhave derived closed form expressions for the probability distribution of position errors along each direction(horizontal, vertical and range) of the coordinate system of the stereo rig. Also, a study of different types of errorand their effects on 3D reconstruction results obtained using a structured light technique has been presentedby Yang et al.6 In their work, Yang et al. have derived expressions for the errors observed for the 3D surfaceposition, the orientation and the curvature measurements. Further, Ramakrishna et al.7 proposed a new approachfor estimating tight bounds on measurement errors, considering the inaccuracies introduced during calibrationand triangulation. Balasuramanian et al.9 analyzed the effect of noise (which is assumed to be independentand uniformly distributed) and of the geometry of the imaging setup on the reconstruction error for a straightline, their analysis being mainly based on simulation studies. Revira-Rios et al.10 have analyzed the error whenmeasuring dimensionally line entities, these errors being mostly due to localization errors in the image planesof the stereo setup. Consequently, in order to determine optimal camera poses, a non-linear program has beenformulated, that minimizes the total MSE (Mean Square Error) for the line to be measured, while satisfyingsensor related constraints. Lastly, the accuracy of 3D reconstructions has been evaluated through comparisonwith ground truth in contributions presented by Park et al.11 and Albouy et al.12 More recently, Jianxi et al.13
have presented an error analysis for 3D reconstruction taking into account only the camera calibration parameteraccuracy.
In all cases, the presence of noise in the acquired data affects the accuracy of the subsequent image processingand, thus, of the reconstruction process. In contrast to the above mentioned studies, our analysis focuses on errorestimation for the segmentation process, the starting step for the whole reconstruction procedure. Using fittingtechnique, error bounds are established for each (geometric) feature that composes the object to be evaluated.The error bounds are then propagated up to the final 3D reconstruction step. This error analysis for stereo-visionbased reconstruction tasks will then help to evaluate the quality of the 3D reconstruction. The resulting finalerror estimates will then enable to state if the reconstruction results fulfills a priori defined criteria, includingtolerance information.
The outline of the contribution is as follows. Section 2 describes the configuration of the stereo-vision systemused in our work and identifies accordingly the sources of error. Section 3 introduces the related image processingand associated errors. In section 4, using the error models, experimental results are presented and discussed.Finally, Section 5 concludes the paper and provides a short outlook.
2. FRAMEWORK OF THE APPROACH
In this section, firstly, we describe shortly the cognitive system built around two cooperative modules, anoff-line planning procedure defining the whole application and an on-line module organizing and controlling theprocessing of the acquired data. Secondly, we point out various error sources likely to be observed in the varioussteps for the whole process.
2.1 System architecture
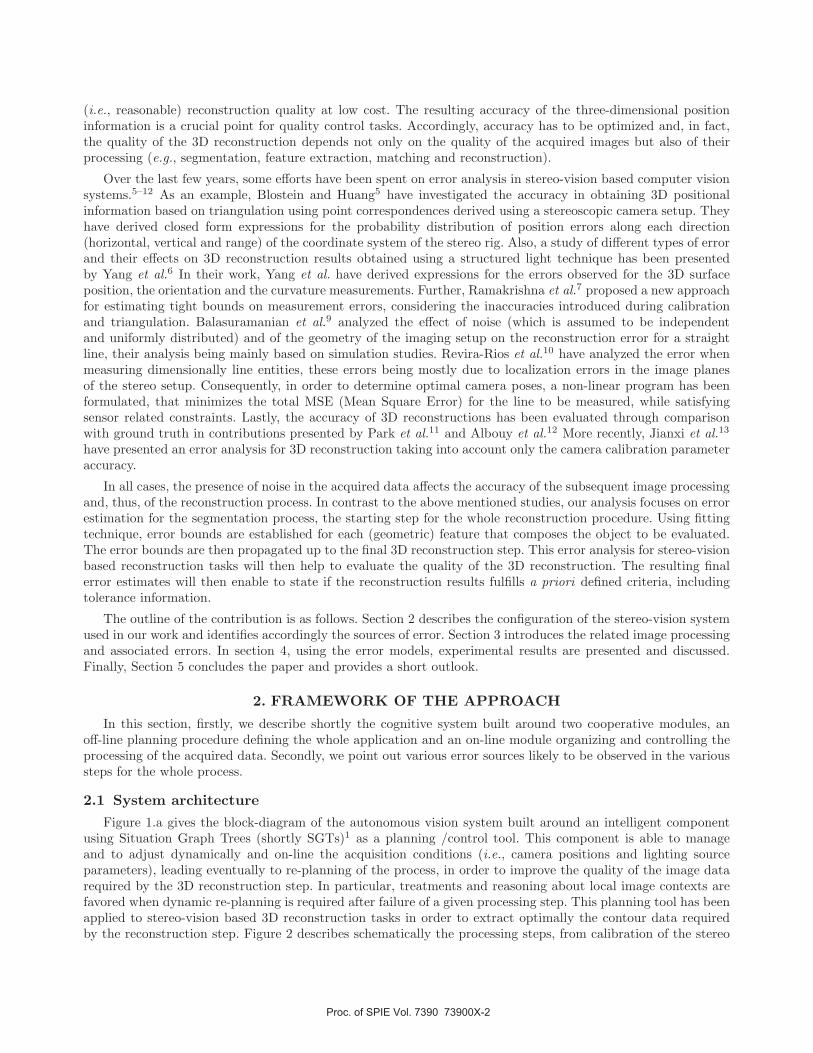
Figure 1.a gives the block-diagram of the autonomous vision system built around an intelligent componentusing Situation Graph Trees (shortly SGTs)1 as a planning /control tool. This component is able to manageand to adjust dynamically and on-line the acquisition conditions (i.e., camera positions and lighting sourceparameters), leading eventually to re-planning of the process, in order to improve the quality of the image datarequired by the 3D reconstruction step. In particular, treatments and reasoning about local image contexts arefavored when dynamic re-planning is required after failure of a given processing step. This planning tool has beenapplied to stereo-vision based 3D reconstruction tasks in order to extract optimally the contour data requiredby the reconstruction step. Figure 2 describes schematically the processing steps, from calibration of the stereo
Proc. of SPIE Vol. 7390 73900X-2
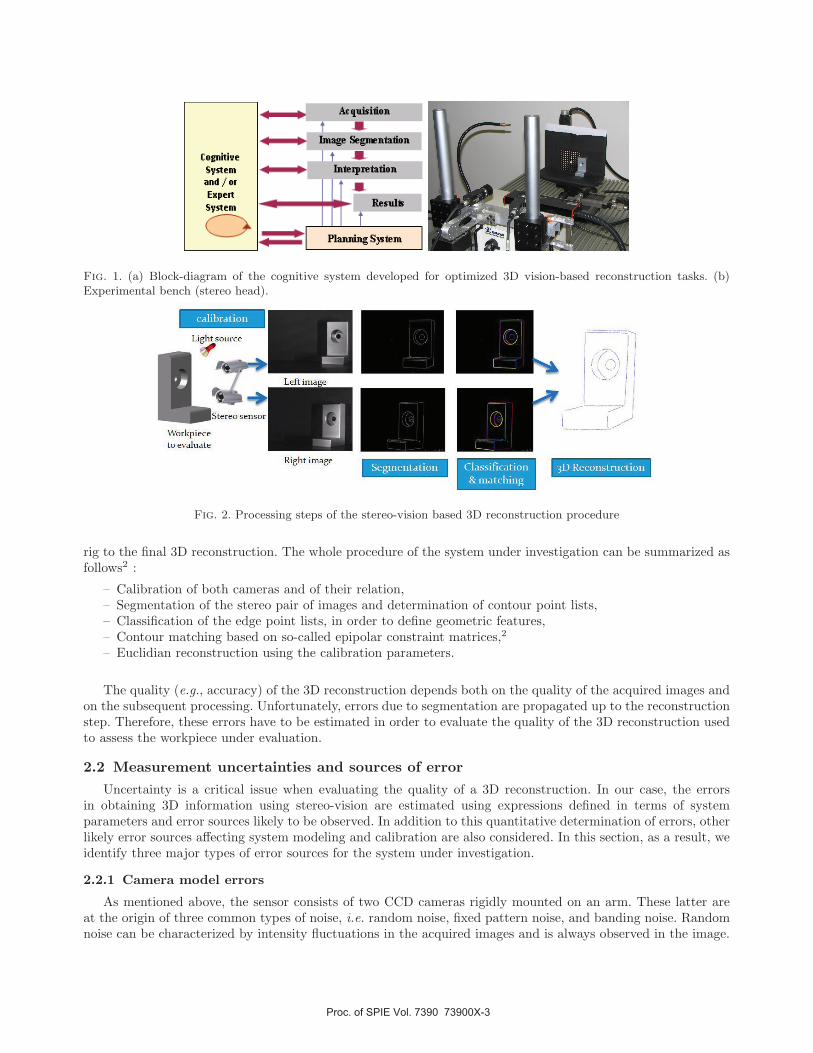
Fig. 1. (a) Block-diagram of the cognitive system developed for optimized 3D vision-based reconstruction tasks. (b)Experimental bench (stereo head).
Fig. 2. Processing steps of the stereo-vision based 3D reconstruction procedure
rig to the final 3D reconstruction. The whole procedure of the system under investigation can be summarized asfollows2 :
– Calibration of both cameras and of their relation,– Segmentation of the stereo pair of images and determination of contour point lists,– Classification of the edge point lists, in order to define geometric features,– Contour matching based on so-called epipolar constraint matrices,2
– Euclidian reconstruction using the calibration parameters.
The quality (e.g., accuracy) of the 3D reconstruction depends both on the quality of the acquired images andon the subsequent processing. Unfortunately, errors due to segmentation are propagated up to the reconstructionstep. Therefore, these errors have to be estimated in order to evaluate the quality of the 3D reconstruction usedto assess the workpiece under evaluation.
2.2 Measurement uncertainties and sources of error
Uncertainty is a critical issue when evaluating the quality of a 3D reconstruction. In our case, the errorsin obtaining 3D information using stereo-vision are estimated using expressions defined in terms of systemparameters and error sources likely to be observed. In addition to this quantitative determination of errors, otherlikely error sources affecting system modeling and calibration are also considered. In this section, as a result, weidentify three major types of error sources for the system under investigation.
2.2.1 Camera model errors
As mentioned above, the sensor consists of two CCD cameras rigidly mounted on an arm. These latter areat the origin of three common types of noise, i.e. random noise, fixed pattern noise, and banding noise. Randomnoise can be characterized by intensity fluctuations in the acquired images and is always observed in the image.
Proc. of SPIE Vol. 7390 73900X-3
Fixed pattern noise generally appears when using rather long exposure times and is usually exacerbated whentemperature increases. Banding noise is highly camera-dependent and is introduced by the camera when readingdata from the digital sensor.8 These latter two types of noise can usually be neglected. Lastly, in our case, anideal pinhole camera model is used with optics of high quality. One can thus ignore camera lens distortion andother optical nonlinearities.
2.2.2 Image processing errors
Results provided by the stereo-vision system depend heavily on the quality of the 2D features extracted byedge detection algorithms and processing is affected by various kinds of errors. As far as the acquisition conditionsare concerned, illumination conditions may decrease the quality of the edge detection procedure following imageacquisition, due to shadow or glare effects. Another kind of error arises from the sampling process leading to thedigital image. As a result, image point coordinates may differ from their true values because the sampling processrestricts image pixels to lie on an integer grid. Furthermore, many edge detection schemes rely on thresholds todecide whether an edge or contour point exists or not. Therefore, localized edge detection algorithms intrinsicallyexhibit errors, as they can fail to detect an edge, which in fact is present in the image, or detect false edge.
2.2.3 Camera calibration errors
Camera calibration is a necessary step in stereo-vision in order to extract quantitative and metric 3D in-formation from the set of two 2D images. Various types of error occur, due to inappropriate calibration of theimaging setup. These errors, which depend on both the camera set-up (e.g., distortion of the grid pattern, lensdistortion, etc) and calibration algorithm, can affect the correspondence procedure (i.e., the matching step of 2Dimage points from the two images and belonging to the same 3D scene point) and thus the triangulation step(i.e., the determination of 3D coordinates using a matched pair of two image points, one from each image of thestereo pair).
3. EVALUATION OF THE SEGMENTATION STEP AND ASSOCIATED ERRORS
Edge or contour point detection relies in our case on a gradient based-method convolving the image withfirst derivatives of a Gaussian smoothing kernel. A decision is then made as to whether a pixel belongs to anedge or not, based on convolution results. Since the aim is to develop a fully automated system (i.e., with veryrestrictive human control), the parameters that control the edge detection process (e.g., the width σ of theGaussian smoothing kernel and the threshold parameter values) are determined automatically. The σ parametervalue is determined by the amount of camera noise observed in the image and by the fine-scale texture of specificobject surfaces seen in the image. In our current implementation, a fixed value (σ = 1) is used as a startingvalue. Chains of detected contour points are subsequently grouped together to form possibly closed contours.Each contour is then further subdivided either into straight-line segments or elliptical arcs using the methoddescribed in.14 These geometric features build the base of the outline of the imaged objects particularly or ourtest workpieces.
However, these simple geometric features do not contain necessarily only true edge points. This leads touncertainties for the set of edge point positions belonging to a given geometric feature, which are further reflectedin the parameter values of the fitting equation used to describe the data. Despite this, the line segment and curvedescriptions can be determined using more or less standard fitting technique for the edge points supposed to beon these lines or curves. For that purpose, linear or non-linear least-squares fitting techniques are widely used.These latter minimize the sum of squared errors in predefined figures of merit. When using geometric fitting,named also the ’best fitting’ technique, the error distance is defined by the orthogonal, or the shortest, distanceof a given point to the geometric feature to be fitted. The geometric fitting for a line segment is a linear problem,whereas the geometric fitting of ellipses is a non-linear problem, which has to be solved iteratively. Gander et
al.15 have proposed a geometric ellipse fitting algorithm in parametric form, which involves a large number offitting parameters (m+5 unknowns in a set of 2m equations, where m is the number of measurement points), andwhere each measurement point carries an individual angular parameter to be estimated simultaneously, togetherwith the five ellipse parameters.
Proc. of SPIE Vol. 7390 73900X-4
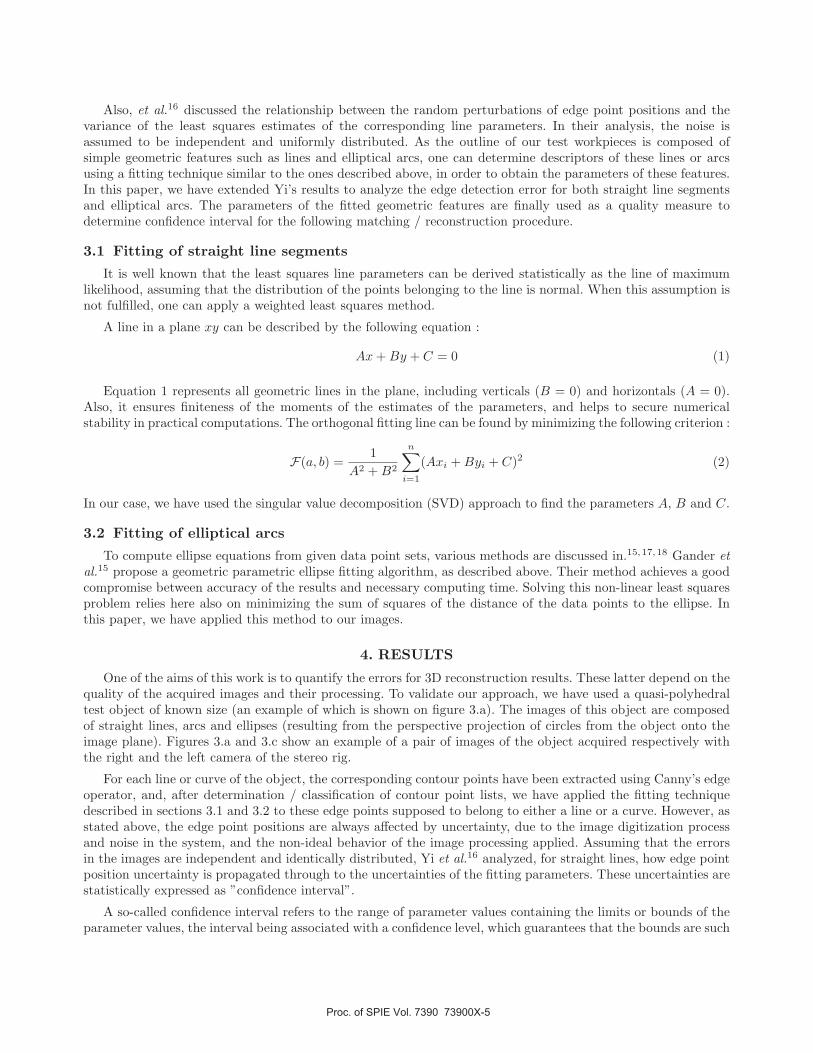
Also, et al.16 discussed the relationship between the random perturbations of edge point positions and thevariance of the least squares estimates of the corresponding line parameters. In their analysis, the noise isassumed to be independent and uniformly distributed. As the outline of our test workpieces is composed ofsimple geometric features such as lines and elliptical arcs, one can determine descriptors of these lines or arcsusing a fitting technique similar to the ones described above, in order to obtain the parameters of these features.In this paper, we have extended Yi’s results to analyze the edge detection error for both straight line segmentsand elliptical arcs. The parameters of the fitted geometric features are finally used as a quality measure todetermine confidence interval for the following matching / reconstruction procedure.
3.1 Fitting of straight line segments
It is well known that the least squares line parameters can be derived statistically as the line of maximumlikelihood, assuming that the distribution of the points belonging to the line is normal. When this assumption isnot fulfilled, one can apply a weighted least squares method.
A line in a plane xy can be described by the following equation :
Ax + By + C = 0 (1)
Equation 1 represents all geometric lines in the plane, including verticals (B = 0) and horizontals (A = 0).Also, it ensures finiteness of the moments of the estimates of the parameters, and helps to secure numericalstability in practical computations. The orthogonal fitting line can be found by minimizing the following criterion :
F(a, b) =1
A2 + B2
n∑
i=1
(Axi + Byi + C)2 (2)
In our case, we have used the singular value decomposition (SVD) approach to find the parameters A, B and C.
3.2 Fitting of elliptical arcs
To compute ellipse equations from given data point sets, various methods are discussed in.15,17,18 Gander et
al.15 propose a geometric parametric ellipse fitting algorithm, as described above. Their method achieves a goodcompromise between accuracy of the results and necessary computing time. Solving this non-linear least squaresproblem relies here also on minimizing the sum of squares of the distance of the data points to the ellipse. Inthis paper, we have applied this method to our images.
4. RESULTS
One of the aims of this work is to quantify the errors for 3D reconstruction results. These latter depend on thequality of the acquired images and their processing. To validate our approach, we have used a quasi-polyhedraltest object of known size (an example of which is shown on figure 3.a). The images of this object are composedof straight lines, arcs and ellipses (resulting from the perspective projection of circles from the object onto theimage plane). Figures 3.a and 3.c show an example of a pair of images of the object acquired respectively withthe right and the left camera of the stereo rig.
For each line or curve of the object, the corresponding contour points have been extracted using Canny’s edgeoperator, and, after determination / classification of contour point lists, we have applied the fitting techniquedescribed in sections 3.1 and 3.2 to these edge points supposed to belong to either a line or a curve. However, asstated above, the edge point positions are always affected by uncertainty, due to the image digitization processand noise in the system, and the non-ideal behavior of the image processing applied. Assuming that the errorsin the images are independent and identically distributed, Yi et al.16 analyzed, for straight lines, how edge pointposition uncertainty is propagated through to the uncertainties of the fitting parameters. These uncertainties arestatistically expressed as ”confidence interval”.
A so-called confidence interval refers to the range of parameter values containing the limits or bounds of theparameter values, the interval being associated with a confidence level, which guarantees that the bounds are such
Proc. of SPIE Vol. 7390 73900X-5
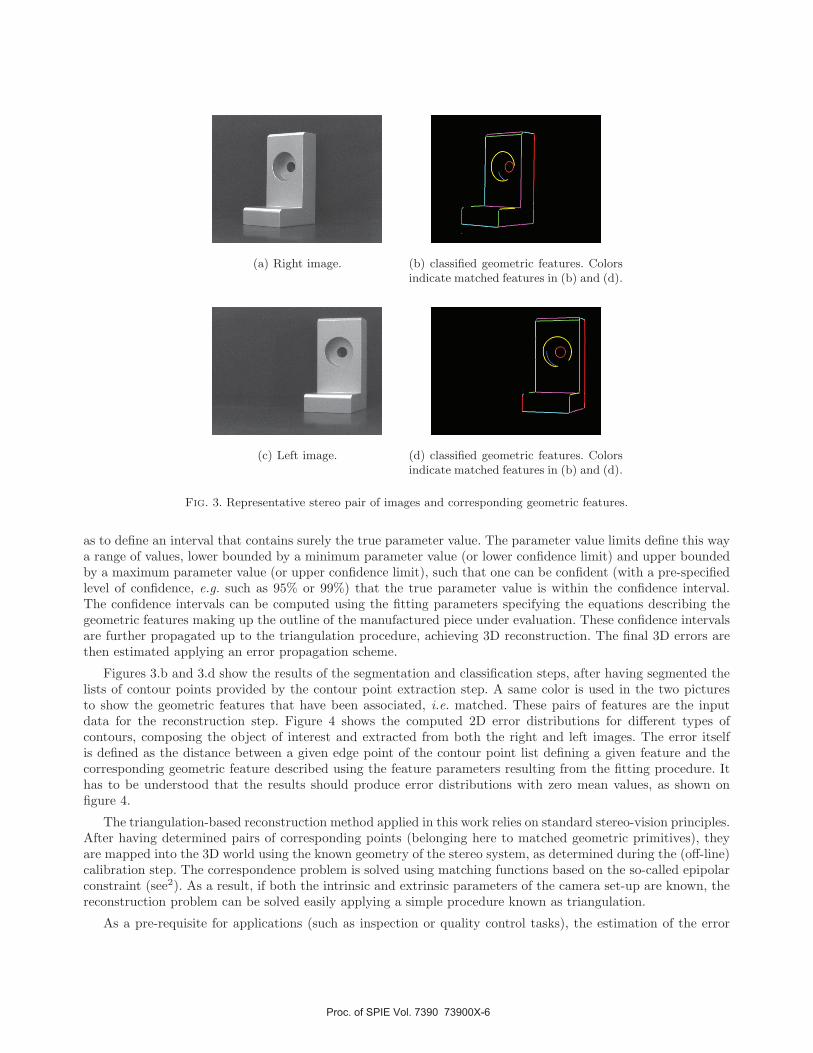
(a) Right image. (b) classified geometric features. Colorsindicate matched features in (b) and (d).
(c) Left image. (d) classified geometric features. Colorsindicate matched features in (b) and (d).
Fig. 3. Representative stereo pair of images and corresponding geometric features.
as to define an interval that contains surely the true parameter value. The parameter value limits define this waya range of values, lower bounded by a minimum parameter value (or lower confidence limit) and upper boundedby a maximum parameter value (or upper confidence limit), such that one can be confident (with a pre-specifiedlevel of confidence, e.g. such as 95% or 99%) that the true parameter value is within the confidence interval.The confidence intervals can be computed using the fitting parameters specifying the equations describing thegeometric features making up the outline of the manufactured piece under evaluation. These confidence intervalsare further propagated up to the triangulation procedure, achieving 3D reconstruction. The final 3D errors arethen estimated applying an error propagation scheme.
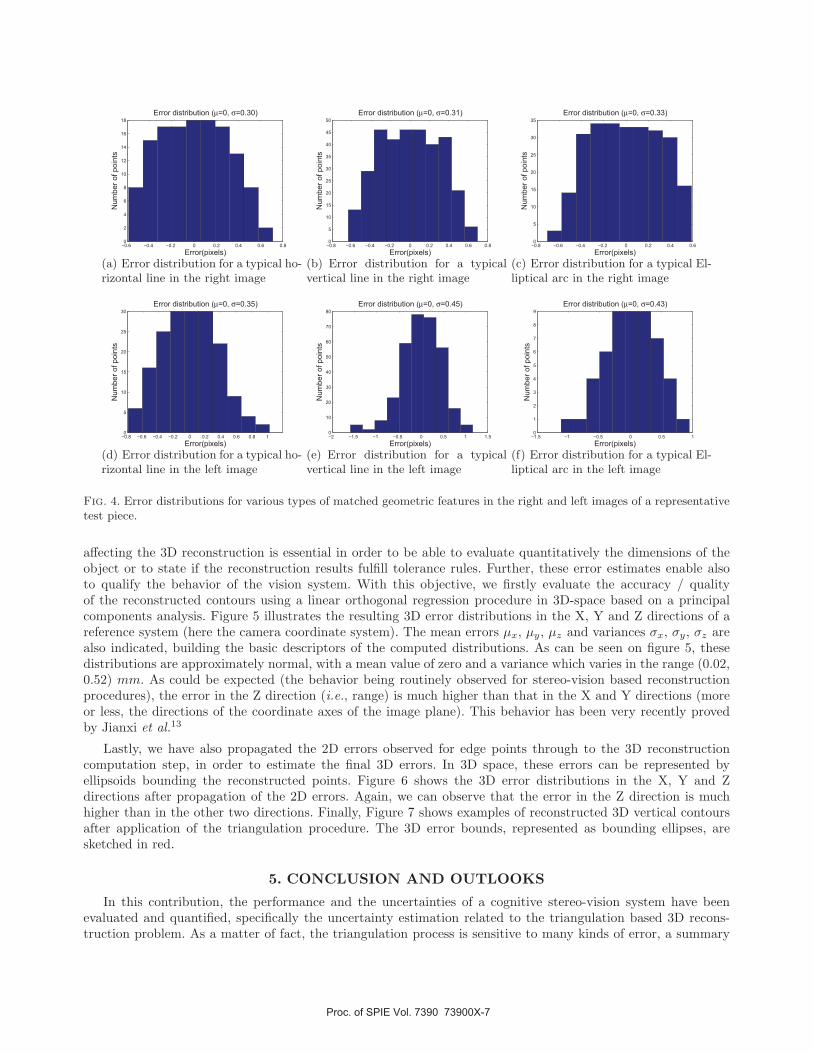
Figures 3.b and 3.d show the results of the segmentation and classification steps, after having segmented thelists of contour points provided by the contour point extraction step. A same color is used in the two picturesto show the geometric features that have been associated, i.e. matched. These pairs of features are the inputdata for the reconstruction step. Figure 4 shows the computed 2D error distributions for different types ofcontours, composing the object of interest and extracted from both the right and left images. The error itselfis defined as the distance between a given edge point of the contour point list defining a given feature and thecorresponding geometric feature described using the feature parameters resulting from the fitting procedure. Ithas to be understood that the results should produce error distributions with zero mean values, as shown onfigure 4.
The triangulation-based reconstruction method applied in this work relies on standard stereo-vision principles.After having determined pairs of corresponding points (belonging here to matched geometric primitives), theyare mapped into the 3D world using the known geometry of the stereo system, as determined during the (off-line)calibration step. The correspondence problem is solved using matching functions based on the so-called epipolarconstraint (see2). As a result, if both the intrinsic and extrinsic parameters of the camera set-up are known, thereconstruction problem can be solved easily applying a simple procedure known as triangulation.
As a pre-requisite for applications (such as inspection or quality control tasks), the estimation of the error
Proc. of SPIE Vol. 7390 73900X-6
−0.6 −0.4 −0.2 0 0.2 0.4 0.6 0.80
2
4
6
8
10
12
14
16
18
Error(pixels)
Num
ber
of poin
tsError distribution (µ=0, σ=0.30)
(a) Error distribution for a typical ho-rizontal line in the right image
−0.8 −0.6 −0.4 −0.2 0 0.2 0.4 0.6 0.80
5
10
15
20
25
30
35
40
45
50
Error(pixels)
Num
ber
of poin
ts
Error distribution (µ=0, σ=0.31)
(b) Error distribution for a typicalvertical line in the right image
−0.8 −0.6 −0.4 −0.2 0 0.2 0.4 0.60
5
10
15
20
25
30
35
Error(pixels)
Num
ber
of poin
ts
Error distribution (µ=0, σ=0.33)
(c) Error distribution for a typical El-liptical arc in the right image
−0.8 −0.6 −0.4 −0.2 0 0.2 0.4 0.6 0.8 10
5
10
15
20
25
30
Error(pixels)
Num
ber
of poin
ts
Error distribution (µ=0, σ=0.35)
(d) Error distribution for a typical ho-rizontal line in the left image
−2 −1.5 −1 −0.5 0 0.5 1 1.50
10
20
30
40
50
60
70
80
Error(pixels)
Num
ber
of poin
ts
Error distribution (µ=0, σ=0.45)
(e) Error distribution for a typicalvertical line in the left image
−1.5 −1 −0.5 0 0.5 10
1
2
3
4
5
6
7
8
9
Error(pixels)
Num
ber
of poin
ts
Error distribution (µ=0, σ=0.43)
(f) Error distribution for a typical El-liptical arc in the left image
Fig. 4. Error distributions for various types of matched geometric features in the right and left images of a representativetest piece.
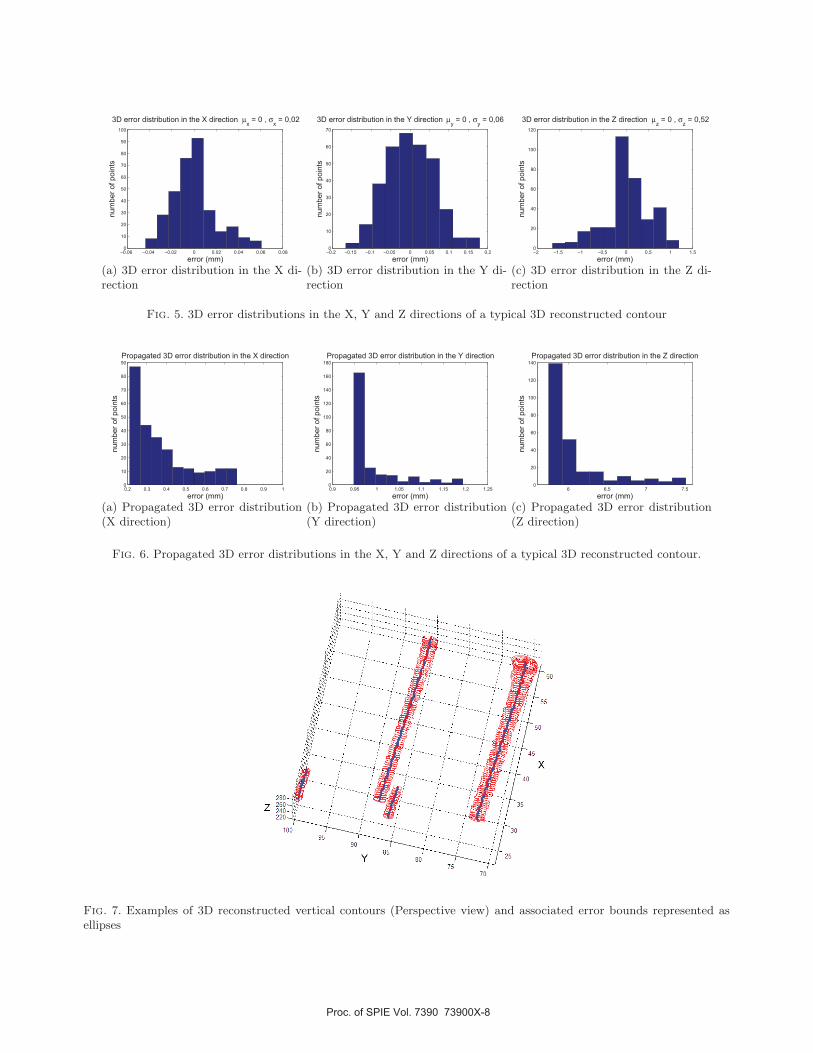
affecting the 3D reconstruction is essential in order to be able to evaluate quantitatively the dimensions of theobject or to state if the reconstruction results fulfill tolerance rules. Further, these error estimates enable alsoto qualify the behavior of the vision system. With this objective, we firstly evaluate the accuracy / qualityof the reconstructed contours using a linear orthogonal regression procedure in 3D-space based on a principalcomponents analysis. Figure 5 illustrates the resulting 3D error distributions in the X, Y and Z directions of areference system (here the camera coordinate system). The mean errors µx, µy, µz and variances σx, σy, σz arealso indicated, building the basic descriptors of the computed distributions. As can be seen on figure 5, thesedistributions are approximately normal, with a mean value of zero and a variance which varies in the range (0.02,0.52) mm. As could be expected (the behavior being routinely observed for stereo-vision based reconstructionprocedures), the error in the Z direction (i.e., range) is much higher than that in the X and Y directions (moreor less, the directions of the coordinate axes of the image plane). This behavior has been very recently provedby Jianxi et al.13
Lastly, we have also propagated the 2D errors observed for edge points through to the 3D reconstructioncomputation step, in order to estimate the final 3D errors. In 3D space, these errors can be represented byellipsoids bounding the reconstructed points. Figure 6 shows the 3D error distributions in the X, Y and Zdirections after propagation of the 2D errors. Again, we can observe that the error in the Z direction is muchhigher than in the other two directions. Finally, Figure 7 shows examples of reconstructed 3D vertical contoursafter application of the triangulation procedure. The 3D error bounds, represented as bounding ellipses, aresketched in red.
5. CONCLUSION AND OUTLOOKS
In this contribution, the performance and the uncertainties of a cognitive stereo-vision system have beenevaluated and quantified, specifically the uncertainty estimation related to the triangulation based 3D recons-truction problem. As a matter of fact, the triangulation process is sensitive to many kinds of error, a summary
Proc. of SPIE Vol. 7390 73900X-7
−0.06 −0.04 −0.02 0 0.02 0.04 0.06 0.080
10
20
30
40
50
60
70
80
90
100
3D error distribution in the X direction µx = 0 , σ
x = 0,02
error (mm)
num
ber
of poin
ts
(a) 3D error distribution in the X di-rection
−0.2 −0.15 −0.1 −0.05 0 0.05 0.1 0.15 0.20
10
20
30
40
50
60
70
3D error distribution in the Y direction µy = 0 , σ
y = 0,06
error (mm)
num
ber
of poin
ts
(b) 3D error distribution in the Y di-rection
−2 −1.5 −1 −0.5 0 0.5 1 1.50
20
40
60
80
100
120
3D error distribution in the Z direction µz = 0 , σ
z = 0,52
error (mm)
num
ber
of poin
ts
(c) 3D error distribution in the Z di-rection
Fig. 5. 3D error distributions in the X, Y and Z directions of a typical 3D reconstructed contour
0.2 0.3 0.4 0.5 0.6 0.7 0.8 0.9 10
10
20
30
40
50
60
70
80
90
Propagated 3D error distribution in the X direction
error (mm)
num
ber
of poin
ts
(a) Propagated 3D error distribution(X direction)
0.9 0.95 1 1.05 1.1 1.15 1.2 1.250
20
40
60
80
100
120
140
160
180
Propagated 3D error distribution in the Y direction
error (mm)
num
ber
of poin
ts
(b) Propagated 3D error distribution(Y direction)
6 6.5 7 7.50
20
40
60
80
100
120
140
Propagated 3D error distribution in the Z direction
error (mm)
num
ber
of poin
ts
(c) Propagated 3D error distribution(Z direction)
Fig. 6. Propagated 3D error distributions in the X, Y and Z directions of a typical 3D reconstructed contour.
Fig. 7. Examples of 3D reconstructed vertical contours (Perspective view) and associated error bounds represented asellipses
Proc. of SPIE Vol. 7390 73900X-8
being provided in this paper. As a result, three major types of error have been identified, namely errors due to theimage formation process (i. e., camera model used), errors related to image processing, and camera calibrationerrors. In this contribution, we mainly considered the source of errors due to the image segmentation procedure.
Assuming that the various errors, specifically those related to image processing, are independent and identi-cally distributed, the errors of each processing step are evaluated independently. In particular, we have estimatedthe segmentation errors, using fitting results of contour point lists, in order to determine so-called confidenceintervals. This latter are computed for each geometric feature that composes the object of interest. The confi-dence intervals have then been propagated through the whole chain of treatments of the images acquired withthe stereo-vision system, using an error propagation scheme. First experimental results concerning this methodof error estimation have been presented, specifically for the segmentation steps. The observed quantified errordistributions are significant and, accordingly, validate the approach. Finally, the error of the stereo-vision systemis estimated, taking, e. g., tolerance specifications into account.
With that objective, in order to evaluate the quality of the 3D reconstruction and to estimate its accuracy, wehave applied a 3D fitting technique to each reconstructed geometric feature, using a linear orthogonal regressionapproach in 3D space based on principal components analysis. As a result, as expected, we have observed thatthe error in the Z direction is much higher than in the X and Y directions.
Finally, propagation of these various errors up to the final 3D reconstruction step, in order to compute aglobal and unique error value, taking into account all error sources, has been carried out. In particular, we haveestimated the 3D reconstruction error, which can be represented as bounding ellipses positioned around thereconstructed 3D points. This helps to quantify on one hand the accuracy of the reconstruction and, on the otherhand, to decide whether the reconstruction result fulfills tolerance rules or not. Related work is performed inorder to reduce the 3D reconstruction errors as much as possible, by adjusting dynamically the image acquisitionconditions, specifically the illumination conditions.19 As an extension to the work presented, all sources of errors,such as matching and calibration errors, will be taken into account.
REFERENCES
[1] Khemmar, R., Lallement, A., and Hirsch, E., “Steps towards an intelligent self-reasoning system for theautomated vision-based evaluation of manufactured parts,” Workshop on Applications of Computer Vision,
in conjunction with ECCV, Graz, Austria , 136–143 (2006).[2] Far, B. A., Kohler, S., and Hirsch, E., “3D reconstruction of manufactured parts using bi-directional
stereovision-based contour matching and comparison of real and synthetic images,” 9th IAPR Conference
on Machine Vision Applications, Tsukuba Science City, Japan , 456–459 (2005).[3] Kohler, S., Far, B., and Hirsch, E., “Dynamic (re)planning of 3D automated reconstruction using situation
graph trees and illumination adjustment,” QCAV’2007 : 8th International Conference on Quality Control
by Artificial Vision, Le Creusot France. Proceedings SPIE 6356, 6356–1 635602 (2007).[4] Khemmar, R., Lallement, A., and Hirsch, E., “Design of an intelligent self-reasoning system for the automa-
ted vision-based evaluation of manufactured parts,,” in [VII. International Conference on Quality Control
by Artificial Vision, QCAV 2005, Japan ], (2005).[5] Blostein, D. S. and Huang, S. T., “Error analysis in stereo determination of 3D point positions,” IEEE
Transactions on Pattern Analysis and Machine Intelligence 9(6), 752–765 (1987).[6] Yang, Z. and Wang, Y. F., “Error analysis of 3D shape construction from structured lighting,” Pattern
Recognition 29, 189–206 (1996).[7] Ramakrishna, R. S. and Vaidvanathan, B., “Error analysis in stereo vision,” Computer Vision ACCV
98 1351, 296–304 (1997).[8] Kamberova, G. and Bajcsy, R., “Sensor errors and the uncertainties in stereo reconstruction,” Proc. IEEE
Workshop on Empirical Evaluation Techniques in Computer Vision in conjunction with CVPR 98 , 96–116(1998).
[9] Balasuramanian, R., Das, S., and Swaminathan, K., “Error analysis in reconstruction of a line in 3D fromtwo arbitrary perspective views,” International Journal of computer vision and mathematics 78, 191–212(2000).
Proc. of SPIE Vol. 7390 73900X-9
[10] Rivera-Rios, A. H., Shih, F., and Marefat, M., “Stereo camera pose determination with error reduction andtolerance satisfaction for dimensional measurements,” Proceedings of the 2005 IEEE Int. Conf. on Robotics
and Automation, Barcelona, Spain , 423–428 (2005).[11] Park, S. and Subbarao, M., “A multiview 3D modeling system based on stereo vision techniques,” Machine
Vision and Applications 16(3), 148–156 (2005).[12] Albouy, B., Koenig, E., Treuillet, S., and Lucas, Y., “Accurate 3D structure measurements from two unca-
librated views,” Advanced Concepts for Intelligent Vision Systems 4179, 1111–1121 (2006).[13] Jianxi, Y., Jianting, L., and Zhendong, S., “Calibrating method and systematic error analysis on binocular
3D position system,” Proceedings of the 6th International Conference on Automation and Logistics, China
, 2310–2314 (2008).[14] Daul, C., Construction et utilisation de liste de primitives en vue d’une analyse dimensionnelle de piece a
geometrie simple, PhD thesis, Universite Louis Pasteur de Strasbourg (1989).[15] Gander, W., Golub, G., and Strebel, R., “Least-squares fitting of circles and ellipses,” Bit Numerical Ma-
thematics 34, 558–578 (1994).[16] Yi, D., Haralick, R., and Shapiro, L., “Error propagation in machine vision,” Machine Vision and Applica-
tions 7, 93–114 (1994).[17] Halir, R. and Flusser, J., “Numerically stable direct least squares fitting of ellipses,” Proceedings of the
6th International Conference in Central Europe on Computer Graphics and Visualization. WSCG ’98. CZ,
Plzen , 125–132 (1998).[18] Ahn, S., Rauh, W., and Recknagel, M., “Ellipse fitting and parameter assessment of circular object targets
for robot vision,” International Conference on Intelligent Robots and Systems 1, 525–530 (1999).[19] Belhaoua, A., Kohler, S., and Hirsch, E., “Determination of optimal lighting position in view of 3D recons-
truction error minimization,” 10th European Congress of Stereology and Image Analysis, Milan, Italy. , InPress (June 22-26 2009).
Proc. of SPIE Vol. 7390 73900X-10


![Chapter 7 Correction of Errors [II]: Errors Affecting …proxy.flss.edu.hk/~flssmcwong/S5 Notes/Chapter 7...1 Chapter 7 Correction of Errors [II]: Errors Affecting Trial Balance Agreement](https://img.pdfslide.tips/doc/110x75/5e919753b752cc557f0672e9/chapter-7-correction-of-errors-ii-errors-affecting-proxyflsseduhkflssmcwongs5.jpg)