Embed Size (px)
Citation preview
Evaluating the Air Quality, Climate & Economic Impacts of Biogas Management Technologies
California Bioresources Alliance
11th Annual Symposium
November 1 – 2, 2016
Rob Williams (UC Davis) & Charlotte Ely (EPA)
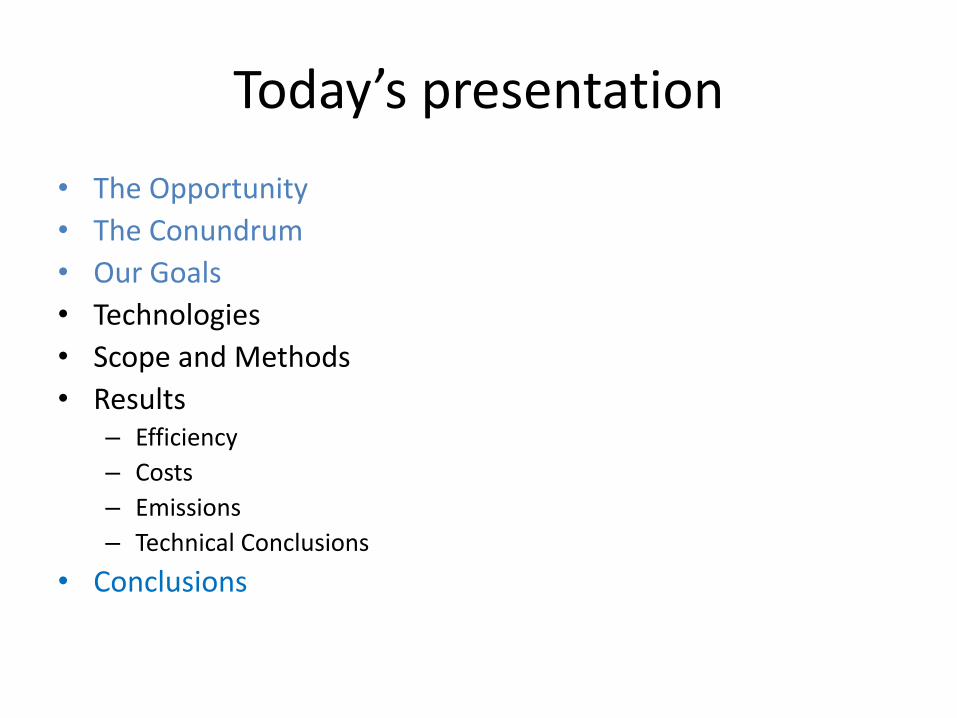
Today’s presentation
• The Opportunity
• The Conundrum
• Our Goals
• Technologies
• Scope and Methods
• Results– Efficiency
– Costs
– Emissions
– Technical Conclusions
• Conclusions
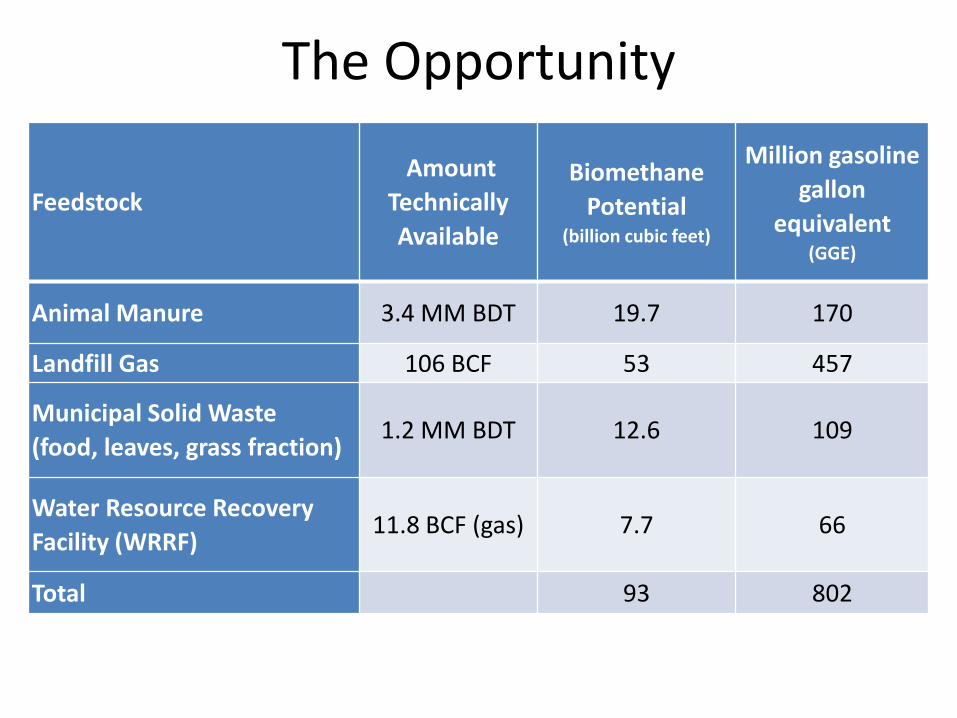
The Opportunity
Feedstock
Amount
Technically
Available
Biomethane
Potential (billion cubic feet)
Million gasoline
gallon
equivalent (GGE)
Animal Manure 3.4 MM BDT 19.7 170
Landfill Gas 106 BCF 53 457
Municipal Solid Waste
(food, leaves, grass fraction)1.2 MM BDT 12.6 109
Water Resource Recovery
Facility (WRRF)11.8 BCF (gas) 7.7 66
Total 93 802

The Opportunity
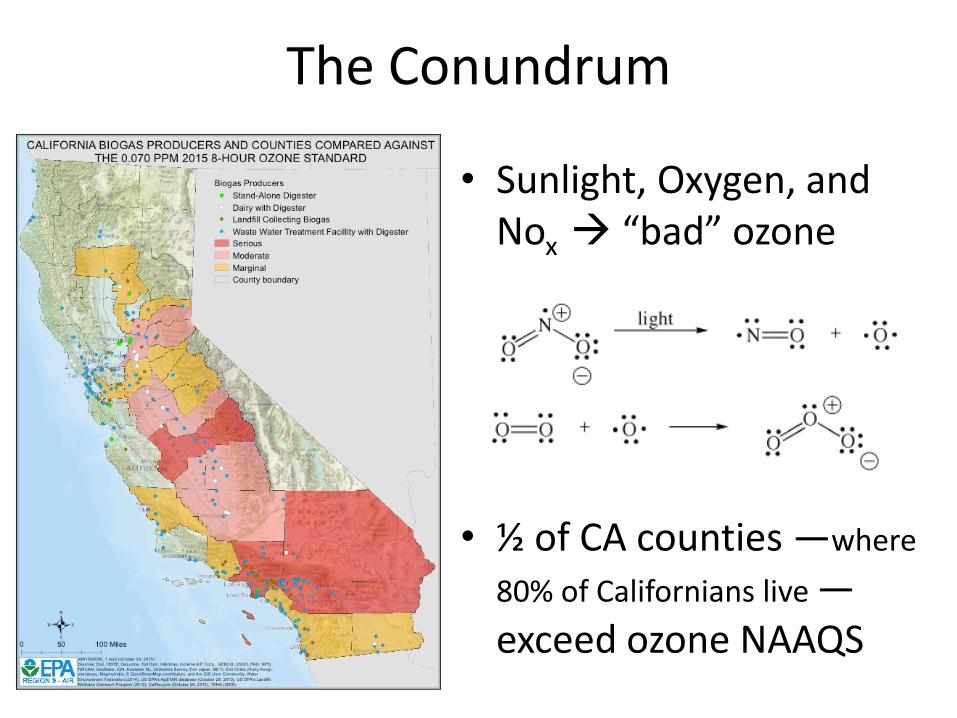
The Conundrum
• Sunlight, Oxygen, and Nox “bad” ozone
• ½ of CA counties —where
80% of Californians live —exceed ozone NAAQS
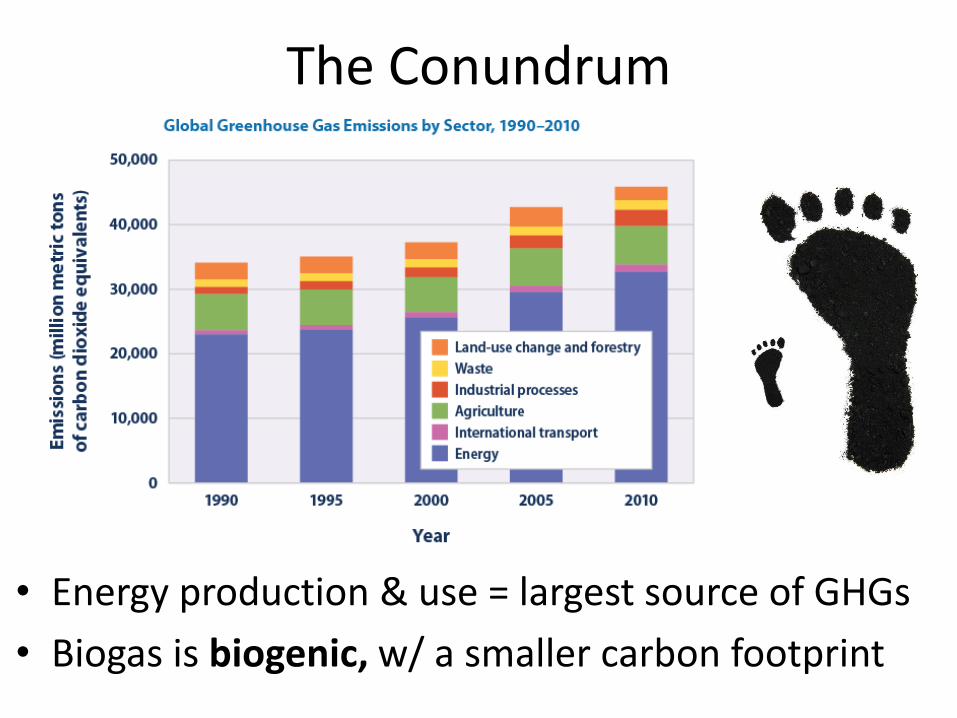
The Conundrum
• Energy production & use = largest source of GHGs
• Biogas is biogenic, w/ a smaller carbon footprint
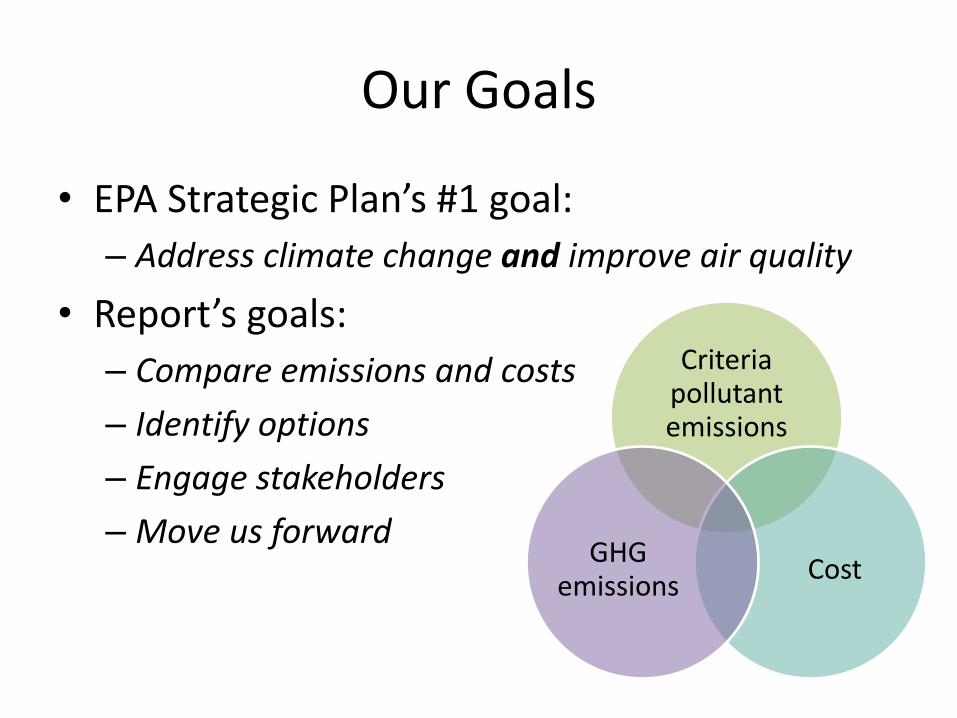
Our Goals
• EPA Strategic Plan’s #1 goal:
– Address climate change and improve air quality
• Report’s goals:
– Compare emissions and costs
– Identify options
– Engage stakeholders
– Move us forward
Criteria pollutant emissions
CostGHG
emissions
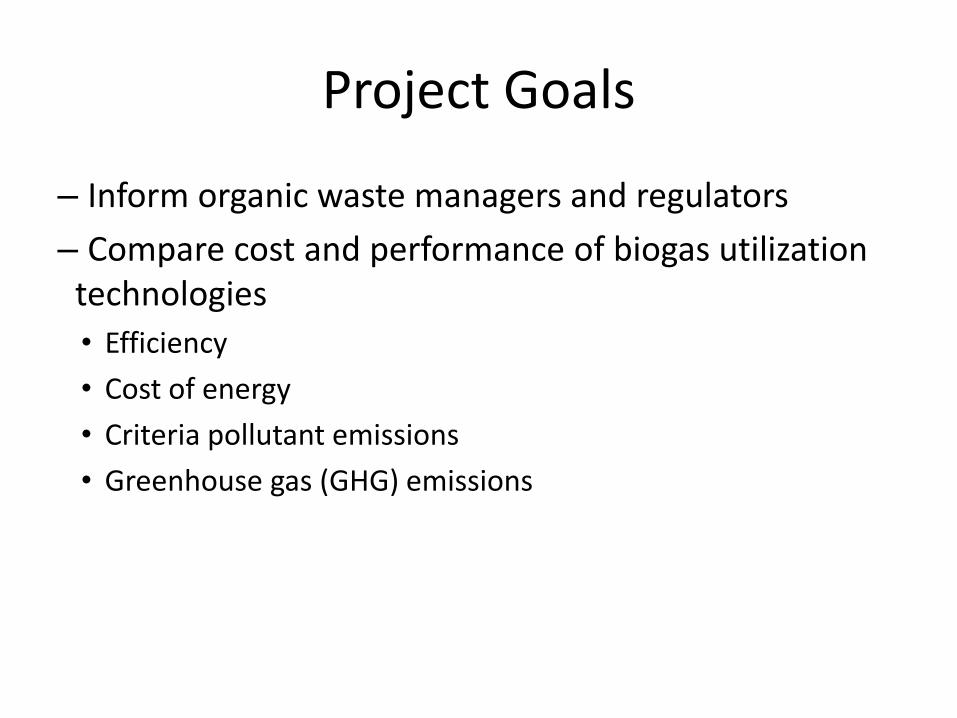
Project Goals
– Inform organic waste managers and regulators
– Compare cost and performance of biogas utilization technologies
• Efficiency
• Cost of energy
• Criteria pollutant emissions
• Greenhouse gas (GHG) emissions
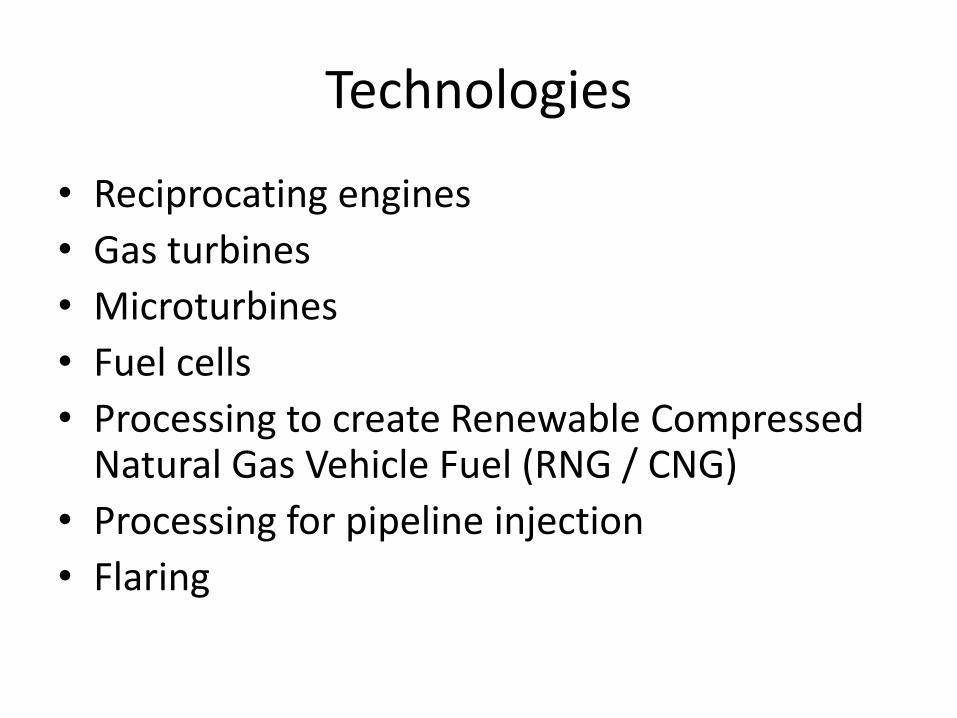
Technologies
• Reciprocating engines
• Gas turbines
• Microturbines
• Fuel cells
• Processing to create Renewable Compressed Natural Gas Vehicle Fuel (RNG / CNG)
• Processing for pipeline injection
• Flaring
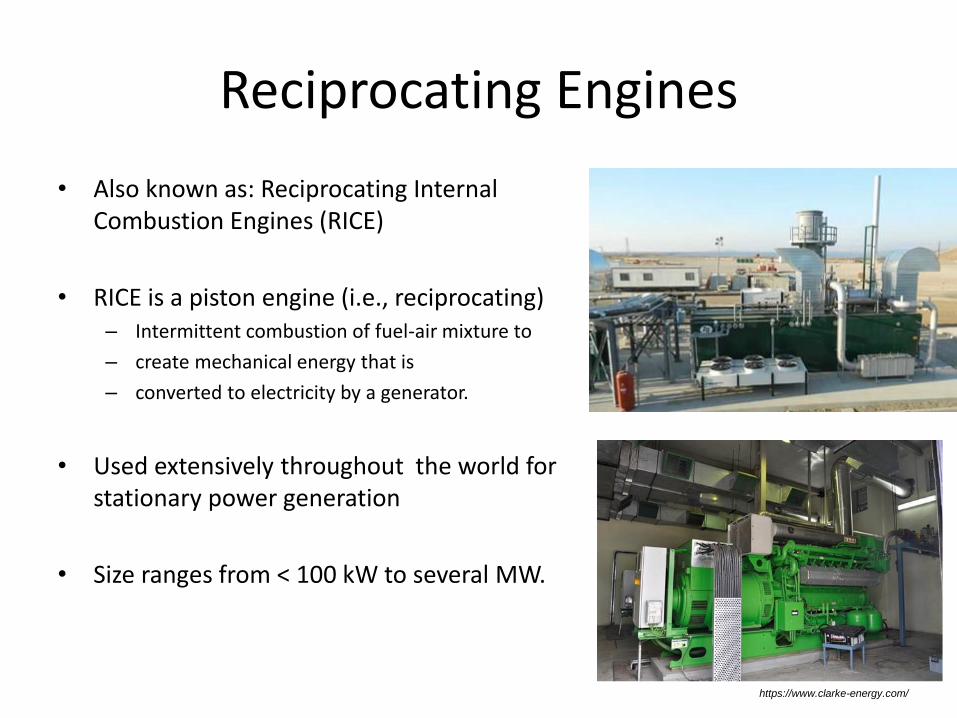
Reciprocating Engines
• Also known as: Reciprocating Internal Combustion Engines (RICE)
• RICE is a piston engine (i.e., reciprocating) – Intermittent combustion of fuel-air mixture to
– create mechanical energy that is
– converted to electricity by a generator.
• Used extensively throughout the world for stationary power generation
• Size ranges from < 100 kW to several MW.
https://www.clarke-energy.com/
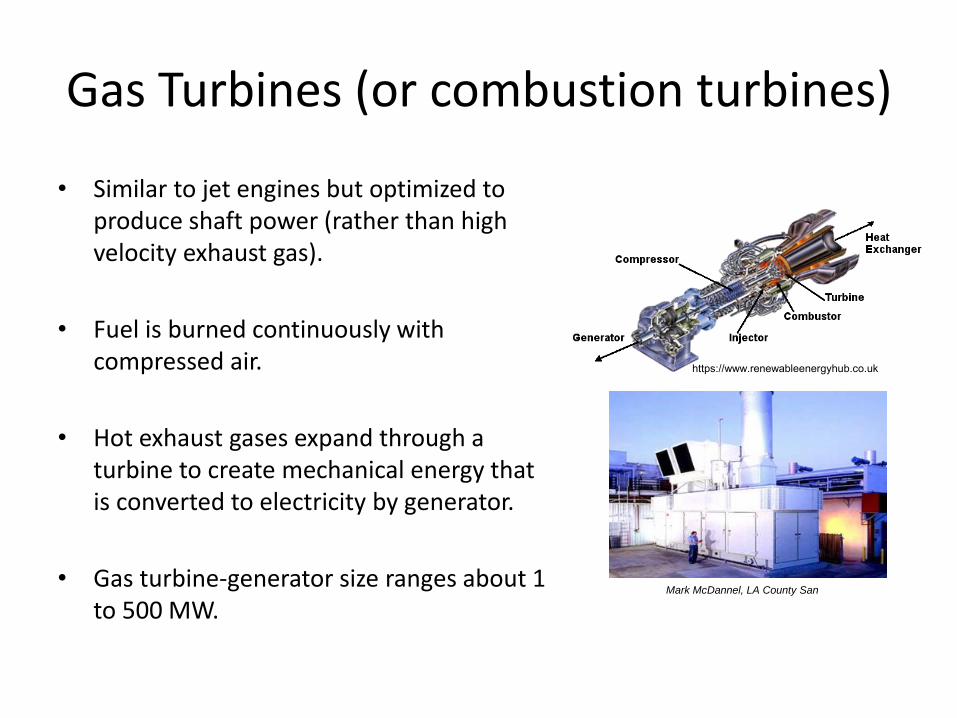
Gas Turbines (or combustion turbines)
• Similar to jet engines but optimized to produce shaft power (rather than high velocity exhaust gas).
• Fuel is burned continuously with compressed air.
• Hot exhaust gases expand through a turbine to create mechanical energy that is converted to electricity by generator.
• Gas turbine-generator size ranges about 1 to 500 MW.
https://www.renewableenergyhub.co.uk
Mark McDannel, LA County San
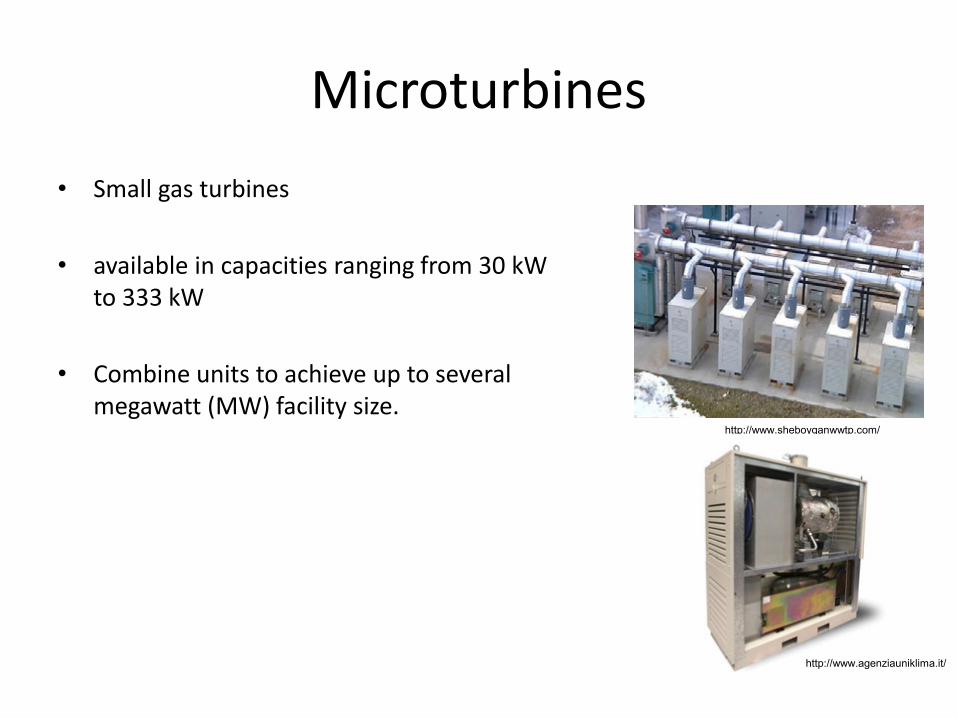
Microturbines
• Small gas turbines
• available in capacities ranging from 30 kW to 333 kW
• Combine units to achieve up to several megawatt (MW) facility size.
http://www.sheboyganwwtp.com/
http://www.agenziauniklima.it/

Fuel Cells
• Use hydrogen and oxygen to produce direct current power through an electrochemical process, rather than combustion-to-mechanical energy process.
• Biogas methane (CH4) is reformed to make hydrogen available for the fuel cell.
• Systems available from <100 kW to several MW.
Jeff Wall, Moreno Valley Regional WRF
http://www.fuelcellenergy.com/
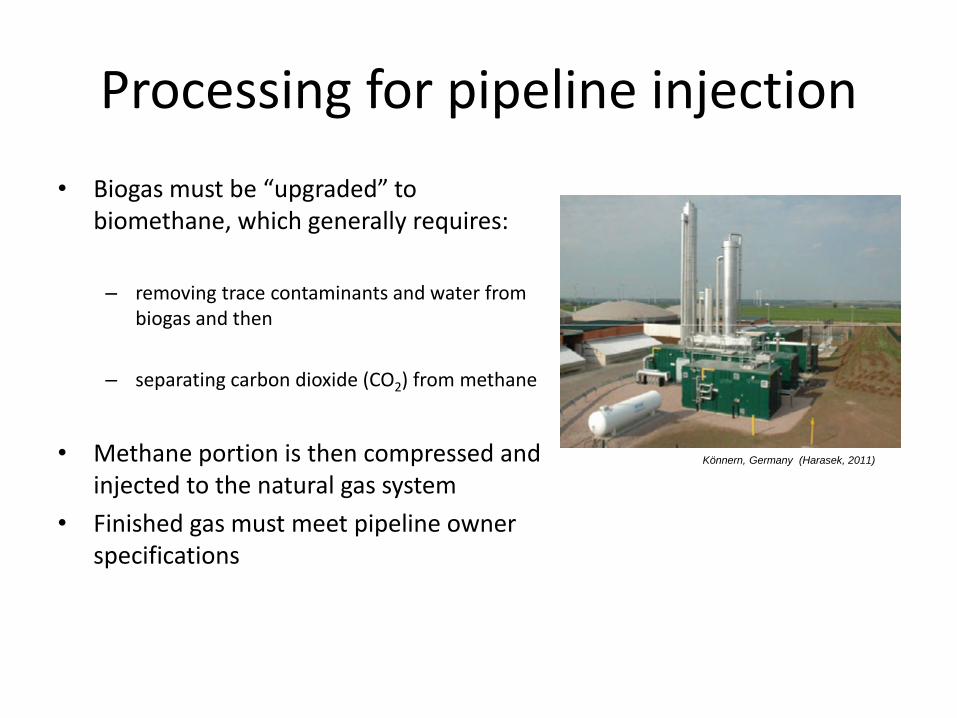
Processing for pipeline injection
• Biogas must be “upgraded” to biomethane, which generally requires:
– removing trace contaminants and water from biogas and then
– separating carbon dioxide (CO2) from methane
• Methane portion is then compressed and injected to the natural gas system
• Finished gas must meet pipeline owner specifications
Könnern, Germany (Harasek, 2011)
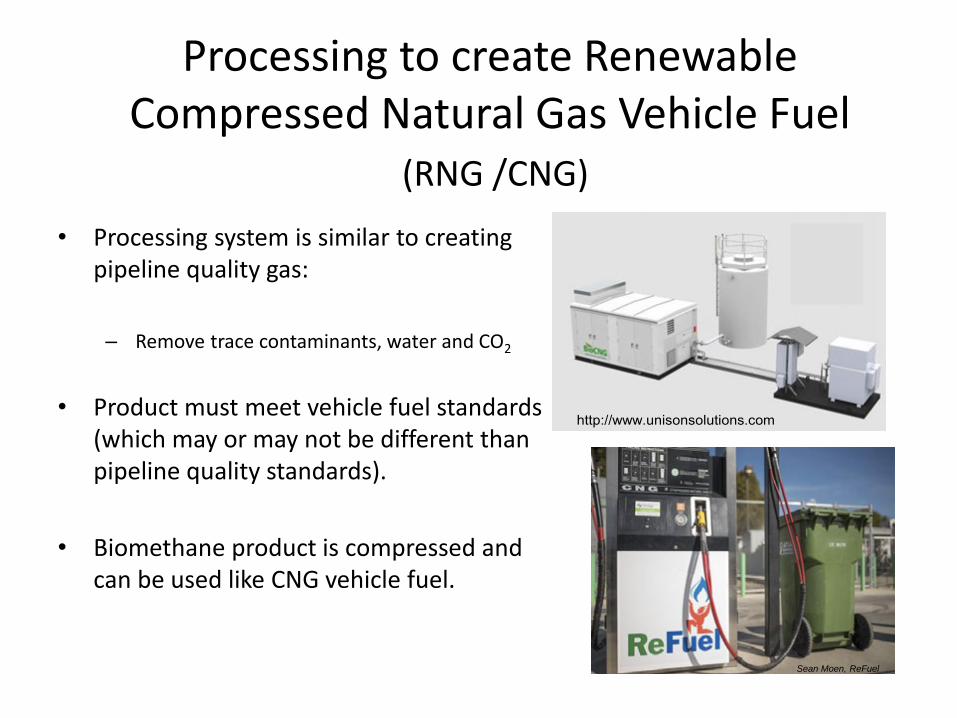
Processing to create Renewable Compressed Natural Gas Vehicle Fuel
(RNG /CNG)
• Processing system is similar to creating pipeline quality gas:
– Remove trace contaminants, water and CO2
• Product must meet vehicle fuel standards (which may or may not be different than pipeline quality standards).
• Biomethane product is compressed and can be used like CNG vehicle fuel.
Sean Moen, ReFuel
http://www.unisonsolutions.com
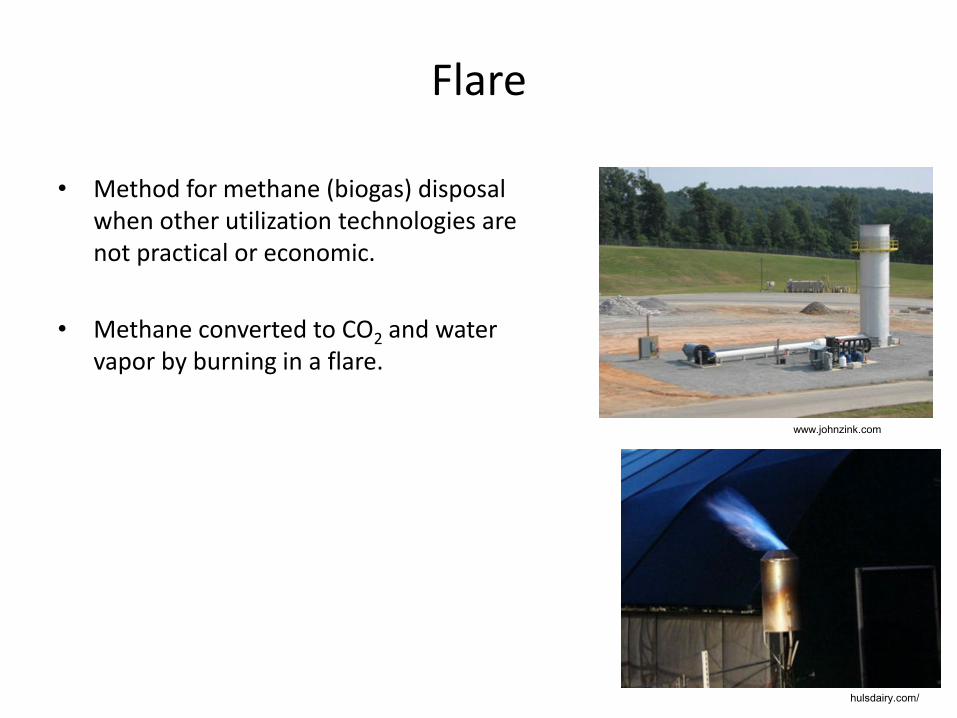
Flare
• Method for methane (biogas) disposal when other utilization technologies are not practical or economic.
• Methane converted to CO2 and water vapor by burning in a flare.
www.johnzink.com
hulsdairy.com/
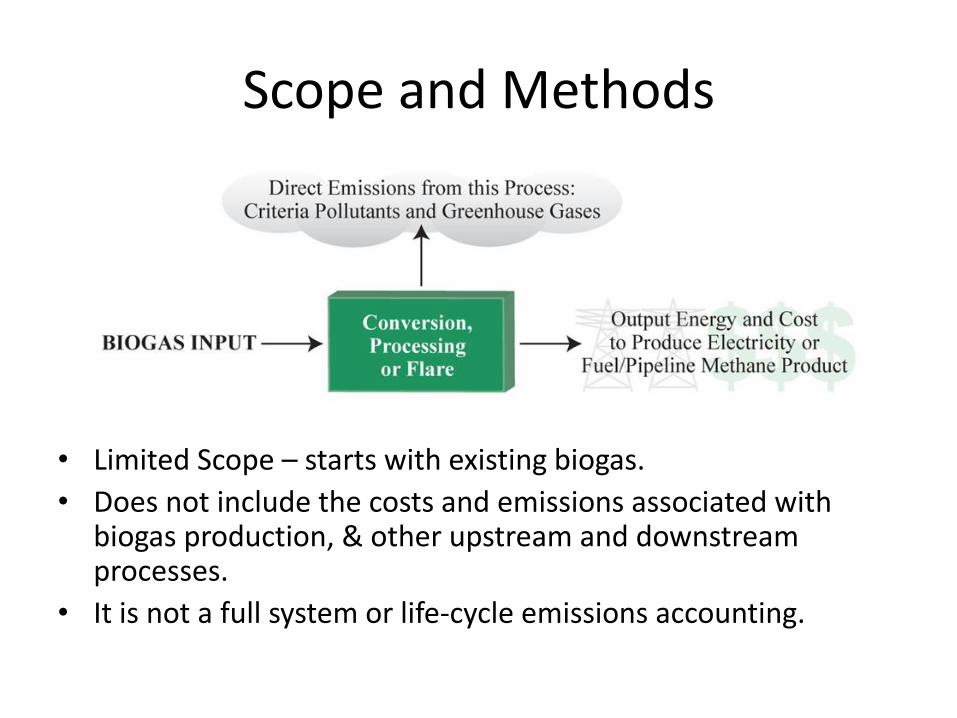
Scope and Methods
• Evaluated on-site use (conversion or upgrading) of already-produced biogas
Scope and Methods
• Evaluated on-site use (conversion or upgrading) of already-produced biogas
• Conversion efficiency: – % energy efficiency for electricity production systems, higher heating
value basis
– % yield for renewable CNG and pipeline injection processes
• Costs– Levelized Cost of Energy (LCOE) [output basis]
– Cost to process biogas [input basis]
– Includes biogas pre-treatment and emissions control costs
• On-site criteria air pollutant and GHG emissions
Scope and Methods
• Limited Scope – starts with existing biogas.
• Does not include the costs and emissions associated with biogas production, & other upstream and downstream processes.
• It is not a full system or life-cycle emissions accounting.
Scope and Methods
Source information included
• peer-reviewed and ‘gray’ literature,
• operating permits,
• source test reports and
• expert and developer interviews.
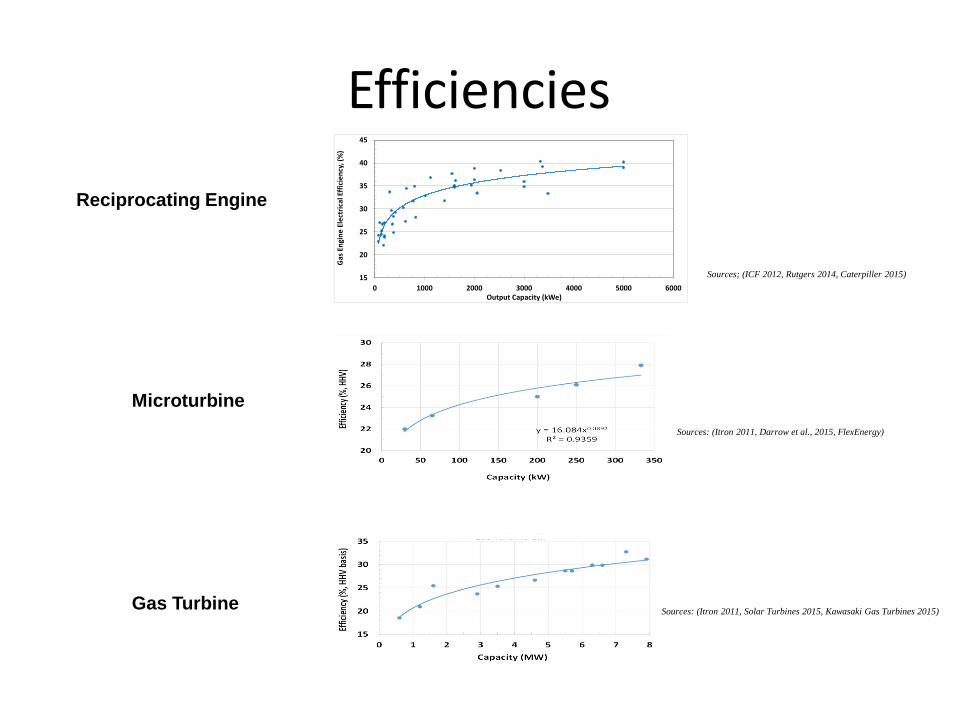
Efficiencies
Sources: (Itron 2011, Solar Turbines 2015, Kawasaki Gas Turbines 2015)Gas Turbine
Reciprocating Engine
Microturbine
Sources: (Itron 2011, Darrow et al., 2015, FlexEnergy)
15
20
25
30
35
40
45
0 1000 2000 3000 4000 5000 6000
Gas
En
gin
e E
lect
rica
l Eff
icie
ncy
, (%
)
Output Capacity (kWe)
Sources; (ICF 2012, Rutgers 2014, Caterpiller 2015)
0
10
20
30
40
50
0 2,000 4,000 6,000 8,000
Effi
cien
cy (
%, H
HV
bas
is)
Capacity (kW)
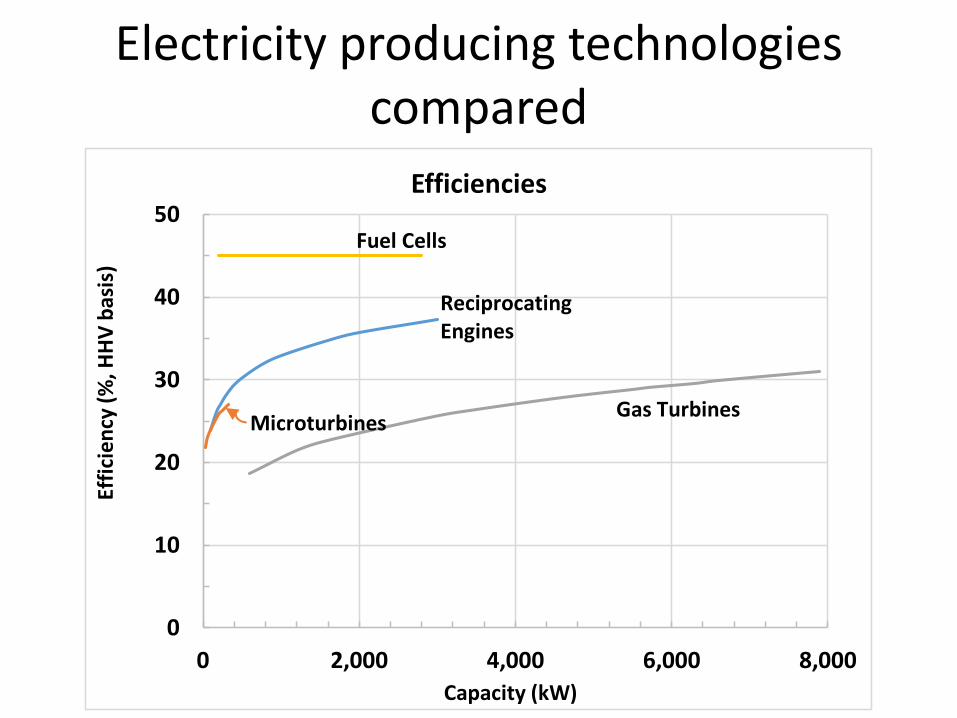
Efficiencies
Fuel Cells
ReciprocatingEngines
MicroturbinesGas Turbines
Electricity producing technologies compared
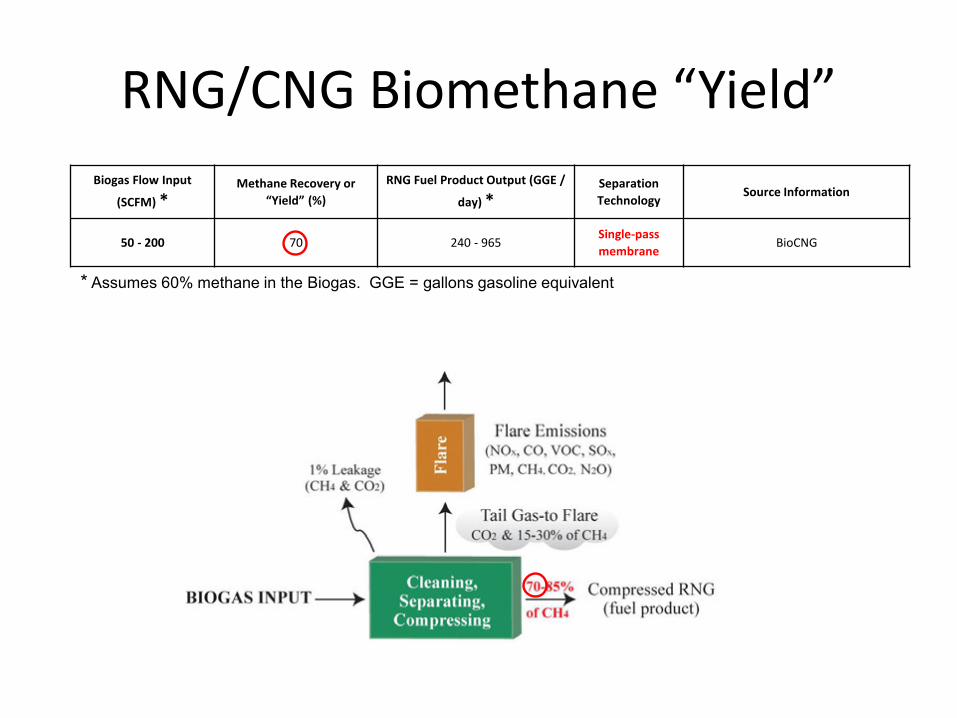
RNG/CNG Biomethane “Yield”
Biogas Flow Input
(SCFM) *Methane Recovery or
“Yield” (%)
RNG Fuel Product Output (GGE /
day) *Separation
TechnologySource Information
50 - 200 70 240 - 965Single-pass
membraneBioCNG
* Assumes 60% methane in the Biogas. GGE = gallons gasoline equivalent
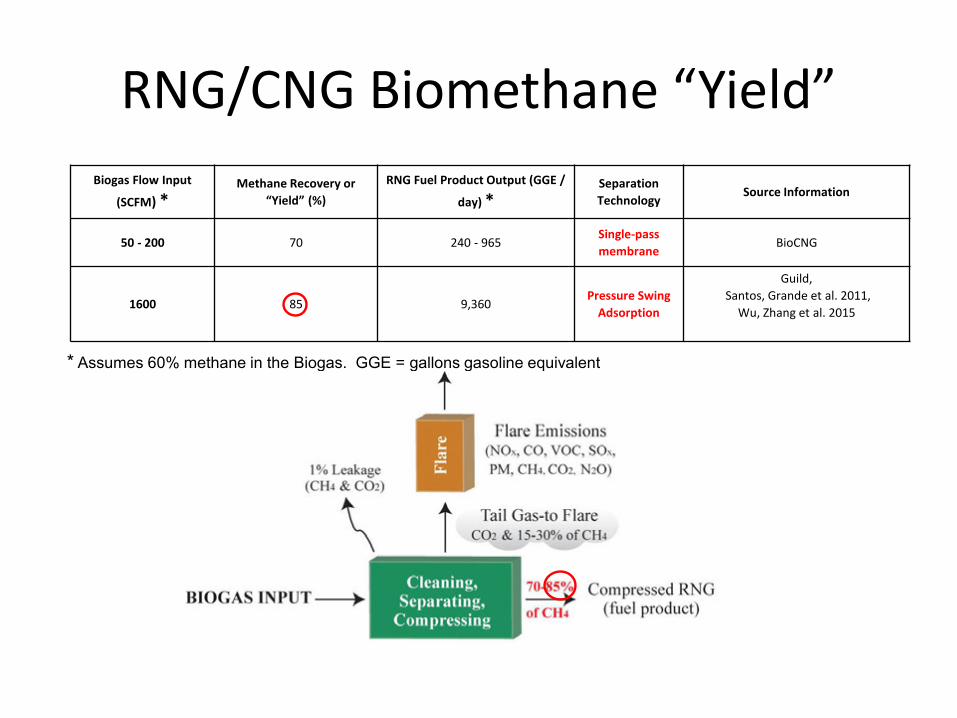
RNG/CNG Biomethane “Yield”
Biogas Flow Input
(SCFM) *Methane Recovery or
“Yield” (%)
RNG Fuel Product Output (GGE /
day) *Separation
TechnologySource Information
50 - 200 70 240 - 965Single-pass
membraneBioCNG
1600 85 9,360Pressure Swing
Adsorption
Guild,
Santos, Grande et al. 2011,
Wu, Zhang et al. 2015
* Assumes 60% methane in the Biogas. GGE = gallons gasoline equivalent
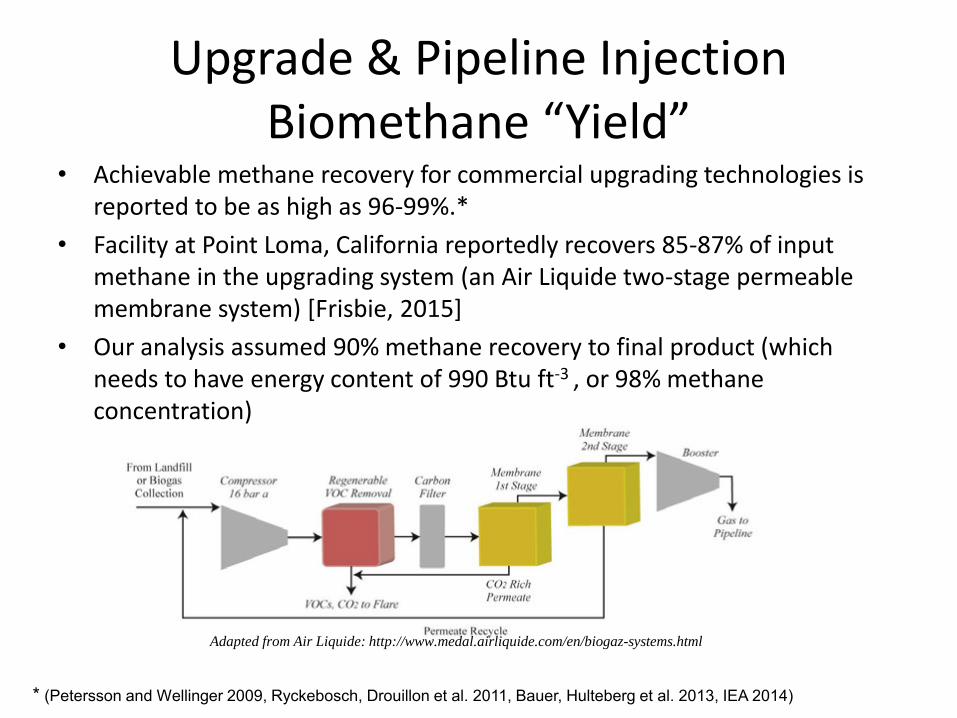
Upgrade & Pipeline Injection Biomethane “Yield”
• Achievable methane recovery for commercial upgrading technologies is reported to be as high as 96-99%.*
• Facility at Point Loma, California reportedly recovers 85-87% of input methane in the upgrading system (an Air Liquide two-stage permeable membrane system) [Frisbie, 2015]
• Our analysis assumed 90% methane recovery to final product (which needs to have energy content of 990 Btu ft-3 , or 98% methane concentration)
Adapted from Air Liquide: http://www.medal.airliquide.com/en/biogaz-systems.html
* (Petersson and Wellinger 2009, Ryckebosch, Drouillon et al. 2011, Bauer, Hulteberg et al. 2013, IEA 2014)
Cost of Energy
• Capital and operating costs taken from literature and discussions with developers;
• Reflects California costs or “cost adders” above U.S. average
• Includes costs for– raw biogas cleanup (H2S and siloxane reduction)
– air pollution control (APC) equipment for reciprocating engines and gas turbines; APC is presumed not needed for microturbines, fuel cells, fuel and pipeline pathways, and flares
• RNG / CNG pathway cost includes on-site fueling equipment
• The upgrade to pipeline injection pathway includes interconnection or injection costs.
Levelized Cost of Energy (LCOE)
• The LCOE represents the required revenue per unit of energy for the project to break even.
• In this analysis, LCOE = Total Annual Cost ÷ Annual Energy Produced
– $/kWh (electricity systems),
– $/gallon-gasoline equivalent ($/GGE) for RNG/CNG systems,
– $/MMBtu for pipeline injection systems & RNG/CNG
• Capital costs were amortized over 20 years at 6% annual interest
• Recall scope starts with existing biogas so biogas has ZERO cost in our financial model (the biogas production is already paid for)
• If the biogas did not yet exist, e.g., a digester needed to be built, then the LCOE would be higher
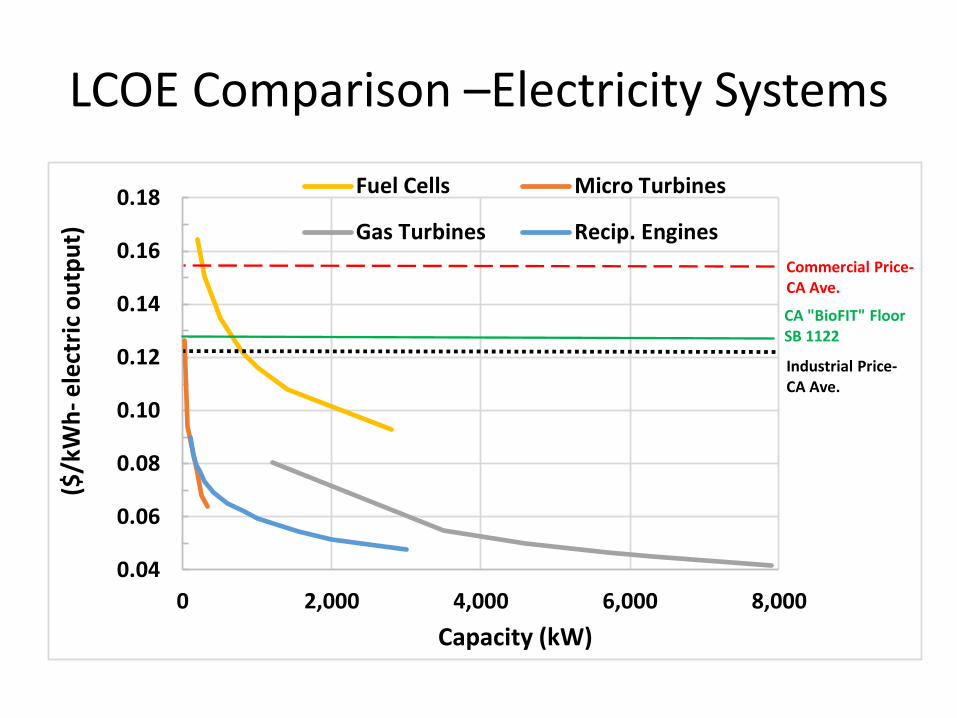
LCOE Comparison –Electricity Systems
0.04
0.06
0.08
0.10
0.12
0.14
0.16
0.18
0 2,000 4,000 6,000 8,000
($/k
Wh
-el
ectr
ic o
utp
ut)
Capacity (kW)
Fuel Cells Micro Turbines
Gas Turbines Recip. Engines
Industrial Price-CA Ave.
Commercial Price-CA Ave.
CA "BioFIT" Floor SB 1122
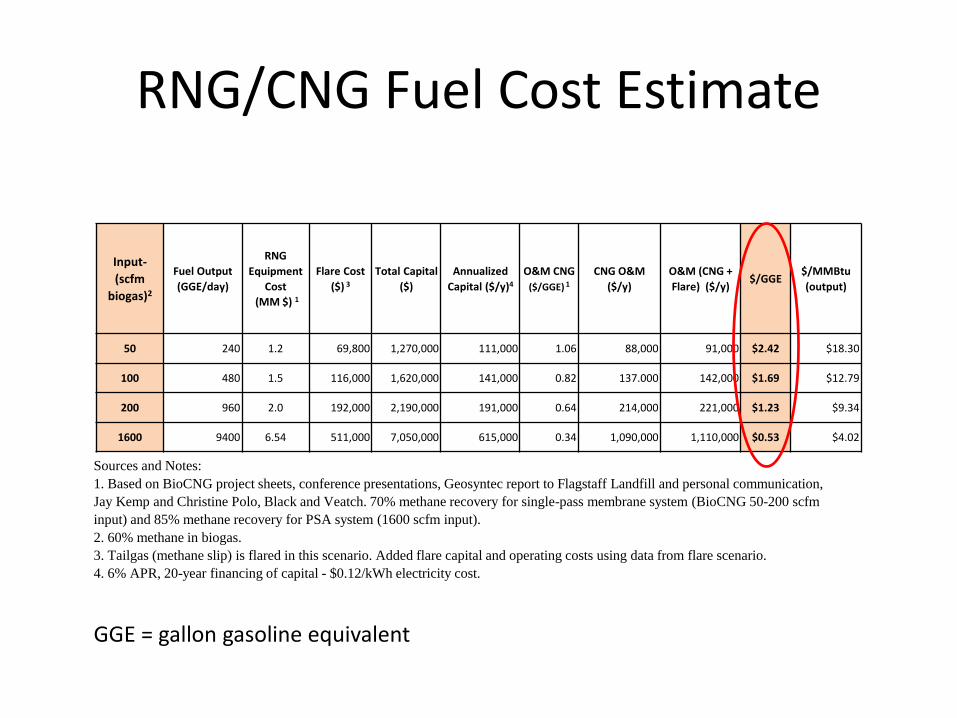
RNG/CNG Fuel Cost Estimate
Input-
(scfm
biogas)2
Fuel Output
(GGE/day)
RNG
Equipment
Cost
(MM $) 1
Flare Cost
($) 3
Total Capital
($)
Annualized
Capital ($/y)4
O&M CNG
($/GGE) 1
CNG O&M
($/y)
O&M (CNG +
Flare) ($/y)$/GGE
$/MMBtu
(output)
50 240 1.2 69,800 1,270,000 111,000 1.06 88,000 91,000 $2.42 $18.30
100 480 1.5 116,000 1,620,000 141,000 0.82 137.000 142,000 $1.69 $12.79
200 960 2.0 192,000 2,190,000 191,000 0.64 214,000 221,000 $1.23 $9.34
1600 9400 6.54 511,000 7,050,000 615,000 0.34 1,090,000 1,110,000 $0.53 $4.02
Sources and Notes:
1. Based on BioCNG project sheets, conference presentations, Geosyntec report to Flagstaff Landfill and personal communication,
Jay Kemp and Christine Polo, Black and Veatch. 70% methane recovery for single-pass membrane system (BioCNG 50-200 scfm
input) and 85% methane recovery for PSA system (1600 scfm input).
2. 60% methane in biogas.
3. Tailgas (methane slip) is flared in this scenario. Added flare capital and operating costs using data from flare scenario.
4. 6% APR, 20-year financing of capital - $0.12/kWh electricity cost.
GGE = gallon gasoline equivalent
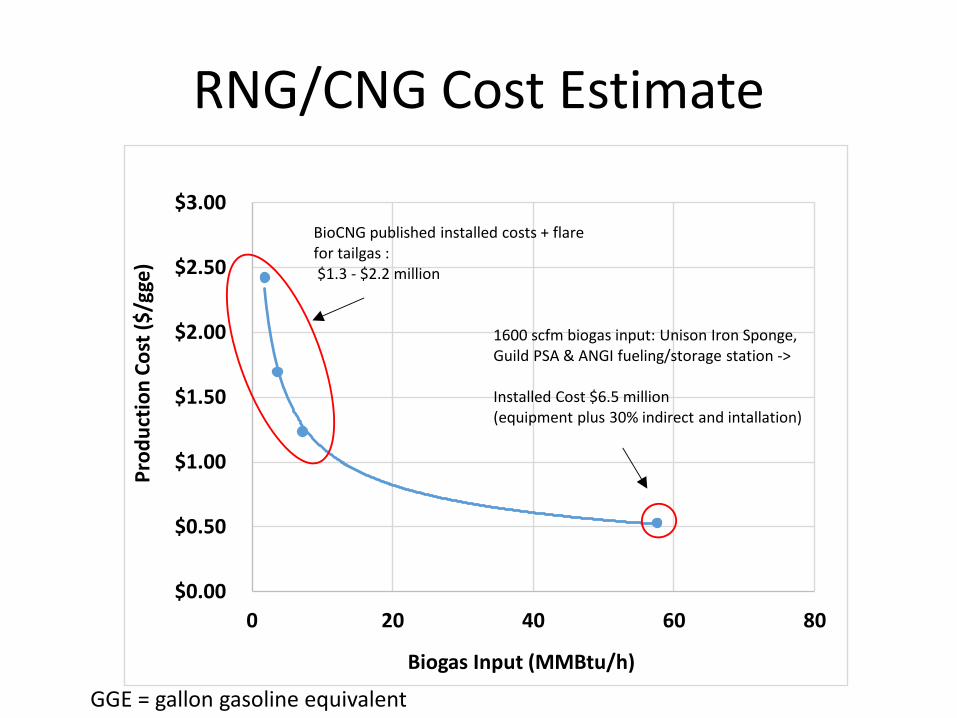
RNG/CNG Cost Estimate
GGE = gallon gasoline equivalent
$0.00
$0.50
$1.00
$1.50
$2.00
$2.50
$3.00
0 20 40 60 80
Pro
du
ctio
n C
ost
($
/gge
)
Biogas Input (MMBtu/h)
BioCNG published installed costs + flarefor tailgas :$1.3 - $2.2 million
1600 scfm biogas input: Unison Iron Sponge, Guild PSA & ANGI fueling/storage station ->
Installed Cost $6.5 million (equipment plus 30% indirect and intallation)
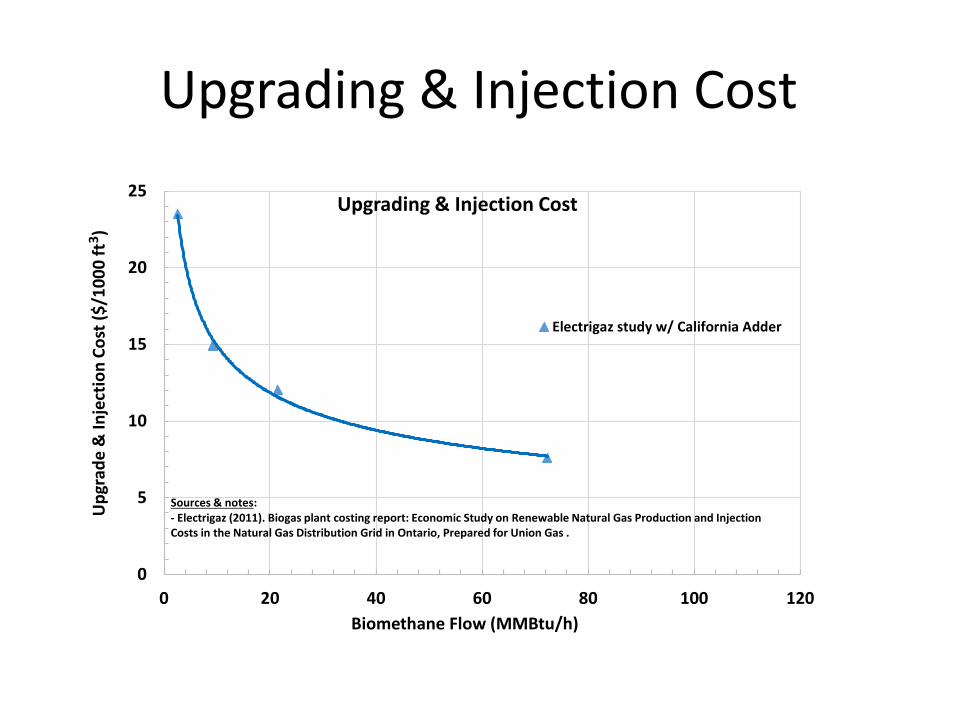
Upgrading & Injection Cost
0
5
10
15
20
25
0 20 40 60 80 100 120
Up
grad
e &
Inje
ctio
n C
ost
($
/10
00
ft3
)
Biomethane Flow (MMBtu/h)
Upgrading & Injection Cost
Electrigaz study w/ California Adder
Sources & notes:- Electrigaz (2011). Biogas plant costing report: Economic Study on Renewable Natural Gas Production and Injection Costs in the Natural Gas Distribution Grid in Ontario, Prepared for Union Gas .
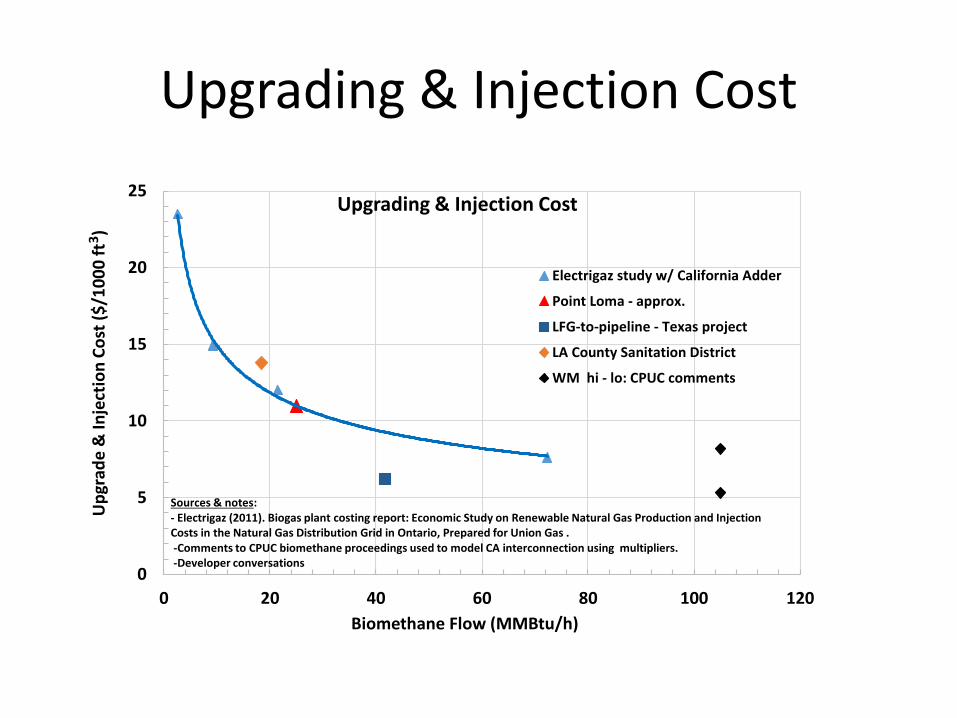
Upgrading & Injection Cost
0
5
10
15
20
25
0 20 40 60 80 100 120
Up
grad
e &
Inje
ctio
n C
ost
($
/10
00
ft3
)
Biomethane Flow (MMBtu/h)
Upgrading & Injection Cost
Electrigaz study w/ California Adder
Point Loma - approx.
LFG-to-pipeline - Texas project
LA County Sanitation District
WM hi - lo: CPUC comments
Sources & notes:- Electrigaz (2011). Biogas plant costing report: Economic Study on Renewable Natural Gas Production and Injection Costs in the Natural Gas Distribution Grid in Ontario, Prepared for Union Gas . -Comments to CPUC biomethane proceedings used to model CA interconnection using multipliers.-Developer conversations
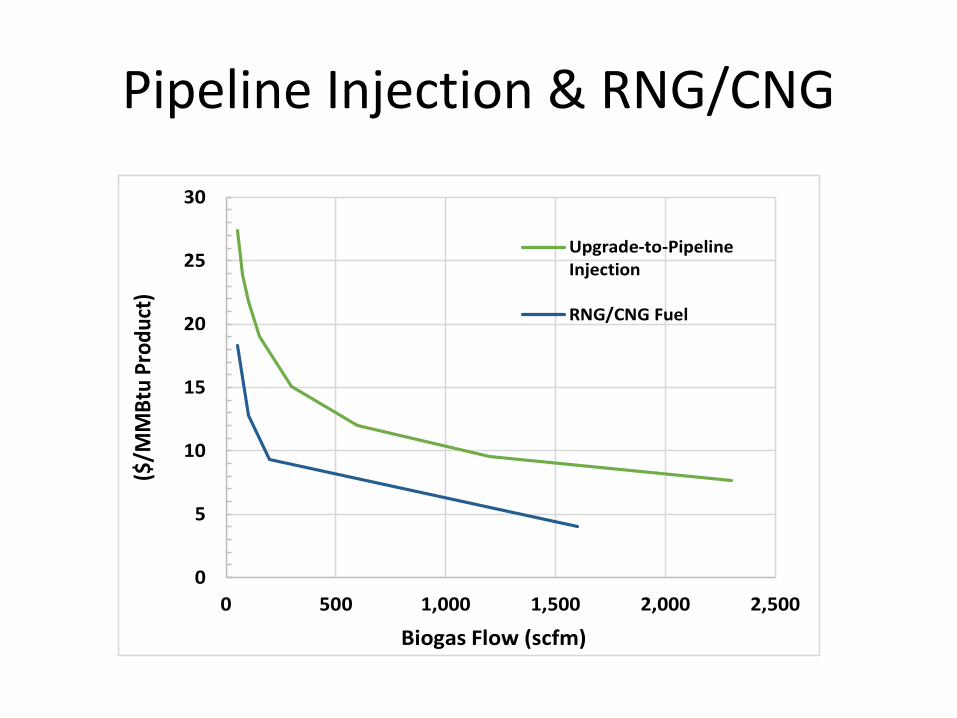
Pipeline Injection & RNG/CNG
0
5
10
15
20
25
30
0 500 1,000 1,500 2,000 2,500
($/M
MB
tu P
rod
uct
)
Biogas Flow (scfm)
Upgrade-to-PipelineInjection
RNG/CNG Fuel
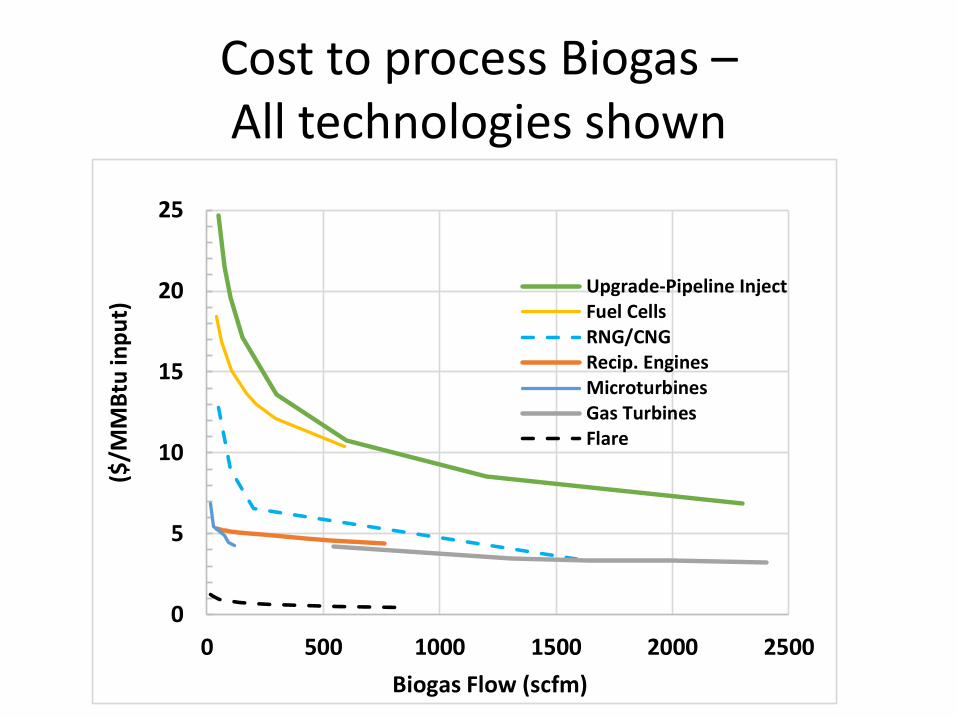
Cost to process Biogas –All technologies shown
0
5
10
15
20
25
0 500 1000 1500 2000 2500
($/M
MB
tu in
pu
t)
Biogas Flow (scfm)
Upgrade-Pipeline InjectFuel CellsRNG/CNGRecip. EnginesMicroturbinesGas TurbinesFlare
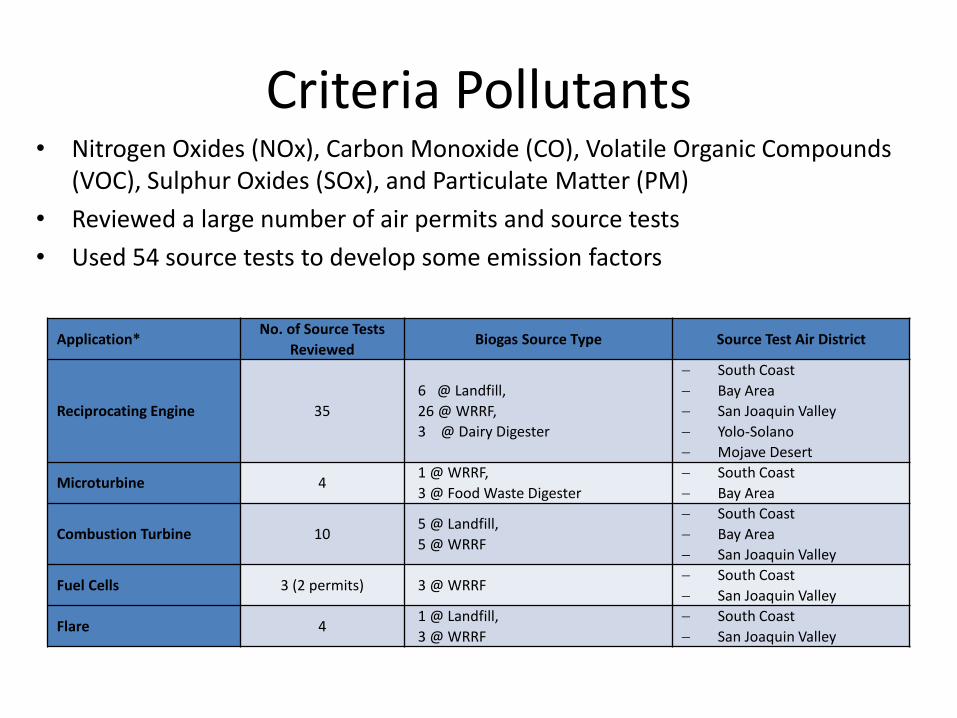
Criteria Pollutants• Nitrogen Oxides (NOx), Carbon Monoxide (CO), Volatile Organic Compounds
(VOC), Sulphur Oxides (SOx), and Particulate Matter (PM)
• Reviewed a large number of air permits and source tests
• Used 54 source tests to develop some emission factors
Application*No. of Source Tests
ReviewedBiogas Source Type Source Test Air District
Reciprocating Engine 35
6 @ Landfill,
26 @ WRRF,
3 @ Dairy Digester
South Coast
Bay Area
San Joaquin Valley
Yolo-Solano
Mojave Desert
Microturbine 41 @ WRRF,
3 @ Food Waste Digester
South Coast
Bay Area
Combustion Turbine 105 @ Landfill,
5 @ WRRF
South Coast
Bay Area
San Joaquin Valley
Fuel Cells 3 (2 permits) 3 @ WRRF South Coast
San Joaquin Valley
Flare 41 @ Landfill,
3 @ WRRF
South Coast
San Joaquin Valley
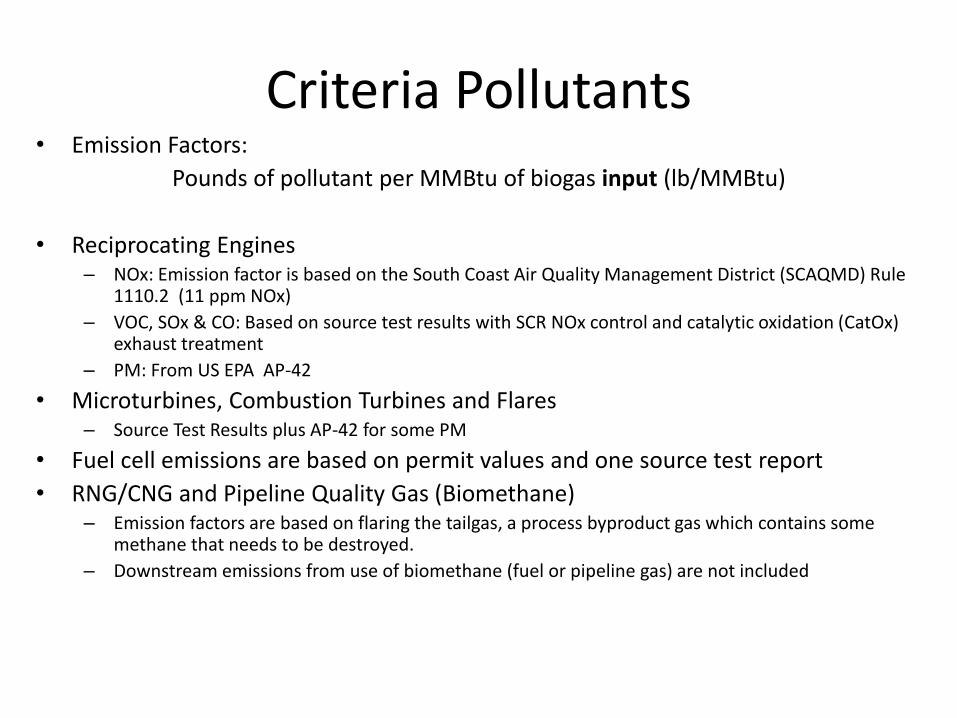
Criteria Pollutants• Emission Factors:
Pounds of pollutant per MMBtu of biogas input (lb/MMBtu)
• Reciprocating Engines– NOx: Emission factor is based on the South Coast Air Quality Management District (SCAQMD) Rule
1110.2 (11 ppm NOx)
– VOC, SOx & CO: Based on source test results with SCR NOx control and catalytic oxidation (CatOx) exhaust treatment
– PM: From US EPA AP-42
• Microturbines, Combustion Turbines and Flares– Source Test Results plus AP-42 for some PM
• Fuel cell emissions are based on permit values and one source test report
• RNG/CNG and Pipeline Quality Gas (Biomethane)– Emission factors are based on flaring the tailgas, a process byproduct gas which contains some
methane that needs to be destroyed.
– Downstream emissions from use of biomethane (fuel or pipeline gas) are not included
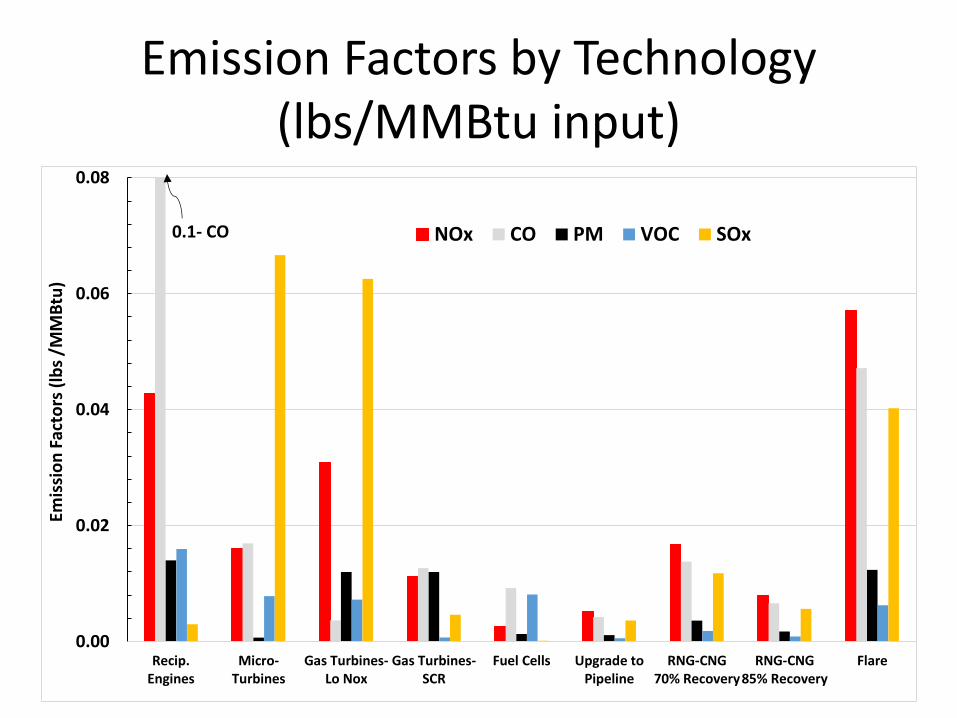
Emission Factors by Technology (lbs/MMBtu input)
0.00
0.02
0.04
0.06
0.08
Recip.Engines
Micro-Turbines
Gas Turbines-Lo Nox
Gas Turbines-SCR
Fuel Cells Upgrade toPipeline
RNG-CNG70% Recovery
RNG-CNG85% Recovery
Flare
Emis
sio
n F
acto
rs (
lbs
/MM
Btu
)
NOx CO PM VOC SOx0.1- CO
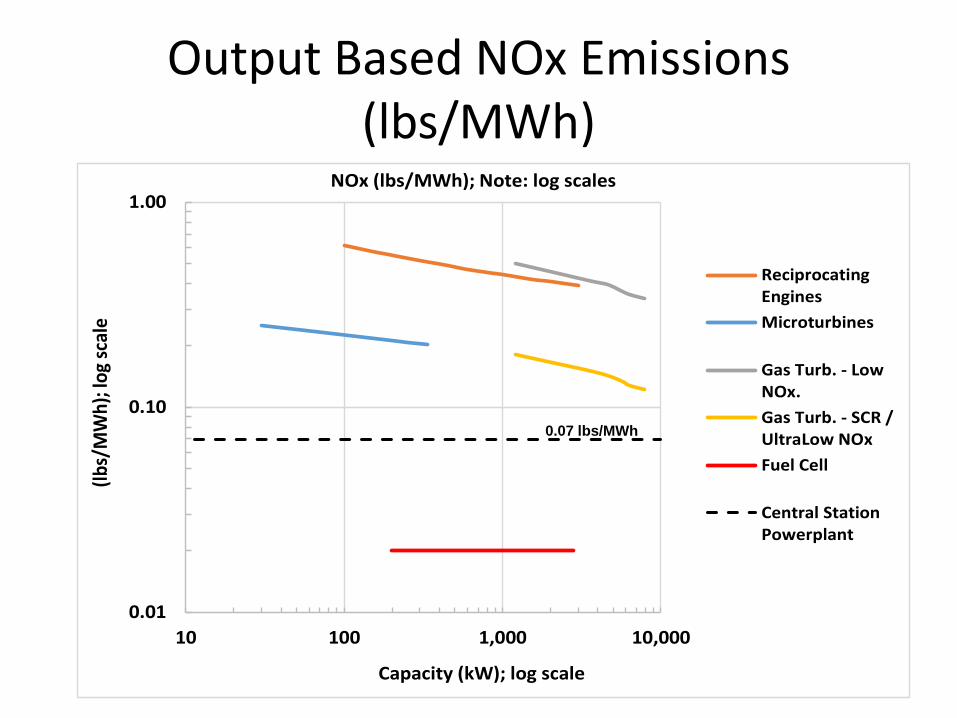
Output Based NOx Emissions (lbs/MWh)
0.01
0.10
1.00
10 100 1,000 10,000
(lbs
/MW
h); l
og s
cale
Capacity (kW); log scale
NOx (lbs/MWh); Note: log scales
ReciprocatingEngines
Microturbines
Gas Turb. - LowNOx.
Gas Turb. - SCR /UltraLow NOx
Fuel Cell
Central StationPowerplant
0.07 lbs/MWh
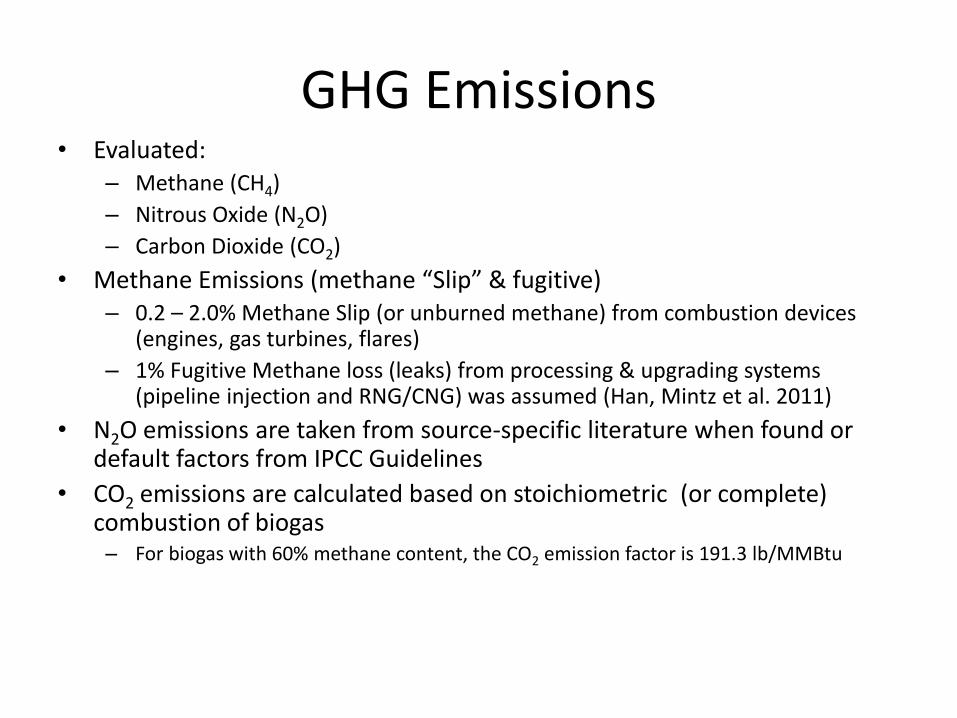
GHG Emissions• Evaluated:
– Methane (CH4)
– Nitrous Oxide (N2O)
– Carbon Dioxide (CO2)
• Methane Emissions (methane “Slip” & fugitive)– 0.2 – 2.0% Methane Slip (or unburned methane) from combustion devices
(engines, gas turbines, flares)
– 1% Fugitive Methane loss (leaks) from processing & upgrading systems (pipeline injection and RNG/CNG) was assumed (Han, Mintz et al. 2011)
• N2O emissions are taken from source-specific literature when found or default factors from IPCC Guidelines
• CO2 emissions are calculated based on stoichiometric (or complete) combustion of biogas
– For biogas with 60% methane content, the CO2 emission factor is 191.3 lb/MMBtu
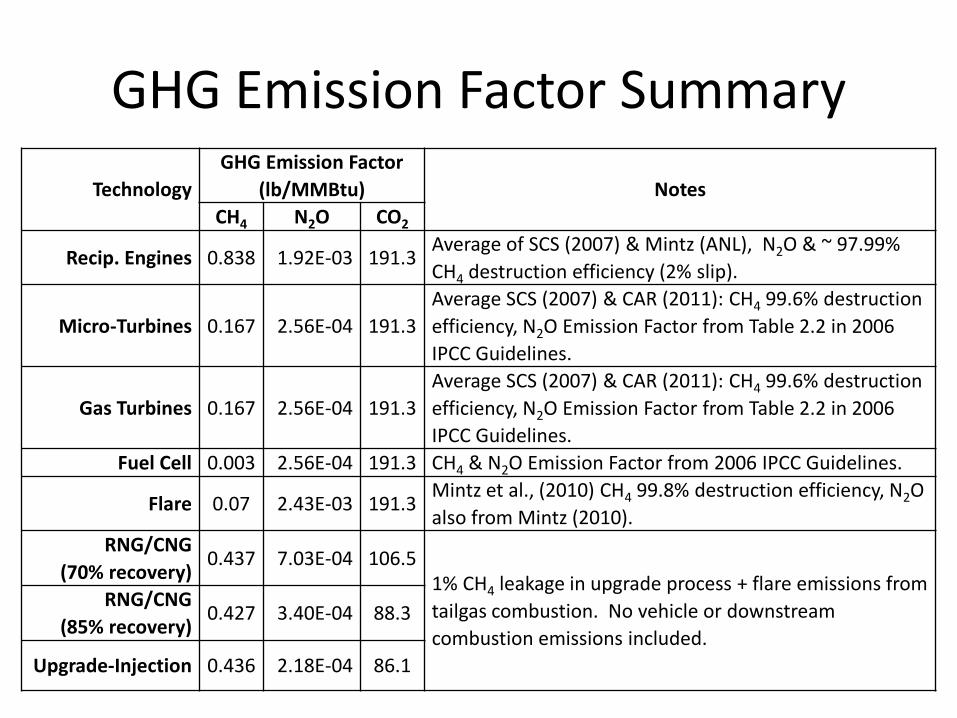
GHG Emission Factor Summary
Technology
GHG Emission Factor
(lb/MMBtu) Notes
CH4 N2O CO2
Recip. Engines 0.838 1.92E-03 191.3Average of SCS (2007) & Mintz (ANL), N2O & ~ 97.99%
CH4 destruction efficiency (2% slip).
Micro-Turbines 0.167 2.56E-04 191.3
Average SCS (2007) & CAR (2011): CH4 99.6% destruction
efficiency, N2O Emission Factor from Table 2.2 in 2006
IPCC Guidelines.
Gas Turbines 0.167 2.56E-04 191.3
Average SCS (2007) & CAR (2011): CH4 99.6% destruction
efficiency, N2O Emission Factor from Table 2.2 in 2006
IPCC Guidelines.
Fuel Cell 0.003 2.56E-04 191.3 CH4 & N2O Emission Factor from 2006 IPCC Guidelines.
Flare 0.07 2.43E-03 191.3Mintz et al., (2010) CH4 99.8% destruction efficiency, N2O
also from Mintz (2010).
RNG/CNG
(70% recovery)0.437 7.03E-04 106.5
1% CH4 leakage in upgrade process + flare emissions from
tailgas combustion. No vehicle or downstream
combustion emissions included.
RNG/CNG
(85% recovery)0.427 3.40E-04 88.3
Upgrade-Injection 0.436 2.18E-04 86.1
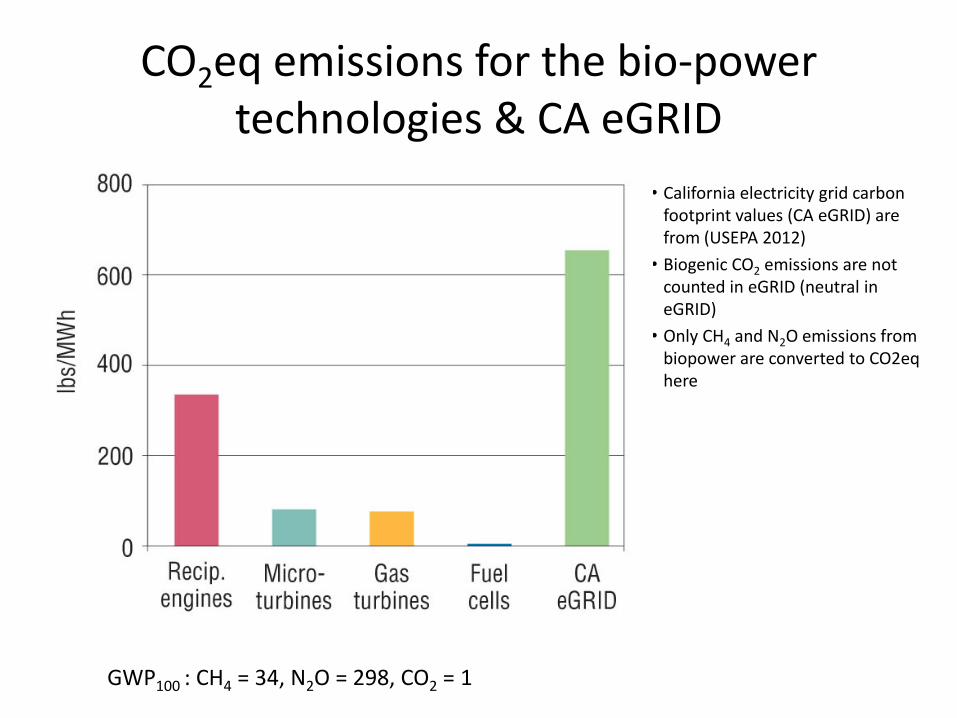
CO2eq emissions for the bio-power technologies & CA eGRID
• California electricity grid carbon footprint values (CA eGRID) are from (USEPA 2012)
• Biogenic CO2 emissions are not counted in eGRID (neutral in eGRID)
• Only CH4 and N2O emissions from biopower are converted to CO2eq here
GWP100 : CH4 = 34, N2O = 298, CO2 = 1
Technology Summary
• Examined seven biogas utilization technologies
• Evaluated and compared – Cost and performance
– Criteria pollutants
– Greenhouse gas emissions
• See EPA report, EPA/ORD/R-16/099, for details (link not yet available- email Rob Williams for copy : [email protected] )
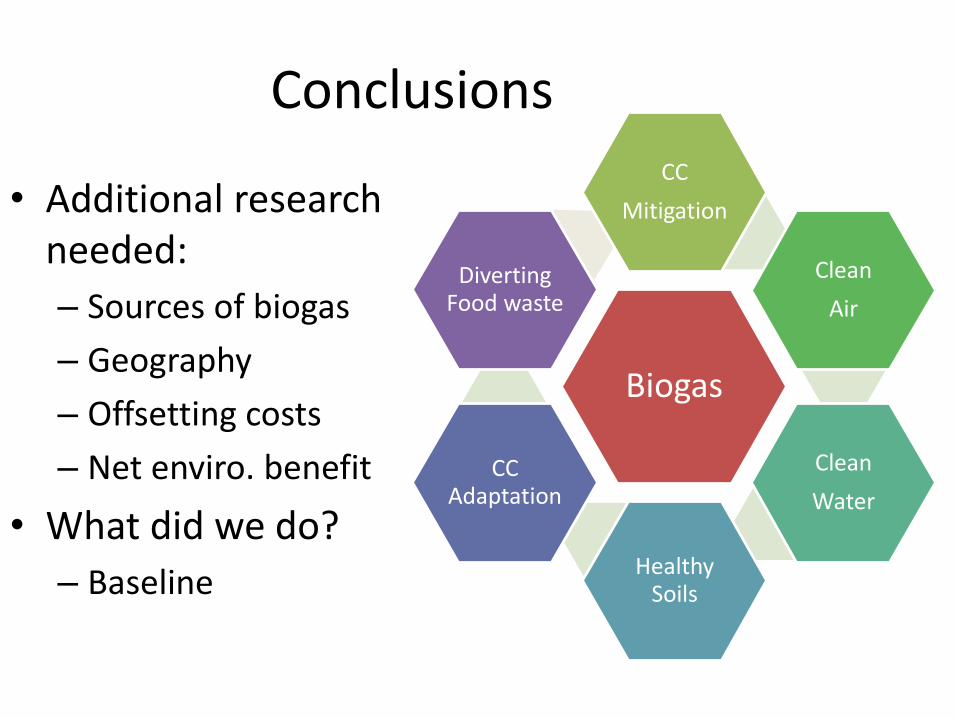
Biogas
CC
Mitigation
Clean
Air
Clean
Water
Healthy Soils
CC Adaptation
Diverting Food waste
Conclusions
• Additional research needed:
– Sources of biogas
– Geography
– Offsetting costs
– Net enviro. benefit
• What did we do?
– Baseline
Thank you
Rob Williams, UC [email protected]
(530) 752-6623
44
For a copy of the report, contact Rob Williams.
Charlotte Ely, US EPA Region 9
[email protected](415) 972-3731