Embed Size (px)
Citation preview
624 Vol. 60, No. 5
© 2012 The Pharmaceutical Society of Japan
Chem. Pharm. Bull. 60(5) 624–631 (2012)
Evaluation of the Degree of Mixing of Combinations of Dry Syrup, Powder, and Fine Granule Products in Consideration of Particle Size Distribution Using Near Infrared SpectrometryYoshihisa Yamamoto,a,b,c Toyofumi Suzuki,*,b Mika Matsumoto,d Michiteru Ohtani,d Shuichi Hayano,e Toshiro Fukami,b and Kazuo Tomonob
a Faculty of Pharmaceutical Science, Teikyo Heisei University; 4–1 Uruido Minami, Ichihara, Chiba 290–0193, Japan: b Laboratory of Pharmaceutics, Nihon University School of Pharmacy; 7–7–1 Narashinodai, Funabashi, Chiba 274–8555, Japan: c Sakuragi Store, Qol Pharmacy; 3–9–29 Sakuragi, Wakaba-ku, Chiba, Chiba 264–0028, Japan: d Department of Pharmacy, Tokyo Posts and Telecommunications Hospital; 2–14–23 Fujimi, Chiyoda-ku, Tokyo 102–8798, Japan: and e Bruker Optics K.K.; 1–4–1 Shinkawa, Chuo-ku, Tokyo 104–0033, Japan.Received December 14, 2011; accepted February 22, 2012; published online February 23, 2012
We used near infrared (NIR) spectroscopy to evaluate the degree of mixing of blended dry syrup (DS) products whose particle sizes are not specified in the Revised 16th Edition of the Japanese Pharmacopoeia, and also evaluated the degree of mixing when powder products or fine granule products were added to DS products. The data obtained were used to investigate the relationship between the particle size distributions of the products studied and the degree of mixing. We found that the particle size distribution characteristics of the 15 DS products studied can be broadly classified into 5 types. Combinations of frequently prescribed products were selected to represent 4 of the 5 particle size distribution types and were blended with a mortar and pestle. The coefficient of variation (CV) decreased as the percent mass of Asverin® Dry Syrup 2% (As-verin-DS) increased in blends of Periactin® Powder 1% (Periactin) and Asverin-DS, indicating an improved degree of mixing (uniformity). In contrast, in blends of Periactin and Mucodyne® DS 33.3%, mixing a com-bination at a 1 : 1 mass ratio 40 times resulted in a CV of 20%. Other mixing frequencies and mass ratios resulted in a CV by 50% to 70%, indicating a very poor degree of mixing (poor uniformity). These results suggest that when combining different DSs, or a DS with a powder or fine granule product, the blending ob-tained with a mortar and pestle improves as the particle size distributions of the components approach each other and as the ranges of the distributions narrow.
Key words near infrared spectroscopy; dry syrup; particle distribution; mixing method
The Revised 16th Edition of the Japanese Pharmacopoeia (JPXVI) defines the particle sizes of powder and fine granule products. Products that pass completely through an 850 µm (No. 18) sieve and whose residual amount in a 500 µm (No. 30) sieve is no more than 5% are designated as powder prod-ucts, and products that pass completely through an 850 µm (No. 18) sieve and whose residual amount in a 500 µm (No. 30) sieve is no more than 10% are designated as fine granule products1) (Fig. 1A). Syrup products designated as dry syrups (DSs) are granular or powdered products that become syrups
when water is added.1) However, the JP does not specify par-ticle size requirements for DSs, which come in a diverse array of particle sizes. In the field of pediatrics, antibiotic DS prod-ucts are generally prescribed as a monotherapy. Cough sup-pressants, expectorants, β2-stimulators (bronchodilators) and antihistamines, however, are available as DSs, powders, fine granules, and many other dosage forms, and are prescribed as blends of DS, powder, and fine granule products (Table 1).
Regular Article
* To whom correspondence should be addressed. e-mail: [email protected]
Fig. 1. Defined Particle Size of Powders and Fine Granules Based on JPXVI (A) and Classified Distribution Type (I–V) of the Particle Size of the Dry Syrups Examined (B)
Table 1. Typical Dry Syrup (DS) Prescriptions Used for Pediatrics
No. Prescription
Rp. 1 Periactin® Powder 1% (cyproheptadine) 0.4 gAsverin® Dry Syrup 2% (tipepidine
hibenzate)2.0 g
Mixture 3 times a day after meals 4 dRp. 2 Meptin® Dry Syrup 0.005% (procaterol) 0.8 g
Mucodyne® DS 33.3% (L-carbocisteine) 1.8 gMixture 2 times a day after morning and
evening meals7 d
Rp. 3 Periactin® Powder 1% (cyproheptadine) 0.4 gMucodyne® DS 33.3% (L-carbocisteine) 1.2 gMixture 3 times a day after meals 4 d
Rp. 4 Mucosolvan® DS 1.5% for pediatric (ambroxol)
1.0 g
Asverin® Dry Syrup 2% (tipepidine hibenzate)
2.0 g
Mixture 3 times a day after meals 5 d
Active pharmaceutical ingredients are expressed in a parenthesis.
May 2012 625
Powder and fine granule products are generally blended into a uniform mixture with a mortar and pestle. Nakamura et al. obtained uniform blending of digoxin powder and phenytoin fine granules by subjecting a diluted preparation to 60 rota-tions in a mortar and pestle.2) When a powder is blended with fine granules, the degree of mixing increases as the particle sizes of the blended products converge.3) No studies, however, have investigated the degree of mixing when DSs, whose par-ticle size is unspecified, are mixed together, or when a powder or fine granules are added to a DS. Pharmaceutical companies use different sizes sieves to determine particle size distribu-tions. DS particle sizes consequently cannot be estimated or directly compared against the particle sizes of other DSs based on the information in company-provided drug literature (known as an “interview form” in Japan). Pharmacists, with knowledge of DS particle size distributions, are supposed to determine whether blends made with a mortar and pestle are appropriate. If differing particle size distributions make blending with a mortar and pestle inappropriate, a procedure in which each product is separately compartmentalized dur-ing machine packaging, or other appropriate procedures to ensure uniform dispensing and packaging of the product, is necessary.
The degree of mixing of powders and other drug products can be assessed by performing colorimetry on a fixed sample size collected from the blend at several locations in the mor-tar,2–4) and by determining the radiation intensity of an in-gredient labeled with 113mIn.5,6) Recently, near infrared (NIR) spectroscopy has been identified as a useful technique for measuring an active or inactive ingredient in pharmaceutical powders.7–10) Matsumoto et al. recently used a rapid and sim-ple procedure for evaluating the degree of mixing of ethenza-mide powder using NIR spectrometry. The precision of NIR is comparable to that of HPLC.11) The NIR procedure does not
require sample removal or extraction, and is non-destructive.12)
In this study, we determined the particle size distributions of 15 DS products, whose particle sizes are not specified in JPXVI. In addition, we used an NIR spectroscopy to evaluate the degree of mixing of blended DS products, and the degree of mixing when a powder or fine granule product was added to a DS product and blended with a mortar and pestle. The data obtained were used to investigate the relationship be-tween the particle size distributions of the products studied and the degree of mixing.
ExperimentalMaterials The particle size distributions of 15 kinds of
DSs (Table 2), 4 types of powder products, and 10 types of fine granule products (Table 3) were measured as described below. Six sieves, with openings of 1700 µm (No. 10), 1400 µm (No. 12), 850 µm (No. 18), 500 µm (No. 30), 355 µm (No. 42), and 75 µm (No. 200), were purchased from Nonaka Rikaki Co., Ltd. (Tokyo, Japan). The porcelain mortar used for blend-ing powders had an outer diameter of 12 cm, an inner diameter of 10 cm, a depth of 5 cm, and volume of 250 mL (Nikkato Corporation, Japan, mortar and pestle for pharmacies).
Measurement of Distribution of Particle Size Particle size distributions were measured according to Particle Size Determination in JPXVI1) (Fig. 1A). Exactly 10.0 g of each of the 29 drug products studied was analyzed. The sieves and collecting pan (with a diameter of 75 mm) were stacked 6 on top of each other, and the weighed product was transferred to the uppermost sieve. A lid was placed on the uppermost sieves. The stacked horizontal sieves were agitated for 3 min. The sides of the sieves were gently tapped twice during agita-tion. The mass of the product remaining in each sieve was then weighed.
From the top, the nested sieves have openings of 1700 µm
Table 2. Dry Syrups (DS) Examined
Dry syrup Abbreviation Active pharmaceutical ingredient Company
Alegysal® Dry Syrup 0.5% Alegysal Pemirolast potassium Mitsubishi Tanabe Pharma Corporation, Osaka, Japan
Alesion® Dry Syrup 1% Alesion Epinastine hydrochloride Nippon Boehringer Ingelheim Co., Ltd., Tokyo, Japan
Asverin® Dry Syrup 2% Asverin-DS Tipepidine hibenzate Mitsubishi Tanabe Pharma Corporation, Osaka, Japan
Banan® Dry Syrup 5% Banan Cefpodoxime proxetil Daiichi Sankyo Co., Ltd., Tokyo, JapanBerachin® Dry Syrup for children 0.1% Berachin Tulobuterol hydrochloride Mitsubishi Tanabe Pharma Corporation,
Osaka, JapanClarith® Dry Syrup 10% for pediatric Clarith Clarithromycin Taisho Toyama Pharmaceutical Co., Ltd.,
Tokyo, JapanErythrocin® Dry Syrup W20% Erythrocin Erythromycin ethylsuccinate Abbott Japan Co., Ltd., Tokyo, JapanIPD® Dry Syrup 5% IPD Suplatast tosilate Taiho Pharmaceutical Co., Ltd., Tokyo, JapanMeptin® Dry Syrup 0.005% Meptin-DS Procaterol hydrochloride hydrate Otsuka Pharmaceutical Co., Ltd., Tokyo,
JapanMucodyne® DS 33.3% Mucodyne-DS L-Carbocisteine Kyorin Pharmaceutical Co., Ltd., Tokyo,
JapanMucosal® Dry Syrup 1.5% Mucosal Ambroxol hydrochloride Nippon Boehringer Ingelheim Co., Ltd.,
Tokyo, JapanMucosolvan® DS 1.5% for pediatric Mucosolvan-DS Ambroxol hydrochloride Teijin Pharma Limited, Tokyo, JapanOnon® Dry Syrup 10% Onon Pranlukast hydrate Ono Pharmaceutical Co., Ltd., Osaka, JapanTheodur® Dry Syrup 20% Theodur Theophylline Mitsubishi Tanabe Pharma Corporation,
Osaka, JapanZaditen® Dry Syrup 0.1% Zaditen Ketotifen fumarate Novartis Pharma K.K., Tokyo, Japan
626 Vol. 60, No. 5
(No. 10), 1400 µm (No. 12), 850 µm (No. 18), 500 µm (No. 30), 355 µm (No. 42), and 75 µm (No. 200) (Fig. 1B). As shown in Table 4, the products were classified into 5 categories, called Types I to V, in order of increasing particle size distribu-tion. Type I category contained products with ≥80% passage through the 355 µm sieve and no passage through the 75 µm sieve (hereafter called 75–355 µm). Most of the particle sizes of Type II products fell within the 75 to 355 µm range, but the
distribution was less than 80%. At least 80% of the particle sizes of Type III products fell within the 355 to 500 µm range. Most of the particle sizes of Type IV products fell within the 355 to 500 µm range, but the distribution was less than 80%. Finally, most of the particle sizes of Type V products fell within the 500 to 850 µm range, but the distribution was also less than 80% (Fig. 1B, Table 4).Selection of Combinations of Drugs Product formulations
Table 3. Powders and Fine Granules Examined
Powders or fine granules Abbreviation Active pharmaceutical ingredient Company
PowdersAsverin® Powder 10% Asverin-P Tipepidine hibenzate Mitsubishi Tanabe Pharma Corporation, Osaka,
JapanBiofermin-R® Powder Biofermin-R Antibiotics-resistant lactic acid
bacteriaeBiofermin Pharmaceutical Co., Ltd., Hyogo,
JapanLactose Extra Fine Crystal Lactose Lactose Mylan Seiyaku, Tokyo, JapanPeriactin® Powder 1% Periactin Cyproheptadine hydrochloride
hydrateNichi-Iko Pharmaceutical Co., Ltd., Toyama,
JapanGranulesAldactone®-A Fine Granules 10% Aldactone Spironolactone Pfizer Japan Inc., Tokyo, JapanCefzon® Fine Granules 10% for pediatric Cefzon Cefdinir Astellas Pharma Inc., Tokyo, JapanLasix® 4% Fine Granule Lasix Furosemide Nichi-Iko Pharmaceutical Co., Ltd., Toyama,
JapanMeiact MS® Fine Granules 10% Meiact Cefditoren pivoxil Meiji Seika Pharma Co., Ltd., Tokyo, JapanMucodyne® Fine Granules 50% Mucodyne-FG L-Carbocisteine Kyorin Pharmaceutical Co., Ltd., Tokyo, JapanNeuzym® Fine Granules 20% Neuzym Lysozyme hydrochloride Sannova Co., Ltd.Sawacillin® Fine Granules 10% Sawacillin Amoxicillin hydrate Astellas Pharma Inc., Tokyo, JapanWidecillin® Fine Granules 200 Widecillin Amoxicillin hydrate Meiji Seika Pharma Co., Ltd., Tokyo, JapanZesulan® Fine Granules 0.6% for pediatric Zesulan Mequitazine Asahi Kasei Pharma Corporation, Tokyo, JapanZithromac® Fine Granules for pediatric use
10%Zithromac Azithromycin hydrate Pfizer Japan Inc., Tokyo, Japan
Table 4. Classification of Distribution Type of Particle Size of Powders, Fine Granules and Dry Syrups
Distribution typeSize of the sieve (μm) Size range of the sieve
(µm–µm) Percentage of distribution (%)Passage particle Residual particle
I 355 75 75–355 ≥80II 355 75 75–355 <80III 500 355 355–500 ≥80IV 500 355 355–500 <80V 850 500 500–850 <80
Table 5. Selected Combinations of Drugs from Prescriptions and Their Weight Ratio for Determination of Mixing
Distribution type Combination of drugs Prescription Weight ratio (mixture ratio)
Volume of the mortar filled (%)
I+I Periactin (cyproheptadine)+Asverin-DS (tipepi-dine hibenzate)
Rp. 1 1 : 1 29.81 : 3 30.81 : 5 31.1
II+II Meptin-DS (procaterol)+Mucodyne-DS (L-carbocisteine)
Rp. 2 1 : 1 29.91 : 2 29.91 : 3 29.9
I+II Periactin (cyproheptadine)+Mucodyne-DS (L-carbocisteine)
Rp. 3 1 : 1 28.81 : 3 29.3
V+I Mucosolvan-DS (ambroxol)+Asverin-DS (tipepidine hibenzate)
Rp. 4 1 : 1 32.31 : 2 32.1
Distribution type of particle size is classified from the results in Figs. 3 and 4. Active pharmaceutical ingredients are expressed in a parenthesis. The prescription is indicated in Table 1.
May 2012 627
having a DS as either 1 or both of the products to be blended were selected from wide use formulations on clinical shown in Table 1, and the mass ratios of the products of the types shown below were selected (Table 5). The following 4 drug product combinations were selected for blending, according to the particle size distribution described in the previous section: Periactin (cyproheptadine) and Asverin-DS (tipepidine hi-benzate) [Periactin+Asverin-DS] as Type I blended products, Meptin-DS (procaterol) and Mucodyne-DS (L-carbocisteine) [Meptin-DS+Mucodyne-DS] as Type II blended products, a combination of Type I Periactin (cyproheptadine) and Type II Mucodyne-DS (L-carbocisteine) [Periactin+Mucodyne-DS], and a combination of Type IV Mucosolvan-DS (am-broxol) and Type I Asverin-DS (tipepidine hibenzate) [Mucosolvan-DS+Asverin-DS].
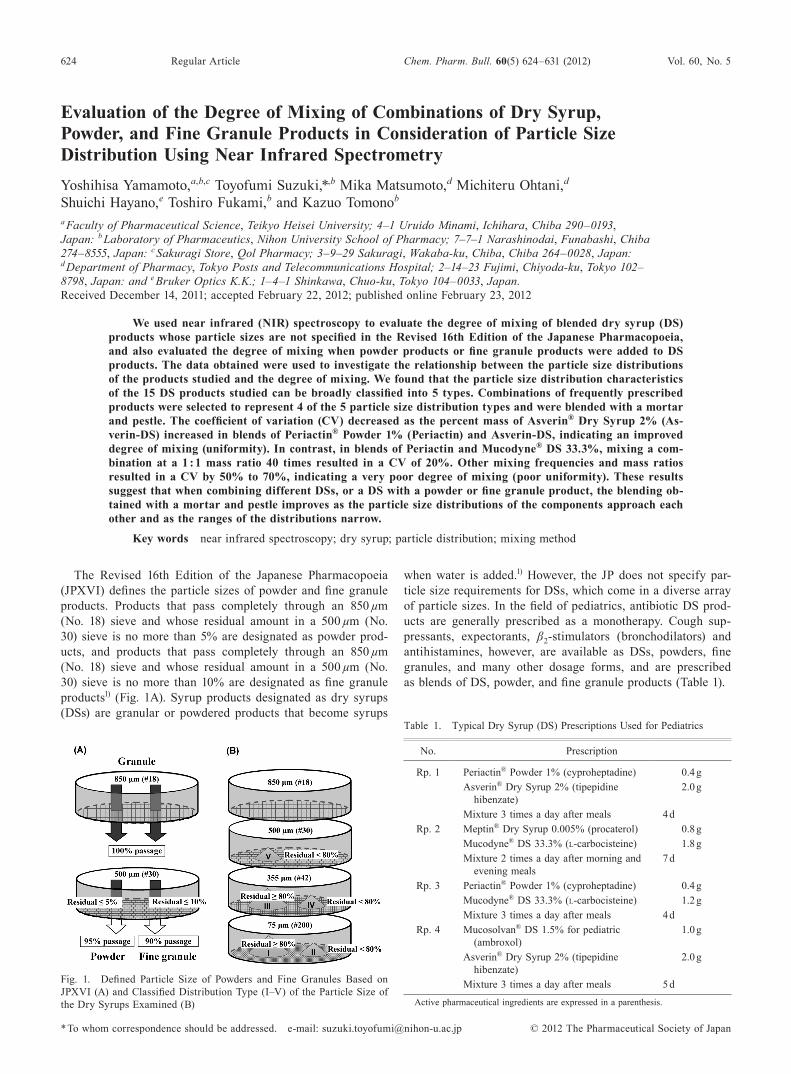
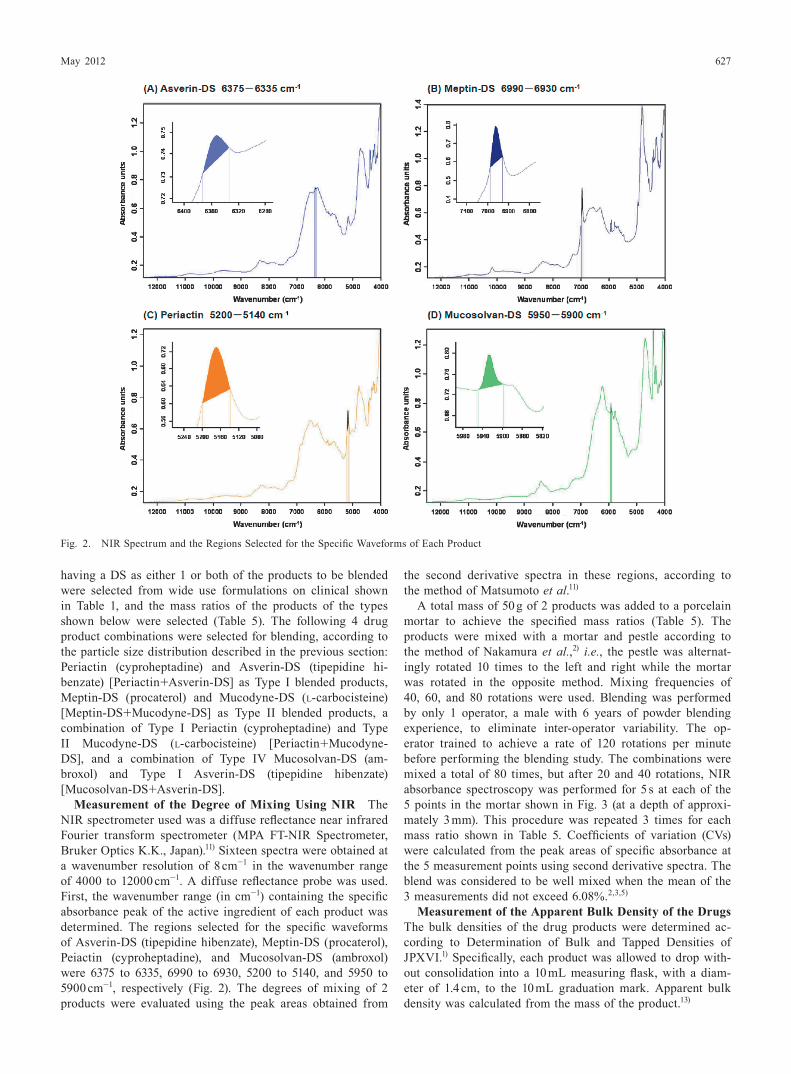
Measurement of the Degree of Mixing Using NIR The NIR spectrometer used was a diffuse reflectance near infrared Fourier transform spectrometer (MPA FT-NIR Spectrometer, Bruker Optics K.K., Japan).11) Sixteen spectra were obtained at a wavenumber resolution of 8 cm−1 in the wavenumber range of 4000 to 12000 cm−1. A diffuse reflectance probe was used. First, the wavenumber range (in cm−1) containing the specific absorbance peak of the active ingredient of each product was determined. The regions selected for the specific waveforms of Asverin-DS (tipepidine hibenzate), Meptin-DS (procaterol), Peiactin (cyproheptadine), and Mucosolvan-DS (ambroxol) were 6375 to 6335, 6990 to 6930, 5200 to 5140, and 5950 to 5900 cm−1, respectively (Fig. 2). The degrees of mixing of 2 products were evaluated using the peak areas obtained from
the second derivative spectra in these regions, according to the method of Matsumoto et al.11)
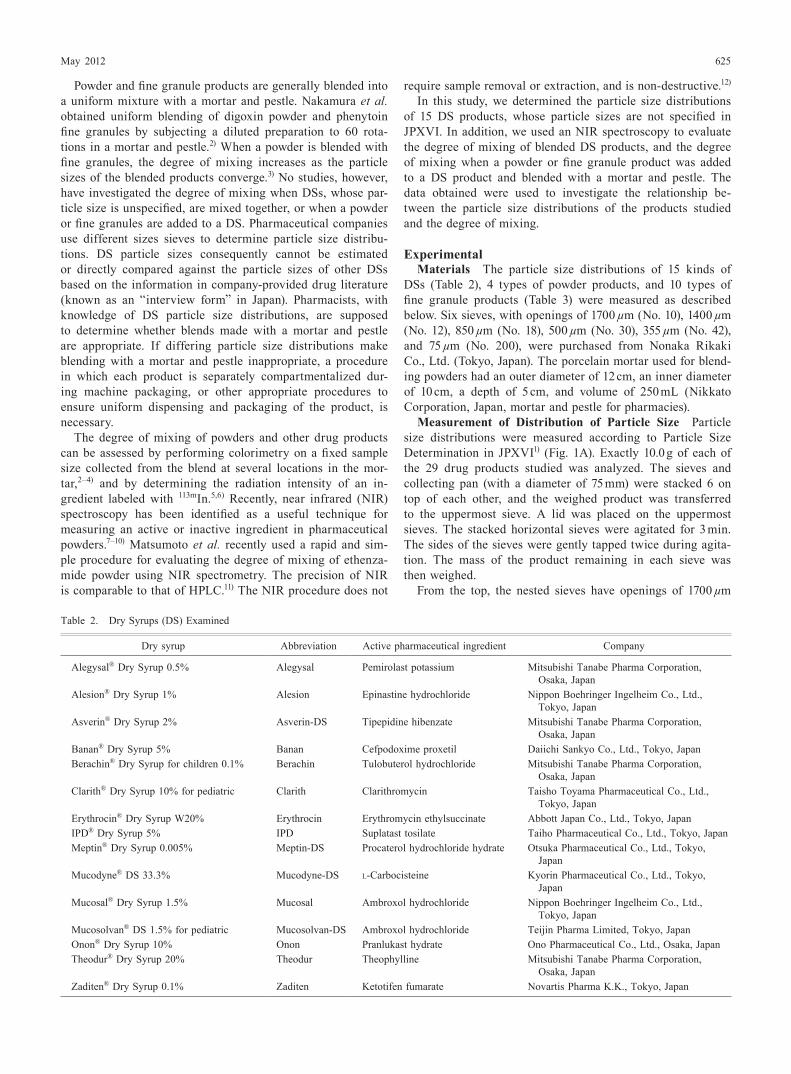
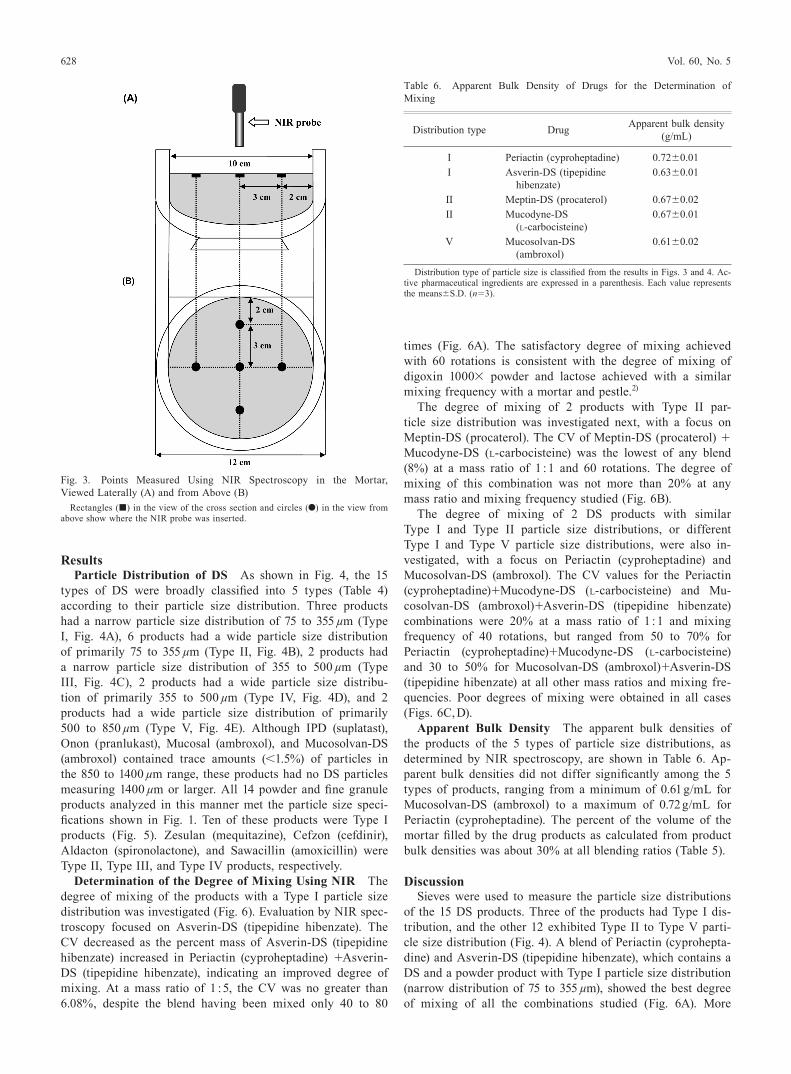
A total mass of 50 g of 2 products was added to a porcelain mortar to achieve the specified mass ratios (Table 5). The products were mixed with a mortar and pestle according to the method of Nakamura et al.,2) i.e., the pestle was alternat-ingly rotated 10 times to the left and right while the mortar was rotated in the opposite method. Mixing frequencies of 40, 60, and 80 rotations were used. Blending was performed by only 1 operator, a male with 6 years of powder blending experience, to eliminate inter-operator variability. The op-erator trained to achieve a rate of 120 rotations per minute before performing the blending study. The combinations were mixed a total of 80 times, but after 20 and 40 rotations, NIR absorbance spectroscopy was performed for 5 s at each of the 5 points in the mortar shown in Fig. 3 (at a depth of approxi-mately 3 mm). This procedure was repeated 3 times for each mass ratio shown in Table 5. Coefficients of variation (CVs) were calculated from the peak areas of specific absorbance at the 5 measurement points using second derivative spectra. The blend was considered to be well mixed when the mean of the 3 measurements did not exceed 6.08%.2,3,5)
Measurement of the Apparent Bulk Density of the Drugs The bulk densities of the drug products were determined ac-cording to Determination of Bulk and Tapped Densities of JPXVI.1) Specifically, each product was allowed to drop with-out consolidation into a 10 mL measuring flask, with a diam-eter of 1.4 cm, to the 10 mL graduation mark. Apparent bulk density was calculated from the mass of the product.13)
Fig. 2. NIR Spectrum and the Regions Selected for the Specific Waveforms of Each Product
628 Vol. 60, No. 5
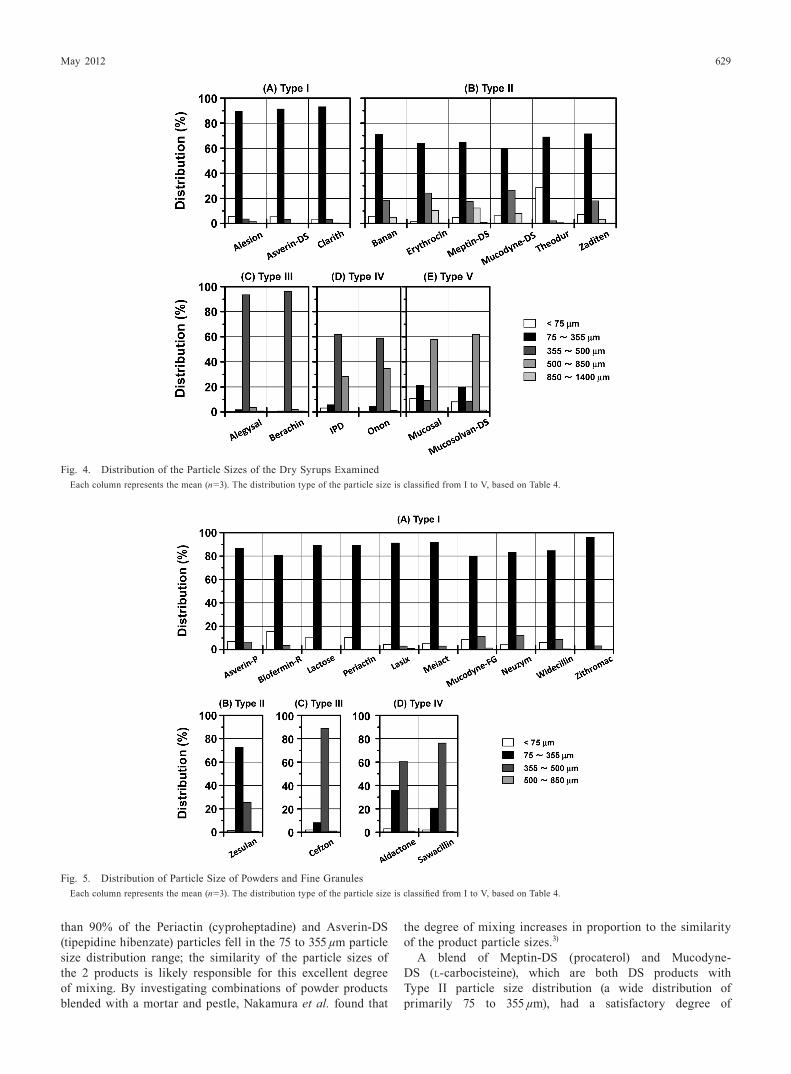
ResultsParticle Distribution of DS As shown in Fig. 4, the 15
types of DS were broadly classified into 5 types (Table 4) according to their particle size distribution. Three products had a narrow particle size distribution of 75 to 355 µm (Type I, Fig. 4A), 6 products had a wide particle size distribution of primarily 75 to 355 µm (Type II, Fig. 4B), 2 products had a narrow particle size distribution of 355 to 500 µm (Type III, Fig. 4C), 2 products had a wide particle size distribu-tion of primarily 355 to 500 µm (Type IV, Fig. 4D), and 2 products had a wide particle size distribution of primarily 500 to 850 µm (Type V, Fig. 4E). Although IPD (suplatast), Onon (pranlukast), Mucosal (ambroxol), and Mucosolvan-DS (ambroxol) contained trace amounts (<1.5%) of particles in the 850 to 1400 µm range, these products had no DS particles measuring 1400 µm or larger. All 14 powder and fine granule products analyzed in this manner met the particle size speci-fications shown in Fig. 1. Ten of these products were Type I products (Fig. 5). Zesulan (mequitazine), Cefzon (cefdinir), Aldacton (spironolactone), and Sawacillin (amoxicillin) were Type II, Type III, and Type IV products, respectively.
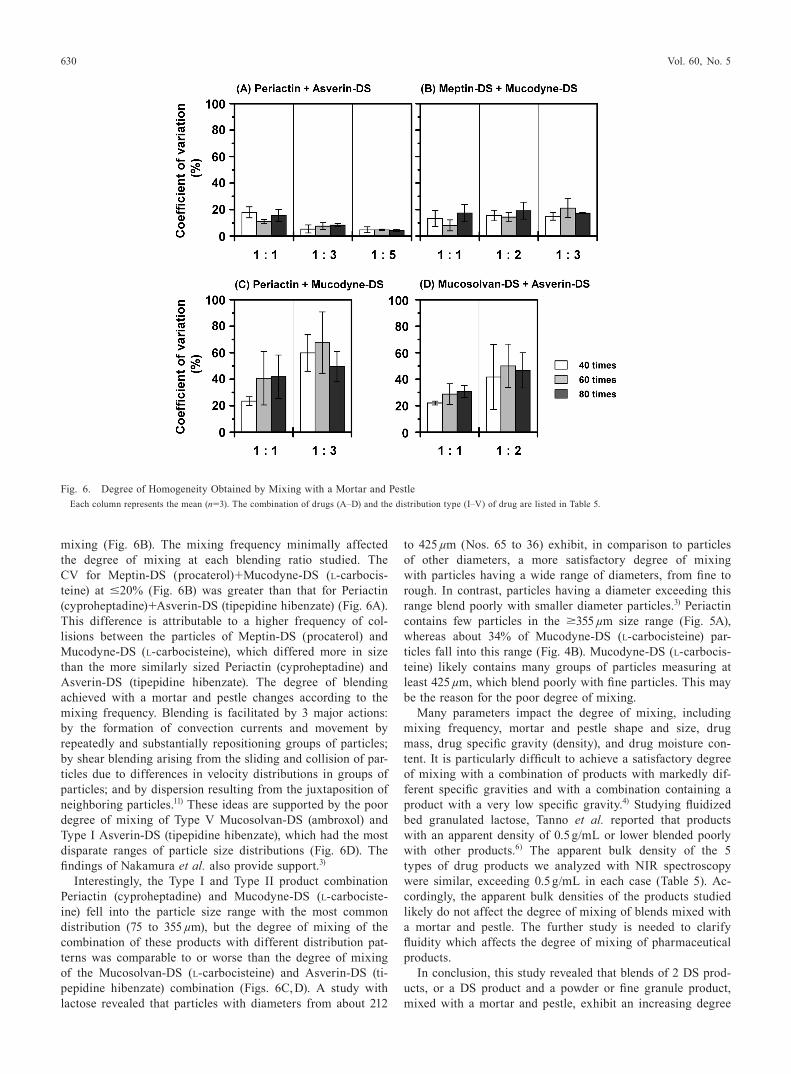
Determination of the Degree of Mixing Using NIR The degree of mixing of the products with a Type I particle size distribution was investigated (Fig. 6). Evaluation by NIR spec-troscopy focused on Asverin-DS (tipepidine hibenzate). The CV decreased as the percent mass of Asverin-DS (tipepidine hibenzate) increased in Periactin (cyproheptadine) +Asverin-DS (tipepidine hibenzate), indicating an improved degree of mixing. At a mass ratio of 1 : 5, the CV was no greater than 6.08%, despite the blend having been mixed only 40 to 80
times (Fig. 6A). The satisfactory degree of mixing achieved with 60 rotations is consistent with the degree of mixing of digoxin 1000× powder and lactose achieved with a similar mixing frequency with a mortar and pestle.2)
The degree of mixing of 2 products with Type II par-ticle size distribution was investigated next, with a focus on Meptin-DS (procaterol). The CV of Meptin-DS (procaterol) + Mucodyne-DS (L-carbocisteine) was the lowest of any blend (8%) at a mass ratio of 1 : 1 and 60 rotations. The degree of mixing of this combination was not more than 20% at any mass ratio and mixing frequency studied (Fig. 6B).
The degree of mixing of 2 DS products with similar Type I and Type II particle size distributions, or different Type I and Type V particle size distributions, were also in-vestigated, with a focus on Periactin (cyproheptadine) and Mucosolvan-DS (ambroxol). The CV values for the Periactin (cyproheptadine)+Mucodyne-DS (L-carbocisteine) and Mu-cosolvan-DS (ambroxol)+Asverin-DS (tipepidine hibenzate) combinations were 20% at a mass ratio of 1 : 1 and mixing frequency of 40 rotations, but ranged from 50 to 70% for Periactin (cyproheptadine)+Mucodyne-DS (L-carbocisteine) and 30 to 50% for Mucosolvan-DS (ambroxol)+Asverin-DS (tipepidine hibenzate) at all other mass ratios and mixing fre-quencies. Poor degrees of mixing were obtained in all cases (Figs. 6C, D).
Apparent Bulk Density The apparent bulk densities of the products of the 5 types of particle size distributions, as determined by NIR spectroscopy, are shown in Table 6. Ap-parent bulk densities did not differ significantly among the 5 types of products, ranging from a minimum of 0.61 g/mL for Mucosolvan-DS (ambroxol) to a maximum of 0.72 g/mL for Periactin (cyproheptadine). The percent of the volume of the mortar filled by the drug products as calculated from product bulk densities was about 30% at all blending ratios (Table 5).
DiscussionSieves were used to measure the particle size distributions
of the 15 DS products. Three of the products had Type I dis-tribution, and the other 12 exhibited Type II to Type V parti-cle size distribution (Fig. 4). A blend of Periactin (cyprohepta-dine) and Asverin-DS (tipepidine hibenzate), which contains a DS and a powder product with Type I particle size distribution (narrow distribution of 75 to 355 µm), showed the best degree of mixing of all the combinations studied (Fig. 6A). More
Fig. 3. Points Measured Using NIR Spectroscopy in the Mortar, Viewed Laterally (A) and from Above (B)
Rectangles (■) in the view of the cross section and circles (●) in the view from above show where the NIR probe was inserted.
Table 6. Apparent Bulk Density of Drugs for the Determination of Mixing
Distribution type Drug Apparent bulk density (g/mL)
I Periactin (cyproheptadine) 0.72±0.01I Asverin-DS (tipepidine
hibenzate)0.63±0.01
II Meptin-DS (procaterol) 0.67±0.02II Mucodyne-DS
(L-carbocisteine)0.67±0.01
V Mucosolvan-DS (ambroxol)
0.61±0.02
Distribution type of particle size is classified from the results in Figs. 3 and 4. Ac-tive pharmaceutical ingredients are expressed in a parenthesis. Each value represents the means±S.D. (n=3).
May 2012 629
than 90% of the Periactin (cyproheptadine) and Asverin-DS (tipepidine hibenzate) particles fell in the 75 to 355 µm particle size distribution range; the similarity of the particle sizes of the 2 products is likely responsible for this excellent degree of mixing. By investigating combinations of powder products blended with a mortar and pestle, Nakamura et al. found that
the degree of mixing increases in proportion to the similarity of the product particle sizes.3)
A blend of Meptin-DS (procaterol) and Mucodyne-DS (L-carbocisteine), which are both DS products with Type II particle size distribution (a wide distribution of primarily 75 to 355 µm), had a satisfactory degree of
Fig. 5. Distribution of Particle Size of Powders and Fine GranulesEach column represents the mean (n=3). The distribution type of the particle size is classified from I to V, based on Table 4.
Fig. 4. Distribution of the Particle Sizes of the Dry Syrups ExaminedEach column represents the mean (n=3). The distribution type of the particle size is classified from I to V, based on Table 4.
630 Vol. 60, No. 5
mixing (Fig. 6B). The mixing frequency minimally affected the degree of mixing at each blending ratio studied. The CV for Meptin-DS (procaterol)+Mucodyne-DS (L-carbocis-teine) at ≤20% (Fig. 6B) was greater than that for Periactin (cyproheptadine)+Asverin-DS (tipepidine hibenzate) (Fig. 6A). This difference is attributable to a higher frequency of col-lisions between the particles of Meptin-DS (procaterol) and Mucodyne-DS (L-carbocisteine), which differed more in size than the more similarly sized Periactin (cyproheptadine) and Asverin-DS (tipepidine hibenzate). The degree of blending achieved with a mortar and pestle changes according to the mixing frequency. Blending is facilitated by 3 major actions: by the formation of convection currents and movement by repeatedly and substantially repositioning groups of particles; by shear blending arising from the sliding and collision of par-ticles due to differences in velocity distributions in groups of particles; and by dispersion resulting from the juxtaposition of neighboring particles.11) These ideas are supported by the poor degree of mixing of Type V Mucosolvan-DS (ambroxol) and Type I Asverin-DS (tipepidine hibenzate), which had the most disparate ranges of particle size distributions (Fig. 6D). The findings of Nakamura et al. also provide support.3)
Interestingly, the Type I and Type II product combination Periactin (cyproheptadine) and Mucodyne-DS (L-carbociste-ine) fell into the particle size range with the most common distribution (75 to 355 µm), but the degree of mixing of the combination of these products with different distribution pat-terns was comparable to or worse than the degree of mixing of the Mucosolvan-DS (L-carbocisteine) and Asverin-DS (ti-pepidine hibenzate) combination (Figs. 6C, D). A study with lactose revealed that particles with diameters from about 212
to 425 µm (Nos. 65 to 36) exhibit, in comparison to particles of other diameters, a more satisfactory degree of mixing with particles having a wide range of diameters, from fine to rough. In contrast, particles having a diameter exceeding this range blend poorly with smaller diameter particles.3) Periactin contains few particles in the ≥355 µm size range (Fig. 5A), whereas about 34% of Mucodyne-DS (L-carbocisteine) par-ticles fall into this range (Fig. 4B). Mucodyne-DS (L-carbocis-teine) likely contains many groups of particles measuring at least 425 µm, which blend poorly with fine particles. This may be the reason for the poor degree of mixing.
Many parameters impact the degree of mixing, including mixing frequency, mortar and pestle shape and size, drug mass, drug specific gravity (density), and drug moisture con-tent. It is particularly difficult to achieve a satisfactory degree of mixing with a combination of products with markedly dif-ferent specific gravities and with a combination containing a product with a very low specific gravity.4) Studying fluidized bed granulated lactose, Tanno et al. reported that products with an apparent density of 0.5 g/mL or lower blended poorly with other products.6) The apparent bulk density of the 5 types of drug products we analyzed with NIR spectroscopy were similar, exceeding 0.5 g/mL in each case (Table 5). Ac-cordingly, the apparent bulk densities of the products studied likely do not affect the degree of mixing of blends mixed with a mortar and pestle. The further study is needed to clarify fluidity which affects the degree of mixing of pharmaceutical products.
In conclusion, this study revealed that blends of 2 DS prod-ucts, or a DS product and a powder or fine granule product, mixed with a mortar and pestle, exhibit an increasing degree
Fig. 6. Degree of Homogeneity Obtained by Mixing with a Mortar and PestleEach column represents the mean (n=3). The combination of drugs (A–D) and the distribution type (I–V) of drug are listed in Table 5.
May 2012 631
of mixing as the particle size distributions of the 2 products converge and as the range of the distributions narrows. Ten of the 15 products studied had a wide range of particle sizes, which shows that some combinations containing a DS should not be mixed in a mortar and pestle. Such combinations of drug products must instead be blended using a procedure in which each product is separately compartmentalized during machine packaging, or using another appropriate procedure suited to uniform product bundling. Sieving or otherwise ho-mogenizing the products before blending should also improve the degree of mixing. This study has revealed that the particle size distributions of DS products, like those of powder and fine granule products, are critical for assessing whether a mor-tar and pestle is sufficient for product blending. Our findings will facilitate the formulation of safe and consistent product blends.
References 1) “The Japanese Pharmacopoeia,” 16th ed., Hirokawa Shoten, Tokyo,
2011. 2) Nakamura H., Higo K., Suzuki A., Fujinuma Y., Tanaka Y., Ohtani
M., Kotaki H., Iga T., Jpn. J. Hosp. Pharm., 23, 305–311 (1997).
3) Nakamura H., Yanagihara Y., Sekiguchi H., Ohtani M., Kariya S., Uchino K., Suzuki H., Iga T., Yakugaku Zasshi, 124, 135–139 (2004).
4) Sakurai Y., Fujii S., Ito S., J. Pharm. Sci. Tech. Jpn., 16, 7–12 (1956).
5) Kanakubo Y., Yamamoto J., Suzuki M., Hasama M., Yamguchi I., Kanno Y., Saito K., Kikuchi N., Tanno K., J. Pharm. Sci. Tech. Jpn., 35, 159–163 (1975).
6) Tanno K., Ikeda M., Sasaki Y., Jpn. J. Hosp. Pharm., 5, 73–79 (1979).
7) Bellamy L. J., Nordon A., Littlejohn D., Analyst (London), 133, 58–64 (2008).
8) Bellamy L. J., Nordon A., Littlejohn D., Int. J. Pharm., 361, 87–91 (2008).
9) Liew C. V., Karande A. D., Heng P. W. S., Int. J. Pharm., 386, 138–148 (2010).
10) Karande A. D., Liew C. V., Heng P. W. S., Int. J. Pharm., 395, 91–97 (2010).
11) Matsumoto M., Ohtani M., Hayano S., Namiki M., Yamamura Y., Osaki K., Terashita K., Jpn. J. Pharm. Health Care Sci., 37, 701–706 (2011).
12) Terashita K., Osaki K., Pharm. Tech. Japan, 21, 1309–1318 (2005).13) Hayashi H., Minami S., Yakugaku Zasshi, 84, 229–236 (1964).
![Mixing in micro - flows. - Indico [Home]indico.ictp.it/event/a04203/session/77/contribution/46/material/0/... · Mixing in micro-flows ... Enhancement of mixing) V. Steinberg](https://img.pdfslide.tips/doc/110x75/5b7d50657f8b9a10598c536c/mixing-in-micro-flows-indico-home-mixing-in-micro-flows-enhancement.jpg)