Embed Size (px)
Citation preview
Runninghead:EVALUATIONOFTHEHARDYBRAINCAMP
EvaluationoftheHardyBrainCamp
ByHannahGrossmanwithMaryE.Brenner
GevirtzGraduateSchoolofEducation
UCSB
August2012
PreparedfortheBoysandGirlsClubofGreaterOxnardandPortHueneme
EvaluationoftheHardyBrainCamp2
ExecutiveSummary
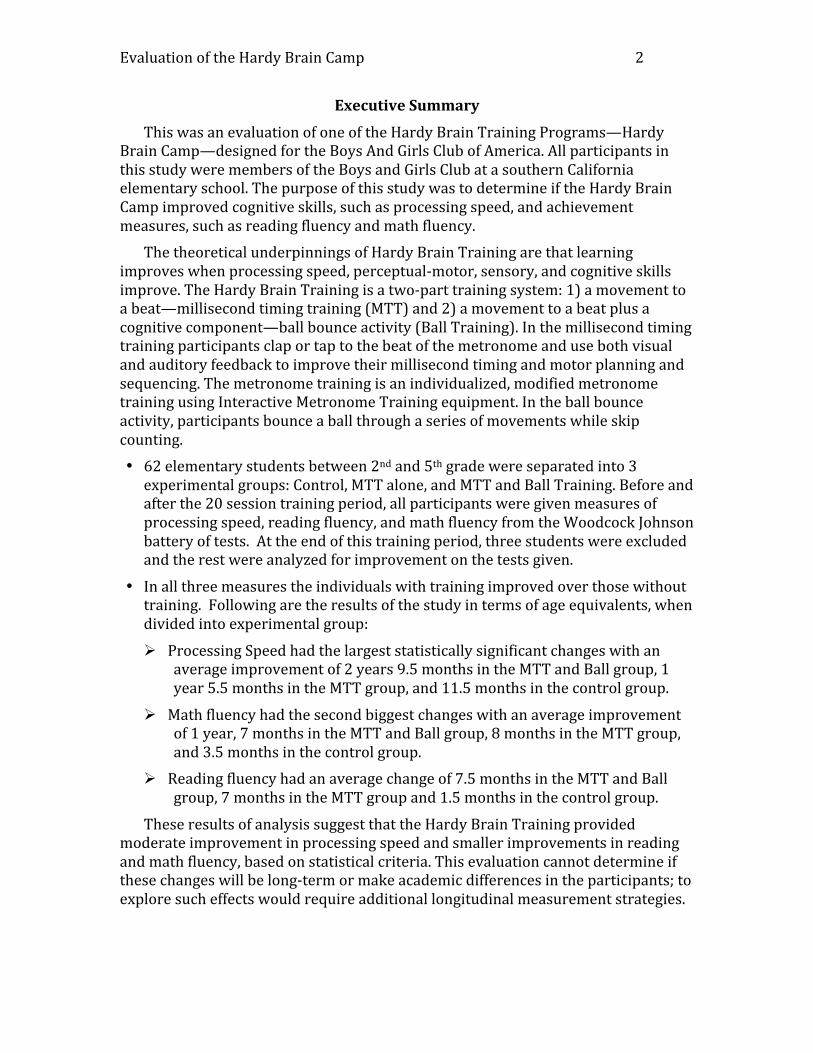
ThiswasanevaluationofoneoftheHardyBrainTrainingPrograms—HardyBrainCamp—designedfortheBoysAndGirlsClubofAmerica.AllparticipantsinthisstudyweremembersoftheBoysandGirlsClubatasouthernCaliforniaelementaryschool.ThepurposeofthisstudywastodetermineiftheHardyBrainCampimprovedcognitiveskills,suchasprocessingspeed,andachievementmeasures,suchasreadingfluencyandmathfluency.
ThetheoreticalunderpinningsofHardyBrainTrainingarethatlearningimproveswhenprocessingspeed,perceptual‐motor,sensory,andcognitiveskillsimprove.TheHardyBrainTrainingisatwo‐parttrainingsystem:1)amovementtoabeat—millisecondtimingtraining(MTT)and2)amovementtoabeatplusacognitivecomponent—ballbounceactivity(BallTraining).Inthemillisecondtimingtrainingparticipantsclaportaptothebeatofthemetronomeandusebothvisualandauditoryfeedbacktoimprovetheirmillisecondtimingandmotorplanningandsequencing.Themetronometrainingisanindividualized,modifiedmetronometrainingusingInteractiveMetronomeTrainingequipment.Intheballbounceactivity,participantsbounceaballthroughaseriesofmovementswhileskipcounting.• 62elementarystudentsbetween2ndand5thgradewereseparatedinto3experimentalgroups:Control,MTTalone,andMTTandBallTraining.Beforeandafterthe20sessiontrainingperiod,allparticipantsweregivenmeasuresofprocessingspeed,readingfluency,andmathfluencyfromtheWoodcockJohnsonbatteryoftests.Attheendofthistrainingperiod,threestudentswereexcludedandtherestwereanalyzedforimprovementonthetestsgiven.
• Inallthreemeasurestheindividualswithtrainingimprovedoverthosewithouttraining.Followingaretheresultsofthestudyintermsofageequivalents,whendividedintoexperimentalgroup:
ProcessingSpeedhadthelargeststatisticallysignificantchangeswithanaverageimprovementof2years9.5monthsintheMTTandBallgroup,1year5.5monthsintheMTTgroup,and11.5monthsinthecontrolgroup.
Mathfluencyhadthesecondbiggestchangeswithanaverageimprovementof1year,7monthsintheMTTandBallgroup,8monthsintheMTTgroup,and3.5monthsinthecontrolgroup.
Readingfluencyhadanaveragechangeof7.5monthsintheMTTandBallgroup,7monthsintheMTTgroupand1.5monthsinthecontrolgroup.
TheseresultsofanalysissuggestthattheHardyBrainTrainingprovidedmoderateimprovementinprocessingspeedandsmallerimprovementsinreadingandmathfluency,basedonstatisticalcriteria.Thisevaluationcannotdetermineifthesechangeswillbelong‐termormakeacademicdifferencesintheparticipants;toexploresucheffectswouldrequireadditionallongitudinalmeasurementstrategies.
EvaluationoftheHardyBrainCamp3
Evaluation of the Hardy Brain Camp
Introduction
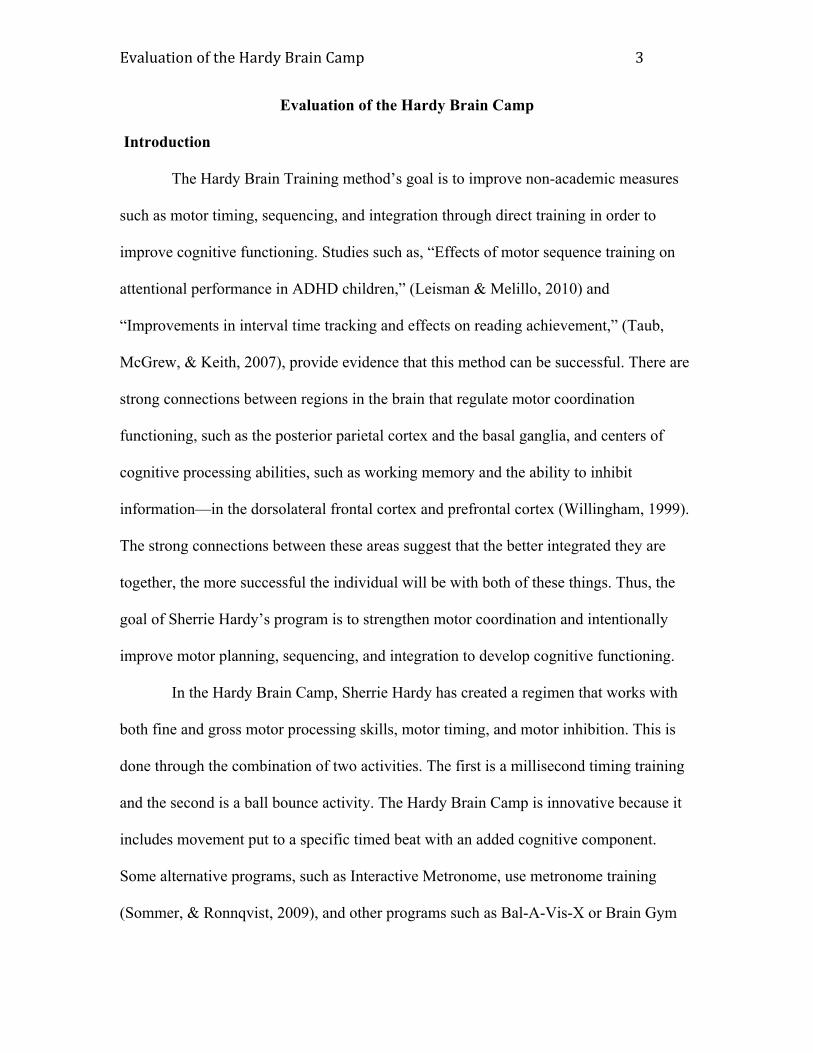
The Hardy Brain Training method’s goal is to improve non-academic measures
such as motor timing, sequencing, and integration through direct training in order to
improve cognitive functioning. Studies such as, “Effects of motor sequence training on
attentional performance in ADHD children,” (Leisman & Melillo, 2010) and
“Improvements in interval time tracking and effects on reading achievement,” (Taub,
McGrew, & Keith, 2007), provide evidence that this method can be successful. There are
strong connections between regions in the brain that regulate motor coordination
functioning, such as the posterior parietal cortex and the basal ganglia, and centers of
cognitive processing abilities, such as working memory and the ability to inhibit
information—in the dorsolateral frontal cortex and prefrontal cortex (Willingham, 1999).
The strong connections between these areas suggest that the better integrated they are
together, the more successful the individual will be with both of these things. Thus, the
goal of Sherrie Hardy’s program is to strengthen motor coordination and intentionally
improve motor planning, sequencing, and integration to develop cognitive functioning.
In the Hardy Brain Camp, Sherrie Hardy has created a regimen that works with
both fine and gross motor processing skills, motor timing, and motor inhibition. This is
done through the combination of two activities. The first is a millisecond timing training
and the second is a ball bounce activity. The Hardy Brain Camp is innovative because it
includes movement put to a specific timed beat with an added cognitive component.
Some alternative programs, such as Interactive Metronome, use metronome training
(Sommer, & Ronnqvist, 2009), and other programs such as Bal-A-Vis-X or Brain Gym
EvaluationoftheHardyBrainCamp4
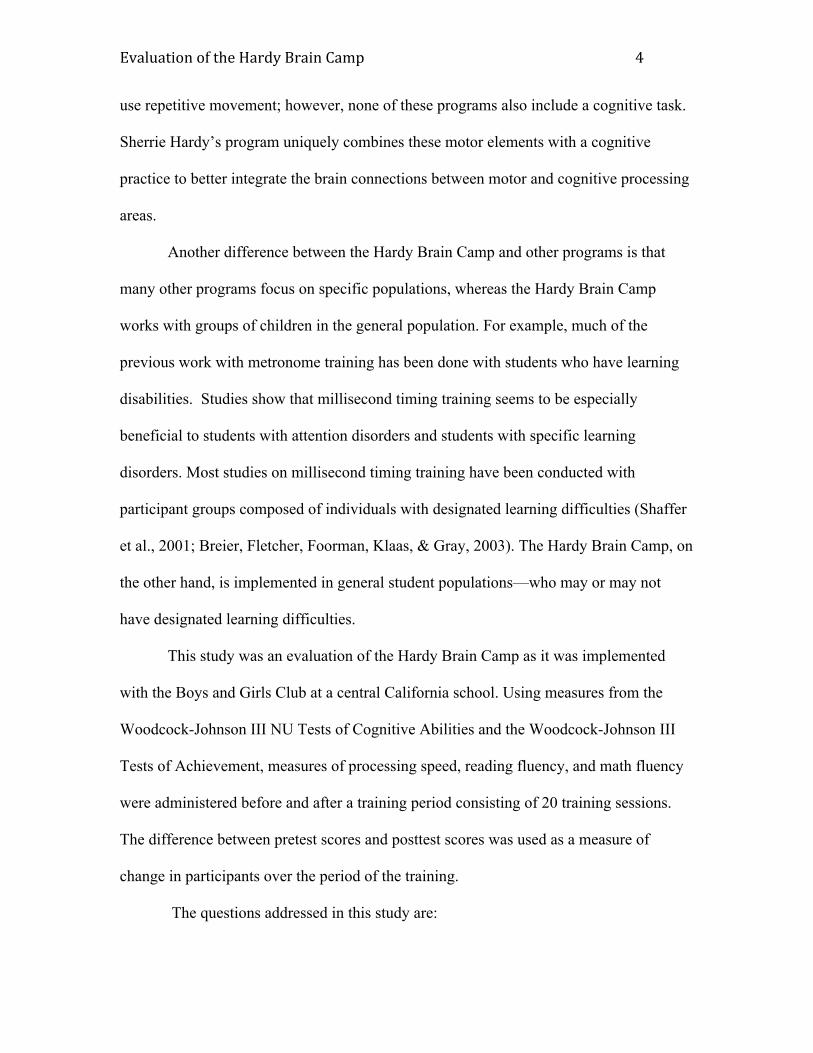
use repetitive movement; however, none of these programs also include a cognitive task.
Sherrie Hardy’s program uniquely combines these motor elements with a cognitive
practice to better integrate the brain connections between motor and cognitive processing
areas.
Another difference between the Hardy Brain Camp and other programs is that
many other programs focus on specific populations, whereas the Hardy Brain Camp
works with groups of children in the general population. For example, much of the
previous work with metronome training has been done with students who have learning
disabilities. Studies show that millisecond timing training seems to be especially
beneficial to students with attention disorders and students with specific learning
disorders. Most studies on millisecond timing training have been conducted with
participant groups composed of individuals with designated learning difficulties (Shaffer
et al., 2001; Breier, Fletcher, Foorman, Klaas, & Gray, 2003). The Hardy Brain Camp, on
the other hand, is implemented in general student populations—who may or may not
have designated learning difficulties.
This study was an evaluation of the Hardy Brain Camp as it was implemented
with the Boys and Girls Club at a central California school. Using measures from the
Woodcock-Johnson III NU Tests of Cognitive Abilities and the Woodcock-Johnson III
Tests of Achievement, measures of processing speed, reading fluency, and math fluency
were administered before and after a training period consisting of 20 training sessions.
The difference between pretest scores and posttest scores was used as a measure of
change in participants over the period of the training.
The questions addressed in this study are:
EvaluationoftheHardyBrainCamp5
1) Does the Hardy Brain Camp improve processing speeds, suggesting an
improvement in motor integration and timing for a general population such as that found
in the Boys and Girls Club as compared to a control group and a group receiving only
metronome timing training?
2) Are there improvements in achievement measures such as reading fluency and
math fluency in the students who have done the Hardy Brain Camp?
3) Are improvements greater for participants who have both metronome training
and ball bounce training, or does the metronome training alone give the same level of
improvement?
4) Are there identifiable trends that suggest that certain subgroups are more likely
to improve with the Hardy Brain Camp, such as age groups or gender groups, or does the
training seem to benefit children more broadly within treatment groups?
We will begin by describing the procedures used in both the millisecond timing
training and the ball bounce activity. Then we will describe the study and give the results
of our analysis. Finally, we will conclude with a discussion of the implications of the
evaluation.
Millisecond Timing Training Procedure
The millisecond timing training protocols used in this study were created by
Sherrie Hardy using the technology from the Interactive Metronome and based on the
Interactive Metronome training. The Hardy Brain Training has customized its program
by modifying its display, its training procedure, and the number of repetitions necessary
in training.
EvaluationoftheHardyBrainCamp6
To begin the millisecond timing training, participants are given an initial test to
determine how close their natural timing is to ideal timing. This initial inventory looks
for close proximity to the metronome beat, the ability to do left side and right side
activities, the ability to do bilateral timing movements and the ability to coordinate both
sides of the body while balancing on one foot or the other. Participants’ strengths and
weaknesses on these activities are used to individualize their training. Exercises are
selected for students to strengthen particular areas of weakness; for example, if a
participant has difficulty with movements on his/her left side, more repetitions in the
exercises that practice left-side training will be programmed for that participant.
Participants’ initial training speed is also determined by how they perform on this
inventory. If participants’ initial average timing scores are more than 100 milliseconds
off of the metronome reference tone, participants enter into Stage One training; if their
timing is less than 100 milliseconds off, they enter into Stage Two Training.
The millisecond timing training presents students with a metronome-paced
reference tone provided through headphones. Their task is to produce certain movements
in time with the metronome beat. There are thirteen total movement exercises, which are
practiced in 40-minute practice sessions. Motor timing information is collected via
sensors: a hand sensor for when the hands are clapped together or clapped against a body
part, and a foot sensor pad for when toes or heels are tapped to the metronome. These
sensors are hardwired to a metronome box that is used with a computer system. The
computer integration is used to provide participants with instantaneous feedback as to
how accurately they are mimicking the metronome’s timing and provides trainers with
EvaluationoftheHardyBrainCamp7
information about how participants are doing with their training. This Interactive
Metronome equipment is specifically designed for the Hardy Brain Camp.
On each day of training, participants begin with Task 1, a one-minute “short
form” task composed of clapping with visual cues and the reference tone. Task 2 follows
this. In this one-minute “short form”, participants clap while being provided with a
reference tone, with visual feedback as to the number of milliseconds they were off tone
and with auditory guide sounds as to whether they were right on, before, or after the tone.
After doing these two standardized one-minute sections, each participant continues on to
a customized training session composed of a combination of the thirteen movements
designed to strengthen individual weaknesses.
Atthebeginningofthetraining,repetitionsegmentsstartoffshort.Some
participantsbeginwithoneminuteofmetronomebeatswithonlyvisualfeedback.
Afterthissection,thereisasmallbreakbetweentasks.Thelengthsofrepetition
sectionsaregraduallyincreaseduntilbytheendofthetrainingperiodthestudent
shouldbeabletodoa38‐minuterepetitionsectionwithoutbreaks.Theconceptual
underpinningofthisisthatifstudentscanattendto38minutesofmotorplanning
andsequencingatonetime,theyshouldbeabletoattendmoreeffectivelytoan
entirelessoninschool.
In millisecond timing training, a student’s millisecond time response improves
over days of training. While very few students are accurate at the beginning of the
training period, by the end of the training most of the students are highly accurate in their
ability to clap in time with the reference tone. This clapping and toe tapping to the
metronome improves initial inhibition of when to move, integrates movements with the
EvaluationoftheHardyBrainCamp8
reference tone, visual, and auditory feedback, and aids calibration of motor responses in
relation to organization of feedback.
The Hardy Brain training program has a minimum goal of 23,000 repetitions of
tone and feedback; however, 32,000 repetitions are the preferred goal, in order to obtain
full benefits. Forthispurpose,eachparticipantinasettingliketheBoysandGirls
Clubisgivenaccessto20sessionsof40minuteswithagoalofenablingchildrento
participateinatleast15sessions.A minimum of 12 sessions is designated as
completion of training. Fewer than 12 training sessions is not enough repetitions to obtain
the benefits of training.
The Role of Daily Monitoring and Training
At the initial evaluation, and on a regular basis thereafter, students’ progress and
timing is monitored by two groups of individuals: the trainers, who are present at the
millisecond timing training (MTT) sessions and deal with day-to-day issues to support
participants, and the Hardy program monitors, who work from a distance and support
participants by examining patterns of timing, strengths and weaknesses, and improvement
in participants. This information is used by both groups to individualize each
participant’s training: displays, feedback, and exercises.
Trainers and Hardy program monitors communicate to modify and individualize
the training for each participant. For example, trainers can call the monitors for
immediate changes in exercise customization and displays. Also, the monitors use
specific screen backdrops as a code to communicate information to the trainers. Screen
backdrops indicate to the trainers which students might need more assistance—a screen
EvaluationoftheHardyBrainCamp9
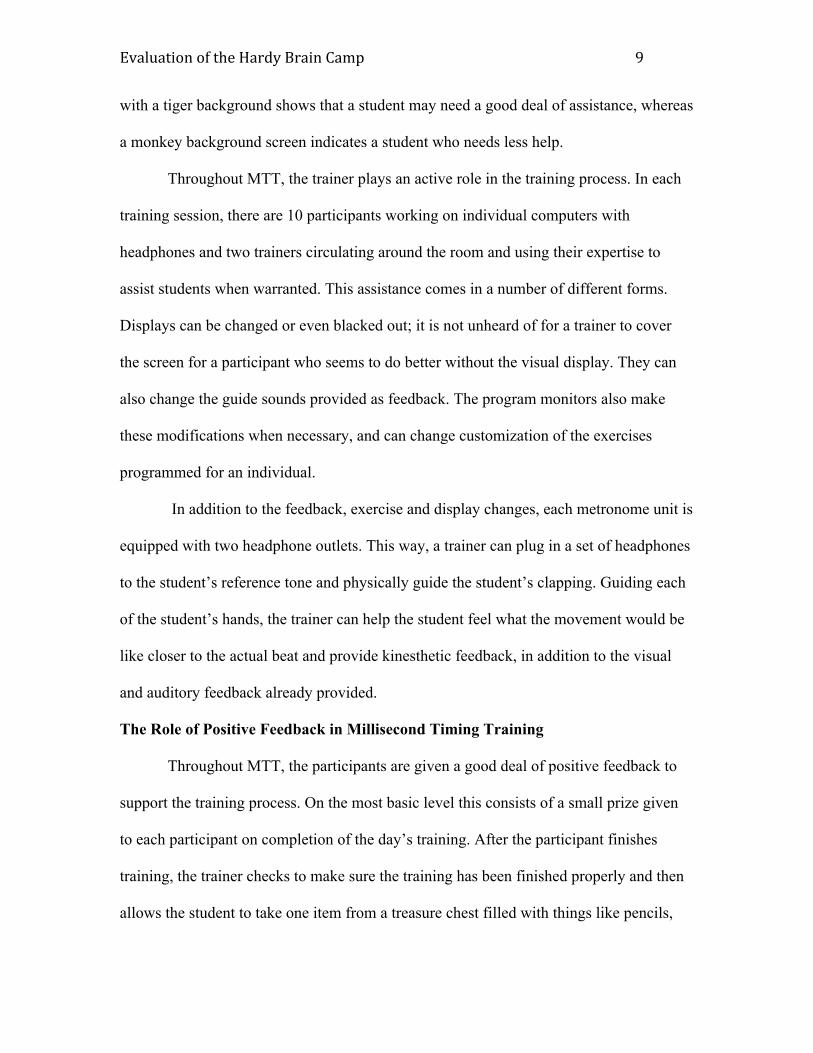
with a tiger background shows that a student may need a good deal of assistance, whereas
a monkey background screen indicates a student who needs less help.
Throughout MTT, the trainer plays an active role in the training process. In each
training session, there are 10 participants working on individual computers with
headphones and two trainers circulating around the room and using their expertise to
assist students when warranted. This assistance comes in a number of different forms.
Displays can be changed or even blacked out; it is not unheard of for a trainer to cover
the screen for a participant who seems to do better without the visual display. They can
also change the guide sounds provided as feedback. The program monitors also make
these modifications when necessary, and can change customization of the exercises
programmed for an individual.
In addition to the feedback, exercise and display changes, each metronome unit is
equipped with two headphone outlets. This way, a trainer can plug in a set of headphones
to the student’s reference tone and physically guide the student’s clapping. Guiding each
of the student’s hands, the trainer can help the student feel what the movement would be
like closer to the actual beat and provide kinesthetic feedback, in addition to the visual
and auditory feedback already provided.
The Role of Positive Feedback in Millisecond Timing Training
Throughout MTT, the participants are given a good deal of positive feedback to
support the training process. On the most basic level this consists of a small prize given
to each participant on completion of the day’s training. After the participant finishes
training, the trainer checks to make sure the training has been finished properly and then
allows the student to take one item from a treasure chest filled with things like pencils,
EvaluationoftheHardyBrainCamp10
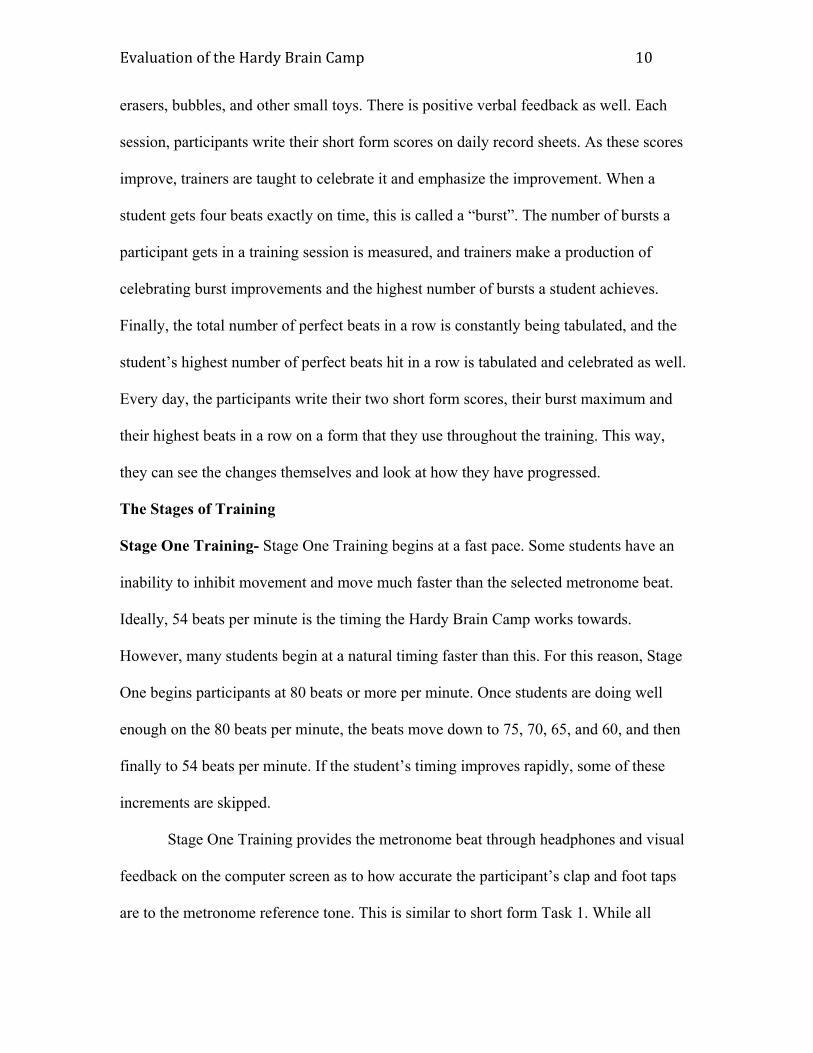
erasers, bubbles, and other small toys. There is positive verbal feedback as well. Each
session, participants write their short form scores on daily record sheets. As these scores
improve, trainers are taught to celebrate it and emphasize the improvement. When a
student gets four beats exactly on time, this is called a “burst”. The number of bursts a
participant gets in a training session is measured, and trainers make a production of
celebrating burst improvements and the highest number of bursts a student achieves.
Finally, the total number of perfect beats in a row is constantly being tabulated, and the
student’s highest number of perfect beats hit in a row is tabulated and celebrated as well.
Every day, the participants write their two short form scores, their burst maximum and
their highest beats in a row on a form that they use throughout the training. This way,
they can see the changes themselves and look at how they have progressed.
The Stages of Training
Stage One Training- Stage One Training begins at a fast pace. Some students have an
inability to inhibit movement and move much faster than the selected metronome beat.
Ideally, 54 beats per minute is the timing the Hardy Brain Camp works towards.
However, many students begin at a natural timing faster than this. For this reason, Stage
One begins participants at 80 beats or more per minute. Once students are doing well
enough on the 80 beats per minute, the beats move down to 75, 70, 65, and 60, and then
finally to 54 beats per minute. If the student’s timing improves rapidly, some of these
increments are skipped.
Stage One Training provides the metronome beat through headphones and visual
feedback on the computer screen as to how accurate the participant’s clap and foot taps
are to the metronome reference tone. This is similar to short form Task 1. While all
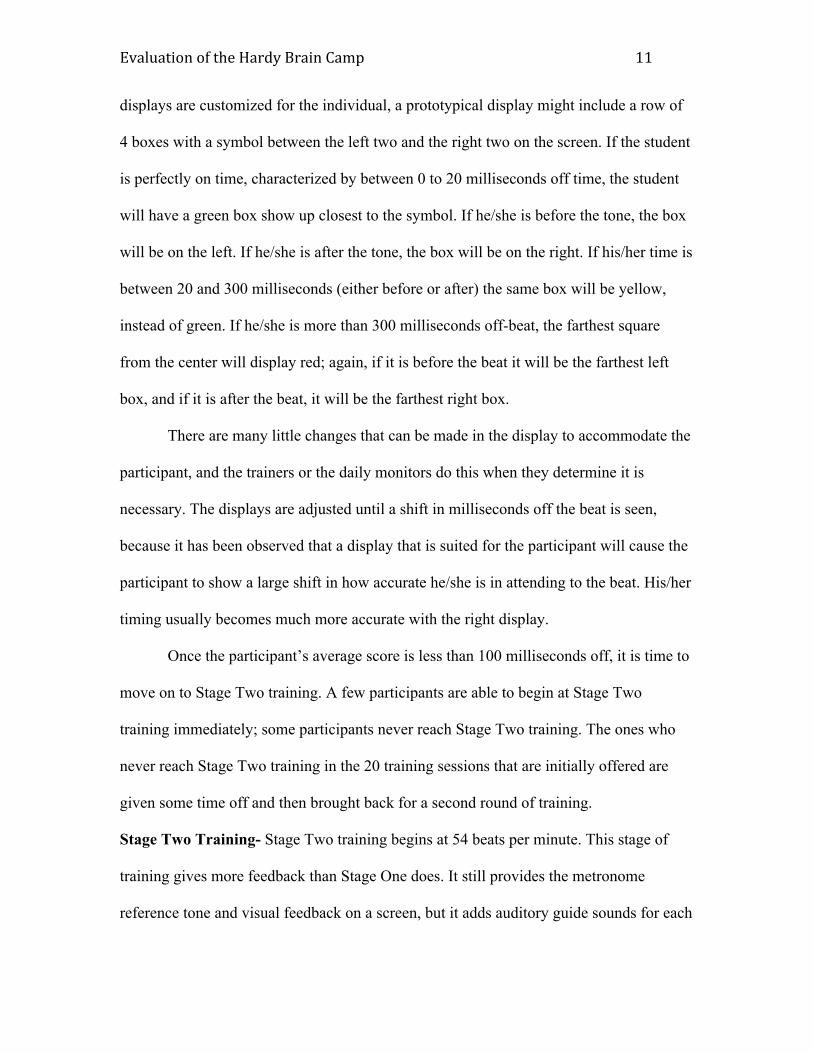
EvaluationoftheHardyBrainCamp11
displays are customized for the individual, a prototypical display might include a row of
4 boxes with a symbol between the left two and the right two on the screen. If the student
is perfectly on time, characterized by between 0 to 20 milliseconds off time, the student
will have a green box show up closest to the symbol. If he/she is before the tone, the box
will be on the left. If he/she is after the tone, the box will be on the right. If his/her time is
between 20 and 300 milliseconds (either before or after) the same box will be yellow,
instead of green. If he/she is more than 300 milliseconds off-beat, the farthest square
from the center will display red; again, if it is before the beat it will be the farthest left
box, and if it is after the beat, it will be the farthest right box.
There are many little changes that can be made in the display to accommodate the
participant, and the trainers or the daily monitors do this when they determine it is
necessary. The displays are adjusted until a shift in milliseconds off the beat is seen,
because it has been observed that a display that is suited for the participant will cause the
participant to show a large shift in how accurate he/she is in attending to the beat. His/her
timing usually becomes much more accurate with the right display.
Once the participant’s average score is less than 100 milliseconds off, it is time to
move on to Stage Two training. A few participants are able to begin at Stage Two
training immediately; some participants never reach Stage Two training. The ones who
never reach Stage Two training in the 20 training sessions that are initially offered are
given some time off and then brought back for a second round of training.
Stage Two Training- Stage Two training begins at 54 beats per minute. This stage of
training gives more feedback than Stage One does. It still provides the metronome
reference tone and visual feedback on a screen, but it adds auditory guide sounds for each
EvaluationoftheHardyBrainCamp12
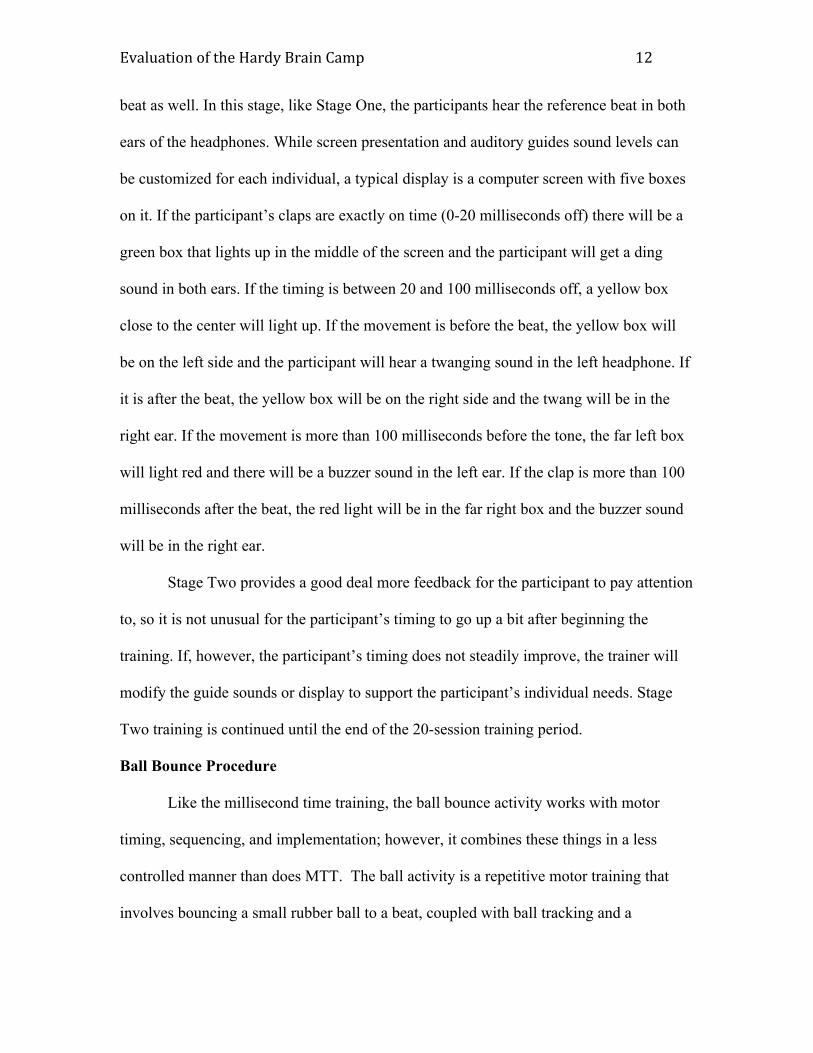
beat as well. In this stage, like Stage One, the participants hear the reference beat in both
ears of the headphones. While screen presentation and auditory guides sound levels can
be customized for each individual, a typical display is a computer screen with five boxes
on it. If the participant’s claps are exactly on time (0-20 milliseconds off) there will be a
green box that lights up in the middle of the screen and the participant will get a ding
sound in both ears. If the timing is between 20 and 100 milliseconds off, a yellow box
close to the center will light up. If the movement is before the beat, the yellow box will
be on the left side and the participant will hear a twanging sound in the left headphone. If
it is after the beat, the yellow box will be on the right side and the twang will be in the
right ear. If the movement is more than 100 milliseconds before the tone, the far left box
will light red and there will be a buzzer sound in the left ear. If the clap is more than 100
milliseconds after the beat, the red light will be in the far right box and the buzzer sound
will be in the right ear.
Stage Two provides a good deal more feedback for the participant to pay attention
to, so it is not unusual for the participant’s timing to go up a bit after beginning the
training. If, however, the participant’s timing does not steadily improve, the trainer will
modify the guide sounds or display to support the participant’s individual needs. Stage
Two training is continued until the end of the 20-session training period.
Ball Bounce Procedure
Like the millisecond time training, the ball bounce activity works with motor
timing, sequencing, and implementation; however, it combines these things in a less
controlled manner than does MTT. The ball activity is a repetitive motor training that
involves bouncing a small rubber ball to a beat, coupled with ball tracking and a
EvaluationoftheHardyBrainCamp13
concurrent cognitive task of skip counting. This activity includes eye/hand coordination,
motor information about how much force to use, rhythm, and bilateral integration in ways
that MTT does not. These differences are intended to create improvements or changes
that the MTT alone cannot promote. By including repetitive skip counting in the ball
bounce practice, the neural connections between motor activities and cognitive processes
are intentionally being stimulated and strengthened.
The ball bounce activity is practiced as a group. Each day, when the group has
finished MTT, all ten students go to the blacktop outside and perform a patterned
practice. Using a beat provided by the trainer, the students recite a skip counting, such as
6, 12, 18, 24, 30, 36, etc., out loud as they perform certain movements. First they bounce
the ball with their dominant hands. They go through the number sequence from 6 to 60
while bouncing with their dominant hand three times. Throughout these repetitions, they
are calling out the number sequence in time with one another to the beat provided by the
trainer.
After they bounce with their dominant hands through three repetitions,
participants will hold still and move the ball in front of their bodies at eye level while
following the ball with their eyes and reciting the number sequence. They repeat this
movement through three number sequences as well. Three sequences with their non-
dominant hand follow. Next, they perform a single sequence, writing the numbers with
their left feet, and then a sequence writing the numbers with their right feet. They
perform three sequences across their midlines—bouncing the ball from their left hands to
their right hands. Finally, there are three sequences in which they write all of the numbers
EvaluationoftheHardyBrainCamp14
in the air with both of their hands simultaneously. In total, this practice takes about 10
minutes to complete.
Each participant is expected to practice 6’s, 7’s, 8’s and 9’s over the scope of the
20 training sessions. If a student misses a training session and is behind on repetitions,
the child will participate in the regular pattern practice with the group and then make up
any missed pattern practice afterwards. In total, each child is expected to have practiced
with each of the four numbers 5 times a week for a total of 50 minutes per number
sequence. This is a grand total of 200 minutes of ball bounce training in the 20 session
training period.
Method
Participants- This study was conducted with 62 students in the Boys and Girls Club at a
southern Californian elementary school. The school served close to 500 students between
kindergarten and fifth grade. At the time of the study, the school was 96% Latino in
constituency and had about 86% of its students receiving free lunches. The school had
230 students from third through fifth grade, the grades targeted for this evaluation. The
Boys and Girls Club had about 180 students in its afterschool program, from which the
study’s participants were selected. With 62 students selected for this study, a large
percentage of the population of the Boys and Girls Club was included in this study.
The majority of the students in this study were selected for inclusion based on
Boys and Girls Club staff and/or teacher referral. Thus, children with learning, attention,
and/or behavioral problems were more likely to be referred and included in the study.
The difficulties mentioned were not necessarily documented or tested for by the school,
rather they were observation and experience-based referrals. Although most of these
EvaluationoftheHardyBrainCamp15
students were recommended for this training, some un-referred Boys and Girls Club
members were included to increase the number of youth in the study; these youth were
not necessarily observed to have any learning or behavior difficulties. A list of students
whose parents had consented to the program was created. Once consent forms were
returned, these students were randomly assigned to experimental groups. While we would
have preferred to have larger group sizes, available students and time constraints related
to training group size limited the size of our study.
These 62 students were randomly distributed into 3 groups: a control group (n =
21), an MTT group (MTT) ( n = 21), and an MTT plus a ball activity group (MTT and
Ball) (n = 20). As age was possibly a factor in this analysis, we took the pre-test age (in
months) and the post-test age and averaged them to give us an average age for analysis.
When ages across groups were examined, there were two outliers, one almost 15 months
older than the next oldest participant and one almost 10 months younger than the next
youngest participant. Given that both the tests and the training have important age-
dependent aspects, after careful consideration, these two outliers were excluded from
analysis. They were both in the MTT group. Furthermore, one child from the MTT and
Ball group attended the pretest, but never attended the training or the posttest. He was
also excluded from analysis. This reduced the MTT and the MTT and Ball group sizes to
19 participants each for analysis.
Members, Gender, and Age- The control group had 21 members. There were 12 boys
and nine girls. They had an average age of 117.38 months, or about 9 years, 9.38 months.
When averaged, their grade level was 4th grade. The MTT group had 19 members. This
group had 14 boys and five girls in the group. They had an average age of 114.5 months,
EvaluationoftheHardyBrainCamp16
or about 9 years, 6.5 months. They had an average grade level of 3.89. The MTT and Ball
group had 19 members. There were eight male and 11 females in the group. This group
had an average age of 121 months, or 10 years, 1 month. They had an average grade level
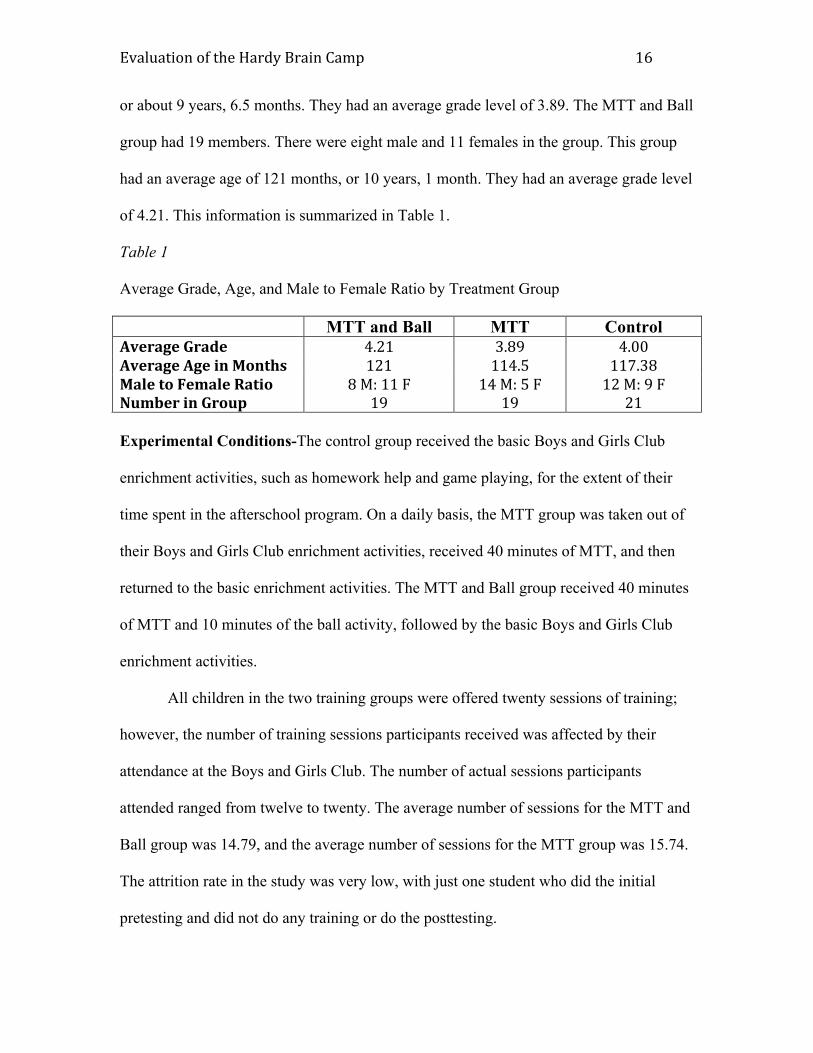
of 4.21. This information is summarized in Table 1.
Table 1
Average Grade, Age, and Male to Female Ratio by Treatment Group
MTT and Ball MTT ControlAverageGrade 4.21 3.89 4.00AverageAgeinMonths 121 114.5 117.38MaletoFemaleRatio 8M:11F 14M:5F 12M:9FNumberinGroup 19 19 21 Experimental Conditions-The control group received the basic Boys and Girls Club
enrichment activities, such as homework help and game playing, for the extent of their
time spent in the afterschool program. On a daily basis, the MTT group was taken out of
their Boys and Girls Club enrichment activities, received 40 minutes of MTT, and then
returned to the basic enrichment activities. The MTT and Ball group received 40 minutes
of MTT and 10 minutes of the ball activity, followed by the basic Boys and Girls Club
enrichment activities.
All children in the two training groups were offered twenty sessions of training;
however, the number of training sessions participants received was affected by their
attendance at the Boys and Girls Club. The number of actual sessions participants
attended ranged from twelve to twenty. The average number of sessions for the MTT and
Ball group was 14.79, and the average number of sessions for the MTT group was 15.74.
The attrition rate in the study was very low, with just one student who did the initial
pretesting and did not do any training or do the posttesting.
EvaluationoftheHardyBrainCamp17
Description of Trainers- There were two trainers who worked with the study
participants. The primary trainer was a female in her mid-twenties, who worked for the
Boys and Girls Club and had been conducting Hardy Braining Training for
approximately two years. She had also been through 20 sessions of the MTT training
herself. She was very comfortable with the Hardy Brain Training Programs and would
often help participants with kinesthetic guidance, verbal support, and display changes in
accordance with the daily off-site monitoring. In the MTT and Ball group, she was the
trainer who provided the beat for the ball bounce activity and led the group repetition.
The second trainer was a high school student who worked for the Boys and Girls
Club. This study was his first extended period working with the Hardy Brain Training
Programs. He was often sent to retrieve participants and do organizational tasks, but also
provided participants with kinesthetic guidance and verbal support.
Sherrie Hardy regularly came and observed the training and offered her expertise
during the training. She was observed to change displays, guide participants, and praise
students for their improvement. She provided verbal support and explanations of the
training to the participants.
Testing Procedures- Four measures were used to assess participants in this evaluation:
two from the Woodcock-Johnson III NU Tests of Cognitive Abilities: the Decision Speed
Test and the Visual Matching Test (these tests were averaged together to give a measure
of processing speed), and two tests from the Woodcock-Johnson III Tests of
Achievement: the Reading Fluency Test and the Math Fluency Test.
The Visual Matching measure looks at cognitive efficiency—the speed at which
an individual can discriminate visual symbols. The participant is asked to locate and
EvaluationoftheHardyBrainCamp18
circle two identical numbers from a row of six numbers. The difficulty of this task
increases throughout the measure. It begins with single digit numbers and increases to
triple digit numbers. This test has a three-minute time limit. The Decision Speed test
measures how quickly a participant can identify two conceptually related pictures from a
row of seven images. A hypothetical example similar to the test would be selecting a
football helmet and a top hat from a row that also includes a star, a door, a pen, a duck,
and a piano. Participants are also given three minutes to complete this test. These two
tests are averaged together to give a processing speed score. This is a cognitive measure.
In the Reading Fluency measure, participants must read through simple sentences
and decide if the sentence is true, and circle yes, or false, and circle no. This test has a
three-minute time limit. In the Math Fluency measure, the participant is given a series of
simple arithmetic problems to complete. There are addition, subtraction, and
multiplication problems. The addition problems are at the beginning of the measure,
followed by subtraction, then multiplication. This test also has a three-minute time limit.
All four of these tests were administered prior to the training period and again re-
administered to all groups after this period. These tests gave us before and after scores of
processing speed, reading fluency, and math fluency for each group. The “before” scores
were subtracted from the “after” scores to give a difference. This difference was seen as
the change in participants over the period of time of the study.
Sherrie Hardy, with an M.A. in Marital and Family Therapy, personally
administered all the tests with the help of one or two test monitors. The tests were
conducted in groups, with students seated at tables a few seats apart from each other. For
each test, the instructions were reviewed together, and any practice problems were gone
EvaluationoftheHardyBrainCamp19
over. All of these tests were timed tests. The students held their pencils up until they were
given the start signal, and all pencils were removed from the paper exactly on the stop
signal. Occasionally the students would finish the entire test, but, more often than not,
they stopped on the signal instead of at the end of the test. All ages were given the same
version of the test.
Woodcock-Johnson Scores- Woodcock-Johnson scores were recorded as a raw form, an
age equivalent (AE) score, grade equivalent (GE) score, a standardized form (W), and a
normed standard score (SS). This analysis uses the normed standard score (SS). The age
and grade equivalent scores would have been easier to interpret; however, those scores
are not standardized and so could not be used for statistical analysis. For reporting
purposes, W mean scores were converted back to age and grade equivalent scores and the
statistically analyzed SS are given. The conversion of W scores to age and grade
equivalent scores was done by one of the test authors, Kevin McGrew.
Results
The results explained are reported in a non-technical manner here in the main
body of this report; a more complete statistical analysis is presented in the technical
appendix. Our statistical analysis was run using the normed, standardized scores (SS) for
each test. Our W mean scores were also converted into age (AE) and grade equivalents
(GE) to ease understanding of what these differences mean. All three sets of data will be
discussed here. For each measure we looked at the effects of training—the MTT and
MTT and Ball groups combined—compared to the control group, and the effects of the
three treatment groups separately.
EvaluationoftheHardyBrainCamp20
SS are averaged using 100 as the average score, with an average standard
deviation of 15. Thus, all of these scores will range around the 100 mark. Age equivalent
scores are based on how participants did compared to others their age. For each treatment
group, the average age and the average scores were used to calculate the AE. Then the
pretest AE was subtracted from the posttest AE to show change in scores. Thus, an age
equivalent improvement of 12 months suggests the group’s average score reflected 12
months of improvement over the 20-session training period. The grade equivalent score is
similar to the age equivalent score; however, it is based on a ten-month school year. If a
group had a grade equivalent improvement of 1.2 it would suggest that the average score
reflects 12 school months of improvement over the 20-session training period.
Differences in Processing Speed- To begin, we analyzed the SS difference for groups
with training versus the groups with no training in processing speed. We used t tests to
compare these differences. On average, those with training had a 16.59 point increase in
standard score, a 2.2 GE improvement, and a 2 year, 1 month AE improvement. Those
without training had a 7.47 point increase in SS, a .9 grade GE, and an 11.5 month AE
improvement. The difference between receiving training and not receiving training was
statistically significant and was considered a moderate effect on differences in processing
speed. Training improved processing speed scores.
When analyzing differences between the experimental groups in relation to
processing speed, on average the control group had a 7.47 SS point increase in score, the
MTT group had a 12.16 SS point increase in score, and the MTT and Ball group had a 21
SS point increase in score. This difference is statistically significant, with the MTT and
Ball doing significantly better than either the control group or the metronome group.
EvaluationoftheHardyBrainCamp21
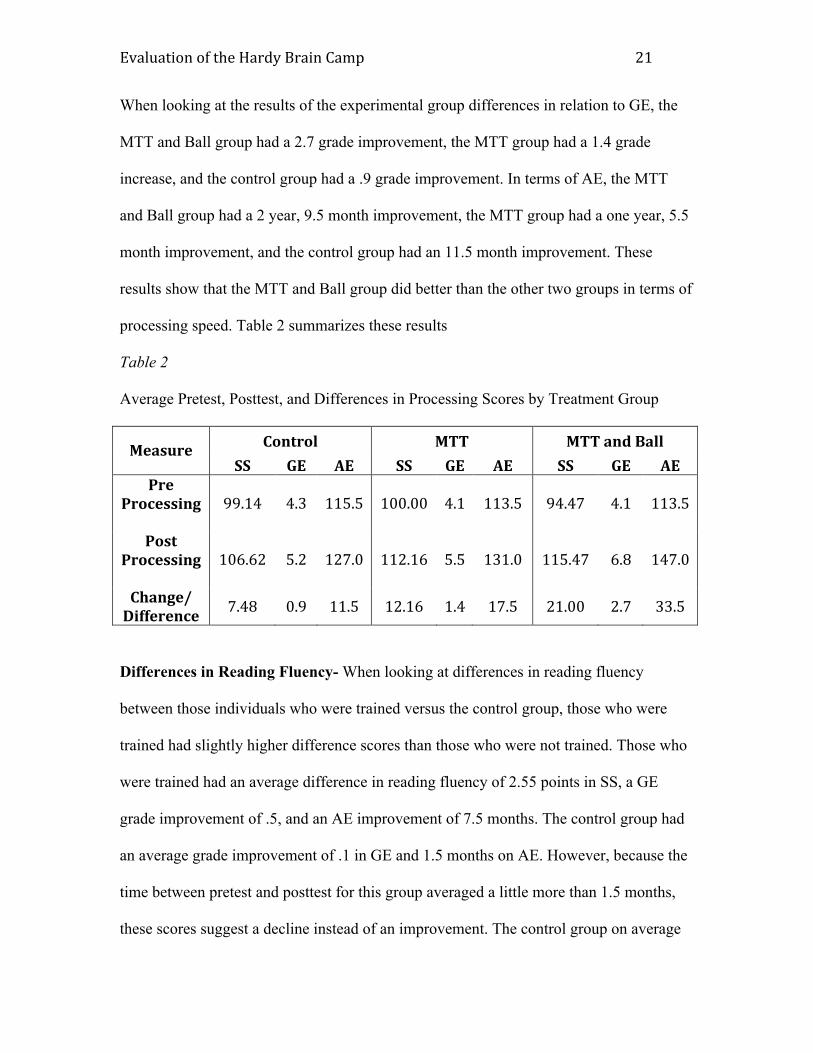
When looking at the results of the experimental group differences in relation to GE, the
MTT and Ball group had a 2.7 grade improvement, the MTT group had a 1.4 grade
increase, and the control group had a .9 grade improvement. In terms of AE, the MTT
and Ball group had a 2 year, 9.5 month improvement, the MTT group had a one year, 5.5
month improvement, and the control group had an 11.5 month improvement. These
results show that the MTT and Ball group did better than the other two groups in terms of
processing speed. Table 2 summarizes these results
Table 2
Average Pretest, Posttest, and Differences in Processing Scores by Treatment Group
Control MTT MTTandBallMeasureSS GE AE SS GE AE SS GE AE
PreProcessing
99.14 4.3 115.5 100.00 4.1 113.5 94.47 4.1 113.5
PostProcessing
106.62 5.2 127.0 112.16 5.5 131.0 115.47 6.8 147.0
Change/Difference
7.48 0.9 11.5 12.16 1.4 17.5 21.00 2.7 33.5
Differences in Reading Fluency- When looking at differences in reading fluency
between those individuals who were trained versus the control group, those who were
trained had slightly higher difference scores than those who were not trained. Those who
were trained had an average difference in reading fluency of 2.55 points in SS, a GE
grade improvement of .5, and an AE improvement of 7.5 months. The control group had
an average grade improvement of .1 in GE and 1.5 months on AE. However, because the
time between pretest and posttest for this group averaged a little more than 1.5 months,
these scores suggest a decline instead of an improvement. The control group on average
EvaluationoftheHardyBrainCamp22
did worse in reading fluency on the posttest. They lost an average of .33 points on the SS
score. These results in both directions are considered small, but reflect statistically
significant differences. Training improved reading scores.
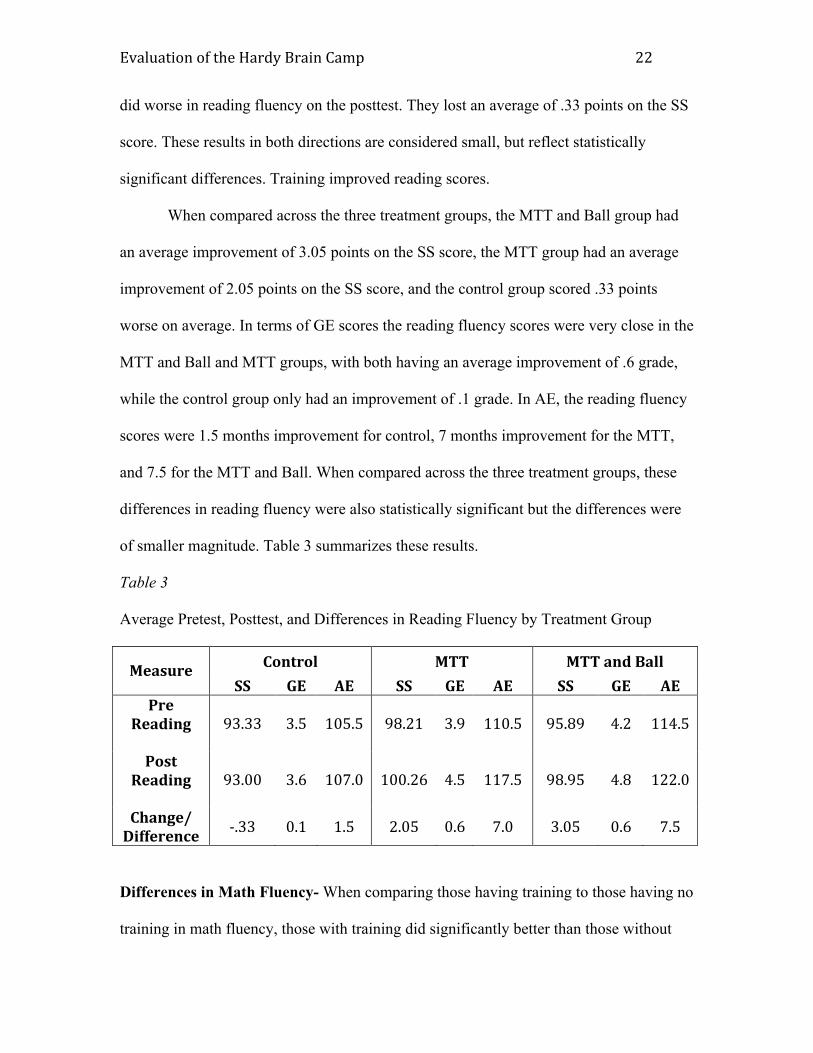
When compared across the three treatment groups, the MTT and Ball group had
an average improvement of 3.05 points on the SS score, the MTT group had an average
improvement of 2.05 points on the SS score, and the control group scored .33 points
worse on average. In terms of GE scores the reading fluency scores were very close in the
MTT and Ball and MTT groups, with both having an average improvement of .6 grade,
while the control group only had an improvement of .1 grade. In AE, the reading fluency
scores were 1.5 months improvement for control, 7 months improvement for the MTT,
and 7.5 for the MTT and Ball. When compared across the three treatment groups, these
differences in reading fluency were also statistically significant but the differences were
of smaller magnitude. Table 3 summarizes these results.
Table 3
Average Pretest, Posttest, and Differences in Reading Fluency by Treatment Group
Control MTT MTTandBallMeasureSS GE AE SS GE AE SS GE AE
PreReading
93.33 3.5 105.5 98.21 3.9 110.5 95.89 4.2 114.5
PostReading
93.00 3.6 107.0 100.26 4.5 117.5 98.95 4.8 122.0
Change/Difference
‐.33 0.1 1.5 2.05 0.6 7.0 3.05 0.6 7.5
Differences in Math Fluency- When comparing those having training to those having no
training in math fluency, those with training did significantly better than those without
EvaluationoftheHardyBrainCamp23
training, although the point differences were small. On average, those with training
improved 6.66 SS points, 1 year, half a month improvement in AE, and a .9 grade
improvement in GE. Those with no training only scored 2.57 SS points better, and had
3.5 months improvement AE and a .3 grade improvement in GE.
When comparing each treatment group and the control, a significant difference
between the groups could be seen in math fluency. The MTT and Ball group had an
average increase in SS scores of 10.11 points, while the MTT group had an average
increase of only 3.21 points, and the control group had an average increase of 2.57 points.
In this case, the MTT group and the control group performed very similarly, whereas the
MTT and Ball group did significantly better than both other groups. This suggests that
the MTT and Ball combination was more successful for math fluency than were the other
two treatment conditions. When looking at grade equivalent scores (GE), the MTT and
Ball group improved an average of 1.5 grades, the MTT group improved an equivalent of
.6 grade, and the control group increased an average of .3 grade. In terms of AE, the MTT
and Ball group improved one year, 7 months, the MTT group improved 8 months, and the
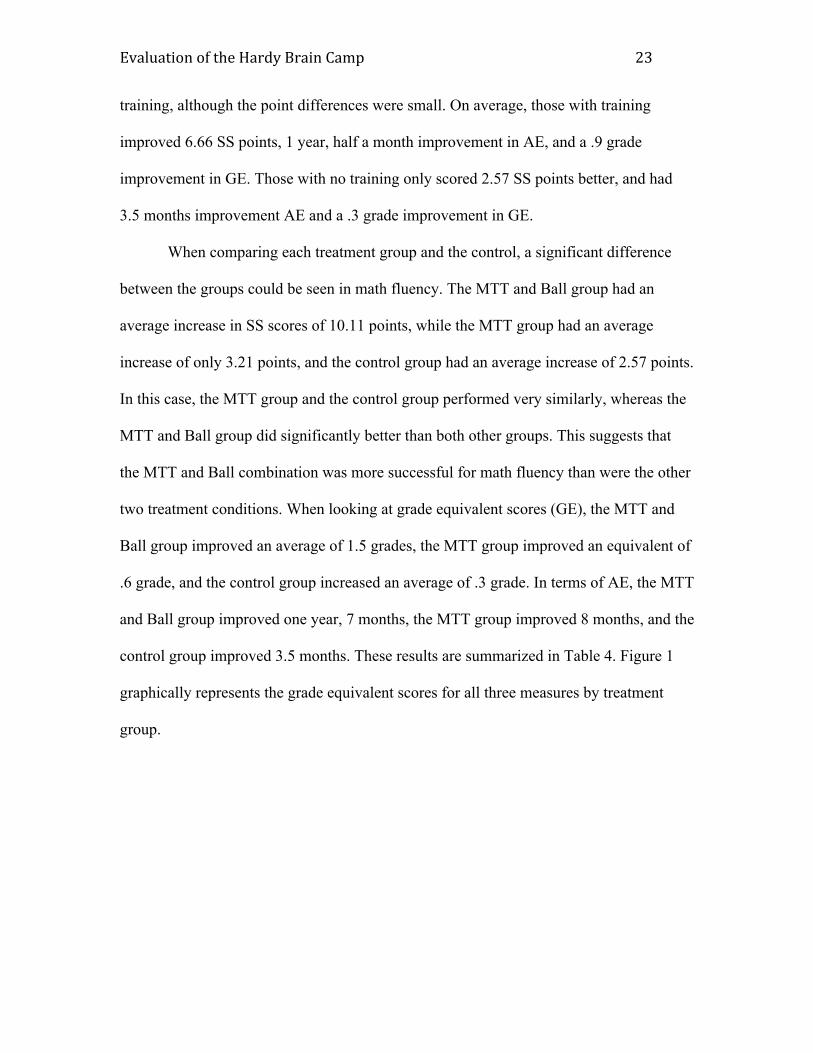
control group improved 3.5 months. These results are summarized in Table 4. Figure 1
graphically represents the grade equivalent scores for all three measures by treatment
group.
EvaluationoftheHardyBrainCamp24
Table 4
Average Pretest, Posttest, and Differences in Math Fluency by Treatment Group
Control MTT MTTandBallMeasureSS GE AE SS GE AE SS GE AE
PreMathFluency
91.00 3.5 106.0 103.11 4.6 120.0 98.11 4.6 119.0
PostMathFluency
93.57 3.8 109.5 106.32 5.2 128.0 108.21 6.1 138.0
Change/Difference
2.57 0.3 3.5 3.21 0.6 8.0 10.10 1.5 19.0
Figure 1. The grade equivalent scores for all three tests, by treatment group.
EvaluationoftheHardyBrainCamp25
Overall Improvements in All Tests- An important question is whether the group
differences were due to some individuals having received more benefit from the training
than others or whether the benefits of the two treatment conditions were found across
most or all of the participants. To assess for this, we ran an exploratory linear regression
using gender, training, and age as possible variables that might affect test scores. If they
affected test scores, they would be linearly related to the final score—someone could
partially predict the participants’ posttest scores from the variable. In all three tests, the
only variable that could be used to predict the posttest scores was the variable of training.
This shows that the other variables did not create a reliable difference in scores. This
allows us to assume age and gender did not affect how much the training benefited these
individuals.
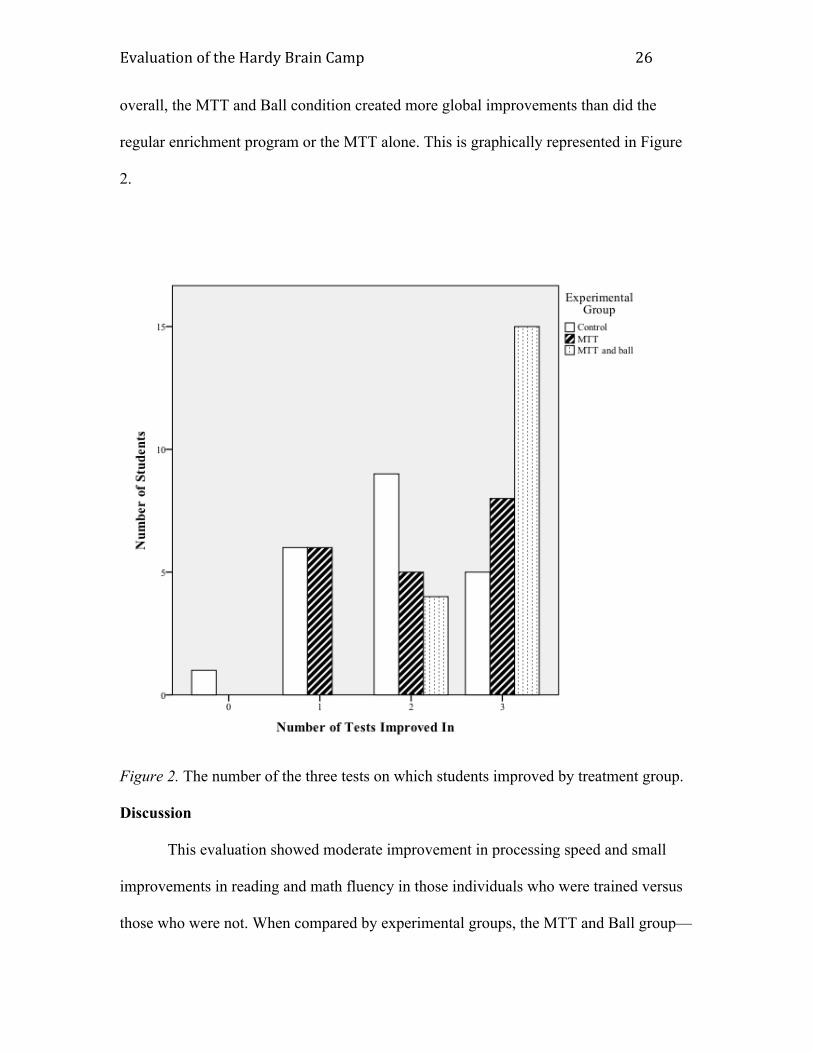
In another examination of the data, we looked at how participants did across all
three tests. The line for improvement was set at zero. If the participant was seen to have
scored a higher SS on the posttest than the pretest, the participant was said to have
improved. When analyzing improvement over zero across the three measures, there were
patterns that emerged in overall score changes. In the control group, there was one
individual who did not improve on any of the three tests: his/her score was always
negative or zero. Six individuals in the MTT group and six individuals in the control
group improved on only one test. Nine individuals in the control group, five individuals
in the MTT group, and four individuals in the MTT and Ball group improved on two of
three tests. Five individuals in the control group, eight individuals in the MTT group, and
15 individuals in the MTT and Ball group improved in all three tests. This suggests that,
EvaluationoftheHardyBrainCamp26
overall, the MTT and Ball condition created more global improvements than did the
regular enrichment program or the MTT alone. This is graphically represented in Figure
2.
Figure 2. The number of the three tests on which students improved by treatment group.
Discussion
This evaluation showed moderate improvement in processing speed and small
improvements in reading and math fluency in those individuals who were trained versus
those who were not. When compared by experimental groups, the MTT and Ball group—
EvaluationoftheHardyBrainCamp27
which is the Hardy Brain Camp—improved students in all three measures more than the
basic Boys and Girls Club enrichment or the millisecond timing training alone did. These
findings are promising, but they do come with some caveats.
Sample Size- The sample size in the evaluation was small. With bigger samples,
statistical analyses of differences are more robust. More research should be conducted
with larger samples to gain stronger evidence of actual differences caused by various
interventions associated with Hardy Brain Camp.
Measures- In this evaluation, we used processing speed, reading fluency, and math
fluency as measures of student improvement in cognitive functioning and academic
achievement. These measures do not directly relate to measures of academic achievement
as measured by the schools, such as state-implemented standardized tests. For this reason,
while the changes in these attributes were statistically significant, we cannot make claims
about the direct academic benefits of any of these measures based upon the design of this
evaluation.
Longevity- In this study, a pretest was given before training, and a posttest given after
training. The changes we were measuring were immediate. This evaluation can make no
statements about the long-term benefits of the Hardy Brain Training Program or of MTT.
Further research would need to be conducted to assess for this.
Conclusion
The questions that were considered by this evaluation and the answers that can be
supported by statistical analyses of measured results are:
EvaluationoftheHardyBrainCamp28
1) Does the Hardy Brain Camp improve processing speeds, suggesting an
improvement of motor integration and timing for a general population such as that
found in the Boys and Girls Club?
The evidence from our analyses does suggest that the Hardy Brain Camp
improves processing speeds, with the MTT and Ball training group improving
more than other treatment groups.
2) Are there improvements in achievement measures such as reading fluency and
math fluency in the students that have done the Hardy Brain Camp?
The evidence from our analyses does show small improvements in both
reading fluency and math fluency using the Hardy Brain Camp, with the MTT and
Ball training group improving more than the other treatment groups.
3) Are improvements greater for participants who have both MTT and ball activity
training, or does the MTT alone give the same level of improvement?
The evidence from our analyses does show that there are greater
improvements from the Hardy Brain Camp than from only a MTT program,
especially for processing speed and math fluency. The differences in reading
fluency were found to be similar with the MTT and MTT and Ball groups.
Overall, though, participants in the Hardy Brain Camp group performed better on
more tests than did the participants in other treatment groups.
4) Are there identifiable trends that suggest that certain subgroups are more likely to
improve with the Hardy Brain Camp, such as age groups or gender groups, or
does the training seem to benefit children more broadly within treatment groups?
EvaluationoftheHardyBrainCamp29
The evidence from our analyses did not show improvement benefits
related to age or gender. None of these factors were linearly related to score
changes in processing speed, reading fluency, or math fluency. The only factor
that linearly related to improvement on the measures was having training. In
addition, more children showed improvement on all three measures in the Hardy
Brain Camp than in the other two groups.
EvaluationoftheHardyBrainCamp30
References
Brier, J.I., Fletcher, J.M., Foorman, B.R., Klaas, P., & Gray, L.C. (2003). Auditory
temporal processing in children with specific reading disability with and without
attention deficit/hyperactivity disorder. Journal of Speech, Language, and Hearing
Research, 46, 31-42
Leisman, G., & Melillo, R. (2010) Effects of motor sequence training on attentional
performance in ADHD children. International Journal on Disability and Human
Development, 9, 4, 275–282.
Shaffer, R. J., Jacokes, L. E., Cassily, J. F., Greenspan, S. I., Tuchman, R. F., & Steemer,
P. J. Jr. (2001). Effect of interactive metronome training on children with ADHD.
American Journal of Occupational Therapy, 55, 155-162.
Sommer, M., & Rönnqvist, L. (2009). Improved motor-timing: effects of synchronized
metronome training on golf shot accuracy. Journal of Sports Science and Medicine, 8,
648-656.
Taub, G.E., McGrew, K.S., & Keith, T.Z. (2007) Improvements in interval time tracking
and effects on reading achievement. Psychology in the Schools, 44, 849-863.
EvaluationoftheHardyBrainCamp31
Willingham, D.B. (1999) The neural basis of motor-skill learning, American
Psychological Association, 8, 6, 178-182.
Technical Appendix
All statistical analysis was conducted using SPSS 19 for Macs.
Initial Analysis
The purpose of this evaluation was to determine if there was a significant mean
score difference in the three dependent variables in relation to the independent variable of
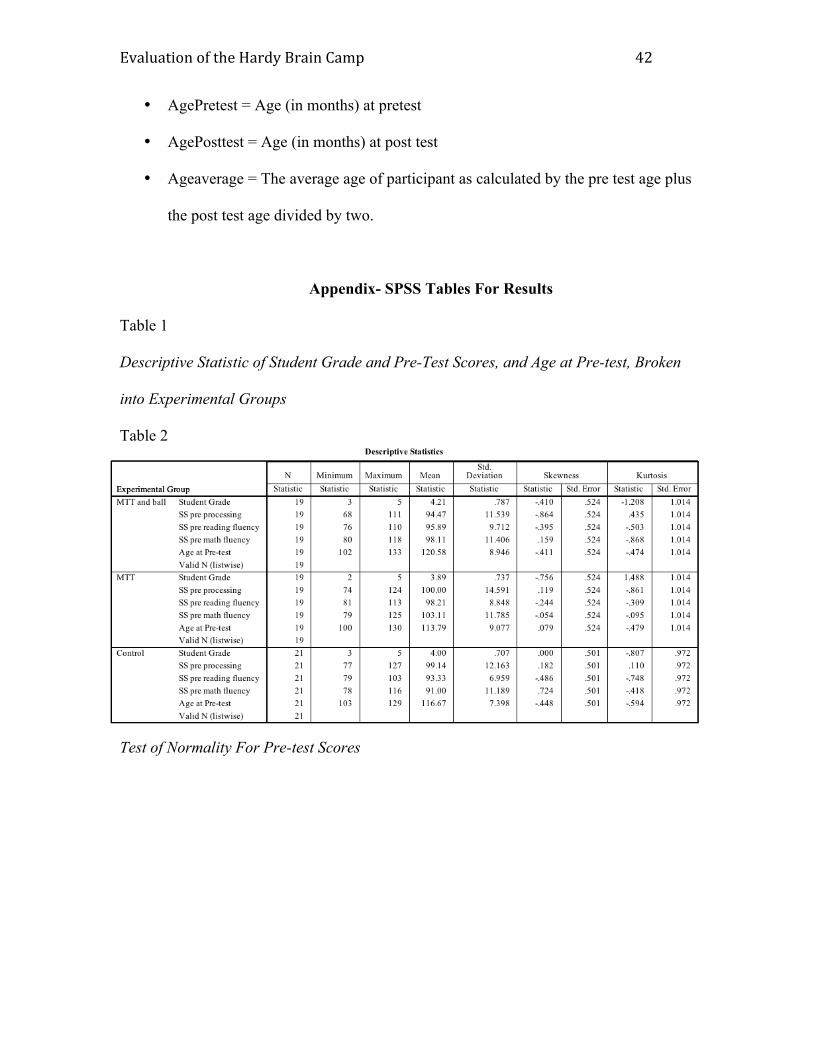
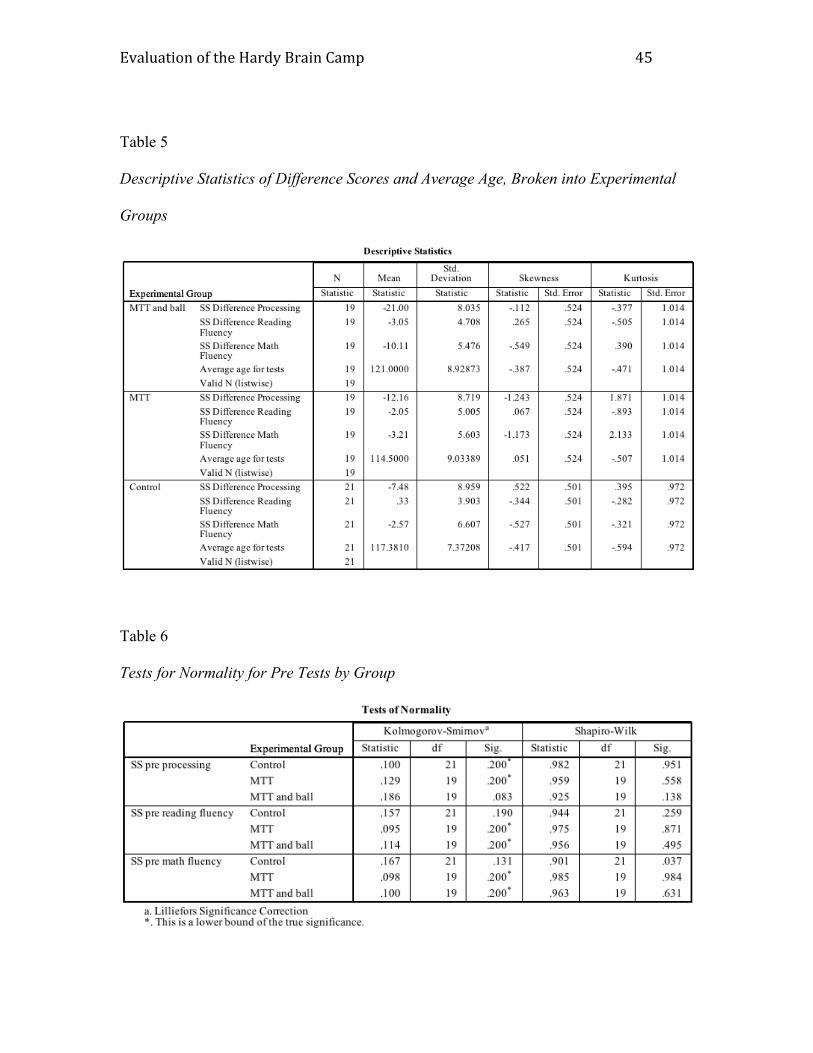
experimental condition. Analysis began by checking descriptive statistics of the primary
variables. The descriptives are summarized in Table 1. For all three variables, the pre-
test scores are considered to be normally distributed. For this reason, group comparison t
tests were run on the difference between pre test and post test for all three dependent
variables to compare metronome training versus no training. This was looked at to
analyze the research question: after groups were split into training groups, did training
make a statistical difference in how well the students did in all three measures?
The next research question was did the type of training significantly matter in in
terms of the difference between pre and post scores? For this analysis three one-way
ANOVAS were run, factored by experimental group: control, MTT, and MTT and Ball.
Results of Initial Analysis
Three independent samples t tests were performed to assess whether processing
speed, reading fluency, and math fluency differed significantly for the 21 participants
who had no MTT training (control group) compared with the 38 participants who had
EvaluationoftheHardyBrainCamp32
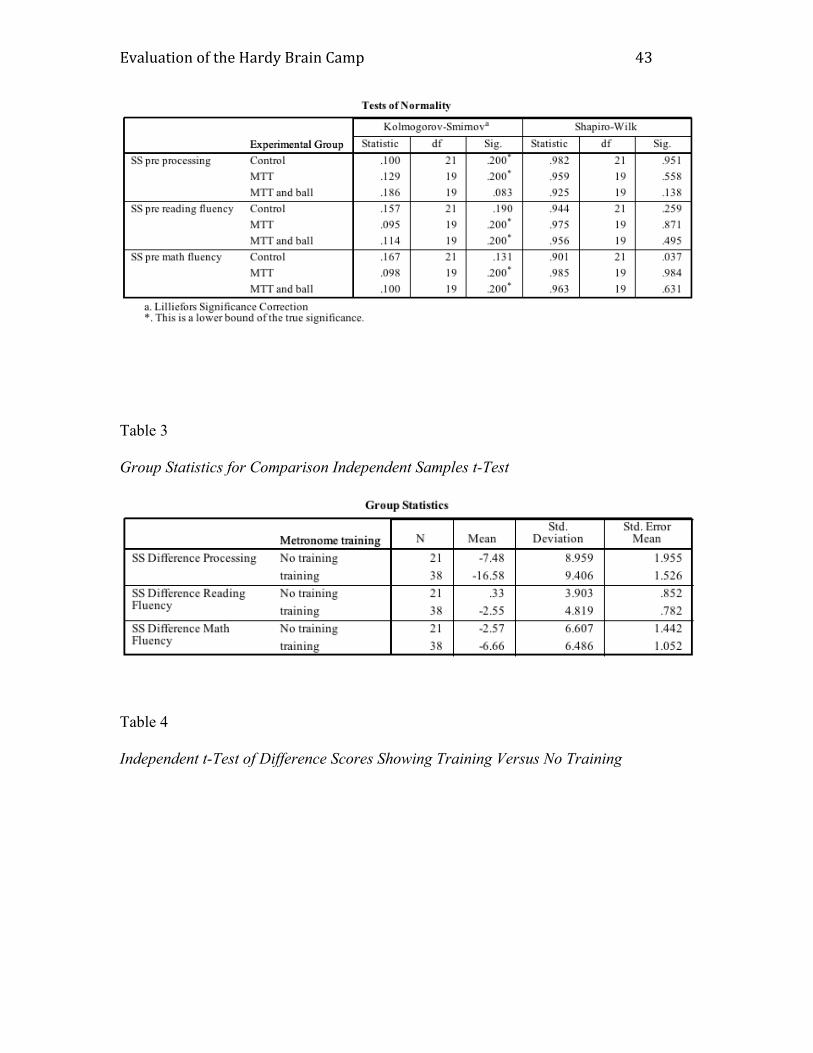
practiced MTT. Preliminary data screening indicated that scores on processing speed,
reading fluency, and math fluency were normally distributed. The tests of normality are
found in Table 2.
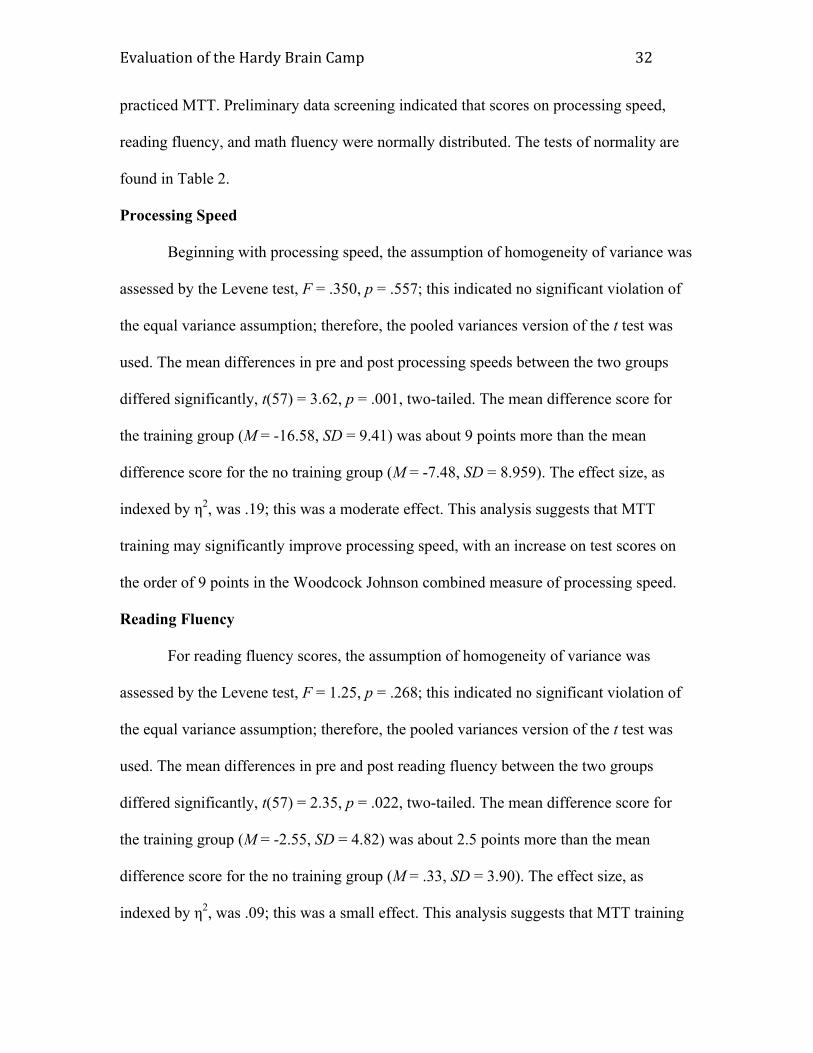
Processing Speed
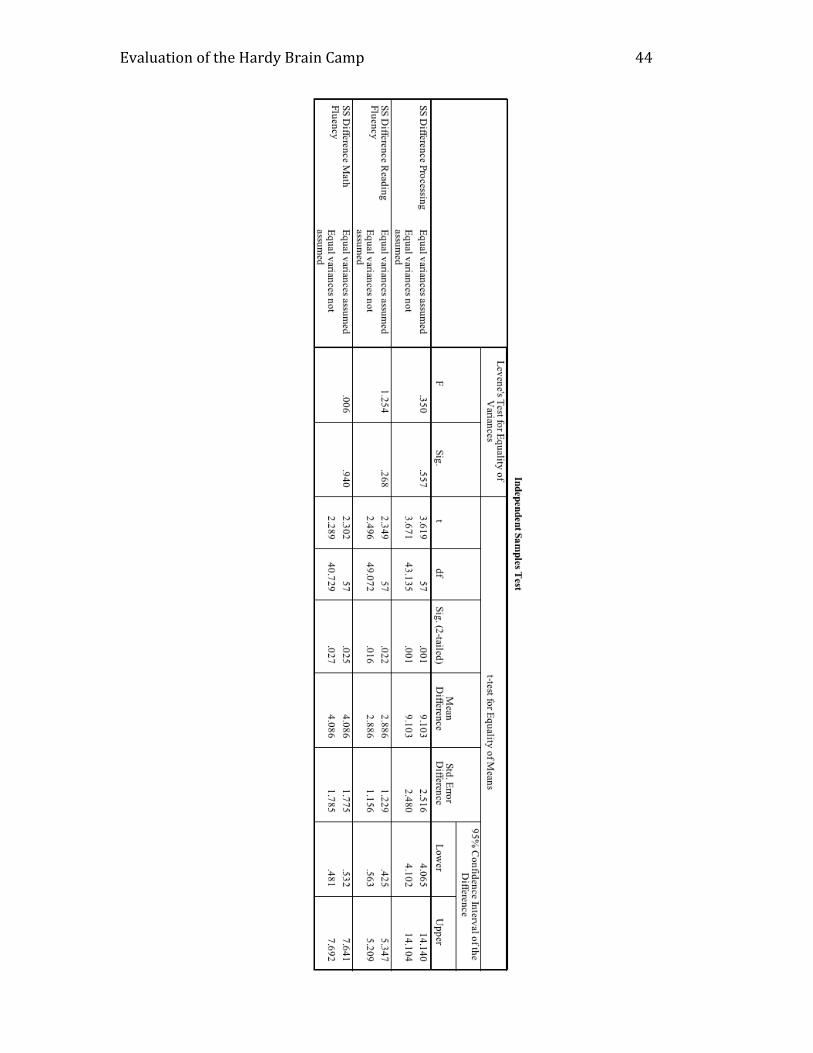
Beginning with processing speed, the assumption of homogeneity of variance was
assessed by the Levene test, F = .350, p = .557; this indicated no significant violation of
the equal variance assumption; therefore, the pooled variances version of the t test was
used. The mean differences in pre and post processing speeds between the two groups
differed significantly, t(57) = 3.62, p = .001, two-tailed. The mean difference score for
the training group (M = -16.58, SD = 9.41) was about 9 points more than the mean
difference score for the no training group (M = -7.48, SD = 8.959). The effect size, as
indexed by η2, was .19; this was a moderate effect. This analysis suggests that MTT
training may significantly improve processing speed, with an increase on test scores on
the order of 9 points in the Woodcock Johnson combined measure of processing speed.
Reading Fluency
For reading fluency scores, the assumption of homogeneity of variance was
assessed by the Levene test, F = 1.25, p = .268; this indicated no significant violation of
the equal variance assumption; therefore, the pooled variances version of the t test was
used. The mean differences in pre and post reading fluency between the two groups
differed significantly, t(57) = 2.35, p = .022, two-tailed. The mean difference score for
the training group (M = -2.55, SD = 4.82) was about 2.5 points more than the mean
difference score for the no training group (M = .33, SD = 3.90). The effect size, as
indexed by η2, was .09; this was a small effect. This analysis suggests that MTT training
EvaluationoftheHardyBrainCamp33
may significantly improve reading fluency, with an increase on test scores on the order of
2.5 points in the Woodcock Johnson reading fluency test.
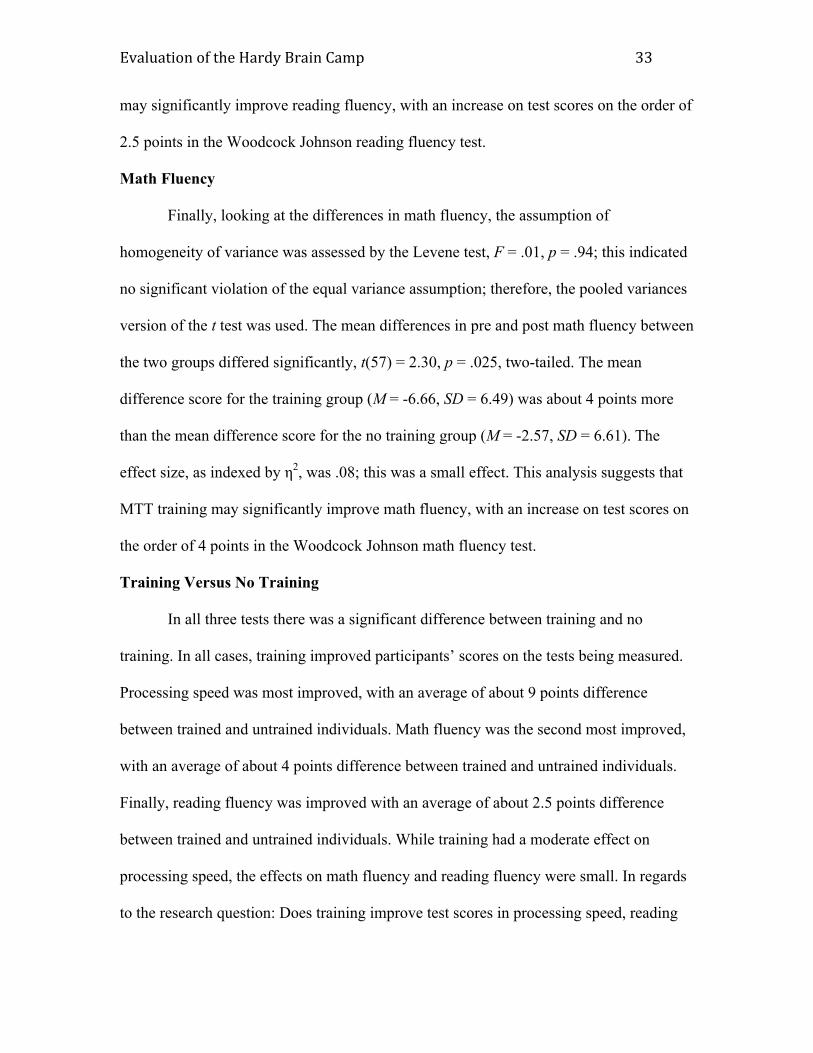
Math Fluency
Finally, looking at the differences in math fluency, the assumption of
homogeneity of variance was assessed by the Levene test, F = .01, p = .94; this indicated
no significant violation of the equal variance assumption; therefore, the pooled variances
version of the t test was used. The mean differences in pre and post math fluency between
the two groups differed significantly, t(57) = 2.30, p = .025, two-tailed. The mean
difference score for the training group (M = -6.66, SD = 6.49) was about 4 points more
than the mean difference score for the no training group (M = -2.57, SD = 6.61). The
effect size, as indexed by η2, was .08; this was a small effect. This analysis suggests that
MTT training may significantly improve math fluency, with an increase on test scores on
the order of 4 points in the Woodcock Johnson math fluency test.
Training Versus No Training
In all three tests there was a significant difference between training and no
training. In all cases, training improved participants’ scores on the tests being measured.
Processing speed was most improved, with an average of about 9 points difference
between trained and untrained individuals. Math fluency was the second most improved,
with an average of about 4 points difference between trained and untrained individuals.
Finally, reading fluency was improved with an average of about 2.5 points difference
between trained and untrained individuals. While training had a moderate effect on
processing speed, the effects on math fluency and reading fluency were small. In regards
to the research question: Does training improve test scores in processing speed, reading
EvaluationoftheHardyBrainCamp34
fluency, and math fluency, this analysis suggests that training does improve test scores in
these areas. These results are summarized in Table 3 and Table 4.
One-Way ANOVAs By Group
Three one-way ANOVAs were performed to assess whether differences in
processing speed, reading fluency scores, and math fluency scores could be predicted
from experimental group: control, MTT, or MTT and Ball. Based on the Hardy Brain
Training Program’s hypotheses, MTT and Ball would create the most improvement in
test scores, MTT the second most, and the control group would only have the average
change brought about by development. Tables 5 through 8 show the assumptions of the
ANOVAs. The results of these one-way ANOVAs are summarized in Table 9 and the
post hoc tests are shown in Table 10.
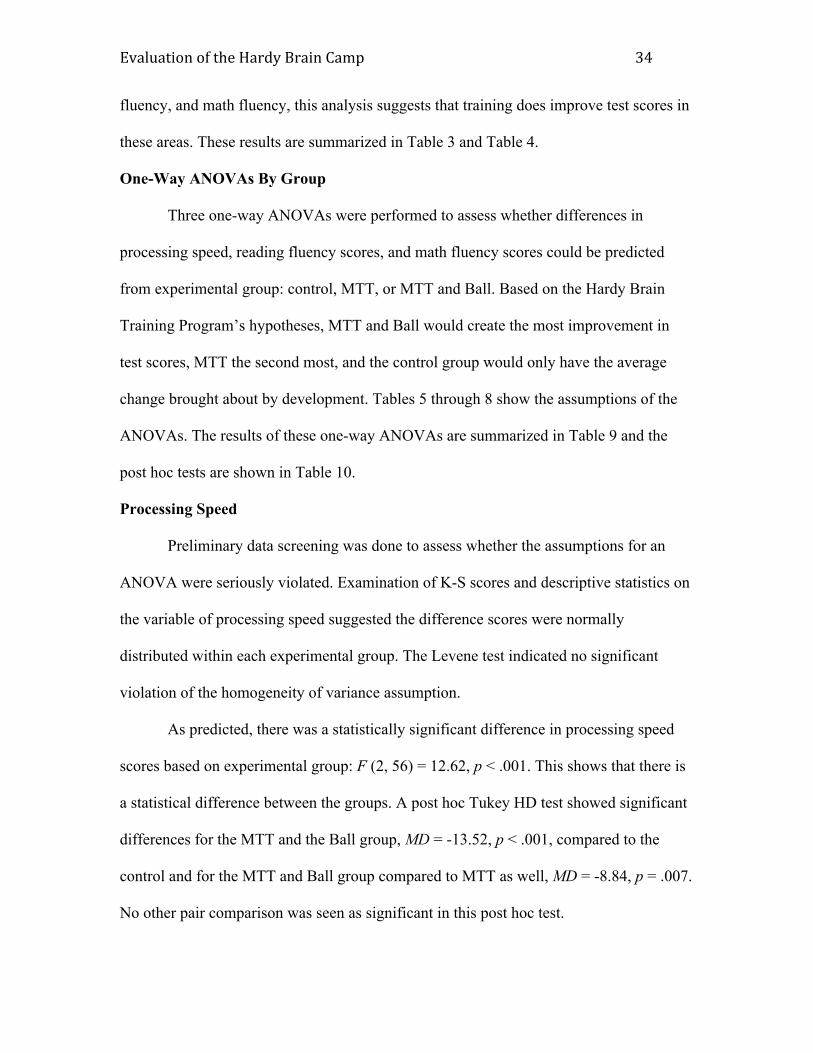
Processing Speed
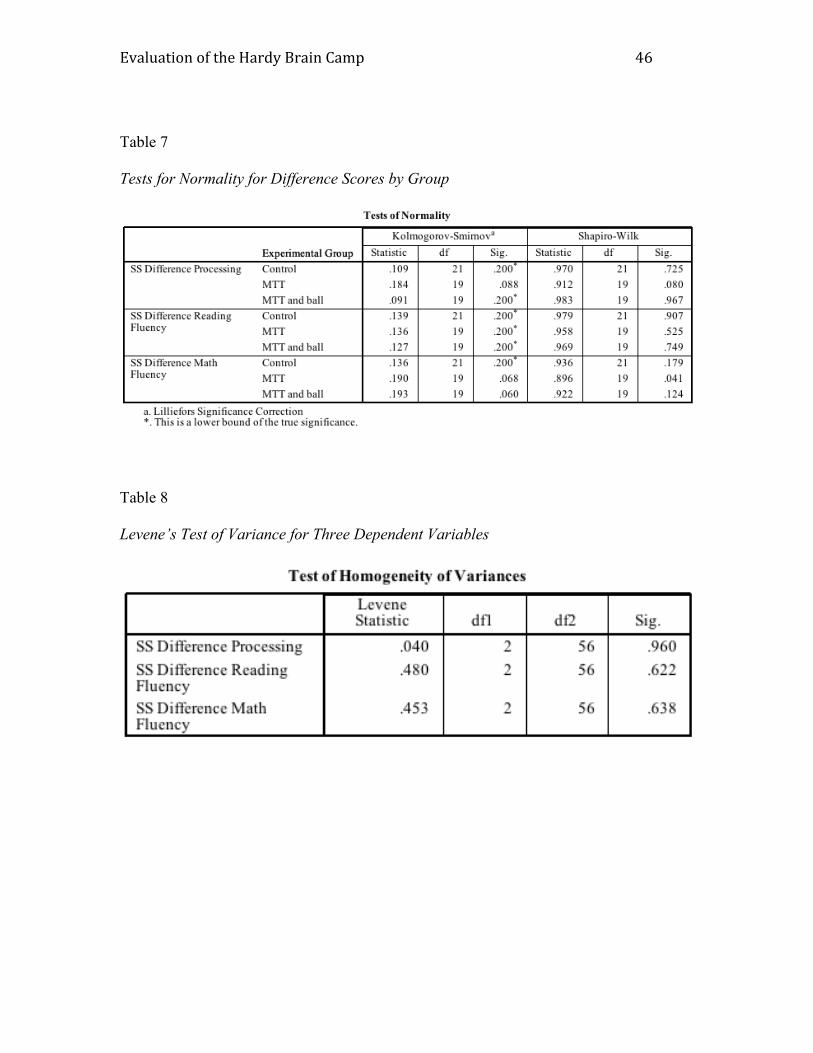
Preliminary data screening was done to assess whether the assumptions for an
ANOVA were seriously violated. Examination of K-S scores and descriptive statistics on
the variable of processing speed suggested the difference scores were normally
distributed within each experimental group. The Levene test indicated no significant
violation of the homogeneity of variance assumption.
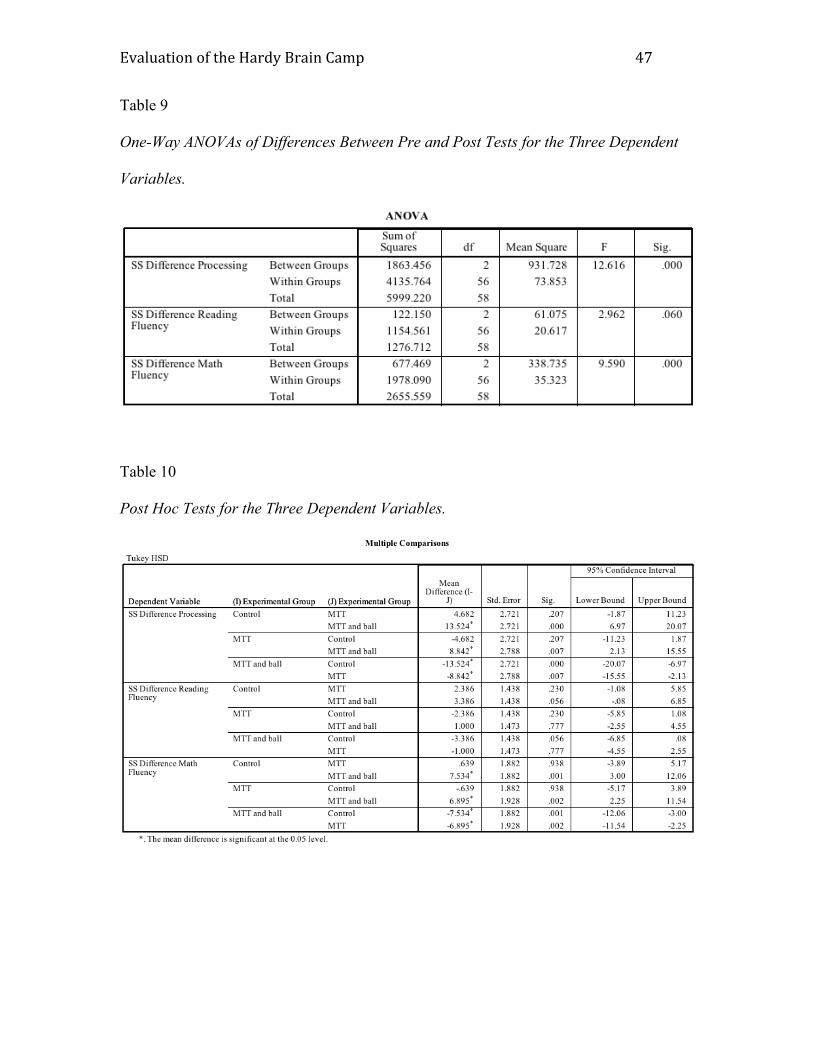
As predicted, there was a statistically significant difference in processing speed
scores based on experimental group: F (2, 56) = 12.62, p < .001. This shows that there is
a statistical difference between the groups. A post hoc Tukey HD test showed significant
differences for the MTT and the Ball group, MD = -13.52, p < .001, compared to the
control and for the MTT and Ball group compared to MTT as well, MD = -8.84, p = .007.
No other pair comparison was seen as significant in this post hoc test.
EvaluationoftheHardyBrainCamp35
Reading Fluency
The hypothesis for reading fluency was the same as for processing speed, that
MTT and ball would do best, followed by the MTT group, and finally the control group.
Preliminary data screening was done to assess whether the assumptions for ANOVA
were seriously violated. Examination of K-S scores and descriptive statistics on the
variable of reading fluency suggested the difference scores were normally distributed
within each experimental group. The Levene test indicated no significant violation of the
homogeneity of variance assumption. The one-way ANOVA showed trends towards our
hypothesis but not a statistically significant difference in reading fluency scores based on
experimental group: F (2, 56) = 2.96, p = .060 in a two-tailed test.
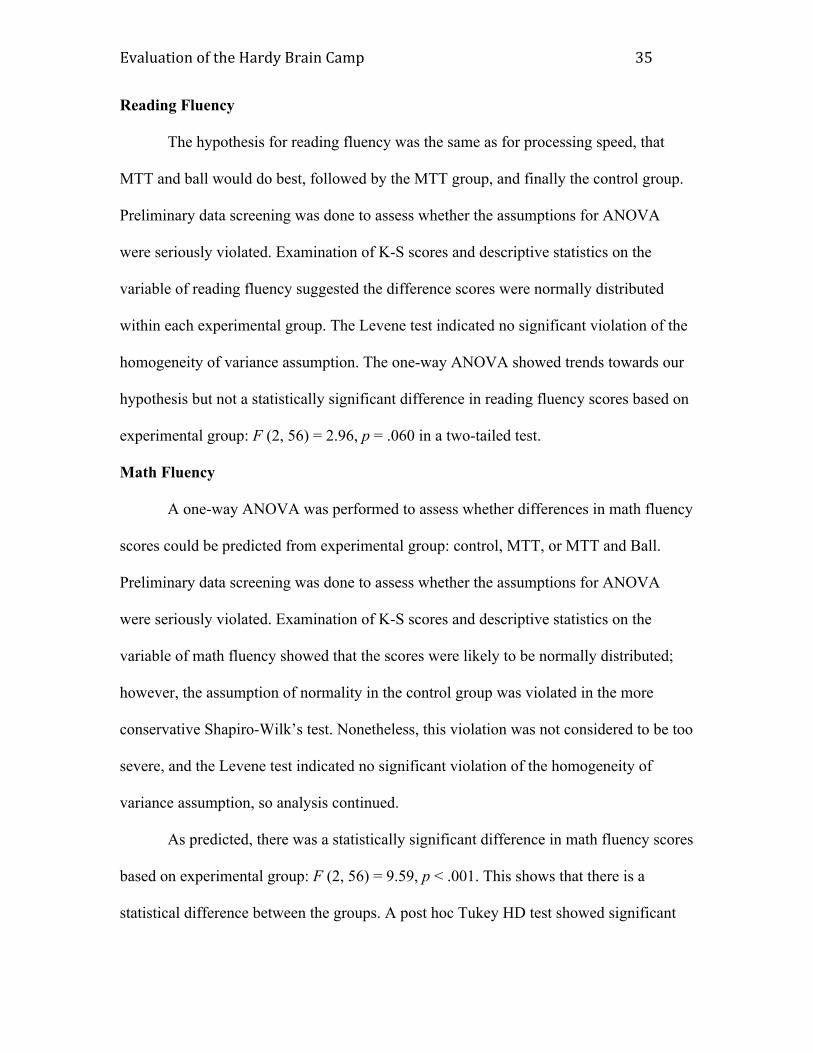
Math Fluency
A one-way ANOVA was performed to assess whether differences in math fluency
scores could be predicted from experimental group: control, MTT, or MTT and Ball.
Preliminary data screening was done to assess whether the assumptions for ANOVA
were seriously violated. Examination of K-S scores and descriptive statistics on the
variable of math fluency showed that the scores were likely to be normally distributed;
however, the assumption of normality in the control group was violated in the more
conservative Shapiro-Wilk’s test. Nonetheless, this violation was not considered to be too
severe, and the Levene test indicated no significant violation of the homogeneity of
variance assumption, so analysis continued.
As predicted, there was a statistically significant difference in math fluency scores
based on experimental group: F (2, 56) = 9.59, p < .001. This shows that there is a
statistical difference between the groups. A post hoc Tukey HD test showed significant
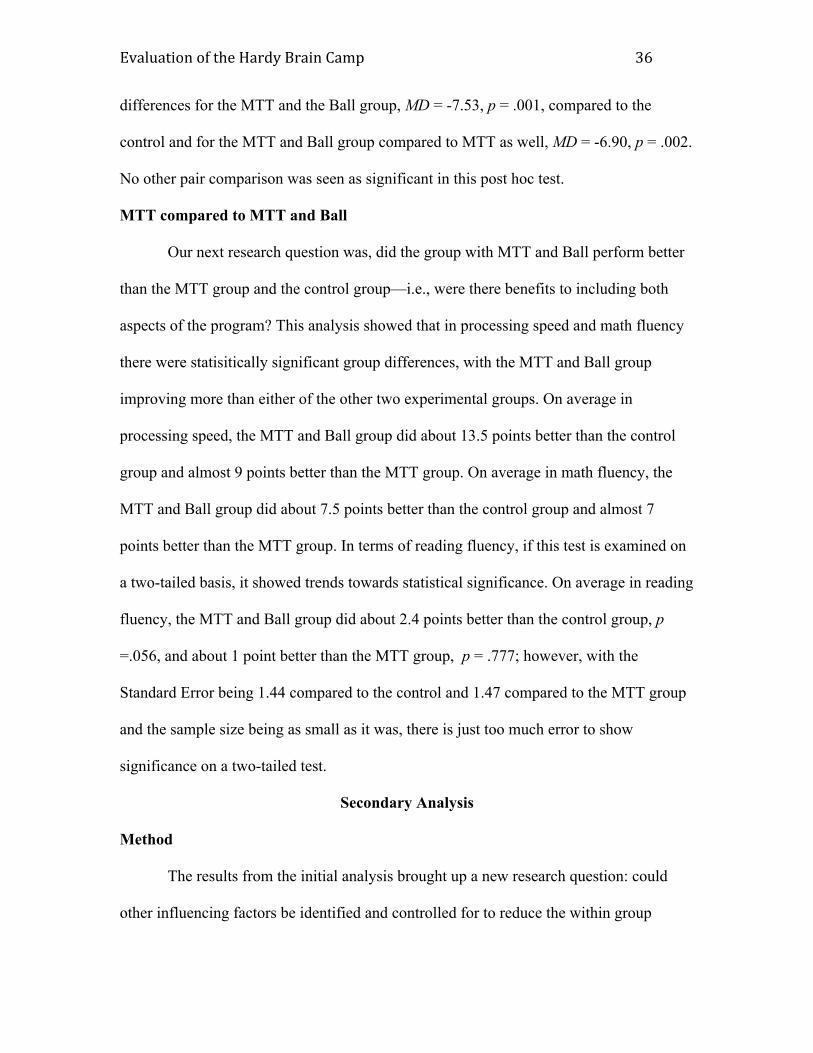
EvaluationoftheHardyBrainCamp36
differences for the MTT and the Ball group, MD = -7.53, p = .001, compared to the
control and for the MTT and Ball group compared to MTT as well, MD = -6.90, p = .002.
No other pair comparison was seen as significant in this post hoc test.
MTT compared to MTT and Ball
Our next research question was, did the group with MTT and Ball perform better
than the MTT group and the control group—i.e., were there benefits to including both
aspects of the program? This analysis showed that in processing speed and math fluency
there were statisitically significant group differences, with the MTT and Ball group
improving more than either of the other two experimental groups. On average in
processing speed, the MTT and Ball group did about 13.5 points better than the control
group and almost 9 points better than the MTT group. On average in math fluency, the
MTT and Ball group did about 7.5 points better than the control group and almost 7
points better than the MTT group. In terms of reading fluency, if this test is examined on
a two-tailed basis, it showed trends towards statistical significance. On average in reading
fluency, the MTT and Ball group did about 2.4 points better than the control group, p
=.056, and about 1 point better than the MTT group, p = .777; however, with the
Standard Error being 1.44 compared to the control and 1.47 compared to the MTT group
and the sample size being as small as it was, there is just too much error to show
significance on a two-tailed test.
Secondary Analysis
Method
The results from the initial analysis brought up a new research question: could
other influencing factors be identified and controlled for to reduce the within group
EvaluationoftheHardyBrainCamp37
difference and allow the actual correlation between reading fluency and group
membership be better represented? Logically, in an ANOVA situation, whatever is
between group differences is divided by whatever is within group differences. Since all
error is portioned into the within group difference, by identifying and controlling for
other factors that might cause within group differences, there would be a greater
likelihood of seeing the between group differences of experimental group on the
difference in reading fluency scores.
This was attempted in two ways: First, a MANOVA was conducted to see if there
was any error based on interdependence of test difference scores in the one-way
ANOVAs. Next, an exploratory regression was performed to see if other variables, such
as gender, pre-reading SS scores, pre-math SS scores, average age, and pre-processing SS
scores, linearly related to the dependent variable of difference in reading fluency scores.
For all of these processes, assumptions were checked. Finally, reading fluency was
approached as a one-sided, hypothesized test, and a one-tailed ANOVA p-value was
calculated.
Results
MANOVA
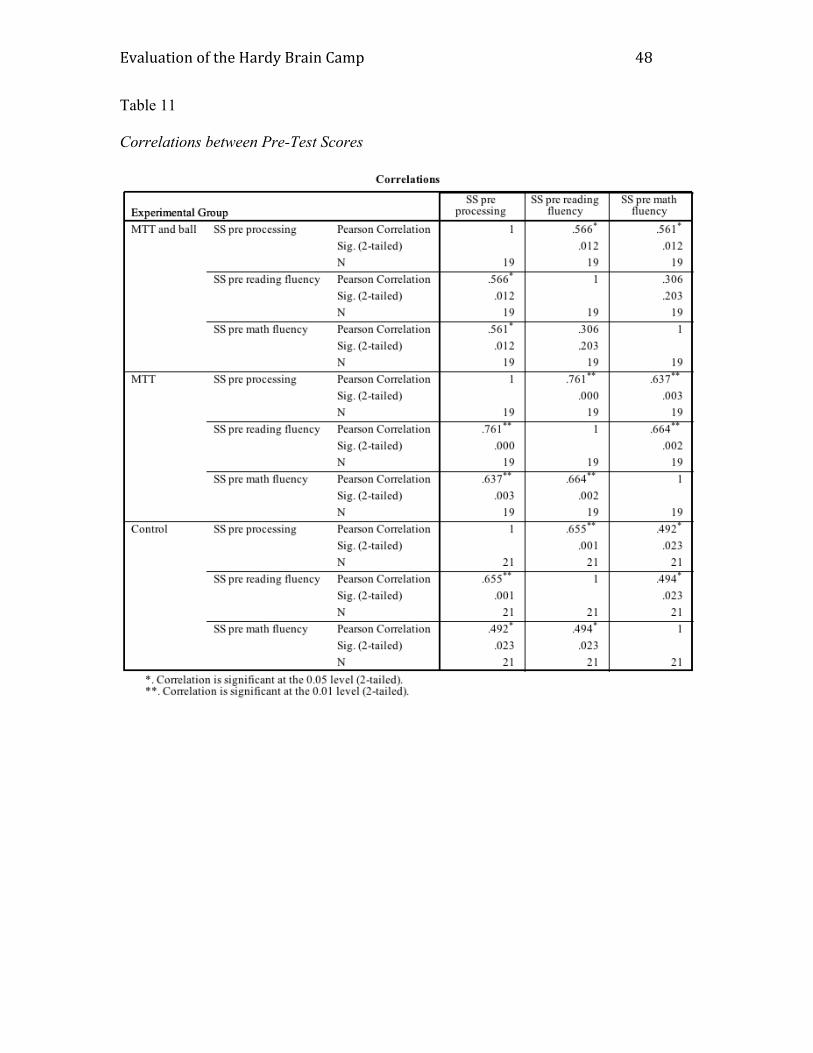
One could argue that skills such as reading fluency, math fluency, and processing
speeds could be related to each other. To analyze how these scores correlated with one
another the Pearson Correlation was analyzed for each pre-test against each other. Table
11 shows these Pearson Correlations. In almost all cases, when broken into groups, there
were statistically significant correlations between pre-test scores. For this reason, there
was a question of whether the differences between pre and post-test scores were
EvaluationoftheHardyBrainCamp38
independent of each other as variables. A MANOVA was conducted on the three
dependent variables using the independent variable of group.
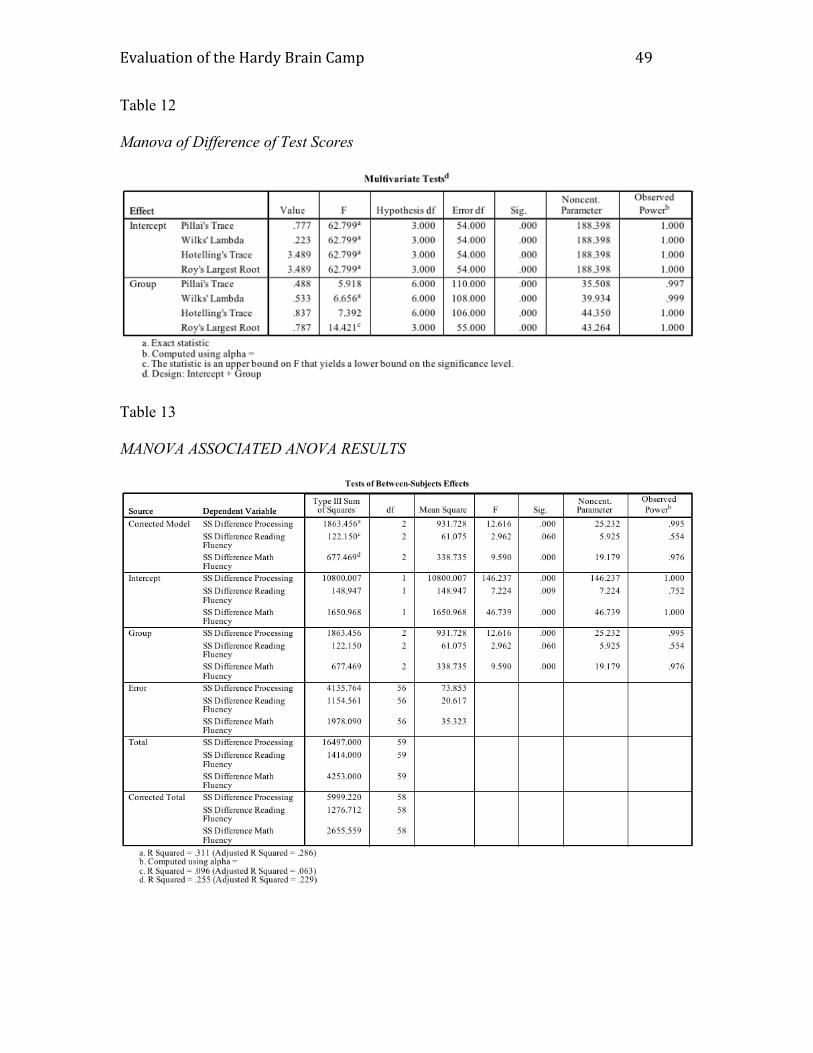
As predicted, there was a statistically significant difference in this model based on
experimental group using Wilks’ Lambda: F (6, 108) = 6.66, p < .001 with an observed
power of .999. That is to say, when processing speed, reading fluency, and math fluency
are combined together there is an overall statistical difference created by experimental
condition; that across the three measures training was shown to have an affect. The
corrected model of between-subjects effects was the same as the one-way ANOVAs on
the three variables, with both differences in processing speed and math fluency being
significant and differences in reading fluency showing trends of improvement, but not
enough to be significant. Table 12 summarizes the results of the MANOVA and Table 13
summarizes the MANOVA associated ANOVA results.
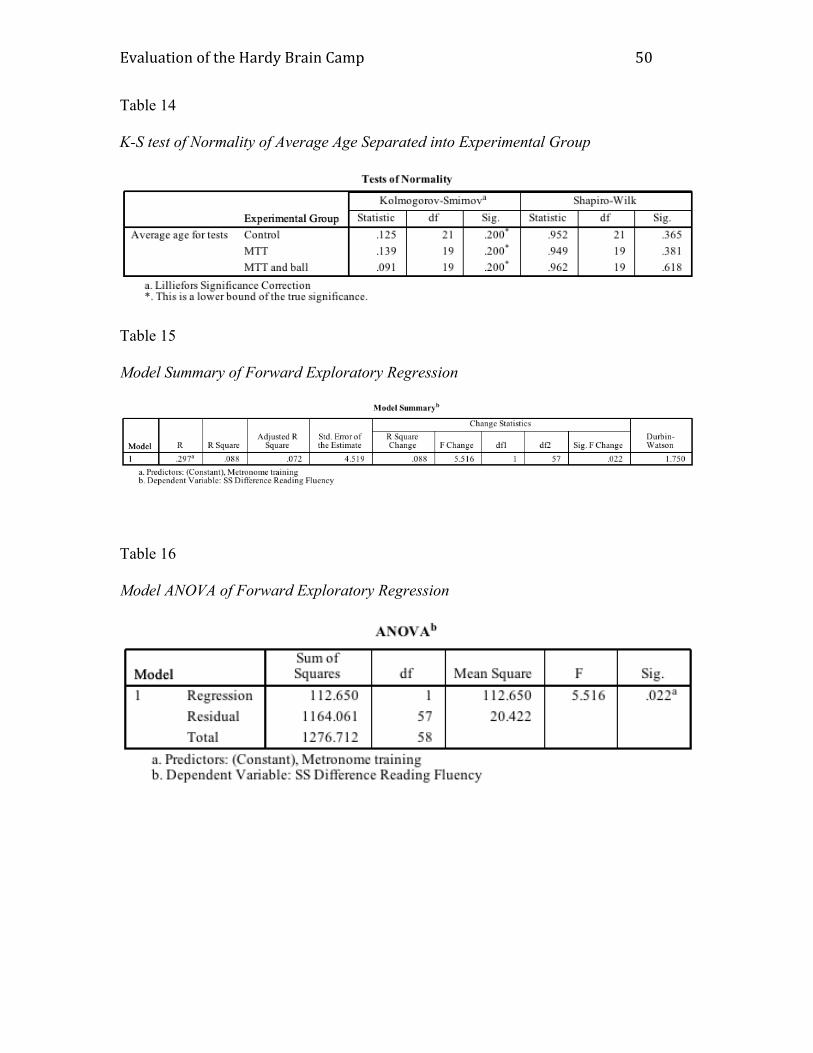
Exploratory Regression
An exploratory statistical regression was performed to predict differences in
reading fluency test scores from the following candidate predictor variables: gender
(coded 0 = Male, 1 = Female), processing pre test scores, math fluency pre test scores,
reading fluency pre-test scores, average age at tests, and metronome training (coded 0 =
no training, 1= training). The total N for this sample was 59. Preliminary data screening
included K-S tests for all continuous variables (see Table 14), examination of histograms
of scores on all variables, and examination of scatter plots for all pairs of variables.
Univariate distributions were reasonably normal with no extreme outliers. Bivariate
relations were not very linear for most variables; however, the analysis was continued.
EvaluationoftheHardyBrainCamp39
Statistical multiple regression was performed using Method = Forward with the F-to-
enter criterion value set at F = 3.00. That is, in each step, SPSS entered the one predictor
variable that would produce the largest increase in R2. When the F ratio for the R2
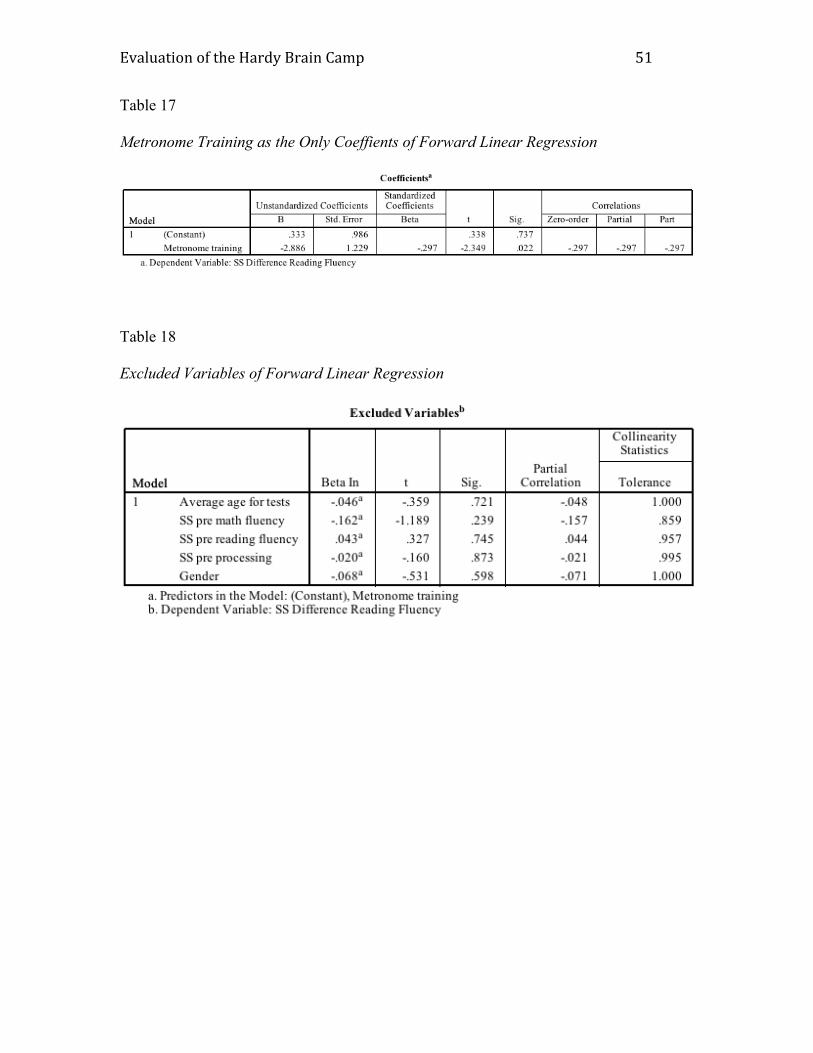
increase due to additional variables fell below F = 3.00, no further variables were added
to the model. This resulted in metronome training being entered into the model and all
other variables being excluded. None of the other variables had enough of a predicting
value on difference in reading fluency scores to be entered into the equation. From this it
was recognized that there would not be another variable that could be controlled for to
reduce the within group variance and better show the effect training had on reading
fluency. Tables 15 through 18 provide a summary of these results.
One-tailed One-way ANOVA
The MANOVA, and the exploratory regression were all run to try to find ways of
reducing the within group variance to better show statistical significance on a two-tailed
reading fluency test. This would give us the strongest argument that experimental group
influenced the difference in reading fluency test scores. However, with all three analyses,
we were unable to factor out any of the error in our within group variance. Nothing else
we measured had a predictive relationship with the difference in reading fluency test
score besides the metronome training.
While it would be ideal to show a statistical difference on a two-tailed test, this
was actually a one-tailed experiment. We hypothesized that we would see improvement
through the training. For this reason, we can divide the p of the original one-way
ANOVA in half to get the one-tailed significance, p = .030. This shows that experimental
group creates a statistically significant difference in reading fluency performance.
EvaluationoftheHardyBrainCamp40
However, the difference in this case was the control group was significantly lower than
either the MTT or the MTT and Ball groups.
Discussion
This evaluation was conducted to see if the Hardy Brain Training Program
improved processing scores, reading fluency scores, and math fluency scores in the
general population of mixed-gender youth found in the Boys and Girls Club. The
analyses show that: 1) when students with metronome training are compared to students
without metronome training the students with metronome training do statistically better
than the students without metronome training in all three dependent measures, and 2)
when students are compared by experimental group, the MTT and Ball group improved
more that the metronome group in all three dependent measures.
The in-depth analysis of the within group variance in reading fluency was a good
example of how training is an important factor in student improvement in these measures.
The forward regression showed how training was predictive of improvement when
gender, age, and pre test abilities were not. Forward regressions of both processing speed
and math fluency showed the same trends, metronome training was predictive of
difference in pre and posttest scores while gender and age were not linearly related to the
outcome.
EvaluationoftheHardyBrainCamp41
Codebook
• Grade = The grade the student is currently in
• Group = Experimental Group (0 = control, 1 = Millisecond Timing Training, 2 =
MTT and ball bounce activity)
• Metronome = Training versus no training (0 = no training, 1 = training)
• Gender = Gender (0 = male, 1 = female)
• DatetestingPre = the date of pretest in Month/Day/Year format
• SSPreP = Standard Score in Processing at Pre-test
• SSPreRF = Standard Score in Reading Fluency at Pre-test
• SSPreMF = Standard Score in Math Fluency at Pre-test
• DatePostTest = the date of pretest in Month/Day/Year format
• SSPostP = Standard Score in Processing at Post-test
• SSPostRF = Standard Score in Reading Fluency at Post-test
• SSPostMF = Standard Score in Math Fluency at Post-test
• SSPDiff = Difference in Standard Score between pre and post test for processing
speed
• SSRFDiff = Difference in Standard Score between pre and post test for reading
fluency
• SSMFDiff = Difference in Standard Score between pre and post test for math
fluency
EvaluationoftheHardyBrainCamp42
• AgePretest = Age (in months) at pretest
• AgePosttest = Age (in months) at post test
• Ageaverage = The average age of participant as calculated by the pre test age plus
the post test age divided by two.
Appendix- SPSS Tables For Results
Table 1
Descriptive Statistic of Student Grade and Pre-Test Scores, and Age at Pre-test, Broken
into Experimental Groups
Table 2
Test of Normality For Pre-test Scores
EvaluationoftheHardyBrainCamp43
Table 3
Group Statistics for Comparison Independent Samples t-Test
Table 4
Independent t-Test of Difference Scores Showing Training Versus No Training
EvaluationoftheHardyBrainCamp44
EvaluationoftheHardyBrainCamp45
Table 5
Descriptive Statistics of Difference Scores and Average Age, Broken into Experimental
Groups
Table 6
Tests for Normality for Pre Tests by Group
EvaluationoftheHardyBrainCamp46
Table 7
Tests for Normality for Difference Scores by Group
Table 8
Levene’s Test of Variance for Three Dependent Variables
EvaluationoftheHardyBrainCamp47
Table 9
One-Way ANOVAs of Differences Between Pre and Post Tests for the Three Dependent
Variables.
Table 10
Post Hoc Tests for the Three Dependent Variables.
EvaluationoftheHardyBrainCamp48
Table 11
Correlations between Pre-Test Scores
EvaluationoftheHardyBrainCamp49
Table 12
Manova of Difference of Test Scores
Table 13
MANOVA ASSOCIATED ANOVA RESULTS
EvaluationoftheHardyBrainCamp50
Table 14
K-S test of Normality of Average Age Separated into Experimental Group
Table 15
Model Summary of Forward Exploratory Regression
Table 16
Model ANOVA of Forward Exploratory Regression
EvaluationoftheHardyBrainCamp51
Table 17
Metronome Training as the Only Coeffients of Forward Linear Regression
Table 18
Excluded Variables of Forward Linear Regression