Embed Size (px)
Citation preview

정책자료 2003-06
Innovation Behaviors of Korea’s Manufacturing Firms: Some Empirical Evidences Based on the Korean Innovation Survey (KIS) Dataset
Taeyoung Shin
July, 2003

2
ABSRACT This study presents some empirical evidences of the relationship between firm’s innovation behavior and firm size, market structure, technological opportunities/strategies, inhouse-capability and other determinants. The empirical investigation is based on the KIS (Korean Innovation Survey) Dataset undertaken in Korea. The empirical results show that the greater possibility of innovation was associated with the more competitive industry and the medium-sized firms.
1. Introduction In the knowledge-based economy, innovation is seen to play a central role, but until recently the complex processes of innovation have been insufficiently understood. Better understanding, however, has emerged from many studies in recent years. At the macro-level, there is a substantial body of evidence that innovation is the dominant factor in national economic growth and international patterns of trade. At the micro-level, R&D is seen as enhancing a firm’s capacity to absorb and make use of new knowledge, strengthening its competitiveness. As innovation comes into a focus, more concerns have been paid to how to collect and produce indicators which well represents the economic activities in general and S&T activities in particular. The attempt to seek and develop new indicators is inevitable since conventional indicators are not quite appropriate for capturing innovation activities and therefore for policy-making for various socio-economic sectors. Conventionally, there have been two basic families of S&T indicators, which are directly relevant to the measurement of technological innovation, that is, resources devoted to R&D and patents statistics. R&D data are collected through national

3
surveys according to the guidelines of the Frascati manual. These data have proved valuable in many studies. However, these data have two main limitations. First, R&D is an input. Although it is obviously related to technical change, it does not measure it. Second, R&D does not encompass all the efforts of firms and governments in this area, as there are other sources of technical change, such as learning by doing. On the other hand, patents as an indicator also have a drawback. Many innovations do not correspond to a patented invention. Many patents correspond to invention with a near zero technological and economic values, whereas a few of them have very high value. Many patents never lead to innovation. Thus, it is needed to develop new indicators properly reflecting innovation activities. In this study, we have made an investigation of firm’s innovation behavior and provided some empirical evidences, based on the KIS (Korean Innovation Survey) dataset, which is collected according to the OECD scheme. In the following chapter, we will discuss the empirical model and data mining. The empirical study was done employing variables, which explains firm’s innovation behavior. Those variables include not only conventional variables such as firm’s age, size and industrial structure, but also the variables such as technological opportunities, in-house capability and market environment, which are perceived by the firm. Using those variables, we obtained some empirical evidences using a probit model. An advantage using an econometric model is that we can systematically reproduce the results at given conditions. Then, we provide some explanation of the empirical results and finally concluding remarks in the last chapter.
2. An Empirical Approach to Innovation Behavior of Firms 2.1. Model

4
There could be various ways to make an empirical investigation of the firm’s behavior of innovation. Using the KIS dataset, we could employ the probit model. In specification of the probit, the observed data for dependent variable is represented by the binary variable, that is, it has the discrete values of either 0 or 1. In the survey, in fact, innovation is measured as a binary variable, i.e., yes or no for making innovation. Three types of innovation are taken into consideration, such as new product innovation, product improvement and process innovation. The probit can be written as
(1) ( 1) (P y F x )β= = or
( 0) 1 (P y F x )β= = − where denotes a probability that the firm made innovation during the observed period if y=1,
PF a probability distribution function, the dependent variable, y x
the vector of the independent variables, and β parameters to be estimated.1 Thus, Eq.(1) represents the probability that a firm makes at least a one innovation during the period of consideration, given a set of independent variables. Suppose Eq.(1) is specified by a probit. Then, we can rewrite Eq.(1) by
(2) ( 1) ( ) (xP y t dt xβ )φ β−∞= = = Φ∫
where ( )φ g represents a standard normal pdf and ( )Φ g a standard normal cdf.
1 This model is called sometimes as a probit or logit according to the characteristics of F .

5
By maximizing the likelihood function of Eq.(2), we can estimate the parameters,
β . The likelihood function of Eq.(2) is given by
(3) [ ] [ ]1( ) 1 ( )
ny y
i iL x xφ β φ β1i
−
=
= −∏
On the other hand, the marginal effect can obtained by taking derivative of the expected values with respect to the variables, x . That is, the expected values are given by
(4) [ ] [ ]0 1 ( ) 1 ( ) ( )E y x x x xφ β φ β φ = − + = β
Taking derivative, we have
(5)
( ) ( )( )
E y x d x xx d x
φ β β φ β ββ
∂ = = ∂
Then, Eq.(5) represents the changes in the possibility that firm makes innovation by increasing the given independent variable by unit. 3.2. Data 3.2.1. Overview of KIS Dataset

6
International efforts to develop new S&T indicators have been led and made by CSTP/OECD. “New S&T indicators” activity aims to develop a set of methods and data sources allowing selected indicators to be calculated on an internationally comparable basis. It also aims at using existing data in new ways, or at using new data, or at implementing full-scale methods, which are still at the research stage. The OECD group of NESTI (National Experts on Science and Technology Indicators) in collaboration of the OECD and Eurostat Secretariats has prepared the Oslo manual in 1992 and revised it in 1996. The manual is designed to serve as a guide for data collection on technological innovation. It is based on the original framework of concepts, definitions and methodology, and updates them to incorporate survey experience and improved understanding of the innovation process. With the guidelines of the manual, many countries undertake the survey and make various analyses based on the innovation survey dataset. Basically, this survey deals with innovation at the level of the individual firm. Table 1. Measures of innovation and its determinants Measured variables 1. Measurement of innovation 2. Firm-specific determinants 3. Industry-specific determinants
Innovative inputs Innovative outputs Innovation count Qualitative data for innovation
Firm size Cash flow Product diversification Firm-specific R&D related capability; organizational, managerial, sociological and psychological attributes of firms Division of innovative labor
Market concentration Demand Technological opportunities Appropriability conditions
7
Source: Kamien & Schwartz (1982), Baldwin & Scott (1987), Cohen (1995), Symeonidis (1996) According to the Oslo manual, technological innovation is divided into three categories, i.e., product innovation, process innovation and diffusion. The product innovation is the commercialization of a technologically changed product. Technological change occurs when the design characteristics of a product change in ways that deliver new or improved services to consumers of the product. The process innovation occurs when there is a significant change in the technology of the production of an item. This may involve new equipment, new management and organization methods, or both. The diffusion is the way in which innovations spread, through market or non-market channels. Without diffusion, an innovation will have no economic impact. The manual recommends six areas for investigation, such as (1) corporate strategies, (2) role of diffusion, (3) sources of information for innovation and obstacles to innovation, (4) inputs to innovation, (5) role of public policy in industrial innovation, and (6) innovation outputs. However, the measurement of innovation is no easy matter and there are a number of factors to influence innovative behavior of the firm. Several alternatives have been suggested from innovation-related studies ever since Schumpeter in early 1940. They are summarized in the following table. The KIS dataset is to collect data about innovation activity at the firm level. The dataset covers more than 3,000 firms and includes information on both inputs to the innovation process, cooperation about innovation, outputs from the innovation process, and institutional and environmental factors influencing firm’s innovative behavior. The Korean survey has been undertaken twice since 1995 by the STEPI. The survey deals mainly with product and process innovations; the product innovation is divided into two such as new product innovation and product improvement. In this survey,

8
new product innovation implies a technologically new product whose technological characteristics or intended uses differ significantly from those of previously produced products. The product improvement implies a technologically improved (existing) product whose performance has been significantly enhanced or upgraded. The process innovation implies the adoption of technologically new or significantly improved production methods, including methods of product delivery. These methods may involve changes in equipment, or production organization, or a combination of these changes, and may be derived from the use of new knowledge. For the investigation, the survey questionnaire includes ten categories of survey parameters, such as (1) general information about the business operation, (2) innovative performance of the firm, (3) information sources of innovation, (4) purposes of innovation, (5) innovation cost, (6) impacts of innovation, (7) technology acquisition and transfer, (8) protection of intellectual property rights, (9) assessment of institutional/governmental support for innovative activities, and finally (10) obstacles to innovation. The measures of survey parameters include quantitative and qualitative ones. 3.2.2. Data Mining For the empirical analyses, first, we run a regression of innovation types on quantitatively measurable variables, i.e., firm’s age, size, the quadratic term of the size and the concentration ratio by the largest 3 firms. It is expected that the firm’s age may have stronger effect on process innovation relative to product innovation or product improvement. It is an empirical matter whether the effects of firm size and concentration ratio are positive or negative.
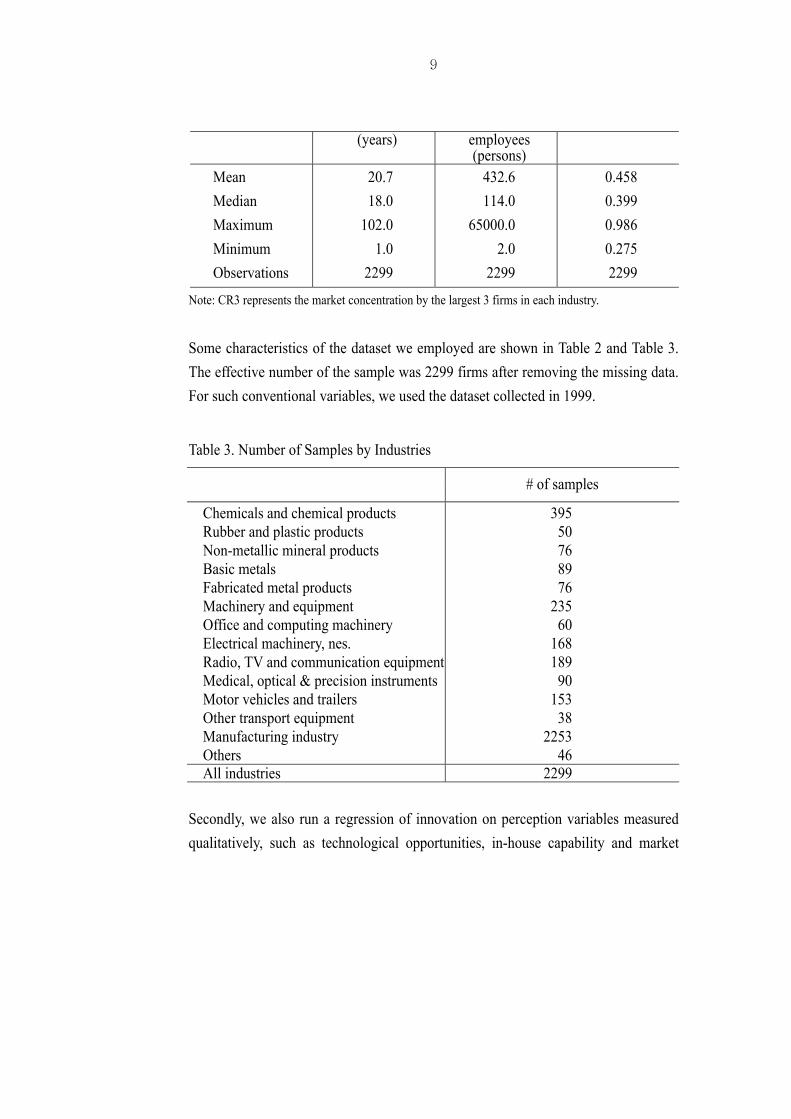
Table 2. Summary Statistics Firm’s age Number of CR3
9
(years) employees (persons)
Mean Median Maximum Minimum Observations
20.7 18.0
102.0 1.0
2299
432.6 114.0
65000.0 2.0
2299
0.458 0.399 0.986 0.275
2299
Note: CR3 represents the market concentration by the largest 3 firms in each industry.
Some characteristics of the dataset we employed are shown in Table 2 and Table 3. The effective number of the sample was 2299 firms after removing the missing data. For such conventional variables, we used the dataset collected in 1999.
Table 3. Number of Samples by Industries
# of samples
Chemicals and chemical products Rubber and plastic products Non-metallic mineral products Basic metals Fabricated metal products Machinery and equipment Office and computing machinery Electrical machinery, nes. Radio, TV and communication equipmentMedical, optical & precision instrumentsMotor vehicles and trailers Other transport equipment Manufacturing industry Others
395 50 76 89 76
235 60
168 189
90 153
38 2253
46 All industries 2299
Secondly, we also run a regression of innovation on perception variables measured qualitatively, such as technological opportunities, in-house capability and market

10
environment. The variable for technological opportunities was obtained by items of sources of technological information, which is measured by the scale 1-5, i.e., the more important are the sources of technological information, the higher is the score between 1 and 5. In the survey, since this variable was structured in a hierarchical way as in Table 4, we have to get through some data-mining to get the degree of freedom as many. For the perception variables, we used the data from the 1997 Survey. Table 4. Elements for Perception Variables Perception Variables Sub-Variables Items evaluated
In-house source
R&D sector Production sector Marketing sector Others
Market/other firms
Competitors of the same market Suppliers of raw materials Suppliers of machines andequipments Demanders Consulting firms Skilled workers or technologists from outside Joint venture
University/research institute
Universities Government research institutes National examination research labs Business associations and other groups Research associations Private research institutes
Technological Opportunities
General media
Patent information Seminars on technologies Magazines Conventions and exhibitions Newspapers, TV and other mass media

11
In-house Capability
--
Technological manpower Acquisition/analysis capability of technological information Cooperation between different organizations Top management attitudes Financial sources for innovation
Market Environment
-- Imitation by competitors Government regulations Responses of customers Supplies of raw materials Supplies of machine and equipments Competition with domestic and foreign firms
Since the perception data is structured in a hierarchical way, the aggregation is necessary. The first aggregation was made by obtaining the average of the items evaluated by sub-variables in all cases. Then, the second aggregation was made using the principal components analysis at the level of sub-variables.2 The second aggregation was done only for the variables of technological opportunities. For the in-house capability and market environment, we simply used the average of evaluated items. 3.3. Empirical Results The estimation results show that most estimated coefficients are highly significant. In Table 4, for the case of new product innovation, estimated coefficients are all significant at 1 % level. For the case of product improvement, estimates of firm size
2 For the second aggregation, we employed the principal components analysis as follows. First, we obtain the principal components ( ip ), and divide it by the eigen values. Then, we have scores ( ) by s 1 /s p 1λ= , where 1p and 1λ denote the factor loading and eigen value of the first component. Using the scores, we can obtain indices ( iI ) by iI xs= , where x denotes the observations of the variables ( n k× ) and s a vector of . 1k ×

12
are significant at 1 % level; firm age at 5 % level; and the concentration ratio at 10% level. Finally, for the case of the process innovation, estimates of firm’s age and size show the significance at 1 % level and that the estimate of the concentration ratio shows less significance. Such estimation results, using measurable independent variables, have important implication for the firm’s innovative behavior and hence industrial policies. An interpretation can be made as follows. In the empirical investigation, firm’s innovation is divided into three types, i.e., product innovation, product improvement, and process innovation, which are the dependent variables in the empirical model. As discussed before, there are two sets of independent variables; measurable variables and perception variables. From the results, it is shown that the age of the firm has the positive relationship with the possibility of making innovations. The coefficient shows the highest value for the new product innovation, and they are relatively close for both cases of product improvement and process innovation. It could be said that the innovation in the manufacturing sector is led by older firms in general, and older firms lead new product innovation to greater degree in particular. Table 5. Estimation Results
Innovation by Types New Product Product
Improvement Process

13
Constant Firm age Number of employees Quadratic term of number of employees CR3 Technological opportunities In-house capability Market environment
-0.16525 (-1.790)
0.01269 (5.504)
8.3E-05 (2.673)
-1.9E-09 (-2.686)
-0.77296 (-4.704)
0.36522 (1.510)
0.21707 (5.359)
0.18952 (3.307)
-0.17054 (-3.513)
-0.52212 (-5.475)
0.00573 (2.461)
8.5E-05 (2.855)
-1.9E09 (-2.778)
-0.28951 (-1.716)
-0.12051 (-0.514)
0.28139 (7.147)
0.23141 (4.143)
-0.15585 (-3.403)
-0.76871 (-7.638)
0.00690 (2.845)
0.00011 (3.519)
-2.2E-09 (-3.235)
-0.23339
(-1.33)
-0.01053 (-0.050)
0.11614 (3.304)
0.18670 (3.724)
-0.11511 (-2.787)
Log-likelihood LR statistics McFadden
2R OBS with Dep=0 OBS with Dep=1 Total OBS
-1531.8 62.662
0.020
1336 963
2299
-880.9 55.366
0.030
318 1880 2198
-1413.4 26.672
0.009
1582 717
2299
-958.6 81.531
0.040
372 1826 2198
-1183.2 41.520
0.017
1799 500
2299
-1303.6 28.264
0.010
631 1567 2198
Notes: 1. The number in parentheses are z-statistics. 2. denotes the concentration ratio by the largest 3 firms. 3CR
The relationship between firm size and innovation shows the inverse U-shape, which is not consent with the Schumpeterian hypothesis. It implies that medium-sized firms lead innovation, relative to small-sized and large firms in the Korean manufacturing sector. Such results were also seen in many other studies. It is an interesting result because it is known that well-organized R&D activities are led by large firms in Korea. However, the empirical results show that more innovation takes place in the medium-sized firms. This may have an important implication for the industrial policy. In addition, it is also supported by the estimation results for the variable of the

14
concentration ratio ( ). The estimated coefficient of turned to be negative. It implies that the greater the market power of the firm, the smaller chances of making innovation are. In a word, it could be said that the medium-sized firms with relatively high competition would make greater innovation activities in Korea’s manufacturing sector. In other words, the market environment is unfavorable to the individual firms, they are more innovative. Similar results can be also shown by the perception variables.
3CR 3CR
As the perception variables, we employed three, i.e., technological opportunities, in-house capability and market environment. Technological opportunities can be captured by various sources of technological information. In-house capability represents absorption and appropriation capabilities of new technologies. All estimated coefficients are significant at 1 % level. The coefficients of technological opportunities and in-house capability are positive, while the coefficient of the market environment is negative. Therefore, it can be interpreted that firms have greater probability for making innovation which are more aware of importance of sources of technological information and in-house capability. On the other hand, when the market environment is less favorable, firms turned to be more innovative. The unfavorable market environment to the individual firm can be taken place if there is greater competition, or inefficient supplies channels, etc. If this the case, the individual firm might seek innovation to break through unfavorable market situation and to increase its competitiveness. Table 6. Marginal Effects of Technological Opportunities, In-House Capability and Market Environment
Innovation by Types
New Product
Product
Improvement Process
Technological Opportunities
In-House Capability
0.047880
0.041803
0.068024
0.055941
0.039111
0.062872

15
Market Environment -0.037617 -0.037675 -0.038765
Using the estimation results, we compare the marginal effect among the perception variables, as shown in Table 6. In case of new product innovation and product improvement, the variable of technological opportunities has the greatest effect on the probability that the firm makes innovation. Next, In-house capability is important for the product innovations. However, market environment has less influence relatively, though it has a negative effect. For the process innovation, in-house capability is the greatest on effect for the probability for the innovation. About the same effect is shown in both cases of technological opportunities and market environment, although they have opposite influences.
4. Concluding Remarks So far, we have discussed the innovation behaviors at the firm level, using the KIS dataset in the manufacturing sector. The empirical results show interesting implications, although some limitations are faced with. The KIS dataset is considered as a useful one to investigate the firm’s behavior of innovation. The dataset include about 3,000 individual firms and information about many variables with respect to the innovation. If this dataset is produced regularly, it will be possible to get a longitudinal data, which makes it possible to investigate ‘within effects’ and ‘along effects’ on the innovation behaviors of the firms. From the empirical results, it was seen that the Schumpeterian hypothesis is not supported. That is, greater chances of innovation exhibit in the medium-sized firms.

16
Larger firms are not relatively more innovative. In addition, the more concentrated the industry is, the less innovative are the firms within the industry. This may have a very important implication for the industrial policy, observing that there have been a significant restructuring in the ‘Chaebul’ and a venture boom after the foreign exchange crisis. On the other hand, we obtained the regression coefficient of the perception variables, technological opportunities, in-house capability and market environment, with respect to types of innovation. From the results, it could be said that the Korean firm perceives technological opportunities most important for the product innovation. However, in-house capability is perceived most important. Therefore, information about the technological opportunities might play a very important role in the product innovation, while in-house capability in the process innovation. It implies that various policy measures are needed to increase the competitiveness of the firm through innovation. Finally, if the firm perceives the market environment is favorable to itself, the motivation for the innovation may not be strong, showing the negative sign of the coefficients for three types of innovation. Based on the KIS dataset, we provided an interesting empirical study, although there are both theoretical and technical limitations to measure the outcomes of innovation. We employed the dataset produced in 1997 and 1999. However, due to the serious limitation of the dataset, we can make a panel data analysis. If the survey is regularly undertaken, it will be possible to produce richer analyses of firm’s innovation behavior.

17
References Cohen, W.M. (1995), "Empirical Studies of Innovative Activity," in P. Stoneman, ed.,
Handbook of the Economics of Innovation and Technological Change, Oxford; Blackwell.
baldwin, M.N. & J.T. Scott, (1987), “Market Structure and Technological Change,” Chichester: Harwood.
Kamien, M.I. & N.L. Schwartz (1982), Market Structure and Innovation, Cambridge: Cambridge University Press.
Levin, R.C. (1988), "Appropriability, R&D Spending and Technological Performance," American Economic Review, Vol. 78, pp.424-428.
M. Yun & J. Jang (1997), “An Innovation Survey for Manufacturing Firm in Korea,” Research Report, Seoul: Science and Technology Policy Institute (STEPI).
Maddala, G.S, (1983), Limited-Dependent and Qualitative Variables in Econometrics, New York: Cambridge University Press.
Mansfield, E. (1963), "Size of Firm, Market Structure, and Innovation," Journal of Political Economy, Vol. 71, pp.556-576.
Nelson, R.R., M.J. Peck & E.D. Kalachek (1967), Technology, Economic Growth and Public Policy, Washington D.C.; Brookings Institution.
OECD (1996), Oslo Manual, 2nd ed., Paris. OECD (1999a), “Measuring and Reporting Intellectual Capital Experience, Issues
and Prospects,” STI/D/99.051. OECD (1999b), Managing National Innovation Systems, Paris. OECD (1999c), The Knowledge-Based Economy: a set of facts and figures. Paris. Scherer, F.M. (1965a), "Firm Size, Market Structure, Opportunity, and the Output of
Patented Inventions," American Economic Review, Vol.55, pp.1097-1125. Schmalensee, R. (1989), "Inter-Industry Studies of Structure and Performance," in R.
Schmalensee & R. Willig, eds. Handbook of Industrial Organization, Amsterdam: North Holland.

18
Schmookler, J. (1966), Invention and Economic Growth, Cambridge: Harvard University Press.
Shin, T. (1999), “Determinants of Firm’s Innovation; Firm Size, Industrial Structure and Innovation,” Policy Issues 99-07, Seoul: Science and Technology Policy Institute (STEPI).
Soete, L. (1979), "Firm Size and Innovative Activity; The Evidence Reconsidered," European Economic Review, Vol. 12, pp.319-340.
Song, W.C. & T. Shin (1998), “Success Factors of New Technology Based Enterprises,” Research Report, Seoul: Science and Technology Policy Institute (STEPI).
Stoneman, P. ed., Handbook of the Economics of Innovation and Technological Change, Oxford; Blackwell, 1995.
Symeonidis, G. (1996), "Innovation, Firm Size and Market Structure: Schumpeterian Hypotheses and Some New Themes," Paris; OECD.