Embed Size (px)
Citation preview
Experimental and computer simulation studies of the micelles formed by comb-like
PEG-containing polymeric surfactants as potential enzyme scaffolds
O. Paiuk1, A. Zaichenko1, N. Mitina1, J.Ilnytskyi1,2*, T.Patsahan2,
S.Minko3 , Kh. Harhay1, V. Garamus4, K. Volianiuk1
1Lviv Polytechnic National University, Lviv, Ukraine
2Institute for Condensed Matter Physics of the National Academy of Sciences of Ukraine, Lviv, Ukraine
3Nanostructured Materials Lab, University of Georgia, Athens, GA, USA
45 Helmholtz-Zentrum Geesthacht (HZG): Centre for Materials and Coastal Research, Max-
Planck-Str, Geesthacht 21502, Germany
*email: [email protected]
Abstract
The industrial implementation of biofuel production from lignocellulosic biomass faces a
number of economic obstacles. One of these is the cost of enzymes, typically used for cellulose
hydrolysis. Nature provides some hints towards the efficiency of this process, exampled in
natural enzyme complexes –cellulosomes, produced by some microorganisms. Therefore, many
research groups target synthetic routes to mimic such cellulosomes with synthetic structures
when many questions remain to be addressed: the optimal chemical structure and size of such
synthetic scaffolds, their adsorption on the cellulosic biomass particles, combinations, and best
practices arrangement of enzymes in the complex. In this work, polyethylene glycol (PEG)
copolymers that form micelles and accommodate enzymes in the micellar structures are
systematically studied using both experimental and computer simulation techniques. Preliminary
results indicate that the micelles are efficient polymer - enzymes structures for cellulose
hydrolysis. While the direct quantitative comparison between the real and model systems is not
always straightforward, both approaches agree on the role of the molecular architecture of the
copolymers on micelle formation and their structural characteristics.
Keywords:
hydrolysis, side-chain polymers, polyethylene glycol, micellization, computer simulation
1.Introduction
The lignocellulosic biomass is a huge natural resource for biofuel production, but
industrial implementation is restricted by relatively high cost of this process. Its bottleneck is the
hydrolysis stage, due to combination of factors1-2. During this stage, the plant cell wall
polysaccharides are decomposed by enzymes into sugar monomers, with their fermentation
being the following step in the biofuel production. The cost of enzymes counts for about half of
biomass hydrolysis process, hence, their efficient use is the key for the efficiency of this
technology overall.
The most widely used way to perform hydrolysis is to use the mixtures of free enzymes.
In this way the process turns into rather stochastic, when the sequence of requires stages, such as
cutting bonds of polysaccharides, cleaving their ends and subsequent split into glucose requires
availability of enzymes of different type to be “at the right place at the right time”. On contrary,
a perfect “team work” of enzymes is demonstrated by the polymer-enzyme complexes, produced
by certain bacterias, and since discovery of that, stimulates researchers to mimic such synergy by
using the synthetic carriers with either random3 or specific arrangement4 of enzymes on a
polymer scaffold. Such synthetic polymersomes involve may various types of molecular
architectures including linear, branched of hyperbranched examples5.
Besides plethora of molecular architectures, the polymersomes may differ in the
physical-chemical mechanism of enzymes immobilization, including cases of both covalent6 and
non-covalent7 (by means of van der Waals or electrostatic forces) attachments. The non-covalent
attachment relates such host-guest systems to the micelles that are used in the systems of targeted
drug delivery and in other applications8. In the case of micellar polymersomes, all the factors
such as: micelle forming dynamics, micelle hosting ability, stability, size and shape of the
polymer-enzyme complexes are of most interest and require detailed study.
The popular class of surfactants are the PEG-containing amphiphilic polymers9-13, that
are used in various fields of science and technology as surfactants and surface modifiers. Such
polymers are widespread as carriers for drug delivery systems, binding and delivery of proteins,
and antibodies14,15. The intra- and intermolecular interactions of PEG chains provide their self-
assembling and formation of micelle-like structures in the solutions in a wide range of polarities
and on surfaces16,17. Experimental study of rheological characteristics of water solution of PEG
with molecular weight higher than 600 Da18-21confirmed formation of intermolecular aggregates
due to formation of the hydrogen bonds between such molecules. Moreover, an availability of
units in the PEG chains causes the possibility of self-assembling the PEG-
containing molecules via hydrophobic interaction depending, evidently, on the separation
between the PEG chains. It was shown that the assembling degree and morphology of the
micelles depends on polymer PEG chain length, molecular weight, architectures and fine
molecular structure22.Nevertheless, the rheological and colloidal-chemical properties of comb-
like copolymers containing side PEG chains of different lengths and arrangement of side chain
groups along the polymer backbone are not yet studied in a required detail.
In this work we provide the results for the synthesis of various PEG-containing polymer
molecules of a side-chain architecture, study their ability to micellize, examine a range of
relevant properties of the micelles and try to relate these to the enhancement of the glucose
production. Although, the gain in the latter, as compared to the case of free enzymes, in not
breathtaking, this paves a way for the future search of similar molecular architectures with more
efficient glucose production, which will be the topic of the following studies. For deeper
understanding the mechanisms of micellization and micellar structure, we combine both the
experimental and computer simulation studies, where the modeling is performed on a
mesoscopic level using the dissipative particle dynamics approach. The outline of the paper is as
follows. Section 2 contains detailed description of the synthetic protocols and the results of the
experimental studies, computer simulation studies are given in section 3, and the conclusions are
provided in section 3.
2.Synthetic protocols and the experimental results
Poly(ethylene glycol) methyl ether methacrylate, with the molecular weight of 475 Da
(PEGMA475) and purity 97 %, was received from Sigma Aldrich (Milwaukee, WI, USA) and
used as received. Peroxide derivative of isopropyl benzene isopropyl-3(4)-[1-(tert-butylperoxy)-
1-methylethyl] benzene (monoperoxine, MP) was synthesized using the method describe in Ref.
[20]. MP has following constants after vacuum distillation and drying under magnesium sulfate:
d420= 0.867 (lit. 0.867); nd
20=1.448 (lit. 1.448). Butyl acrylate (BA), dimethyl maleate (DMM),
N-vinylpyrrolidone (NVP) were received from Merk and purified by vacuum distillation.All
other solvents and reagents were obtained from Aldrich (Milwaukee, WI, USA).
Comb-like PEG-containing macromolecules of various architectures were synthesized
via radical homo- or copolymerization of PEGMA475 ([monomer]=1.0mol/l) initiated by AIBN
([AIBN]=0.06 mol/l) in the presence of MP ([MP]=0.25mol/l) as chain transfer agent. Reaction
mixtures preparing for PEGMA polymerization are described below. For synthesis of
poly(PEGMA)-MP polymer, AIBN was dissolved in dry 1.4-dioxane, then PEGMA and MP
were added to AIBN solution. Synthesis of poly(PEGMA475-co-BA)-MP and
poly(PEGMA475-co-DMM)-MP was performed as explained below.AIBN was dissolved in dry
1.4-dioxane, then PEGMA (Mn = 475 Da) and BA or DMM were added to the solution ([general
monomer concentration]=1.0 mol/l). The molar ratio of PEGMA475:BA and PEGMA:DMM
were ranged from 2.9:91.7% mol. to 70.8:29.2 % mol. and from 2.9:91.7 % mol. to 73.2:26.8 %

mol., respectively. The reaction mixtures were loaded into calibrated dilatometers and purged
with argon. Polymerization was carried out at 343K till monomer conversion of 60-70% has
been reached, where the latter was controlled by using the dilatometric and gravimetric
techniques. Resulting products were cooled down to the ambient temperature, dried and
fractioned via dropped precipitation and the fractions were dried in vacuum till a constant weight
has been reached. Poly(PEGMA475-co-NVP)-MP was synthesized via polymerization carried
out at 343K till monomer conversion of 60-70%, where the latter was controlled by using the
dilatometric and gravimetric techniques. Resulting products were cooled down to the ambient
temperature, dried and fractioned via dropped precipitation and the fractions were dried in
vacuum till a constant weight has been reached. To obtain copolymers with different contents of
NVP units, a mixture of NVP: PEGMA monomers was used at the following molar ratios:
21.8:79.2 (for [PEGMA-NVP]-III-3); 75.6:24.4 (for [PEGMA-NVP]-III-2) and 48.4:51.6 (for
[PEGMA-NVP]-III-1). Chemical structures of all polymer molecules are collected in Fig.1,
whereas their molar weight fractions and molecular masses – in Table 1.
Fig.1. Chemical structures synthesized and discussed via computer simulations in
current study. I stays for poly(PEGMA), II for poly(PEGMA-co-BA), III for poly(PEGMA-co-
NVP) and IV for poly(PEGMA-co-DMM).
copolymer PEGMA
fraction, %
BA
fraction, %
DMM
fraction, %
NVP
fraction, %
MP
fraction, %
polymer
molar weight,kDa
[PEGMA] 99.8 - - - 0.2 150.0
[PEGMA-co-
BA]
85.7 14.0 - - 0.3 105.0
[PEGMA-co-
DMM]
85,2 - 14.0 - 0.8 25.0
[PEGMA-co-
NVP]-I
84.0 - - 15.4 0.6 45.2
[PEGMA-co-
NVP]-II
93.05 - - 6.5 0.45 59.5
[PEGMA-co-
NVP]-III-1
96.6 - - 3.1 0.3 78.9
Tab.1. Molar mass fractions and molar weights of all polymers being synthesized and
studied ecxperimentally.
As already pointed out in the Introduction, the main motivation for the synthesis and
examination of the properties of this set of PEG-containing copolymers is their potential
application as the cellulase carriers targeted on efficient cellulose hydrolysis. Here we show
some preliminary results for that only, in a form of the comparison between the glucose
production rate for cellulases immobilized within the micelles formed by these polymers vs the
case of the mixture of free cellulases. These results are presented in Fig.2. More results and their
deeper analysis, alongside with the results obtained for other type of polymers, will be given in a
separate paper.
1 2 3 4 5
0,02
0,04
0,06
0,08
0,10
0,12
0,14
0,16
0,18
0,20
glu
cose p
rod
uctio
n r
ate
%/h
ou
r
control
cellulosomes
5oC
1 2 3 4 5
0,02
0,04
0,06
0,08
0,10
0,12
0,14
0,16
0,18
0,20
20oC
1 2 3 4 5
0,02
0,04
0,06
0,08
0,10
0,12
0,14
0,16
0,18
0,20
40oC
1 - control
2 - poly(NVP-co-PEGMA-co-GMA),
Mn=67kDa
3- poly(PEGA-co-DMM),
Mn=30kDa
4 - poly(PEGA),
Mn=180 kDa
5 - poly(PEGA)-bl-poly(NVP),
Mn=250 kDa
Fig.2. Glucose production rate as the result of hydrolysis performed by
free cellulase (indicated as “Cellulase”) and when cellulase is immobilized within
a micelle formed of specific PEG-containing polymer, as indicated in the figure.
All these PEG-containing side chain polymers are known for their micellization abilities
and are, to various extents, examined in relation to the targeted drug delivery [23]. In the current
study we examine possible correlation between their micellization abilities and the efficiency of
the cellulose hydrolysis. It might be expected, that the size, shape and internal structure of the
micelles, serving as the hosts for cellulases, all play an important role in the process of
hydrolysis. If so, then all these properties may be related to the experimentally observed
differences in the glucose production rate shown in Fig.2.
Visualization of the micellar structures is performed via the TEM images are
presented in Fig.3, from where one can observe the differences between their size and shape.
Fig.3. TEM images for the micellar structures formed in water at the
polymer concentration of 30mg/l, polymers are indicated within the images.
copolymer Rh,
nm
CMC.104,
mol/l
σCMC,
mN/m
Г∞.106,
mol/m2
S0,
Å2 NTU
[PEGMA] 270 6.75 43.1 0.67 247 332
[PEGMA-co-
BA] 160 8.26 39.3 0.92 180 101
[PEGMA-co-
DMM] 152.5 23.3 46.7 1.11 150 3,7
[PEGMA-co-
NVP]-III-1 107.5 14.6 51.7 0.51 105 2.0
[PEGMA-co- 225 11.9 50.1 0.60 155 150
NVP]-III-2
[PEGMA-co-
NVP]-III-3 240 9.75 49.3 0.60 180 210
Tab.2. Tab.2. Chemical colloidal characteristics of micelles are listed in Tab. 2.
Here Rh is the average hydrodynamics radius measured via dynamic light scattering,
CMC is the critical micelle concentration, is the surface tension, σCMC the surface
tension, Г∞ is maximal adsorption at the water-air interface, S0 is average minimum area
per polymer molecule and NTU is turbidity of aqueous solution
The influence of the fine structures of the polymers on their solubility, surface activity
and ability to form micelle-like self-organized assemblies in water solution is quantified via their
respective colloidal-chemical characteristics, listed in Tab. 2, these are obtained used a number
of experimental techniques specified below. Gel permeable chromatography (GPC) was used for
polymeric molecular weight determination. Presented results were obtained by Waters 150C
chromatograph with a builtin RI detector (Waters Corporation, Milford, USA), a Shodex 602
column (Kawasaki, Japan), the flow rate was varied (0.5 and 2.5 cm3 min–1). Dynamic light
scattering(DLS) method was used for micellar sizes measurement by DynaProNanoStar(Wyatt
Technology, Santa Barbara, USA) instruments and photon correlation spectra using the Non-
InvasiveBack Scatter (NIBS) technology at 25 °C. For preparation of samples for DLS polymer
was dissolved in bidistilled water (pH – 6.5 – 7.0) for 0.05 g⋅mL-1concentration and measured
every sample by three-time. Solutions for DLS study were kept 24 h before the measurement.
Hydrodynamic radii in this article presented by intensity of scattered light. TEM micrographs of
the polymeric micelles were obtained with a transmission electron microscope JEM-200А
(JEOL, Japan) at an accelerating voltage of 200 kV. The specimens for TEM were prepared by
dropping 3 μL of sample solution onto a copper TEM grid (300 mesh) coated with thin, electron-
transparent carbon film. After 1 min the solution was removed by touching the bottom of the grid
with filtering paper (fast drying method). This fast removal of the solution was performed in
order to minimize oversaturation artifacts during the drying process. Before the TEM
observation, the samples were left to dry completely at room temperature.
Surface tension of polymeric surfactant solutions was studied by using the method of
measurement of maximum bubble pressure24 on Sensa Dyne bubble pressure tensiometer
QC3000 (Gardco, USA). The device was calibrated using bidistilled water before the
measurements. Polymeric solutions at different concentrations were prepared and keptfor at least
24 h before the measurement. It was assumed that equilibrium was reached if the surface tension
variation was lesser 0.01mN⋅m−1 during 10 min. PEG-containing polymers were dissolved in
bidistilledwater, pH value was 6.5–7.0. The measurements were carried out in thethermostated
Teflon cell at 25 °C.
The values of polymeric maximal adsorption (Γ∞, mol⋅m−2)25 were calculated using Eq.
(1) and (2)26 fromthe experimental plots ofisotherms of surface tension of the solutions.
(1)
(2)
in Eq. (1): - C (dσ/d lgC) is the slope of the curve of surface tension versus the logarithm
of surfactant concentration; in Eq. (3): 1/ is the slope of the curve of dependence of C/Γ - C,
and α/ is segment on the ordinate (α - constant Eq. (2)); R is an ideal gas constant, T is
temperature. The average minimum area per molecule (S0,Å2) is evaluated using the
equationError! Bookmark not defined.:
S0=1/(NA⋅ )×1020 (3)
where NA is Avogadro’s number.
Due to the tight arrangement of the PEG side chains along the backbone of
poly(PEGMA)-MP, these have relatively rigid structure, and, therefore, are less surface active
and form micelle-like assemblies at higher concentrations. Analysis of the results of colloidal-
chemical study of other PEG containing comb-like surfactants confirms the determinative
influence of the arrangement of side PEG chains on polymer dissolution and colloidal-chemical
characteristics. One can see in Tab.2, that dilution of the PEGMA side chains by the
hydrophobic DMM chains doesn’t reduce polymer solubility as it was expected, moreover, the
solubility of the poly(PEGMA-co-DMM)-MP in water increases significantly in comparison
with poly(PEGMA)-MP. This is caused, in our opinion, by the enhancement of the accessibility
of side PEG chains for water molecules and hydration. At the same time, this does not lead to the
increase of the surface activity, micelle forming ability and impedes tight packing aggregates
formed by poly(PEGMA-co-DMM)-MP molecules. As a result, self-assemblies formed by
poly(PEGMA-co-DMM)-MP are characterized by smaller size (60-90 nm) in contrast to self-
assemblies formed by poly(PEGMA)-MP molecules (from 100 nm to 500 nm) in water solution.
The CMC value, surface tension and size of micelle-like assemblies formed by poly(PEGMA-
co-BA)-MP in water solution are smaller than for poly(PEGMA)-MP due to, evidently,
hydrophobic contribution of BA links in HLB value and increase of the backbone flexibility
(Table 3, Fig. 5), however, for both comb-like polymers the sizes increase with the enhancement
of polymer concentration in the solution and content of PEGMA units in molecules of
poly(PEGMA-co-BA)-MP.
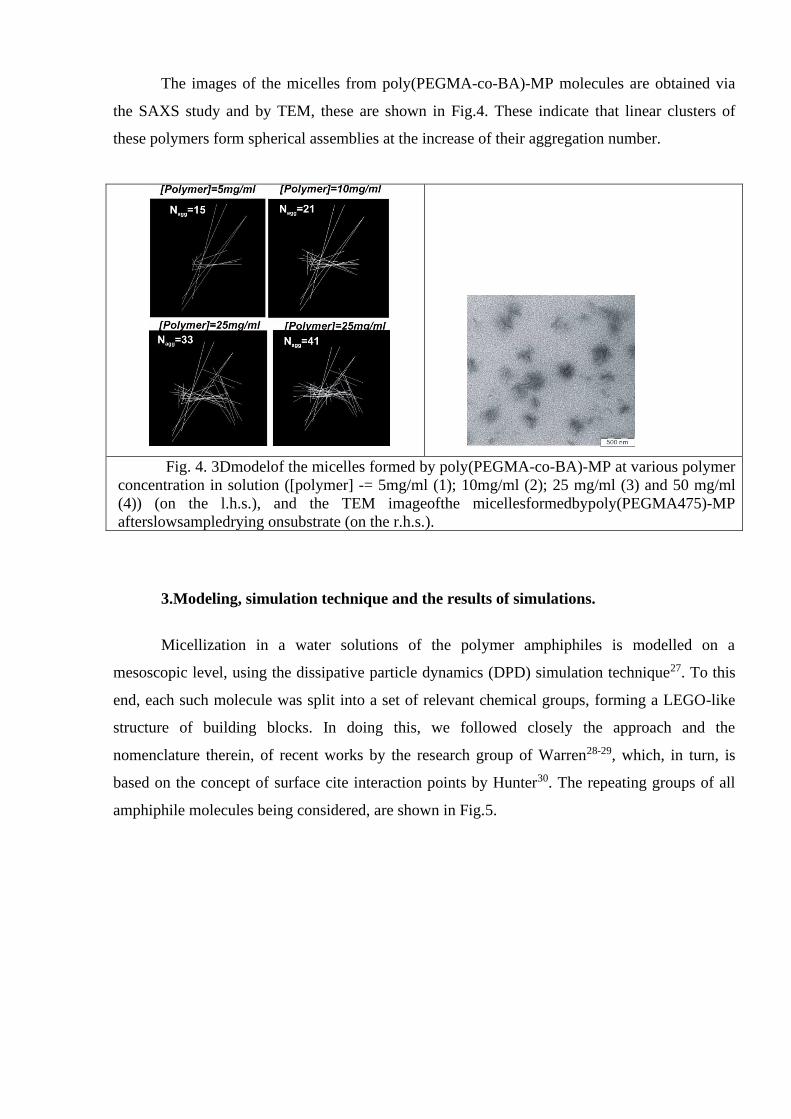
The images of the micelles from poly(PEGMA-co-BA)-MP molecules are obtained via
the SAXS study and by TEM, these are shown in Fig.4. These indicate that linear clusters of
these polymers form spherical assemblies at the increase of their aggregation number.
Fig. 4. 3Dmodelof the micelles formed by poly(PEGMA-co-BA)-MP at various polymer
concentration in solution ([polymer] -= 5mg/ml (1); 10mg/ml (2); 25 mg/ml (3) and 50 mg/ml
(4)) (on the l.h.s.), and the TEM imageofthe micellesformedbypoly(PEGMA475)-MP
afterslowsampledrying onsubstrate (on the r.h.s.).
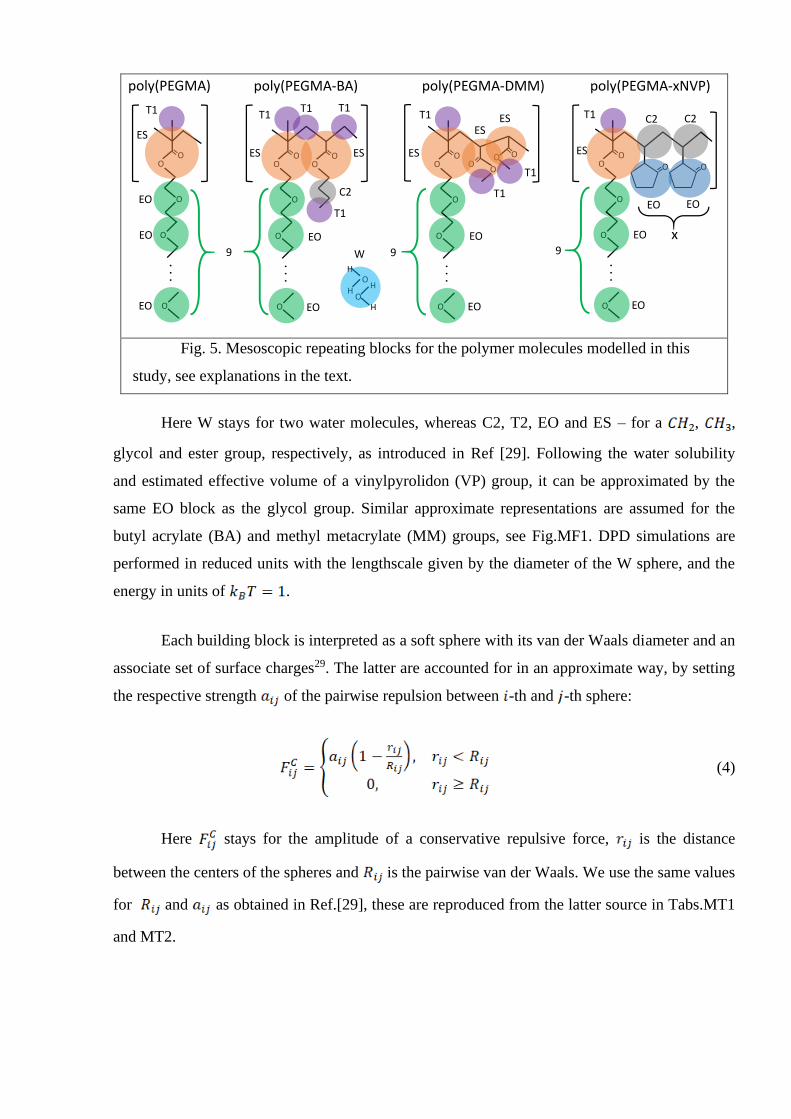
3.Modeling, simulation technique and the results of simulations.
Micellization in a water solutions of the polymer amphiphiles is modelled on a
mesoscopic level, using the dissipative particle dynamics (DPD) simulation technique27. To this
end, each such molecule was split into a set of relevant chemical groups, forming a LEGO-like
structure of building blocks. In doing this, we followed closely the approach and the
nomenclature therein, of recent works by the research group of Warren28-29, which, in turn, is
based on the concept of surface cite interaction points by Hunter30. The repeating groups of all
amphiphile molecules being considered, are shown in Fig.5.
poly(PEGMA-xNVP)
OO
O
ES
T1
OO
OO
poly(PEGMA-DMM)
OO
O
O
EO
ES
T1
poly(PEGMA)
O OO
O
O
ES
T1 C2
EO
x
HO
H
HO
H
W
ESES C2
EO
T1
T1
OO
O
ES
T1
OO
T1 T1
ES
poly(PEGMA-BA)
. . .
9
O
O
. . .
OEO
EO O
. . .
O
9
O
. . .
O
9EO
EO
EO
EO
EO
EO
T1
C2
Fig. 5. Mesoscopic repeating blocks for the polymer molecules modelled in this
study, see explanations in the text.
Here W stays for two water molecules, whereas C2, T2, EO and ES – for a , ,
glycol and ester group, respectively, as introduced in Ref [29]. Following the water solubility
and estimated effective volume of a vinylpyrolidon (VP) group, it can be approximated by the
same EO block as the glycol group. Similar approximate representations are assumed for the
butyl acrylate (BA) and methyl metacrylate (MM) groups, see Fig.MF1. DPD simulations are
performed in reduced units with the lengthscale given by the diameter of the W sphere, and the
energy in units of .
Each building block is interpreted as a soft sphere with its van der Waals diameter and an
associate set of surface charges29. The latter are accounted for in an approximate way, by setting
the respective strength of the pairwise repulsion between -th and -th sphere:
(4)
Here stays for the amplitude of a conservative repulsive force, is the distance
between the centers of the spheres and is the pairwise van der Waals. We use the same values
for and as obtained in Ref.[29], these are reproduced from the latter source in Tabs.MT1
and MT2.
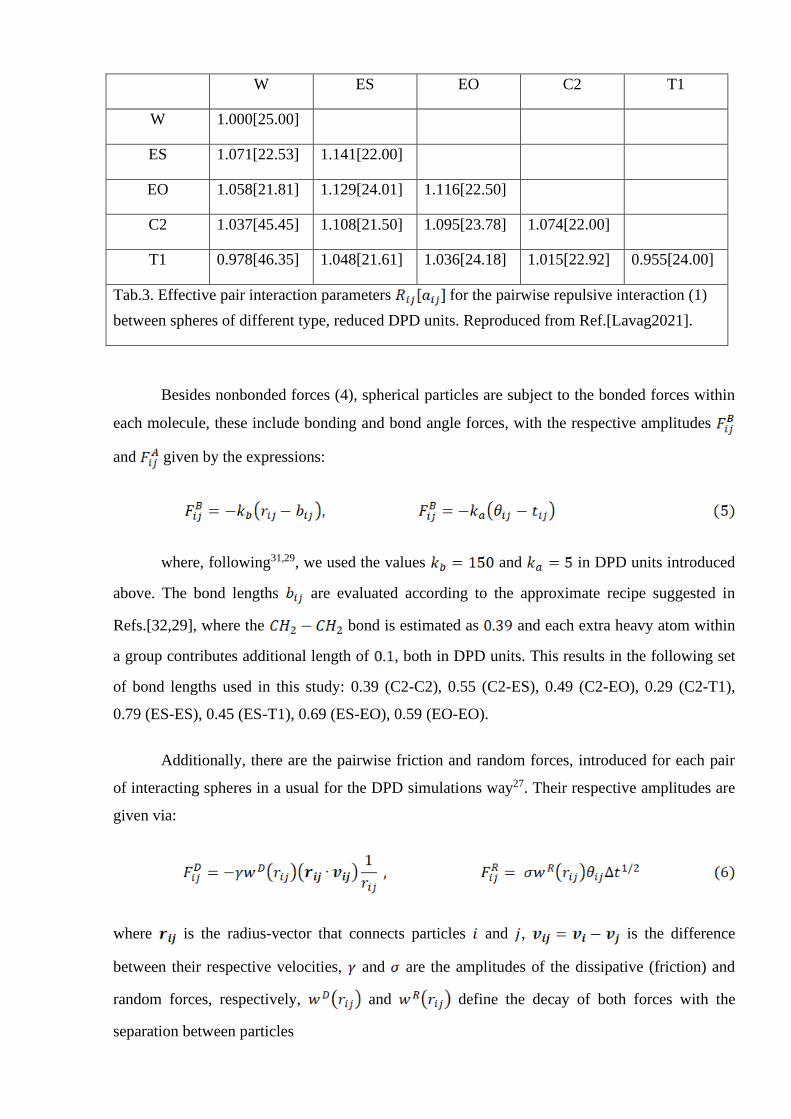
W ES EO C2 T1
W 1.000[25.00]
ES 1.071[22.53] 1.141[22.00]
EO 1.058[21.81] 1.129[24.01] 1.116[22.50]
C2 1.037[45.45] 1.108[21.50] 1.095[23.78] 1.074[22.00]
T1 0.978[46.35] 1.048[21.61] 1.036[24.18] 1.015[22.92] 0.955[24.00]
Tab.3. Effective pair interaction parameters for the pairwise repulsive interaction (1)
between spheres of different type, reduced DPD units. Reproduced from Ref.[Lavag2021].
Besides nonbonded forces (4), spherical particles are subject to the bonded forces within
each molecule, these include bonding and bond angle forces, with the respective amplitudes
and given by the expressions:
where, following31,29, we used the values and in DPD units introduced
above. The bond lengths are evaluated according to the approximate recipe suggested in
Refs.[32,29], where the bond is estimated as and each extra heavy atom within
a group contributes additional length of , both in DPD units. This results in the following set
of bond lengths used in this study: 0.39 (C2-C2), 0.55 (C2-ES), 0.49 (C2-EO), 0.29 (C2-T1),
0.79 (ES-ES), 0.45 (ES-T1), 0.69 (ES-EO), 0.59 (EO-EO).
Additionally, there are the pairwise friction and random forces, introduced for each pair
of interacting spheres in a usual for the DPD simulations way27. Their respective amplitudes are
given via:
where is the radius-vector that connects particles and , is the difference
between their respective velocities, and are the amplitudes of the dissipative (friction) and
random forces, respectively, and define the decay of both forces with the
separation between particles
is the Gaussian random variable. For more details see Ref. [27]. Because of a
relatively high value of a spring constant , as compared to the initial value of
used in Ref.[27], the simulations are performed with a small time step of 29. Each
simulated case comprises in total DPD steps, of which the first (depending
on the polymer) are allowed for equilibration.
To match experimental conditions, one would prefer the situation, where a simulation
box contains at least few micelles to allow averaging over their sizes and shapes. On a top of
that, relatively long simulation times are required, because of slow dynamics of macromolecules
and their sub-micellar aggregates, and, therefore, the metastability effects. Both factors put a
huge strain on the expenditure of computational time, especially for the models with explicit
solvent, as is the case for the DPD approach, and may turn the simulations completely
unfeasible.
To overcome these difficulties, we restrict molecular masses of the model amphiphiles.
Namely, all model molecules contain fixed number of 16 PEG side chain blocks in the case of
each polymer, assembled according to Fig.5. Simulation box is also restricted in size to the
in DPD units. Then, assuming the number density of 3, as first suggested by Groot
and Warren27 based on fits of the model compressibility to that of water, one arrives at the total
number of spherical particles equal to 192000. Each molecule type is assembled according to
Fig.5, therefore, we consider in total 6 model amphiphiles: poly(PEGMA), poly(PEGMA-co-
BA), poly(PEGMA-co-DMM) and poly(PEGMA-co-xNVP), where x=2,3,4. This allows us to
both study the role of the type of separators placed in between PEGMA side chains, and their
number, in the case of NVP.
Following suggested protocol for simulation of micellization33, there are several ways to
define the micellar aggregates based on positions of individual monomers of the amphiphiles.
We used the following criteria: two amphiphiles, , , are assumed to belong to the same
aggregate if there are at least two pairs of monomers (where one monomer of a pair belongs to
th amphiphile and the other – to th one) with the separation less than unit lengths. Then, the
network of linked molecules is constructed, with the periodic boundary conditions being taken
into account. This network defines all amphiphilic molecules participated in an aggregate and,
consequently, the set of all monomers they are formed of. To collect statistics on aggregation,
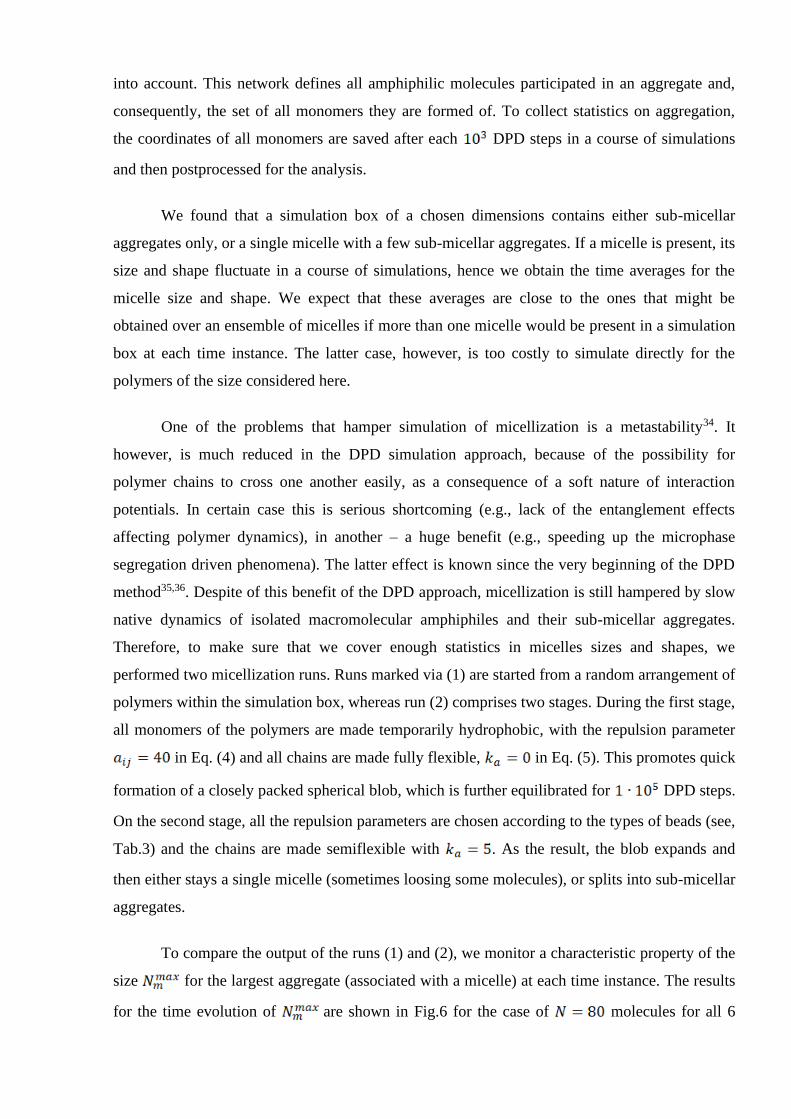
the coordinates of all monomers are saved after each DPD steps in a course of simulations
and then postprocessed for the analysis.
We found that a simulation box of a chosen dimensions contains either sub-micellar
aggregates only, or a single micelle with a few sub-micellar aggregates. If a micelle is present, its
size and shape fluctuate in a course of simulations, hence we obtain the time averages for the
micelle size and shape. We expect that these averages are close to the ones that might be
obtained over an ensemble of micelles if more than one micelle would be present in a simulation
box at each time instance. The latter case, however, is too costly to simulate directly for the
polymers of the size considered here.
One of the problems that hamper simulation of micellization is a metastability34. It
however, is much reduced in the DPD simulation approach, because of the possibility for
polymer chains to cross one another easily, as a consequence of a soft nature of interaction
potentials. In certain case this is serious shortcoming (e.g., lack of the entanglement effects
affecting polymer dynamics), in another – a huge benefit (e.g., speeding up the microphase
segregation driven phenomena). The latter effect is known since the very beginning of the DPD
method35,36. Despite of this benefit of the DPD approach, micellization is still hampered by slow
native dynamics of isolated macromolecular amphiphiles and their sub-micellar aggregates.
Therefore, to make sure that we cover enough statistics in micelles sizes and shapes, we
performed two micellization runs. Runs marked via (1) are started from a random arrangement of
polymers within the simulation box, whereas run (2) comprises two stages. During the first stage,
all monomers of the polymers are made temporarily hydrophobic, with the repulsion parameter
in Eq. (4) and all chains are made fully flexible, in Eq. (5). This promotes quick
formation of a closely packed spherical blob, which is further equilibrated for DPD steps.
On the second stage, all the repulsion parameters are chosen according to the types of beads (see,
Tab.3) and the chains are made semiflexible with . As the result, the blob expands and
then either stays a single micelle (sometimes loosing some molecules), or splits into sub-micellar
aggregates.
To compare the output of the runs (1) and (2), we monitor a characteristic property of the
size for the largest aggregate (associated with a micelle) at each time instance. The results
for the time evolution of are shown in Fig.6 for the case of molecules for all 6
amphiphiles. One can see that after the system equilibrates during DPD steps
(depending on the polymer type), both approaches provide very similar time evolution for .
The time interval from to DPD steps provides the statistics for all the
properties of the interest.
0
20
40
60
80
100
0 1 2 3 nst x 10-6
poly(PEGMA)
Nm
max
(1) (2)
0
20
40
60
80
100
0 1 2 3 nst x 10-6
poly(PEGMA-co-2NVP)
Nm
max
(1) (2)
0
20
40
60
80
100
0 1 2 3 nst x 10-6
poly(PEGMA-co-BA)
Nm
max
(1) (2)
0
20
40
60
80
100
0 1 2 3 nst x 10-6
poly(PEGMA-co-3NVP)
Nm
max
(1) (2)
0
20
40
60
80
100
0 1 2 3 nst x 10-6
poly(PEGMA-co-DMM)
Nm
max
(1) (2)
0
20
40
60
80
100
0 1 2 3 nst x 10-6
poly(PEGMA-co-4NVP)
Nm
max
(1) (2)
Fig.6. Time evolution for the size of the largest aggregate (in
number of molecules) at each time step. Types of molecular architectures are
indicated in the plot according to Fig.5. Both types of runs, (1) and (2), are shown
in each case, see text for details.
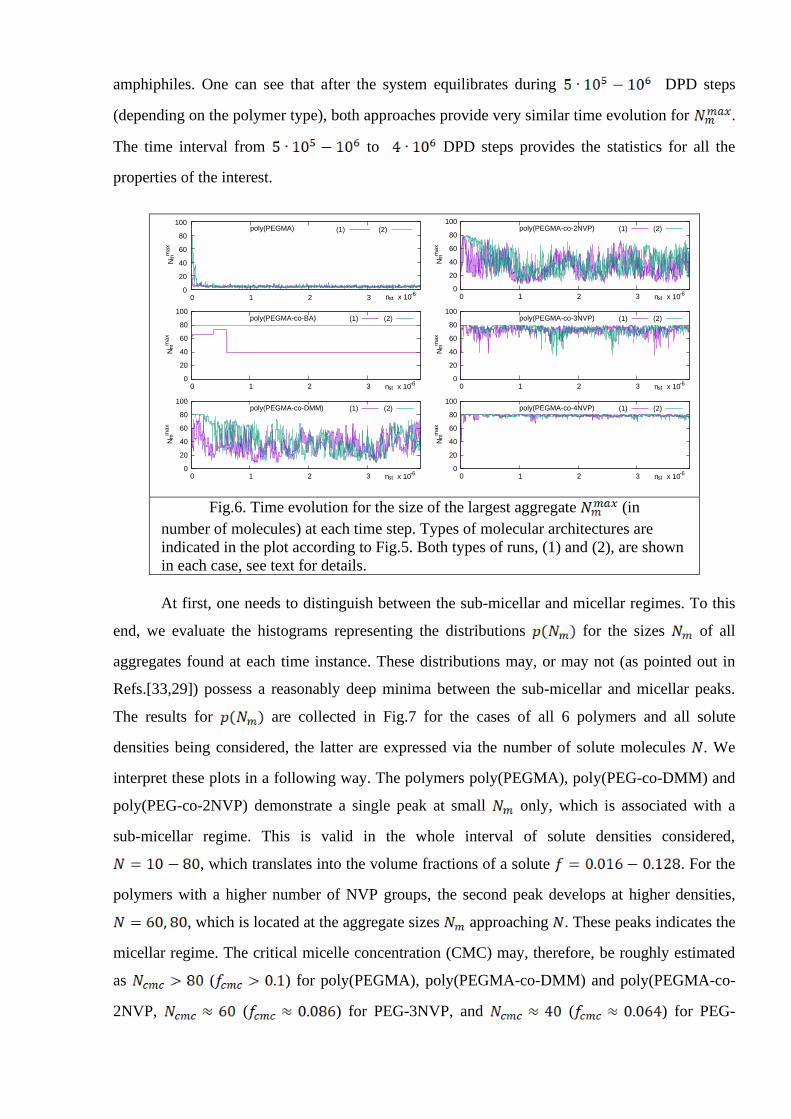
At first, one needs to distinguish between the sub-micellar and micellar regimes. To this
end, we evaluate the histograms representing the distributions for the sizes of all
aggregates found at each time instance. These distributions may, or may not (as pointed out in
Refs.[33,29]) possess a reasonably deep minima between the sub-micellar and micellar peaks.
The results for are collected in Fig.7 for the cases of all 6 polymers and all solute
densities being considered, the latter are expressed via the number of solute molecules . We
interpret these plots in a following way. The polymers poly(PEGMA), poly(PEG-co-DMM) and
poly(PEG-co-2NVP) demonstrate a single peak at small only, which is associated with a
sub-micellar regime. This is valid in the whole interval of solute densities considered,
, which translates into the volume fractions of a solute . For the
polymers with a higher number of NVP groups, the second peak develops at higher densities,
, which is located at the aggregate sizes approaching . These peaks indicates the
micellar regime. The critical micelle concentration (CMC) may, therefore, be roughly estimated
as ( ) for poly(PEGMA), poly(PEGMA-co-DMM) and poly(PEGMA-co-
2NVP, ( ) for PEG-3NVP, and ( ) for PEG-
4NVP. Such two-maxima form for the distributions bears similarities with the first-order
phase transitions, e.g. a liquid-vapor of nematic-isotropic ones37. Unfortunately, the simulations
are not able to analyze the micellization of the poly(PEGMA-co-BA), as the model system is
found to be trapped in a long living metastable state, which strongly depends on the initial
arrangement of the polymers within a simulation box. For runs of type (2) for this polymer,
displayed in Fig.7, the histograms for turned into a δ-like spikes .
-
0
0.1
0.2
0 10 20 30 40 50 60 70 80 Nm
poly(PEGMA)
p(N
m)
N=10N=20N=40N=60N=80
0
0.1
0.2
0 10 20 30 40 50 60 70 80 Nm
poly(PEGMA-co-2NVP)
p(N
m)
N=10N=20N=40N=60N=80
0
0.1
0.2
0 10 20 30 40 50 60 70 80 Nm
poly(PEGMA-co-BA)
p(N
m)
N=10N=20N=40N=60N=80
0
0.1
0.2
0 10 20 30 40 50 60 70 80 Nm
poly(PEGMA-co-3NVP)
p(N
m)
N=10N=20N=40N=60N=80
0
0.1
0.2
0 10 20 30 40 50 60 70 80 Nm
poly(PEGMA-co-DMM)
p(N
m)
N=10N=20N=40N=60N=80
0
0.1
0.2
0 10 20 30 40 50 60 70 80 Nm
poly(PEGMA-co-4NVP)
p(N
m)
N=10N=20N=40N=60N=80
Fig. 7. Histograms representing distributions for the size of all aggregates in a
solution for each molecular architecture at each solute density represented in terms of the
number of solute molecules .
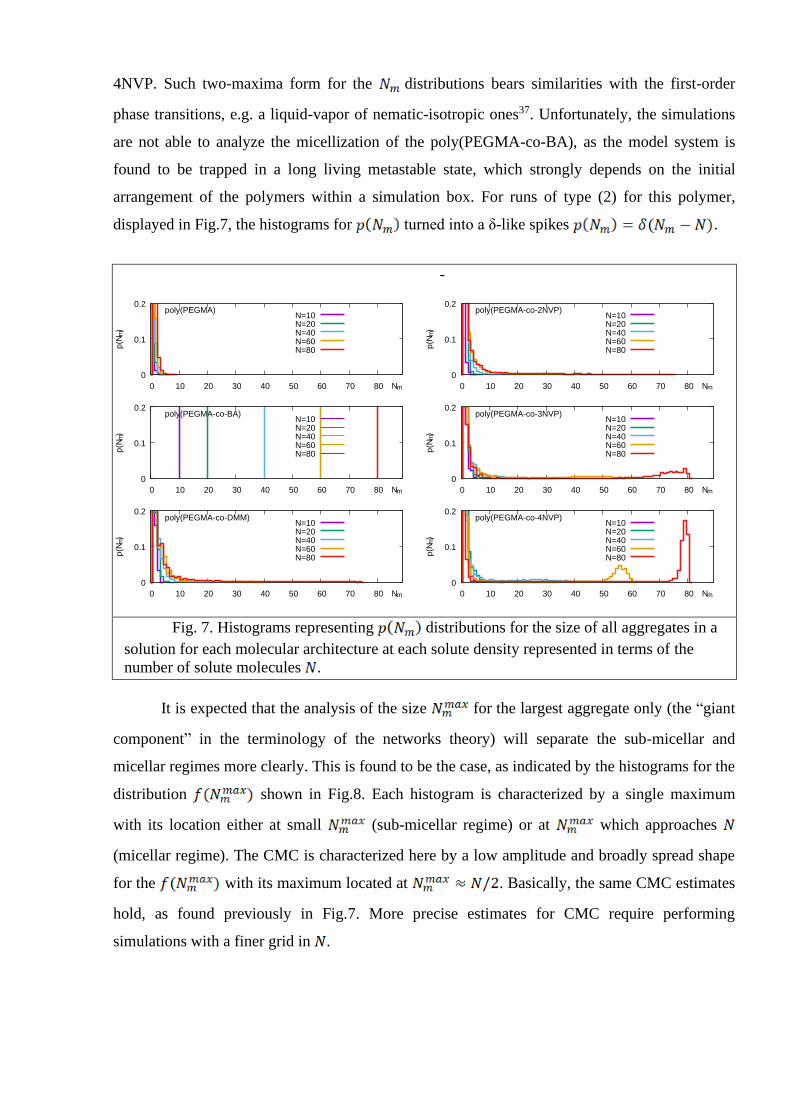
It is expected that the analysis of the size for the largest aggregate only (the “giant
component” in the terminology of the networks theory) will separate the sub-micellar and
micellar regimes more clearly. This is found to be the case, as indicated by the histograms for the
distribution shown in Fig.8. Each histogram is characterized by a single maximum
with its location either at small (sub-micellar regime) or at which approaches
(micellar regime). The CMC is characterized here by a low amplitude and broadly spread shape
for the with its maximum located at . Basically, the same CMC estimates
hold, as found previously in Fig.7. More precise estimates for CMC require performing
simulations with a finer grid in .
0
0.1
0.2
0.3
0.4
0.5
0 10 20 30 40 50 60 70 80 Nmmax
poly(PEGMA)
p(N
mm
ax )
N=10N=20N=40N=60N=80
0
0.1
0.2
0.3
0.4
0.5
0 10 20 30 40 50 60 70 80 Nmmax
poly(PEGMA-co-2NVP)
p(N
mm
ax )
N=10N=20N=40N=60N=80
0
0.1
0.2
0.3
0.4
0.5
0 10 20 30 40 50 60 70 80 Nmmax
poly(PEGMA-co-BA)
p(N
mm
ax )
N=10N=20N=40N=60N=80
0
0.1
0.2
0.3
0.4
0.5
0 10 20 30 40 50 60 70 80 Nmmax
poly(PEGMA-co-3NVP)
p(N
mm
ax )
N=10N=20N=40N=60N=80
0
0.1
0.2
0.3
0.4
0.5
0 10 20 30 40 50 60 70 80 Nmmax
poly(PEGMA-co-DMM)
p(N
mm
ax )
N=10N=20N=40N=60N=80
0
0.1
0.2
0.3
0.4
0.5
0 10 20 30 40 50 60 70 80 Nmmax
poly(PEGMA-co-4NVP)
p(N
mm
ax )
N=10N=20N=40N=60N=80
Fig. 8. Histograms representing distributions for the size of the largest
aggregate in a solution for each molecular architecture at each solute density represented in
terms of the number of solute molecules .
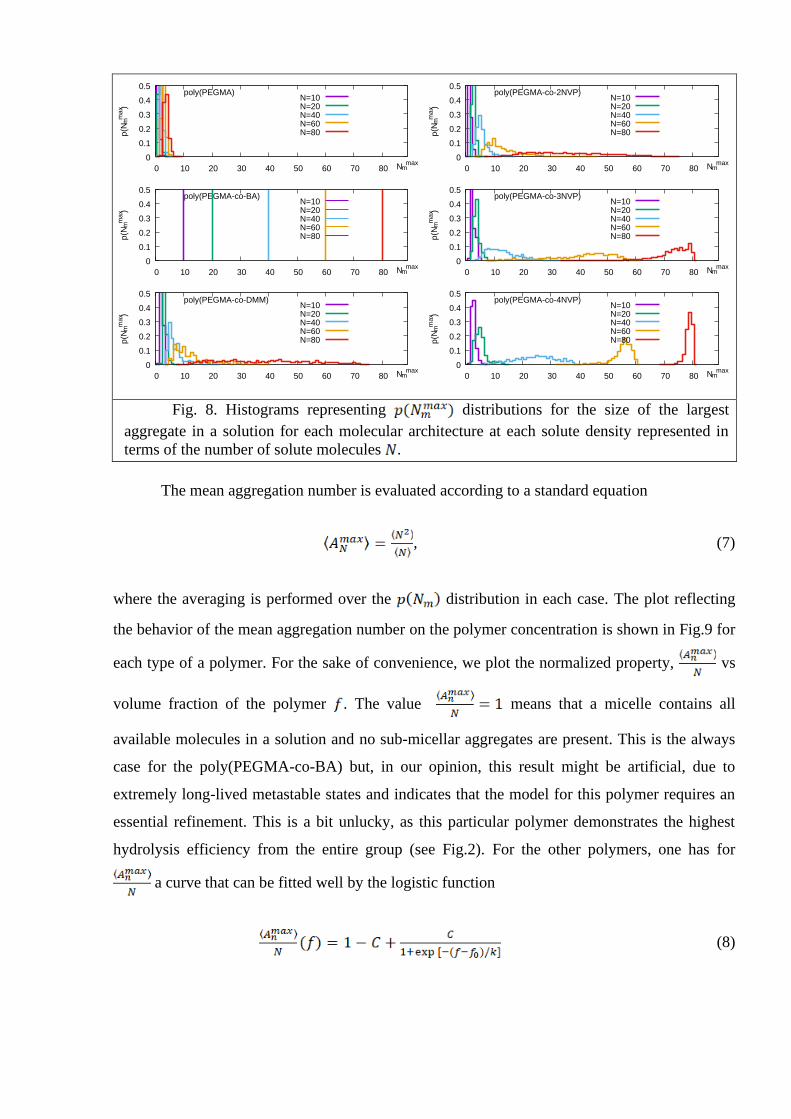
The mean aggregation number is evaluated according to a standard equation
, (7)
where the averaging is performed over the distribution in each case. The plot reflecting
the behavior of the mean aggregation number on the polymer concentration is shown in Fig.9 for
each type of a polymer. For the sake of convenience, we plot the normalized property, vs
volume fraction of the polymer . The value means that a micelle contains all
available molecules in a solution and no sub-micellar aggregates are present. This is the always
case for the poly(PEGMA-co-BA) but, in our opinion, this result might be artificial, due to
extremely long-lived metastable states and indicates that the model for this polymer requires an
essential refinement. This is a bit unlucky, as this particular polymer demonstrates the highest
hydrolysis efficiency from the entire group (see Fig.2). For the other polymers, one has for
a curve that can be fitted well by the logistic function
(8)
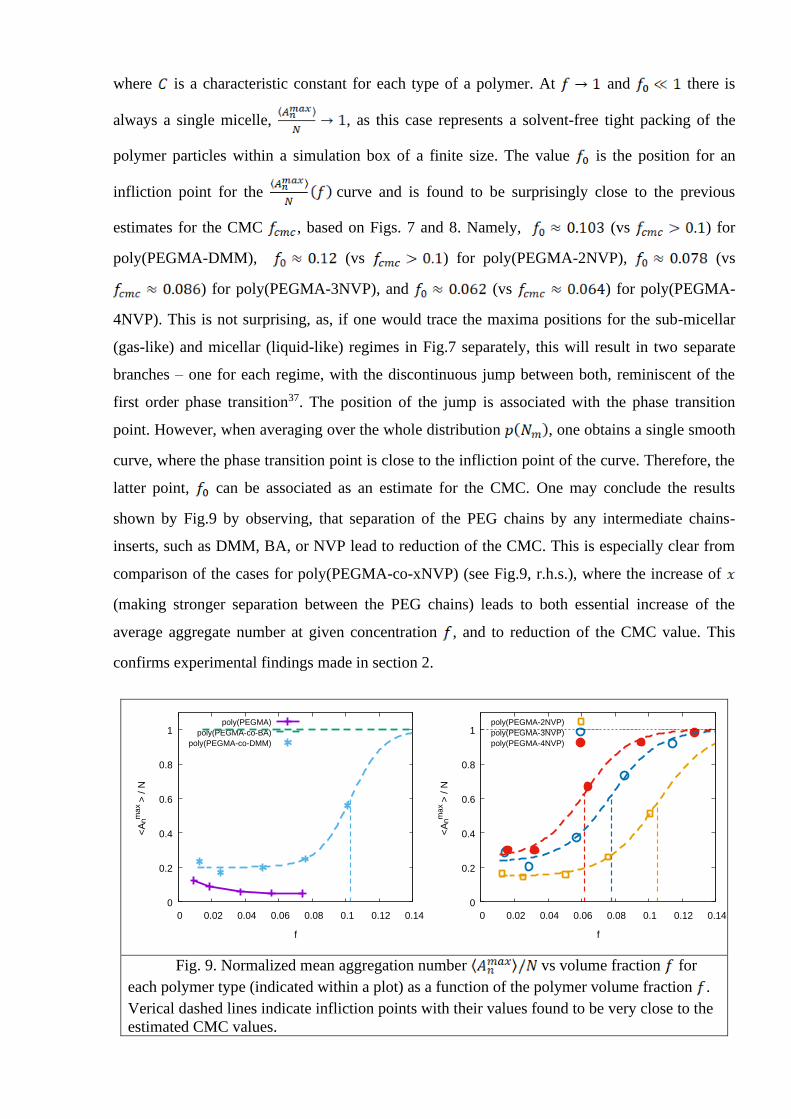
where is a characteristic constant for each type of a polymer. At and there is
always a single micelle, , as this case represents a solvent-free tight packing of the
polymer particles within a simulation box of a finite size. The value is the position for an
infliction point for the curve and is found to be surprisingly close to the previous
estimates for the CMC , based on Figs. 7 and 8. Namely, (vs ) for
poly(PEGMA-DMM), (vs ) for poly(PEGMA-2NVP), (vs
) for poly(PEGMA-3NVP), and (vs ) for poly(PEGMA-
4NVP). This is not surprising, as, if one would trace the maxima positions for the sub-micellar
(gas-like) and micellar (liquid-like) regimes in Fig.7 separately, this will result in two separate
branches – one for each regime, with the discontinuous jump between both, reminiscent of the
first order phase transition37. The position of the jump is associated with the phase transition
point. However, when averaging over the whole distribution , one obtains a single smooth
curve, where the phase transition point is close to the infliction point of the curve. Therefore, the
latter point, can be associated as an estimate for the CMC. One may conclude the results
shown by Fig.9 by observing, that separation of the PEG chains by any intermediate chains-
inserts, such as DMM, BA, or NVP lead to reduction of the CMC. This is especially clear from
comparison of the cases for poly(PEGMA-co-xNVP) (see Fig.9, r.h.s.), where the increase of
(making stronger separation between the PEG chains) leads to both essential increase of the
average aggregate number at given concentration , and to reduction of the CMC value. This
confirms experimental findings made in section 2.
0
0.2
0.4
0.6
0.8
1
0 0.02 0.04 0.06 0.08 0.1 0.12 0.14
<A
nm
ax
> /
N
f
poly(PEGMA)
poly(PEGMA-co-BA)
poly(PEGMA-co-DMM)
0
0.2
0.4
0.6
0.8
1
0 0.02 0.04 0.06 0.08 0.1 0.12 0.14
<A
nm
ax
> /
N
f
poly(PEGMA-2NVP)
poly(PEGMA-3NVP)
poly(PEGMA-4NVP)
Fig. 9. Normalized mean aggregation number vs volume fraction for
each polymer type (indicated within a plot) as a function of the polymer volume fraction .
Verical dashed lines indicate infliction points with their values found to be very close to the
estimated CMC values.
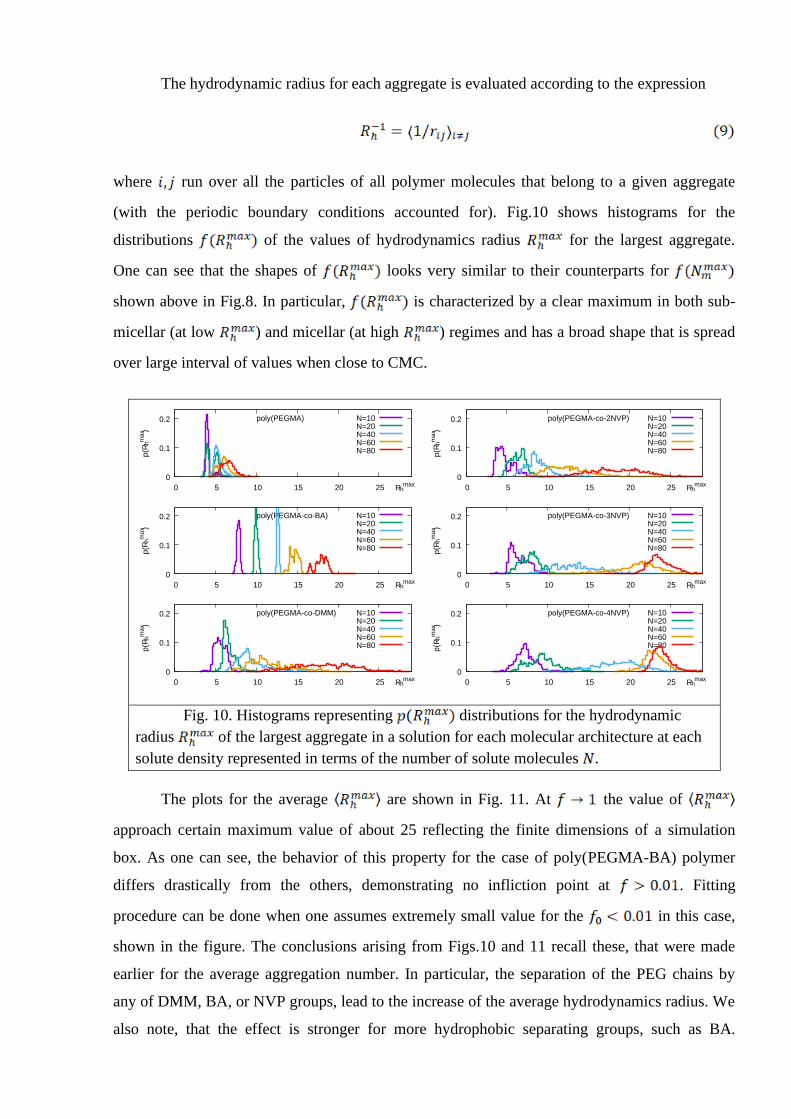
The hydrodynamic radius for each aggregate is evaluated according to the expression
where run over all the particles of all polymer molecules that belong to a given aggregate
(with the periodic boundary conditions accounted for). Fig.10 shows histograms for the
distributions of the values of hydrodynamics radius for the largest aggregate.
One can see that the shapes of looks very similar to their counterparts for
shown above in Fig.8. In particular, is characterized by a clear maximum in both sub-
micellar (at low ) and micellar (at high ) regimes and has a broad shape that is spread
over large interval of values when close to CMC.
0
0.1
0.2
0 5 10 15 20 25 Rhmax
poly(PEGMA)
p(R
hm
ax )
N=10N=20N=40N=60N=80
0
0.1
0.2
0 5 10 15 20 25 Rhmax
poly(PEGMA-co-2NVP)
p(R
hm
ax )
N=10N=20N=40N=60N=80
0
0.1
0.2
0 5 10 15 20 25 Rhmax
poly(PEGMA-co-BA)
p(R
hm
ax )
N=10N=20N=40N=60N=80
0
0.1
0.2
0 5 10 15 20 25 Rhmax
poly(PEGMA-co-3NVP)
p(R
hm
ax )
N=10N=20N=40N=60N=80
0
0.1
0.2
0 5 10 15 20 25 Rhmax
poly(PEGMA-co-DMM)
p(R
hm
ax )
N=10N=20N=40N=60N=80
0
0.1
0.2
0 5 10 15 20 25 Rhmax
poly(PEGMA-co-4NVP)
p(R
hm
ax )
N=10N=20N=40N=60N=80
Fig. 10. Histograms representing distributions for the hydrodynamic
radius of the largest aggregate in a solution for each molecular architecture at each
solute density represented in terms of the number of solute molecules .
The plots for the average are shown in Fig. 11. At the value of
approach certain maximum value of about 25 reflecting the finite dimensions of a simulation
box. As one can see, the behavior of this property for the case of poly(PEGMA-BA) polymer
differs drastically from the others, demonstrating no infliction point at . Fitting
procedure can be done when one assumes extremely small value for the in this case,
shown in the figure. The conclusions arising from Figs.10 and 11 recall these, that were made
earlier for the average aggregation number. In particular, the separation of the PEG chains by
any of DMM, BA, or NVP groups, lead to the increase of the average hydrodynamics radius. We
also note, that the effect is stronger for more hydrophobic separating groups, such as BA.
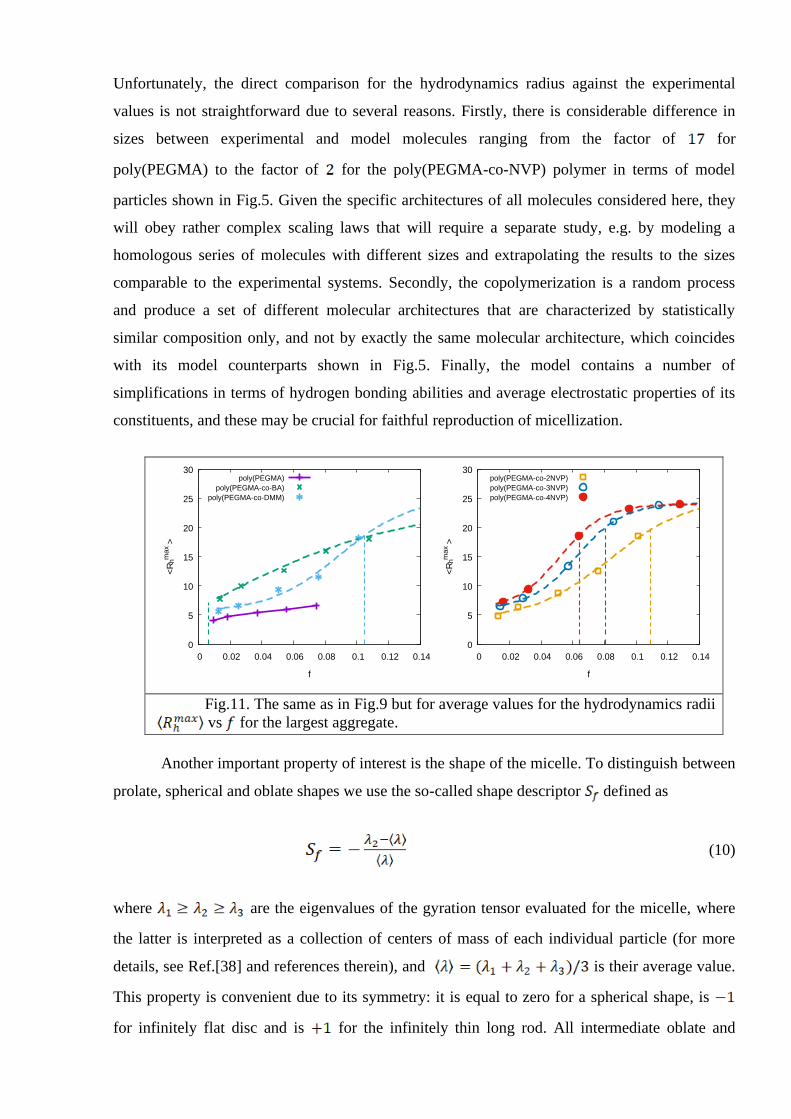
Unfortunately, the direct comparison for the hydrodynamics radius against the experimental
values is not straightforward due to several reasons. Firstly, there is considerable difference in
sizes between experimental and model molecules ranging from the factor of for
poly(PEGMA) to the factor of for the poly(PEGMA-co-NVP) polymer in terms of model
particles shown in Fig.5. Given the specific architectures of all molecules considered here, they
will obey rather complex scaling laws that will require a separate study, e.g. by modeling a
homologous series of molecules with different sizes and extrapolating the results to the sizes
comparable to the experimental systems. Secondly, the copolymerization is a random process
and produce a set of different molecular architectures that are characterized by statistically
similar composition only, and not by exactly the same molecular architecture, which coincides
with its model counterparts shown in Fig.5. Finally, the model contains a number of
simplifications in terms of hydrogen bonding abilities and average electrostatic properties of its
constituents, and these may be crucial for faithful reproduction of micellization.
0
5
10
15
20
25
30
0 0.02 0.04 0.06 0.08 0.1 0.12 0.14
<R
hm
ax
>
f
poly(PEGMA)
poly(PEGMA-co-BA)
poly(PEGMA-co-DMM)
0
5
10
15
20
25
30
0 0.02 0.04 0.06 0.08 0.1 0.12 0.14
<R
hm
ax
>
f
poly(PEGMA-co-2NVP)
poly(PEGMA-co-3NVP)
poly(PEGMA-co-4NVP)
Fig.11. The same as in Fig.9 but for average values for the hydrodynamics radii
vs for the largest aggregate.
Another important property of interest is the shape of the micelle. To distinguish between
prolate, spherical and oblate shapes we use the so-called shape descriptor defined as
(10)
where are the eigenvalues of the gyration tensor evaluated for the micelle, where
the latter is interpreted as a collection of centers of mass of each individual particle (for more
details, see Ref.[38] and references therein), and is their average value.
This property is convenient due to its symmetry: it is equal to zero for a spherical shape, is
for infinitely flat disc and is for the infinitely thin long rod. All intermediate oblate and
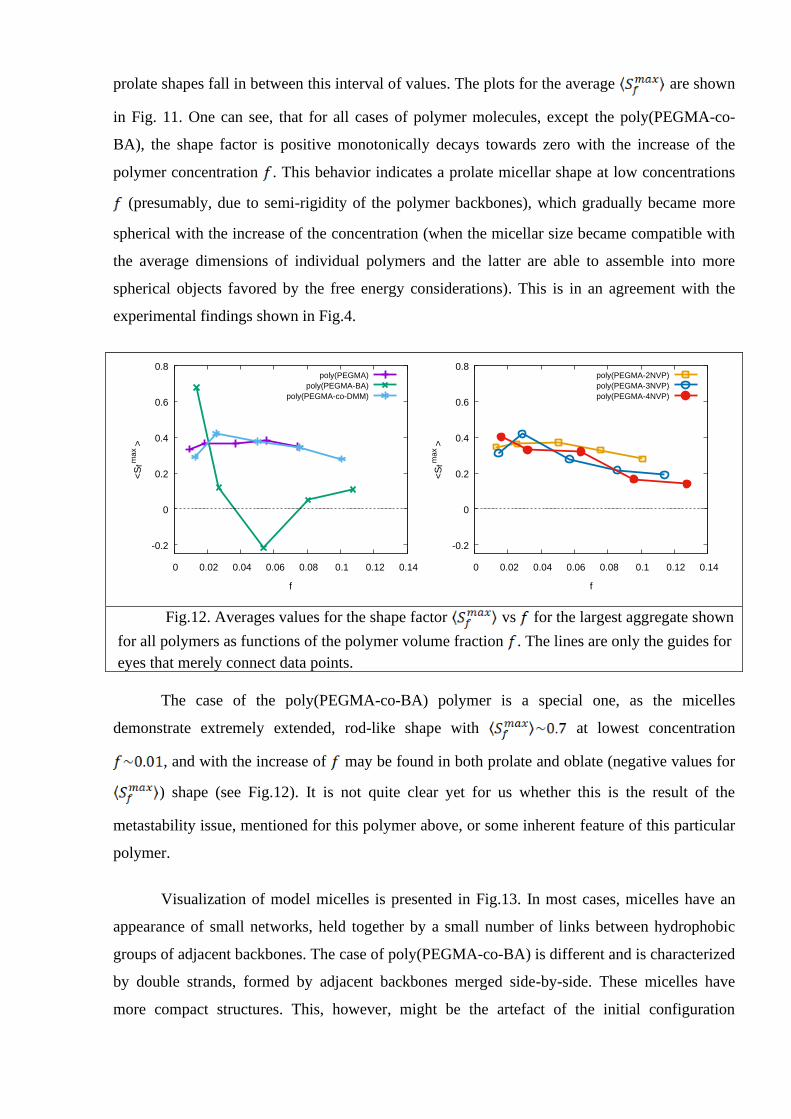
prolate shapes fall in between this interval of values. The plots for the average are shown
in Fig. 11. One can see, that for all cases of polymer molecules, except the poly(PEGMA-co-
BA), the shape factor is positive monotonically decays towards zero with the increase of the
polymer concentration . This behavior indicates a prolate micellar shape at low concentrations
(presumably, due to semi-rigidity of the polymer backbones), which gradually became more
spherical with the increase of the concentration (when the micellar size became compatible with
the average dimensions of individual polymers and the latter are able to assemble into more
spherical objects favored by the free energy considerations). This is in an agreement with the
experimental findings shown in Fig.4.
-0.2
0
0.2
0.4
0.6
0.8
0 0.02 0.04 0.06 0.08 0.1 0.12 0.14
<S
fm
ax
>
f
poly(PEGMA)
poly(PEGMA-BA)
poly(PEGMA-co-DMM)
-0.2
0
0.2
0.4
0.6
0.8
0 0.02 0.04 0.06 0.08 0.1 0.12 0.14
<S
fm
ax
>
f
poly(PEGMA-2NVP)
poly(PEGMA-3NVP)
poly(PEGMA-4NVP)
Fig.12. Averages values for the shape factor vs for the largest aggregate shown
for all polymers as functions of the polymer volume fraction . The lines are only the guides for
eyes that merely connect data points.
The case of the poly(PEGMA-co-BA) polymer is a special one, as the micelles
demonstrate extremely extended, rod-like shape with at lowest concentration
, and with the increase of may be found in both prolate and oblate (negative values for
) shape (see Fig.12). It is not quite clear yet for us whether this is the result of the
metastability issue, mentioned for this polymer above, or some inherent feature of this particular
polymer.
Visualization of model micelles is presented in Fig.13. In most cases, micelles have an
appearance of small networks, held together by a small number of links between hydrophobic
groups of adjacent backbones. The case of poly(PEGMA-co-BA) is different and is characterized
by double strands, formed by adjacent backbones merged side-by-side. These micelles have
more compact structures. This, however, might be the artefact of the initial configuration
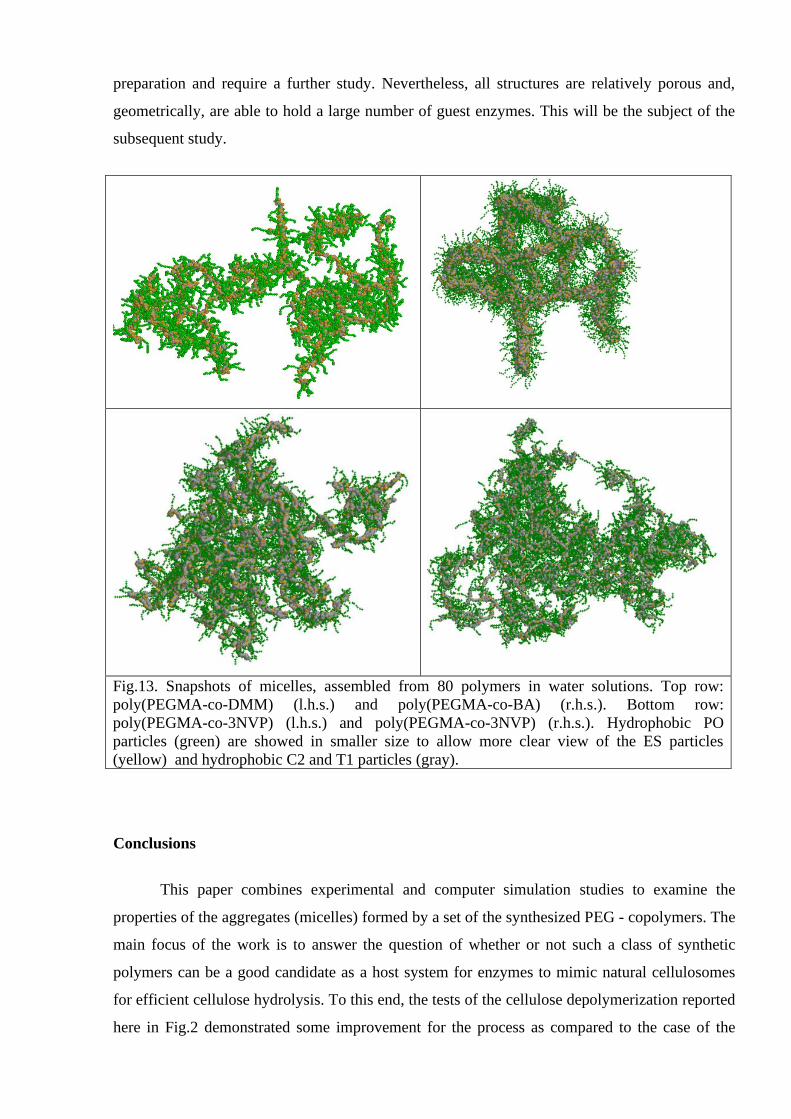
preparation and require a further study. Nevertheless, all structures are relatively porous and,
geometrically, are able to hold a large number of guest enzymes. This will be the subject of the
subsequent study.
Fig.13. Snapshots of micelles, assembled from 80 polymers in water solutions. Top row:
poly(PEGMA-co-DMM) (l.h.s.) and poly(PEGMA-co-BA) (r.h.s.). Bottom row:
poly(PEGMA-co-3NVP) (l.h.s.) and poly(PEGMA-co-3NVP) (r.h.s.). Hydrophobic PO
particles (green) are showed in smaller size to allow more clear view of the ES particles
(yellow) and hydrophobic C2 and T1 particles (gray).
Conclusions
This paper combines experimental and computer simulation studies to examine the
properties of the aggregates (micelles) formed by a set of the synthesized PEG - copolymers. The
main focus of the work is to answer the question of whether or not such a class of synthetic
polymers can be a good candidate as a host system for enzymes to mimic natural cellulosomes
for efficient cellulose hydrolysis. To this end, the tests of the cellulose depolymerization reported
here in Fig.2 demonstrated some improvement for the process as compared to the case of the
mixture of free enzymes. The study was directed towards the search of possible links between
the micellization of each polymer structure and the hydrolysis efficiency of the host-guest system
based on its micellar structure. In particular, it was found that poly(PEGMA-co-BA) micellar
structures are characterized by the highest glucose production rate. The molecular architecture,
specifically the separation between PEG side chains along the polymer backbone, is beneficial
for micelle formation. The micellar structures of this copolymer are stabilized by strong
backbone-backbone interactions and possess pocket-like domains that can accommodate enzyme
molecules. All these results call for future refinement of the molecular models and steer research
towards looking for the polymers with this given set of properties of their micellar structures.
Acknowledgements
The authors acknowledge financial support from the CRDF Global award 66705.
Bibliography
(1) Eriksson, T.; Karlsson, J.; Tjerneld, F. A model explaining declining rate in hydrolysis of
lignocellulose substrates with cellobiohydrolase I (Cel7A) and endoglucanase I (Cel7B) of
Trichoderma reesei. Appl. Biochem. Biotechnol. 2002, 101 (1), 41-60, DOI:
10.1385/abab:101:1:41.
(2) Holtzapple, M.; Cognata, M.; Shu, Y.; Hendrickson, C. Inhibition of trichoderma-reesei
cellulase by sugars and solvents. Biotechnol. Bioeng. 1990, 36 (3), 275-287, DOI:
10.1002/bit.260360310.
(3) Zholobko, O.; Hammed, A.; Zakharchenko, A.; Borodinov, N.; Luzinov, I.; Urbanowicz, B.;
Patsahan, T.; Ilnytskyi, J.; Minko, S.; Pryor, S. W.; Voronov, A. “Biomimetic Cellulosomes
Assembled on Molecular Brush Scaffolds: Random Complexes vs Enzyme Mixtures”. ACS
Applied Polymer Materials 2021, 3 : 1840–1853 (USA).
(4) J. Caspi, D. Irwin, R. Lamed, Yu. Shoham, H.-P. Fierobe, D. B. Wilson, E. A. Bayer, 2006,
Thermobifida fusca family-6 cellulases as potential designer cellulosome components,
Biocatalysis and Biotransformation, 24:1-2, 3-12, DOI: 10.1080/10242420600598046.
(5) X. Qiu†, S. Xie, L. Min, X‑M Wu, L‑Y Zhu, L. Zhu, Spatial organization of enzymes to
enhance synthetic pathways in microbial chassis: a systematic review, Microb Cell Fact, 2018,
17:120, https://doi.org/10.1186/s12934-018-0965-0.
(6) Novick S.J., Rozzell J.D. (2005) Immobilization of Enzymes by Covalent Attachment. In:
Barredo J.L. (eds) Microbial Enzymes and Biotransformations. Methods in Biotechnology, vol
17. Humana Press. https://doi.org/10.1385/1-59259-846-3:247.
(7) H. He, W. Tan, J. Guo, M. Yi, A.N. Shy, B. Xu, Enzymatic Noncovalent Synthesis, Chem.
Rev. 2020, 120, 18, 9994–10078, DOI:10.1021/acs.chemrev.0c00306.
(8) Y. Zhang, Y. Huang, S. Li, Polymeric Micelles: Nanocarriers for Cancer-Targeted Drug
Delivery, AAPS PharmSciTech. 2014 Aug; 15(4): 862–871, doi: 10.1208/s12249-014-0113-z.
(9)Azri, A., Privat, M., Grohens, Y., & Aubry, T. (2013). Linear rheological properties of low
molecular weight polyethylene glycol solutions.Journal of colloid and interface science, 393,
104-108.
(10) Suh, K. Y., Seong, J., Khademhosseini, A., Laibinis, P. E., & Langer, R. (2004).A simple
soft lithographic route to fabrication of poly (ethylene glycol) microstructures for protein and
cell patterning. Biomaterials, 25(3), 557-563.
(11) Chen, Q., Osada, K., Ishii, T., Oba, M., Uchida, S., Tockary, T. A., ...&Itaka, K. (2012).
Homo-catiomer integration into PEGylatedpolyplex micelle from block-catiomer for systemic
anti-angiogenic gene therapy for fibrotic pancreatic tumors. Biomaterials, 33(18), 4722-4730.
(12) Ma, K., Zhang, D., Cong, Y., &Wiesner, U. (2016).Elucidating the mechanism of silica
nanoparticle PEGylation processes using fluorescence correlation spectroscopies. Chemistry of
Materials, 28(5), 1537-1545..
(13) Liu J., Ran Q., Miao C., Zhou D. Synthesis and characterization of comb-like copolymer
dispersant with methoxypoly(ethylene oxide) side chains. PolymerPlastics Technology and
Engineering. 2011. Vol. 50. P. 59-66
(14) De Paul, S. M., Falconnet, D., Pasche, S., Textor, M., Abel, A. P., Kauffmann, E., ...&Ehrat,
M. (2005). Tuned graft copolymers as controlled coatings for DNA microarrays. Analytical
chemistry, 77(18), 5831-5838.
(15) Yoshimoto, K., Matsumoto, S., Asakawa, R., Uchida, K., Ishii, T., &Nagasaki, Y. (2007).
Immobilization and Hybridization Behavior of DNA on Poly (ethylene glycol)-block-Poly [2-(N,
N-dimethylamino) ethyl methacrylate]-modified Gold Surfaces. Chemistry letters, 36(12), 1444-
1445.
(16) TopchievaI.,Karezin K. Self-assembled supramolecular micellar structures based on non-
ionic surfactants and cyclodextrins //Journal of colloid and interface science. – 1999. – Т. 213. –
№. 1. – С. 29-35.
(17) Rosen H. N. Moisture adsorption and swelling in polyethylene glycol and polymethyl
methacrylate treated wood at high relative humidity //Wood and Fiber Science. – 2007. – Т. 7. –
№. 4. – С. 249-255.
(18) Swiergiel, J., &Jadzyn, J. (2018).From supramolecular to conventional
polymers.Polyethylene glycol. Physical Chemistry Chemical Physics.
(19) Derkaoui, N., Said, S., Grohens, Y., Olier, R., &Privat, M. (2007). PEG400 novel phase
description in water.Journal of colloid and interface science, 305(2), 330-338.
(20) Faraone, A., Magazu, S., Maisano, G., Migliardo, P., Tettamanti, E., & Villari, V. (1999).
The puzzle of poly (ethylene oxide) aggregation in water: Experimental findings. The Journal of
chemical physics, 110(3), 1801-1806.
(21) Azri, A., Privat, M., Grohens, Y., &Aubry, T. (2013).Linear rheological properties of low
molecular weight polyethylene glycol solutions.Journalofcolloidandinterfacescience, 393, 104-
108.
(22) Hussain, H., Mya, K. Y., & He, C. (2008). Self-assembly of brush-like poly [poly (ethylene
glycol) methyl ether methacrylate] synthesized via aqueous atom transfer radical
polymerization. Langmuir, 24(23), 13279-13286.
(23) Riabtseva A., Mitina N., Boiko N., Garasevich S., Yanchuk I., Stoika R., Slobodyanyuk O.,
Zaichenko A. Structural and colloidal-chemical characteristics f nanosized drug delivery systems
based on pegylatedcomb-like carriers // Chemistry & Chemical Technology. – Vol. 6, N 3. –
2012. – P. 291–295 (ISSN: 1996-4196).
(24) V. Fainermanand, R. Mille, R. Miller, L. Liggieri (Eds.), Bubble and Drop Interfaces in
Progress in Colloid and Interface Science, vol. 2, 2009, p. 665 Bril, Leiden.
(25) F. Liu, J. Xiao, V.M. Garamus, L. Almásy, R. Willumeit, B. Mu, A. Zou, Interaction of the
biosurfactant, surfactin with betaines in aqueous solution, Langmuir 29 (2013) 10648–10657,
https://doi.org/10.1021/la400683u.
(26) E.D. Shchukin, A.V. Pertsov, E.A. Amelina, A.S. Zelenev, D. Mobius, R. Miller (Eds.),
Colloid and Surface Chemistry, vol. 12, Elsevier Science, Amsterdam, 2001, p. 774.
(27) Groot, R.D., Warren, P.B., Dissipative particle dynamics: Bridging the gap between
atomistic and mesoscopic simulation, J. Chem. Phys. 107, 4423 (1997);
https://doi.org/10.1063/1.474784
(28) Lavagnini, E., Cook, J.L., Warren, P.B., Williamson, M.J., Hunter, C.A., A Surface Site
Interaction Point Method for Dissipative Particle Dynamics Parametrization: Application to
Alkyl Ethoxylate Surfactant Self-Assembly, J. Phys. Chem. B 2020, 124, 5047−5055.
(29) Lavagnini, E., Cook, J.L., Warren, P.B., Hunter, C.A., Translation of Chemical Structure
into Dissipative Particle Dynamics Parameters for Simulation of Surfactant Self-Assembly, J.
Phys. Chem. B 2021, 125, 3942−3952.
(30) Hunter, C.A., A surface site interaction model for the properties of liquids at equilibrium,
Chem. Sci., 2013, 4, 1687.
(31) Anderson, R. L.; Bray, D. J.; Ferrante, A. S.; Noro, M. G.; Stott, I. P.; Warren, P. B.
Dissipative Particle Dynamics: Systematic Parametrization Using Water-Octanol Partition
Coefficients. J. Chem. Phys. 2017, 147, 094503.
(32) Milano, G.; Muller-Plathe, F. Mapping Atomistic Simulations to Mesoscopic Models: A
Systematic Coarse-Graining Procedure for Vinyl Polymer Chains. J. Phys. Chem. B 2005, 109,
18609−18619.
(33) Michael A. Johnston, William C. Swope, Kirk E. Jordan, Patrick B. Warren, Massimo G.
Noro, David J. Bray, and Richard L. Anderson, Toward a Standard Protocol for Micelle
Simulation, J. Phys. Chem. B 2016, 120, 6337−6351.
(34) Metastability
(35) R.D. Groot and T.J. Madden, Dynamic simulation of diblock copolymer microphase
separation, J. Chem. Phys. 108, 8713 (1998); https://doi.org/10.1063/1.476300
(36) J.Ilnytskyi, T.Patsahan, M.Holovko, P.Krouskop, M.Makowski. "Morphological changes in
block copolymer melts due to a variation of intramolecular branching. Dissipative particles
dynamics study". Macromol., v.41, 9904 (2008).
(37) J. Ilnytskyi, S. Sokołowski, O. Pizio, Nematic-isotropic transition in a lattice model with
quenched disordered impurities: A Monte Carlo study, Phys. Rev. E 1999, 4161
(38) O.Y. Kalyuzhnyi, J. IlnytskyiJ.,C. von .Ferber, Shape characteristics of the aggregates
formed by amphiphilic stars in water: Dissipative particle dynamics study, 2017, Condensed
Matter Physics 20(1), 13802: 1–10, DOI: 10.5488/CMP.20.13802.