Embed Size (px)
Citation preview
Experimental realization of directed percolation criticality in turbulent liquid crystals
Kazumasa A. Takeuchi,1,2,* Masafumi Kuroda,1 Hugues Chaté,2 and Masaki Sano1,†
1Department of Physics, The University of Tokyo, 7-3-1 Hongo, Bunkyo-ku, Tokyo 113-0033, Japan2Service de Physique de l’État Condensé, CEA-Saclay, 91191 Gif-sur-Yvette, France
�Received 24 July 2009; published 16 November 2009�
This is a comprehensive report on the phase transition between two turbulent states of electroconvection innematic liquid crystals, which was recently found by the authors to be in the directed percolation �DP�universality class �K. A. Takeuchi et al., Phys. Rev. Lett. 99, 234503 �2007��. We further investigate both staticand dynamic critical behaviors of this phase transition, measuring a total of 12 critical exponents, 5 scalingfunctions, and 8 scaling relations, all in full agreement with those characterizing the DP class in 2+1 dimen-sions. Developing an experimental technique to create a seed of topological-defect turbulence by pulse laser,we confirm in particular the rapidity symmetry, which is a basic but nontrivial consequence of the field-theoretic approach to DP. This provides a clear experimental realization of this outstanding truly out-of-equilibrium universality class, dominating most phase transitions into an absorbing state.
DOI: 10.1103/PhysRevE.80.051116 PACS number�s�: 64.60.Ht, 64.70.mj, 47.27.Cn, 05.45.�a
I. INTRODUCTION
Absorbing states, i.e., states which systems may fall intobut never escape from, and phase transitions into them areexpected to be ubiquitous in nature. For instance, spreadingor contamination processes such as fires or epidemics exhibitsuch transitions when the propagation rate changes: initiallyactive �infected� regions eventually disappear forever at lowrates, i.e., the absorbing state is reached, while they can besustained �pandemic regime� for fast-enough propagation.Examples abound far beyond hundreds of numerical models,describing, e.g., catalytic reactions, granular flows, and cal-cium dynamics in living cells, to name but a few, have beenshown to exhibit such absorbing phase transitions �1,2�. Suchphase transitions also naturally arise from general problemssuch as synchronization �3,4�, self-organized criticality �5�,spatiotemporal intermittency �STI� �6�, and depinning �7,8�.The vast majority of these transitions share the same criticalbehavior, that of the “directed percolation” �DP� class �1,2�,as long as they are continuous.
Deep theoretical issues underpin this situation. Whereasuniversality is well understood for systems in thermody-namic equilibrium, this is still not the case for systems drivenout of equilibrium, where even the relevant ingredients de-termining the class are not well understood. In this context,absorbing phase transitions are central because of their genu-ine nonequilibrium character since absorbing states directlyimply violation of the detailed balance. Janssen and Grass-berger �9,10� conjectured that the DP universality class con-tains all continuous transitions into a single effective absorb-ing state in the absence of any extra symmetry orconservation law. The DP class thus appears as the simplestand most common case as testified by overwhelming numeri-cal evidence.
However, the situation has been quite different in experi-ments. Over the last 20 years and more, a number of experi-
ments have been performed in situations where DP-classtransitions would be theoretically expected, but they havealways yielded mixed and/or partial results with limited ac-curacy �7,11–22� �Table I�. This lack of fully convincing ex-perimental realizations, in contrast with the wealth of nu-merical results, has been found surprising and a matter ofconcern in the literature �1,28�.
Recently, though, studying a STI regime occurring in tur-bulent liquid crystals, we found a transition whose completeset of static critical exponents matches those of the DP class�29�. The goal of the present paper is to provide a compre-hensive report on this transition including not only a morecomplete description of experiments designed to investigatethe static critical behavior but also new experiments givingaccess to dynamic critical behavior.
The paper is organized as follows. We first illustrate thecoarse-grained dynamics of the turbulent regime of electro-convection studied and our basic experimental setup �Sec.II�, with further details on image analysis given in the Ap-pendix. To characterize the critical behavior, we performthree series of experiments: �a� steady-state experiment un-der constant applied voltages �Sec. III�, �b� critical-quenchexperiment starting from fully active initial conditions �Sec.IV�, and �c� critical-spreading experiment starting from asingle active seed, prepared with an experimental techniqueusing pulse laser, developed in this work �Sec. V�. In Sec.VI, our results are summarized and we discuss why clearDP-class critical behavior is observed rather easily in oursystem, contrary to many other experiments performed in thepast in this context.
II. EXPERIMENTAL SETUP
We work on the electrohydrodynamic convection of nem-atic liquid crystals, which occurs when a thin layer of liquidcrystal is subjected to an external voltage strong enough totrigger the Carr-Helfrich instability �30,31�. This is a priori asuitable system to study critical behavior, thanks to its pos-sibly large aspect ratio, fast response time, and easy control-lability. We focus on the transition between two turbulent
*[email protected]†[email protected]
PHYSICAL REVIEW E 80, 051116 �2009�
Selected for a Viewpoint in Physics
1539-3755/2009/80�5�/051116�12� ©2009 The American Physical Society051116-1
regimes, called dynamic scattering modes 1 and 2 �DSM1and DSM2�, observed successively upon increasing the root-mean-square amplitude of the voltage V at relatively lowfrequencies �31,32�. The difference between DSM1 andDSM2 lies in their density of topological defects in the di-rector field �Fig. 1�a��. In the DSM2 state, a large quantity ofthese defects, called disclinations, are present �34�. Theyelongate and split constantly under the shear due to the fluc-tuating turbulent flow around. In DSM1, on the other hand,disclinations are present but kept smaller than the criticalsize and disappear immediately. Their density thus remainsvery low. The many disclinations in DSM2 lead to the loss ofmacroscopic nematic anisotropy and to a lower light trans-mittance than in DSM1.
Our basic experimental setup is shown in Fig. 2. Thesample cell is made of two parallel glass plates spaced by apolyester film of thickness d=12 �m. Both inner surfacesare covered with transparent electrodes of size 14�14 mm2, coated with polyvinyl alcohol, and then rubbedin order that molecules are planarly aligned in the x direc-tion, defined thereby. The cell is filled withN-�4-methoxybenzylidene�-4-butylaniline �MBBA� �purity�99.5%, Tokyo Chemical Industry� doped with 0.01 wt %of tetra-n-butylammonium bromide. The temperature of thecell is kept constant carefully by a handmade thermocontrol-
ler, composed of heating wires and Peltier elements con-trolled by a proportional-integral-derivative feedback loopwith a lock-in amplifier �Fig. 2�b��. Windows of the thermo-controller are made of sapphire in order to improve the spa-tial homogeneity of the temperature. Throughout each seriesof experiments, the cell temperature is maintained at 26.0 °Cwith fluctuations typically of a few mK, unless otherwisestipulated, measured by three thermistors placed at differentpositions close to the cell.
We observe the electroconvection through the transmittedlight from a handmade stabilized light source made of light-emitting diodes, recorded by a charge-coupled device cam-era. The observed region is a central rectangle of size 1217�911 �m2 �inset of Fig. 2�. Since there is a minimum linearsize of DSM2 domains, d /�2 �32�, we can roughly estimatethe number of effective degrees of freedom at 1650�1650�2.7�106 for the convection area and 143�107�1.5�104 for the observation area. Note that the meaningful fig-ure is that of the total system size, which is at least fourorders of magnitude larger than in earlier experimental stud-ies �Table I�. In the following, we vary V and fix the fre-quency at 250 Hz at roughly one third of the cutoff fre-quency 820�70 Hz which separates the conducting and thedielectric regimes of electroconvection �30,31�.
Disclinations being topological defects, the spontaneousnucleation of DSM2 in a DSM1 domain is in principle for-
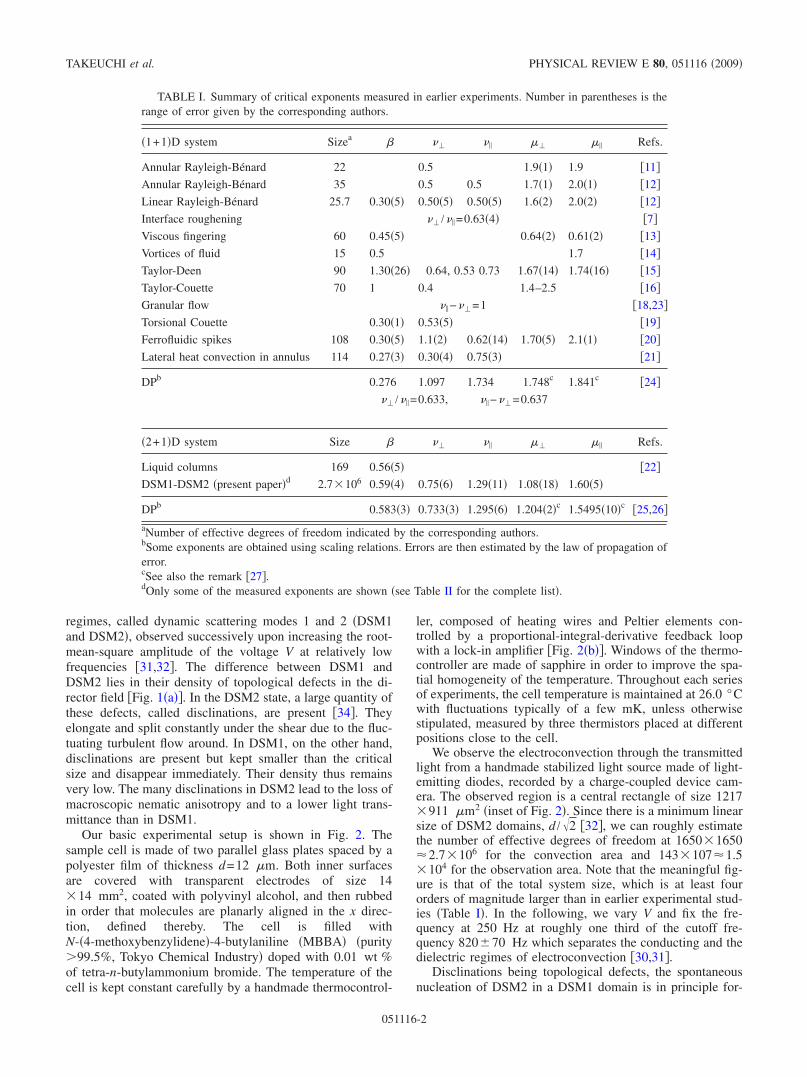
TABLE I. Summary of critical exponents measured in earlier experiments. Number in parentheses is therange of error given by the corresponding authors.
�1+1�D system Sizea � �� �� �� �� Refs.
Annular Rayleigh-Bénard 22 0.5 1.9�1� 1.9 �11�Annular Rayleigh-Bénard 35 0.5 0.5 1.7�1� 2.0�1� �12�Linear Rayleigh-Bénard 25.7 0.30�5� 0.50�5� 0.50�5� 1.6�2� 2.0�2� �12�Interface roughening �� /�� =0.63�4� �7�Viscous fingering 60 0.45�5� 0.64�2� 0.61�2� �13�Vortices of fluid 15 0.5 1.7 �14�Taylor-Deen 90 1.30�26� 0.64, 0.53 0.73 1.67�14� 1.74�16� �15�Taylor-Couette 70 1 0.4 1.4–2.5 �16�Granular flow �� −��=1 �18,23�Torsional Couette 0.30�1� 0.53�5� �19�Ferrofluidic spikes 108 0.30�5� 1.1�2� 0.62�14� 1.70�5� 2.1�1� �20�Lateral heat convection in annulus 114 0.27�3� 0.30�4� 0.75�3� �21�
DPb 0.276 1.097 1.734 1.748c 1.841c �24��� /�� =0.633, �� −��=0.637
�2+1�D system Size � �� �� �� �� Refs.
Liquid columns 169 0.56�5� �22�DSM1-DSM2 �present paper�d 2.7�106 0.59�4� 0.75�6� 1.29�11� 1.08�18� 1.60�5�
DPb 0.583�3� 0.733�3� 1.295�6� 1.204�2�c 1.5495�10�c �25,26�aNumber of effective degrees of freedom indicated by the corresponding authors.bSome exponents are obtained using scaling relations. Errors are then estimated by the law of propagation oferror.cSee also the remark �27�.dOnly some of the measured exponents are shown �see Table II for the complete list�.
TAKEUCHI et al. PHYSICAL REVIEW E 80, 051116 �2009�
051116-2

bidden. It is indeed an essentially unobservable rare eventexcept along the edges of the electrode and for very highvoltages far from the range investigated in the present paper.Therefore, the fully DSM1 state serves as an absorbing state.On the other hand, DSM2 domains introduced externally orpresent initially in the system can remain sustained in thebulk for large enough voltages but eventually disappear forvoltages lower than a certain threshold Vc. Closely above Vc,a regime of STI is observed, with DSM2 patches movingaround on a DSM1 background �Fig. 1�b� and movie S1 inRef. �33��. The basic dynamics of the observed STI is illus-trated in Fig. 1�d�: active DSM2 patches evolve in space timeessentially by contamination of neighboring inactive �ab-sorbing� DSM1 regions and by relaxation into the DSM1state. This suggests an absorbing phase transition induced bychange in rates of both elementary processes �6�, which arefunctions of the applied voltage here. The order parameter �is then simply the ratio of the surface occupied by activeDSM2 regions to the whole area.
Prior to any analysis, we must distinguish DSM2 domainsfrom DSM1. This binary reduction can be easily performed
by our eyes, so we automated it, based on the facts thatDSM2 domains have lower transmittance, longer time corre-lations, and a minimum area of d2 /2 �32� �see Appendix fordetails�. A typical result is shown in Fig. 1�c� and in movieS2 in Ref. �33�. Figure 1�e� displays spatiotemporal diagramsobtained this way, showing how DSM2 patches evolve in thesteady state. This supports the qualitative dynamics illus-trated in Fig. 1�d� and indeed looks like the directed perco-lation of, say, water in a porous medium under gravitationalfield.
III. STEADY-STATE EXPERIMENT
We first observe STI in the steady state under constantvoltage V in the range of 34.858 VV39.998 V. Thevoltage for the onset of steady roll convection �Williams do-main� is V�=8.95 V. Spatiotemporal distributions of DSM2patches are recorded over the period 1000 sT8000 s,which is longer than 103 correlation times defined from thefluctuations of the order parameter ��t�.
(b)
(e)
100µm
tx
y
(c)(a)
DSM1
DSM2
DSM1
(d)
time
[c] [r]
[c] [c][r]
[r] [r][r]
34.858 V 34.876 V 34.900 V
FIG. 1. �Color online� Spatiotemporal intermittency between DSM1 and DSM2. �a� Sketch of a DSM2 domain with many entangleddisclinations, i.e., loops of singularities in orientations of liquid crystal. Blue dashed curves in the closeup indicate contour lines of equalalignment. �b� Snapshot taken at 35.153 V. Active �DSM2� patches appear darker than the absorbing DSM1 background. See also movie S1in Ref. �33�. �c� Binarized image of �b�. See also movie S2 in Ref. �33�. �d� Sketch of the dynamics: DSM2 domains �gray� stochasticallycontaminate �c� neighboring DSM1 regions �white� and/or relax �r� into the DSM1 state but do not nucleate spontaneously within DSM1regions �DSM1 is absorbing�. �e� Spatiotemporal binarized diagrams showing DSM2 regions for three voltages near the critical point. Thediagrams are shown in the range of 1206�899 �m2 �the whole observation area� in space and 6.6 s in time.
PC
thermocontroller
cell
LED
d = 12µm amplifier
V
waveformgenerator
CCD
to eyepiece unitlenses
objective10x fins
cell
Peltier (cooler) heating wire
thermistors
PID controller
lock-in amp.
power supply
power supply
sapphire windows
(b)(a)
(top)
(side)
diffuser
half mirror
bridge
FIG. 2. �Color online� Schematic diagram of the experimental setup in its entirety �a� and for the thermocontroller �b�. LED: light-emitting diode, CCD: charge-coupled device camera, PC: computer, PID: proportional-integral derivative. See text for details.
EXPERIMENTAL REALIZATION OF DIRECTED-… PHYSICAL REVIEW E 80, 051116 �2009�
051116-3
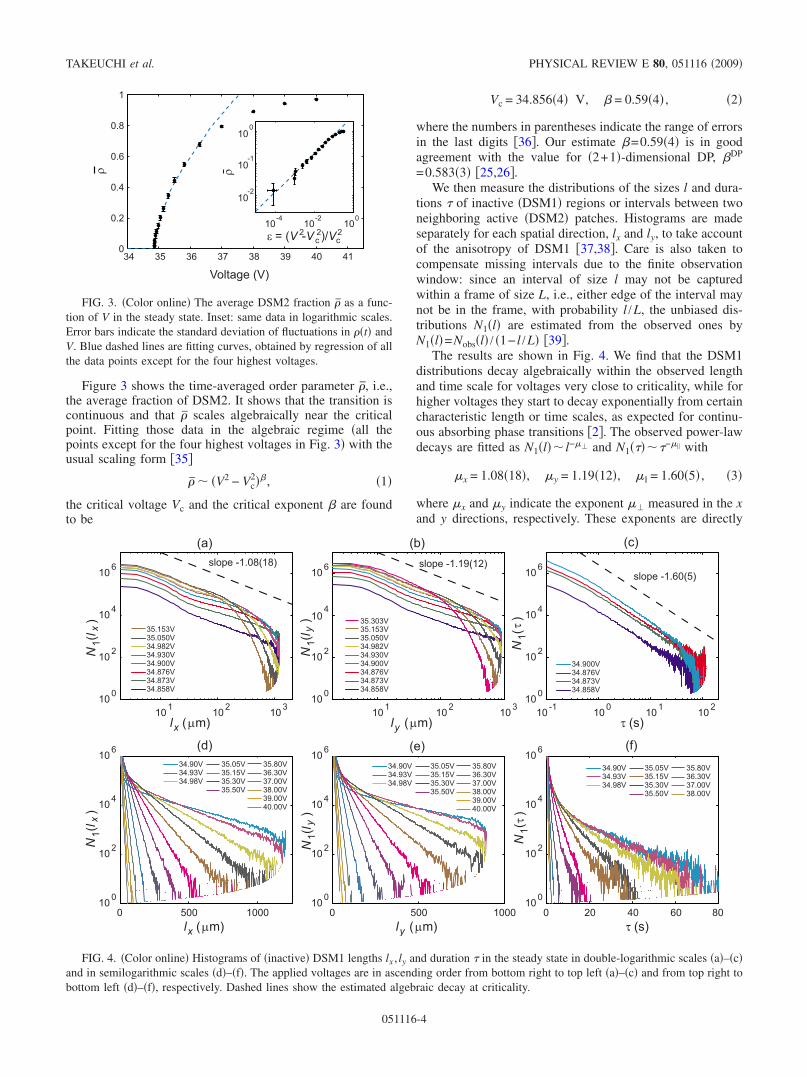
Figure 3 shows the time-averaged order parameter �̄, i.e.,the average fraction of DSM2. It shows that the transition iscontinuous and that �̄ scales algebraically near the criticalpoint. Fitting those data in the algebraic regime �all thepoints except for the four highest voltages in Fig. 3� with theusual scaling form �35�
�̄ � �V2 − Vc2��, �1�
the critical voltage Vc and the critical exponent � are foundto be
Vc = 34.856�4� V, � = 0.59�4� , �2�
where the numbers in parentheses indicate the range of errorsin the last digits �36�. Our estimate �=0.59�4� is in goodagreement with the value for �2+1�-dimensional DP, �DP
=0.583�3� �25,26�.We then measure the distributions of the sizes l and dura-
tions � of inactive �DSM1� regions or intervals between twoneighboring active �DSM2� patches. Histograms are madeseparately for each spatial direction, lx and ly, to take accountof the anisotropy of DSM1 �37,38�. Care is also taken tocompensate missing intervals due to the finite observationwindow: since an interval of size l may not be capturedwithin a frame of size L, i.e., either edge of the interval maynot be in the frame, with probability l /L, the unbiased dis-tributions N1�l� are estimated from the observed ones byN1�l�=Nobs�l� / �1− l /L� �39�.
The results are shown in Fig. 4. We find that the DSM1distributions decay algebraically within the observed lengthand time scale for voltages very close to criticality, while forhigher voltages they start to decay exponentially from certaincharacteristic length or time scales, as expected for continu-ous absorbing phase transitions �2�. The observed power-lawdecays are fitted as N1�l�� l−�� and N1�����−�� with
�x = 1.08�18�, �y = 1.19�12�, �� = 1.60�5� , �3�
where �x and �y indicate the exponent �� measured in the xand y directions, respectively. These exponents are directly
34 35 36 37 38 39 40 410
0.2
0.4
0.6
0.8
1
Voltage (V)
ρ
10-4
10-2
100
10-2
10-1
100
ε = (V 2-V c2)/Vc
2ρ
FIG. 3. �Color online� The average DSM2 fraction �̄ as a func-tion of V in the steady state. Inset: same data in logarithmic scales.Error bars indicate the standard deviation of fluctuations in ��t� andV. Blue dashed lines are fitting curves, obtained by regression of allthe data points except for the four highest voltages.
101 102 103100
102
104
106
lx (µm)
N(lx)
10 2101 103100
102
104
106
ly (µm)
y)
10 -1 100 101 102100
102
104
106
τ (s)
τ)
0 500 1000100
102
104
106
lx (µm)0 500 1000
100
102
104
106
ly (µm)
y)
0 20 40 60 80100
102
104
106
τ (s)
τ)
(a) (b) (c)
(d) (e) (f)
slope -1.08(18) slope -1.19(12)slope -1.60(5)
35.153V
34.858V34.873V34.876V34.900V34.930V34.982V35.050V
35.153V35.303V
34.858V34.873V34.876V34.900V34.930V34.982V35.050V
34.858V34.873V34.876V34.900V
34.98V34.93V34.90V
35.50V35.30V35.15V35.05V 35.80V
40.00V39.00V38.00V37.00V36.30V
34.98V34.93V34.90V
35.50V35.30V35.15V35.05V 35.80V
40.00V39.00V38.00V37.00V36.30V
34.98V34.93V34.90V
35.50V35.30V35.15V35.05V 35.80V
38.00V37.00V36.30V
1N(lx)
1
N(l 1
N(l 1 N( 1
N( 1
FIG. 4. �Color online� Histograms of �inactive� DSM1 lengths lx , ly and duration � in the steady state in double-logarithmic scales �a�–�c�and in semilogarithmic scales �d�–�f�. The applied voltages are in ascending order from bottom right to top left �a�–�c� and from top right tobottom left �d�–�f�, respectively. Dashed lines show the estimated algebraic decay at criticality.
TAKEUCHI et al. PHYSICAL REVIEW E 80, 051116 �2009�
051116-4

connected to the fractal dimensions df of the DSM2 clustersmeasured in the corresponding direction as �=df+1. Thecritical exponents �� and �� for DP can be estimated usingscaling relations with the order parameter exponent � and thecorrelation length and time exponents �� and ��, namely �2�,
�� = 2 − �/��, �� = 2 − �/�� . �4�
They give ��DP=1.204�2� and ��
DP=1.5495�10� for �2+1� di-mensions �26�. Although the existence of slight discrepanciesof order 10−2 in Eq. �4� is suggested from numerical studies�40,41�, our estimates in Eq. �3� agree with values expectedfor the DP class at any rate.
Moreover, the DSM1 distributions allow estimating cor-relation length and time scales, �� and ��, respectively, fromtheir exponential tails shown in Figs. 4�d�–4�f�. Fitting dis-tributions with an empirical form �11,20�
N1�l�,N1��� � �Al−� + B�e−l/�, �5�
with powers �� and �� fixed at the estimates in Eq. �3�, weobtain the results shown in Fig. 5. Both �� and �� showalgebraic divergence,
�� � �V2 − Vc2�−��, �� � �V2 − Vc
2�−�� , �6�
near criticality as expected, except for the first two points inFig. 5�c�, which deviate from the power law presumably dueto finite length of movies �120 s� used to count the distribu-
tions. Fitting Eq. �6� to the data in scaling regions �the firstfive points for �x ,�y and all the points except the first two for���, we obtain
�x = 0.75�6�, �y = 0.78�9�, �� = 1.29�11� . �7�
They are in good agreement with the DP values ��DP
=0.733�3� and ��DP=1.295�6� �25,26�. In addition, the facts
that no significant anisotropy is found between �x and �y andthat they can be even shorter than the cell depth d=12 �m�Figs. 5�a� and 5�b�� suggest that distributions of DSM2patches are practically not influenced by the anisotropy ofDSM1 �37,38� and by the existence of coherent roll structureof width roughly d behind DSM1 �38�.
On the other hand, distributions of sizes of active �DSM2�patches do not show any long-range correlations even closeto criticality �Figs. 6�a� and 6�b��. It implies that the localrecession of DSM2 into DSM1 sketched in Fig. 1�d� is in-deed always present. The effective relaxation rate can bedirectly estimated just as an inverse of the characteristic time�0 from the exponential tail of the temporal DSM2 distribu-tion, shown in Fig. 6�c�. The characteristic time �0 increaseslinearly with V except for high voltages, where it is not sim-ply determined from the dynamics of individual patches be-cause of the saturation of the DSM2 fraction �Fig. 3�. Inparticular, it exhibits no sign of criticality. All these observa-tions are consistent with, e.g., the dynamics of the so-called
10-210-3 10-1 100100
101
102
103
ε
ξ x(µm)
10010-210-3 10-1100
101
102
103
ε
ξ y(µm)
10-210-3 10-1 10010 -1
100
101
102
ε
ξ ||(s)
(a) (b) (c)
slope -0.75(6) slope -0.78(9)
slope -1 slope -1
slope -1.29(11)
FIG. 5. �Color online� Correlation length �x, �y and correlation time �� in the steady state as functions of the deviation from criticality �V2−Vc
2� /Vc2. Dashed lines are guides for the eyes.
0 500 1000100
102
104
106
l x (µm)
N2(l x)
0 20 40100
102
104
106
τ (s)
N2(τ)
34 36V 380
0.3
0.6
0.9
1.2
Voltage (V)
τ 0(s)
0
20
40
60
80
l 0(µm)
34 36 380
30
60
(a) (b) (c)
38.00V39.00V40.00V
34.858V35.15V35.80V37.00V
38.00V39.00V40.00V
34.858V35.15V35.80V37.00V
c
τ0l x0l y0
V
τ00l /
FIG. 6. �Color online� Distributions of �active� DSM2 domain sizes in the steady state. �a� and �b� Histograms of DSM2 lengths lx in thex direction �a� and of DSM2 duration � �b�. The applied voltages are in ascending order from bottom left to top right. �c� Characteristic lengthand time scales lx0 , ly0 ,�0, defined from the exponential decay in the histograms. The range of errors is smaller than the symbol size. Dashedline indicates the critical voltage Vc. �Inset� Ratios of lx0 and ly0 to �0 �same symbols as in the main panel�.
EXPERIMENTAL REALIZATION OF DIRECTED-… PHYSICAL REVIEW E 80, 051116 �2009�
051116-5

contact process �42� �depicted in Fig. 1�d��, a prototypicalmodel showing a DP-class transition �1,2�, indicating thatsuch process indeed governs the coarse-grained dynamics ofour STI regime in liquid crystal turbulence.
Similarly, the spatial distributions of DSM2 sizes yieldcharacteristic length scales lx0 and ly0 �Fig. 6�c��. Althoughthey appear to be also dominated by the relaxation process,as suggested from an effectively constant ratio l0 /�0 �inset ofFig. 6�c��, they clearly show anisotropy �Fig. 6�c��, as op-posed to the correlation lengths �x and �y estimated fromDSM1-size distributions �Figs. 5�a� and 5�b��. This impliesthat the contamination process of DSM2 is indeed driven bythe anisotropic fluctuating shear flow of surrounding DSM1.The larger effective contamination rate in x is in line with thefact that the turbulent structure of DSM1 remains mainly inthe x-z plane �37� but at odds with the global elliptic shape ofgrowing DSM2 nuclei, longer in y, observed for higher volt-ages �32,43�. Both would be explained if we assume thatturbulent flow behind is faster and more correlated in the ydirection, but further studies are necessary on this point.
IV. CRITICAL-QUENCH EXPERIMENT
A typical experiment performed usually on numericalmodels showing absorbing phase transitions is the criticaldecay of active patches from fully active initial conditions�1,2�. In such critical-quench experiments, correlation length,and time grow in time, and, as long as they remain muchsmaller than the system size, scaling estimates are free fromfinite-size effects.
Experiments are performed as follows: we first apply60 V��Vc� to the cell and wait until it is entirely invaded byDSM2 domains. We then suddenly decrease the applied volt-age to a value in the range of 34.86 VV35.16 V, i.e.,near Vc, and observe the time decay of activity for 900 s. Werepeat this ten times for each V and average the results overthis ensemble.
We first measure the decay of the order parameter ��t�after the quench �Fig. 7�a��. As expected, ��t� decays expo-nentially with a certain characteristic time for lower voltages,converges to a finite value for higher voltages, and in be-tween at V=35.04 V, it decays algebraically over the wholeobservation time. A simple scaling ansatz implies the follow-ing functional form for ��t� in this case:
��t� � t−�F�� t1/���, � = �/�� , �8�
where �V2−Vc2� /Vc
2 is the deviation from criticality andF��x� is a universal scaling function. From the slopes of thealgebraic regimes for the three V values closest to the thresh-old, we estimate
Vc = 35.04�1� V, � = 0.48�5� . �9�
Note that Vc measured here is slightly higher than in thesteady-state experiments. In fact, the roll convection onsetV�=8.96 V was also higher. We believe this is because ofpossible slight shift in the controlled temperature and also ofthe aging of our sample, a well known property of MBBA,during the days which separated the two sets of experiments.On the other hand, no measurable shift of Vc was detected
during a given set of experiments. We also confirmed that Vchere is consistent with a threshold roughly estimated fromsteady state just before the critical-quench experiments. Ourestimate of the critical exponent � is again in good agree-ment with the DP value �DP=0.4505�10� �26�.
Furthermore, the scaling form of Eq. �8� implies that thetime series ��t� for different voltages collapse on a singlecurve F��x� when ��t�t� is plotted as a function of t ��. Ourdata do collapse reasonably well �Fig. 7�b��, where the upperand lower branches correspond to V�Vc and VVc, respec-tively. It is compared and found in good agreement with theuniversal scaling function F��x� of the DP class �dashedcurve in Fig. 7�b��, calculated numerically from the�2+1�-dimensional contact process. It shows that the decayof DSM2 patches is governed by this DP universal functionexcept for the very early stage where it is influenced bymicroscopic features of the liquid crystal as expected.
We also measure the autocorrelation function C�t , t0� de-fined as
C�t,t0� = ���r,t���r,t0�� − ���r,t0�����r,t�� , �10�
where �¯ � denotes average in space and over ensembles.During the critical decaying process, C�t , t0� is not a function
10-1
100
101
102
10310
-2
10-1
100
t (s)
ρ(t)
10-4
10-2
100
10-4
10-3
10-2
10-1
100
101
t |ε |ν || (s)
ρ(t)tα(s
α)
(a)
(b)
35.04V
35.02V
35.06V
slope -0.48(5)
FIG. 7. �Color online� Decay of the order parameter ��t� oncritical quenching. �a� ��t� versus t for V=34.86,34.88, . . . ,35.16 V from bottom left to top right. The curvefor V=35.04 V �showing the longest power-law regime� is indi-cated by a thick line. �b� Same data with rescaled axes t �� and��t�t�, showing data collapsing. For Vc, �, and ��, we use valuesmeasured in the experiment �Eqs. �7� and �9��, but a collapse ofsimilar quality is obtained also with DP-class exponent values. Thedashed curve indicates the DP universal scaling function F�
DP�x�obtained numerically from the contact process.
TAKEUCHI et al. PHYSICAL REVIEW E 80, 051116 �2009�
051116-6
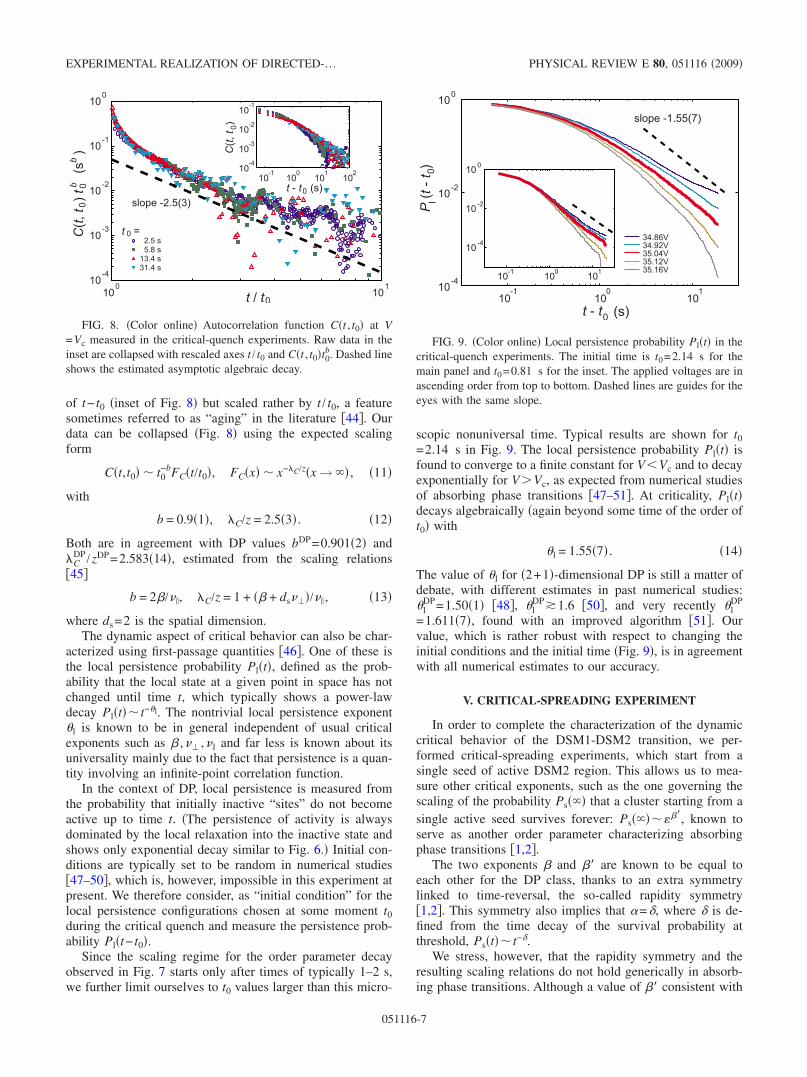
of t− t0 �inset of Fig. 8� but scaled rather by t / t0, a featuresometimes referred to as “aging” in the literature �44�. Ourdata can be collapsed �Fig. 8� using the expected scalingform
C�t,t0� � t0−bFC�t/t0�, FC�x� � x−�C/z�x → �� , �11�
with
b = 0.9�1�, �C/z = 2.5�3� . �12�
Both are in agreement with DP values bDP=0.901�2� and�C
DP /zDP=2.583�14�, estimated from the scaling relations�45�
b = 2�/��, �C/z = 1 + �� + ds���/�� , �13�
where ds=2 is the spatial dimension.The dynamic aspect of critical behavior can also be char-
acterized using first-passage quantities �46�. One of these isthe local persistence probability Pl�t�, defined as the prob-ability that the local state at a given point in space has notchanged until time t, which typically shows a power-lawdecay Pl�t�� t−�l. The nontrivial local persistence exponent�l is known to be in general independent of usual criticalexponents such as � ,�� ,�� and far less is known about itsuniversality mainly due to the fact that persistence is a quan-tity involving an infinite-point correlation function.
In the context of DP, local persistence is measured fromthe probability that initially inactive “sites” do not becomeactive up to time t. �The persistence of activity is alwaysdominated by the local relaxation into the inactive state andshows only exponential decay similar to Fig. 6.� Initial con-ditions are typically set to be random in numerical studies�47–50�, which is, however, impossible in this experiment atpresent. We therefore consider, as “initial condition” for thelocal persistence configurations chosen at some moment t0during the critical quench and measure the persistence prob-ability Pl�t− t0�.
Since the scaling regime for the order parameter decayobserved in Fig. 7 starts only after times of typically 1–2 s,we further limit ourselves to t0 values larger than this micro-
scopic nonuniversal time. Typical results are shown for t0=2.14 s in Fig. 9. The local persistence probability Pl�t� isfound to converge to a finite constant for VVc and to decayexponentially for V�Vc, as expected from numerical studiesof absorbing phase transitions �47–51�. At criticality, Pl�t�decays algebraically �again beyond some time of the order oft0� with
�l = 1.55�7� . �14�
The value of �l for �2+1�-dimensional DP is still a matter ofdebate, with different estimates in past numerical studies:�l
DP=1.50�1� �48�, �lDP�1.6 �50�, and very recently �l
DP
=1.611�7�, found with an improved algorithm �51�. Ourvalue, which is rather robust with respect to changing theinitial conditions and the initial time �Fig. 9�, is in agreementwith all numerical estimates to our accuracy.
V. CRITICAL-SPREADING EXPERIMENT
In order to complete the characterization of the dynamiccritical behavior of the DSM1-DSM2 transition, we per-formed critical-spreading experiments, which start from asingle seed of active DSM2 region. This allows us to mea-sure other critical exponents, such as the one governing thescaling of the probability Ps��� that a cluster starting from asingle active seed survives forever: Ps���� ��, known toserve as another order parameter characterizing absorbingphase transitions �1,2�.
The two exponents � and �� are known to be equal toeach other for the DP class, thanks to an extra symmetrylinked to time-reversal, the so-called rapidity symmetry�1,2�. This symmetry also implies that �=�, where � is de-fined from the time decay of the survival probability atthreshold, Ps�t�� t−�.
We stress, however, that the rapidity symmetry and theresulting scaling relations do not hold generically in absorb-ing phase transitions. Although a value of �� consistent with
100
10110
-4
10-2
100
10-1
10-3
100 10210-1 10110-410-310-210-1
t / t0
C(t,t)t
b(sb)
00
C(t,t) 0
t - t (s)0
2.5 s5.8 s13.4 s31.4 s
slope -2.5(3)
t =0
FIG. 8. �Color online� Autocorrelation function C�t , t0� at V=Vc measured in the critical-quench experiments. Raw data in theinset are collapsed with rescaled axes t / t0 and C�t , t0�t0
b. Dashed lineshows the estimated asymptotic algebraic decay.
100
101
10-110-4
10-2
100
100 10110-1
100
10 -2
10 -4
P l(t-t0)
t - t0 (s)
35.16V
35.04V
34.86V
35.12V
34.92V
slope -1.55(7)
FIG. 9. �Color online� Local persistence probability Pl�t� in thecritical-quench experiments. The initial time is t0=2.14 s for themain panel and t0=0.81 s for the inset. The applied voltages are inascending order from top to bottom. Dashed lines are guides for theeyes with the same slope.
EXPERIMENTAL REALIZATION OF DIRECTED-… PHYSICAL REVIEW E 80, 051116 �2009�
051116-7
DP was suggested from the critical scaling of hysteresisloops in the DSM1-DSM2 transition �52�, it remains impor-tant to assess all spreading exponents as accurately and in-dependently as possible in order to complete our character-ization of DP-class critical behavior and check directly therapidity symmetry.
A. Technique for nucleating DSM2
In contrast to numerical simulations, it is not easy, in ex-periments, to prepare an initial, single, localized seed ofDSM2 in an otherwise homogeneous DSM1 system. We de-veloped an experimental technique for nucleating a DSM2patch artificially using a pulse laser.
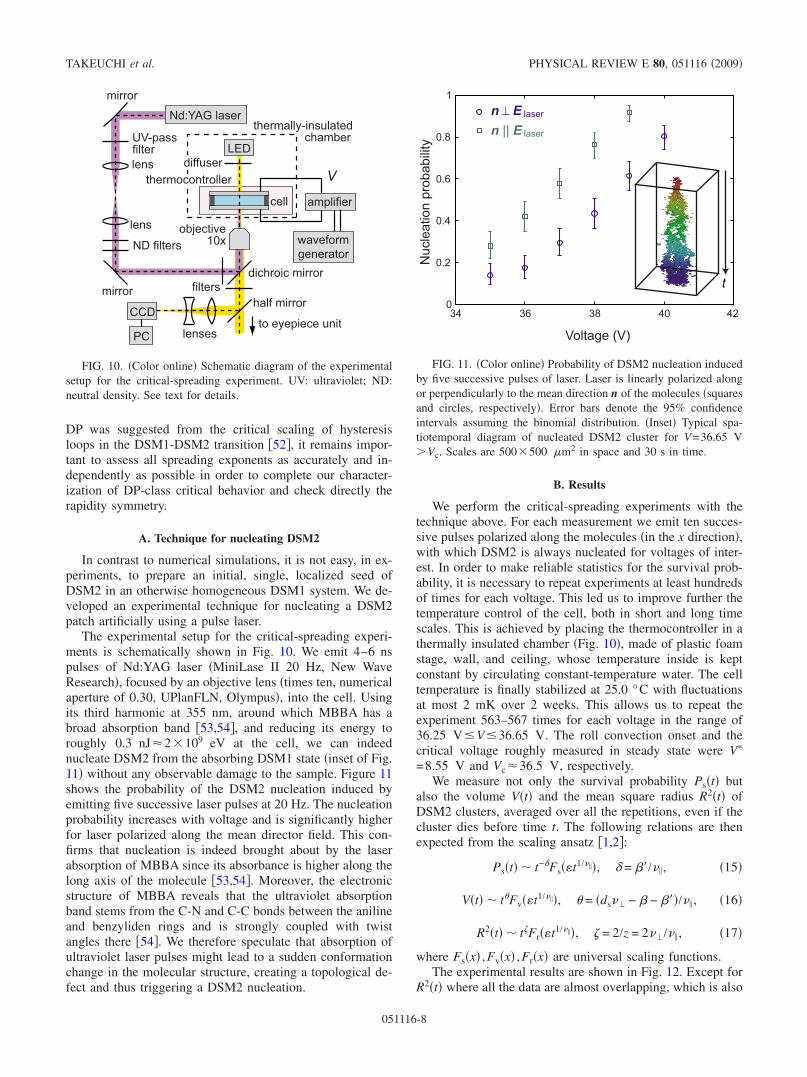
The experimental setup for the critical-spreading experi-ments is schematically shown in Fig. 10. We emit 4–6 nspulses of Nd:YAG laser �MiniLase II 20 Hz, New WaveResearch�, focused by an objective lens �times ten, numericalaperture of 0.30, UPlanFLN, Olympus�, into the cell. Usingits third harmonic at 355 nm, around which MBBA has abroad absorption band �53,54�, and reducing its energy toroughly 0.3 nJ�2�109 eV at the cell, we can indeednucleate DSM2 from the absorbing DSM1 state �inset of Fig.11� without any observable damage to the sample. Figure 11shows the probability of the DSM2 nucleation induced byemitting five successive laser pulses at 20 Hz. The nucleationprobability increases with voltage and is significantly higherfor laser polarized along the mean director field. This con-firms that nucleation is indeed brought about by the laserabsorption of MBBA since its absorbance is higher along thelong axis of the molecule �53,54�. Moreover, the electronicstructure of MBBA reveals that the ultraviolet absorptionband stems from the C-N and C-C bonds between the anilineand benzyliden rings and is strongly coupled with twistangles there �54�. We therefore speculate that absorption ofultraviolet laser pulses might lead to a sudden conformationchange in the molecular structure, creating a topological de-fect and thus triggering a DSM2 nucleation.
B. Results
We perform the critical-spreading experiments with thetechnique above. For each measurement we emit ten succes-sive pulses polarized along the molecules �in the x direction�,with which DSM2 is always nucleated for voltages of inter-est. In order to make reliable statistics for the survival prob-ability, it is necessary to repeat experiments at least hundredsof times for each voltage. This led us to improve further thetemperature control of the cell, both in short and long timescales. This is achieved by placing the thermocontroller in athermally insulated chamber �Fig. 10�, made of plastic foamstage, wall, and ceiling, whose temperature inside is keptconstant by circulating constant-temperature water. The celltemperature is finally stabilized at 25.0 °C with fluctuationsat most 2 mK over 2 weeks. This allows us to repeat theexperiment 563–567 times for each voltage in the range of36.25 VV36.65 V. The roll convection onset and thecritical voltage roughly measured in steady state were V�
=8.55 V and Vc�36.5 V, respectively.We measure not only the survival probability Ps�t� but
also the volume V�t� and the mean square radius R2�t� ofDSM2 clusters, averaged over all the repetitions, even if thecluster dies before time t. The following relations are thenexpected from the scaling ansatz �1,2�:
Ps�t� � t−�Fs� t1/���, � = ��/�� , �15�
V�t� � t�Fv� t1/���, � = �ds�� − � − ���/�� , �16�
R2�t� � t�Fr� t1/���, � = 2/z = 2��/�� , �17�
where Fs�x� ,Fv�x� ,Fr�x� are universal scaling functions.The experimental results are shown in Fig. 12. Except for
R2�t� where all the data are almost overlapping, which is also
PC
thermocontroller
cell amplifier
V
waveformgenerator
CCDto eyepiece unit
lenses
objective10x
diffuser
half mirror
dichroic mirror
Nd:YAG laser
mirror
mirror
lens
UV-passfilter
ND filters
lens
filters
thermally-insulatedchamber
LED
FIG. 10. �Color online� Schematic diagram of the experimentalsetup for the critical-spreading experiment. UV: ultraviolet; ND:neutral density. See text for details.
34 36 38 40 420
0.2
0.4
0.6
0.8
1
Voltage (V)
Nucleationprobability
n⊥ En || E
t
laser
laser
FIG. 11. �Color online� Probability of DSM2 nucleation inducedby five successive pulses of laser. Laser is linearly polarized alongor perpendicularly to the mean direction n of the molecules �squaresand circles, respectively�. Error bars denote the 95% confidenceintervals assuming the binomial distribution. �Inset� Typical spa-tiotemporal diagram of nucleated DSM2 cluster for V=36.65 V�Vc. Scales are 500�500 �m2 in space and 30 s in time.
TAKEUCHI et al. PHYSICAL REVIEW E 80, 051116 �2009�
051116-8

typically the case in simulations of DP-class models, the datashow opposite curvatures below and above a certain voltage.Seeking for the curve with the longest algebraic regime inV�t�, which is statistically most reliable, we locate the criticalvoltage Vc at
Vc = 36.45�2� V. �18�
We then measure the three critical exponents � ,� ,� from thealgebraic regime for three voltages around Vc, yielding
� = 0.46�5�, � = 0.22�5�, � = 1.15�9� . �19�
All of them are in good agreement with the DP exponents,�DP=0.4505�10�, �DP=0.2295�10�, and �DP=1.1325�10��26�. This confirms the scaling relations expressing the rapid-ity symmetry. It is further confirmed by plotting the ratio ofthe survival probability Ps�t� to the DSM2 fraction ��t� in thecritical-quench experiments �inset of Fig. 12�a��, whichshows that the two order parameters become asymptoticallyproportional to each other
Ps�t� � m2��t� �20�
with the coefficient m2�3.2.We also tested data collapse �Figs. 12�d�–12�f��, which
provides reasonable results given the limited statistical accu-racy of the data. The obtained scaling functions coincide
satisfactorily with those of the �2+1�-dimensional contactprocess �dashed curves in Figs. 12�d�–12�f��. As in the datacollapse of ��t� �Fig. 7�b��, the collapsed data show typicaltime scales above which the corresponding quantities aregoverned by the DP scaling functions.
VI. SUMMARY AND DISCUSSION
We have performed three series of experiments, namely,steady-state experiments, critical-quench experiments, andcritical-spreading experiments, to characterize the critical be-havior of the DSM1-DSM2 transition in liquid crystal turbu-lence. Table II summarizes the main results. We have mea-sured in total 12 critical exponents with reasonable accuracytypically over a few orders of magnitude of power-law re-gimes. All of the measured exponent values agree within afew percent with those defining the DP universality class�36�. Given that most of them are theoretically linkedthrough scaling relations, we can equivalently say that wehave experimentally confirmed those scaling relations, 8 intotal, that connect the measured exponents �Table III�.Among them, we have confirmed in particular the rapiditysymmetry �=�, providing also the asymptotic amplitude ofthe ratio between the two order parameters, m2�3.2. More-over, we have also tested the expected scaling forms of Eqs.
10-1
101
10310
-2
10-1
100
t (s)
P s(t)
10-1
101
102
100
102
103
104
t (s)
V(t)(µm2)
10-1
100
101
102
102
103
104
105
t (s)
R2(t)(µm2)
10-4
10-2
10010
-2
10-1
100
101
t |ε|ν || (s)
P s(t)tδ(s
δ)
10-4
10-2
100
10-2
100
102
104
t |ε|ν || (s)
V(t)t-θ(µm2 /sθ)
10-4
10-2
10010
2
103
t |ε|ν || (s)
R2(t)t
-
ζ(µm2 /sζ)
10-1
101
1031
2
3
4
t (s)
Ps(t) /ρ(t)
(b)(a) (c)
(d) (e) (f)
slope -0.46(5)
slope 0.22(5)
slope 1.15(9)
FIG. 12. �Color online� Results of the critical-spreading experiments. �a�–�c� Survival probability Ps�t�, volume V�t�, and mean squareradius R2�t� of clusters started from a single DSM2 nucleus, for V=36.25,36.29, . . . ,36.65 V from bottom to top. The data for R2�t� aremostly overlapping. The curves for V=36.45 V=Vc are drawn with thick lines. �Inset of �a�� The ratio of the survival probability Ps�t� fromthe critical-spreading experiments to the DSM2 fraction ��t� from the critical-quench experiments both at criticality. The dashed line is aguide for the eyes, indicating roughly the asymptotic ratio of Ps�t� /��t�. �d�–�f� Same data with axes scaled after the expected scalings �Eqs.�15�–�17��. We use values of Vc and critical exponents measured in the experiments. The dashed curves indicate the DP universal scalingfunctions Fs
DP�x� ,FvDP�x� ,Fr
DP�x� obtained numerically from the contact process.
EXPERIMENTAL REALIZATION OF DIRECTED-… PHYSICAL REVIEW E 80, 051116 �2009�
051116-9

�8�, �11�, and �15�–�17� through data collapse and foundthem in good agreement with numerically obtained DP uni-versal scaling functions. Reproducibility of the results wasalso checked for three independent critical exponents� ,�� ,��, using two other samples with different cell sizesand cutoff frequencies. Based on all these results, we con-clude that the DSM1-DSM2 transition constitutes an unam-biguous experimental realization of an absorbing phase tran-sition in the DP universality class.
We now return to our initial remark concerning the sur-prising scarcity of experimental realizations of DP-class tran-sitions �Table I�.
One central difficulty lies in the necessity to avoid, asmuch as possible, quenched disorder, which is known to berelevant. It is theoretically known that such disorder doesaffect DP criticality and even destroys it for strong disorder�55�. Recent theoretical and numerical studies show that
even weak disorder changes the asymptotic critical behavior�56–58�, but the characteristic length or time scale separatingDP and disordered, so-called “activated” critical behavior,grows fast with decreasing strength of disorder �56,57�. It istherefore important to work with systems made of macro-scopic units, where quenched disorder is expected to be neg-ligible. We consider that the quenched disorder in our sys-tem, which may take the form of inhomogeneities in theelectrodes or impurities in the sample, is also sufficientlyweak.
Still, our DSM1-DSM2 transition seems to be the onlyfully convincing one. Three factors explain, in our view, whyour experiments provided such clear DP scaling laws.
�a� Large system size and fast response. As already men-tioned, one great advantage to work with electroconvectionis that very large aspect ratios can easily be realized. Thenumber of effective degrees of freedom of our cell is 2.7�106, which is orders of magnitude larger than any earlierexperiment �Table I�. This considerably suppresses finite-sizeeffects and allows us to observe scaling on several orders ofmagnitude. Similarly, the typical microscopic time scales ofliquid crystals are very short �of the order of 10 ms�, provid-ing accurate statistics in reasonable laboratory time.
�b� Almost perfectly absorbing state. The condition forbeing an absorbing state, i.e., that the system can never es-cape once it entered, appears to be somewhat too strict fromthe experimental point of view. Indeed, spontaneous nucle-ation of the active state seems to have been present at least insome of the past experiments �1,20�, which blurs the criticalbehavior beyond some finite scales.
On the other hand, our active state, DSM2, consists oftopological defects, whose spontaneous formation is in prin-ciple forbidden. Of course this may occur in practice, assuggested from the observation of vanishing hysteresis at theDSM1-DSM2 transition �52�, but the nucleation rate remainsso low that we cannot directly observe it, constituting analmost perfectly absorbing state.
�c� Fluctuating absorbing state. In most earlier experi-ments and numerical studies, the absorbing state has beenessentially fluctuation-free or laminar. This is indeed a natu-ral choice suggested from the minimal theory of DP andcauses of course no problem in numerical studies. In experi-ments, however, such absorbing states may typically causelong-range effects through the rigidity of their laminar pat-tern and/or the propagation of solitonlike objects, which mayfurther reduce the effective system size and even break DPscaling �1,2�. In contrast, our absorbing state, DSM1, is itselfa fluctuating turbulent state. Long-range interactions are thenlikely to be killed by the local turbulent fluctuations ofDSM1, which may have led to the observation of clean DPcritical behavior. It is noteworthy to remark that the Chaté-Manneville coupled map lattice �59�, a deterministic numeri-cal model for absorbing phase transitions with a nonchaotic�laminar� absorbing state, exhibits non-DP critical behaviorprobably due to solitonlike objects propagating through lami-nar regions. Interestingly, an elementary modification to ren-der its absorbing state itself chaotic does lead to DP scaling�60�.
In conclusion, we have experimentally found that theDSM1-DSM2 transition in the electroconvection of nematic
TABLE II. Summary of the measured critical exponents �see theremark �36� for the range of errors shown in the list�.
Exponent DSM1-DSM2 DPa
Density order parameter � 0.59�4� 0.583�3�Correlation lengthb �� 0.75�6� 0.78�9� 0.733�3�Correlation time �� 1.29�11� 1.295�6�Inactive interval in spaceb �� 1.08�18� 1.19�12� 1.204�2�c
Inactive interval in time �� 1.60�5� 1.5495�10�c
Density decay � 0.48�5� 0.4505�10�Local persistence �l 1.55�7� 1.611�7�d
Aging in autocorrelator b 0.9�1� 0.901�2��C /z 2.5�3� 2.583�14�
Survival probability � 0.46�5� 0.4505�10�Cluster volume � 0.22�5� 0.2295�10�Cluster mean square radius � 1.15�9� 1.1325�10�aReferences �25,26�.bFor �� and ��, exponents measured in x and y directions areshown in this order.cSee also the remark �27�.dReference �51�.
TABLE III. Experimentally confirmed scaling relations.
Scaling relations LHS RHS DPa
��=2−� /��b �in x� 1.08�18� 1.21�8� 1.204�2�
�in y� 1.19�12� 1.24�10� 1.204�2��� =2−� /��
b 1.60�5� 1.54�5� 1.5495�10��=� /�� 0.48�5� 0.46�5� 0.4505�10�b=2� /�� 0.9�1� 0.91�10� 0.901�2��C /z=1+ ��+ds��� /�� 2.5�3� 2.62�17�c 2.583�14��=� /�� 0.46�5� 0.46�5� 0.4505�10��= �ds��−2�� /�� 0.22�5� 0.25�11�c 0.2295�10��=2 /z=2�� /�� 1.15�9� 1.16�14�c 1.1325�10�aReferences �25,26�.bSee also the remark �27�.cThe value of �x is used for ��.
TAKEUCHI et al. PHYSICAL REVIEW E 80, 051116 �2009�
051116-10

liquid crystals, showing an absorbing transition into spa-tiotemporal intermittency, clearly belongs to the DP univer-sality class. Both static and dynamic critical behaviors havebeen investigated with the help of the newly developed ex-perimental technique to create a seed of DSM2, confirming atotal of 12 critical exponents, 5 scaling functions, 8 scalingrelations, and in particular the rapidity symmetry, in fullagreement with those characterizing the DP class in 2+1dimensions. We hope that this clear and comprehensive ex-perimental realization of a DP-class transition will triggerfurther studies of absorbing phase transitions and of relatedsituations with genuinely nonequilibrium critical properties.In this respect the recent works of Corté et al. �61� and ofMangan et al. �62� are especially encouraging, concerningexperiments and realistic situations, respectively, for absorb-ing transitions with a conserved field.
ACKNOWLEDGMENTS
The authors are grateful to I. Dornic, F. Ginelli, J. A.Hoyos, S. Kai, and N. Oikawa for fruitful discussions. Wewould also like to thank M. Henkel and G. I. Menon fordrawing our attention to aging and Ref. �41� and to localpersistence, respectively. This work was supported in part bythe Grant-in-Aid for Scientific Research �Grant No.18068005� and by the JSPS.
APPENDIX: BINARIZING IMAGES
Every analysis presented in the paper is performed usingbinarized images, where DSM2 domains are distinguishedfrom the absorbing DSM1 background. We give here a de-tailed description of the binarizing algorithm we used.
The binarization is carried out in the following manner.�a� We prepare three successive images taken at 15 frames/sand remove the inhomogeneity of the incident light intensity.�b� We then normalize the obtained intensity I of the threeimages with respect to mean �IDSM1� and standard deviation�IDSM1 of the DSM1 intensity at a given voltage, namely,Inorm= �I− �IDSM1�� /�IDSM1. Note that we can separately mea-sure the intensity of the fully DSM1 state even above the
threshold Vc since DSM1 always appears first when the volt-age is applied. �c� Since DSM2 domains have lower trans-mittance than DSM1, we extract the regions where the nor-malized intensity is less than a certain threshold, Ith. Here wechose Ith=1.5, determined so as to obtain a good agreementwith direct visual observations particularly in movies. �d�Taking into consideration that DSM2 domains move muchslower than the local intensity fluctuations in DSM1 �recallthat DSM1 is itself a turbulent state� and that the minimumDSM2 area is d2 /2 �32�, where d is the depth of the cell, wetake the logical intersection �“AND” operator� of the threesuccessive images and then remove clusters with areasmaller than d2 /2. Clusters are screened out in this way, andtheir binarized images in the middle frame are used as finalimages. In other words, the intersection is used only for com-parison with the minimum area. �e� Finally, we cut off theperiphery of the image of width d /2�2 since this region isbiased in the step �d�. The size of the binarized images re-duces to 1206�899 �m2, which roughly corresponds to142�106 effective degrees of freedom. We confirmed thatthe chosen threshold �Ith=1.5� works well all over the rangeof voltages we investigate and that no DSM2 region isfalsely detected when binarizing images of the fully DSM1phase. Typical results of the binarization are shown in Figs.1�c� and 1�e� and movie S2 in Ref. �33�, where we can con-firm that DSM2 domains are precisely detected.
For the critical-spreading experiments presented in Sec. V,we have slightly modified the binarization algorithm in orderto detect DSM2 patches originating only from the preparedseed and not to miss them. To this end, we have reduced theintensity threshold Ith to 1.2 and, instead, binarized onlywithin a target region, defined from positions of DSM2patches in previous images �position of the seed for the firstimage� and assumed maximal displacement of DSM2, whichis chosen to be much larger than the actual displacement,namely, d during successive two images taken at 15 frames/sand extrapolated diffusively. We again confirmed that bina-rized images from a single set of parameters closely followthe actual evolution of DSM2 patches for all the voltages ofinterest. A typical result is shown in the inset of Fig. 11.
�1� H. Hinrichsen, Adv. Phys. 49, 815 �2000�.�2� M. Henkel, H. Hinrichsen, and S. Lübeck, Non-Equilibrium
Phase Transitions, Vol. I: Absorbing Phase Transitions�Springer, Dordrecht, 2008�.
�3� L. Baroni, R. Livi, and A. Torcini, Phys. Rev. E 63, 036226�2001�.
�4� V. Ahlers and A. Pikovsky, Phys. Rev. Lett. 88, 254101�2002�.
�5� R. Dickman, M. A. Muñoz, A. Vespignani, and S. Zapperi,Braz. J. Phys. 30, 27 �2000�.
�6� Y. Pomeau, Physica D 23, 3 �1986�.�7� S. V. Buldyrev, A. -L. Barabási, F. Caserta, S. Havlin, H. E.
Stanley, and T. Vicsek, Phys. Rev. A 45, R8313 �1992�.�8� F. Ginelli, V. Ahlers, R. Livi, D. Mukamel, A. Pikovsky, A.
Politi, and A. Torcini, Phys. Rev. E 68, 065102�R� �2003�.�9� H. K. Janssen, Z. Phys. B: Condens. Matter 42, 151 �1981�.
�10� P. Grassberger, Z. Phys. B: Condens. Matter 47, 365 �1982�.�11� S. Ciliberto and P. Bigazzi, Phys. Rev. Lett. 60, 286 �1988�.�12� F. Daviaud, M. Bonetti, and M. Dubois, Phys. Rev. A 42, 3388
�1990�.�13� S. Michalland, M. Rabaud, and Y. Couder, Europhys. Lett. 22,
17 �1993�.�14� H. Willaime, O. Cardoso, and P. Tabeling, Phys. Rev. E 48,
288 �1993�.�15� M. M. Degen, I. Mutabazi, and C. D. Andereck, Phys. Rev. E
53, 3495 �1996�.�16� P. W. Colovas and C. D. Andereck, Phys. Rev. E 55, 2736
�1997�.
EXPERIMENTAL REALIZATION OF DIRECTED-… PHYSICAL REVIEW E 80, 051116 �2009�
051116-11

�17� H. Téphany, J. Nahmias, and J. A. M. S. Duarte, Physica A242, 57 �1997�.
�18� A. Daerr and S. Douady, Nature �London� 399, 241 �1999�.�19� A. Cros and P. Le Gal, Phys. Fluids 14, 3755 �2002�.�20� P. Rupp, R. Richter, and I. Rehberg, Phys. Rev. E 67, 036209
�2003�.�21� V. Lepiller, A. Prigent, F. Dumouchel, and I. Mutabazi, Phys.
Fluids 19, 054101 �2007�.�22� C. Pirat, A. Naso, J.-L. Meunier, P. Maïssa, and C. Mathis,
Phys. Rev. Lett. 94, 134502 �2005�.�23� H. Hinrichsen, A. Jiménez-Dalmaroni, Y. Rozov, and E.
Domany, Phys. Rev. Lett. 83, 4999 �1999�.�24� I. Jensen, J. Phys. A 32, 5233 �1999�.�25� P. Grassberger and Y. C. Zhang, Physica A 224, 169 �1996�.�26� C. A. Voigt and R. M. Ziff, Phys. Rev. E 56, R6241 �1997�.�27� Scaling relations used for �� and �� �Eq. �4�� may be slightly
violated in the order of 10−2 due to some intermittency effectsin DP �40,41�.
�28� P. Grassberger, in Nonlinearities in Complex Systems, editedby S. Puri and S. Dattagupta �Narosa, New Delhi, 1997�, p. 61.
�29� K. A. Takeuchi, M. Kuroda, H. Chaté, and M. Sano, Phys. Rev.Lett. 99, 234503 �2007�.
�30� E. Dubois-Violette, P. G. de Gennes, and O. Parodi, J. Phys.�Paris� 32, 305 �1971�.
�31� P. G. de Gennes and J. Prost, The Physics of Liquid Crystals,2nd ed. �Oxford University Press, Oxford, 1993�.
�32� S. Kai, W. Zimmermann, M. Andoh, and N. Chizumi, J. Phys.Soc. Jpn. 58, 3449 �1989�; Phys. Rev. Lett. 64, 1111 �1990�.
�33� J. Nehring, Phys. Rev. A 7, 1737 �1973�. Note that topologicaldefects observed there are obtained by switching off the ap-plied voltage from DSM2 �see also Ref. �32��.
�34� See the supplementary material to Ref. �29�, EPAPS DocumentNo. E-PRLTAO-99-056749, for movies S1 and S2. This mate-rial may be accessed from the reference section of the onlinearticle, or via the EPAPS homepage http://www.aip.org/pubservs/epaps.html.
�35� The deviation from criticality is measured in terms of V2 in-stead of V by convention since the dielectric torque that drivesthe electroconvection is proportional to V2 �30,31�. The resultsdo not change if �̄��V−Vc�� is used.
�36� Confidence intervals of the critical exponents given in thepresent paper are determined as follows. �a� For values esti-mated from a finite number of independent data points �Eqs.�2� and �7��, 95% confidence intervals in the sense of student’st are provided. �b� For values estimated from a continuouscurve �Eqs. �3�, �9�, �14�, �12�, and �19��, range of fitting isvaried within reasonable regions, and both the dependence onfitting regions and the confidence interval from each fitting areincorporated in the final estimate of error. When the thresholdis simultaneously determined �Eqs. �9� and �19��, uncertaintyin the estimate of the threshold is also considered. �c� Forvalues determined from data collapsing �Eq. �12��, we providethe range of values of the exponent with which no systematic
shift in data collapsing is seen. �d� For values derived from anequation, the range of error is estimated by the law of propa-gation of error. �e� For values cited from literature, we simplyborrow the range of errors provided by the corresponding au-thors.
�37� G. Strangi, C. Versace, N. Scaramuzza, D. E. Lucchetta, V.Carbone, and R. Bartolino, Phys. Rev. E 59, 5523 �1999�.
�38� T. Nagaya, T. Takeda, and H. Orihara, J. Phys. Soc. Jpn. 68,3848 �1999�.
�39� This correction was not made in Ref. �29�. Although algebraicdecays in the distributions are not much influenced, this cor-rection is significant to have exponential decays in sufficientlylarge scales to estimate the correlation length and time.
�40� B. Hede, J. Kertész, and T. Vicsek, J. Stat. Phys. 64, 829�1991�.
�41� M. Henkel and R. Peschanski, Nucl. Phys. B 390, 637 �1993�.�42� T. E. Harris, Ann. Probab. 2, 969 �1974�.�43� Note that parallel and perpendicular directions �x and y in our
notation� in the second reference in Ref. �32� are opposite.�44� M. Henkel, J. Phys.: Condens. Matter 19, 065101 �2007�.�45� F. Baumann and A. Gambassi, J. Stat. Mech.: Theory Exp.
�2007�, P01002.�46� S. N. Majumdar, Curr. Sci. 77, 370 �1999�, and references
therein.�47� H. Hinrichsen and H. M. Koduvely, Eur. Phys. J. B 5, 257
�1998�.�48� E. V. Albano and M. A. Muñoz, Phys. Rev. E 63, 031104
�2001�.�49� G. I. Menon, S. Sinha, and P. Ray, Europhys. Lett. 61, 27
�2003�.�50� J. Fuchs, J. Schelter, F. Ginelli, and H. Hinrichsen, J. Stat.
Mech.: Theory Exp. �2008�, P04015.�51� P. Grassberger, J. Stat. Mech.: Theory Exp. �2009�, P08021.�52� K. A. Takeuchi, Phys. Rev. E 77, 030103�R� �2008�.�53� M. Mizuno and T. Shinoda, Mol. Cryst. Liq. Cryst. 41, 155
�1978�.�54� M. Mizuno and T. Shinoda, Mol. Cryst. Liq. Cryst. 69, 103
�1981�.�55� J. Hooyberghs, F. Iglói, and C. Vanderzande, Phys. Rev. Lett.
90, 100601 �2003�.�56� J. A. Hoyos, Phys. Rev. E 78, 032101 �2008�.�57� T. Vojta and M. Dickison, Phys. Rev. E 72, 036126 �2005�; T.
Vojta, A. Farquhar, and J. Mast, ibid. 79, 011111 �2009�.�58� C. J. Neugebauer, S. V. Fallert, and S. N. Taraskin, Phys. Rev.
E 74, 040101�R� �2006�; S. V. Fallert and S. N. Taraskin, ibid.79, 042105 �2009�.
�59� H. Chaté and P. Manneville, Physica D 32, 409 �1988�.�60� H. Chaté �unpublished�.�61� L. Corté, P. M. Chaikin, J. P. Gollub, and D. J. Pine, Nat. Phys.
4, 420 �2008�.�62� N. Mangan, C. Reichhardt, and C. J. Olson Reichhardt, Phys.
Rev. Lett. 100, 187002 �2008�.
TAKEUCHI et al. PHYSICAL REVIEW E 80, 051116 �2009�
051116-12