Embed Size (px)
Citation preview

B R A I N R E S E A R C H 1 1 9 5 ( 2 0 0 8 ) 1 2 – 1 9
ava i l ab l e a t www.sc i enced i rec t . com
www.e l sev i e r. com/ loca te /b ra in res
Research Report
Expression of the MAST family of serine/threonine kinases
Patrick Garlanda, Shmma Quraishea, Pim Frenchb, Vincent O'Connora,⁎aUniversity of Southampton, School of Biological Sciences, Boldrewood, Basssett Crescent East, Southampton, SO16 7PX, UKbDepartment of Neurology, Josephine Nefkens Institute, Erasmus MC, PO Box 2040, 3000 DR Rotterdam, Netherlands
A R T I C L E I N F O
⁎ Corresponding author. Fax: +44 2380594459.E-mail address: [email protected] (V.Abbreviations: MAST, microtubule-associat
large/zona occludens-1 domain; RT-PCR, revcomplex; EMS, electroshock-evoked maximpostsynaptic density; mGluRs, metabotropic
0006-8993/$ – see front matter © 2007 Elsevidoi:10.1016/j.brainres.2007.12.027
A B S T R A C T
Article history:Accepted 16 December 2007Available online 23 December 2007
The Microtubule-Associated Serine/Threonine Kinase family (MAST1–4, and MAST-like) ischaracterised by the presence of a serine/threonine kinase domain and a postsynapticdensity protein-95/discs large/zona occludens-1 domain (PDZ). This latter domain gives theMAST family the capacity to scaffold its own kinase activity. In the present study we haveprofiled the mRNA for each member of the MAST family transcripts across various tissues,with particular focus on rodent brain. Reverse-transcriptase polymerase chain reaction (RT-PCR) has shown equivalent patterns of expression for MAST1 and 2 in multiple tissues. BothMAST3 and 4 showmore distinct expression in several tissues, and MAST-like appears to bepredominantly expressed in heart and testis. In situ hybridisation reveals overlappingexpression of MAST1 and 2 in specific brain regions. In contrast, MAST3 shows selectiveexpression in the striatum and cerebral cortex. MAST4 also exhibits distinct expression inoligodendrocytes of whitematter containing brain regions. In keeping with previous results,this family member also shows increased expression in the hippocampus following seizure-like activity. Our analysis of MAST family expression provides support for the role of thesekinases in a broad range of neural functions.
© 2007 Elsevier B.V. All rights reserved.
Keywords:PDZ domainIn situ hybridisationDystrophinStriatumOligodendrocytesSeizure
1. Introduction
The components of signalling pathways, including kinases,are dependent on the underlying scaffolding mechanism toensure the spatial and temporal control of their downstreamoutputs (e.g. Smith et al., 2006). Such scaffolding is achieved bynetworks of protein–protein interactions, which are mediatedby specialized scaffolding domains such as the PDZ domain(Kim and Sheng, 2004). The MAST protein family, initially rep-resented by Microtubule-Associated Serine/Threonine Kinaseof 205 kDa, harbours a kinase domain and a PDZ scaffoldingdomain (Walden and Cowan, 1993). MAST205 is now classified
O'Connor).ed serine/threonine kinaerse-transcriptase polymeal seizures; nNOS, neurglutamate receptor; IEG,
er B.V. All rights reserved
as MAST2 and other members of the family, MAST1, 3 and 4,share a similar domain organization suggesting a shared abil-ity to scaffold their own kinase activity. A fifth member of thefamily MAST-like (MAST-l) consists of an elongated kinasedomain, and has weak homology to the other family members(Manning et al., 2002). A potential scaffolding function for theseproteins is implicated by the ability ofMAST1 and 2 to associatewith the cytoskeleton and support a PDZ-dependent interactionwith syntrophin. These interactions may in turn contribute tothe organization of the utropin/dystrophin-associated proteincomplex (Lumengetal., 1999).Thescaffoldingofproteinsvia thePDZ domain of the MAST family has also been reported for
se; MAST-l, MAST-like; PDZ, postsynaptic density protein-95/discsrase chain reaction; UAPC/DAPC, utrophin/dystrophin-associatedonal nitric oxide synthase; NMJ, neuromuscular junction; PSD,immediate early genes; NPC, neural progenitor cells
.
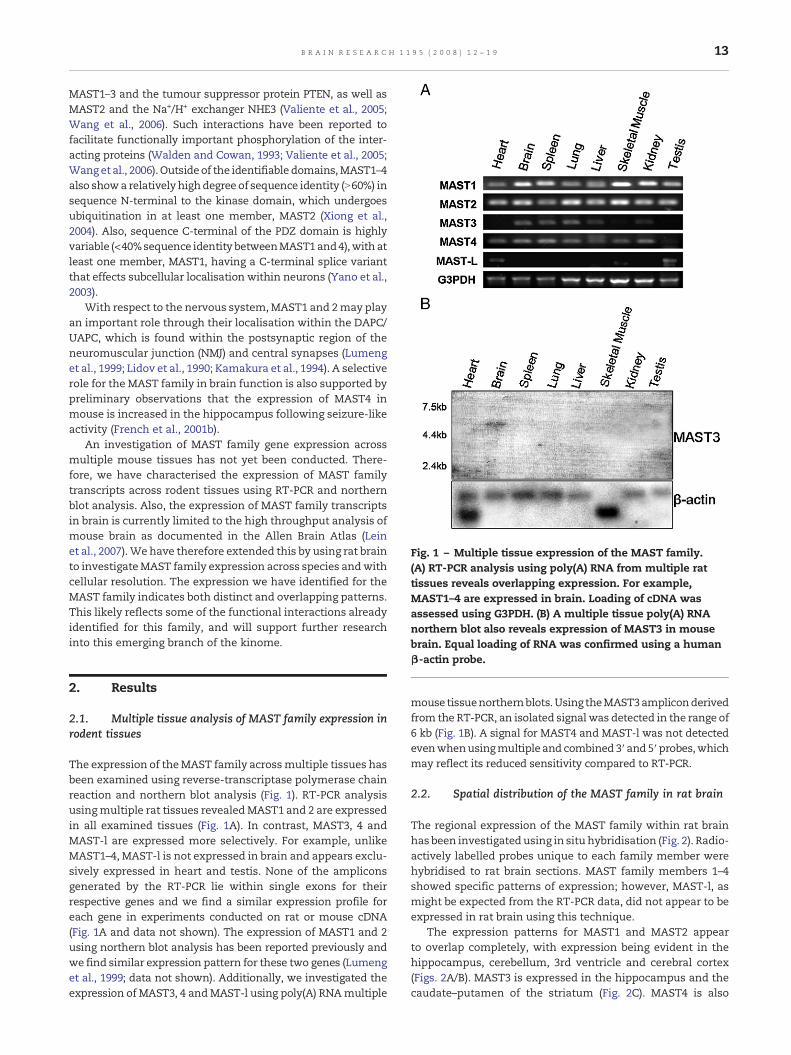
Fig. 1 – Multiple tissue expression of the MAST family.(A) RT-PCR analysis using poly(A) RNA from multiple rattissues reveals overlapping expression. For example,MAST1–4 are expressed in brain. Loading of cDNA wasassessed using G3PDH. (B) A multiple tissue poly(A) RNAnorthern blot also reveals expression of MAST3 in mousebrain. Equal loading of RNA was confirmed using a human
13B R A I N R E S E A R C H 1 1 9 5 ( 2 0 0 8 ) 1 2 – 1 9
MAST1–3 and the tumour suppressor protein PTEN, as well asMAST2 and the Na+/H+ exchanger NHE3 (Valiente et al., 2005;Wang et al., 2006). Such interactions have been reported tofacilitate functionally important phosphorylation of the inter-acting proteins (Walden and Cowan, 1993; Valiente et al., 2005;Wang et al., 2006). Outsideof the identifiable domains,MAST1–4also showa relativelyhighdegree of sequence identity (N60%) insequence N-terminal to the kinase domain, which undergoesubiquitination in at least one member, MAST2 (Xiong et al.,2004). Also, sequence C-terminal of the PDZ domain is highlyvariable (<40%sequence identity betweenMAST1and4),with atleast one member, MAST1, having a C-terminal splice variantthat effects subcellular localisation within neurons (Yano et al.,2003).
With respect to the nervous system,MAST1 and 2may playan important role through their localisation within the DAPC/UAPC, which is found within the postsynaptic region of theneuromuscular junction (NMJ) and central synapses (Lumenget al., 1999; Lidov et al., 1990; Kamakura et al., 1994). A selectiverole for the MAST family in brain function is also supported bypreliminary observations that the expression of MAST4 inmouse is increased in the hippocampus following seizure-likeactivity (French et al., 2001b).
An investigation of MAST family gene expression acrossmultiple mouse tissues has not yet been conducted. There-fore, we have characterised the expression of MAST familytranscripts across rodent tissues using RT-PCR and northernblot analysis. Also, the expression of MAST family transcriptsin brain is currently limited to the high throughput analysis ofmouse brain as documented in the Allen Brain Atlas (Leinet al., 2007).We have therefore extended this by using rat brainto investigateMAST family expression across species andwithcellular resolution. The expression we have identified for theMAST family indicates both distinct and overlapping patterns.This likely reflects some of the functional interactions alreadyidentified for this family, and will support further researchinto this emerging branch of the kinome.
β-actin probe.
2. Results
2.1. Multiple tissue analysis of MAST family expression inrodent tissues
The expression of theMAST family acrossmultiple tissues hasbeen examined using reverse-transcriptase polymerase chainreaction and northern blot analysis (Fig. 1). RT-PCR analysisusingmultiple rat tissues revealedMAST1 and 2 are expressedin all examined tissues (Fig. 1A). In contrast, MAST3, 4 andMAST-l are expressed more selectively. For example, unlikeMAST1–4, MAST-l is not expressed in brain and appears exclu-sively expressed in heart and testis. None of the ampliconsgenerated by the RT-PCR lie within single exons for theirrespective genes and we find a similar expression profile foreach gene in experiments conducted on rat or mouse cDNA(Fig. 1A and data not shown). The expression of MAST1 and 2using northern blot analysis has been reported previously andwe find similar expression pattern for these two genes (Lumenget al., 1999; data not shown). Additionally, we investigated theexpression of MAST3, 4 andMAST-l using poly(A) RNAmultiple
mouse tissuenorthernblots.Using theMAST3ampliconderivedfrom the RT-PCR, an isolated signal was detected in the range of6 kb (Fig. 1B). A signal for MAST4 and MAST-l was not detectedevenwhenusingmultiple and combined 3′ and 5′probes,whichmay reflect its reduced sensitivity compared to RT-PCR.
2.2. Spatial distribution of the MAST family in rat brain
The regional expression of the MAST family within rat brainhas been investigated using in situ hybridisation (Fig. 2). Radio-actively labelled probes unique to each family member werehybridised to rat brain sections. MAST family members 1–4showed specific patterns of expression; however, MAST-l, asmight be expected from the RT-PCR data, did not appear to beexpressed in rat brain using this technique.
The expression patterns for MAST1 and MAST2 appearto overlap completely, with expression being evident in thehippocampus, cerebellum, 3rd ventricle and cerebral cortex(Figs. 2A/B). MAST3 is expressed in the hippocampus and thecaudate–putamen of the striatum (Fig. 2C). MAST4 is also

Fig. 2 – Tissue expression of the MAST family in rat brain. Panels A–D show rat brain sections cut in 3 orientations – horizontal,sagittal, and coronal – and probed with radioactively labelled oligonucleotides specific to each family member. Anoligonucleotide specific to MAST-l did not produce a detectable signal. Co, cerebral cortex; Hi, hippocampus; 3V, 3rd ventricle;Ce, cerebellum; CPu, caudate–putamen; CC, corpus callosum; IC, internal capsule; Fi, fimbria.
14 B R A I N R E S E A R C H 1 1 9 5 ( 2 0 0 8 ) 1 2 – 1 9
expressed in the hippocampus, as well as white matter con-taining regions (Fig. 2D). The expression patterns for MAST3and MAST4 have been confirmed using independent probes(data not shown).
No specific signalwasobservedusinganexcess ofunlabelledoligonucleotide or the sense probe (data not shown).
To delineate the expression patterns for the MAST familywith higher resolution emulsion autoradiography was per-formed for MAST1–4 (Fig. 3).
All family members tested showed expression in neuronsof the hippocampus (Figs. 3A–D). To illustrate this expressionthe crest of the dentate gyrus is shown in Fig. 3A (MAST1),Fig. 3C (MAST3), and Fig. 3D (MAST4); and the ventral limb of
the dentate gyrus is shown in Fig. 3B (MAST2). MAST1 and 2are also expressed in the neuronal, granule cell, layer of thecerebellum (Figs. 3E–F). In contrast, MAST4 shows a clearexpression in the non-neuronal white matter regions of thecerebellum (Fig. 3G). Oligodendrocytes characteristically formtandem arrays in white matter containing regions, and asignal for MAST4 can be seen to follow this pattern. MAST4 isalso expressed in Purkinje cells of the cerebellum (Fig. 3H).Fig. 3I shows a signal for MAST3 in medium sized neurons ofthe striatum (black arrows), and not glia (white arrow). Theneurons showing expression of MAST3 appear to constitute alarge proportion of the cell types present; therefore, MAST3appears to be expressed in the medium spiny projection

Fig. 3 – Cellular expression of theMAST family in rat brain. Panels A–J show emulsion autoradiographs performed using probesspecific to MAST1–4 on rat brain sections. Panels A–D show expression of MAST1 (A), MAST2 (B), MAST3 (C), and MAST4 (D) inthe granule cells of the dentate gyrus. Panels E and F also show expression of MAST1 and 2 in the granule cells of thecerebellum. In contrast MAST4 shows expression in oligodendrocytes of the cerebellum (G), and Purkinje cells (H). MAST3shows expression inmedium size neurons of the striatum (I, black arrows), but not non-neuronal cells (I, white arrow); neuronsin layer II of the cerebral cortex also show expression of MAST3 (J). Scale bars in A–F=20 μm, and H–J=30 μm.
15B R A I N R E S E A R C H 1 1 9 5 ( 2 0 0 8 ) 1 2 – 1 9

Table 1 – Summary of distinct and overlapping expression patterns for MAST1–4 in the rat brain
MAST1 MAST2 MAST3 MAST4
Structure Rat Mouse (Brain Atlas) Rat Mouse (Brain Atlas) Rat Mouse (Brain Atlas) Rat Mouse (Brain Atlas)
Hippocampus ++ ++ ++ ++ +++ +++ + −Cortex + + + + +++ +++ − −Cerebellum ++ ++ ++ ++ − − ++ −3rd ventricle + − ++ − − − ++ −Striatum − − − − +++ ++ − −White matter − − − − − − ++ −
Relative expression patterns have been scored semi-quantitatively as indicated. For comparison, expression patterns reported for mouse brain(Allen Brain Atlas) are shown.
16 B R A I N R E S E A R C H 1 1 9 5 ( 2 0 0 8 ) 1 2 – 1 9
neurons, which can constitute up to 95% of the neuronalpopulation in the striatum (Kemp and Powell, 1971). MAST3also shows expression in cells of the cerebral cortex, especiallyneurons within layer II (Fig. 3J). The distinct and overlappingexpression patterns for the MAST family in rat brain are sum-marised in Table 1.
2.3. The expression of MAST4 is increased followingseizure-like activity
The activity-dependent expression of MAST4 has beenreported previously in mouse brain (French et al., 2001b). Toexaminewhether this increase also occurs in rat brainwehave
Fig. 4 – The expression of MAST4 is increased followingseizure-like activity. The oligonucleotide used to assessexpression of MAST4 in naive tissue was used to probe ratbrain coronal sections derived from animals subjected toEMS. Representative sections taken from control animals areshown on the left, and those from animals 1 h post-seizureare shown on the right. The integrated density for control andseized tissue was measured for the dentate gyrus (dg)using the programme ImageJ (NIH) and normalised withreference to the cerebral cortex. The expression of MAST4was found to significantly increase (p<0.02, n=3) in thedentate gyrus. In contrast, the expression of MAST3 was notfound to increase following EMS.
used in situ hybridisation on animals exposed to electroshock-evokedmaximal seizure (EMS; Fig. 4). The expressionofMAST4in the dentate gyrus of the hippocampus can be seen tosignificantly (p<0.02, n=3) increase by 1.4 fold 1 h after seizure-like activity. The expression of MAST4 after 4 h post-EMSreturned to control levels (data not shown). In contrast, theexpression of MAST3, which is constitutively expressed atrelatively high levels in the hippocampus, does not increasefollowing EMS.
3. Discussion
Wehave profiled themRNA expression for theMAST family ofserine/threonine kinases across multiple tissues, with parti-cular focus on rodent brain. RT-PCR on rat (Fig. 1A) and mouse(data not shown) illustrates that both MAST1 and 2 areexpressed across all examined tissues, and MAST3 to MAST-lhave a more selective expression. In situ hybridisation hasshown an overlap of MAST family expression in the hippo-campus, cortex and cerebellum, and more selective expres-sion ofMAST3 in the striatumandMAST4 in oligodendrocytes.
As Table 1 shows, the regional expression of the MASTfamily in rat brain appears to generally overlap with thosereported for mouse brain. However, we show an expression inthe 3rd ventricle for MAST1, 2 and 4 and in the cerebellum forMAST2, which is not detected by the Allen Brain Atlas (Leinet al., 2007). Unlike the Allen Brain Atlas, we have labelled ourprobes radioactively, which allows for increased sensitivity.This increase in sensitivity is most clearly illustrated by ourcharacterisation of MAST4 expression, which is also not de-tected by the Allen Brain Atlas. As well as a more comprehen-sive characterisation of gross anatomical expression, we havealso shown an expression of MAST family members at thecellular level using emulsion autoradiography.
Like the RT-PCR analysis, the expression of MAST1 and 2 inbrain appears to overlap, which suggests that they may sharesimilar functions. Themost likely explanation for this degree ofoverlap is the role these family members have in the dystro-phin/utrophin-associated protein complex.
The UAPC/DAPC links the actin cytoskeleton to the extra-cellular matrix, particularly in postsynaptic cell membranespecialisations such as the neuromuscular junction and thepostsynaptic density of central synapses. This structural role isaugmented by interactions that support the clustering ofreceptors, signal transduction molecules, and associated

17B R A I N R E S E A R C H 1 1 9 5 ( 2 0 0 8 ) 1 2 – 1 9
proteins. These interactions are mediated by components ofthe complex such as the syntrophins. Both MAST1 and 2 havebeen found to interact with the syntrophins (Lumeng et al.,1999). These investigations showed that MAST1 proteincolocalises with DAPC/UAPC components in the vascular en-dothelium of the CNS, choroid plexuses, neurons in thecerebral cortex and cerebellum (Lumeng et al., 1999). Ourexpression data for MAST1 mRNA is therefore in agreementwith that previously identified (Lumeng et al., 1999). Inparticular, our identification of MAST1 expression in the 3rdventricle (as opposed to neuronal nuclei such as the medialhabenula) is rationalised by the invagination of this structureby the choroid plexuses. Previous work has reported expres-sion of MAST2 transcripts in mouse brain using northern blotanalysis (Lumeng et al., 1999). However, this workwas not ableto characterise the expression pattern for MAST2 in brain.Therefore, our identification of overlapping expression pat-terns for MAST1 and 2 suggests that these family membersshare similar roles in the DAPC/UAPC.
Like MAST1 and 2, MAST3 is also expressed in brain. Thedatabase (NCBI) entry for murine MAST3 predicts an mRNA ofbetween 3 and 4.4 kb— this ambiguity is due to poor definitionof the full-length transcript. However, the predicted size offull-length MAST3 for three other species is within the rangewe detected: Macaca mulatta (6.3 kb); Pan troglodytes (6.2 kb);Homo sapiens (5.9 kb). We therefore believe the predominantMAST3 transcript withinmouse brain to be within the range of6 kb. The expression of MAST3 in the hippocampus appearsstronger than MAST1/2, and unlike these family members ithas a more distinct pattern of expression in the cortex andstriatum, which in the latter structure appears to be in themedium spiny neurons. This unique pattern of expression isparticularly interesting in light of the interaction we haveidentified between MAST1/2 and group I and II metabotropicglutamate receptors (mGluRs; Pilkington, B.J, unpublished data).For example, mGlur5 is expressed in the cortex, hippocampusand the medium spiny neurons of the striatum (Testa et al.,1994; Kerner et al., 1997). Further investigations are thereforeneeded to determinewhether MAST3 can also interact with themGluRs.
Under basal conditions, MAST4 transcript is expressed inthe 3rd ventricle, hippocampus and oligodendrocytes withinwhite matter containing regions of the brain. However, fol-lowing seizure-like activity there is a transient up-regulationofMAST4 mRNA within the dentate gyrus, which is consistentwith our earlier study in mouse (French et al., 2001b). This up-regulation appears selective to MAST4 as MAST3, a major hip-pocampal isoform, is not similarly regulated. This observationargues that MAST4 is among the specific subset of hippocam-pal transcripts that are regulatedby EMS (O'Connor et al., 2004).
The temporary induction ofMAST4 is reminiscent of imme-diate early genes (IEG) whose expression in the dentate gyrushas also been found to increase following seizure stimulus;for example, the transcription factors, zif268, c-fos, jun-B, andc-jun (Saffen et al., 1988) and the scaffolding protein Homer1a(Xiao et al., 1998). Immediate early genes are thought to sup-port activity-dependent changes in synaptic function, and theirexpression following seizure may contribute to the aetiology ofepilepsy (Hughes et al., 1999). The restrictedup-regulation in thedentate gyrus over other sub-fields of the hippocampusmay be
related to the fact that this region of the brain contains glia-likestem cells that can differentiate into granule cells. This pos-sibilitymay allow its expression inoligodendrocytes and the 3rdventricle to be reconciled with its activity-dependent expres-sion. It is now known that the dentate and in particular thesubventricular zonecontainpopulationsof stemcells (MingandSong, 2005). Following seizure, these neural progenitor cells(NPC) are known to proliferate and differentiate into granulecells (Parent et al., 1997). Recentwork highlights these ‘germinalniches’ which also exist in the 3rd ventricle and the whitematter and are maintained in an astroglial phenotype, whichcan both proliferate and differentiate into neurons and glia(Alvarez-Buylla and Lim, 2004; Xu et al., 2005; Takemura, 2005).These studies therefore suggest that neurogenic cellswithin thedentate gyrusaremore closely related toother glia cells than theneurons they can differentiate into. This proposition is sup-ported by a recent reportwhich shows that the transcriptome ofhippocampal NPC shows a stronger similarity to that of whitematter containing brain regions than differentiated hippocam-pal tissue (Maisel et al., 2007). In the context described above,MAST4 may thus contribute to an aspect of glia phenotypewhich is required continuously in oligodendrocytes, but onlytransiently following seizure stimulus. This hypothesis isparticularly interesting in light of the expression pattern of thealternatively spliced isoform of MAST1, SAST124 (Yano et al.,2003). SAST124 protein is expressed in the dentate gyrus,subventricular zone and the pathway that nascent cellsmigratealong from this neurogenic region to the olfactory bulb. Thispatternof expressionhasalso leadYanoet al. (2003) toproposearole for SAST124 in regulating/maintaining cellular phenotypein these regions. Interestingly, these authors also show anexpression of SAST124 in glia-like cells of the corpus callosum.The expression patterns of MAST4 and SAST124 thereforesuggest that these familymembersmaysharesimilar functions.
In conclusion, our data report a distinct and overlappingexpression of a poorly investigated branch of the mammaliankinome.Theextensiveexpressionof theMAST familycombinedwith their ability to restrict their signalling through scaffoldingsuggests that these kinases will have a broad role in neuralfunction. The expression in cell types of distinct function butrelated developmental origin, combined with transcriptionalregulation in response to activity, indicates a potential functionin the short and long term plasticity of the brain.
4. Experimental procedures
4.1. Reverse-transcriptase polymerase chain reaction(RT-PCR)
RT-PCR was performed using a rat multiple tissue cDNA panel(reverse transcribed from poly(A) RNA) purchased from Clon-tech. The following oligonucleotide primers were used toamplifynon-homologous regionsofeachMAST familymember:
MAST1 Sense 5′-atcaccatccaacgctcag-3′MAST1 Antisense 5′-ggtcacagctactttgttgc-3′MAST2 Sense 5′-atcatcatccaccgagctgg-3′MAST2 Antisense 5′-aattgataccttgttccactc-3′MAST3 Sense 5′-aaccgtaagagcttggtcgtg-3′MAST3 Antisense 5′-ggtggtggataaagcccaaga-3′

18 B R A I N R E S E A R C H 1 1 9 5 ( 2 0 0 8 ) 1 2 – 1 9
MAST4 Sense 5′-cagcccattgtcatccacag-3′MAST4 Antisense 5′-tggagtagtggtgatagacac-3′MAST-l Sense 5′-tgaggagaatgaaggaggtgc-3′MAST-l Antisense 5′-cgaaggtatgtgactggctac-3′
The oligonucleotide primer set used for the amplification ofthe G3PDH control was:
5′-tgaaggtcggtgtcaacggatttggc-3′5′-catgtaggccatgaggtccaccac-3′
The cycling parameters for polymerase chain reaction (PCR)were: 94 °C for 2min; 35 cycles of 94 °C for 40 s, 30 s for (MAST1/l55 °C,MAST2/353 °C,MAST451 °C), and1minat72 °C; andfinally72 °C for 10 min. The amplified products were electrophoresedon a 1% gel and visualised with ethidium bromide staining.
4.2. Northern blot analysis
Mouse multiple tissue northern blots (Clonetech) were probedwith cDNA fragments from non-homologous regions ofMAST3 (bp 206–770, AK140821.1), MAST4 (bp 8481–9132 andbp 1667–2470, AK090136.1), MAST-l (bp 79–980, AK030140) andhuman β-actin. Following random prime labelling (Sigma)using 32P-dCTP, blots were incubated at 68 °C overnight witheach probe(s) in 15 ml of hybridisation buffer (5× SSC, 5×Denhardts solution, 0.1× SDS, 100 μg/ml sheared salmonsperm DNA). Following hybridisation, blots were then washed3× 15 min in wash solution 1 (2× SSC, 0.05% SDS) at R/T. Theblots were finally washed 2× 20min at 50 °C in wash solution 2(0.1× SSC, 0.1% SDS), and exposed to autoradiographic film.
4.3. In situ hybridisation
Adult male Wistar rats were sacrificed by cervical dislocationand their brains removed. 14 μMsectionswere cut on a cryostat,mounted onto Superfrost slides (Menzel-Glaser) and stored at−80 °C prior to use. In situ hybridisation was performed aspreviously described (French et al., 2001a), with exposure timebetween 4 and 8 weeks. For emulsion autoradiography slideswere dipped in Ilford K-5 emulsion, the exposure increased 3–5folds the standard exposure time, developed, and counter-stained with cresyl violet. For quantification, autoradiographswere analysed by measuring the integrated density of thedentate gyrus using ImageJ (NIH), which was normalised withreference to the cerebral cortex.
45mer oligonucleotides unique to each member were sup-plied by Eurogentec. Sequences were:
MAST1 Sense —atgtctgactctctctggaccgcgctttccaatttctcgatgccc
MAST1 Antisense —gggcatcgagaaattggaaagcgcggtccagagagagtcagacat
MAST2 Sense —gttcctgcccgtaggactgatggacggcgctggtctttggcctca
MAST2 Antisense —tgaggccaaagaccagcgccgtccatcagtcctacgggcaggaac
MAST3 Sense — cgtagtttctcctcgggcctccagcactctctgtcctccagMAST3 Antisense —
ctggaggacagagagtgcctggaggcccgaggagaaactacgMAST4 Sense —
tgcaaaaacaaaccacaaagatagccaagatgaggtgaagtccctMAST4 Antisense —
agggacttcacctcatcttggctatctttgtggtttgtttttgca
MAST-l Sense —ccagacaacgaaacagatacatcctactttgaagccaggaa
MAST-l Antisense —attgttctggcttcaaagtaggatgtatctgtttcgttgt
4.4. Electroshock-evoked maximal seizures
As previously described (Upton et al., 1997), electroshock-evoked maximal seizures (EMS) were induced in adult maleSprague–Dawley rats,whichwere supplied byCharlesRiver,UK.The experimental work was conducted in compliance withHome Office Guidance on the operation of the Animals (Scien-tific Procedures) Act 1986, and was approved by the SmithKlineBeecham Procedures Review Panel. In brief, animals weresubjected to a maximal fixed current (60 mA, 0.3 s, 50 Hz sinewave) applied via corneal electrodes. This procedure inducedhind limb tonic extensor seizure in all animals. A control groupof animals was exposed to the same procedure, but withoutstimulation. Brains were removed 1 h and 4 h post-EMS, frozenon dry ice, and stored at −80 °C.
R E F E R E N C E S
Alvarez-Buylla, A., Lim, D.A., 2004. For the long run: maintaininggerminal niches in the adult brain. Neuron 41, 683–686.
French, P.J., O'Connor, V., Jones, M.W., Davis, S., Errington, M.L.,Voss, K., Truchet, B., Wotjak, C., Stean, T., Doyere, V.,Maroun, M., Laroche, S., Bliss, T.V., 2001a. Subfield-specificimmediate early gene expression associated withhippocampal long-term potentiation in vivo. Eur. J. Neurosci.13, 968–976.
French, P.J., O'Connor, V., Voss, K., Stean, T., Hunt, S.P., Bliss, T.V.,2001b. Seizure-induced gene expression in area CA1 of themouse hippocampus. Eur. J. Neurosci. 14, 2037–2041.
Hughes, P.E., Alexi, T., Walton, M., Williams, C.E., Dragunow, M.,Clark, R.G., Gluckman, P.D., 1999. Activity andinjury-dependent expression of inducible transcription factors,growth factors and apoptosis-related genes within the centralnervous system. Prog. Neurobiol. 57, 421–450.
Kamakura, K., Tadano, Y., Kawai, M., Ishiura, S., Nakamura, R.,Miyamoto, K., Nagata, N., Sugita, H., 1994. Dystrophin-relatedprotein is found in the central nervous system of mice atvarious developmental stages, especially at the postsynapticmembrane. J. Neurosci. Res. 37, 728–734.
Kemp, J.M., Powell, T.P., 1971. The structure of the caudate nucleusof the cat: light and electron microscopy. Philos. Trans. R. Soc.Lond., B Biol. Sci. 262, 383–401.
Kerner, J.A., Standaert, D.G., Penney Jr., J.B., Young, A.B.,Landwehrmeyer, G.B., 1997. Expression of group onemetabotropic glutamate receptor subunit mRNAs inneurochemically identified neurons in the rat neostriatum,neocortex, and hippocampus. Brain Res. Mol. Brain Res. 48,259–269.
Kim, E., Sheng, M., 2004. PDZ domain proteins of synapses. Nat.Rev., Neurosci. 5, 771–781.
Lein, E.S., Hawrylycz, M.J., Ao, N., Ayres, M., Bensinger, A., Bernard,A., Boe, A.F., Boguski, M.S., Brockway, K.S., Byrnes, E.J., Chen, L.,Chen, L., Chen, T.M., Chin, M.C., Chong, J., Crook, B.E.,Czaplinska, A., Dang, C.N., Datta, S., Dee, N.R., Desaki, A.L.,Desta, T., Diep, E., Dolbeare, T.A., Donelan, M.J., Dong, H.W.,Dougherty, J.G., Duncan, B.J., Ebbert, A.J., Eichele, G., Estin, L.K.,Faber, C., Facer, B.A., Fields, R., Fischer, S.R., Fliss, T.P., Frensley,C., Gates, S.N., Glattfelder, K.J., Halverson, K.R., Hart, M.R.,Hohmann, J.G., Howell, M.P., Jeung, D.P., Johnson, R.A., Karr, P.T.,
19B R A I N R E S E A R C H 1 1 9 5 ( 2 0 0 8 ) 1 2 – 1 9
Kawal, R., Kidney, J.M., Knapik, R.H., Kuan, C.L., Lake, J.H.,Laramee, A.R., Larsen, K.D., Lau, C., Lemon, T.A., Liang, A.J., Liu,Y., Luong, L.T., Michaels, J., Morgan, J.J., Morgan, R.J., Mortrud,M.T., Mosqueda, N.F., Ng, L.L., Ng, R., Orta, G.J., Overly, C.C., Pak,T.H., Parry, S.E., Pathak, S.D., Pearson, O.C., Puchalski, R.B.,Riley, Z.L., Rockett, H.R., Rowland, S.A., Royall, J.J., Ruiz, M.J.,Sarno, N.R., Schaffnit, K., Shapovalova, N.V., Sivisay, T.,Slaughterbeck, C.R., Smith, S.C., Smith, K.A., Smith, B.I., Sodt, A.J.,Stewart, N.N., Stumpf, K.R., Sunkin, S.M., Sutram, M., Tam, A.,Teemer, C.D., Thaller, C., Thompson, C.L., Varnam, L.R., Visel, A.,Whitlock, R.M., Wohnoutka, P.E., Wolkey, C.K., Wong, V.Y.,Wood, M., Yaylaoglu, M.B., Young, R.C., Youngstrom, B.L., Yuan,X.F., Zhang, B., Zwingman, T.A., Jones, A.R., 2007. Genome-wideatlas of gene expression in the adult mouse brain. Nature 445,168–176.
Lidov, H.G., Byers, T.J., Watkins, S.C., Kunkel, L.M., 1990.Localization of dystrophin to postsynaptic regions of centralnervous system cortical neurons. Nature 348, 725–728.
Lumeng, C., Phelps, S., Crawford, G.E., Walden, P.D., Barald, K.,Chamberlain, J.S., 1999. Interactions between beta2-syntrophin and a family of microtubule-associated serine/threonine kinases. Nat. Neurosci. 2, 611–617.
Maisel, M., Herr, A., Milosevic, J., Hermann, A., Habisch, H.J.,Schwarz, S., Kirsch, M., Antoniadis, G., Brenner, R.,Hallmeyer-Elgner, S., Lerche, H., Schwarz, J., Storch, A., 2007.Transcription profiling of adult and fetal humanneuroprogenitors identifies divergent paths to maintain theneuroprogenitor cell state. Stem Cells 25, 1231–1240.
Manning, G., Whyte, D.B., Martinez, R., Hunter, T., Sudarsanam, S.,2002. The protein kinase complement of the human genome.Science 298, 1912–1934.
Ming, G.L., Song, H., 2005. Adult neurogenesis in themammalian central nervous system. Annu. Rev. Neurosci.28, 223–250.
O'Connor, V., Genin, A., Davis, S., Karishma, K.K., Doyere, V., DeZeeuw, C.I., Sanger, G., Hunt, S.P., Richter-Levin, G., Mallet, J.,Laroche, S., Bliss, T.V.P., French, P.J., 2004. Differentialamplification of intron containing transcript reveals long-termpotentiation associated up-regulation of specific Pde10Aphosphodiesterase splice variants. J. Biol. Chem. 279,15841–15849.
Parent, J.M., Yu, T.W., Leibowitz, R.T., Geschwind, D.H., Sloviter,R.S., Lowenstein,D.H., 1997. Dentate granule cell neurogenesis isincreased by seizures and contributes to aberrant networkreorganization in the adult rat hippocampus. J. Neurosci. 17,3727–3738.
Saffen, D.W., Cole, A.J., Worley, P.F., Christy, B.A., Ryder, K.,Baraban, J.M., 1988. Convulsant-induced increase in
transcription factor messenger RNAs in rat brain. Proc. Natl.Acad. Sci. U. S. A. 85, 7795–7799.
Smith, F.D., Langeberg, L.K., Scott, J.D., 2006. The where's andwhen's of kinase anchoring. Trends Biochem. Sci. 31,316–323.
Takemura, N.U., 2005. Evidence for neurogenesis within the whitematter beneath the temporal neocortex of the adult rat brain.Neuroscience 134, 121–132.
Testa, C.M., Standaert, D.G., Young, A.B., Penney Jr., J.B., 1994.Metabotropic glutamate receptor mRNA expression in thebasal ganglia of the rat. J. Neurosci. 14, 3005–3018.
Upton, N., Blackburn, T.P., Campbell, C.A., Cooper, D., Evans, M.L.,Herdon, H.J., King, P.D., Ray, A.M., Stean, T.O., Chan, W.N.,Evans, J.M., Thompson, M., 1997. Profile of SB-204269, amechanistically novel anticonvulsant drug, in rat models offocal and generalized epileptic seizures. Br. J. Pharmacol. 121,1679–1686.
Valiente, M., Andres-Pons, A., Gomar, B., Torres, J., Gil, A.,Tapparel, C., Antonarakis, S.E., Pulido, R., 2005. Binding of PTENto specific PDZ domains contributes to PTEN protein stabilityand phosphorylation by microtubule-associatedserine/threonine kinases. J. Biol. Chem. 280, 28936–28943.
Walden, P.D., Cowan, N.J., 1993. A novel 205-kilodaltontestis-specific serine/threonine protein kinase associated withmicrotubules of the spermatid manchette. Mol. Cell. Biol. 13,7625–7635.
Wang, D., Lee, H.J., Cooper, D.S., Cebotaro, L., Walden, P.D., Choi, I.,Yun, C.C., 2006. Coexpression of MAST205 inhibits the activityof Na+/H+ exchanger NHE3. Am. J. Physiol. Renal Physiol. 290,F428–F437.
Xiao, B., Tu, J.C., Petralia, R.S., Yuan, J.P., Doan, A., Breder, C.D.,Ruggiero, A., Lanahan, A.A., Wenthold, R.J., Worley, P.F., 1998.Homer regulates the association of group 1 metabotropicglutamate receptors with multivalent complexes ofhomer-related, synaptic proteins. Neuron 21, 707–716.
Xiong, H., Li, H., Chen, Y., Zhao, J., Unkeless, J.C., 2004.Interaction of TRAF6 with MAST205 regulates NF-kappaBactivation and MAST205 stability. J. Biol. Chem. 279,43675–43683.
Xu, Y., Tamamaki, N., Noda, T., Kimura, K., Itokazu, Y.,Matsumoto, N., Dezawa, M., Ide, C., 2005. Neurogenesis in theependymal layer of the adult rat 3rd ventricle. Exp. Neurol. 192,251–264.
Yano, R., Yap, C.C., Yamazaki, Y., Muto, Y., Kishida, H., Okada, D.,Hashikawa, T., 2003. Sast124, a novel splice variant ofsyntrophin-associated serine/threonine kinase (SAST), isspecifically localized in the restricted brain regions.Neuroscience 117, 373–381.

![PGS,TS.NGUYEÃN PHÖÔÙC NHUAÄN Ch · 4 THREONINE Thr[T] (αααα-amino ββββ-hydroxyl butyric acid) 07 STT Tên Ký hiệu Công thức cấu tạo SERINE Ser [S] (αααα-amino](https://img.pdfslide.tips/doc/110x75/5e10d2c143e3ce5333489551/pgstsnguyefn-phc-nhuan-ch-4-threonine-thrt-amino-hydroxyl.jpg)