Embed Size (px)
Citation preview

International Conference on Soil and Water Assessment Tool (SWAT)
10th-12th Jan. 2018
IIT Madras, Chennai, India.
Ch.Tirupathi, T. Shashidhar
Research Scholar, Associate Professor
Department of Civil Engineering, IIT- Hyderabad, India.
Extreme event analysis of Krishna river basin under
future scenarios
11-Jan-18 1

Problem statement
• Economy of the country mainly depends on vagaries of the weather especially on
extreme weather events.
• The extreme events such as floods, drought, cyclone and heat waves have huge
impact on India.
• According to the International Disaster Data Base “there have been 268 reported
flooding events in India over 1950-2015 affecting about 825 million people, leaving
17 million homeless and killing 69,000 people”.
• IMD recorded 2016 as the hottest year since 1901.
• According IMD report 1600 people died due to extreme heat wave conditions
whereas 475 lives were lost in floods and around 330 million people are affected
by drought in India by the year 2016.
• Understanding the climate variability and its influence on the occurrence of
extreme events such as floods and drought under future scenarios
11-Jan-18 2

Objective
“Seasonal prediction of Indian summer monsoon rainfall
along with predictions of extreme rainfall events”
11-Jan-18 3

Methodology
11-Jan-18 4

Study Area
Krishna basin, India.
It lies between 73°17’E to 81°9’E and 13°10’ N to 19°22’ N
The annual average rainfall is
about 784 mm
Maximum and minimum
temperatures of basin varies from
27.7°C to 40.4°C and 20.6°C to
27.2°C.
Source: India-wris.nrsc.gov.in
11-Jan-18 5
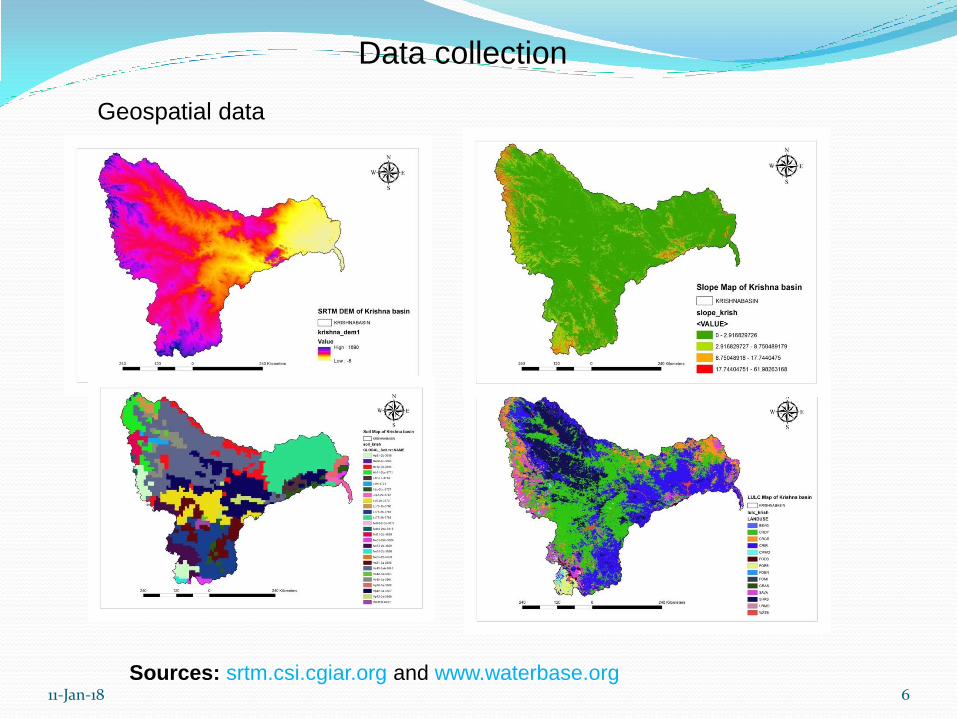
Sources: srtm.csi.cgiar.org and www.waterbase.org
11-Jan-18 6
Data collection
Geospatial data

Climate Model Data
The observed climate data i.e., rainfall (0.25°×0.25°) was obtained from Indian
Meteorological Department (IMD), Pune, India, and temperature (0.25°×0.25°) were
obtained from NCEP Climate Forecast System Reanalysis (CFSR).
Climate model data –RCM available with grid cell size 0.5°×0.5°.
Driving GCM model: CSIRO-QCCCE-CSIRO-Mk3-6-0, NOAA-GFDL-GFDL-ESM2M,
ICHEC-EC-EARTH, MPI-M-MPI-ESM-LR, IPSL-IPSL-CM5A-MR, MIROC-MIROC5,
CNRM-CERFACS-CNRM-CM5 and NCC-NorESM1-M.
Source: esg-dn1.nsc.liu.se (CORDEX )
11-Jan-18 7

Hydrological modeling of Krishna basin
11-Jan-18 8

Calibration and Validation of Krishna basin using SWAT- CUP
SUFI-2 is used calibration and validation of the Model.
From the available stream flow data model was calibrated for a period of 23 years
(1984-2004) and validated for a period of 9 years (2006 – 2013) for the gauge
stations of Wadenapalli and Matralayam.
At the gauge station of Malkhed the calibration and validation periods were from
1990 – 2007, 1995-2007 and 2008 – 2013 respectively
Source: Central Water Commission (CWC), Hyderabad
Table 1: Objective functions and their corresponding values
Gauge station Calibration Validation
R2 NSE R2 NSE
Mantralayam 0.65 0.57 0.7 0.6
Malkhed 0.68 0.65 0.64 0.56
Wadenapalli 0.62 0.57 0.7 0.47
11-Jan-18 9

Table 2: Initial and final values of optimized parameters
Parameter Unit State LULC
CRDY CRIR CRGR SHRB SAVA WATB FOEB FOEN FODB CRWO
CN2 Initial 84 83.5 83.2 79.3 79.3 92 70 74. 79 82
Final 76.5 76 75.5 73.5 73.6 92 63.5 67 72 74
GWREVAP Initial 0.02 0.02 0.02 0.02 0.02 0.02 0.02 0.02 0.02 0.02
Final .179 0.179 0.179 0.179 0.179 0.179 0.179 0.179 0.179 0.179
SOLAWC
mm Initial 125.5 126.52 125.5 124.4 121.8 128.6 120 117.81 117 117
Final 118 119 118.3 117.3 114.5 121 113 111 110 110
ESCO Initial 0.95 0.95 0.95 0.95 0.95 0.95 0.95 0.95 0.95 0.95
Final .0.31 .0.31 .0.31 .0.31 ..0.31 .0.31 .0.31 . 0.31 .0.31 .0.31
GWQMN mm initial 1000 1000 1000 1000 1000 1000 1000 1000 1000 1000
Final 994 994 994 994 994 994 994 994 994 994
Note: CN2: SCS Curve Number II; GW_REVAP: Ground water “revap” coefficient;
SOL_AWC: Available water capacity of the soil layer; ESCO: Soil Evaporation
Compensation Factor; GWQMN: Threshold depth of water in the shallow aquifer required
for return flow to occur.
11-Jan-18 10

Mantralayam sub-basin Calibration (1983-2004) and validation (2006-2013)
0
500
1000
1500
2000
Av
era
ge
Mo
nth
ly
Str
ea
mfl
ow
(m
3 /s)
Time (Months)
Observed Simulated
0
500
1000
1500
2000
Av
era
ge
Mo
nth
ly S
tre
am
flo
w
(m3 /
s)
Time (Months)
observed simulated
11-Jan-18 11

Wadenapalli sub-basin Calibration (1990-2007) and validation (2008-2013)
0
1000
2000
3000
4000
5000
6000
7000
8000
9000
10000
Av
era
ge
Mo
nth
ly
Str
ea
mfl
ow
(m
3 /s)
Time (Months)
Observed Simulated
0
1000
2000
3000
4000
5000
6000
7000
8000
Av
era
ge
Mo
nth
ly
stre
am
flo
w (
m3 /
s)
Time (Months)
Observed Simulated
11-Jan-18 12

0
50
100
150
200
250
300
350
400
450
500
Ave
rage
Mo
nth
ly S
tre
amfl
ow
(m3/s
)
Time (Months)
Observed Simulated
0
50
100
150
200
250
300
350
Ave
rage
Mo
nth
ly S
tre
amfl
ow
(m
3/s
)
Time (Months)
Observed Simulated
Malkhed sub-basin Calibration (1990-2007) and validation (2008-2013)
11-Jan-18 13

Monthly variation of rainfall (IMD vs HIST)
100
120
140
160
180
Mo
nth
ly r
ain
fall
(mm
)
Time (Months)
IMD GFDL_LS CNRM_CM5_LS CSIRO_LS ICHEC_LS
IPSL_LS MIROC_LS #REF! NorESM_LS
11-Jan-18 14
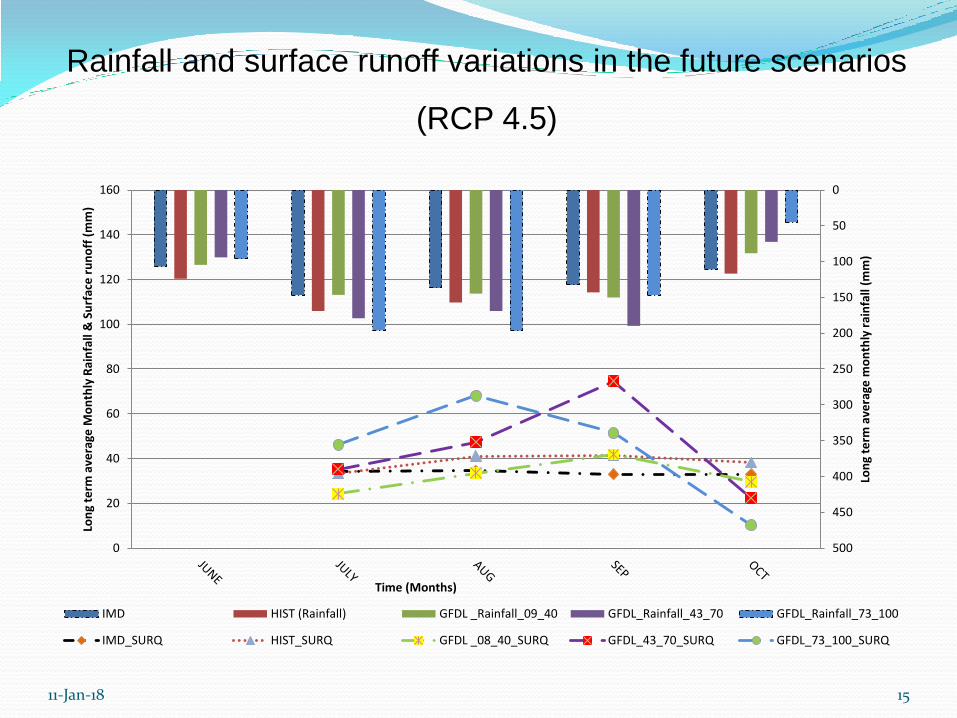
Rainfall and surface runoff variations in the future scenarios
(RCP 4.5)
0
50
100
150
200
250
300
350
400
450
5000
20
40
60
80
100
120
140
160
Lon
g te
rm a
vera
ge m
on
thly
rai
nfa
ll (m
m)
Lon
g te
rm a
vera
ge M
on
thly
Rai
nfa
ll &
Su
rfac
e r
un
off
(m
m)
Time (Months)
IMD HIST (Rainfall) GFDL _Rainfall_09_40 GFDL_Rainfall_43_70 GFDL_Rainfall_73_100
IMD_SURQ HIST_SURQ GFDL _08_40_SURQ GFDL_43_70_SURQ GFDL_73_100_SURQ
11-Jan-18 15

Number extreme events under future scenarios
Event IMD HIST 09_40 43_70 73_100
Normal
Years
11 11 17 18 8
Dry Years 5 4 6 2 6
Wet Years 4 5 2 4 7
Moderate
Drought
2 2 8 4 7
Severe
Drought
0 0 0 0 0
11-Jan-18 16

Extreme events under future scenarios (GFDL_ESM2M)
-60
-55
-50
-45
-40
-35
-30
-25
-20
-15
-10
-5
0
5
10
15
20
25
30
35
40
45
50
55
60
% c
ha
ng
e i
n r
ain
fall
w.r
.t h
isto
ric
Time (Years)
GFDL Dry Year Wet Year Moderate Drought Severe Drought
11-Jan-18 17

Conclusions and Further Work
In this study water balance components such as surface runoff, water yield and
evapotranspiration were simulated under future climate scenarios using GFDL-ESM2M
with RCP 4.5 scenario.
GFDL-ESM2M with RCP 4.5 showed the rainfall decrease by 10.5% in the early century
(2006-2040) whereas mid-century and end century it decrease by 0.8% and 4.2%.
The amount of rainfall in October continuously decreasing in all the future scenarios.
In the end century, there may be a continuous drought between 2078 to 2085 under
RCP4.5
Frequencies of extreme weather events are more under the future climate scenarios
Further the results may be improved by including human interventions such as study
effect of reservoirs on the basin and also incorporating land use changes.
11-Jan-18 18

References
Abbaspour KC, Rouholahnejad E, Vaghefi S, Srinivasan R, Yang H, Kløve B (2015) A continental-
scale hydrology and water quality model for Europe: Calibration and uncertainty of a high-
resolution large-scale SWAT model. Journal of Hydrology 524:733-52
Arnell NW, Reynard NS (1996) The effects of climate change due to global warming on river flows
in Great Britain. Journal of hydrology183 (3):397-424
Arnold JG, Srinivasan R, Muttiah RS, Williams JR (1998) Large area hydrologic modeling and
assessment part I: Model development1 73-89
Barnett TP, Adam JC, Lettenmaier DP (2005) Potential impacts of a warming climate on water
availability in snow-dominated regions. Nature 438(7066):303-9
Ghoraba SM (2015) Hydrological modeling of the Simly Dam watershed (Pakistan) using GIS and
SWAT model. Alexandria Engineering Journal 54(3):583-94
Gosain AK, Rao S, Basuray D (2006) Climate change impact assessment on hydrology of Indian
river basins. Current science 90(3):346-53
Guo S, Wang J, Xiong L, Ying A, Li D (2002) A macro-scale and semi-distributed monthly water
balance model to predict climate change impacts in China. Journal of Hydrology 268(1):1-5
Huntington TG (2006) Evidence for intensification of the global water cycle: review and synthesis.
Journal of Hydrology 319(1):83-95
Kulkarni BD, Deshpande NR, Patwardhan SK, Bansod SD ( 2014) Assessing Hydrological
Response to Changing Climate in the Krishna Basin of India. Journal of Earth Science & Climatic
Change 2014
11-Jan-18 19

THANK YOU
11-Jan-18 20