Embed Size (px)
Citation preview
EyeLink Data Viewer User’s Manual
Document Version 2.1.1
Please report all functionality comments and bugs to:
Copyright ©2002-2014, SR Research Ltd.
EyeLink is a registered trademark of SR Research Ltd., Mississauga, Canada
EyeLink Data Viewer 2002-2014 SR Research Ltd. ii
Table of Contents 1 Introduction ................................................................................................................... 1
1.1 Data Visualization .................................................................................................. 1 1.2 Event Selection ...................................................................................................... 2 1.3 Interest Area Definition ......................................................................................... 2 1.4 Event Filtering ....................................................................................................... 2 1.5 Interest Periods and Reaction Time Definition ...................................................... 3 1.6 Data Output and Analysis ...................................................................................... 3 1.7 Experiment Integration .......................................................................................... 4
2 Installation ..................................................................................................................... 5 2.1 System Requirements ............................................................................................. 5 2.2 Setup ...................................................................................................................... 5
2.2.1 For Standard Installation (applicable to most users) ....................................... 5 2.2.2 For Installation using Network Licensing ....................................................... 6
3 Working with Files ....................................................................................................... 8 3.1 Creating a Data Viewing Session (DVS) ............................................................... 8 3.2 Saving a Viewing Session ...................................................................................... 8 3.3 Opening an Existing Viewing Session ................................................................... 8 3.4 Saving an Existing Viewing Session to a Different File ........................................ 9 3.5 Importing EyeLink Data Files ............................................................................... 9
4 Data Viewer Windows ................................................................................................ 11 4.1 Inspector Window ................................................................................................ 11
4.1.1 Data Tab ........................................................................................................ 11 4.1.1.1 Data Tree Hierarchy ............................................................................... 13 4.1.1.2 Trial Grouping ....................................................................................... 13 4.1.1.3 Trial Summary ....................................................................................... 14 4.1.1.4 Interest Area Templates ......................................................................... 16 4.1.1.5 Custom Interest Area Set/Empty Interest Area Set ................................ 16
4.1.2 Preferences Tab ............................................................................................. 16 4.2 Trial View Window ............................................................................................. 16
4.2.1 Selecting Data Elements to Display .............................................................. 17 4.2.2 Cloning a Trial View .................................................................................... 17 4.2.3 Tiling/Cascading Windows ........................................................................... 17
4.3 Spatial Overlay Trial View .................................................................................. 18 4.4 Temporal Graph Trial View ................................................................................. 20
4.4.1 Viewing Sample and Target Data ................................................................. 20 4.4.2 Zooming Operations ..................................................................................... 22
4.5 Animation View ................................................................................................... 22 5 Working with Events, Samples, and Interest Areas .................................................... 25
5.1 Common Operations ............................................................................................ 25 5.1.1 Selecting Events ............................................................................................ 26 5.1.2 Deleting Events ............................................................................................. 26
5.2 Fixations ............................................................................................................... 26 5.2.1 Selecting Fixations ........................................................................................ 29 5.2.2 Merging Fixations ......................................................................................... 29 5.2.3 Drift Correcting Fixations ............................................................................. 29
EyeLink Data Viewer 2002-2014 SR Research Ltd. iii
5.2.3.1 Drift-correcting a Group of Selected Fixations ..................................... 29 5.2.3.2 Precise Drift Correction of a Single Fixation ........................................ 30 5.2.3.3 Cleaning Fixations ................................................................................. 31
5.3 Saccades ............................................................................................................... 32 5.3.1 Merging Saccades ......................................................................................... 33
5.4 Blink Events ......................................................................................................... 33 5.5 Messages .............................................................................................................. 34
5.5.1 Import Message List ..................................................................................... 36 5.6 Button Events ....................................................................................................... 37 5.7 Samples ................................................................................................................ 39 5.8 Interest Areas ....................................................................................................... 39
5.8.1 Format of static and dynamic interest areas .................................................. 40 5.8.2 Interest Area Properties ................................................................................. 43 5.8.3 Manually Creating Interest Areas ................................................................. 45 5.8.4 Creating Interest Area: Image Segmentation ................................................ 48 5.8.5 Saving Interest Areas .................................................................................... 48 5.8.6 Importing Interest Area File (for a specific trial) .......................................... 48 5.8.7 Emptying an Interest Area Set ...................................................................... 49 5.8.8 Loading Interest Area Templates .................................................................. 49 5.8.9 Using Interest Area Templates ...................................................................... 50 5.8.10 Deleting Interest Area Templates ............................................................... 51 5.8.11 Selecting Interest Areas .............................................................................. 51 5.8.12 Copying and Pasting Interest Areas ............................................................ 51 5.8.13 Cleaning Up Dynamic Interest Areas ......................................................... 52 5.8.14 Mouse Record Mode ................................................................................... 52 5.8.15 Moving an Interest Area ............................................................................. 53 5.8.16 Resizing Rectangular and Elliptical Interest Areas .................................... 54 5.8.17 Resizing Freehand Interest Areas ............................................................... 54 5.8.18 Adding a Point to a Freehand Interest Area ................................................ 54 5.8.19 Deleting an Existing Point from a Freehand Interest Area ......................... 55 5.8.20 Deleting Interest Areas ............................................................................... 55 5.8.21 Splitting Interest Areas ............................................................................... 55 5.8.22 Merging Interest Areas / Instances of a Dynamic Interest Area ................. 56 5.8.23 Conversion between a Static Interest Area and a Dynamic Interest Area .. 56 5.8.24 Examples of Creating Dynamic Interest Areas in a Viewing Session ........ 56 5.8.25 Output Reports and Preferences .................................................................. 58
6 Data Analysis and Output ........................................................................................... 60 6.1 Managing Trial Variables .................................................................................... 60
6.1.1 Trial Variable Manager ................................................................................. 61 6.1.2 Trial Variable Value Editor .......................................................................... 61 6.1.3 Trial Grouping .............................................................................................. 62
6.2 Fixation Map ........................................................................................................ 63 6.3 Managing Reaction Time Definitions .................................................................. 68
6.3.1 Reaction Time Manager ................................................................................ 69 6.3.2 Viewing Reaction Time Information ............................................................ 72
6.4 Interest Periods ..................................................................................................... 73
EyeLink Data Viewer 2002-2014 SR Research Ltd. iv
6.4.1 Creating Interest Periods ............................................................................... 73 6.4.2 Using Interest Period ..................................................................................... 75
6.5 Trial Report .......................................................................................................... 76 6.5.1 Obtaining a Trial Report ............................................................................... 76 6.5.2 Variables in the Trial Report ......................................................................... 78 6.5.3 Using Trial Report ........................................................................................ 81 6.5.4 Configuring the Trial Report ........................................................................ 82
6.6 Fixation Report .................................................................................................... 83 6.6.1 Obtaining a Fixation Report .......................................................................... 83 6.6.2 Variables in the Fixation Report ................................................................... 85 6.6.3 Configuring the Fixation Report ................................................................... 91
6.7 Saccade Report ..................................................................................................... 92 6.7.1 Obtaining a Saccade Report .......................................................................... 92 6.7.2 Variables in the Saccade Report ................................................................... 92
6.8 Interest Area Report ............................................................................................. 93 6.8.1 Obtaining an Interest Area Report ................................................................ 93 6.8.2 Variables in the Interest Area Report ............................................................ 95 6.8.3 Using Interest Area Report ......................................................................... 101
6.8.3.1 Fixation Sequence Analysis ................................................................. 102 6.8.3.2 Regression Analysis ............................................................................. 103
6.9 Sample Output Report ........................................................................................ 105 6.9.1 Loading Samples into a Viewing Session ................................................... 105 6.9.2 Obtaining a Sample Output Report ............................................................. 105 6.9.3 Variables in the Sample Output Report ...................................................... 107
6.10 Message Output Report .................................................................................... 111 6.10.1 Obtaining a Message Output Report ......................................................... 112 6.10.2 Variables in the Message Output Report .................................................. 113
6.11 Recording Event Sequence Data ...................................................................... 116 6.11.1 Obtaining a Recording Event Sequence Data ........................................... 116 6.11.2 Formats of the Recording Event Sequence Data ...................................... 116
6.11.2.1 Fixation Events .................................................................................. 117 6.11.2.2 Saccade Events ................................................................................... 118 6.11.2.3 Blink Events ....................................................................................... 118 6.11.2.4 Message Events .................................................................................. 118 6.11.2.5 Button Events ..................................................................................... 118
7 Protocol for EyeLink Data to Viewer Integration ..................................................... 119 7.1 Defining the Start and End of a Trial ................................................................. 119
7.1.1 Trial Start Message ..................................................................................... 119 7.1.2 Trial End Message ...................................................................................... 120
7.2 Pre-Trial Message Commands ........................................................................... 120 7.2.1 Trial Variable Labels .................................................................................. 120 7.2.2 Display Coordinates .................................................................................... 121 7.2.3 Trial Grouping ............................................................................................ 121
7.3 Trial Message Commands .................................................................................. 122 7.3.1 Trial Variable Values .................................................................................. 122 7.3.2 Single Trial Variable Message Token ......................................................... 122
EyeLink Data Viewer 2002-2014 SR Research Ltd. v
7.3.3 Image Commands ....................................................................................... 123 7.3.3.1 Image Loading – Fill Full Screen ........................................................ 123 7.3.3.2 Image Loading – Top Left ................................................................... 124 7.3.3.3 Image Loading – Centered ................................................................... 124
7.3.4 Simple Drawing .......................................................................................... 125 7.3.4.1 Clear Overlay View ............................................................................. 125 7.3.4.2 Line drawing ........................................................................................ 126 7.3.4.3 Drawing a Rectangle ............................................................................ 126 7.3.4.4 Drawing a Filled Rectangle ................................................................. 127 7.3.4.5 Drawing a Fixation Point ..................................................................... 127 7.3.4.6 Draw List File ...................................................................................... 128
7.3.5 Interest Area Commands ............................................................................. 129 7.3.5.1 Rectangular Interest Area .................................................................... 129 7.3.5.2 Elliptical Interest Area ......................................................................... 129 7.3.5.3 Freehand Interest Area ......................................................................... 130 7.3.5.4 Interest Area Set ................................................................................... 130
7.3.6 Target Position Commands ......................................................................... 131 7.4 Reaction Time Definitions ................................................................................. 132
7.4.1 Button Events .............................................................................................. 132 7.4.2 Fixation Events: ...................................................................................... 133 7.4.3 Saccade Events: ...................................................................................... 134 7.4.4 Message Events: ...................................................................................... 135 7.4.5 Reaction Time Definition Set ................................................................. 135
7.5 Changes in the Sample Experiments .................................................................. 136 7.5.1 “Simple” Template ...................................................................................... 136 7.5.2 “Text” Template .......................................................................................... 136 7.5.3 “Picture” Template ...................................................................................... 137 7.5.4 “EyeData” Template ................................................................................... 137 7.5.5 “GCWindow” Template .............................................................................. 138 7.5.6 “Control” Template ..................................................................................... 138 7.5.7 “Dynamic” Template .................................................................................. 139 7.5.8 “Comm_simple” Template ......................................................................... 139 7.5.9 Other Templates .......................................................................................... 139
8 Preference Settings .................................................................................................... 140 8.1 General Preferences ........................................................................................... 141 8.2 Data Loading Preferences .................................................................................. 142 8.3 Output / Analysis ............................................................................................... 144 8.4 Fixation Map ...................................................................................................... 147 8.5 Data Filter Preferences ....................................................................................... 149 8.6 General Trial View Preferences ......................................................................... 152 8.7 Spatial Overlay View Preferences ..................................................................... 154 8.8 Image Segmentation Preferences ....................................................................... 156 8.9 Temporal Graph Preferences ............................................................................. 157 8.10 Animation Preferences ..................................................................................... 159
9 Release History ......................................................................................................... 160
EyeLink Data Viewer 2002-2014 SR Research Ltd. vi
List of Figures Figure 4-1. Viewer Display after Loading the Sample Picture.edf File .......................... 11 Figure 4-2. Components of the Inspector Window (Left: Data Tab; Right: Preference
Tab) ........................................................................................................................... 13 Figure 4-3. Tiling Trial View Windows. ......................................................................... 18 Figure 4-4. Sample Spatial Overlay Trial View .............................................................. 19 Figure 4-5. Sample Temporal Graph Trial View ............................................................. 20 Figure 4-6. Sample Playback Animation View. ............................................................... 23 Figure 5-1.Sample Spatial Overlay View of Fixation Events ........................................... 27 Figure 5-2. Diagram for Angle Calculation ...................................................................... 28 Figure 5-3. Drift Correcting Fixations on One Line of Text. ........................................... 30 Figure 5-4. Options for Fixation Cleaning. ...................................................................... 31 Figure 5-5. Sample Spatial Overlay View of Saccade Events ......................................... 32 Figure 5-6. Sample Temporal Graph View of Blink Events ........................................... 34 Figure 5-7. Sample Temporal Graph View of Message Events (Note that the default size
of the message symbol in the temporal-graph preference settings has been changed).................................................................................................................................... 36
Figure 5-8. Sample Temporal Graph View Showing the Button Events (Note that the default size of the button symbol in the temporal-graph preference settings has been changed). ................................................................................................................... 38
Figure 5-9. Sample Spatial Overlay View (left) and Temporal Graph View (right) of Raw Sample Data ...................................................................................................... 39
Figure 5-10. Sample Text Display Overlaid with Interest Areas ..................................... 40 Figure 5-11. Sample Interest Area Instances in One Interest Period ............................... 42 Figure 5-12. Sample Interest Area Instances in Another Interest Period ........................ 43 Figure 5-13. Creating a Freehand Interest Area ............................................................... 46 Figure 5-14. Sample Interest Area Instances in Another Interest Period ........................ 47 Figure 5-15. Interest Area Templates Listed in the Tree View ....................................... 50 Figure 5-16. Mouse Record Mode .................................................................................... 53 Figure 6-1. Trial Variable Manager ................................................................................. 61 Figure 6-2. Trial Variable Value Editor Dialog ............................................................... 62 Figure 6-3. Applying Trial Grouping by a Trial Condition Variable and Setting Interest
Area Template for a Group of Trials. ....................................................................... 63 Figure 6-4. Example fixation map .................................................................................... 64 Figure 6-5. Creating a Fixation Map ................................................................................ 65 Figure 6-6. Types of Fixation Map .................................................................................. 67 Figure 6-7. Adjusting the Scale of the Fixation Map ........................................................ 68 Figure 6-8. Reaction Time Definition Manager .............................................................. 69 Figure 6-9. Reaction Time Definition Editor (General Tab) ........................................... 70 Figure 6-10. Reaction Time Definition Editor (Reaction Time Tab) .............................. 70 Figure 6-11. Deleting Reaction Time Definitions ........................................................... 72 Figure 6-12. Reaction Time Graphics in Both the Spatial Overlay View and the
Temporal Graph View of the Trial View Window ................................................... 72 Figure 6-13. Interest Period Editor (General Tab) ............................................................ 74 Figure 6-14. Interest Period Editor (Details Tab). ........................................................... 74 Figure 6-15. Creating a Trial Report. ................................................................................ 76
EyeLink Data Viewer 2002-2014 SR Research Ltd. vii
Figure 6-16. Variables used in the Trial Report. ............................................................. 77 Figure 6-17. Saving the Output Report. ............................................................................ 78 Figure 6-18. Using Interest Period for Event Filtering .................................................... 82 Figure 6-19. Creating a Fixation Report. .......................................................................... 83 Figure 6-20. Variables in a Fixation Report. .................................................................... 84 Figure 6-21. Creating a Saccade Report. ......................................................................... 92 Figure 6-22. Variables in a Saccade Report. .................................................................... 93 Figure 6-23. Creating an Interest Area Report. ................................................................ 94 Figure 6-24. Variables in an Interest Area Report. .......................................................... 94 Figure 6-25. Progress Dialog Box Displayed when Creating the Interest Area Report 102 Figure 6-26. Creating a Sample Report. ........................................................................ 106 Figure 6-27. Variables in a Sample Report. ................................................................... 106 Figure 6-28. Creating a Message Report. ...................................................................... 112 Figure 6-29. Variales in a Message Report. ................................................................... 113 Figure 8-1. Saving properties as defaults. ....................................................................... 140
EyeLink Data Viewer 2002-2014 SR Research Ltd. 1
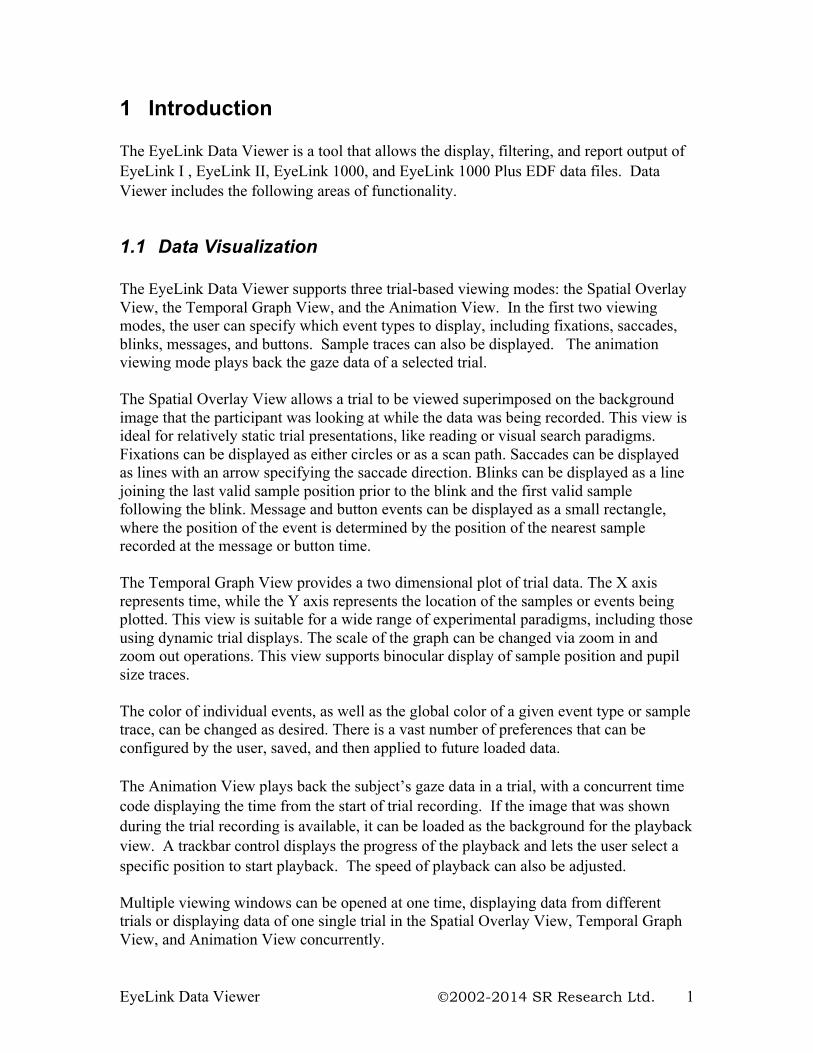
1 Introduction The EyeLink Data Viewer is a tool that allows the display, filtering, and report output of EyeLink I , EyeLink II, EyeLink 1000, and EyeLink 1000 Plus EDF data files. Data Viewer includes the following areas of functionality.
1.1 Data Visualization The EyeLink Data Viewer supports three trial-based viewing modes: the Spatial Overlay View, the Temporal Graph View, and the Animation View. In the first two viewing modes, the user can specify which event types to display, including fixations, saccades, blinks, messages, and buttons. Sample traces can also be displayed. The animation viewing mode plays back the gaze data of a selected trial. The Spatial Overlay View allows a trial to be viewed superimposed on the background image that the participant was looking at while the data was being recorded. This view is ideal for relatively static trial presentations, like reading or visual search paradigms. Fixations can be displayed as either circles or as a scan path. Saccades can be displayed as lines with an arrow specifying the saccade direction. Blinks can be displayed as a line joining the last valid sample position prior to the blink and the first valid sample following the blink. Message and button events can be displayed as a small rectangle, where the position of the event is determined by the position of the nearest sample recorded at the message or button time. The Temporal Graph View provides a two dimensional plot of trial data. The X axis represents time, while the Y axis represents the location of the samples or events being plotted. This view is suitable for a wide range of experimental paradigms, including those using dynamic trial displays. The scale of the graph can be changed via zoom in and zoom out operations. This view supports binocular display of sample position and pupil size traces. The color of individual events, as well as the global color of a given event type or sample trace, can be changed as desired. There is a vast number of preferences that can be configured by the user, saved, and then applied to future loaded data. The Animation View plays back the subject’s gaze data in a trial, with a concurrent time code displaying the time from the start of trial recording. If the image that was shown during the trial recording is available, it can be loaded as the background for the playback view. A trackbar control displays the progress of the playback and lets the user select a specific position to start playback. The speed of playback can also be adjusted. Multiple viewing windows can be opened at one time, displaying data from different trials or displaying data of one single trial in the Spatial Overlay View, Temporal Graph View, and Animation View concurrently.
EyeLink Data Viewer 2002-2014 SR Research Ltd. 2
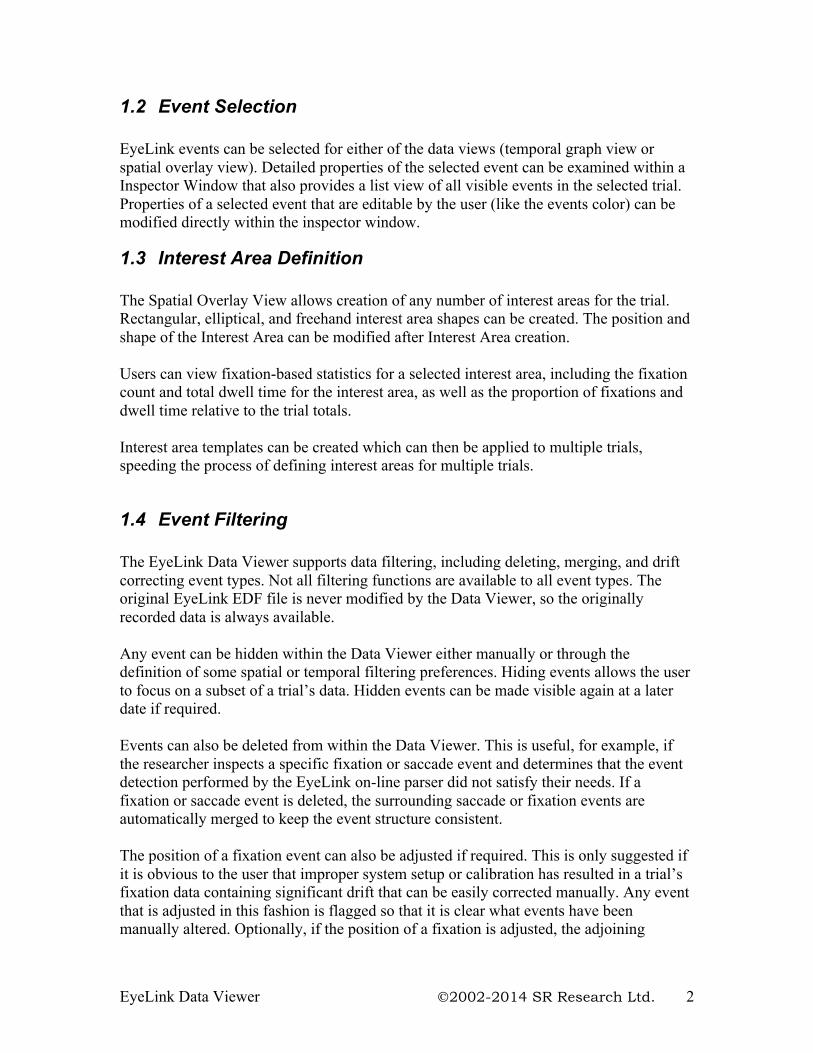
1.2 Event Selection EyeLink events can be selected for either of the data views (temporal graph view or spatial overlay view). Detailed properties of the selected event can be examined within a Inspector Window that also provides a list view of all visible events in the selected trial. Properties of a selected event that are editable by the user (like the events color) can be modified directly within the inspector window.
1.3 Interest Area Definition The Spatial Overlay View allows creation of any number of interest areas for the trial. Rectangular, elliptical, and freehand interest area shapes can be created. The position and shape of the Interest Area can be modified after Interest Area creation. Users can view fixation-based statistics for a selected interest area, including the fixation count and total dwell time for the interest area, as well as the proportion of fixations and dwell time relative to the trial totals. Interest area templates can be created which can then be applied to multiple trials, speeding the process of defining interest areas for multiple trials.
1.4 Event Filtering The EyeLink Data Viewer supports data filtering, including deleting, merging, and drift correcting event types. Not all filtering functions are available to all event types. The original EyeLink EDF file is never modified by the Data Viewer, so the originally recorded data is always available. Any event can be hidden within the Data Viewer either manually or through the definition of some spatial or temporal filtering preferences. Hiding events allows the user to focus on a subset of a trial’s data. Hidden events can be made visible again at a later date if required. Events can also be deleted from within the Data Viewer. This is useful, for example, if the researcher inspects a specific fixation or saccade event and determines that the event detection performed by the EyeLink on-line parser did not satisfy their needs. If a fixation or saccade event is deleted, the surrounding saccade or fixation events are automatically merged to keep the event structure consistent. The position of a fixation event can also be adjusted if required. This is only suggested if it is obvious to the user that improper system setup or calibration has resulted in a trial’s fixation data containing significant drift that can be easily corrected manually. Any event that is adjusted in this fashion is flagged so that it is clear what events have been manually altered. Optionally, if the position of a fixation is adjusted, the adjoining
EyeLink Data Viewer 2002-2014 SR Research Ltd. 3
saccade end point and start point are also adjusted so that the saccade positions are kept consistent with fixation positions.
1.5 Interest Periods and Reaction Time Definition For each trial, the user may selectively view and perform analysis on data within a specific period of time within a trial (Interest Period). The EyeLink Data Viewer allows the user to create interest periods based on messages and button events. The created interest periods are added to the interest period list. The user can navigate between different interest periods by selecting the desired interest period from the list. For each interest period, only those events falling within that period are shown in the spatial overlay, temporal graph views, and in the event list of the inspector window. In addition, only those events and data within the selected interest period (custom-defined interest period, or the default – “Full Trial Period”) are exported to the output file. One important variant of the interest period is the reaction-time period. Reaction Time Definitions (RTD) can be created and applied to all trials loaded into an EyeLink Data Viewer session. Each RTD can have a set of trial condition variables that must be matched for the RTD to be applied to a given trial. The message event to use as the start time for the reaction time can be defined. Each RTD can have a fixation, saccade, button, or message event as the ending event for the reaction time calculation. Depending on the event type selected for the reaction time end event, a set of event properties can be specified to determine which event should be used within each trial. A number of RTDs can be created for a given Data Viewer session, allowing multiple reaction time conditions to be specified. Each trial will only be matched to at most one RTD.
1.6 Data Output and Analysis Both Spatial Overlay and Temporal Graph trial views can be saved as JPEG images for illustrative purposes. A series of output reports can be run for a Data Viewer session. The Fixation Output Report generates one row for each visible fixation within the Data Viewer. A set of output variables can be selected, with each variable output as a column in the report. Fixation report variables include start and end time, duration, average position, interest area identifier, etc. A set of relative variables is also available, including the previous and next fixations position, angle, distance, and direction. The Saccade Output Report generates one row for each visible saccade within the Data Viewer. A set of output variables can be selected, with each variable output as a column in the report. Saccade output report variables include start and end time, start and end position, amplitude, angle, direction, average and peak velocity, etc. A set of relative variables is also available, including the previous and next saccades start and end position, etc.
EyeLink Data Viewer 2002-2014 SR Research Ltd. 4
The Interest Area Output Report generates one row for each interest area in every trial loaded in the Data Viewer. Variables include the interest area identifier, label, fixation index list, number fixations, summed dwell time, and proportions of fixations and dwell time in the interest area relative to the trial. The Trial Output Report generates one row of data for each trial within the Data Viewer. Variables include the count of each event type visible within the trial, the average fixation duration and saccadic amplitude, as well as the reaction time calculated for the trial based on the reaction time definitions created for the Data Viewer session. The Sample Output Report provides a columnar output of eye movement data for each eye sample in a trial. Variables include the index of the sample in a trial, time of the sample, position (x, y), velocity, acceleration, and pupil data of the current sample. If appropriate target position messages are read from the EDF file, the position, velocity, and acceleration data of the targets (up to two targets) can also be provided. The user can also save the spatial overlay and temporal graph views into image files, save the playback of the trial into a movie file, or create a "landscape" view (i.e., fixation map) for a trial or for a group of trials with the same background image.
1.7 Experiment Integration The EyeLink Data Viewer allows commands to be inserted directly into the EyeLink EDF file when an experiment is running. This allows the experiment to be significantly integrated into the Data Viewer. These commands are interpreted by the Data Viewer when the data file is loaded and automates several areas of the viewer functionality. By using a set of predefined viewer commands, the programmer of an experiment can inform the Data Viewer regarding:
a) The image(s) to load for each trial’s Spatial Overlay View. b) The Interest Areas to load for each trial. c) The Reaction Time Definitions to apply to the Data Viewing session. d) The trial condition variables and values to use for each trial. e) The position of the target in a dynamic display.
If you use SR Research Experiment Builder software, please make sure you use the Experiment Builder Project Checklist to check up the experiment project before data collection. This checklist is contained in the Experiment Builder User Manual (or from this link https://www.sr-support.com/forums/showthread.php?t=1012).
EyeLink Data Viewer 2002-2014 SR Research Ltd. 5
2 Installation
2.1 System Requirements Operating System: Windows XP, Vista, Windows 7, or Windows 8 Processor: Pentium 4 1.4 GHz or higher (avoid computers with atom CPU) RAM: Minimum 1GB MB RAM (2GB or higher recommended) Disk Space: 240 MB free disk space for application plus space required for EyeLink data files and saved viewing sessions. Graphics Card: video card with Opengl 2.0 support and with at least 128 MB RAM Monitor Resolution: 1024x768 or better resolution Other: Free USB port required
2.2 Setup The latest version of EyeLink Data Viewer installer can be downloaded from https://www.sr-support.com/forums/showthread.php?t=10. If you have a previous version of EyeLink Data Viewer installed on the computer, please uninstall it with the DV installer or with Windows© Control Panel tool "Add or Remove Programs" before installing the new version. By default, the EyeLink Data Viewer software will be installed at "{Windows Drive}:\Program Files\SR Research\DataViewer". Important: A USB Dongle provided by SR Research is required to run this application and must remain connected to the PC while the application is running. If a USB Dongle is not detected by the program, the application will run in a DEMO mode supporting limited data loading.
2.2.1 For Standard Installation (applicable to most users) The following installation instruction is applicable to users who use a standalone USB dongle that supports a single-PC license.
1. Install the EyeLink Data Viewer software. Double click on the EyeLinkDV1.*.exe installer, keeping the default settings.
EyeLink Data Viewer 2002-2014 SR Research Ltd. 6
2. Install standalone HASP key driver (if this is the first time that the USB dongle have been used on the display PC). You may install the driver by clicking "Start -> All Programs -> SR Research -> Install HASP Driver" from your computer desktop or double clicking on "hdd32.exe" in "C:\Program Files\SR Research\Common" folder.
3. Plug the dongle to the display computer. Click on the License Manager utility (Start -> All Programs -> SR Research -> License Manager) to check for the licensing status for the Data Viewer software.
4. From the computer desktop, click "Start -> All Programs -> SR Research -> EyeLink -> Data Viewer -> DataViewer" to run the application.
2.2.2 For Installation using Network Licensing The following is applicable to the users who have purchased a network license (i.e., a shared license for several computers on a network that running EyeLink Data Viewer at the same time) for the Data Viewer software.
1. Install the Data Viewer software. Double click on the EyeLinkDV1.*.exe installer, keeping the default settings on InstallShield Wizard screens except for the following two: • On the "Setup Type" dialog box, select "Custom". • On the "Select Feature" screen, make sure that both "HASP4" and "HASPHL" driver options are selected.
2. Install network HASP key driver. You may install the driver by clicking "Start ->
All Programs -> SR Research -> HASP HL Driver" from your computer desktop or double clicking on "HaspUserSetup.exe" in "C:\Program Files\SR Research\Common" folder.
3. Install network HASP License Manager. You may install the tool by clicking "Start -> All Programs -> SR Research -> Networked HASP License Manager" from your computer desktop or double clicking on "lmsetup.exe" in "C:\Program Files\SR Research\Common" folder. Failing to install this will report a "NO HASP Key Found" error in the SR License Manager dialog box. • When installing the license manager, set the "Installation Type" to Service (nhsrvice.exe). • On the "HASP License Manager" dialog box, check either Yes or No to continue.
4. If this is the server computer, you may install optional Aladin Monitor software by clicking "Start -> All Programs -> SR Research-> Aladdin Monitor" from your computer desktop or double clicking on "Aksmon32.exe" in "C:\Program Files\SR Research\Common" folder.
5. Test license status. • Please make sure that the server and client computers are running and visible to each other in the same network group (check this out from "My Network Places -> View Network computers"). Contact your system administrator if the computers cannot see each other in the same network group.
EyeLink Data Viewer 2002-2014 SR Research Ltd. 7
• Please make sure that the network license dongle is plugged to server computer (remove all other HASP dongles) and drivers are already installed. • Now, click "Start -> All Programs -> SR Research -> License Manager" to check for the licensing status for each of the client computers in the network.
EyeLink Data Viewer 2002-2014 SR Research Ltd. 8
3 Working with Files The EyeLink Data Viewer can import EyeLink EDF files. The viewer loads each data file into a Data Viewing Session (DVS). A DVS can consist of many EyeLink data files. Only one DVS can be open within the Data Viewer at a time. Once a DVS has been created and EyeLink data files have been imported into it, the DVS file can be saved and then reloaded at a later date for future analysis. It is much quicker to load a DVS than to load the original EDF files of which the DVS consists. All changes made during an viewing session only affect the DVS data; the original EDF files are never altered. 3.1 Creating a Data Viewing Session (DVS) From the menu, choose: File → New Tip: A new viewing session can also be created by clicking the Create New Viewing Session tool on the standard toolbar, or press Ctrl N on Windows or ⌘ N on Mac OSX. Tip: To find out the meaning of a tool on the standard toolbar, simply place the mouse over the tool. 3.2 Saving a Viewing Session From the menus, choose: File → Save Tip: The viewing session can also be saved by clicking the Save Viewing Session tool
on the standard toolbar, or press Ctrl S on Windows or ⌘ S on Mac OSX. When a new viewing session is saved, Data Viewer will create a {session name}.evs file as well as a {session}.res folder; both of them are required for a proper re-opening of the viewing session later on. 3.3 Opening an Existing Viewing Session To open an existing viewing session
1) From the menus, choose:
EyeLink Data Viewer 2002-2014 SR Research Ltd. 9
File → Open 2) In the Open dialog box, browse to the location of the file and select it. 3) Click Open
Tip: A saved viewing session can also be opened by clicking the Open Existing Viewer Session tool on the standard toolbar, or press Ctrl O on Windows or ⌘ O on Mac OSX. The viewing session can also be opened by double clicking on the {session name}.evs file. Please make sure that the {session}.res folder is available; otherwise the viewing session cannot be properly opened. 3.4 Saving an Existing Viewing Session to a Different File To save a viewing session to a file
1) From the menus, choose: File → Save AS
2) In the Save As dialog box, browse to the directory in which you want to save the document.
3) In the File name text box, type in the name for the document. 4) Click Save.
Tip: The viewing session can also be saved by clicking the Save Viewing Session As tool on the standard toolbar. 3.5 Importing EyeLink Data Files EyeLink EDF files can be imported into an already opened Viewing session or, if no Viewing session is open, a new one will be created for you when the data files are imported. To import an .EDF file,
1) From the menus, choose: File → Import Data → EyeLink Data File
2) In the Load dialog box, browse to the location of the EDF file that you want to import and select it.
3) Click Load.
Tip: EyeLink data can also be imported by clicking the Import EyeLink Data File button on the standard toolbar, Multiple EDF files can be imported through “File → Import Data → Multiple EyeLink Data Files”, or Press Ctrl I on Windows or ⌘ I on Mac OSX. In the “Import EyeLink Data File” dialog box, browse to the intended “Location”. A list of EDF files in the
EyeLink Data Viewer 2002-2014 SR Research Ltd. 10
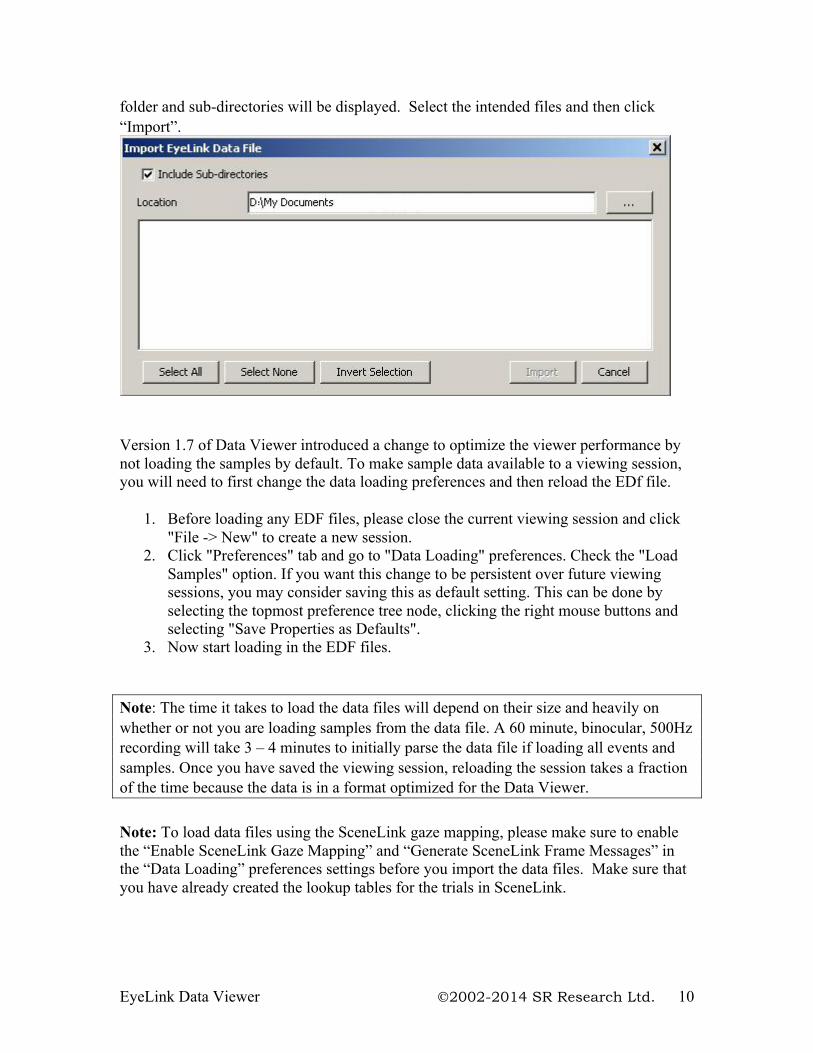
folder and sub-directories will be displayed. Select the intended files and then click “Import”.
Version 1.7 of Data Viewer introduced a change to optimize the viewer performance by not loading the samples by default. To make sample data available to a viewing session, you will need to first change the data loading preferences and then reload the EDf file.
1. Before loading any EDF files, please close the current viewing session and click "File -> New" to create a new session.
2. Click "Preferences" tab and go to "Data Loading" preferences. Check the "Load Samples" option. If you want this change to be persistent over future viewing sessions, you may consider saving this as default setting. This can be done by selecting the topmost preference tree node, clicking the right mouse buttons and selecting "Save Properties as Defaults".
3. Now start loading in the EDF files.
Note: The time it takes to load the data files will depend on their size and heavily on whether or not you are loading samples from the data file. A 60 minute, binocular, 500Hz recording will take 3 – 4 minutes to initially parse the data file if loading all events and samples. Once you have saved the viewing session, reloading the session takes a fraction of the time because the data is in a format optimized for the Data Viewer. Note: To load data files using the SceneLink gaze mapping, please make sure to enable the “Enable SceneLink Gaze Mapping” and “Generate SceneLink Frame Messages” in the “Data Loading” preferences settings before you import the data files. Make sure that you have already created the lookup tables for the trials in SceneLink.
EyeLink Data Viewer 2002-2014 SR Research Ltd. 11
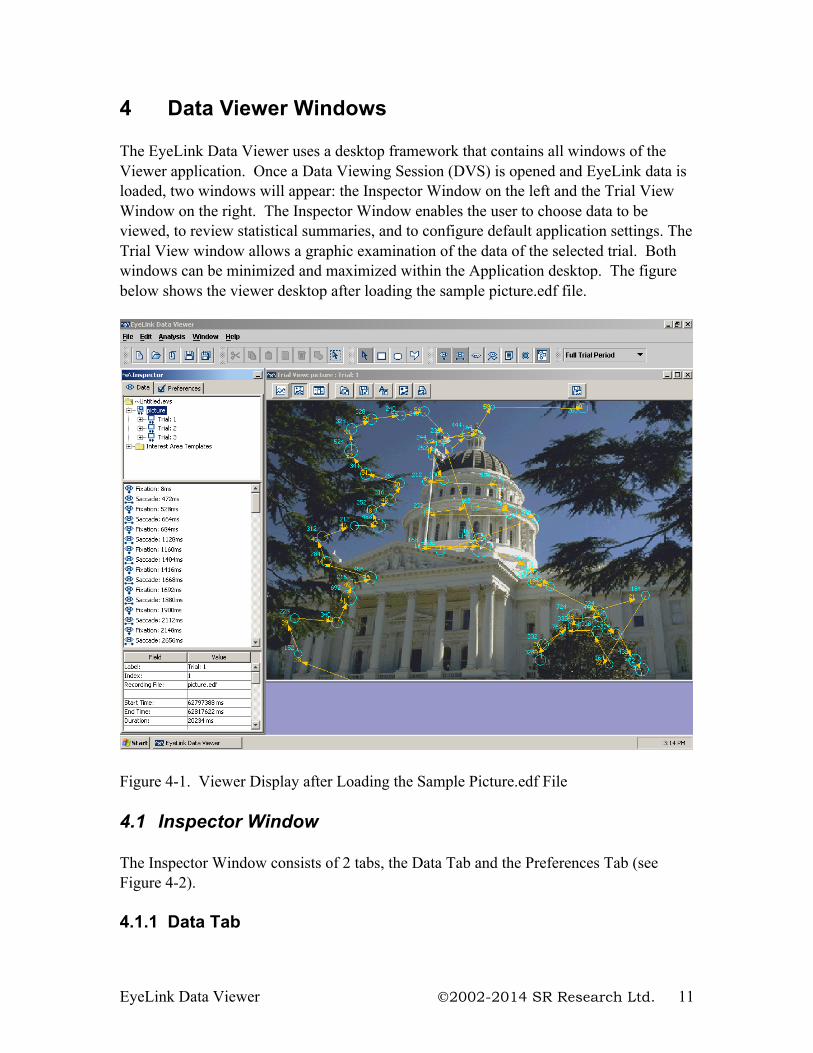
4 Data Viewer Windows The EyeLink Data Viewer uses a desktop framework that contains all windows of the Viewer application. Once a Data Viewing Session (DVS) is opened and EyeLink data is loaded, two windows will appear: the Inspector Window on the left and the Trial View Window on the right. The Inspector Window enables the user to choose data to be viewed, to review statistical summaries, and to configure default application settings. The Trial View window allows a graphic examination of the data of the selected trial. Both windows can be minimized and maximized within the Application desktop. The figure below shows the viewer desktop after loading the sample picture.edf file.
Figure 4-1. Viewer Display after Loading the Sample Picture.edf File 4.1 Inspector Window The Inspector Window consists of 2 tabs, the Data Tab and the Preferences Tab (see Figure 4-2). 4.1.1 Data Tab
EyeLink Data Viewer 2002-2014 SR Research Ltd. 12
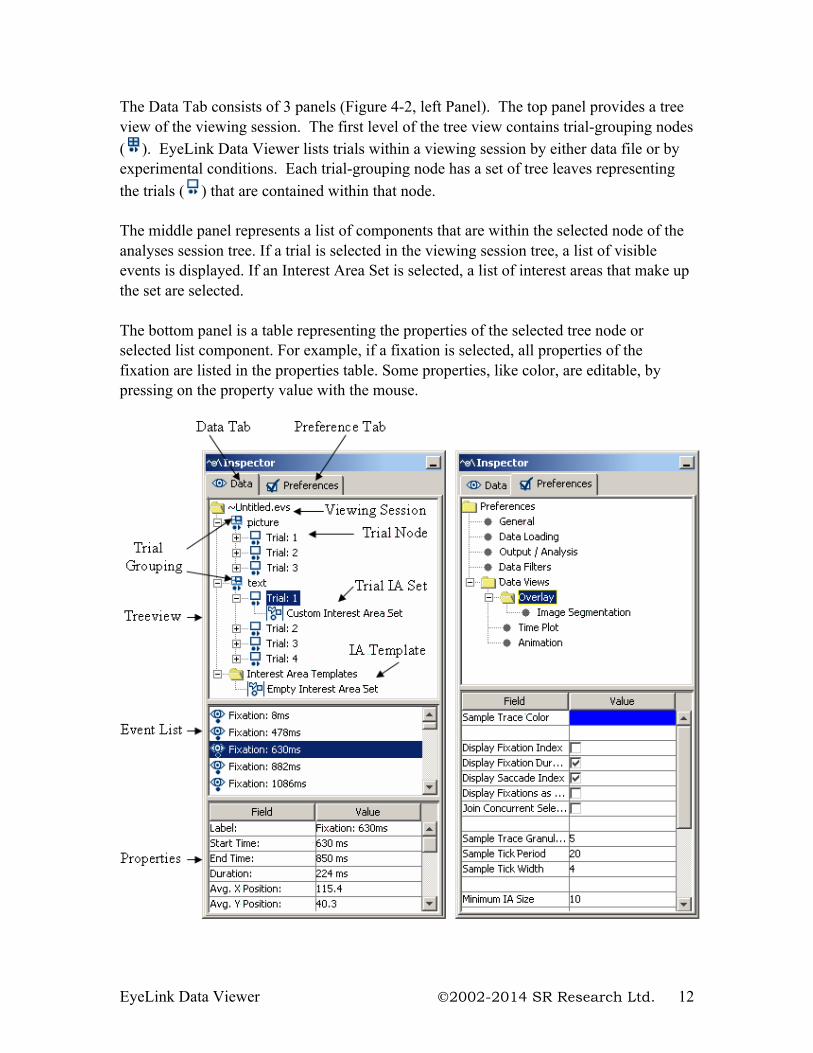
The Data Tab consists of 3 panels (Figure 4-2, left Panel). The top panel provides a tree view of the viewing session. The first level of the tree view contains trial-grouping nodes ( ). EyeLink Data Viewer lists trials within a viewing session by either data file or by experimental conditions. Each trial-grouping node has a set of tree leaves representing the trials ( ) that are contained within that node. The middle panel represents a list of components that are within the selected node of the analyses session tree. If a trial is selected in the viewing session tree, a list of visible events is displayed. If an Interest Area Set is selected, a list of interest areas that make up the set are selected. The bottom panel is a table representing the properties of the selected tree node or selected list component. For example, if a fixation is selected, all properties of the fixation are listed in the properties table. Some properties, like color, are editable, by pressing on the property value with the mouse.
EyeLink Data Viewer 2002-2014 SR Research Ltd. 13
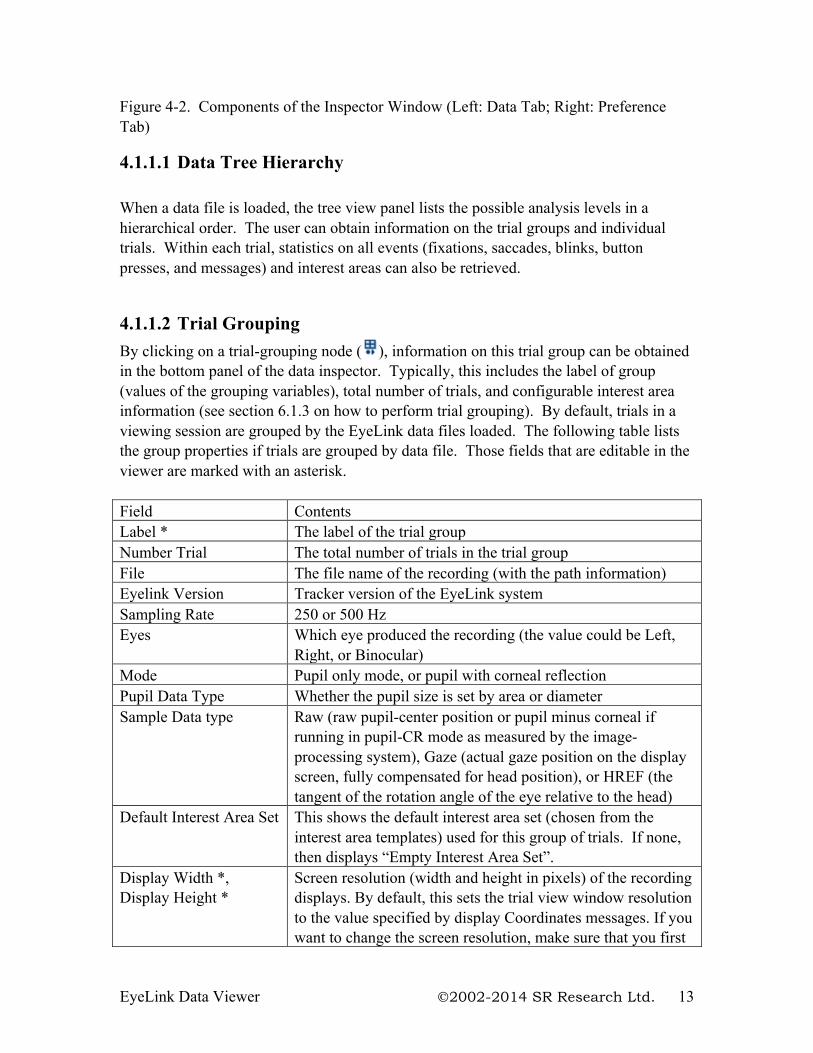
Figure 4-2. Components of the Inspector Window (Left: Data Tab; Right: Preference Tab)
4.1.1.1 Data Tree Hierarchy When a data file is loaded, the tree view panel lists the possible analysis levels in a hierarchical order. The user can obtain information on the trial groups and individual trials. Within each trial, statistics on all events (fixations, saccades, blinks, button presses, and messages) and interest areas can also be retrieved.
4.1.1.2 Trial Grouping By clicking on a trial-grouping node ( ), information on this trial group can be obtained in the bottom panel of the data inspector. Typically, this includes the label of group (values of the grouping variables), total number of trials, and configurable interest area information (see section 6.1.3 on how to perform trial grouping). By default, trials in a viewing session are grouped by the EyeLink data files loaded. The following table lists the group properties if trials are grouped by data file. Those fields that are editable in the viewer are marked with an asterisk. Field Contents Label * The label of the trial group Number Trial The total number of trials in the trial group File The file name of the recording (with the path information) Eyelink Version Tracker version of the EyeLink system Sampling Rate 250 or 500 Hz Eyes Which eye produced the recording (the value could be Left,
Right, or Binocular) Mode Pupil only mode, or pupil with corneal reflection Pupil Data Type Whether the pupil size is set by area or diameter Sample Data type Raw (raw pupil-center position or pupil minus corneal if
running in pupil-CR mode as measured by the image-processing system), Gaze (actual gaze position on the display screen, fully compensated for head position), or HREF (the tangent of the rotation angle of the eye relative to the head)
Default Interest Area Set This shows the default interest area set (chosen from the interest area templates) used for this group of trials. If none, then displays “Empty Interest Area Set”.
Display Width *, Display Height *
Screen resolution (width and height in pixels) of the recording displays. By default, this sets the trial view window resolution to the value specified by display Coordinates messages. If you want to change the screen resolution, make sure that you first
EyeLink Data Viewer 2002-2014 SR Research Ltd. 14
close the Trial View Window first, change the Display Width and Display Height values, and then open another trial view window.
Report Hidden If checked, the entire data file will be excluded from the output reports.
4.1.1.2.1 Deleting a group of trials To remove a group of trials from the analysis, select the grouping node, click the right mouse button and click on the “delete” menu item. If trials contained within a grouping node are deleted from the data viewer session, they will be permanently removed from the tree view (the EDF file has to be reloaded before information on that file can be accessed again).
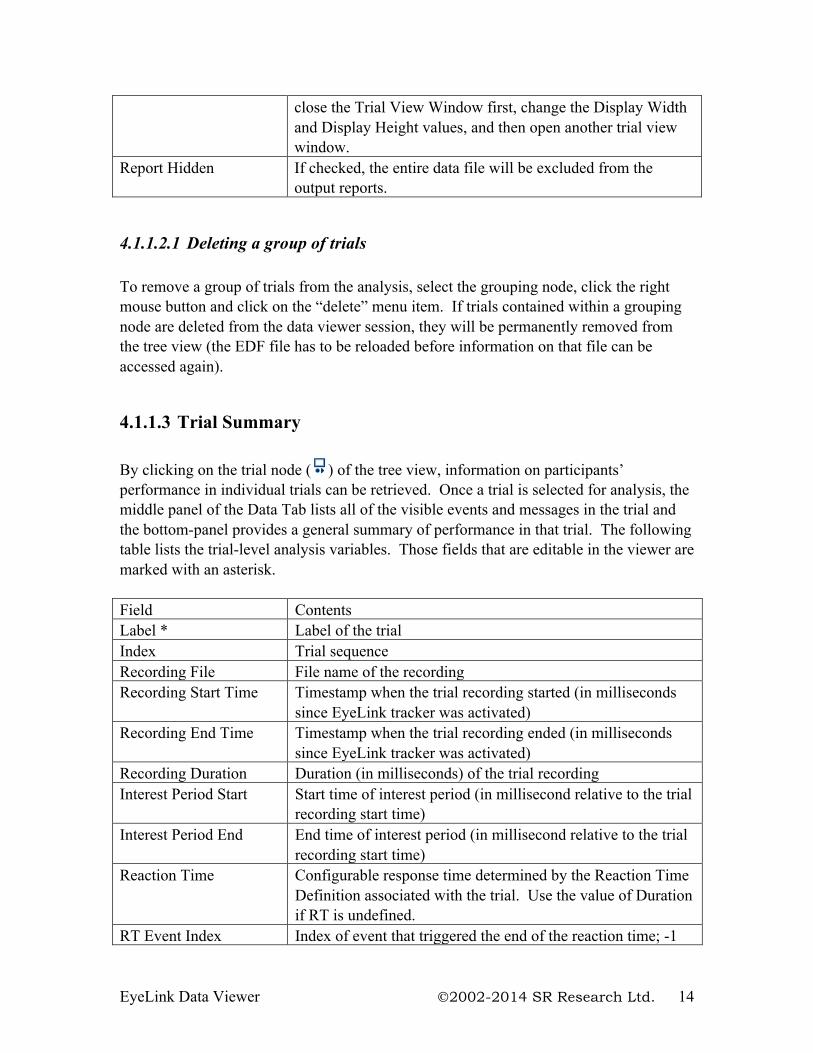
4.1.1.3 Trial Summary By clicking on the trial node ( ) of the tree view, information on participants’ performance in individual trials can be retrieved. Once a trial is selected for analysis, the middle panel of the Data Tab lists all of the visible events and messages in the trial and the bottom-panel provides a general summary of performance in that trial. The following table lists the trial-level analysis variables. Those fields that are editable in the viewer are marked with an asterisk. Field Contents Label * Label of the trial Index Trial sequence Recording File File name of the recording Recording Start Time Timestamp when the trial recording started (in milliseconds
since EyeLink tracker was activated) Recording End Time Timestamp when the trial recording ended (in milliseconds
since EyeLink tracker was activated) Recording Duration Duration (in milliseconds) of the trial recording Interest Period Start Start time of interest period (in millisecond relative to the trial
recording start time) Interest Period End End time of interest period (in millisecond relative to the trial
recording start time) Reaction Time Configurable response time determined by the Reaction Time
Definition associated with the trial. Use the value of Duration if RT is undefined.
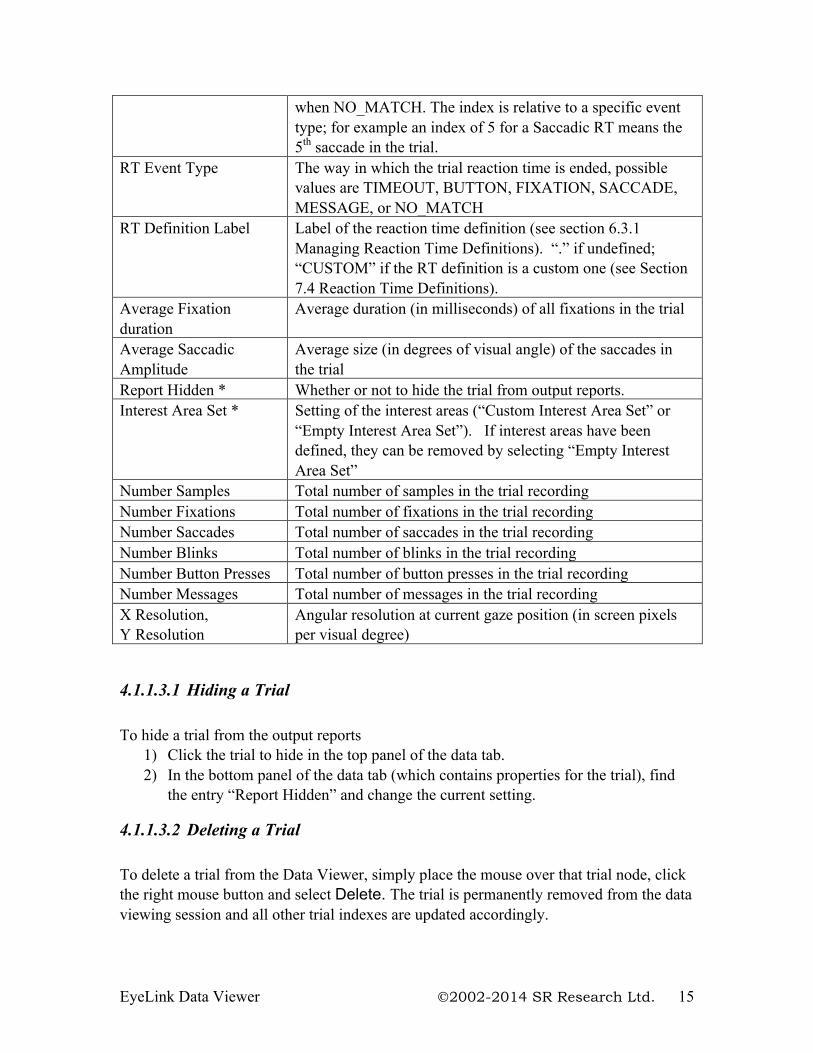
RT Event Index Index of event that triggered the end of the reaction time; -1
EyeLink Data Viewer 2002-2014 SR Research Ltd. 15
when NO_MATCH. The index is relative to a specific event type; for example an index of 5 for a Saccadic RT means the 5th saccade in the trial.
RT Event Type The way in which the trial reaction time is ended, possible values are TIMEOUT, BUTTON, FIXATION, SACCADE, MESSAGE, or NO_MATCH
RT Definition Label Label of the reaction time definition (see section 6.3.1 Managing Reaction Time Definitions). “.” if undefined; “CUSTOM” if the RT definition is a custom one (see Section 7.4 Reaction Time Definitions).
Average Fixation duration
Average duration (in milliseconds) of all fixations in the trial
Average Saccadic Amplitude
Average size (in degrees of visual angle) of the saccades in the trial
Report Hidden * Whether or not to hide the trial from output reports. Interest Area Set * Setting of the interest areas (“Custom Interest Area Set” or
“Empty Interest Area Set”). If interest areas have been defined, they can be removed by selecting “Empty Interest Area Set”
Number Samples Total number of samples in the trial recording Number Fixations Total number of fixations in the trial recording Number Saccades Total number of saccades in the trial recording Number Blinks Total number of blinks in the trial recording Number Button Presses Total number of button presses in the trial recording Number Messages Total number of messages in the trial recording X Resolution, Y Resolution
Angular resolution at current gaze position (in screen pixels per visual degree)
4.1.1.3.1 Hiding a Trial To hide a trial from the output reports
1) Click the trial to hide in the top panel of the data tab. 2) In the bottom panel of the data tab (which contains properties for the trial), find
the entry “Report Hidden” and change the current setting.
4.1.1.3.2 Deleting a Trial To delete a trial from the Data Viewer, simply place the mouse over that trial node, click the right mouse button and select Delete. The trial is permanently removed from the data viewing session and all other trial indexes are updated accordingly.
EyeLink Data Viewer 2002-2014 SR Research Ltd. 16
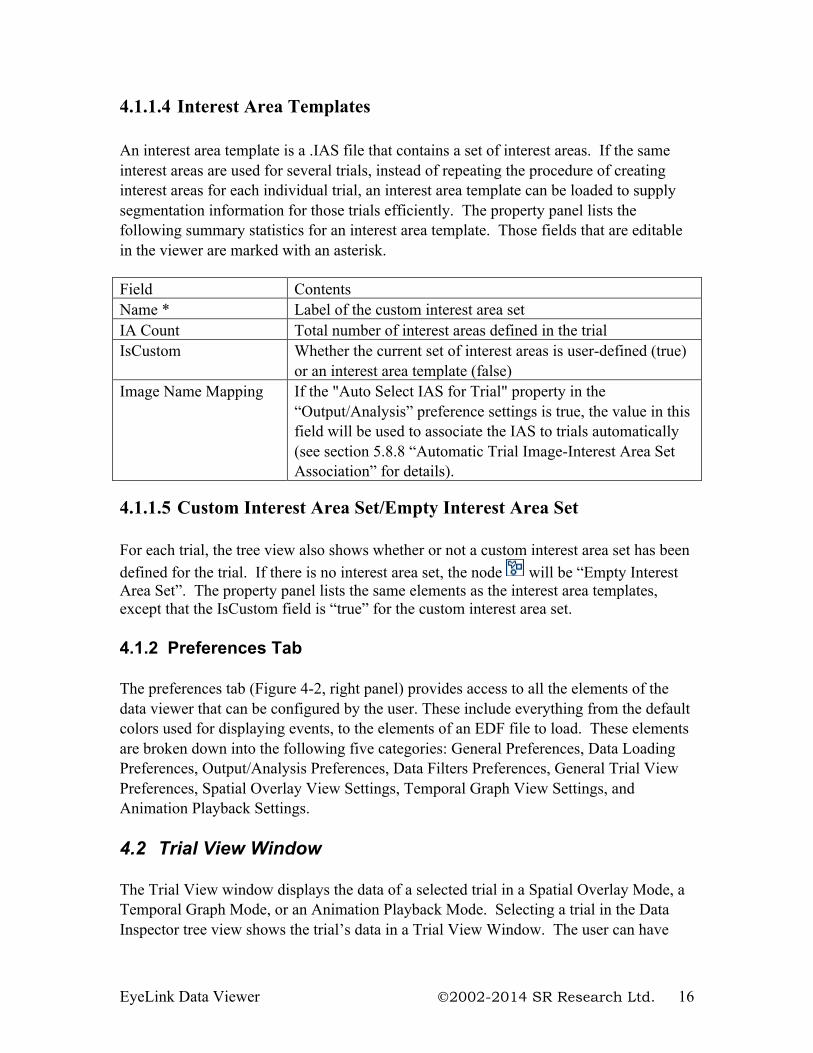
4.1.1.4 Interest Area Templates An interest area template is a .IAS file that contains a set of interest areas. If the same interest areas are used for several trials, instead of repeating the procedure of creating interest areas for each individual trial, an interest area template can be loaded to supply segmentation information for those trials efficiently. The property panel lists the following summary statistics for an interest area template. Those fields that are editable in the viewer are marked with an asterisk. Field Contents Name * Label of the custom interest area set IA Count Total number of interest areas defined in the trial IsCustom Whether the current set of interest areas is user-defined (true)
or an interest area template (false) Image Name Mapping If the "Auto Select IAS for Trial" property in the
“Output/Analysis” preference settings is true, the value in this field will be used to associate the IAS to trials automatically (see section 5.8.8 “Automatic Trial Image-Interest Area Set Association” for details).
4.1.1.5 Custom Interest Area Set/Empty Interest Area Set For each trial, the tree view also shows whether or not a custom interest area set has been defined for the trial. If there is no interest area set, the node will be “Empty Interest Area Set”. The property panel lists the same elements as the interest area templates, except that the IsCustom field is “true” for the custom interest area set. 4.1.2 Preferences Tab The preferences tab (Figure 4-2, right panel) provides access to all the elements of the data viewer that can be configured by the user. These include everything from the default colors used for displaying events, to the elements of an EDF file to load. These elements are broken down into the following five categories: General Preferences, Data Loading Preferences, Output/Analysis Preferences, Data Filters Preferences, General Trial View Preferences, Spatial Overlay View Settings, Temporal Graph View Settings, and Animation Playback Settings. 4.2 Trial View Window The Trial View window displays the data of a selected trial in a Spatial Overlay Mode, a Temporal Graph Mode, or an Animation Playback Mode. Selecting a trial in the Data Inspector tree view shows the trial’s data in a Trial View Window. The user can have
EyeLink Data Viewer 2002-2014 SR Research Ltd. 17
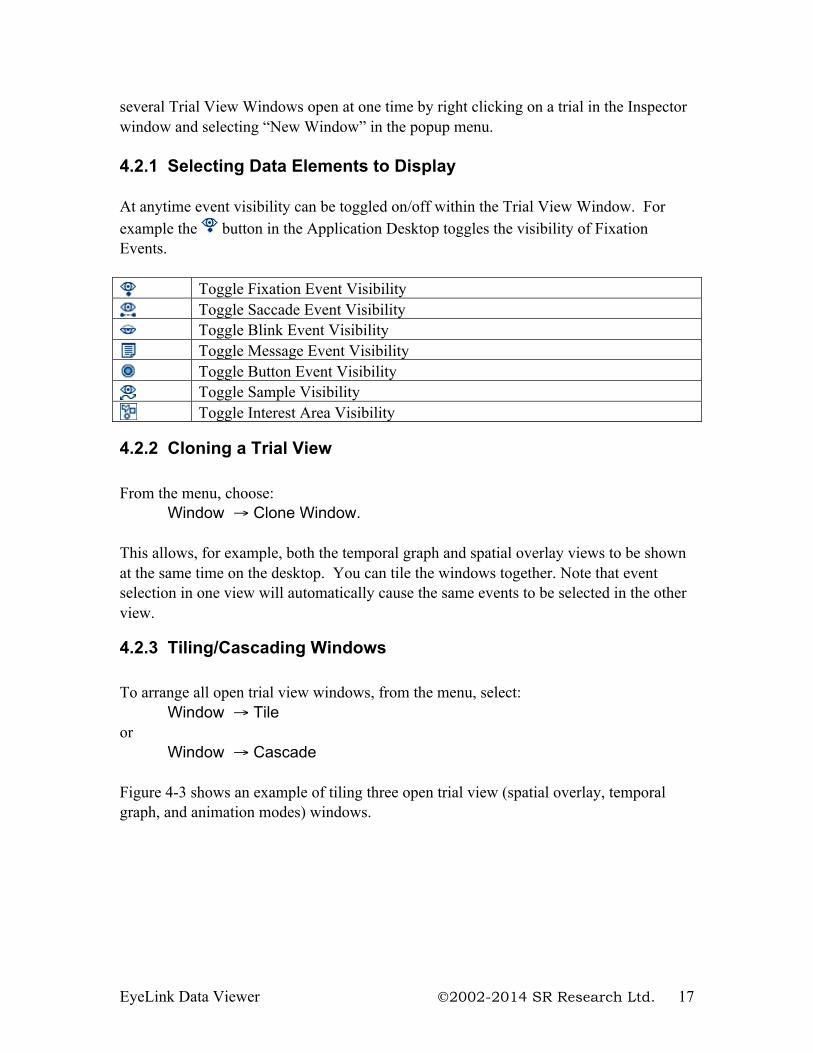
several Trial View Windows open at one time by right clicking on a trial in the Inspector window and selecting “New Window” in the popup menu. 4.2.1 Selecting Data Elements to Display At anytime event visibility can be toggled on/off within the Trial View Window. For example the button in the Application Desktop toggles the visibility of Fixation Events.
Toggle Fixation Event Visibility Toggle Saccade Event Visibility Toggle Blink Event Visibility Toggle Message Event Visibility Toggle Button Event Visibility Toggle Sample Visibility Toggle Interest Area Visibility
4.2.2 Cloning a Trial View From the menu, choose: Window → Clone Window. This allows, for example, both the temporal graph and spatial overlay views to be shown at the same time on the desktop. You can tile the windows together. Note that event selection in one view will automatically cause the same events to be selected in the other view.
4.2.3 Tiling/Cascading Windows To arrange all open trial view windows, from the menu, select:
Window → Tile or
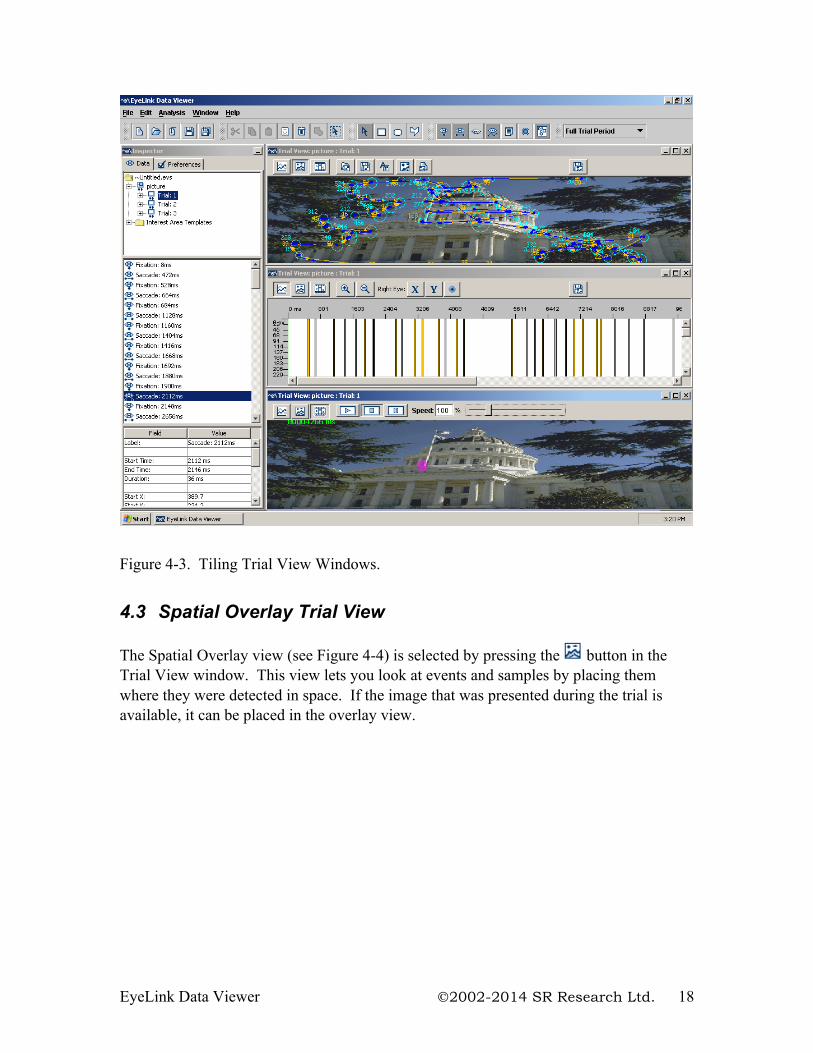
Window → Cascade Figure 4-3 shows an example of tiling three open trial view (spatial overlay, temporal graph, and animation modes) windows.
EyeLink Data Viewer 2002-2014 SR Research Ltd. 18
Figure 4-3. Tiling Trial View Windows.
4.3 Spatial Overlay Trial View The Spatial Overlay view (see Figure 4-4) is selected by pressing the button in the Trial View window. This view lets you look at events and samples by placing them where they were detected in space. If the image that was presented during the trial is available, it can be placed in the overlay view.
EyeLink Data Viewer 2002-2014 SR Research Ltd. 19
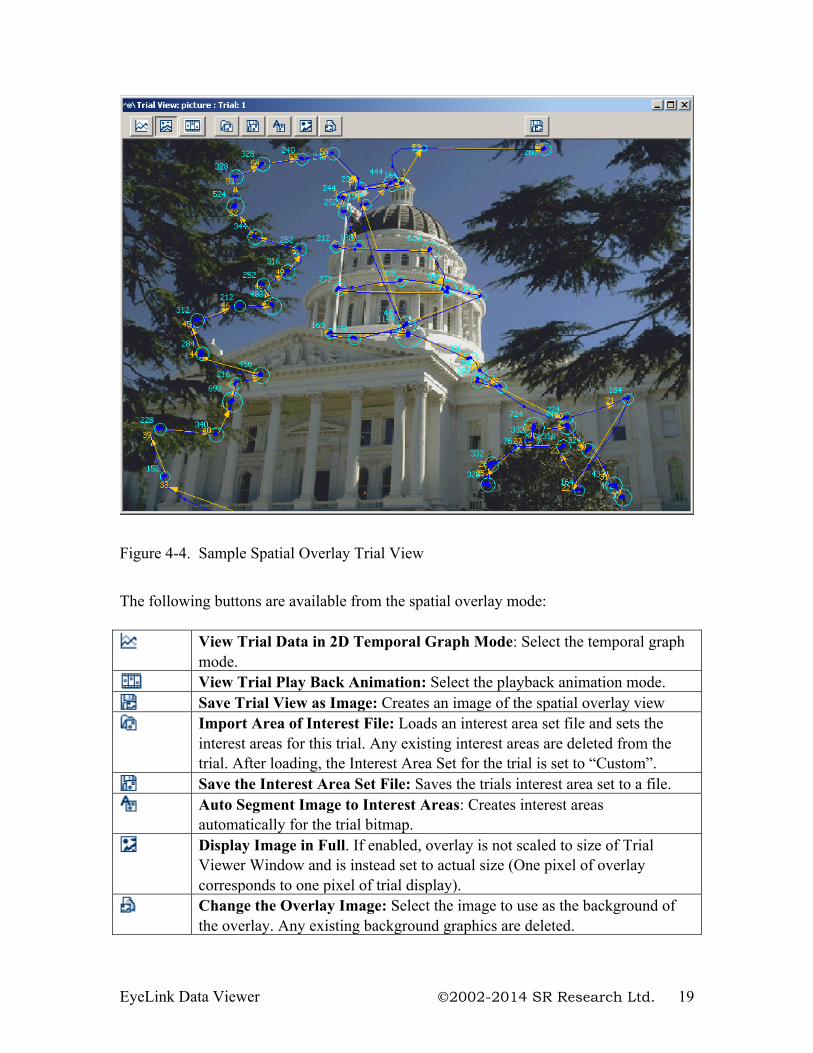
Figure 4-4. Sample Spatial Overlay Trial View
The following buttons are available from the spatial overlay mode:
View Trial Data in 2D Temporal Graph Mode: Select the temporal graph mode.
View Trial Play Back Animation: Select the playback animation mode. Save Trial View as Image: Creates an image of the spatial overlay view Import Area of Interest File: Loads an interest area set file and sets the
interest areas for this trial. Any existing interest areas are deleted from the trial. After loading, the Interest Area Set for the trial is set to “Custom”.
Save the Interest Area Set File: Saves the trials interest area set to a file. Auto Segment Image to Interest Areas: Creates interest areas
automatically for the trial bitmap. Display Image in Full. If enabled, overlay is not scaled to size of Trial
Viewer Window and is instead set to actual size (One pixel of overlay corresponds to one pixel of trial display).
Change the Overlay Image: Select the image to use as the background of the overlay. Any existing background graphics are deleted.
EyeLink Data Viewer 2002-2014 SR Research Ltd. 20
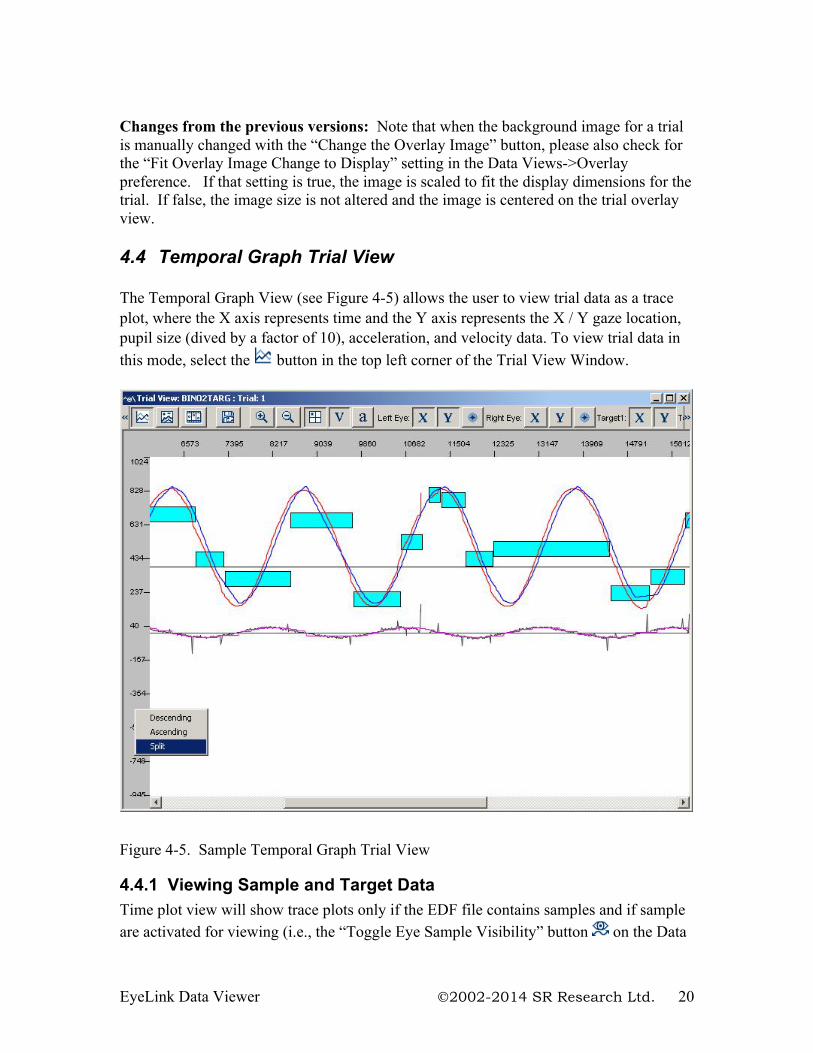
Changes from the previous versions: Note that when the background image for a trial is manually changed with the “Change the Overlay Image” button, please also check for the “Fit Overlay Image Change to Display” setting in the Data Views->Overlay preference. If that setting is true, the image is scaled to fit the display dimensions for the trial. If false, the image size is not altered and the image is centered on the trial overlay view. 4.4 Temporal Graph Trial View The Temporal Graph View (see Figure 4-5) allows the user to view trial data as a trace plot, where the X axis represents time and the Y axis represents the X / Y gaze location, pupil size (dived by a factor of 10), acceleration, and velocity data. To view trial data in this mode, select the button in the top left corner of the Trial View Window.
Figure 4-5. Sample Temporal Graph Trial View
4.4.1 Viewing Sample and Target Data Time plot view will show trace plots only if the EDF file contains samples and if sample are activated for viewing (i.e., the “Toggle Eye Sample Visibility” button on the Data
EyeLink Data Viewer 2002-2014 SR Research Ltd. 21
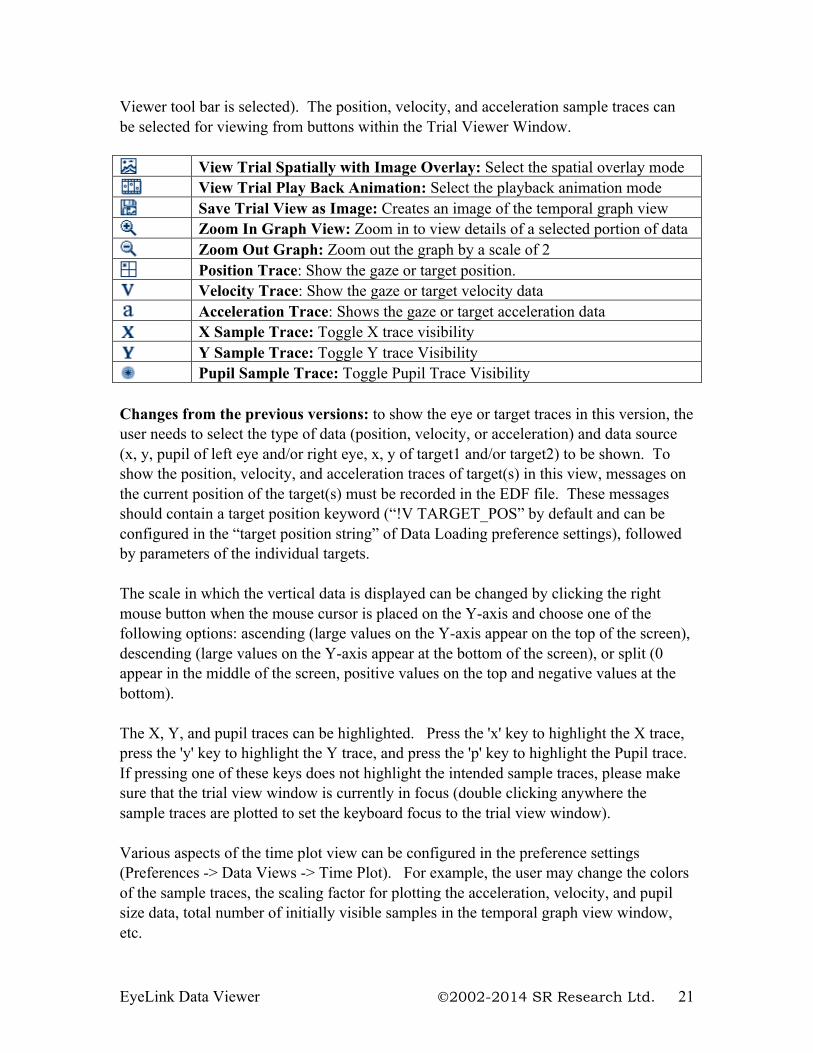
Viewer tool bar is selected). The position, velocity, and acceleration sample traces can be selected for viewing from buttons within the Trial Viewer Window.
View Trial Spatially with Image Overlay: Select the spatial overlay mode View Trial Play Back Animation: Select the playback animation mode
Save Trial View as Image: Creates an image of the temporal graph view Zoom In Graph View: Zoom in to view details of a selected portion of data Zoom Out Graph: Zoom out the graph by a scale of 2 Position Trace: Show the gaze or target position. Velocity Trace: Show the gaze or target velocity data Acceleration Trace: Shows the gaze or target acceleration data X Sample Trace: Toggle X trace visibility Y Sample Trace: Toggle Y trace Visibility Pupil Sample Trace: Toggle Pupil Trace Visibility
Changes from the previous versions: to show the eye or target traces in this version, the user needs to select the type of data (position, velocity, or acceleration) and data source (x, y, pupil of left eye and/or right eye, x, y of target1 and/or target2) to be shown. To show the position, velocity, and acceleration traces of target(s) in this view, messages on the current position of the target(s) must be recorded in the EDF file. These messages should contain a target position keyword (“!V TARGET_POS” by default and can be configured in the “target position string” of Data Loading preference settings), followed by parameters of the individual targets. The scale in which the vertical data is displayed can be changed by clicking the right mouse button when the mouse cursor is placed on the Y-axis and choose one of the following options: ascending (large values on the Y-axis appear on the top of the screen), descending (large values on the Y-axis appear at the bottom of the screen), or split (0 appear in the middle of the screen, positive values on the top and negative values at the bottom). The X, Y, and pupil traces can be highlighted. Press the 'x' key to highlight the X trace, press the 'y' key to highlight the Y trace, and press the 'p' key to highlight the Pupil trace. If pressing one of these keys does not highlight the intended sample traces, please make sure that the trial view window is currently in focus (double clicking anywhere the sample traces are plotted to set the keyboard focus to the trial view window). Various aspects of the time plot view can be configured in the preference settings (Preferences -> Data Views -> Time Plot). For example, the user may change the colors of the sample traces, the scaling factor for plotting the acceleration, velocity, and pupil size data, total number of initially visible samples in the temporal graph view window, etc.
EyeLink Data Viewer 2002-2014 SR Research Ltd. 22
4.4.2 Zooming Operations The temporal graph can be zoomed in and out. To zoom into an area of the temporal graph:
1) Hold the Shift key down or press the button. 2) Position the mouse on the temporal graph at the location of the upper left hand
corner of the area you wish to zoom into. 3) Press the mouse button and drag the mouse to the lower right hand corner of the
area you wish to zoom into. 4) Release the mouse button 5) Release the Shift key.
The graph will be magnified so that the area you selected fills the Trial View Window. To zoom out the graph, press the button. The temporal graph will be zoomed out by a factor of 2.
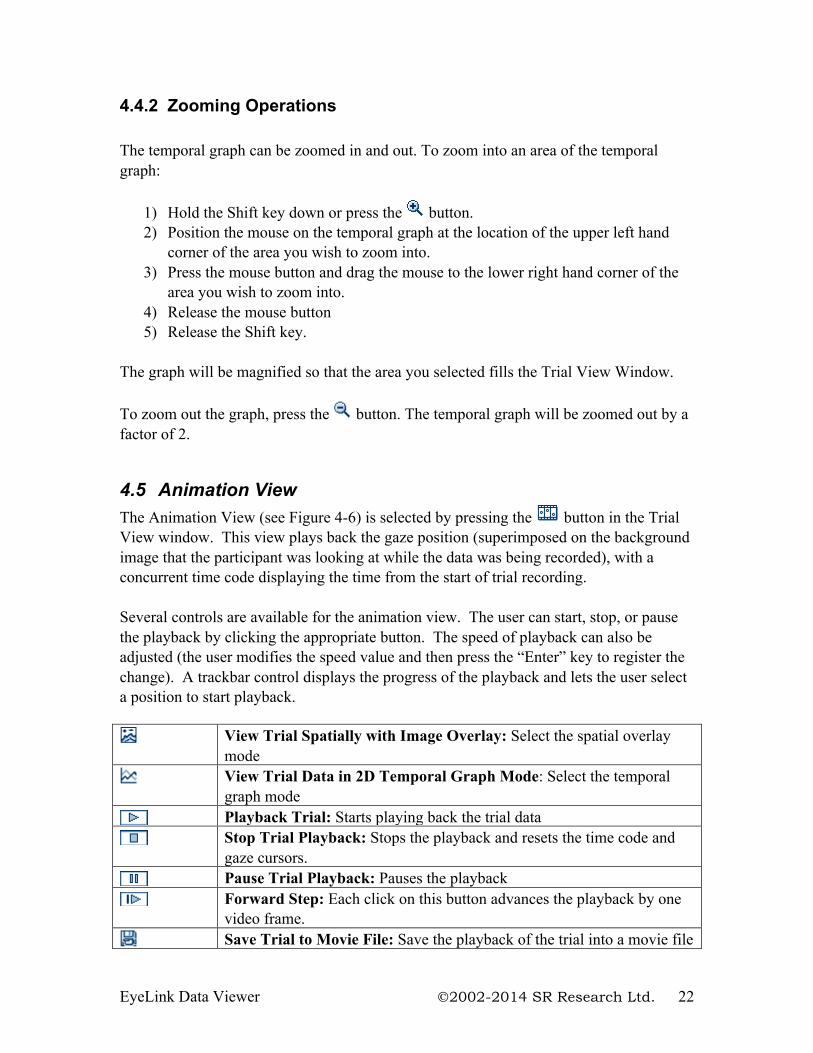
4.5 Animation View The Animation View (see Figure 4-6) is selected by pressing the button in the Trial View window. This view plays back the gaze position (superimposed on the background image that the participant was looking at while the data was being recorded), with a concurrent time code displaying the time from the start of trial recording. Several controls are available for the animation view. The user can start, stop, or pause the playback by clicking the appropriate button. The speed of playback can also be adjusted (the user modifies the speed value and then press the “Enter” key to register the change). A trackbar control displays the progress of the playback and lets the user select a position to start playback.
View Trial Spatially with Image Overlay: Select the spatial overlay mode
View Trial Data in 2D Temporal Graph Mode: Select the temporal graph mode
Playback Trial: Starts playing back the trial data Stop Trial Playback: Stops the playback and resets the time code and
gaze cursors. Pause Trial Playback: Pauses the playback Forward Step: Each click on this button advances the playback by one
video frame. Save Trial to Movie File: Save the playback of the trial into a movie file
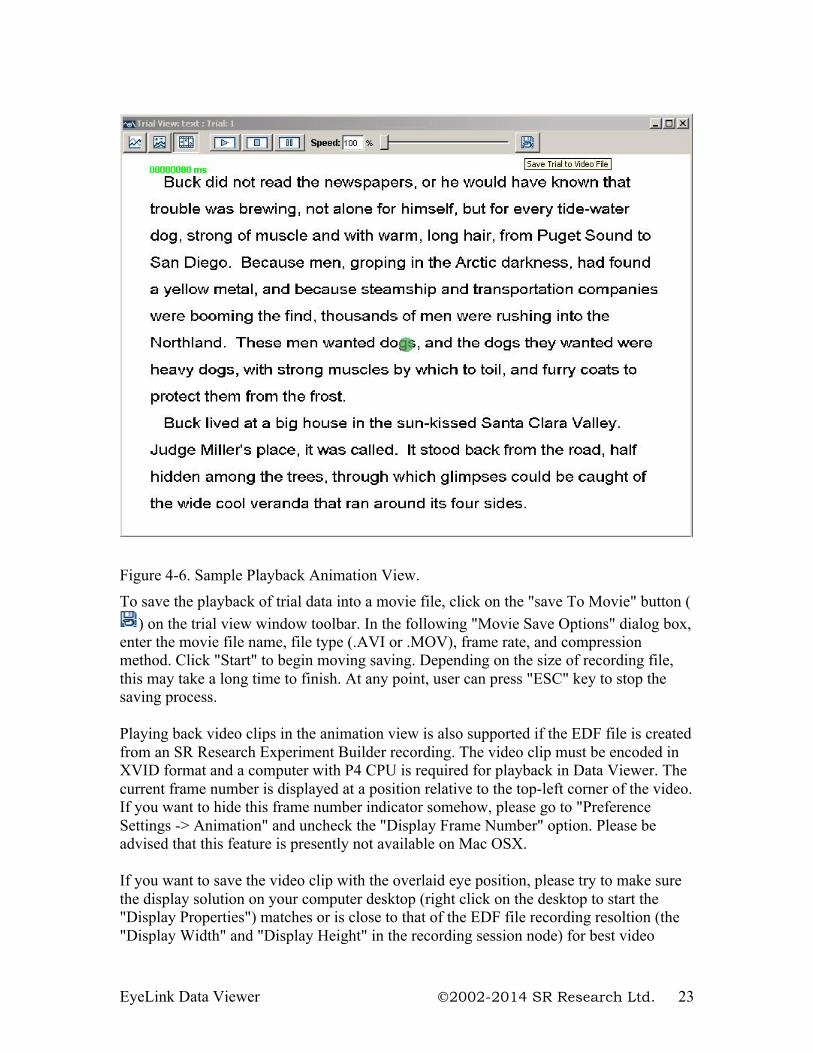
EyeLink Data Viewer 2002-2014 SR Research Ltd. 23
Figure 4-6. Sample Playback Animation View. To save the playback of trial data into a movie file, click on the "save To Movie" button (
) on the trial view window toolbar. In the following "Movie Save Options" dialog box, enter the movie file name, file type (.AVI or .MOV), frame rate, and compression method. Click "Start" to begin moving saving. Depending on the size of recording file, this may take a long time to finish. At any point, user can press "ESC" key to stop the saving process. Playing back video clips in the animation view is also supported if the EDF file is created from an SR Research Experiment Builder recording. The video clip must be encoded in XVID format and a computer with P4 CPU is required for playback in Data Viewer. The current frame number is displayed at a position relative to the top-left corner of the video. If you want to hide this frame number indicator somehow, please go to "Preference Settings -> Animation" and uncheck the "Display Frame Number" option. Please be advised that this feature is presently not available on Mac OSX. If you want to save the video clip with the overlaid eye position, please try to make sure the display solution on your computer desktop (right click on the desktop to start the "Display Properties") matches or is close to that of the EDF file recording resoltion (the "Display Width" and "Display Height" in the recording session node) for best video
EyeLink Data Viewer 2002-2014 SR Research Ltd. 24
saving quality. In the video saving dailog box, set the "size" to this recording resolution. The default NONE compression will save a large output file. You may try some codec that does the compression (e.g., the"CINEPAK CODEC", which does a good compression albeit slow). Please also keep the default Trial View Window size as any change in the aspect ratio of this window may introduce distortion to the saved overlay video. When the video saving is in progress, please do not disrupt it (e.g., by resizing or moving the Data Viewer window or have it occluded) as whatever is visible on the display frame will be saved in the capture as well.
EyeLink Data Viewer 2002-2014 SR Research Ltd. 25
5 Working with Events, Samples, and Interest Areas The EyeLink Data File (EDF file) contains two streams of data: eye-position samples (up to 2000 per second produced from the EyeLink tracker, depending on the system model) and events (eye-movement events such as saccades and fixations, subject responses, and synchronizing events from the experimental application). Both streams are time-synchronized for easy analysis. The file is organized into trials of data, one for each of the start and stop of tracker recording. Each trial may have samples, events, or both. Samples are time-stamped in milliseconds and contain monocular or binocular eye-position data - for now Data Viewer only report the eye position in screen coordinate (GAZE) while other data formats (PUPIL or HREF) are ignored. Pupil sizes as area or diameter are also recordable. Samples may also contain eye-movement resolution (used to compute true velocity or saccadic amplitudes). Eye-movement events record eye position changes identified by the EyeLink tracker's on-line parser, such as fixations, blinks, and saccades. Both the onset and end of these events are marked, allowing samples to be assigned to eye-movement periods without complex algorithms. Important data for analysis such as average position for fixations and peak velocity for saccades is also recorded in the events. Other events record subject responses (such as button presses) and synchronization and data messages from applications. These can be used to record the time of a change in the display, or an experimental condition. Events are generated by the EyeLink eye tracker (EyeLink I, EyeLink II, and EyeLink CL) in real-time based on an internal heuristic saccade detector (using a velocity and acceleration-based saccade detection method). A blink is defined as a period of saccade-detector activity with the pupil data missing for three or more samples in a sequence. A fixation event is defined as any period that is not a blink or saccade. To detect a saccade, for each data sample, the parser computes instantaneous velocity and acceleration and compares these to the velocity and acceleration thresholds. If either is above threshold, a saccade signal is generated. The parser will check that the saccade signal is on or off for a critical time before deciding that a saccade has begun or ended. A detailed discussion on event parsing can be found in section "4. Data Files" of the EyeLink II or EyeLink 1000 User Manual. In addition to providing a file-based and a trial-based summary of performance, the EyeLink Data Viewer allows a detailed examination of event data such as fixations, saccades, blinks, buttons, messages, as well as raw sample data. 5.1 Common Operations
EyeLink Data Viewer 2002-2014 SR Research Ltd. 26
The EyeLink Data Viewer allows the user to carry out various manipulations over the events, such as selecting a portion of data for further scrutiny, excluding or deleting a subset of events from analysis, performing drift correction on fixations, merging neighboring fixations and saccades, etc. Selecting, hiding, and deleting operations are common to all event types (fixations, saccades, buttons, blink events, and messages) whereas merging and drift correction is available to fixation and saccade events only. The common operations are discussed in this section whereas the unique operations pertaining to certain types of events are documented in the relevant event section. 5.1.1 Selecting Events To select an event (fixation, saccade, blink, button, or message), place the mouse cursor over the event either in the spatial overlay/temporal graph view or in the event list of the inspector window and click the left mouse button. To select more than one event, hold down the CTRL key on Windows or the command key on Mac OSX and select the target event, until all desired events are selected. If all events in a trial are to be selected, simply click the Select All Visible Item button on the toolbar (or click the right mouse button and select “Select All”). To select a group of events within a square region, place the mouse cursor at the top-left corner of the region. Click and hold down the left mouse button, drag the mouse cursor to the bottom-right corner of the square region, and then release the left mouse button. Tip: Holding the CTRL or command key while selecting an event leaves previously selected events selected. If the CTRL or command key is not pressed, previously selected events are unselected. 5.1.2 Deleting Events Select the events and click the Delete Selected Items button on the toolbar (or click the right mouse button and select “delete”). If an event is deleted, it will be permanently removed from the temporal graph view, spatial overlay view, as well as the output reports, and cannot be “undeleted”. In addition, deleting a fixation or saccade event will have an impact on other temporally contiguous events. For example, deleting a fixation will merge the saccades on either side of the fixation into one saccade. Similarly, deleting one saccade will merge the fixations on either side of the saccade into one big fixation. 5.2 Fixations
EyeLink Data Viewer 2002-2014 SR Research Ltd. 27
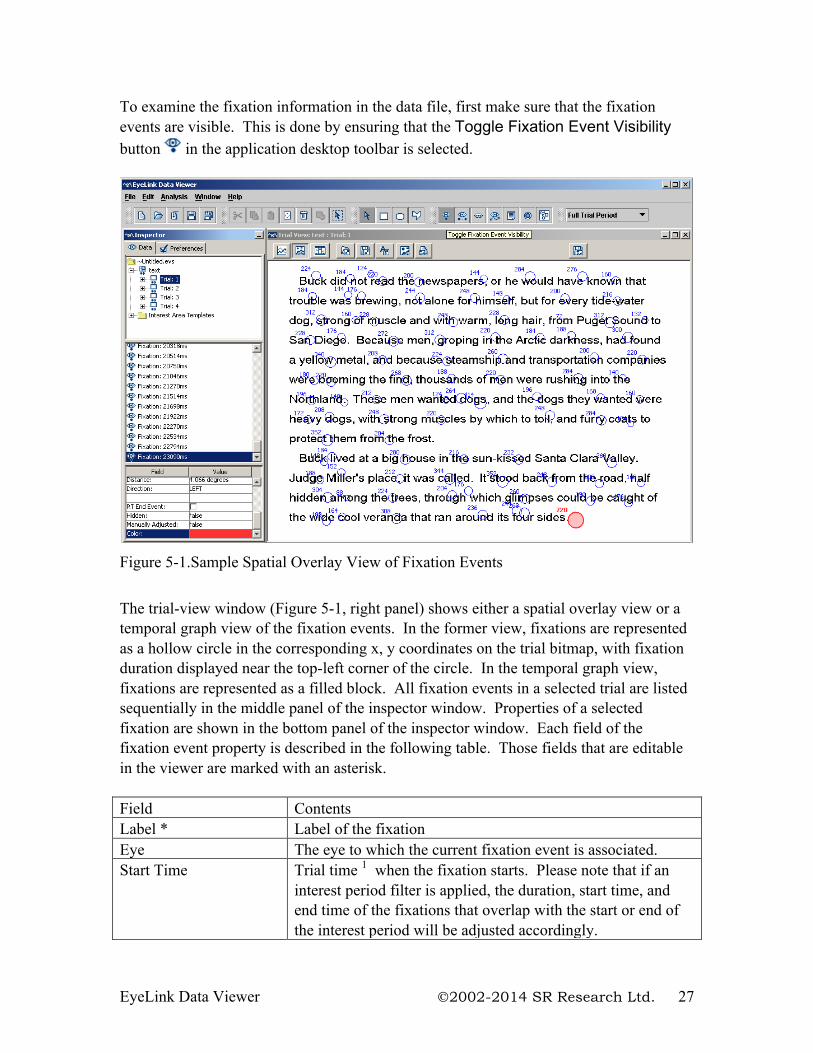
To examine the fixation information in the data file, first make sure that the fixation events are visible. This is done by ensuring that the Toggle Fixation Event Visibility button in the application desktop toolbar is selected.
Figure 5-1.Sample Spatial Overlay View of Fixation Events The trial-view window (Figure 5-1, right panel) shows either a spatial overlay view or a temporal graph view of the fixation events. In the former view, fixations are represented as a hollow circle in the corresponding x, y coordinates on the trial bitmap, with fixation duration displayed near the top-left corner of the circle. In the temporal graph view, fixations are represented as a filled block. All fixation events in a selected trial are listed sequentially in the middle panel of the inspector window. Properties of a selected fixation are shown in the bottom panel of the inspector window. Each field of the fixation event property is described in the following table. Those fields that are editable in the viewer are marked with an asterisk. Field Contents Label * Label of the fixation Eye The eye to which the current fixation event is associated. Start Time Trial time 1 when the fixation starts. Please note that if an
interest period filter is applied, the duration, start time, and end time of the fixations that overlap with the start or end of the interest period will be adjusted accordingly.
EyeLink Data Viewer 2002-2014 SR Research Ltd. 28
End Time Trial time 1 when the fixation ends. Duration Duration (in milliseconds) of the fixation. The fixation
duration may be adjusted if the fixation spans the start or end of an interest period and the "Trim Spanned Fixation Time" option is enabled in the Data Filter preferences.
Avg. X Position *, Avg. Y Position *
Average camera X, Y of pupil center
Angle Angle between the horizontal plane and the line connecting the current fixation and the previous/next fixation
Distance Distance (in degrees of visual angle) between the current fixation and the previous/next fixation
Direction Direction (“LEFT”, “RIGHT”, “UP”, or “DOWN”) 3 relative to the current fixation in which the previous/next fixation is located
RT End Event * Whether the current fixation is the reaction time end event (see section 6.3.1 for reaction time definition)
Hidden Whether the current fixation is hidden from viewing and output analysis. This feature was disabled since version 1.6.
Manually Adjusted Whether the fixation has been shifted manually Color * To achieve better visibility, the color of the currently selected
fixation can be changed by clicking on the color toolbox Note 1 : System time refers to the timestamp (in milliseconds) since the EyeLink tracker
was activated whereas the trial time refers to the time since the trial started. The default trial start time is the start of the trial recording (i.e., “START” message). If reaction-time definitions are applied, the trial-start time is reset at the start event of the RT definition (e.g., “SYNCTIME” message). A negative trial time means that the event or message occurred before the trial start time.
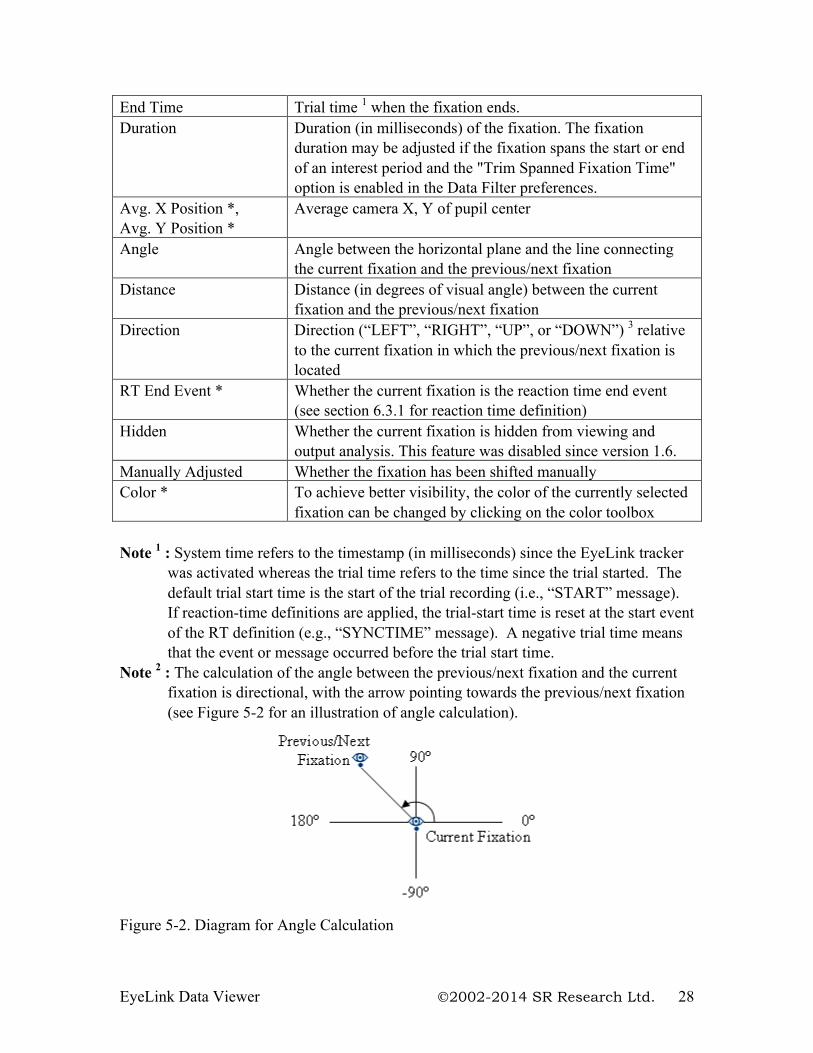
Note 2 : The calculation of the angle between the previous/next fixation and the current
fixation is directional, with the arrow pointing towards the previous/next fixation (see Figure 5-2 for an illustration of angle calculation).
Figure 5-2. Diagram for Angle Calculation
EyeLink Data Viewer 2002-2014 SR Research Ltd. 29
Note 3: The direction of the previous/next fixation relative to the current fixation is determined as “LEFT” if the angle is greater than 135º or less than -135º, “UP” if the angle is between 45º and 135º, “RIGHT” if the angle is between -45º and 45º, and “DOWN” if the angle is between -135º and -45º.
5.2.1 Selecting Fixations In addition to the common method of event selection by mouse, a group of temporally contiguous fixations may also be selected by using a combination of the Shift key and the up or down cursor keys. Select the first fixation by mouse in the event list of the inspector window and hold down the Shift key. Press the down cursor key to select the next fixation, until all target fixations are selected. Use the up cursor key to unselect the recently selected fixations or go to fixations before the first selection. 5.2.2 Merging Fixations In some cases, two or more temporally contiguous fixations can be merged and represented as a “larger” fixation. To merge fixations, select the fixations and click the Merge Selected Items button on the toolbar (or click the right mouse button and select “merge”). Note: Only two or more temporally contiguous fixations can be merged. If fixations are selected that are not temporally contiguous, only the neighboring fixations will be merged. 5.2.3 Drift Correcting Fixations Sometimes, a drift in the gaze position may occur due to poor system setup, headband slippage, or excessive head/body movement. Normally, the eye tracker operator would notice this problem and perform a recalibration or drift correction. If however, the issue was not addressed during recording, it may be possible to manually adjust the fixation events so that some degree of data analysis can still be performed.
5.2.3.1 Drift-correcting a Group of Selected Fixations To perform drift correction:
1) Select the fixations to be drift corrected 2) Hold the ALT key down 3) Click anywhere on the trial view window so that it receives the input focus 4) Move the selected fixations with the cursor keys to the desired locations
Tip: In case several fixations on one single line (such as in reading research) are to be drift-corrected, another method is to select all of the desired fixations and press CTRL+D on Windows (or Command D on Mac OSX) to align them to the same Y position (see
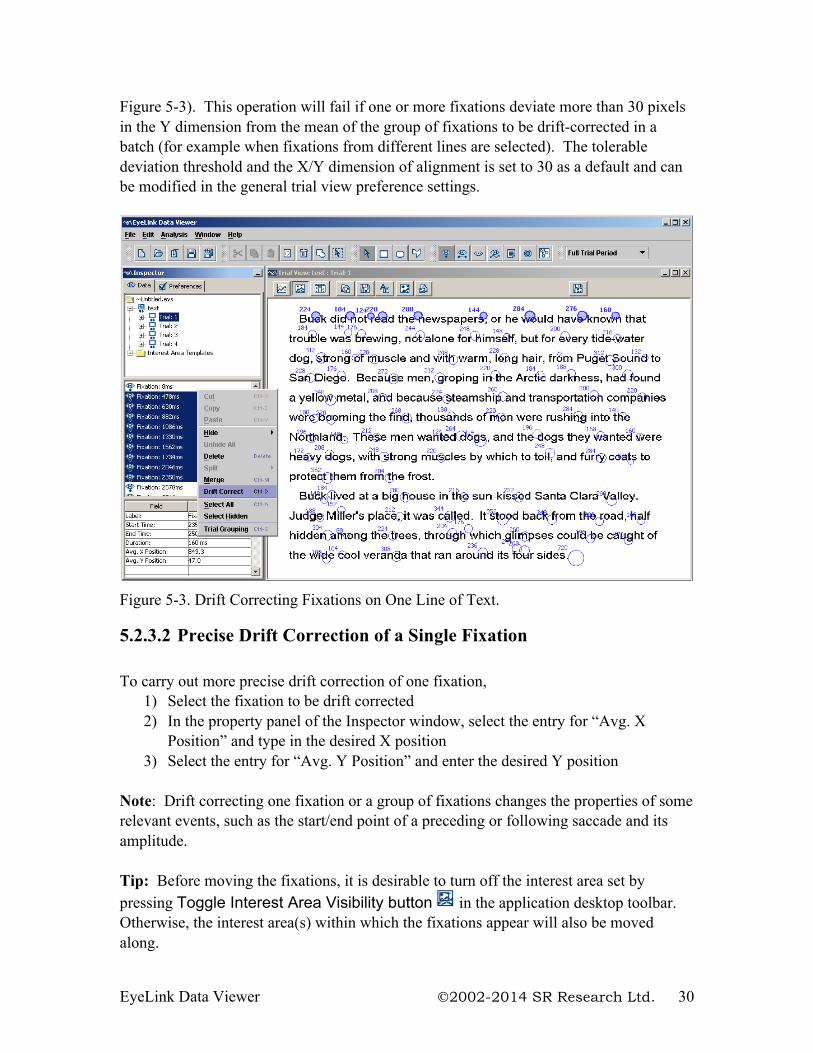
EyeLink Data Viewer 2002-2014 SR Research Ltd. 30
Figure 5-3). This operation will fail if one or more fixations deviate more than 30 pixels in the Y dimension from the mean of the group of fixations to be drift-corrected in a batch (for example when fixations from different lines are selected). The tolerable deviation threshold and the X/Y dimension of alignment is set to 30 as a default and can be modified in the general trial view preference settings.
Figure 5-3. Drift Correcting Fixations on One Line of Text.
5.2.3.2 Precise Drift Correction of a Single Fixation To carry out more precise drift correction of one fixation,
1) Select the fixation to be drift corrected 2) In the property panel of the Inspector window, select the entry for “Avg. X
Position” and type in the desired X position 3) Select the entry for “Avg. Y Position” and enter the desired Y position
Note: Drift correcting one fixation or a group of fixations changes the properties of some relevant events, such as the start/end point of a preceding or following saccade and its amplitude. Tip: Before moving the fixations, it is desirable to turn off the interest area set by pressing Toggle Interest Area Visibility button in the application desktop toolbar. Otherwise, the interest area(s) within which the fixations appear will also be moved along.
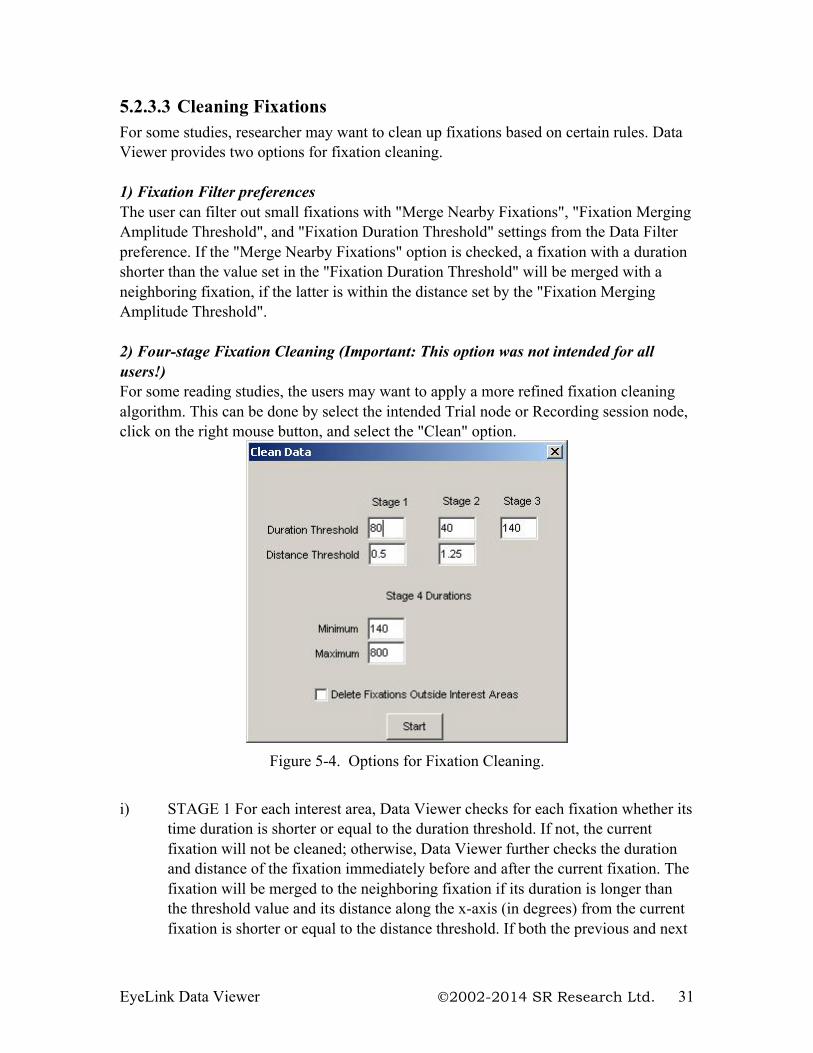
EyeLink Data Viewer 2002-2014 SR Research Ltd. 31
5.2.3.3 Cleaning Fixations For some studies, researcher may want to clean up fixations based on certain rules. Data Viewer provides two options for fixation cleaning. 1) Fixation Filter preferences The user can filter out small fixations with "Merge Nearby Fixations", "Fixation Merging Amplitude Threshold", and "Fixation Duration Threshold" settings from the Data Filter preference. If the "Merge Nearby Fixations" option is checked, a fixation with a duration shorter than the value set in the "Fixation Duration Threshold" will be merged with a neighboring fixation, if the latter is within the distance set by the "Fixation Merging Amplitude Threshold". 2) Four-stage Fixation Cleaning (Important: This option was not intended for all users!) For some reading studies, the users may want to apply a more refined fixation cleaning algorithm. This can be done by select the intended Trial node or Recording session node, click on the right mouse button, and select the "Clean" option.
Figure 5-4. Options for Fixation Cleaning.
i) STAGE 1 For each interest area, Data Viewer checks for each fixation whether its
time duration is shorter or equal to the duration threshold. If not, the current fixation will not be cleaned; otherwise, Data Viewer further checks the duration and distance of the fixation immediately before and after the current fixation. The fixation will be merged to the neighboring fixation if its duration is longer than the threshold value and its distance along the x-axis (in degrees) from the current fixation is shorter or equal to the distance threshold. If both the previous and next
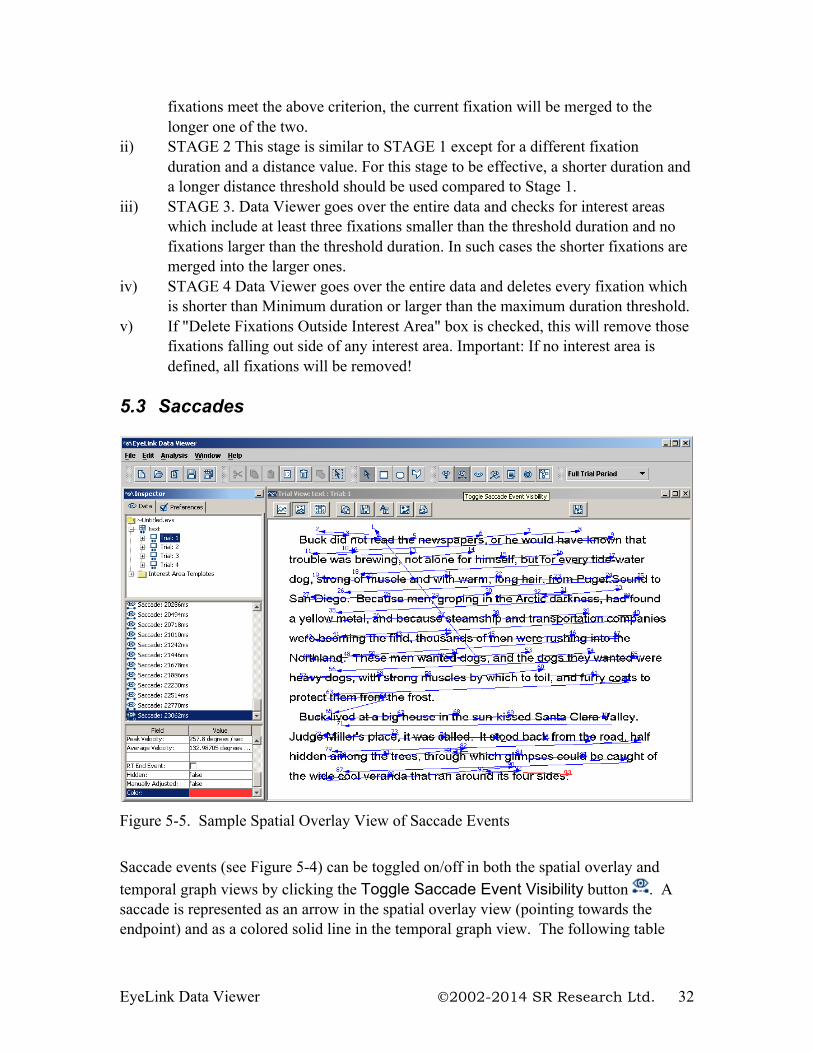
EyeLink Data Viewer 2002-2014 SR Research Ltd. 32
fixations meet the above criterion, the current fixation will be merged to the longer one of the two.
ii) STAGE 2 This stage is similar to STAGE 1 except for a different fixation duration and a distance value. For this stage to be effective, a shorter duration and a longer distance threshold should be used compared to Stage 1.
iii) STAGE 3. Data Viewer goes over the entire data and checks for interest areas which include at least three fixations smaller than the threshold duration and no fixations larger than the threshold duration. In such cases the shorter fixations are merged into the larger ones.
iv) STAGE 4 Data Viewer goes over the entire data and deletes every fixation which is shorter than Minimum duration or larger than the maximum duration threshold.
v) If "Delete Fixations Outside Interest Area" box is checked, this will remove those fixations falling out side of any interest area. Important: If no interest area is defined, all fixations will be removed!
5.3 Saccades
Figure 5-5. Sample Spatial Overlay View of Saccade Events
Saccade events (see Figure 5-4) can be toggled on/off in both the spatial overlay and temporal graph views by clicking the Toggle Saccade Event Visibility button . A saccade is represented as an arrow in the spatial overlay view (pointing towards the endpoint) and as a colored solid line in the temporal graph view. The following table
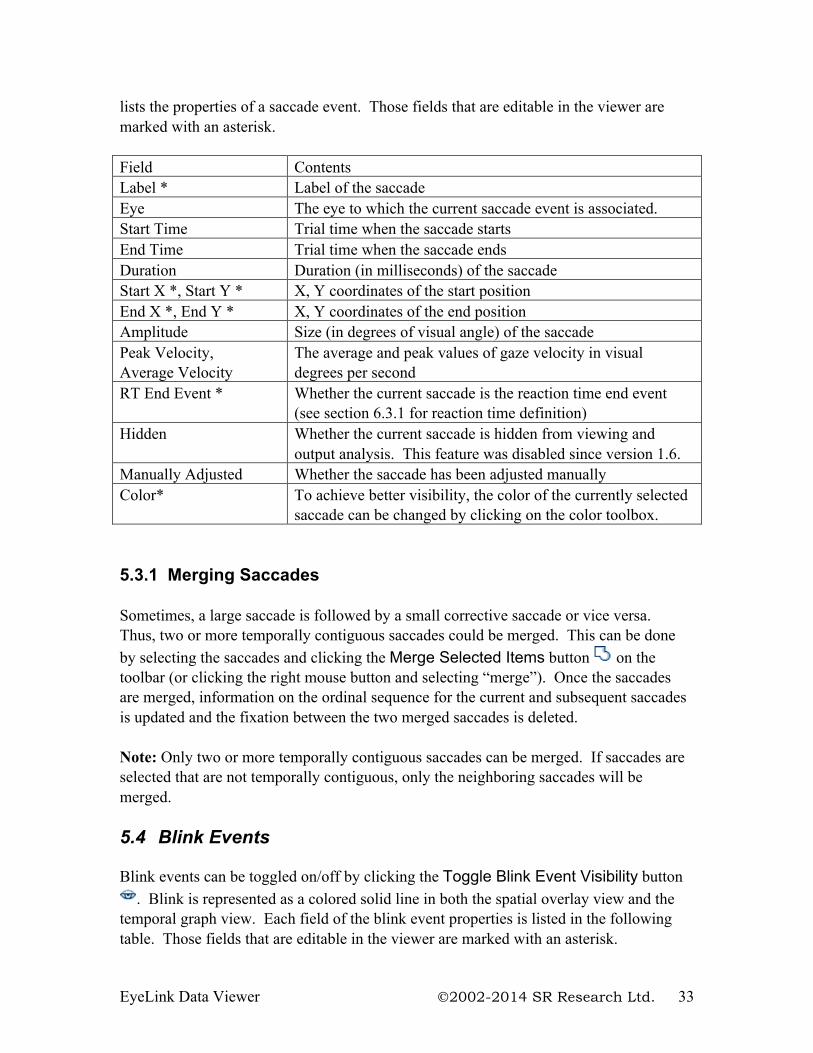
EyeLink Data Viewer 2002-2014 SR Research Ltd. 33
lists the properties of a saccade event. Those fields that are editable in the viewer are marked with an asterisk. Field Contents Label * Label of the saccade Eye The eye to which the current saccade event is associated. Start Time Trial time when the saccade starts End Time Trial time when the saccade ends Duration Duration (in milliseconds) of the saccade Start X *, Start Y * X, Y coordinates of the start position End X *, End Y * X, Y coordinates of the end position Amplitude Size (in degrees of visual angle) of the saccade Peak Velocity, Average Velocity
The average and peak values of gaze velocity in visual degrees per second
RT End Event * Whether the current saccade is the reaction time end event (see section 6.3.1 for reaction time definition)
Hidden Whether the current saccade is hidden from viewing and output analysis. This feature was disabled since version 1.6.
Manually Adjusted Whether the saccade has been adjusted manually Color* To achieve better visibility, the color of the currently selected
saccade can be changed by clicking on the color toolbox. 5.3.1 Merging Saccades Sometimes, a large saccade is followed by a small corrective saccade or vice versa. Thus, two or more temporally contiguous saccades could be merged. This can be done by selecting the saccades and clicking the Merge Selected Items button on the toolbar (or clicking the right mouse button and selecting “merge”). Once the saccades are merged, information on the ordinal sequence for the current and subsequent saccades is updated and the fixation between the two merged saccades is deleted. Note: Only two or more temporally contiguous saccades can be merged. If saccades are selected that are not temporally contiguous, only the neighboring saccades will be merged. 5.4 Blink Events Blink events can be toggled on/off by clicking the Toggle Blink Event Visibility button
. Blink is represented as a colored solid line in both the spatial overlay view and the temporal graph view. Each field of the blink event properties is listed in the following table. Those fields that are editable in the viewer are marked with an asterisk.
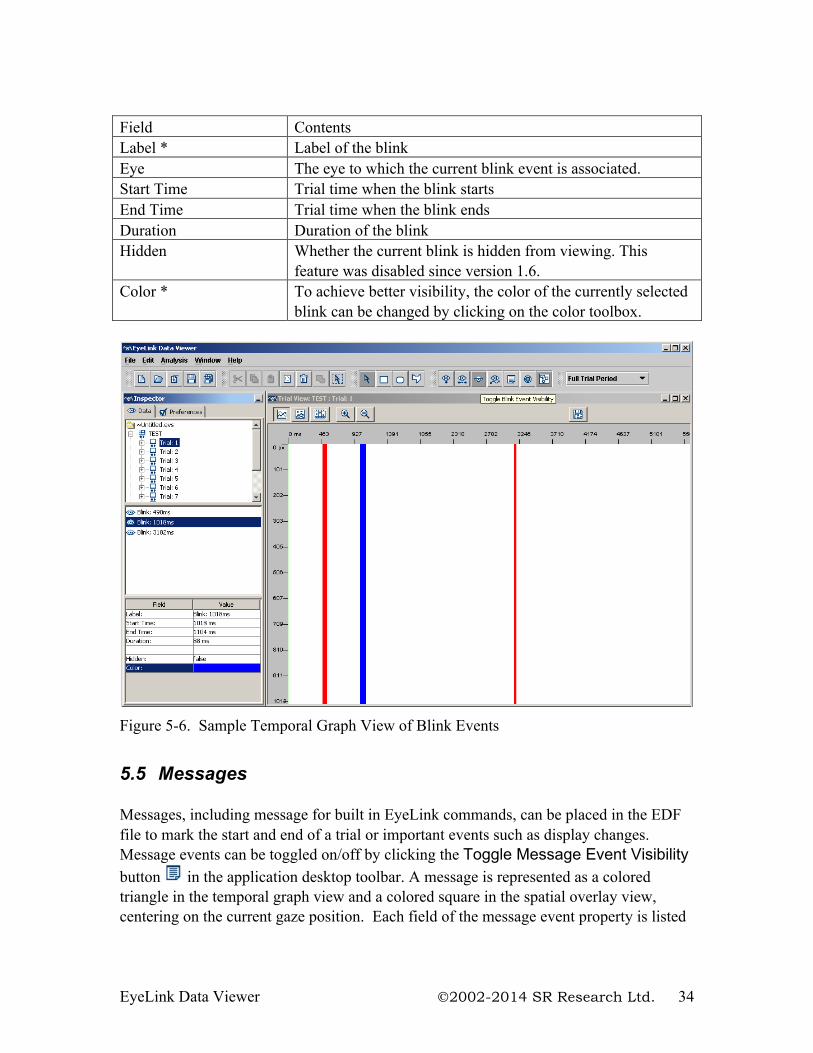
EyeLink Data Viewer 2002-2014 SR Research Ltd. 34
Field Contents Label * Label of the blink Eye The eye to which the current blink event is associated. Start Time Trial time when the blink starts End Time Trial time when the blink ends Duration Duration of the blink Hidden Whether the current blink is hidden from viewing. This
feature was disabled since version 1.6. Color * To achieve better visibility, the color of the currently selected
blink can be changed by clicking on the color toolbox.
Figure 5-6. Sample Temporal Graph View of Blink Events
5.5 Messages Messages, including message for built in EyeLink commands, can be placed in the EDF file to mark the start and end of a trial or important events such as display changes. Message events can be toggled on/off by clicking the Toggle Message Event Visibility button in the application desktop toolbar. A message is represented as a colored triangle in the temporal graph view and a colored square in the spatial overlay view, centering on the current gaze position. Each field of the message event property is listed
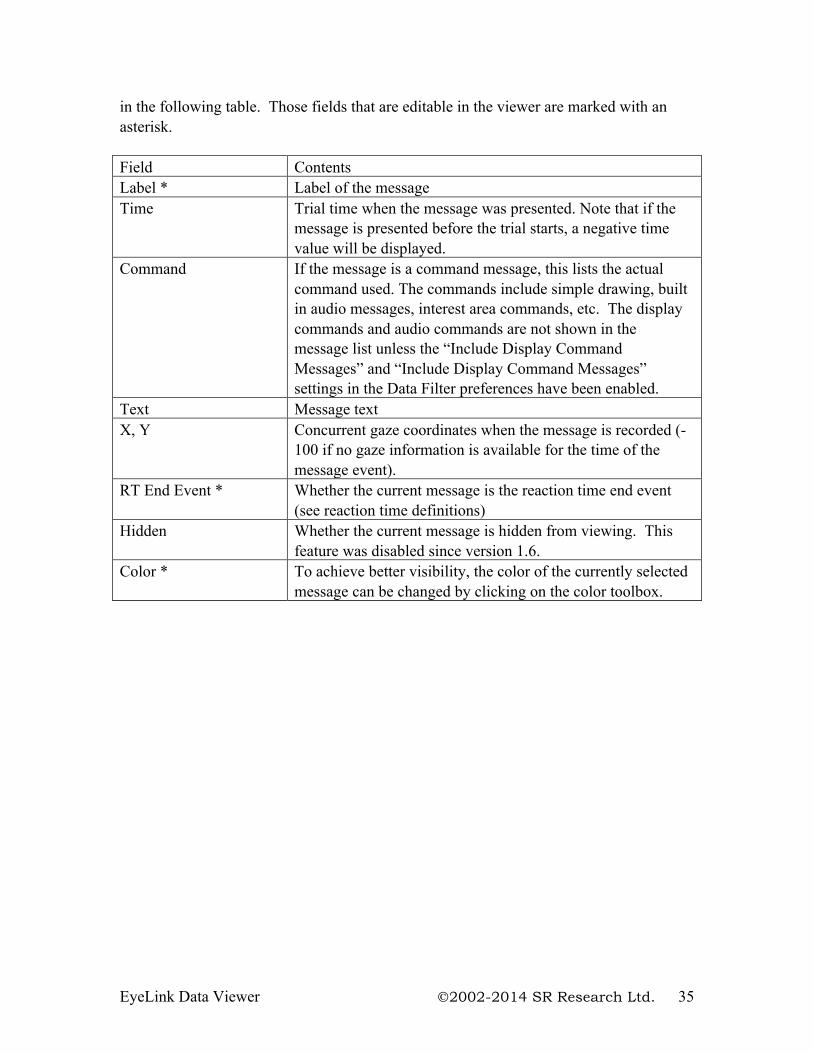
EyeLink Data Viewer 2002-2014 SR Research Ltd. 35
in the following table. Those fields that are editable in the viewer are marked with an asterisk. Field Contents Label * Label of the message Time Trial time when the message was presented. Note that if the
message is presented before the trial starts, a negative time value will be displayed.
Command If the message is a command message, this lists the actual command used. The commands include simple drawing, built in audio messages, interest area commands, etc. The display commands and audio commands are not shown in the message list unless the “Include Display Command Messages” and “Include Display Command Messages” settings in the Data Filter preferences have been enabled.
Text Message text X, Y Concurrent gaze coordinates when the message is recorded (-
100 if no gaze information is available for the time of the message event).
RT End Event * Whether the current message is the reaction time end event (see reaction time definitions)
Hidden Whether the current message is hidden from viewing. This feature was disabled since version 1.6.
Color * To achieve better visibility, the color of the currently selected message can be changed by clicking on the color toolbox.
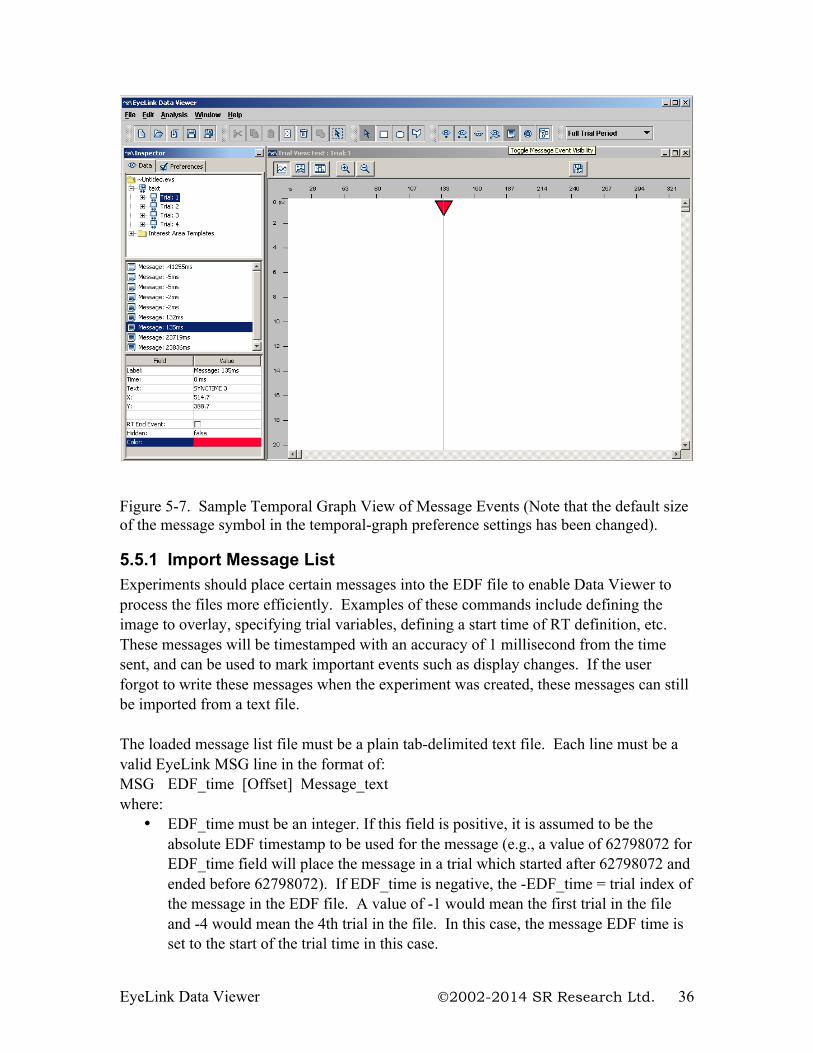
EyeLink Data Viewer 2002-2014 SR Research Ltd. 36
Figure 5-7. Sample Temporal Graph View of Message Events (Note that the default size of the message symbol in the temporal-graph preference settings has been changed).
5.5.1 Import Message List Experiments should place certain messages into the EDF file to enable Data Viewer to process the files more efficiently. Examples of these commands include defining the image to overlay, specifying trial variables, defining a start time of RT definition, etc. These messages will be timestamped with an accuracy of 1 millisecond from the time sent, and can be used to mark important events such as display changes. If the user forgot to write these messages when the experiment was created, these messages can still be imported from a text file. The loaded message list file must be a plain tab-delimited text file. Each line must be a valid EyeLink MSG line in the format of: MSG EDF_time [Offset] Message_text where:
• EDF_time must be an integer. If this field is positive, it is assumed to be the absolute EDF timestamp to be used for the message (e.g., a value of 62798072 for EDF_time field will place the message in a trial which started after 62798072 and ended before 62798072). If EDF_time is negative, the -EDF_time = trial index of the message in the EDF file. A value of -1 would mean the first trial in the file and -4 would mean the 4th trial in the file. In this case, the message EDF time is set to the start of the trial time in this case.
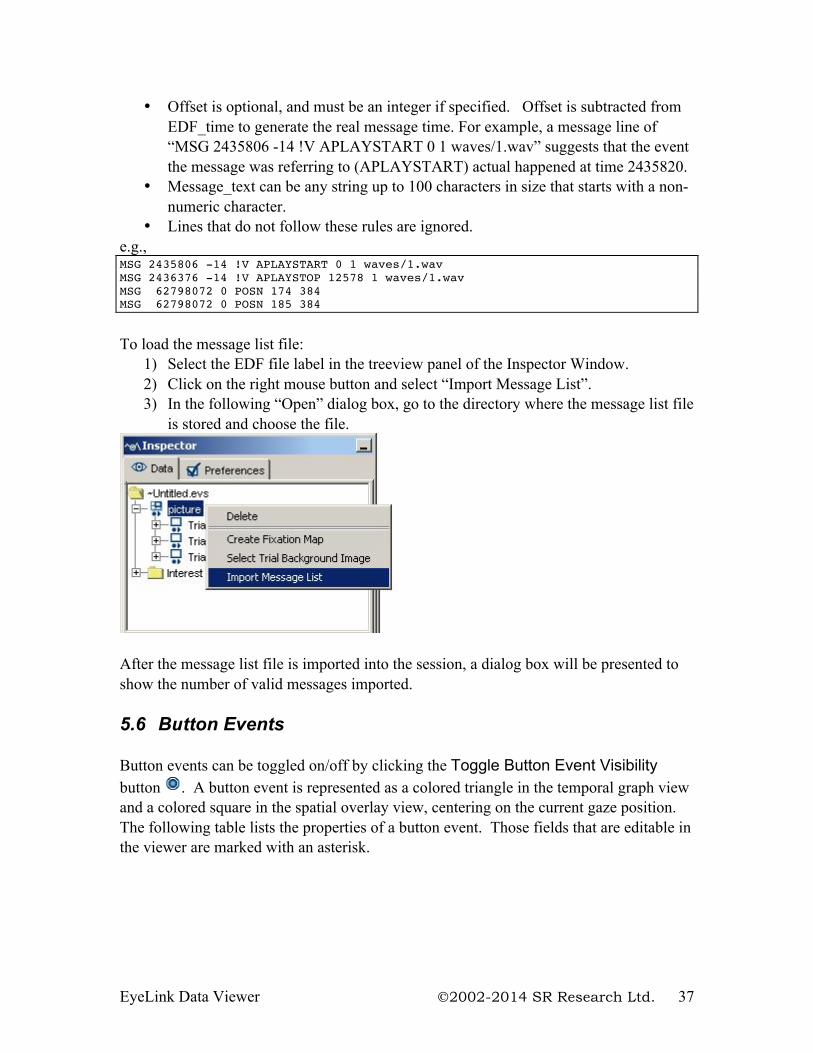
EyeLink Data Viewer 2002-2014 SR Research Ltd. 37
• Offset is optional, and must be an integer if specified. Offset is subtracted from EDF_time to generate the real message time. For example, a message line of “MSG 2435806 -14 !V APLAYSTART 0 1 waves/1.wav” suggests that the event the message was referring to (APLAYSTART) actual happened at time 2435820.
• Message_text can be any string up to 100 characters in size that starts with a non-numeric character.
• Lines that do not follow these rules are ignored. e.g., MSG 2435806 -14 !V APLAYSTART 0 1 waves/1.wav MSG 2436376 -14 !V APLAYSTOP 12578 1 waves/1.wav MSG 62798072 0 POSN 174 384 MSG 62798072 0 POSN 185 384
To load the message list file:
1) Select the EDF file label in the treeview panel of the Inspector Window. 2) Click on the right mouse button and select “Import Message List”. 3) In the following “Open” dialog box, go to the directory where the message list file
is stored and choose the file.
After the message list file is imported into the session, a dialog box will be presented to show the number of valid messages imported. 5.6 Button Events Button events can be toggled on/off by clicking the Toggle Button Event Visibility button . A button event is represented as a colored triangle in the temporal graph view and a colored square in the spatial overlay view, centering on the current gaze position. The following table lists the properties of a button event. Those fields that are editable in the viewer are marked with an asterisk.
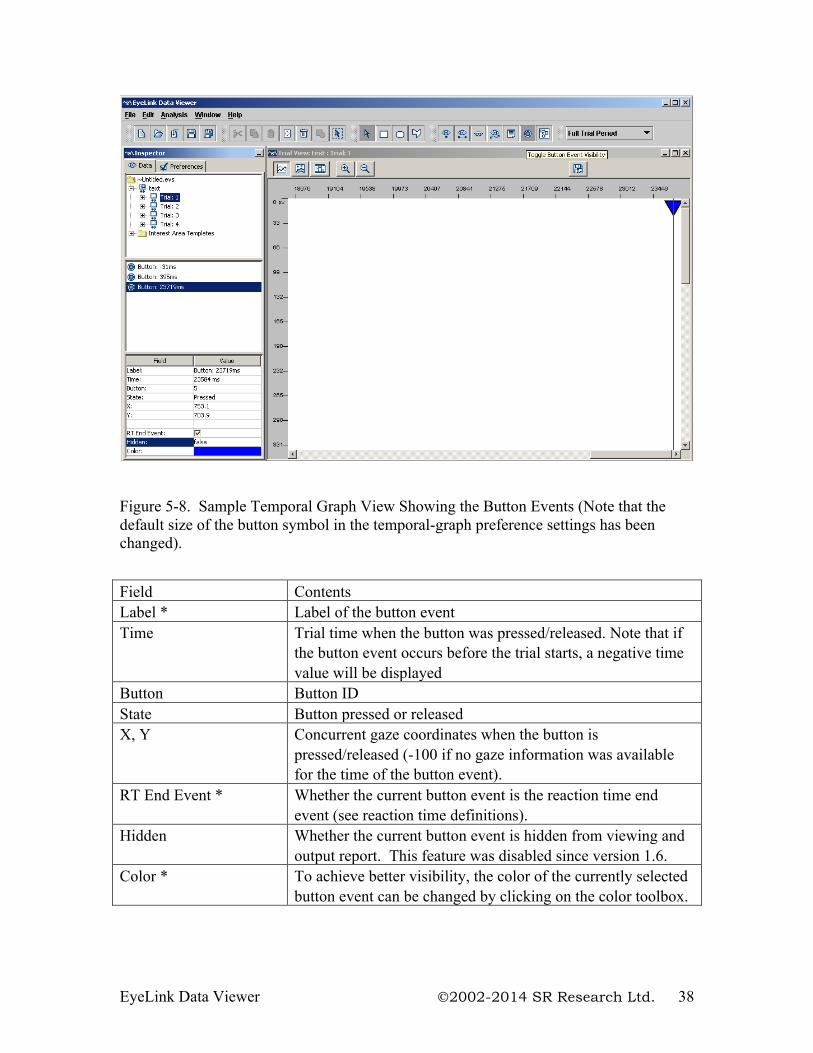
EyeLink Data Viewer 2002-2014 SR Research Ltd. 38
Figure 5-8. Sample Temporal Graph View Showing the Button Events (Note that the default size of the button symbol in the temporal-graph preference settings has been changed).
Field Contents Label * Label of the button event Time Trial time when the button was pressed/released. Note that if
the button event occurs before the trial starts, a negative time value will be displayed
Button Button ID State Button pressed or released X, Y Concurrent gaze coordinates when the button is
pressed/released (-100 if no gaze information was available for the time of the button event).
RT End Event * Whether the current button event is the reaction time end event (see reaction time definitions).
Hidden Whether the current button event is hidden from viewing and output report. This feature was disabled since version 1.6.
Color * To achieve better visibility, the color of the currently selected button event can be changed by clicking on the color toolbox.
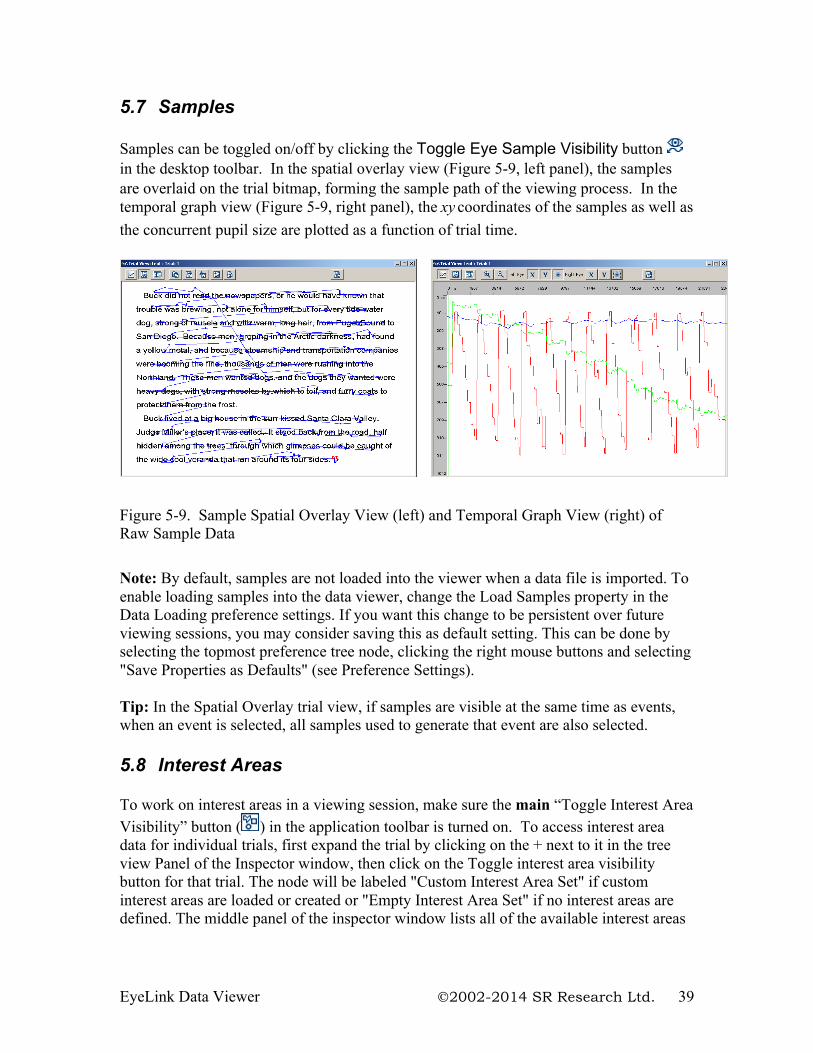
EyeLink Data Viewer 2002-2014 SR Research Ltd. 39
5.7 Samples Samples can be toggled on/off by clicking the Toggle Eye Sample Visibility button in the desktop toolbar. In the spatial overlay view (Figure 5-9, left panel), the samples are overlaid on the trial bitmap, forming the sample path of the viewing process. In the temporal graph view (Figure 5-9, right panel), the xy coordinates of the samples as well as the concurrent pupil size are plotted as a function of trial time.
Figure 5-9. Sample Spatial Overlay View (left) and Temporal Graph View (right) of Raw Sample Data
Note: By default, samples are not loaded into the viewer when a data file is imported. To enable loading samples into the data viewer, change the Load Samples property in the Data Loading preference settings. If you want this change to be persistent over future viewing sessions, you may consider saving this as default setting. This can be done by selecting the topmost preference tree node, clicking the right mouse buttons and selecting "Save Properties as Defaults" (see Preference Settings). Tip: In the Spatial Overlay trial view, if samples are visible at the same time as events, when an event is selected, all samples used to generate that event are also selected. 5.8 Interest Areas To work on interest areas in a viewing session, make sure the main “Toggle Interest Area Visibility” button ( ) in the application toolbar is turned on. To access interest area data for individual trials, first expand the trial by clicking on the + next to it in the tree view Panel of the Inspector window, then click on the Toggle interest area visibility button for that trial. The node will be labeled "Custom Interest Area Set" if custom interest areas are loaded or created or "Empty Interest Area Set" if no interest areas are defined. The middle panel of the inspector window lists all of the available interest areas
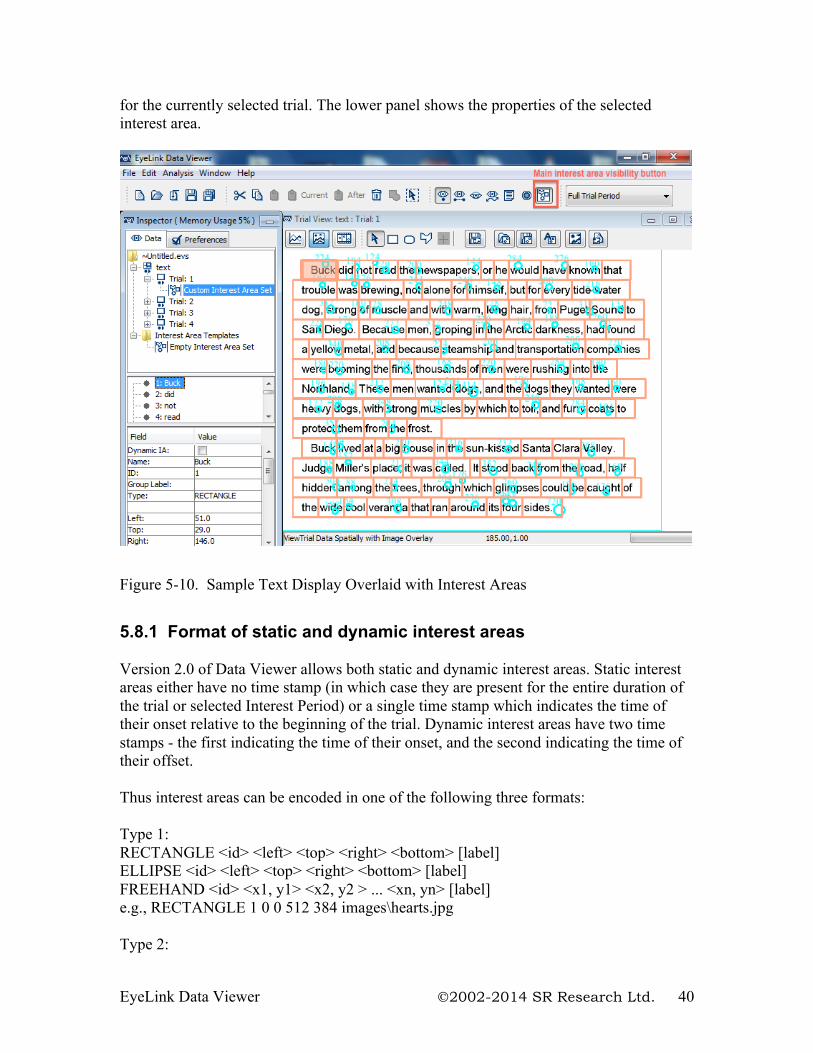
EyeLink Data Viewer 2002-2014 SR Research Ltd. 40
for the currently selected trial. The lower panel shows the properties of the selected interest area.
Figure 5-10. Sample Text Display Overlaid with Interest Areas
5.8.1 Format of static and dynamic interest areas Version 2.0 of Data Viewer allows both static and dynamic interest areas. Static interest areas either have no time stamp (in which case they are present for the entire duration of the trial or selected Interest Period) or a single time stamp which indicates the time of their onset relative to the beginning of the trial. Dynamic interest areas have two time stamps - the first indicating the time of their onset, and the second indicating the time of their offset. Thus interest areas can be encoded in one of the following three formats: Type 1: RECTANGLE <id> <left> <top> <right> <bottom> [label] ELLIPSE <id> <left> <top> <right> <bottom> [label] FREEHAND <id> <x1, y1> <x2, y2 > ... <xn, yn> [label] e.g., RECTANGLE 1 0 0 512 384 images\hearts.jpg Type 2:
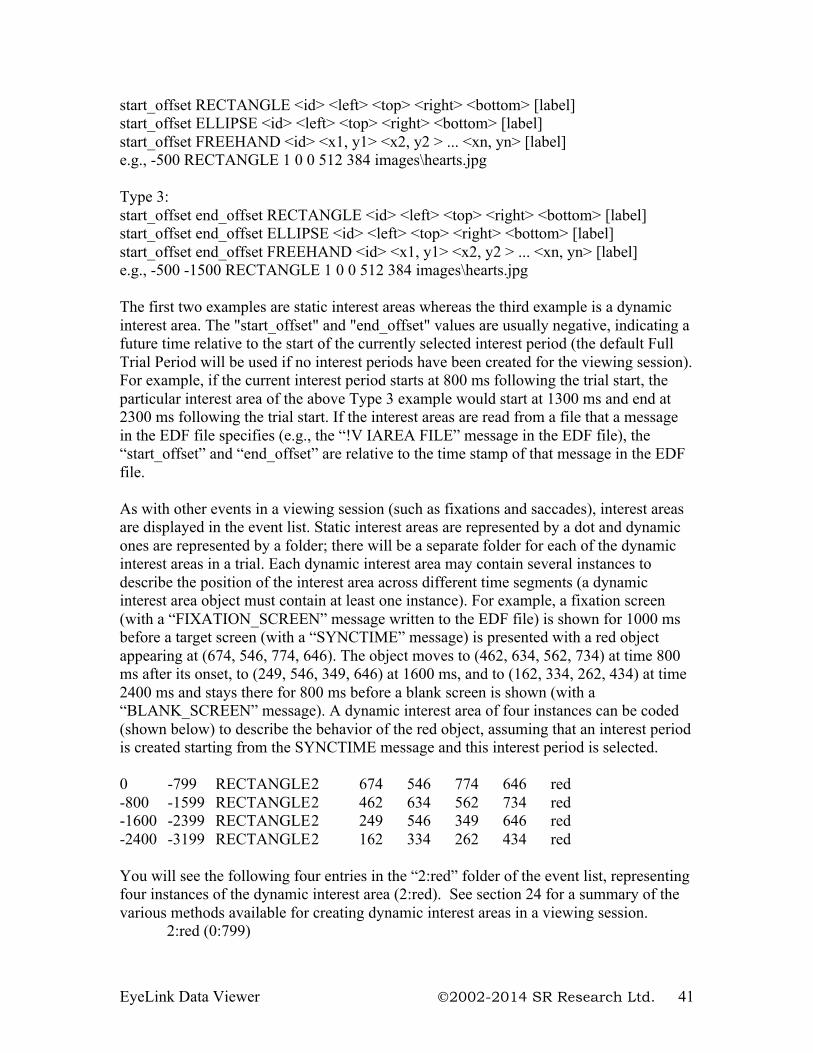
EyeLink Data Viewer 2002-2014 SR Research Ltd. 41
start_offset RECTANGLE <id> <left> <top> <right> <bottom> [label] start_offset ELLIPSE <id> <left> <top> <right> <bottom> [label] start_offset FREEHAND <id> <x1, y1> <x2, y2 > ... <xn, yn> [label] e.g., -500 RECTANGLE 1 0 0 512 384 images\hearts.jpg Type 3: start_offset end_offset RECTANGLE <id> <left> <top> <right> <bottom> [label] start_offset end_offset ELLIPSE <id> <left> <top> <right> <bottom> [label] start_offset end_offset FREEHAND <id> <x1, y1> <x2, y2 > ... <xn, yn> [label] e.g., -500 -1500 RECTANGLE 1 0 0 512 384 images\hearts.jpg The first two examples are static interest areas whereas the third example is a dynamic interest area. The "start_offset" and "end_offset" values are usually negative, indicating a future time relative to the start of the currently selected interest period (the default Full Trial Period will be used if no interest periods have been created for the viewing session). For example, if the current interest period starts at 800 ms following the trial start, the particular interest area of the above Type 3 example would start at 1300 ms and end at 2300 ms following the trial start. If the interest areas are read from a file that a message in the EDF file specifies (e.g., the “!V IAREA FILE” message in the EDF file), the “start_offset” and “end_offset” are relative to the time stamp of that message in the EDF file. As with other events in a viewing session (such as fixations and saccades), interest areas are displayed in the event list. Static interest areas are represented by a dot and dynamic ones are represented by a folder; there will be a separate folder for each of the dynamic interest areas in a trial. Each dynamic interest area may contain several instances to describe the position of the interest area across different time segments (a dynamic interest area object must contain at least one instance). For example, a fixation screen (with a “FIXATION_SCREEN” message written to the EDF file) is shown for 1000 ms before a target screen (with a “SYNCTIME” message) is presented with a red object appearing at (674, 546, 774, 646). The object moves to (462, 634, 562, 734) at time 800 ms after its onset, to (249, 546, 349, 646) at 1600 ms, and to (162, 334, 262, 434) at time 2400 ms and stays there for 800 ms before a blank screen is shown (with a “BLANK_SCREEN” message). A dynamic interest area of four instances can be coded (shown below) to describe the behavior of the red object, assuming that an interest period is created starting from the SYNCTIME message and this interest period is selected. 0 -799 RECTANGLE 2 674 546 774 646 red -800 -1599 RECTANGLE 2 462 634 562 734 red -1600 -2399 RECTANGLE 2 249 546 349 646 red -2400 -3199 RECTANGLE 2 162 334 262 434 red You will see the following four entries in the “2:red” folder of the event list, representing four instances of the dynamic interest area (2:red). See section 24 for a summary of the various methods available for creating dynamic interest areas in a viewing session.
2:red (0:799)
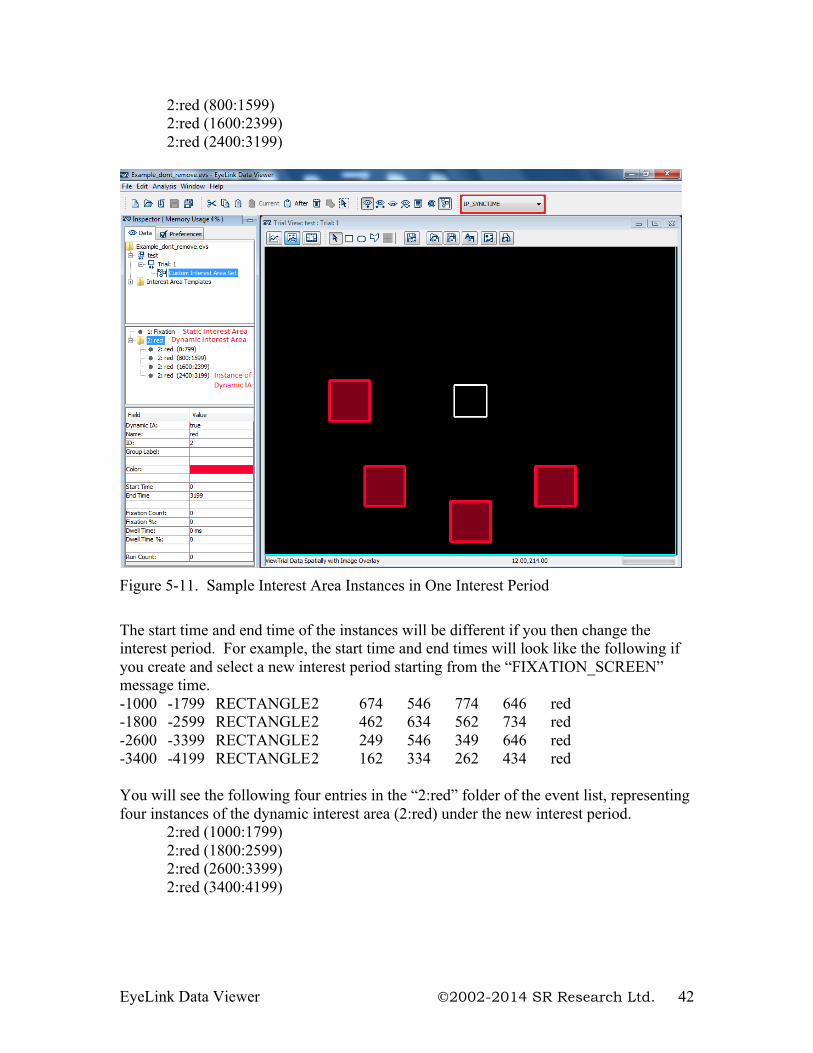
EyeLink Data Viewer 2002-2014 SR Research Ltd. 42
2:red (800:1599) 2:red (1600:2399) 2:red (2400:3199)
Figure 5-11. Sample Interest Area Instances in One Interest Period The start time and end time of the instances will be different if you then change the interest period. For example, the start time and end times will look like the following if you create and select a new interest period starting from the “FIXATION_SCREEN” message time. -1000 -1799 RECTANGLE 2 674 546 774 646 red -1800 -2599 RECTANGLE 2 462 634 562 734 red -2600 -3399 RECTANGLE 2 249 546 349 646 red -3400 -4199 RECTANGLE 2 162 334 262 434 red You will see the following four entries in the “2:red” folder of the event list, representing four instances of the dynamic interest area (2:red) under the new interest period.
2:red (1000:1799) 2:red (1800:2599) 2:red (2600:3399) 2:red (3400:4199)
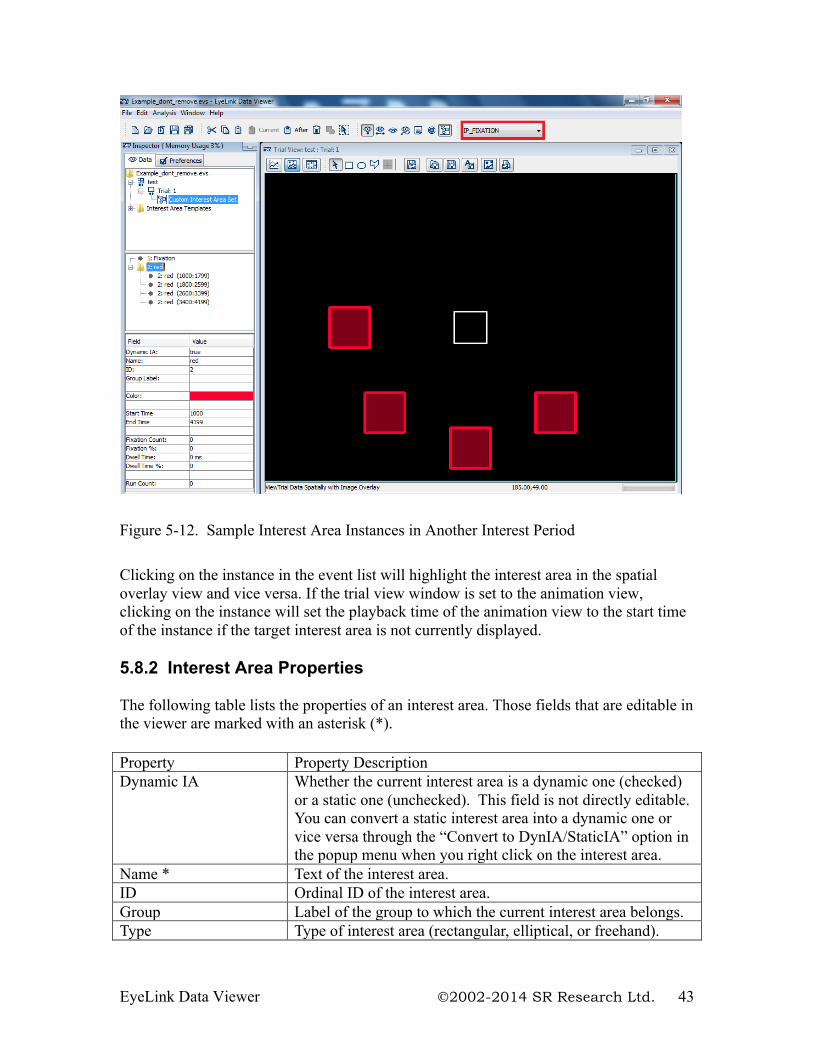
EyeLink Data Viewer 2002-2014 SR Research Ltd. 43
Figure 5-12. Sample Interest Area Instances in Another Interest Period
Clicking on the instance in the event list will highlight the interest area in the spatial overlay view and vice versa. If the trial view window is set to the animation view, clicking on the instance will set the playback time of the animation view to the start time of the instance if the target interest area is not currently displayed. 5.8.2 Interest Area Properties The following table lists the properties of an interest area. Those fields that are editable in the viewer are marked with an asterisk (*). Property Property Description Dynamic IA Whether the current interest area is a dynamic one (checked)
or a static one (unchecked). This field is not directly editable. You can convert a static interest area into a dynamic one or vice versa through the “Convert to DynIA/StaticIA” option in the popup menu when you right click on the interest area.
Name * Text of the interest area. ID Ordinal ID of the interest area. Group Label of the group to which the current interest area belongs. Type Type of interest area (rectangular, elliptical, or freehand).
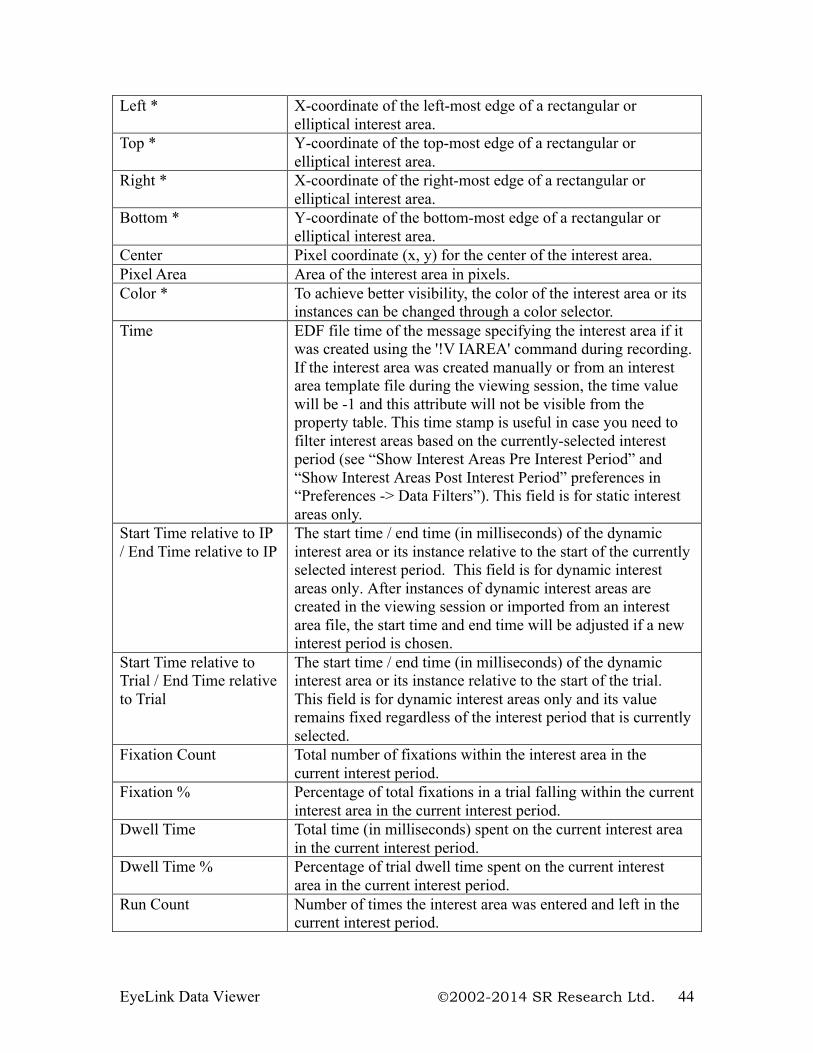
EyeLink Data Viewer 2002-2014 SR Research Ltd. 44
Left * X-coordinate of the left-most edge of a rectangular or elliptical interest area.
Top * Y-coordinate of the top-most edge of a rectangular or elliptical interest area.
Right * X-coordinate of the right-most edge of a rectangular or elliptical interest area.
Bottom * Y-coordinate of the bottom-most edge of a rectangular or elliptical interest area.
Center Pixel coordinate (x, y) for the center of the interest area. Pixel Area Area of the interest area in pixels. Color * To achieve better visibility, the color of the interest area or its
instances can be changed through a color selector. Time EDF file time of the message specifying the interest area if it
was created using the '!V IAREA' command during recording. If the interest area was created manually or from an interest area template file during the viewing session, the time value will be -1 and this attribute will not be visible from the property table. This time stamp is useful in case you need to filter interest areas based on the currently-selected interest period (see “Show Interest Areas Pre Interest Period” and “Show Interest Areas Post Interest Period” preferences in “Preferences -> Data Filters”). This field is for static interest areas only.
Start Time relative to IP / End Time relative to IP
The start time / end time (in milliseconds) of the dynamic interest area or its instance relative to the start of the currently selected interest period. This field is for dynamic interest areas only. After instances of dynamic interest areas are created in the viewing session or imported from an interest area file, the start time and end time will be adjusted if a new interest period is chosen.
Start Time relative to Trial / End Time relative to Trial
The start time / end time (in milliseconds) of the dynamic interest area or its instance relative to the start of the trial. This field is for dynamic interest areas only and its value remains fixed regardless of the interest period that is currently selected.
Fixation Count Total number of fixations within the interest area in the current interest period.
Fixation % Percentage of total fixations in a trial falling within the current interest area in the current interest period.
Dwell Time Total time (in milliseconds) spent on the current interest area in the current interest period.
Dwell Time % Percentage of trial dwell time spent on the current interest area in the current interest period.
Run Count Number of times the interest area was entered and left in the current interest period.
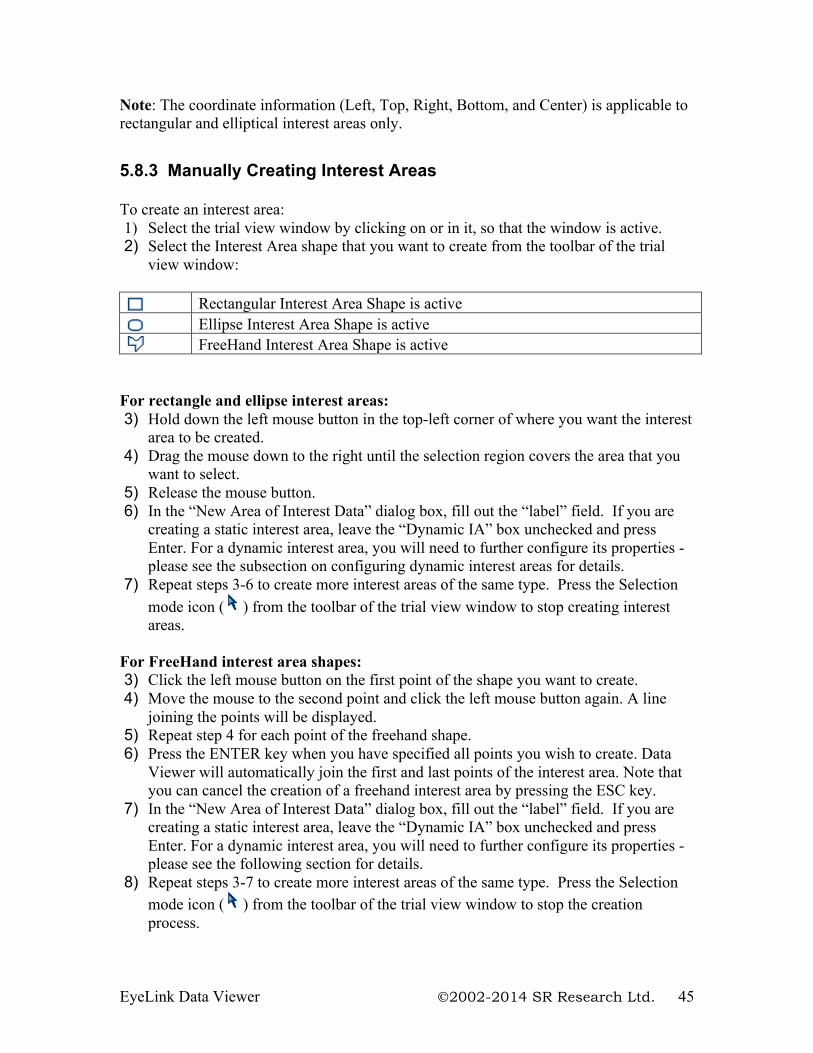
EyeLink Data Viewer 2002-2014 SR Research Ltd. 45
Note: The coordinate information (Left, Top, Right, Bottom, and Center) is applicable to rectangular and elliptical interest areas only.
5.8.3 Manually Creating Interest Areas To create an interest area: 1) Select the trial view window by clicking on or in it, so that the window is active. 2) Select the Interest Area shape that you want to create from the toolbar of the trial
view window:
Rectangular Interest Area Shape is active Ellipse Interest Area Shape is active FreeHand Interest Area Shape is active
For rectangle and ellipse interest areas: 3) Hold down the left mouse button in the top-left corner of where you want the interest
area to be created. 4) Drag the mouse down to the right until the selection region covers the area that you
want to select. 5) Release the mouse button. 6) In the “New Area of Interest Data” dialog box, fill out the “label” field. If you are
creating a static interest area, leave the “Dynamic IA” box unchecked and press Enter. For a dynamic interest area, you will need to further configure its properties - please see the subsection on configuring dynamic interest areas for details.
7) Repeat steps 3-6 to create more interest areas of the same type. Press the Selection mode icon ( ) from the toolbar of the trial view window to stop creating interest areas.
For FreeHand interest area shapes: 3) Click the left mouse button on the first point of the shape you want to create. 4) Move the mouse to the second point and click the left mouse button again. A line
joining the points will be displayed. 5) Repeat step 4 for each point of the freehand shape. 6) Press the ENTER key when you have specified all points you wish to create. Data
Viewer will automatically join the first and last points of the interest area. Note that you can cancel the creation of a freehand interest area by pressing the ESC key.
7) In the “New Area of Interest Data” dialog box, fill out the “label” field. If you are creating a static interest area, leave the “Dynamic IA” box unchecked and press Enter. For a dynamic interest area, you will need to further configure its properties - please see the following section for details.
8) Repeat steps 3-7 to create more interest areas of the same type. Press the Selection mode icon ( ) from the toolbar of the trial view window to stop the creation process.
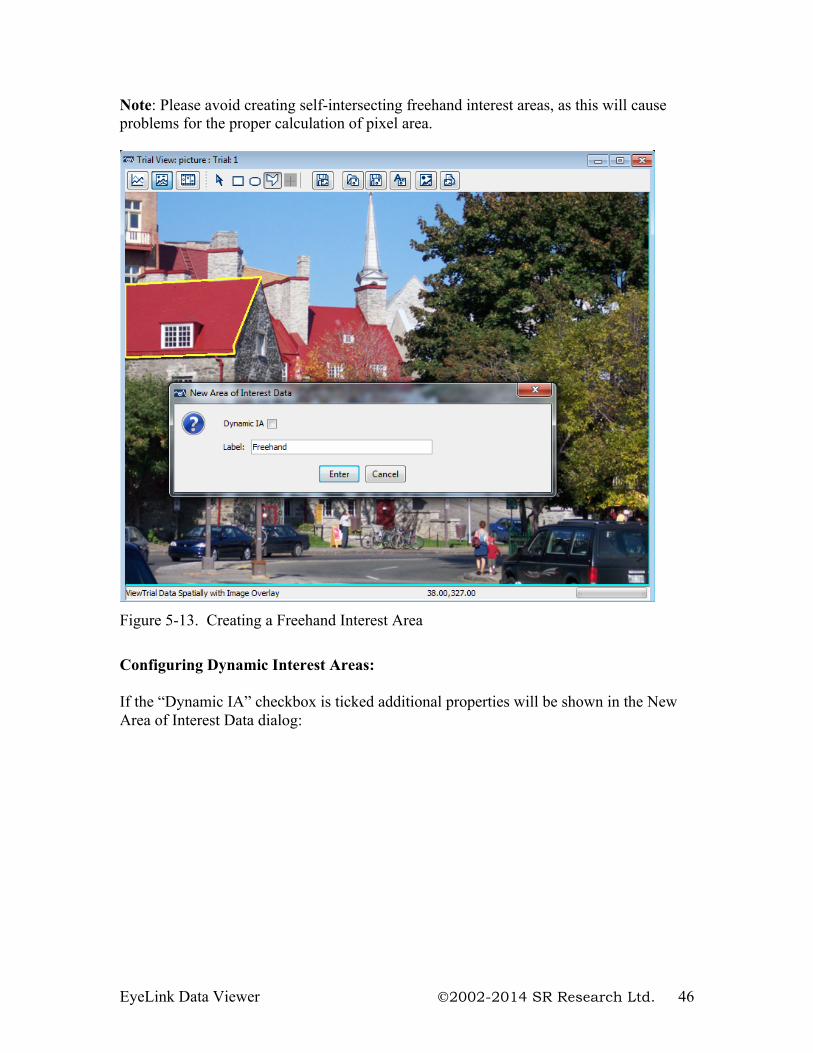
EyeLink Data Viewer 2002-2014 SR Research Ltd. 46
Note: Please avoid creating self-intersecting freehand interest areas, as this will cause problems for the proper calculation of pixel area.
Figure 5-13. Creating a Freehand Interest Area
Configuring Dynamic Interest Areas: If the “Dynamic IA” checkbox is ticked additional properties will be shown in the New Area of Interest Data dialog:
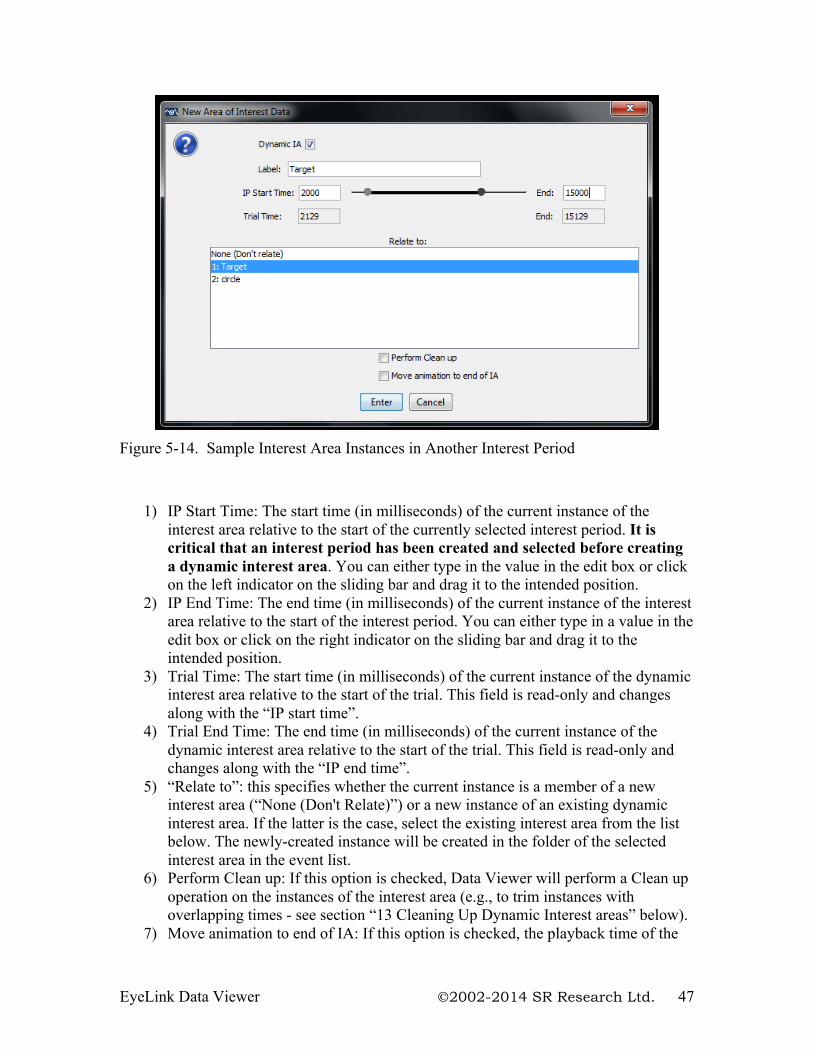
EyeLink Data Viewer 2002-2014 SR Research Ltd. 47
Figure 5-14. Sample Interest Area Instances in Another Interest Period
1) IP Start Time: The start time (in milliseconds) of the current instance of the interest area relative to the start of the currently selected interest period. It is critical that an interest period has been created and selected before creating a dynamic interest area. You can either type in the value in the edit box or click on the left indicator on the sliding bar and drag it to the intended position.
2) IP End Time: The end time (in milliseconds) of the current instance of the interest area relative to the start of the interest period. You can either type in a value in the edit box or click on the right indicator on the sliding bar and drag it to the intended position.
3) Trial Time: The start time (in milliseconds) of the current instance of the dynamic interest area relative to the start of the trial. This field is read-only and changes along with the “IP start time”.
4) Trial End Time: The end time (in milliseconds) of the current instance of the dynamic interest area relative to the start of the trial. This field is read-only and changes along with the “IP end time”.
5) “Relate to”: this specifies whether the current instance is a member of a new interest area (“None (Don't Relate)”) or a new instance of an existing dynamic interest area. If the latter is the case, select the existing interest area from the list below. The newly-created instance will be created in the folder of the selected interest area in the event list.
6) Perform Clean up: If this option is checked, Data Viewer will perform a Clean up operation on the instances of the interest area (e.g., to trim instances with overlapping times - see section “13 Cleaning Up Dynamic Interest areas” below).
7) Move animation to end of IA: If this option is checked, the playback time of the
EyeLink Data Viewer 2002-2014 SR Research Ltd. 48
animation view will be set to 1 millisecond after the end point of the newly created interest area instance.
5.8.4 Creating Interest Area: Image Segmentation If a trial bitmap has already been loaded, the Data Viewer can create interest areas for the trial by auto-segmentation. This is done by clicking the “Auto Segment Image to Interest Area” button ( ) in the toolbar of the spatial overlay view window. Note: Using the auto-segmentation feature will remove all of the existing interest areas for the trial. Auto segmentation is more feasible for those displays in which the individual items can be easily isolated, such as in reading and visual search studies where a background of a single color is present, but not good for some visual scenes in which the boundaries between individual elements are not clearly defined (see Section 8.7 on preference settings for image segmentation). 5.8.5 Saving Interest Areas Interest areas that have been created for any one trial can be saved into a template file and re-used on other trials. To save interest areas: 1) Click the Save the Interest Area Set to Disk button ( ) on the toolbar of the trial
view window. 2) In the Save dialog box, go to the directory where the interest area set should be
saved. 3) In the File name text box, type in the name of the file. Data Viewer will
automatically fill in the file extension (.ias). 4) Press the Save button.
In the saved interest area file, static interest areas will not have a time stamp. For dynamic interest areas, the time stamps associated with each instance of the interest area will be based on the currently selected interest period. So it is critical that the interest period is set correctly before saving the template. Please note that the time stamps will change if an incorrect interest period is selected when saving – this will mean that when the template is applied to other trials (when the interest period is set properly) the instances will not have the correct time stamps. 5.8.6 Importing Interest Area File (for a specific trial) Interest areas from a file can be imported and applied to a specific trial. 1) Click the Import Interest Area File button ( ) on the toolbar of the trial view
window 2) In the Load dialog box, browse to the location of the interest area file that you want
to import and select it. 3) Click Load.
EyeLink Data Viewer 2002-2014 SR Research Ltd. 49
The interest areas imported from the file will be added on top of the existing interest areas in the trial. For dynamic interest areas, the start and end time will be mapped relative to the currently selected interest period. If no interest period is created for the session, the default “Full Trial Period” will be used. 5.8.7 Emptying an Interest Area Set To empty the current interest area set for a trial: 1) Click on the target trial in the tree view whose interest areas are to be emptied 2) In the property panel of the trial, find the entry “Interest Area Set” and choose
“Empty Interest Area”. Existing interest areas in a recording session file or a group of trials can be similarly cleared by setting the “Default Interest Area Set” entry of the property table to “Empty Interest Area Set”. 5.8.8 Loading Interest Area Templates If the same interest areas are used across a group of trials, instead of repeating the procedure of creating interest areas for each individual trial, an interest area template can be used to supply the interest area information to a group of trials. To import an interest area template file into a viewing session: 1) From the application menu, choose:
File −> Import Data −> Interest Area Template 2) In the Load dialog box, browse to the location of the interest area (.ias) file(s) that
you want to import and select it/them. 3) Click Load.
The interest area template files imported will be listed in the “Interest Area Template” section, which is at the bottom of the tree view in the Inspector window.
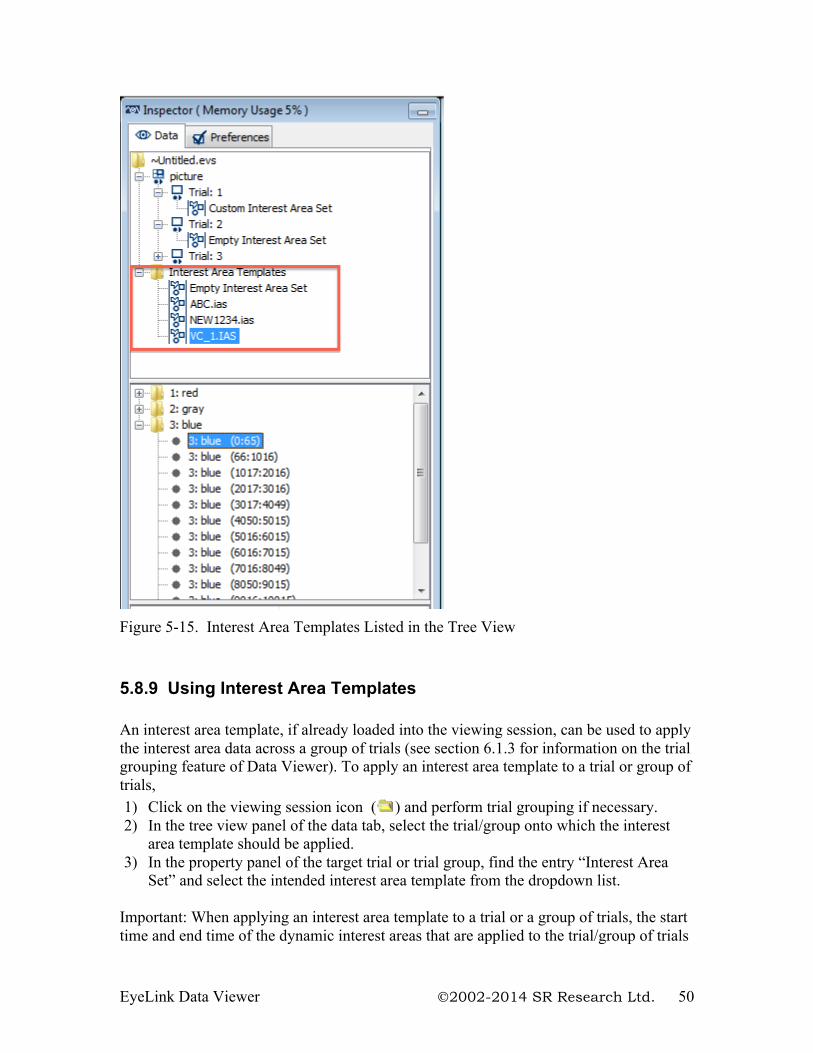
EyeLink Data Viewer 2002-2014 SR Research Ltd. 50
Figure 5-15. Interest Area Templates Listed in the Tree View
5.8.9 Using Interest Area Templates An interest area template, if already loaded into the viewing session, can be used to apply the interest area data across a group of trials (see section 6.1.3 for information on the trial grouping feature of Data Viewer). To apply an interest area template to a trial or group of trials, 1) Click on the viewing session icon ( ) and perform trial grouping if necessary. 2) In the tree view panel of the data tab, select the trial/group onto which the interest
area template should be applied. 3) In the property panel of the target trial or trial group, find the entry “Interest Area
Set” and select the intended interest area template from the dropdown list. Important: When applying an interest area template to a trial or a group of trials, the start time and end time of the dynamic interest areas that are applied to the trial/group of trials
EyeLink Data Viewer 2002-2014 SR Research Ltd. 51
will be set relative to the currently selected interest period. If no interest period is created for the viewing session, the default “Full Trial Period” will be used. So it is very important that a proper interest period be created and selected before applying interest area templates containing dynamic interest areas to a trial or group of trials!
5.8.10 Deleting Interest Area Templates Interest area templates can be deleted from the template list. In the tree view panel of the Inspector window, find the "Interest Area Templates" folder where all of the interest area templates are located. Select the target interest area template from the list, click the right mouse button, and select "Delete". If the deleted interest area template is used by a trial, the "Interest Area Set" property of that trial will be set to "Empty Interest Area Set" and existing interest areas will be removed.
5.8.11 Selecting Interest Areas To select an interest area or an instance of a dynamic interest area, place the mouse cursor over the interest area in the tree view window and click the left mouse button. The interest area is highlighted in both the trial view window and the event list. To select more than one interest area, hold down the CTRL key on Windows or the Command key ⌘ on Mac OS X and select the target area by left-clicking - repeat until all of the desired interest areas are selected. If all of the interest areas in a trial are to be selected, simply click the Select All Visible Items button ( ) on the toolbar (or click the right mouse button and select “Select All”). Selection can also be made from the event list in the inspector window by clicking on the “Custom Interest Area Set” node of the trial in the tree view and selecting the interest areas from the event list panel. The selected interest area will be highlighted in the trial view window. When an instance of a dynamic interest area is selected from the event list, the playtime of the animation view will be set to the start time of that instance. Note: If you are not able to select any interest area or instance, please make sure none of the interest area shape buttons ( , , or ) are active. You may press the Selection mode icon ( ) from the toolbar of the trial view window to stop creating interest areas. If there are eye events within the interest area to be selected, clicking on the interest area may end up selecting the eye events instead. To make a more precise interest area selection, you may toggle off the visibility of the eye events first, make the interest area selection, and then toggle the visibility of the eye events back on if desired. 5.8.12 Copying and Pasting Interest Areas A new interest area can be created by copying and then pasting an existing one. Select the target interest area, click on the right mouse button, choose the “Copy” option from the
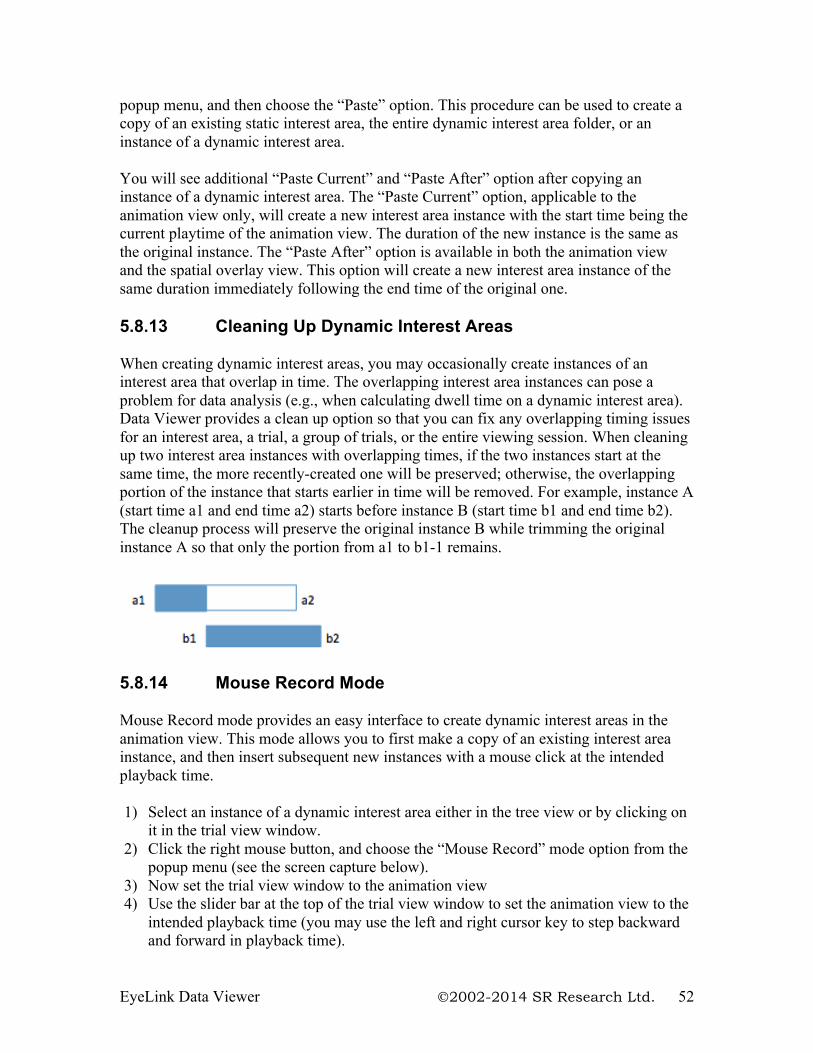
EyeLink Data Viewer 2002-2014 SR Research Ltd. 52
popup menu, and then choose the “Paste” option. This procedure can be used to create a copy of an existing static interest area, the entire dynamic interest area folder, or an instance of a dynamic interest area. You will see additional “Paste Current” and “Paste After” option after copying an instance of a dynamic interest area. The “Paste Current” option, applicable to the animation view only, will create a new interest area instance with the start time being the current playtime of the animation view. The duration of the new instance is the same as the original instance. The “Paste After” option is available in both the animation view and the spatial overlay view. This option will create a new interest area instance of the same duration immediately following the end time of the original one. 5.8.13 Cleaning Up Dynamic Interest Areas When creating dynamic interest areas, you may occasionally create instances of an interest area that overlap in time. The overlapping interest area instances can pose a problem for data analysis (e.g., when calculating dwell time on a dynamic interest area). Data Viewer provides a clean up option so that you can fix any overlapping timing issues for an interest area, a trial, a group of trials, or the entire viewing session. When cleaning up two interest area instances with overlapping times, if the two instances start at the same time, the more recently-created one will be preserved; otherwise, the overlapping portion of the instance that starts earlier in time will be removed. For example, instance A (start time a1 and end time a2) starts before instance B (start time b1 and end time b2). The cleanup process will preserve the original instance B while trimming the original instance A so that only the portion from a1 to b1-1 remains.
5.8.14 Mouse Record Mode Mouse Record mode provides an easy interface to create dynamic interest areas in the animation view. This mode allows you to first make a copy of an existing interest area instance, and then insert subsequent new instances with a mouse click at the intended playback time. 1) Select an instance of a dynamic interest area either in the tree view or by clicking on
it in the trial view window. 2) Click the right mouse button, and choose the “Mouse Record” mode option from the
popup menu (see the screen capture below). 3) Now set the trial view window to the animation view 4) Use the slider bar at the top of the trial view window to set the animation view to the
intended playback time (you may use the left and right cursor key to step backward and forward in playback time).
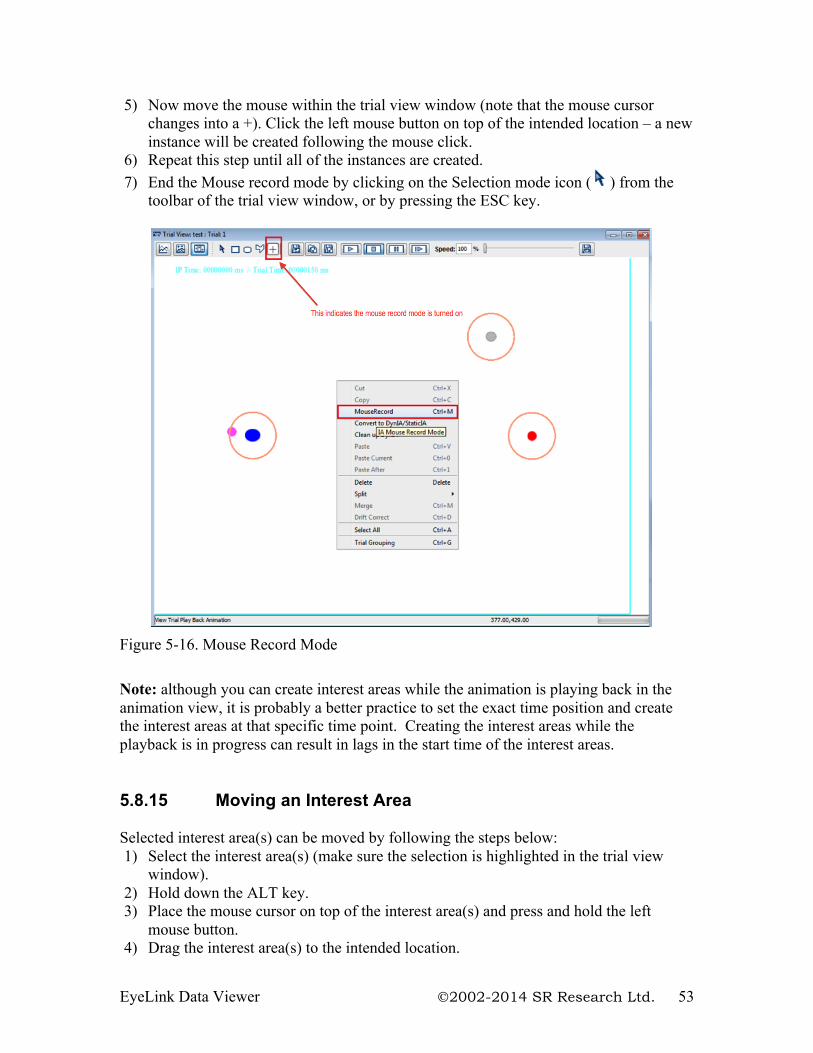
EyeLink Data Viewer 2002-2014 SR Research Ltd. 53
5) Now move the mouse within the trial view window (note that the mouse cursor changes into a +). Click the left mouse button on top of the intended location – a new instance will be created following the mouse click.
6) Repeat this step until all of the instances are created. 7) End the Mouse record mode by clicking on the Selection mode icon ( ) from the
toolbar of the trial view window, or by pressing the ESC key.
Figure 5-16. Mouse Record Mode
Note: although you can create interest areas while the animation is playing back in the animation view, it is probably a better practice to set the exact time position and create the interest areas at that specific time point. Creating the interest areas while the playback is in progress can result in lags in the start time of the interest areas. 5.8.15 Moving an Interest Area Selected interest area(s) can be moved by following the steps below: 1) Select the interest area(s) (make sure the selection is highlighted in the trial view
window). 2) Hold down the ALT key. 3) Place the mouse cursor on top of the interest area(s) and press and hold the left
mouse button. 4) Drag the interest area(s) to the intended location.
EyeLink Data Viewer 2002-2014 SR Research Ltd. 54
5) Release the mouse button. The position of the selected interest area(s) can also be adjusted by pressing the left, right, up, and down keys while holding down the ALT key.
5.8.16 Resizing Rectangular and Elliptical Interest Areas A rectangular or elliptical interest area can be resized by following these steps: 1) Select the interest area (make sure the selection is highlighted in the trial view
window). 2) Hold down the ALT key. 3) Place the mouse over the edge to be dragged (the arrow cursor changes into a sizing
cursor ó). 4) Press the left mouse button and drag the edge to the desired location. 5) Release the mouse button.
To carry out a more precise adjustment for a rectangular or elliptical interest area: 1) Select the interest area to move or adjust. 2) In the property panel of the interest area, select the entry for “Left” and type in the
desired x-coordinate of left-most edge. 3) Select the entry for “Top” and type in the desired y-coordinate of top-most edge. 4) Select the entry for “Right” and type in the desired x-coordinate of right-most edge. 5) Select the entry for “Bottom” and type in the desired y-coordinate of bottom-most
edge.
Please note that the coordinates must be made such that the “Left” value will be smaller than the “Right” value and the “Top” value will be smaller than the “Bottom” value.
5.8.17 Resizing Freehand Interest Areas A freehand interest area can be resized by following these steps: 1) Select the interest area (make sure the selection is highlighted in the trial view
window). 2) Hold the ALT key down. 3) Place the mouse over the vertex to be moved (the move cursor changes into a hand
cursor and a red circle is drawn on top of the vertex). 4) Press the left mouse button and drag the vertex to the desired location. 1) Release the mouse button.
5.8.18 Adding a Point to a Freehand Interest Area To add a new point to a freehand interest area: 1) Select the interest area (make sure the selection is highlighted in the trial view
window)
EyeLink Data Viewer 2002-2014 SR Research Ltd. 55
2) Hold the ALT key down. 3) Place the mouse over the existing edge where a point will be added (the arrow cursor
changes into a hand cursor ) 4) Press the left mouse button. A new vertex will be created. 5) Now move the newly added vertex to the intended location.
5.8.19 Deleting an Existing Point from a Freehand Interest Area To remove an existing point from a freehand interest area: 1) Select the interest area (make sure the selection is highlighted in the trial view
window) 2) Hold the ALT key down. 3) Place the mouse over the vertex to be removed (the arrow cursor changes into a hand
cursor and a red circle is drawn on the vertex). 4) Click on the right mouse button, and choose the “Delete” option from the popup
menu. 5) When the delete confirmation dialog box is displayed (“Do you want to delete the
selected point from the Freehand Interest Area”), choose “Yes”. Data Viewer will automatically join the two points around the deleted one.
5.8.20 Deleting Interest Areas To delete interest areas: 1) First toggle off all of the eye event visibility buttons in the application toolbar so that
interest areas can be deleted without removing any eye events within them. 2) Select the interest areas to be deleted. 3) Press the right mouse button. 4) Select the Delete option from the popup menu. 5) Confirm that the IAs should be deleted.
Interest areas can also be deleted by clicking the Delete Selected Items button ( ) or the Cut Selected Item button ( ) on the application toolbar. 5.8.21 Splitting Interest Areas Rectangular and elliptical interest areas can be split either horizontally or vertically. To split an interest area: 1) Select the interest area to split. 2) Press the right mouse button. 3) Select “Split” and then “Horizontally” or “Vertically” from the popup menu.
When splitting an instance of a dynamic interest area, the duration of the instance is split as well - one of the newly created instances takes the first half of the original duration and the other takes the second half of the duration.
EyeLink Data Viewer 2002-2014 SR Research Ltd. 56
5.8.22 Merging Interest Areas / Instances of a Dynamic Interest Area
Two selected rectangular or elliptical interest areas can be merged in the following way: 1) Click "Toggle Fixation Event Visibility" button ( ) on the application toolbar to
turn off the fixation visibility so that fixation events will not be merged. 2) Press the CTRL key on Windows or the Command key ⌘ on Mac OS X to select the
interest areas to be merged. 3) Click the right mouse button to bring up a popup menu, select "Merge" from the list.
Multiple instances of a dynamic interest area can also be merged. The start time of the newly created instance will be the start of the earliest instance and the end time will be end of the latest instance
5.8.23 Conversion between a Static Interest Area and a Dynamic
Interest Area Unlike a static interest area, a dynamic interest area consists of one or multiple instances, each of which has a start time and end time. Data Viewer supports the conversion between these two types of interest areas: instances of a dynamic interest area can be converted into static interest areas by removing the start time and end time whereas a static interest area can be converted into a dynamic one, with the start time being 0 and end time being the duration of the trial. The conversion process preserves the spatial coordinate of the original interest area. 5.8.24 Examples of Creating Dynamic Interest Areas in a Viewing
Session This section briefly summarizes various methods of creating dynamic interest areas using the example given at the beginning of the Chapter. A fixation screen (with a “FIXATION_SCREEN” message written to the EDF file) is shown for 1000 ms before a display screen (with a “SYNCTIME” message) is presented with a red object appearing at (674, 546, 774, 646). The object moves to (462, 634, 562, 734) at time 800 ms after its onset, to (249, 546, 349, 646) at 1600 ms, and to (162, 334, 262, 434) at time 2400 ms and stays there for 800 ms before a blank screen is shown (with a “BLANK_SCREEN” message). A dynamic interest area of four instances can be coded (shown below) to describe the behavior of the red object, assuming that we create an interest period starting from the onset of the SYNCTIME screen. 0 -799 RECTANGLE 2 674 546 774 646 red -800 -1599 RECTANGLE 2 462 634 562 734 red -1600 -2399 RECTANGLE 2 249 546 349 646 red -2400 -3199 RECTANGLE 2 162 334 262 434 red
EyeLink Data Viewer 2002-2014 SR Research Ltd. 57
There are several possible ways to create the instances of this dynamic interest area. Regardless of the method chosen, the first step would be creating an interest period and selecting it as the active interest period. 1) Click the "Interest Period List" combo box at the far-right hand of the application
menu bar and select "Edit …". 2) Click the New button ( ) on the interest period manager dialog box. 3) In the general tab, enter a label for the current interest period in the label edit box and
choose "Message Event" in the “Type” drop-down list. 4) Now click on the "Details" tab. Set the "Start Time Message Text" as "SYNCTIME"
and "End Time Message Text" as "BLANK_SCREEN" (both message texts are case-sensitive without quotation marks).
5) Close the Interest Period Editor dialog. The "Interest Period List" combo box should now display the label of the newly created interest period.
Next, create the first instance of the interest area following the steps discussed in section “3. Manually Creating Interest Areas”. In the property table of the interest area instance, set the “Left” value to 674, “Top” to 546, “Right” to 774, “Bottom” to 646, “Start Time relative to IP” to 0, and “End Time relative to IP” to 799. The subsequent interest area instances can be created using one of the methods described below. Method 1: Manual Creation in Animation View Set the trial view window to the animation view, as this view is useful for displaying, creating, and editing of instances of a dynamic interest area. You may play back the trial to the intended interest period time and manually draw each of the subsequent instances (please note that the top-left corner of the animation view displays both the current playback time relative to the currently selected interest period and to the start time of the trial). The coordinate, start time and end time can be adjusted through the property table of the instances. Method 2: Copy and Paste First copy the existing instance either from the event list in the Inspector Window or by clicking on it in the overlay / animation view and then paste it. If needed, for the newly created instance, edit the “left”, “top”, “right”, “bottom”, “Start Time relative to IP”, and “End Time relative to IP” fields in the property table of the instance (the position of the interest area can also be adjusted by holding down the ALT key and then dragging it to the intended position). Repeat this process until all of the instances are created. Method 3: Copy and Paste Current First copy the existing interest area instance. Set the trial view window to the animation view and play back the trial to the intended interest period time (you may first drag the indicator on the slider at the top of the trial view window, and then use the left/right arrow key to get to the precise playback time). Now click the right mouse button and choose the “Paste Current” option. A new instance with proper time stamps will be created. You can adjust the position of the instance by holding down the ALT key and dragging the instance to its intended location, or by editing the “left”, “top”, “right”,
EyeLink Data Viewer 2002-2014 SR Research Ltd. 58
“bottom” values in the property table of the instance. Repeat this process until all of the instances are created. Method 4: Mouse Creation mode in animation view First copy the existing interest area instance. Click on the right mouse button and choose the “Mouse Creation” option. Set the trial view window to the animation view and play back the trial to the intended interest period time (you may first drag the indicator on the slider at the top of the trial view window, and then use the left/right arrow key to get to the precise playback time). Now place the mouse cursor on top of the intended location and click the left mouse button – a new instance will be created following the mouse click. Repeat this process until all of the instances are created. It may take some time for you to create the interest area instances for the very first recording file. Once the interest areas are saved into an .ias file, you can import that .ias file into the viewing session and use it as a template for subsequent similar trials across recording sessions. 5.8.25 Output Reports and Preferences Version 2.0 of EyeLink Data Viewer supports report creation for both static and dynamic interest areas. However, dynamic interest areas introduce a number of complexities to data analysis. For example, you may run into scenarios where a single fixation lands in multiple interest areas. Some Data Viewer variables (e.g., the "CURRENT_FIX_INTEREST_AREA_INDEX" variable in the Fixation Report) require a fixation to be assigned to a single interest area. If a fixation lands in multiple dynamic interest areas, by default, this assignment will be based on the duration of fixation on respective interest areas - the interest area with the longest duration gets the fixation assignment. Occasionally, users may want to do the fixation assignment based on the index of the interest areas. This can be configured through the preference setting “Preferences -> Output/analysis -> Assign fixations to dynamic IA ordered by relative duration". The default value is true, so to assign fixations by interest area index, uncheck this option to set it to false. Another related issue when a fixation lands in multiple interest areas is the calculation of actual dwell time on each of the interest areas and fixation count. Data Viewer has an “Include Fixation in Single IA” option in “Preferences -> Output/analysis”. When selected, the fixation is assigned to one of the interest areas only (see the above paragraph on how the “winning” interest area is determined) - the interest area assigned gets the full length of the fixation when calculating dwell times. If this option is disabled (default setting), the fixation can be assigned to multiple interest areas, and effective duration (the total amount of time that fixation and instances of the same IA intersect) for each of the interest areas is used for the calculation of dwell times. This option will affect the calculation of some variables in the Fixation Report (e.g., CURRENT_FIX_INTEREST_AREAS, CURRENT_FIX_INTEREST_AREA_DWELL_TIME, etc.) and Interest Area Report (e.g., IA_DWELL_TIME, IA_FIXATION_COUNT, etc.). The following table illustrates
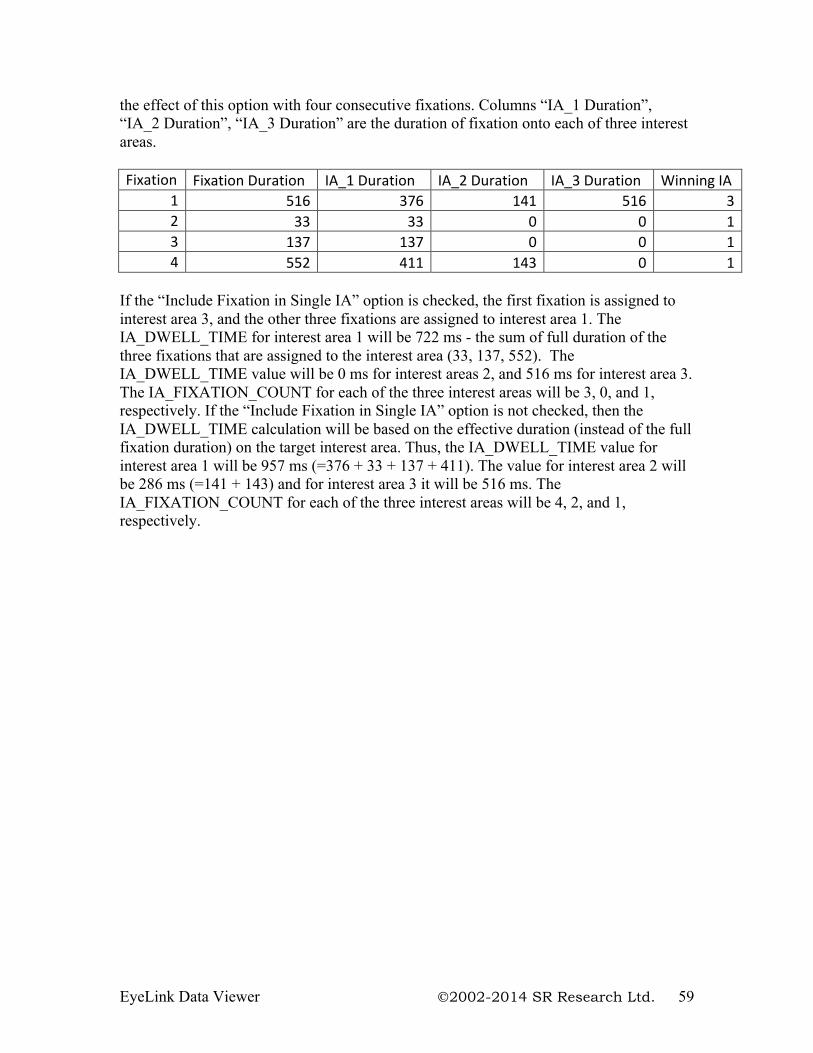
EyeLink Data Viewer 2002-2014 SR Research Ltd. 59
the effect of this option with four consecutive fixations. Columns “IA_1 Duration”, “IA_2 Duration”, “IA_3 Duration” are the duration of fixation onto each of three interest areas. Fixation Fixation Duration IA_1 Duration IA_2 Duration IA_3 Duration Winning IA
1 516 376 141 516 3 2 33 33 0 0 1 3 137 137 0 0 1 4 552 411 143 0 1
If the “Include Fixation in Single IA” option is checked, the first fixation is assigned to interest area 3, and the other three fixations are assigned to interest area 1. The IA_DWELL_TIME for interest area 1 will be 722 ms - the sum of full duration of the three fixations that are assigned to the interest area (33, 137, 552). The IA_DWELL_TIME value will be 0 ms for interest areas 2, and 516 ms for interest area 3. The IA_FIXATION_COUNT for each of the three interest areas will be 3, 0, and 1, respectively. If the “Include Fixation in Single IA” option is not checked, then the IA_DWELL_TIME calculation will be based on the effective duration (instead of the full fixation duration) on the target interest area. Thus, the IA_DWELL_TIME value for interest area 1 will be 957 ms (=376 + 33 + 137 + 411). The value for interest area 2 will be 286 ms (=141 + 143) and for interest area 3 it will be 516 ms. The IA_FIXATION_COUNT for each of the three interest areas will be 4, 2, and 1, respectively.
EyeLink Data Viewer 2002-2014 SR Research Ltd. 60
6 Data Analysis and Output One of the ultimate goals of the EyeLink Data Viewer is to let you extract useful eye-movement information and export data to a tab-delimited text file that can be processed by most statistical packages. Before performing any data analysis, the first question you may ask yourself is what part of the recording data you need to look at? Do you need to analyze the eye movement data for the entire recording trial or just a small portion of it? For example, you conducted a reading experiment in which each trial displays a sentence followed by a comprehension question for the sentence just read. Do you need to look at the portion of eye movement data when the subject was answering the comprehension question? If not, you may create an interest period for the reading part (i.e., from the onset of the reading screen to the onset of the comprehension questions) and then select the intended interest period. In some experimemts, you may create a reaction time period. The reaction time definition is a special variant of interest period filter in the sense that it reports the duration and end-event data in the Trial Report in addition to the data filtering capability. Next, you will need to deterimine which report is appropriate for your analysis. EyeLink Data Viewer organizes the output reports based on different analysis emphasis. If you care about the summary statistics for a recording trial (e.g., how long is the trial recording, how many fixations were made in each of the trials?), the Trial Report is ideal for it. The Fixation Report, Saccade Report, and Sample Report provide detailed eye movement measures for each of the fixation, saccade events, or the individual eye samples. The Interest Area Report provides a columnar output for the eye-movement data related to each of the interest areas. The message report provides an output for each of the message events recorded in the data file with the corresponding fixation/saccade event. While most of the research questions can be answered by extracting and analyzing the data from one or several of those reports, it is possible that in some cases you will need to write some extra analysis code to further process the report outputs. When performing analysis, you may organize each of the viewing sessions by loading one or multiple EDF files. The settings from one viewing session (a "template") can be exported to different viewing sessions. Thus the user may go through each of the output reports to configure the selection of variables in an intended order. Export the variable selection into a property file by clicking on the "Export Variable Selection" button. For all future viewing sessions, the variable selection in the reports can be automated by importing the previously saved property file (by clicking on the "Import Variable Selection" button). The export/import feature is similarly available to the interest period definitions and properties of the viewing session. 6.1 Managing Trial Variables
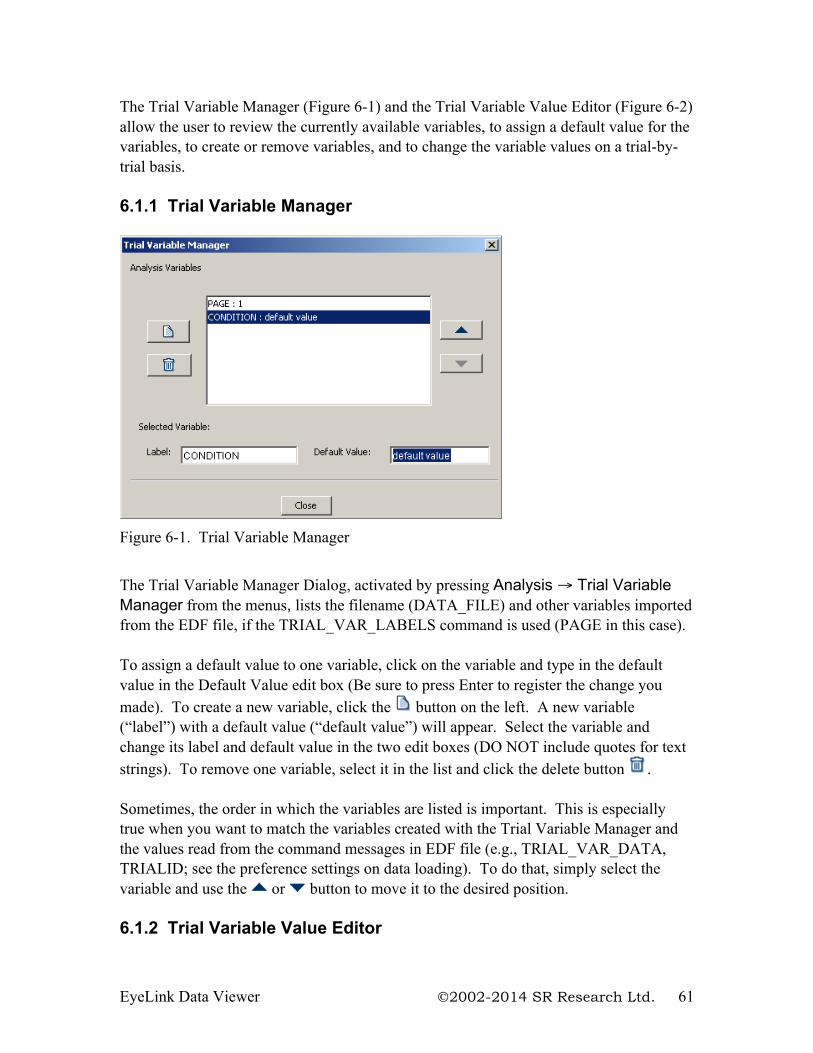
EyeLink Data Viewer 2002-2014 SR Research Ltd. 61
The Trial Variable Manager (Figure 6-1) and the Trial Variable Value Editor (Figure 6-2) allow the user to review the currently available variables, to assign a default value for the variables, to create or remove variables, and to change the variable values on a trial-by-trial basis. 6.1.1 Trial Variable Manager
Figure 6-1. Trial Variable Manager
The Trial Variable Manager Dialog, activated by pressing Analysis → Trial Variable Manager from the menus, lists the filename (DATA_FILE) and other variables imported from the EDF file, if the TRIAL_VAR_LABELS command is used (PAGE in this case).
To assign a default value to one variable, click on the variable and type in the default value in the Default Value edit box (Be sure to press Enter to register the change you made). To create a new variable, click the button on the left. A new variable (“label”) with a default value (“default value”) will appear. Select the variable and change its label and default value in the two edit boxes (DO NOT include quotes for text strings). To remove one variable, select it in the list and click the delete button . Sometimes, the order in which the variables are listed is important. This is especially true when you want to match the variables created with the Trial Variable Manager and the values read from the command messages in EDF file (e.g., TRIAL_VAR_DATA, TRIALID; see the preference settings on data loading). To do that, simply select the variable and use the or button to move it to the desired position. 6.1.2 Trial Variable Value Editor
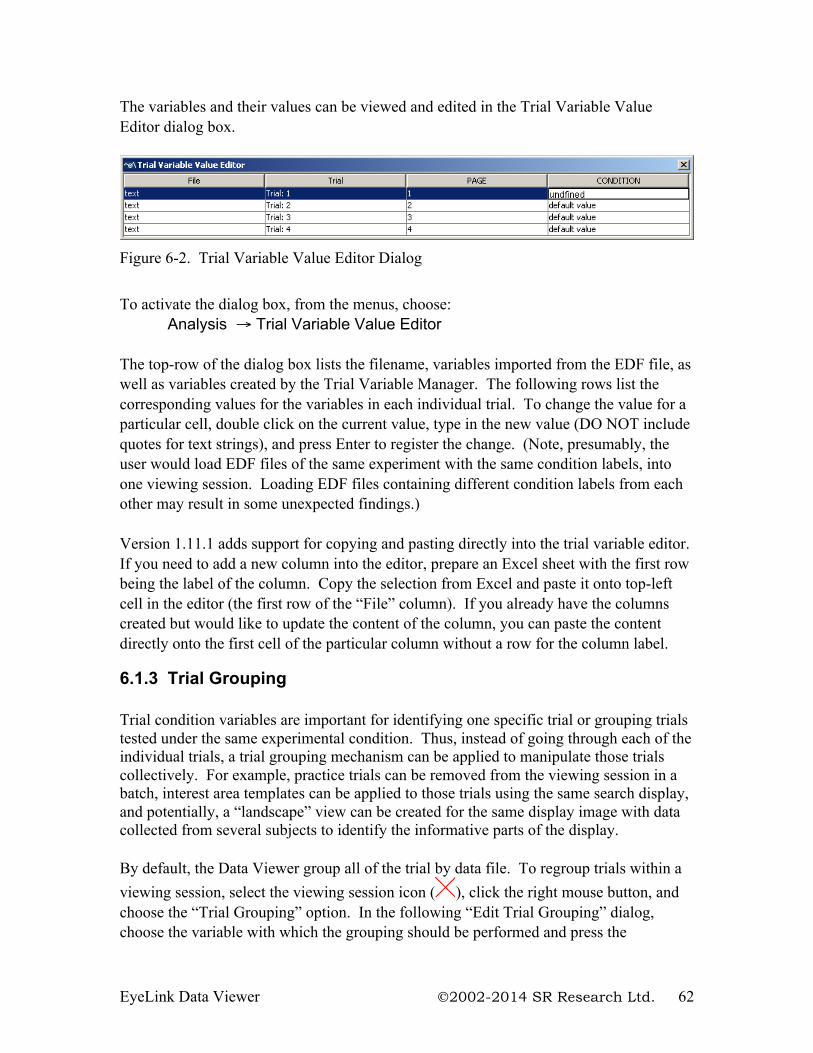
EyeLink Data Viewer 2002-2014 SR Research Ltd. 62
The variables and their values can be viewed and edited in the Trial Variable Value Editor dialog box.
Figure 6-2. Trial Variable Value Editor Dialog
To activate the dialog box, from the menus, choose: Analysis → Trial Variable Value Editor The top-row of the dialog box lists the filename, variables imported from the EDF file, as well as variables created by the Trial Variable Manager. The following rows list the corresponding values for the variables in each individual trial. To change the value for a particular cell, double click on the current value, type in the new value (DO NOT include quotes for text strings), and press Enter to register the change. (Note, presumably, the user would load EDF files of the same experiment with the same condition labels, into one viewing session. Loading EDF files containing different condition labels from each other may result in some unexpected findings.) Version 1.11.1 adds support for copying and pasting directly into the trial variable editor. If you need to add a new column into the editor, prepare an Excel sheet with the first row being the label of the column. Copy the selection from Excel and paste it onto top-left cell in the editor (the first row of the “File” column). If you already have the columns created but would like to update the content of the column, you can paste the content directly onto the first cell of the particular column without a row for the column label.
6.1.3 Trial Grouping Trial condition variables are important for identifying one specific trial or grouping trials tested under the same experimental condition. Thus, instead of going through each of the individual trials, a trial grouping mechanism can be applied to manipulate those trials collectively. For example, practice trials can be removed from the viewing session in a batch, interest area templates can be applied to those trials using the same search display, and potentially, a “landscape” view can be created for the same display image with data collected from several subjects to identify the informative parts of the display. By default, the Data Viewer group all of the trial by data file. To regroup trials within a viewing session, select the viewing session icon ( ), click the right mouse button, and choose the “Trial Grouping” option. In the following “Edit Trial Grouping” dialog, choose the variable with which the grouping should be performed and press the
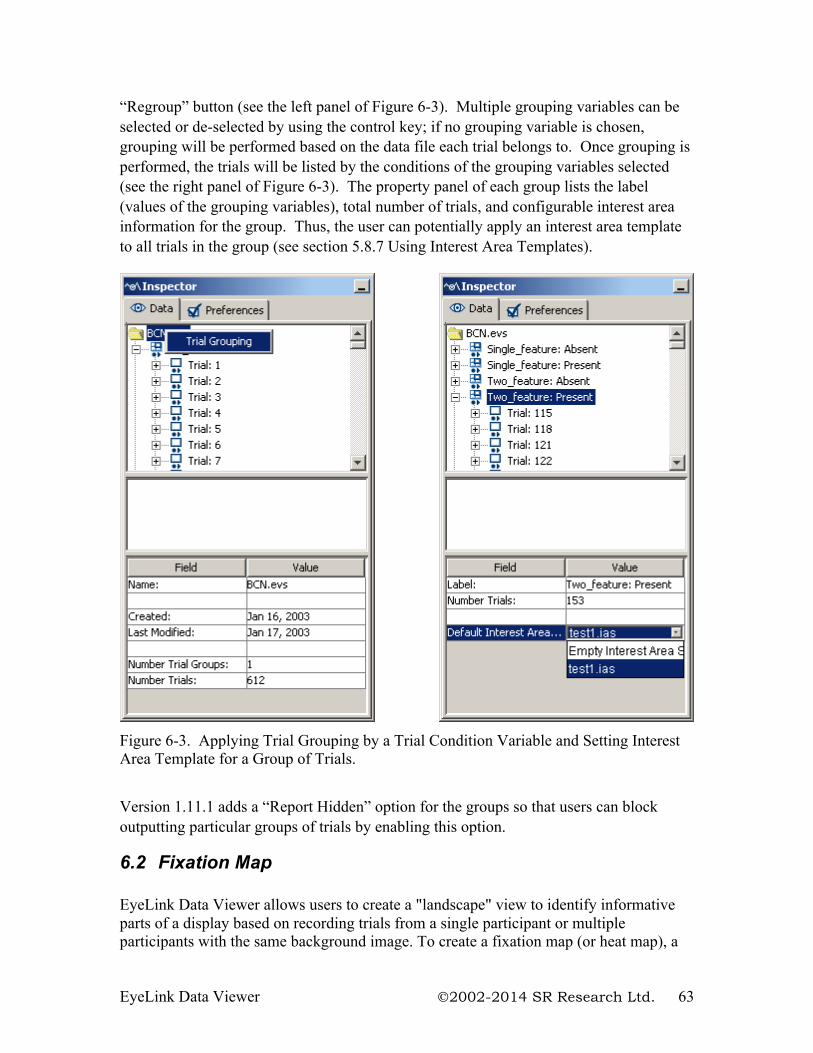
EyeLink Data Viewer 2002-2014 SR Research Ltd. 63
“Regroup” button (see the left panel of Figure 6-3). Multiple grouping variables can be selected or de-selected by using the control key; if no grouping variable is chosen, grouping will be performed based on the data file each trial belongs to. Once grouping is performed, the trials will be listed by the conditions of the grouping variables selected (see the right panel of Figure 6-3). The property panel of each group lists the label (values of the grouping variables), total number of trials, and configurable interest area information for the group. Thus, the user can potentially apply an interest area template to all trials in the group (see section 5.8.7 Using Interest Area Templates).
Figure 6-3. Applying Trial Grouping by a Trial Condition Variable and Setting Interest Area Template for a Group of Trials.
Version 1.11.1 adds a “Report Hidden” option for the groups so that users can block outputting particular groups of trials by enabling this option.
6.2 Fixation Map EyeLink Data Viewer allows users to create a "landscape" view to identify informative parts of a display based on recording trials from a single participant or multiple participants with the same background image. To create a fixation map (or heat map), a
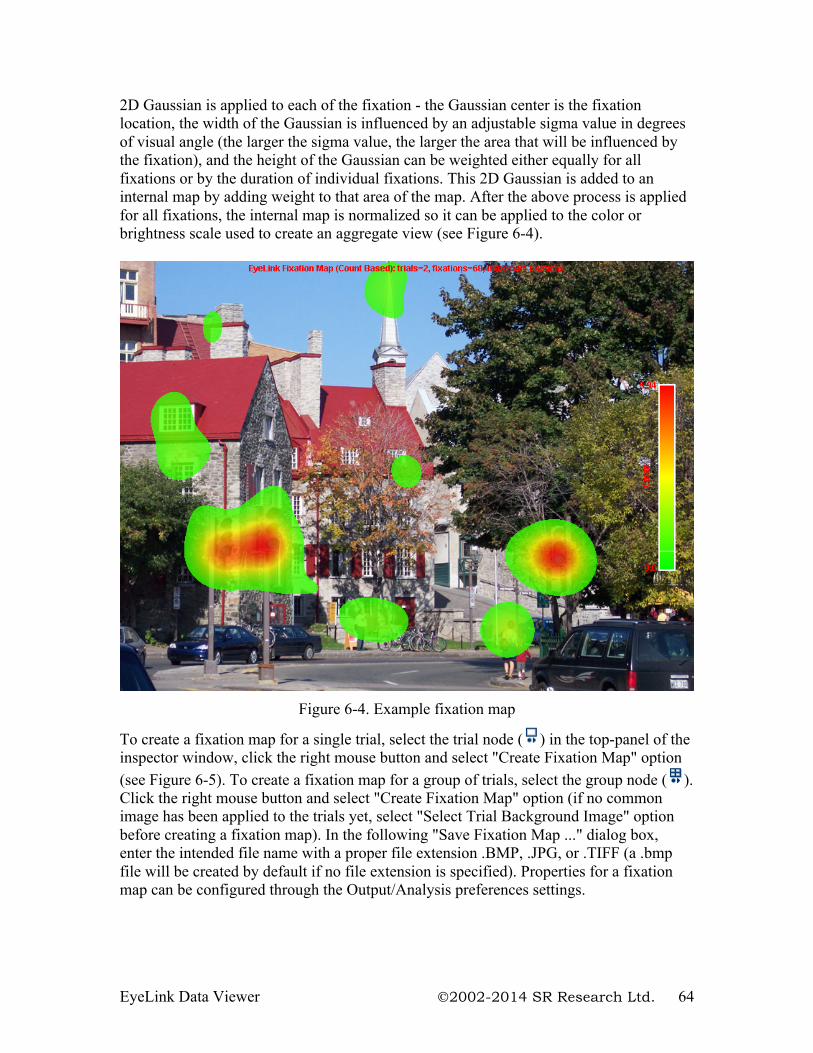
EyeLink Data Viewer 2002-2014 SR Research Ltd. 64
2D Gaussian is applied to each of the fixation - the Gaussian center is the fixation location, the width of the Gaussian is influenced by an adjustable sigma value in degrees of visual angle (the larger the sigma value, the larger the area that will be influenced by the fixation), and the height of the Gaussian can be weighted either equally for all fixations or by the duration of individual fixations. This 2D Gaussian is added to an internal map by adding weight to that area of the map. After the above process is applied for all fixations, the internal map is normalized so it can be applied to the color or brightness scale used to create an aggregate view (see Figure 6-4).
Figure 6-4. Example fixation map
To create a fixation map for a single trial, select the trial node ( ) in the top-panel of the inspector window, click the right mouse button and select "Create Fixation Map" option (see Figure 6-5). To create a fixation map for a group of trials, select the group node ( ). Click the right mouse button and select "Create Fixation Map" option (if no common image has been applied to the trials yet, select "Select Trial Background Image" option before creating a fixation map). In the following "Save Fixation Map ..." dialog box, enter the intended file name with a proper file extension .BMP, .JPG, or .TIFF (a .bmp file will be created by default if no file extension is specified). Properties for a fixation map can be configured through the Output/Analysis preferences settings.
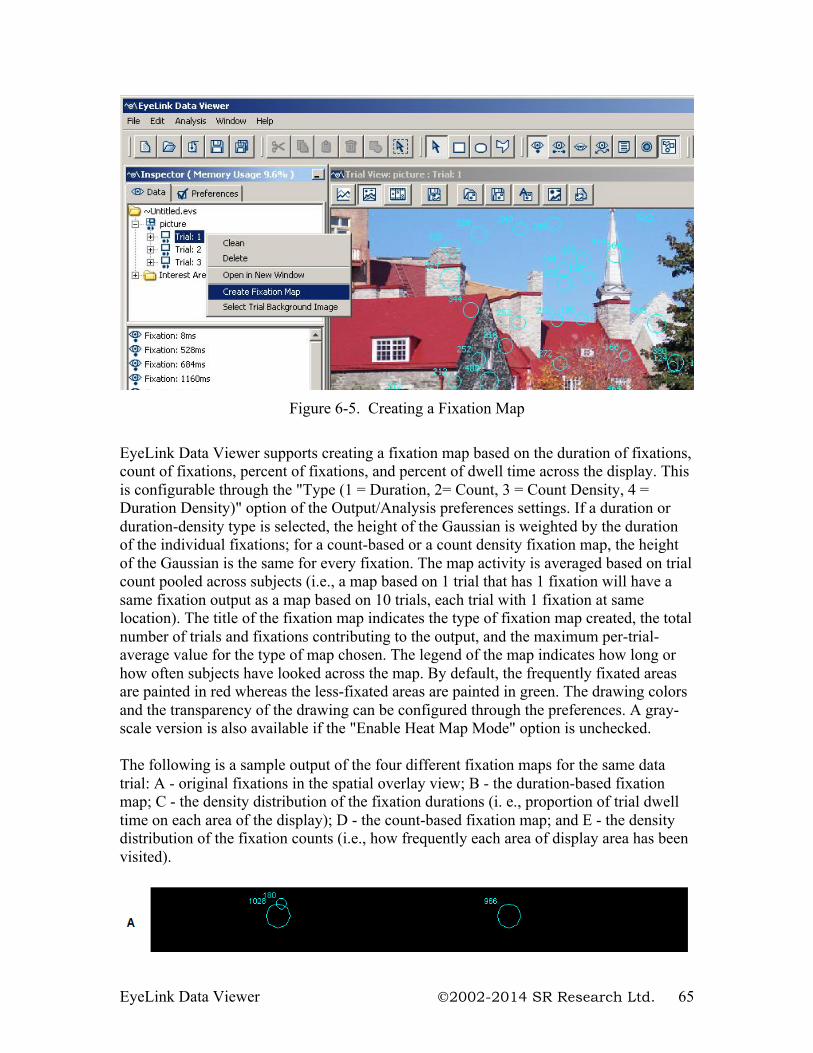
EyeLink Data Viewer 2002-2014 SR Research Ltd. 65
Figure 6-5. Creating a Fixation Map
EyeLink Data Viewer supports creating a fixation map based on the duration of fixations, count of fixations, percent of fixations, and percent of dwell time across the display. This is configurable through the "Type (1 = Duration, 2= Count, 3 = Count Density, 4 = Duration Density)" option of the Output/Analysis preferences settings. If a duration or duration-density type is selected, the height of the Gaussian is weighted by the duration of the individual fixations; for a count-based or a count density fixation map, the height of the Gaussian is the same for every fixation. The map activity is averaged based on trial count pooled across subjects (i.e., a map based on 1 trial that has 1 fixation will have a same fixation output as a map based on 10 trials, each trial with 1 fixation at same location). The title of the fixation map indicates the type of fixation map created, the total number of trials and fixations contributing to the output, and the maximum per-trial-average value for the type of map chosen. The legend of the map indicates how long or how often subjects have looked across the map. By default, the frequently fixated areas are painted in red whereas the less-fixated areas are painted in green. The drawing colors and the transparency of the drawing can be configured through the preferences. A gray-scale version is also available if the "Enable Heat Map Mode" option is unchecked. The following is a sample output of the four different fixation maps for the same data trial: A - original fixations in the spatial overlay view; B - the duration-based fixation map; C - the density distribution of the fixation durations (i. e., proportion of trial dwell time on each area of the display); D - the count-based fixation map; and E - the density distribution of the fixation counts (i.e., how frequently each area of display area has been visited).
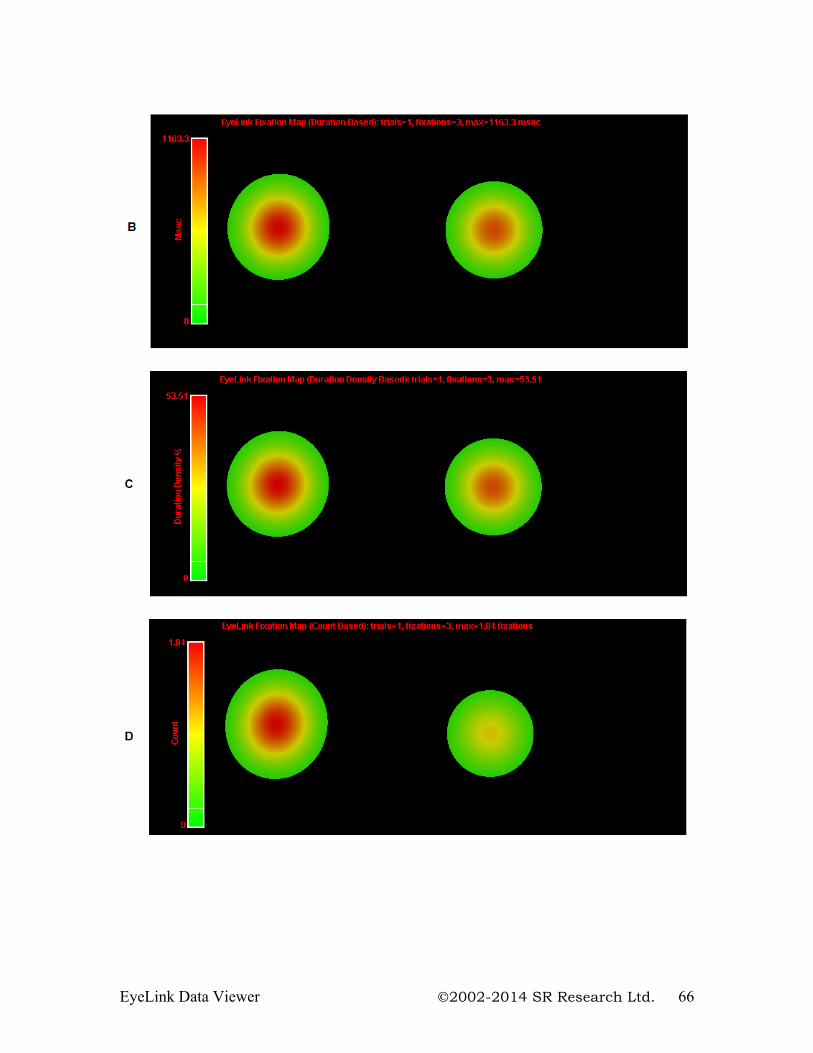
EyeLink Data Viewer 2002-2014 SR Research Ltd. 66
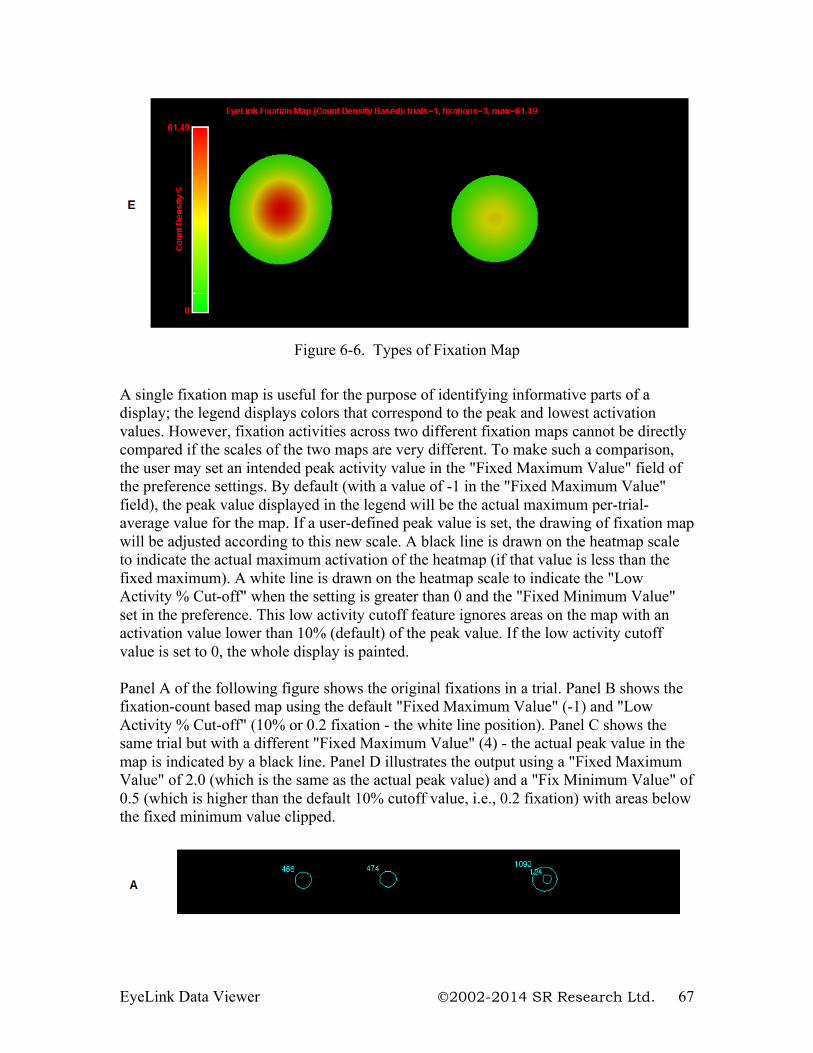
EyeLink Data Viewer 2002-2014 SR Research Ltd. 67
Figure 6-6. Types of Fixation Map
A single fixation map is useful for the purpose of identifying informative parts of a display; the legend displays colors that correspond to the peak and lowest activation values. However, fixation activities across two different fixation maps cannot be directly compared if the scales of the two maps are very different. To make such a comparison, the user may set an intended peak activity value in the "Fixed Maximum Value" field of the preference settings. By default (with a value of -1 in the "Fixed Maximum Value" field), the peak value displayed in the legend will be the actual maximum per-trial-average value for the map. If a user-defined peak value is set, the drawing of fixation map will be adjusted according to this new scale. A black line is drawn on the heatmap scale to indicate the actual maximum activation of the heatmap (if that value is less than the fixed maximum). A white line is drawn on the heatmap scale to indicate the "Low Activity % Cut-off" when the setting is greater than 0 and the "Fixed Minimum Value" set in the preference. This low activity cutoff feature ignores areas on the map with an activation value lower than 10% (default) of the peak value. If the low activity cutoff value is set to 0, the whole display is painted. Panel A of the following figure shows the original fixations in a trial. Panel B shows the fixation-count based map using the default "Fixed Maximum Value" (-1) and "Low Activity % Cut-off" (10% or 0.2 fixation - the white line position). Panel C shows the same trial but with a different "Fixed Maximum Value" (4) - the actual peak value in the map is indicated by a black line. Panel D illustrates the output using a "Fixed Maximum Value" of 2.0 (which is the same as the actual peak value) and a "Fix Minimum Value" of 0.5 (which is higher than the default 10% cutoff value, i.e., 0.2 fixation) with areas below the fixed minimum value clipped.
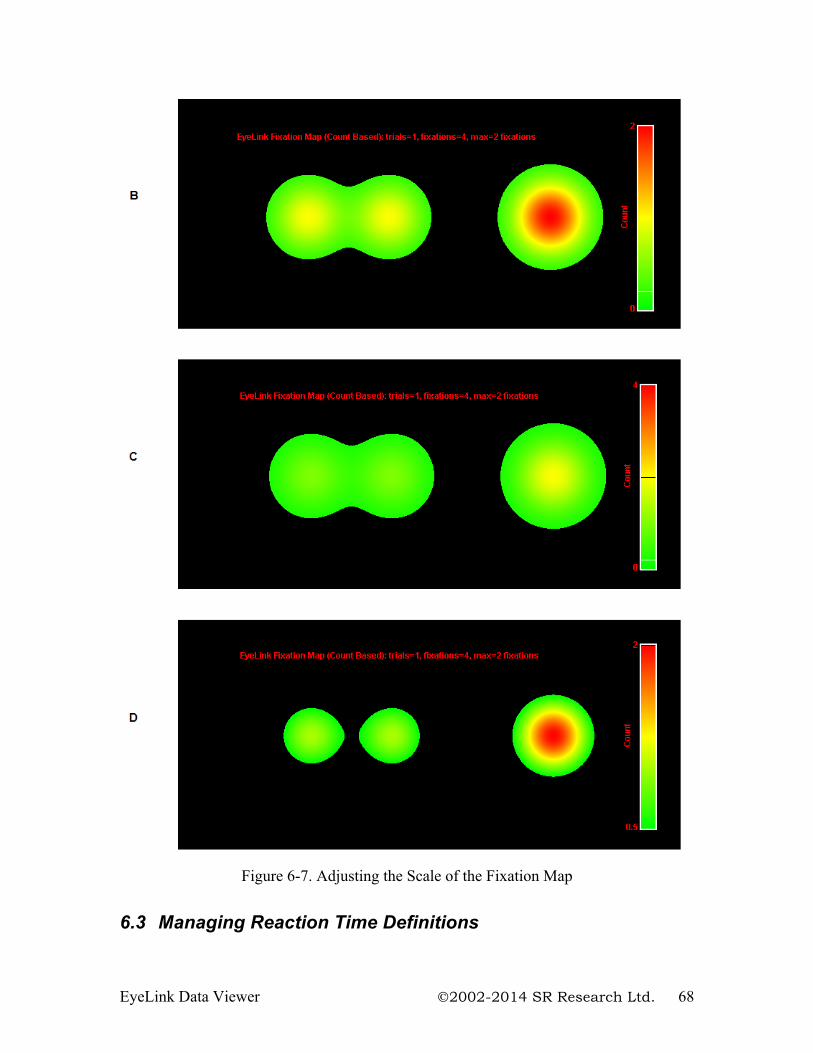
EyeLink Data Viewer 2002-2014 SR Research Ltd. 68
Figure 6-7. Adjusting the Scale of the Fixation Map
6.3 Managing Reaction Time Definitions
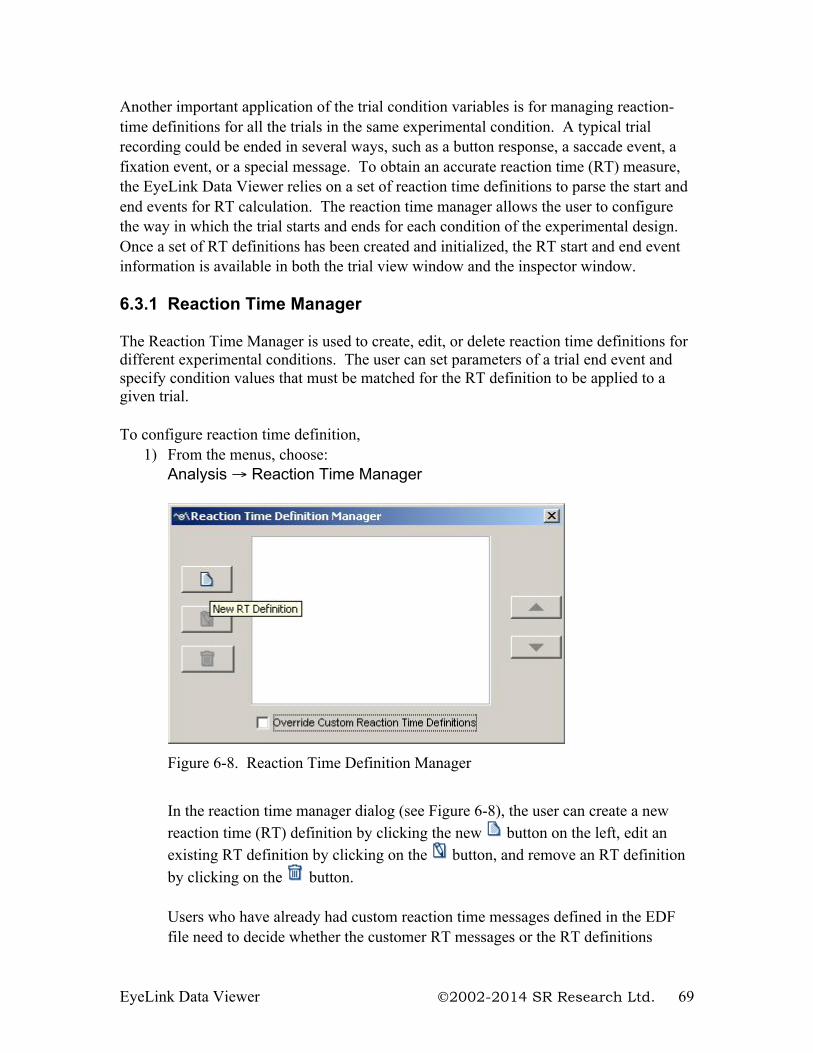
EyeLink Data Viewer 2002-2014 SR Research Ltd. 69
Another important application of the trial condition variables is for managing reaction-time definitions for all the trials in the same experimental condition. A typical trial recording could be ended in several ways, such as a button response, a saccade event, a fixation event, or a special message. To obtain an accurate reaction time (RT) measure, the EyeLink Data Viewer relies on a set of reaction time definitions to parse the start and end events for RT calculation. The reaction time manager allows the user to configure the way in which the trial starts and ends for each condition of the experimental design. Once a set of RT definitions has been created and initialized, the RT start and end event information is available in both the trial view window and the inspector window. 6.3.1 Reaction Time Manager The Reaction Time Manager is used to create, edit, or delete reaction time definitions for different experimental conditions. The user can set parameters of a trial end event and specify condition values that must be matched for the RT definition to be applied to a given trial. To configure reaction time definition,
1) From the menus, choose: Analysis → Reaction Time Manager
Figure 6-8. Reaction Time Definition Manager
In the reaction time manager dialog (see Figure 6-8), the user can create a new reaction time (RT) definition by clicking the new button on the left, edit an existing RT definition by clicking on the button, and remove an RT definition by clicking on the button. Users who have already had custom reaction time messages defined in the EDF file need to decide whether the customer RT messages or the RT definitions
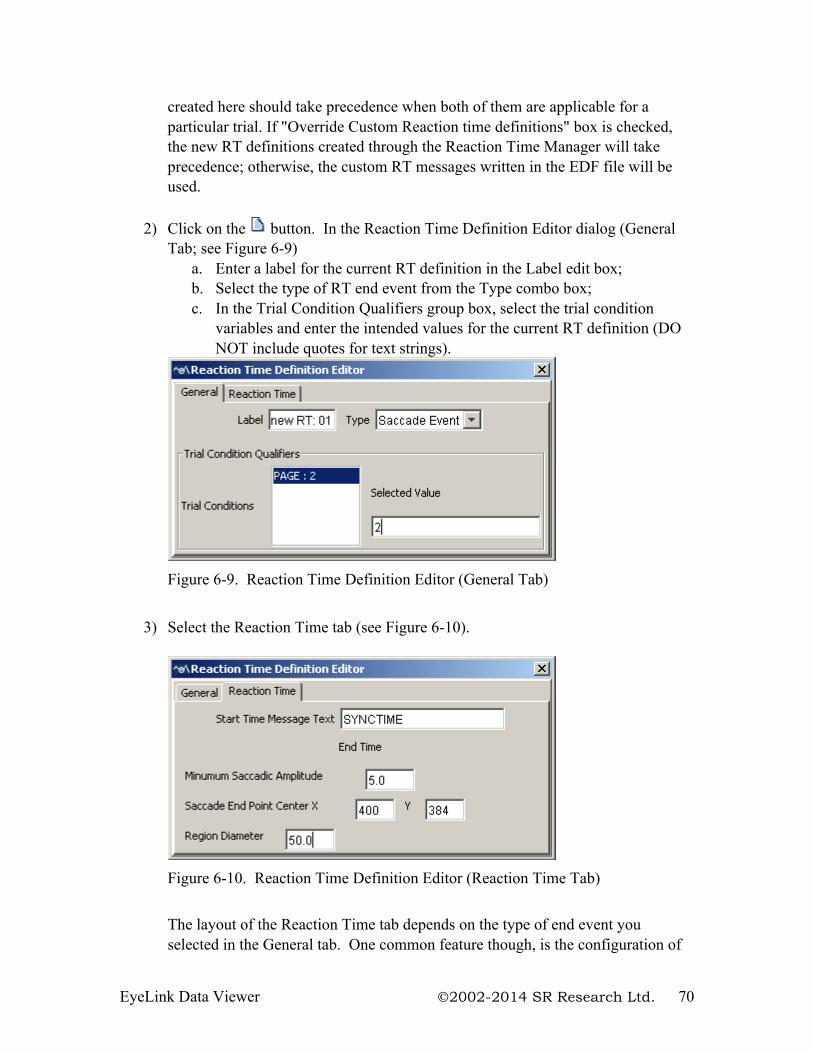
EyeLink Data Viewer 2002-2014 SR Research Ltd. 70
created here should take precedence when both of them are applicable for a particular trial. If "Override Custom Reaction time definitions" box is checked, the new RT definitions created through the Reaction Time Manager will take precedence; otherwise, the custom RT messages written in the EDF file will be used.
2) Click on the button. In the Reaction Time Definition Editor dialog (General Tab; see Figure 6-9)
a. Enter a label for the current RT definition in the Label edit box; b. Select the type of RT end event from the Type combo box; c. In the Trial Condition Qualifiers group box, select the trial condition
variables and enter the intended values for the current RT definition (DO NOT include quotes for text strings).
Figure 6-9. Reaction Time Definition Editor (General Tab)
3) Select the Reaction Time tab (see Figure 6-10).
Figure 6-10. Reaction Time Definition Editor (Reaction Time Tab)
The layout of the Reaction Time tab depends on the type of end event you selected in the General tab. One common feature though, is the configuration of
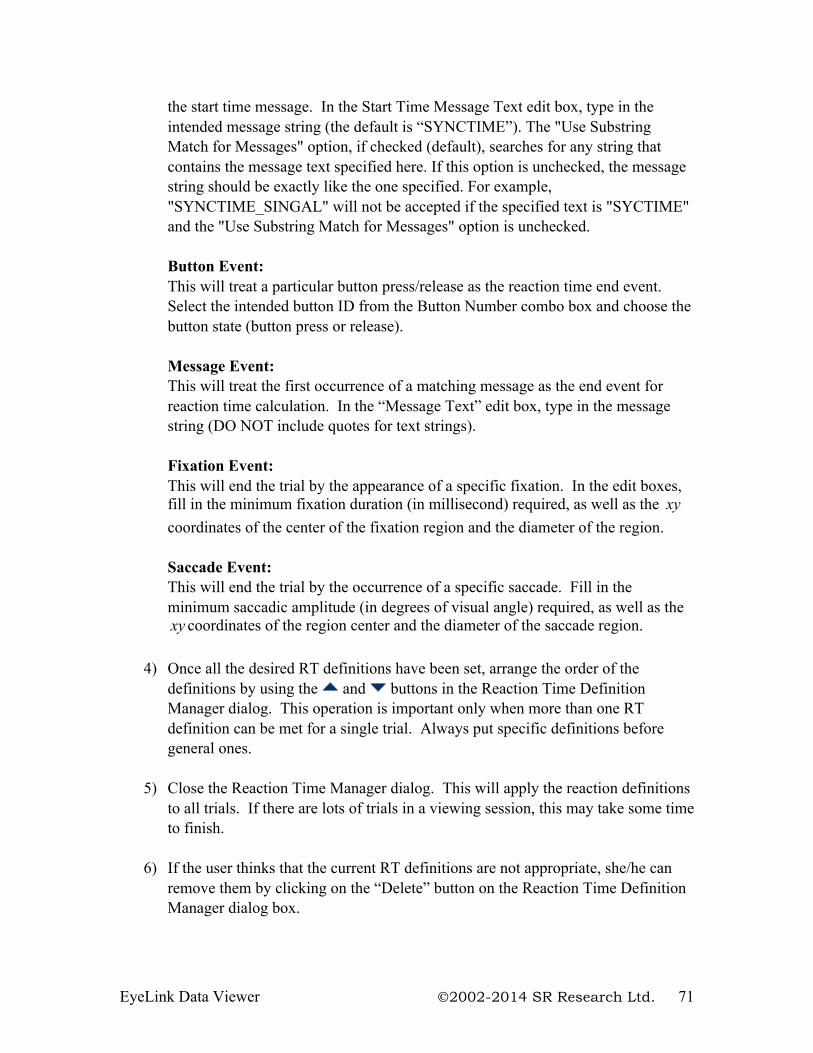
EyeLink Data Viewer 2002-2014 SR Research Ltd. 71
the start time message. In the Start Time Message Text edit box, type in the intended message string (the default is “SYNCTIME”). The "Use Substring Match for Messages" option, if checked (default), searches for any string that contains the message text specified here. If this option is unchecked, the message string should be exactly like the one specified. For example, "SYNCTIME_SINGAL" will not be accepted if the specified text is "SYCTIME" and the "Use Substring Match for Messages" option is unchecked. Button Event: This will treat a particular button press/release as the reaction time end event. Select the intended button ID from the Button Number combo box and choose the button state (button press or release).
Message Event: This will treat the first occurrence of a matching message as the end event for reaction time calculation. In the “Message Text” edit box, type in the message string (DO NOT include quotes for text strings). Fixation Event: This will end the trial by the appearance of a specific fixation. In the edit boxes, fill in the minimum fixation duration (in millisecond) required, as well as the xy coordinates of the center of the fixation region and the diameter of the region. Saccade Event: This will end the trial by the occurrence of a specific saccade. Fill in the minimum saccadic amplitude (in degrees of visual angle) required, as well as thexy coordinates of the region center and the diameter of the saccade region.
4) Once all the desired RT definitions have been set, arrange the order of the
definitions by using the and buttons in the Reaction Time Definition Manager dialog. This operation is important only when more than one RT definition can be met for a single trial. Always put specific definitions before general ones.
5) Close the Reaction Time Manager dialog. This will apply the reaction definitions
to all trials. If there are lots of trials in a viewing session, this may take some time to finish.
6) If the user thinks that the current RT definitions are not appropriate, she/he can
remove them by clicking on the “Delete” button on the Reaction Time Definition Manager dialog box.
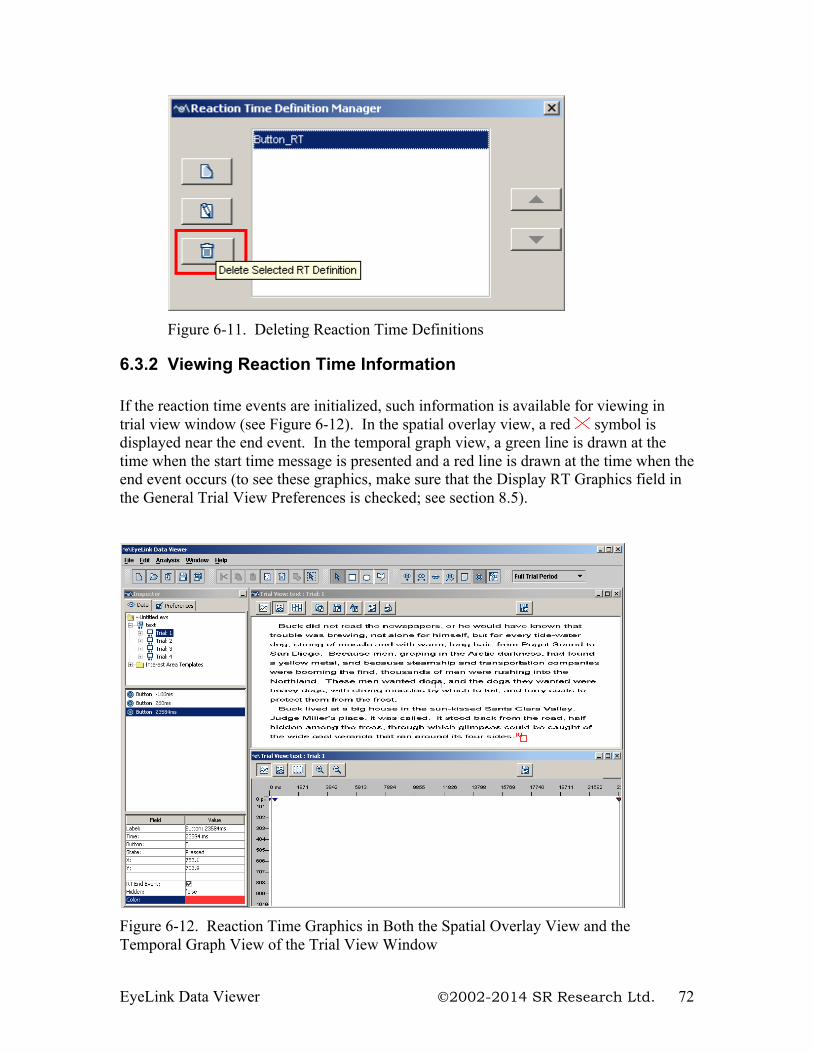
EyeLink Data Viewer 2002-2014 SR Research Ltd. 72
Figure 6-11. Deleting Reaction Time Definitions
6.3.2 Viewing Reaction Time Information If the reaction time events are initialized, such information is available for viewing in trial view window (see Figure 6-12). In the spatial overlay view, a red symbol is displayed near the end event. In the temporal graph view, a green line is drawn at the time when the start time message is presented and a red line is drawn at the time when the end event occurs (to see these graphics, make sure that the Display RT Graphics field in the General Trial View Preferences is checked; see section 8.5).
Figure 6-12. Reaction Time Graphics in Both the Spatial Overlay View and the Temporal Graph View of the Trial View Window
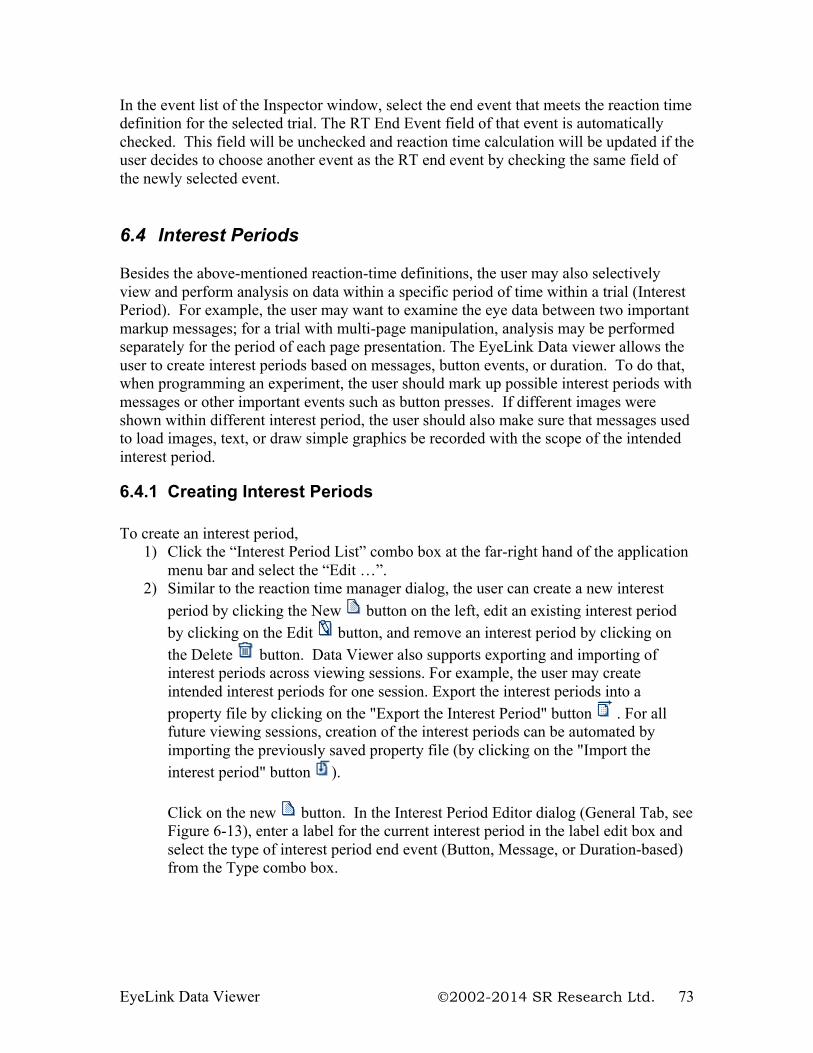
EyeLink Data Viewer 2002-2014 SR Research Ltd. 73
In the event list of the Inspector window, select the end event that meets the reaction time definition for the selected trial. The RT End Event field of that event is automatically checked. This field will be unchecked and reaction time calculation will be updated if the user decides to choose another event as the RT end event by checking the same field of the newly selected event. 6.4 Interest Periods Besides the above-mentioned reaction-time definitions, the user may also selectively view and perform analysis on data within a specific period of time within a trial (Interest Period). For example, the user may want to examine the eye data between two important markup messages; for a trial with multi-page manipulation, analysis may be performed separately for the period of each page presentation. The EyeLink Data viewer allows the user to create interest periods based on messages, button events, or duration. To do that, when programming an experiment, the user should mark up possible interest periods with messages or other important events such as button presses. If different images were shown within different interest period, the user should also make sure that messages used to load images, text, or draw simple graphics be recorded with the scope of the intended interest period.
6.4.1 Creating Interest Periods To create an interest period,
1) Click the “Interest Period List” combo box at the far-right hand of the application menu bar and select the “Edit …”.
2) Similar to the reaction time manager dialog, the user can create a new interest period by clicking the New button on the left, edit an existing interest period by clicking on the Edit button, and remove an interest period by clicking on the Delete button. Data Viewer also supports exporting and importing of interest periods across viewing sessions. For example, the user may create intended interest periods for one session. Export the interest periods into a property file by clicking on the "Export the Interest Period" button . For all future viewing sessions, creation of the interest periods can be automated by importing the previously saved property file (by clicking on the "Import the interest period" button ). Click on the new button. In the Interest Period Editor dialog (General Tab, see Figure 6-13), enter a label for the current interest period in the label edit box and select the type of interest period end event (Button, Message, or Duration-based) from the Type combo box.
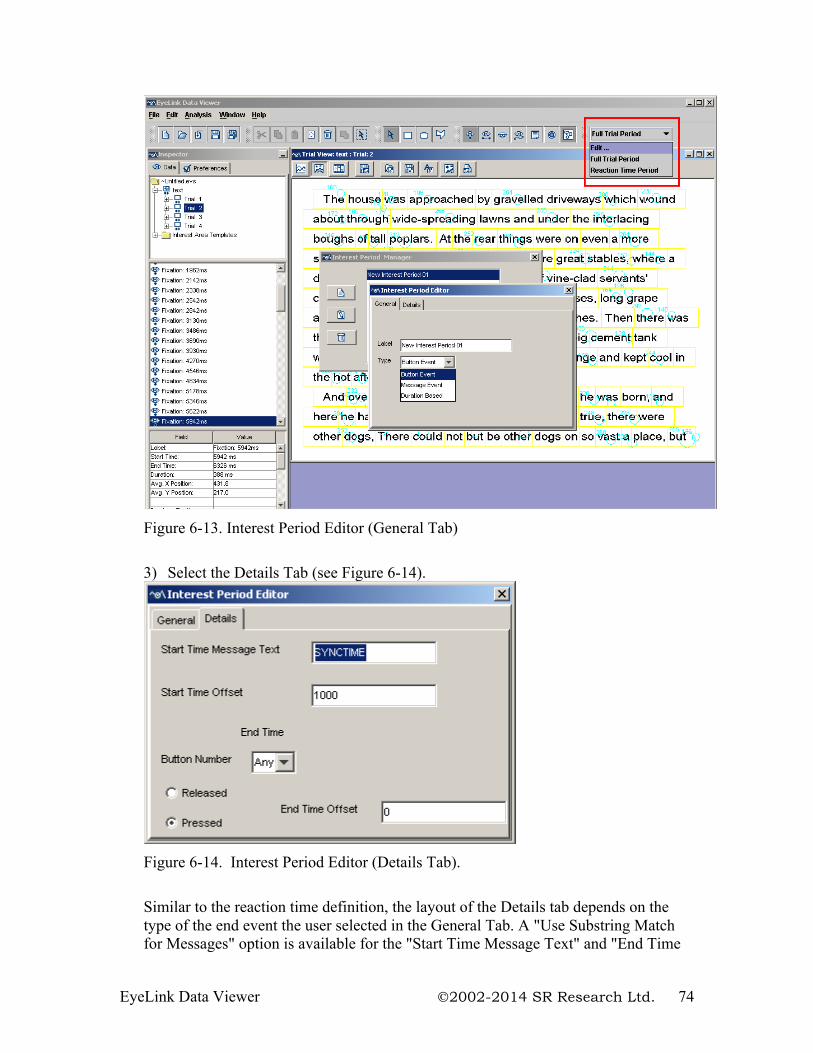
EyeLink Data Viewer 2002-2014 SR Research Ltd. 74
Figure 6-13. Interest Period Editor (General Tab) 3) Select the Details Tab (see Figure 6-14).
Figure 6-14. Interest Period Editor (Details Tab).
Similar to the reaction time definition, the layout of the Details tab depends on the type of the end event the user selected in the General Tab. A "Use Substring Match for Messages" option is available for the "Start Time Message Text" and "End Time
EyeLink Data Viewer 2002-2014 SR Research Ltd. 75
Message Text". If checked (default), Data Viewer searches for any string that contains the message text specified here. If this option is unchecked, the message string should be exactly like the one specified. For example, "SYNCTIME_SINGAL" will not be accepted if the specified text is "SYCTIME" and the "Use Substring Match for Messages" option is unchecked. Button Event: This will treat a particular button press/release as the interest period end event. In the Start Time Message Text edit box, enter the message string (case-sensitive; DO NOT include quotes for text strings); if an empty string is used, this will be the start of the trial recording. Select the intended button ID from the Button Number combo box and choose the desired button state (button pressed or released). The user can also specify a time offset (0 or a positive number in milliseconds) for the start time and end time so that the interest period does not start or end right on the time of message and/or button event. Message Event: This will treat the first occurrence of a matching message as the end event for the interest period. Enter the desire message strings for both the Start Time and End Time Message Text edit boxes (case sensitive, with no quotes for text strings); a valid message must be supplied for both start and end time message text fields. The user can also set a time offset (0 or a positive number, in milliseconds) for the start time and end time. Please note that when using this option, the interest period end message must be different from the start message; otherwise, the user should use a duration-based interest period instead (see below). Duration Based: The interest period can also be based on a duration following the detection of the start message (e.g., 10 seconds following the “SYNCTIME” message). The user needs to specify a message string (case-sensitive; DO NOT include quotes for text strings) in the Start Time Message Text edit box; if an empty string is used, this will be the start of the trial recording. The user can also specify an optional offset time value so that the interest period does not start right on the message time. In the “Duration” edit box, enter the desired duration (a positive number in milliseconds) of the interest period.
4) Close the Interest Period Editor dialog. This will initialize the interest period for all trials.
6.4.2 Using Interest Period The newly-created interest periods are added to the interest period list, along with the default interest periods – “Full Trial Period” and “Reaction Time Period”. The user can navigate between different interest periods by selecting the desired interest period from the list. For each interest period, only those events falling within that period are shown in the spatial overlay, temporal graph views, and in the event list of the inspector window.
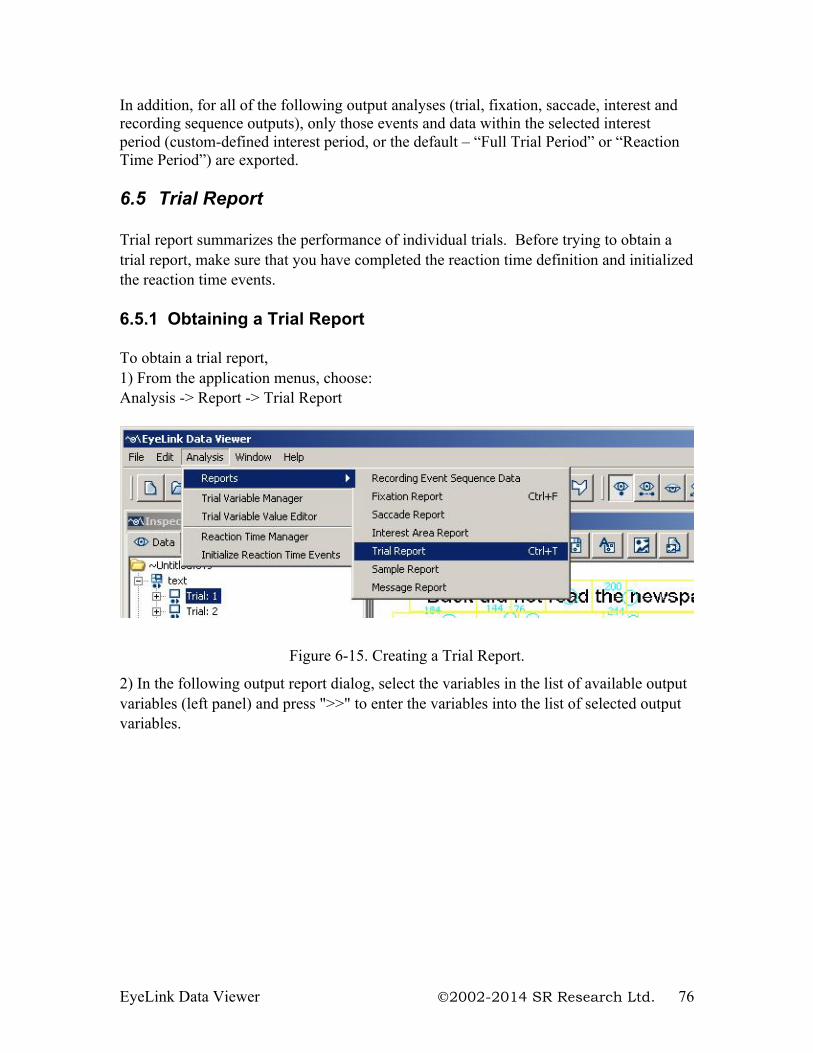
EyeLink Data Viewer 2002-2014 SR Research Ltd. 76
In addition, for all of the following output analyses (trial, fixation, saccade, interest and recording sequence outputs), only those events and data within the selected interest period (custom-defined interest period, or the default – “Full Trial Period” or “Reaction Time Period”) are exported. 6.5 Trial Report Trial report summarizes the performance of individual trials. Before trying to obtain a trial report, make sure that you have completed the reaction time definition and initialized the reaction time events. 6.5.1 Obtaining a Trial Report To obtain a trial report, 1) From the application menus, choose: Analysis -> Report -> Trial Report
Figure 6-15. Creating a Trial Report.
2) In the following output report dialog, select the variables in the list of available output variables (left panel) and press ">>" to enter the variables into the list of selected output variables.
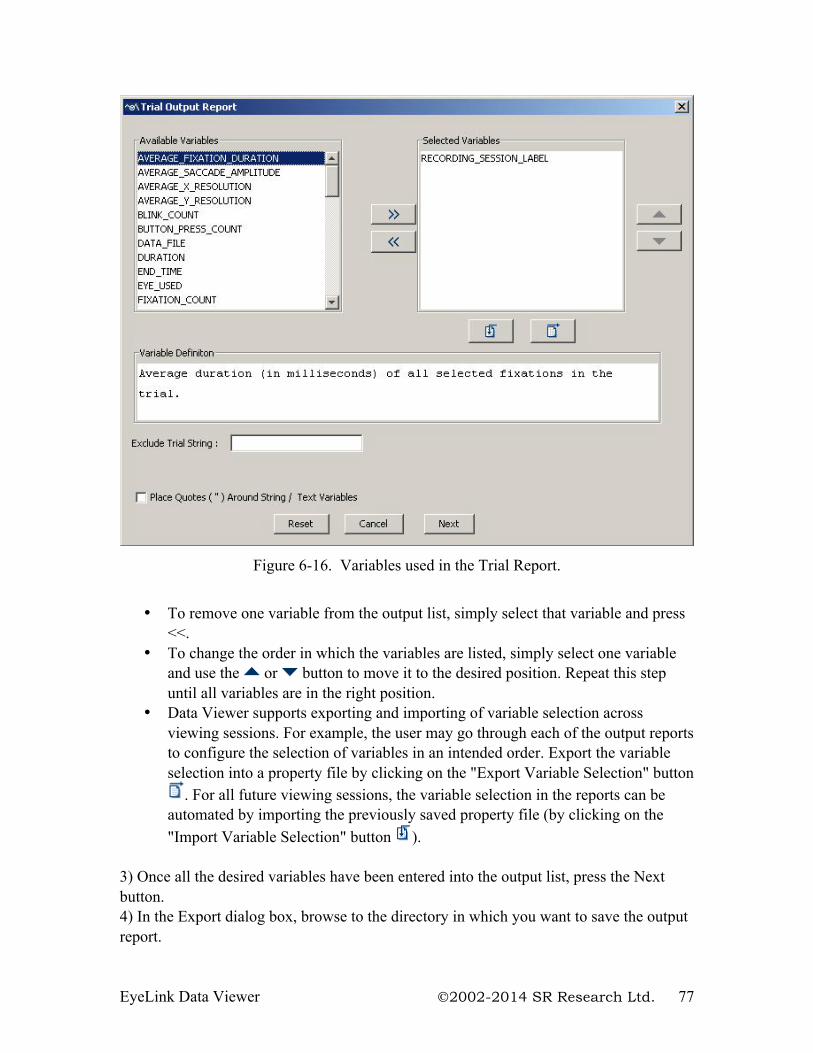
EyeLink Data Viewer 2002-2014 SR Research Ltd. 77
Figure 6-16. Variables used in the Trial Report.
• To remove one variable from the output list, simply select that variable and press
<<. • To change the order in which the variables are listed, simply select one variable
and use the or button to move it to the desired position. Repeat this step until all variables are in the right position.
• Data Viewer supports exporting and importing of variable selection across viewing sessions. For example, the user may go through each of the output reports to configure the selection of variables in an intended order. Export the variable selection into a property file by clicking on the "Export Variable Selection" button
. For all future viewing sessions, the variable selection in the reports can be automated by importing the previously saved property file (by clicking on the "Import Variable Selection" button ).
3) Once all the desired variables have been entered into the output list, press the Next button. 4) In the Export dialog box, browse to the directory in which you want to save the output report.
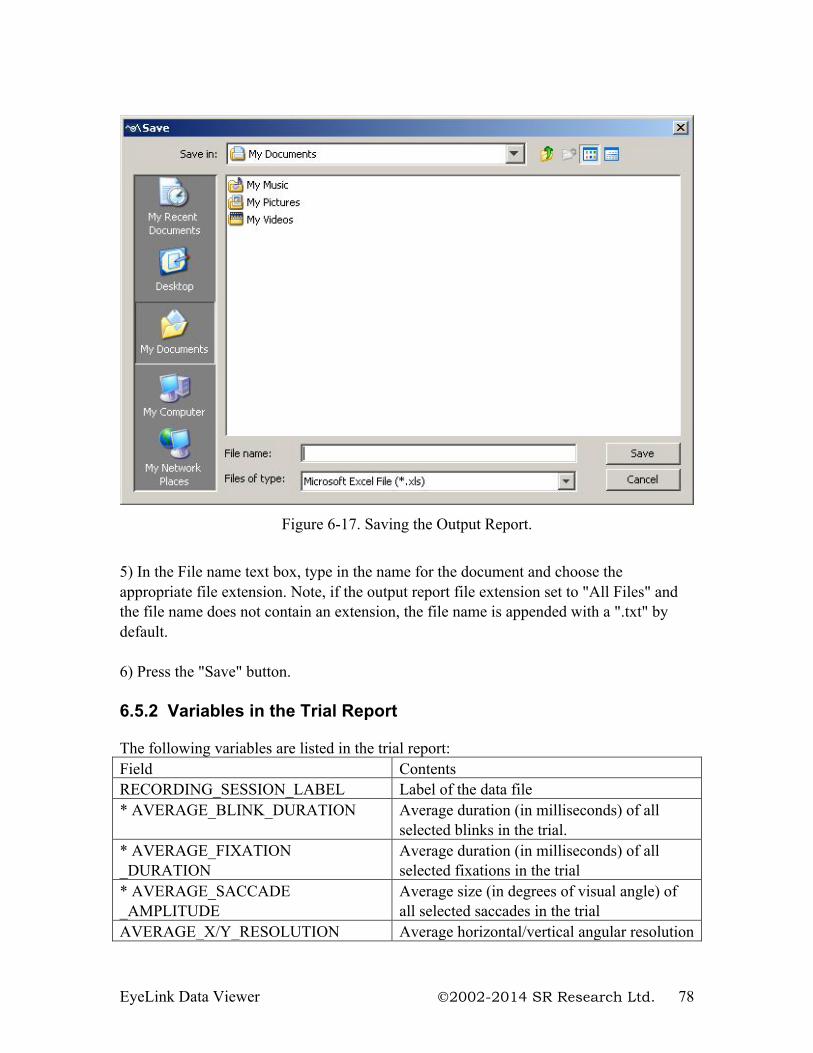
EyeLink Data Viewer 2002-2014 SR Research Ltd. 78
Figure 6-17. Saving the Output Report.
5) In the File name text box, type in the name for the document and choose the appropriate file extension. Note, if the output report file extension set to "All Files" and the file name does not contain an extension, the file name is appended with a ".txt" by default. 6) Press the "Save" button. 6.5.2 Variables in the Trial Report The following variables are listed in the trial report: Field Contents RECORDING_SESSION_LABEL Label of the data file * AVERAGE_BLINK_DURATION Average duration (in milliseconds) of all
selected blinks in the trial. * AVERAGE_FIXATION _DURATION
Average duration (in milliseconds) of all selected fixations in the trial
* AVERAGE_SACCADE _AMPLITUDE
Average size (in degrees of visual angle) of all selected saccades in the trial
AVERAGE_X/Y_RESOLUTION Average horizontal/vertical angular resolution
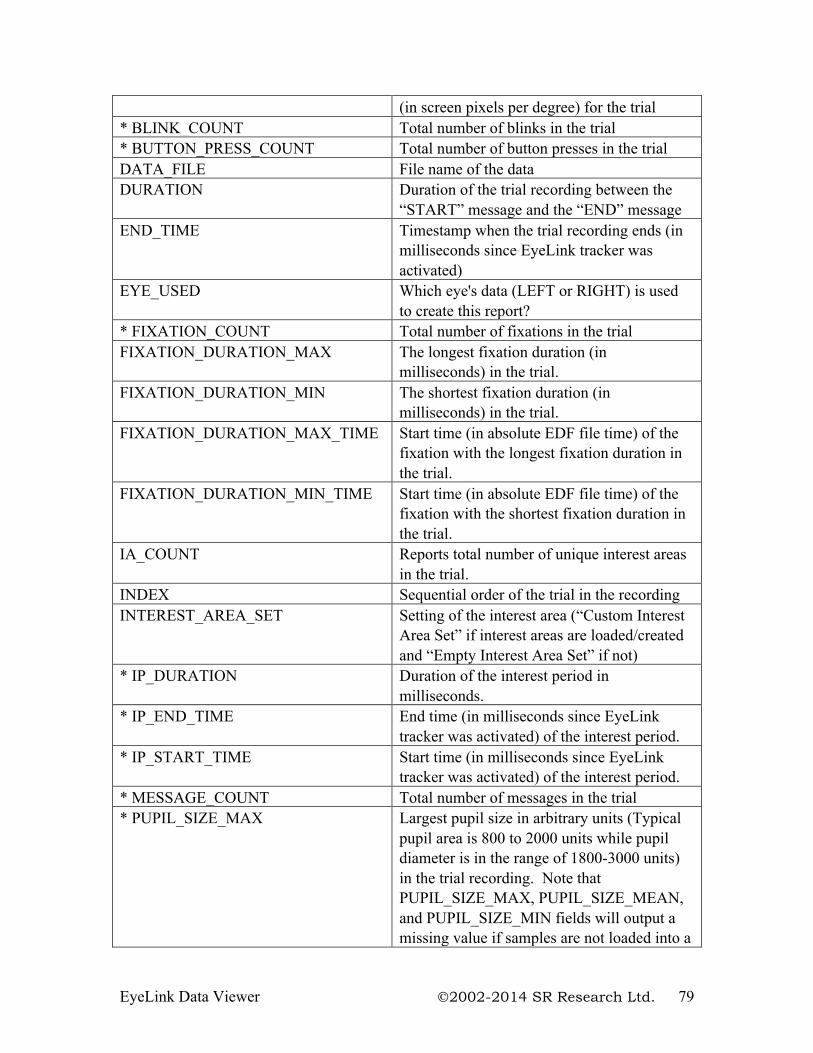
EyeLink Data Viewer 2002-2014 SR Research Ltd. 79
(in screen pixels per degree) for the trial * BLINK_COUNT Total number of blinks in the trial * BUTTON_PRESS_COUNT Total number of button presses in the trial DATA_FILE File name of the data DURATION Duration of the trial recording between the
“START” message and the “END” message END_TIME Timestamp when the trial recording ends (in
milliseconds since EyeLink tracker was activated)
EYE_USED Which eye's data (LEFT or RIGHT) is used to create this report?
* FIXATION_COUNT Total number of fixations in the trial FIXATION_DURATION_MAX
The longest fixation duration (in milliseconds) in the trial.
FIXATION_DURATION_MIN
The shortest fixation duration (in milliseconds) in the trial.
FIXATION_DURATION_MAX_TIME Start time (in absolute EDF file time) of the fixation with the longest fixation duration in the trial.
FIXATION_DURATION_MIN_TIME Start time (in absolute EDF file time) of the fixation with the shortest fixation duration in the trial.
IA_COUNT Reports total number of unique interest areas in the trial.
INDEX Sequential order of the trial in the recording INTEREST_AREA_SET Setting of the interest area (“Custom Interest
Area Set” if interest areas are loaded/created and “Empty Interest Area Set” if not)
* IP_DURATION Duration of the interest period in milliseconds.
* IP_END_TIME End time (in milliseconds since EyeLink tracker was activated) of the interest period.
* IP_START_TIME Start time (in milliseconds since EyeLink tracker was activated) of the interest period.
* MESSAGE_COUNT Total number of messages in the trial * PUPIL_SIZE_MAX Largest pupil size in arbitrary units (Typical
pupil area is 800 to 2000 units while pupil diameter is in the range of 1800-3000 units) in the trial recording. Note that PUPIL_SIZE_MAX, PUPIL_SIZE_MEAN, and PUPIL_SIZE_MIN fields will output a missing value if samples are not loaded into a
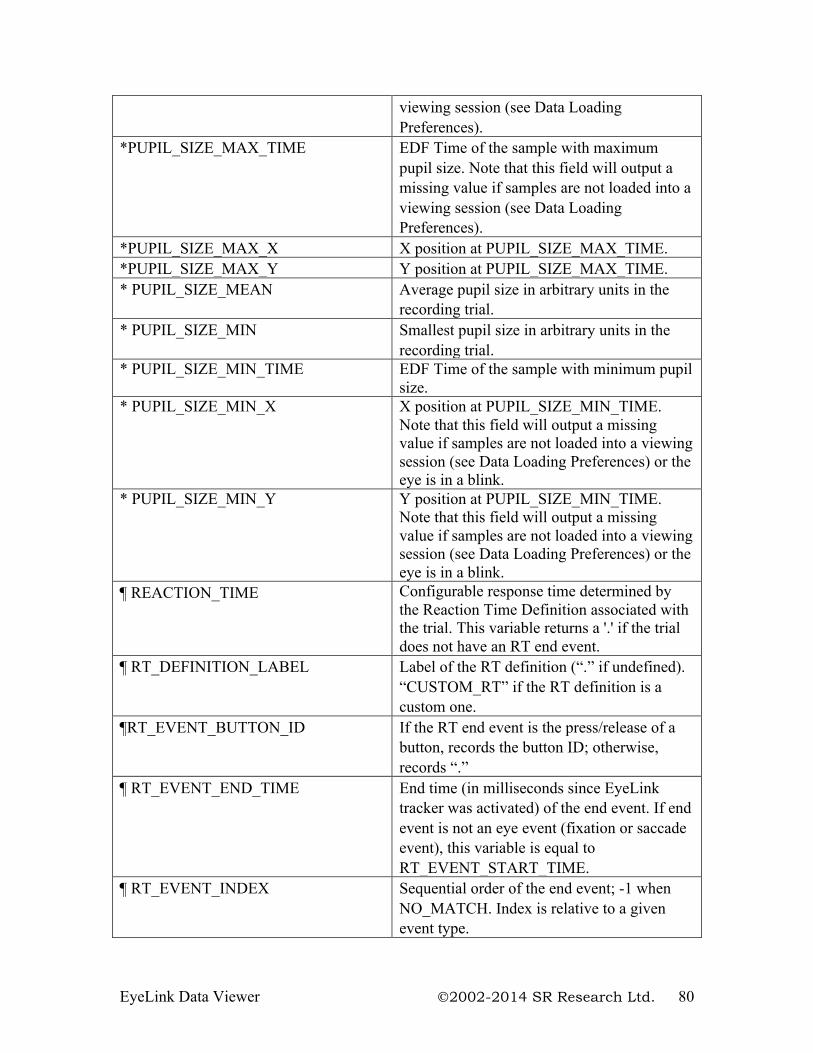
EyeLink Data Viewer 2002-2014 SR Research Ltd. 80
viewing session (see Data Loading Preferences).
*PUPIL_SIZE_MAX_TIME
EDF Time of the sample with maximum pupil size. Note that this field will output a missing value if samples are not loaded into a viewing session (see Data Loading Preferences).
*PUPIL_SIZE_MAX_X X position at PUPIL_SIZE_MAX_TIME. *PUPIL_SIZE_MAX_Y Y position at PUPIL_SIZE_MAX_TIME. * PUPIL_SIZE_MEAN Average pupil size in arbitrary units in the
recording trial. * PUPIL_SIZE_MIN Smallest pupil size in arbitrary units in the
recording trial. * PUPIL_SIZE_MIN_TIME EDF Time of the sample with minimum pupil
size. * PUPIL_SIZE_MIN_X X position at PUPIL_SIZE_MIN_TIME.
Note that this field will output a missing value if samples are not loaded into a viewing session (see Data Loading Preferences) or the eye is in a blink.
* PUPIL_SIZE_MIN_Y Y position at PUPIL_SIZE_MIN_TIME. Note that this field will output a missing value if samples are not loaded into a viewing session (see Data Loading Preferences) or the eye is in a blink.
¶ REACTION_TIME Configurable response time determined by the Reaction Time Definition associated with the trial. This variable returns a '.' if the trial does not have an RT end event.
¶ RT_DEFINITION_LABEL Label of the RT definition (“.” if undefined). “CUSTOM_RT” if the RT definition is a custom one.
¶RT_EVENT_BUTTON_ID If the RT end event is the press/release of a button, records the button ID; otherwise, records “.”
¶ RT_EVENT_END_TIME End time (in milliseconds since EyeLink tracker was activated) of the end event. If end event is not an eye event (fixation or saccade event), this variable is equal to RT_EVENT_START_TIME.
¶ RT_EVENT_INDEX Sequential order of the end event; -1 when NO_MATCH. Index is relative to a given event type.
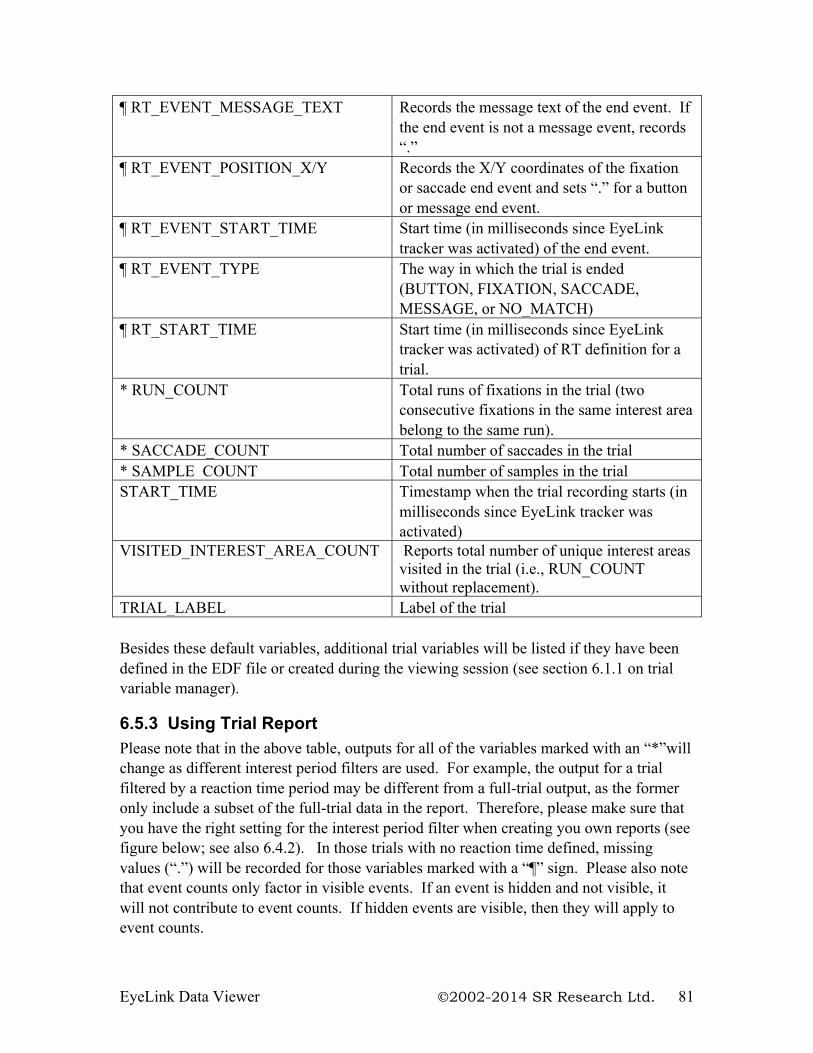
EyeLink Data Viewer 2002-2014 SR Research Ltd. 81
¶ RT_EVENT_MESSAGE_TEXT Records the message text of the end event. If the end event is not a message event, records “.”
¶ RT_EVENT_POSITION_X/Y Records the X/Y coordinates of the fixation or saccade end event and sets “.” for a button or message end event.
¶ RT_EVENT_START_TIME Start time (in milliseconds since EyeLink tracker was activated) of the end event.
¶ RT_EVENT_TYPE The way in which the trial is ended (BUTTON, FIXATION, SACCADE, MESSAGE, or NO_MATCH)
¶ RT_START_TIME Start time (in milliseconds since EyeLink tracker was activated) of RT definition for a trial.
* RUN_COUNT Total runs of fixations in the trial (two consecutive fixations in the same interest area belong to the same run).
* SACCADE_COUNT Total number of saccades in the trial * SAMPLE_COUNT Total number of samples in the trial START_TIME Timestamp when the trial recording starts (in
milliseconds since EyeLink tracker was activated)
VISITED_INTEREST_AREA_COUNT Reports total number of unique interest areas visited in the trial (i.e., RUN_COUNT without replacement).
TRIAL_LABEL Label of the trial Besides these default variables, additional trial variables will be listed if they have been defined in the EDF file or created during the viewing session (see section 6.1.1 on trial variable manager).
6.5.3 Using Trial Report Please note that in the above table, outputs for all of the variables marked with an “*”will change as different interest period filters are used. For example, the output for a trial filtered by a reaction time period may be different from a full-trial output, as the former only include a subset of the full-trial data in the report. Therefore, please make sure that you have the right setting for the interest period filter when creating you own reports (see figure below; see also 6.4.2). In those trials with no reaction time defined, missing values (“.”) will be recorded for those variables marked with a “¶” sign. Please also note that event counts only factor in visible events. If an event is hidden and not visible, it will not contribute to event counts. If hidden events are visible, then they will apply to event counts.
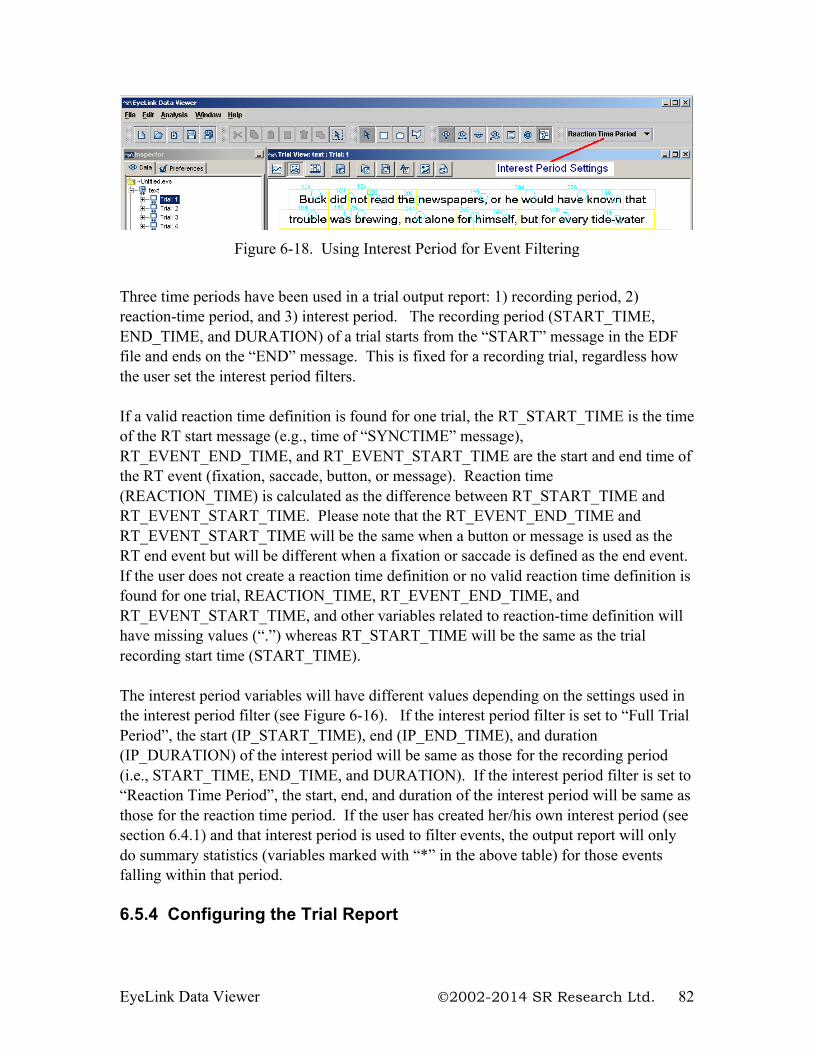
EyeLink Data Viewer 2002-2014 SR Research Ltd. 82
Figure 6-18. Using Interest Period for Event Filtering
Three time periods have been used in a trial output report: 1) recording period, 2) reaction-time period, and 3) interest period. The recording period (START_TIME, END_TIME, and DURATION) of a trial starts from the “START” message in the EDF file and ends on the “END” message. This is fixed for a recording trial, regardless how the user set the interest period filters. If a valid reaction time definition is found for one trial, the RT_START_TIME is the time of the RT start message (e.g., time of “SYNCTIME” message), RT_EVENT_END_TIME, and RT_EVENT_START_TIME are the start and end time of the RT event (fixation, saccade, button, or message). Reaction time (REACTION_TIME) is calculated as the difference between RT_START_TIME and RT_EVENT_START_TIME. Please note that the RT_EVENT_END_TIME and RT_EVENT_START_TIME will be the same when a button or message is used as the RT end event but will be different when a fixation or saccade is defined as the end event. If the user does not create a reaction time definition or no valid reaction time definition is found for one trial, REACTION_TIME, RT_EVENT_END_TIME, and RT_EVENT_START_TIME, and other variables related to reaction-time definition will have missing values (“.”) whereas RT_START_TIME will be the same as the trial recording start time (START_TIME). The interest period variables will have different values depending on the settings used in the interest period filter (see Figure 6-16). If the interest period filter is set to “Full Trial Period”, the start (IP_START_TIME), end (IP_END_TIME), and duration (IP_DURATION) of the interest period will be same as those for the recording period (i.e., START_TIME, END_TIME, and DURATION). If the interest period filter is set to “Reaction Time Period”, the start, end, and duration of the interest period will be same as those for the reaction time period. If the user has created her/his own interest period (see section 6.4.1) and that interest period is used to filter events, the output report will only do summary statistics (variables marked with “*” in the above table) for those events falling within that period. 6.5.4 Configuring the Trial Report
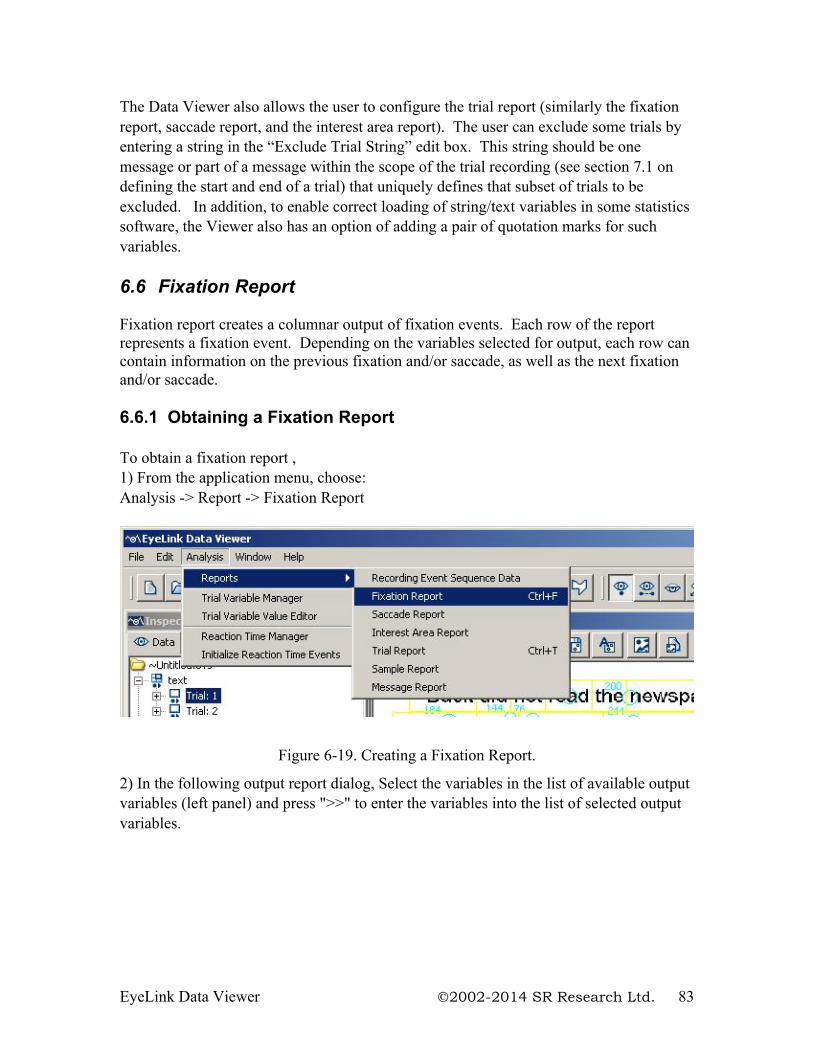
EyeLink Data Viewer 2002-2014 SR Research Ltd. 83
The Data Viewer also allows the user to configure the trial report (similarly the fixation report, saccade report, and the interest area report). The user can exclude some trials by entering a string in the “Exclude Trial String” edit box. This string should be one message or part of a message within the scope of the trial recording (see section 7.1 on defining the start and end of a trial) that uniquely defines that subset of trials to be excluded. In addition, to enable correct loading of string/text variables in some statistics software, the Viewer also has an option of adding a pair of quotation marks for such variables. 6.6 Fixation Report Fixation report creates a columnar output of fixation events. Each row of the report represents a fixation event. Depending on the variables selected for output, each row can contain information on the previous fixation and/or saccade, as well as the next fixation and/or saccade. 6.6.1 Obtaining a Fixation Report To obtain a fixation report , 1) From the application menu, choose: Analysis -> Report -> Fixation Report
Figure 6-19. Creating a Fixation Report.
2) In the following output report dialog, Select the variables in the list of available output variables (left panel) and press ">>" to enter the variables into the list of selected output variables.
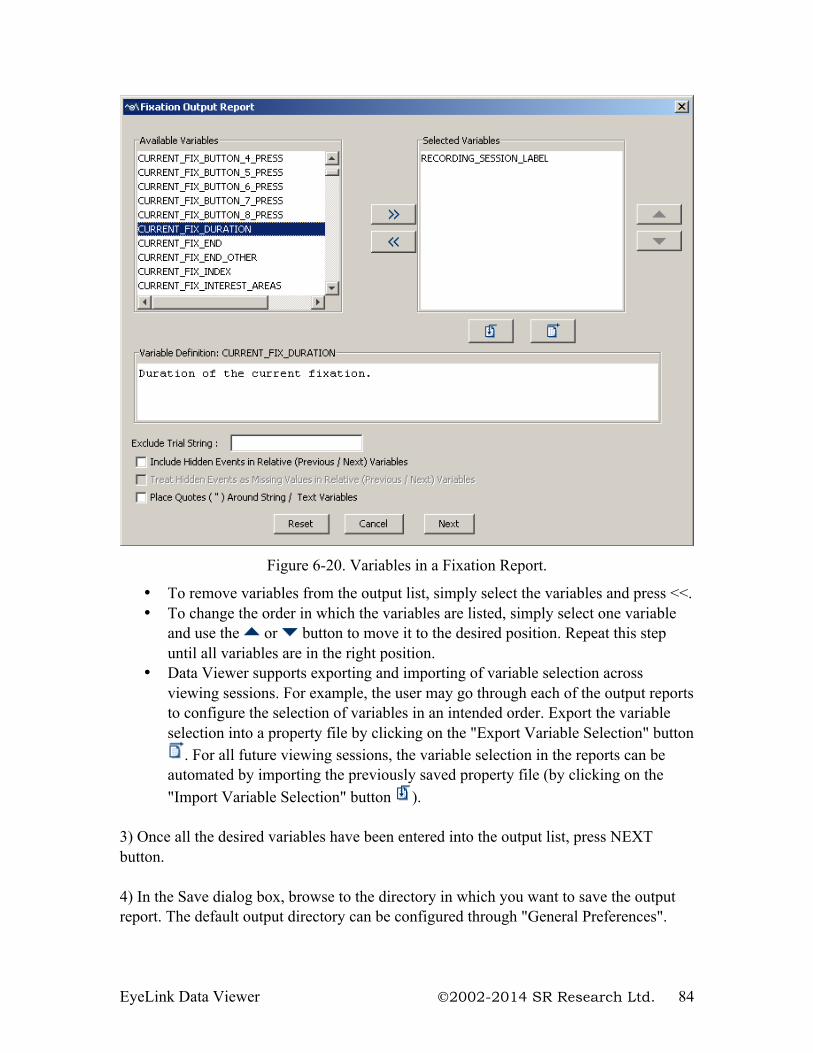
EyeLink Data Viewer 2002-2014 SR Research Ltd. 84
Figure 6-20. Variables in a Fixation Report.
• To remove variables from the output list, simply select the variables and press <<. • To change the order in which the variables are listed, simply select one variable
and use the or button to move it to the desired position. Repeat this step until all variables are in the right position.
• Data Viewer supports exporting and importing of variable selection across viewing sessions. For example, the user may go through each of the output reports to configure the selection of variables in an intended order. Export the variable selection into a property file by clicking on the "Export Variable Selection" button
. For all future viewing sessions, the variable selection in the reports can be automated by importing the previously saved property file (by clicking on the "Import Variable Selection" button ).
3) Once all the desired variables have been entered into the output list, press NEXT button. 4) In the Save dialog box, browse to the directory in which you want to save the output report. The default output directory can be configured through "General Preferences".
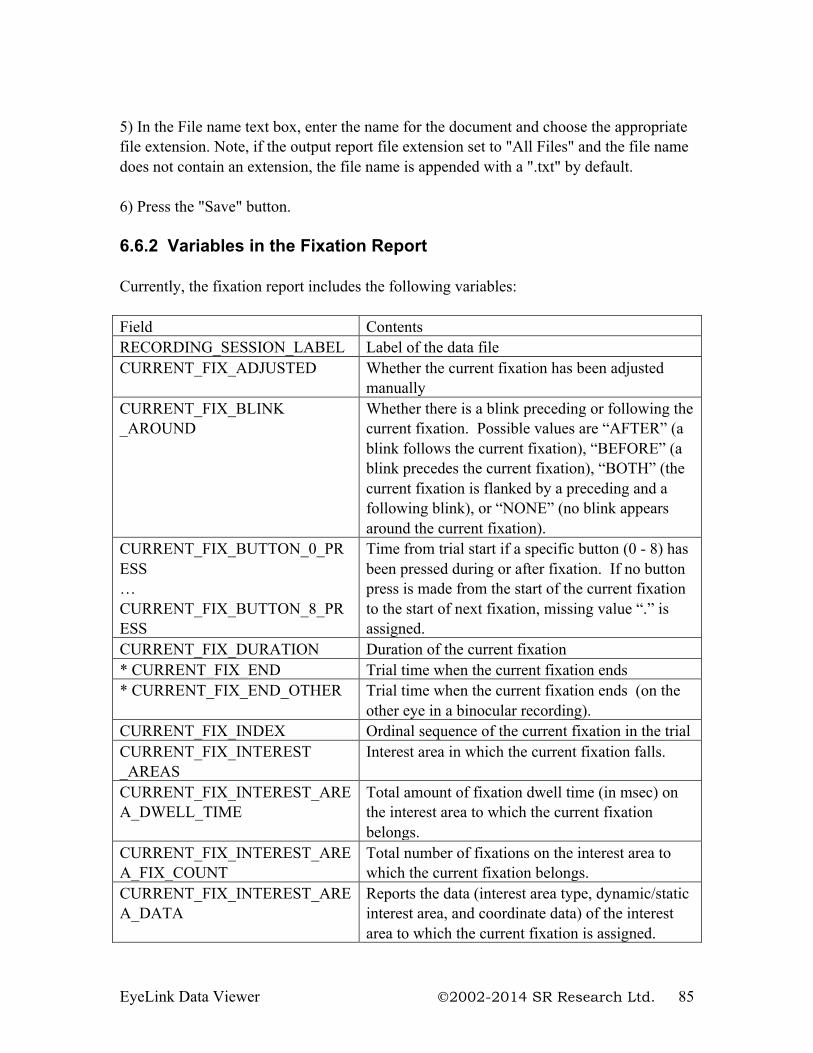
EyeLink Data Viewer 2002-2014 SR Research Ltd. 85
5) In the File name text box, enter the name for the document and choose the appropriate file extension. Note, if the output report file extension set to "All Files" and the file name does not contain an extension, the file name is appended with a ".txt" by default. 6) Press the "Save" button. 6.6.2 Variables in the Fixation Report Currently, the fixation report includes the following variables: Field Contents RECORDING_SESSION_LABEL Label of the data file CURRENT_FIX_ADJUSTED Whether the current fixation has been adjusted
manually CURRENT_FIX_BLINK _AROUND
Whether there is a blink preceding or following the current fixation. Possible values are “AFTER” (a blink follows the current fixation), “BEFORE” (a blink precedes the current fixation), “BOTH” (the current fixation is flanked by a preceding and a following blink), or “NONE” (no blink appears around the current fixation).
CURRENT_FIX_BUTTON_0_PRESS … CURRENT_FIX_BUTTON_8_PRESS
Time from trial start if a specific button (0 - 8) has been pressed during or after fixation. If no button press is made from the start of the current fixation to the start of next fixation, missing value “.” is assigned.
CURRENT_FIX_DURATION Duration of the current fixation * CURRENT_FIX_END Trial time when the current fixation ends * CURRENT_FIX_END_OTHER Trial time when the current fixation ends (on the
other eye in a binocular recording). CURRENT_FIX_INDEX Ordinal sequence of the current fixation in the trial CURRENT_FIX_INTEREST _AREAS
Interest area in which the current fixation falls.
CURRENT_FIX_INTEREST_AREA_DWELL_TIME
Total amount of fixation dwell time (in msec) on the interest area to which the current fixation belongs.
CURRENT_FIX_INTEREST_AREA_FIX_COUNT
Total number of fixations on the interest area to which the current fixation belongs.
CURRENT_FIX_INTEREST_AREA_DATA
Reports the data (interest area type, dynamic/static interest area, and coordinate data) of the interest area to which the current fixation is assigned.
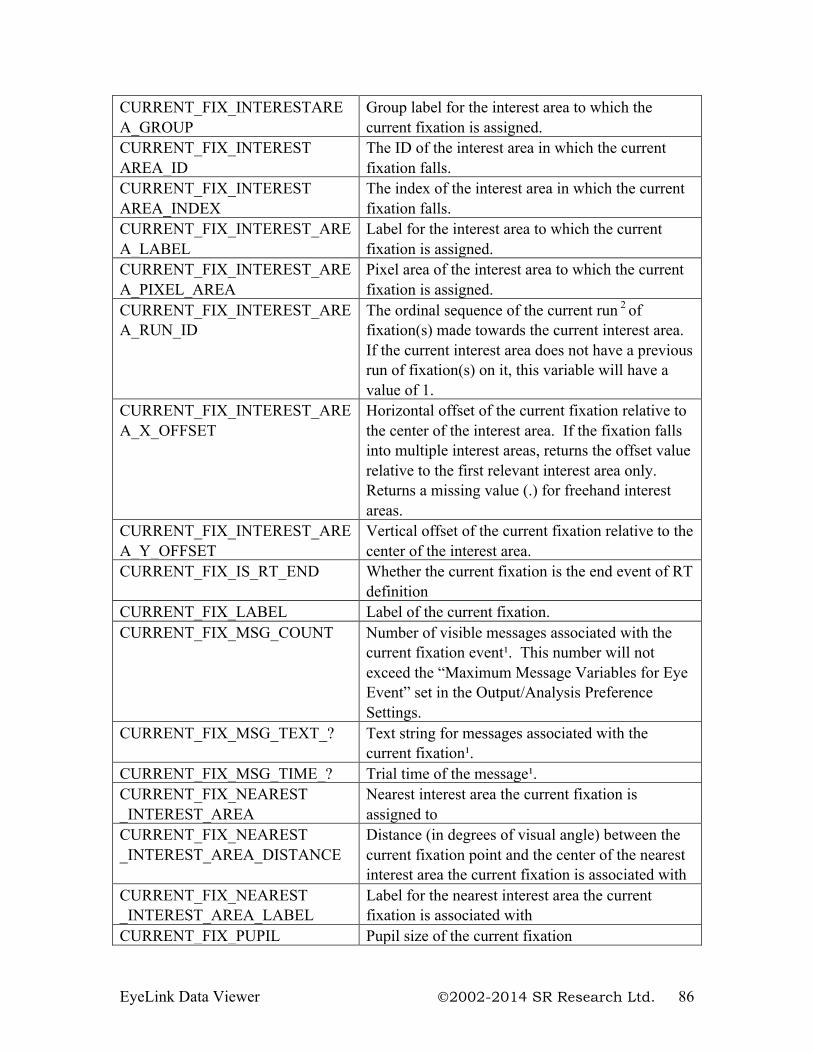
EyeLink Data Viewer 2002-2014 SR Research Ltd. 86
CURRENT_FIX_INTERESTAREA_GROUP
Group label for the interest area to which the current fixation is assigned.
CURRENT_FIX_INTEREST AREA_ID
The ID of the interest area in which the current fixation falls.
CURRENT_FIX_INTEREST AREA_INDEX
The index of the interest area in which the current fixation falls.
CURRENT_FIX_INTEREST_AREA_LABEL
Label for the interest area to which the current fixation is assigned.
CURRENT_FIX_INTEREST_AREA_PIXEL_AREA
Pixel area of the interest area to which the current fixation is assigned.
CURRENT_FIX_INTEREST_AREA_RUN_ID
The ordinal sequence of the current run 2 of fixation(s) made towards the current interest area. If the current interest area does not have a previous run of fixation(s) on it, this variable will have a value of 1.
CURRENT_FIX_INTEREST_AREA_X_OFFSET
Horizontal offset of the current fixation relative to the center of the interest area. If the fixation falls into multiple interest areas, returns the offset value relative to the first relevant interest area only. Returns a missing value (.) for freehand interest areas.
CURRENT_FIX_INTEREST_AREA_Y_OFFSET
Vertical offset of the current fixation relative to the center of the interest area.
CURRENT_FIX_IS_RT_END Whether the current fixation is the end event of RT definition
CURRENT_FIX_LABEL Label of the current fixation. CURRENT_FIX_MSG_COUNT Number of visible messages associated with the
current fixation event¹. This number will not exceed the “Maximum Message Variables for Eye Event” set in the Output/Analysis Preference Settings.
CURRENT_FIX_MSG_TEXT_? Text string for messages associated with the current fixation¹.
CURRENT_FIX_MSG_TIME_? Trial time of the message¹. CURRENT_FIX_NEAREST _INTEREST_AREA
Nearest interest area the current fixation is assigned to
CURRENT_FIX_NEAREST _INTEREST_AREA_DISTANCE
Distance (in degrees of visual angle) between the current fixation point and the center of the nearest interest area the current fixation is associated with
CURRENT_FIX_NEAREST _INTEREST_AREA_LABEL
Label for the nearest interest area the current fixation is associated with
CURRENT_FIX_PUPIL Pupil size of the current fixation
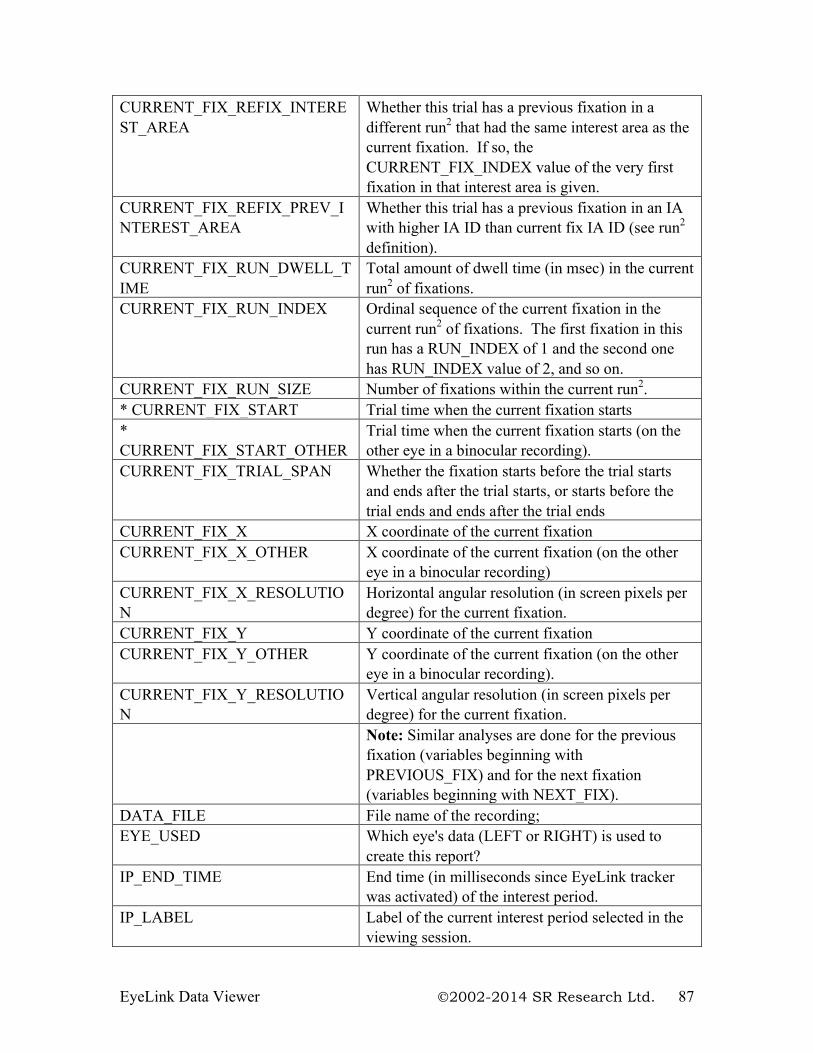
EyeLink Data Viewer 2002-2014 SR Research Ltd. 87
CURRENT_FIX_REFIX_INTEREST_AREA
Whether this trial has a previous fixation in a different run2 that had the same interest area as the current fixation. If so, the CURRENT_FIX_INDEX value of the very first fixation in that interest area is given.
CURRENT_FIX_REFIX_PREV_INTEREST_AREA
Whether this trial has a previous fixation in an IA with higher IA ID than current fix IA ID (see run2 definition).
CURRENT_FIX_RUN_DWELL_TIME
Total amount of dwell time (in msec) in the current run2 of fixations.
CURRENT_FIX_RUN_INDEX Ordinal sequence of the current fixation in the current run2 of fixations. The first fixation in this run has a RUN_INDEX of 1 and the second one has RUN_INDEX value of 2, and so on.
CURRENT_FIX_RUN_SIZE Number of fixations within the current run2. * CURRENT_FIX_START Trial time when the current fixation starts * CURRENT_FIX_START_OTHER
Trial time when the current fixation starts (on the other eye in a binocular recording).
CURRENT_FIX_TRIAL_SPAN Whether the fixation starts before the trial starts and ends after the trial starts, or starts before the trial ends and ends after the trial ends
CURRENT_FIX_X X coordinate of the current fixation CURRENT_FIX_X_OTHER X coordinate of the current fixation (on the other
eye in a binocular recording) CURRENT_FIX_X_RESOLUTION
Horizontal angular resolution (in screen pixels per degree) for the current fixation.
CURRENT_FIX_Y Y coordinate of the current fixation CURRENT_FIX_Y_OTHER Y coordinate of the current fixation (on the other
eye in a binocular recording). CURRENT_FIX_Y_RESOLUTION
Vertical angular resolution (in screen pixels per degree) for the current fixation.
Note: Similar analyses are done for the previous fixation (variables beginning with PREVIOUS_FIX) and for the next fixation (variables beginning with NEXT_FIX).
DATA_FILE File name of the recording; EYE_USED Which eye's data (LEFT or RIGHT) is used to
create this report? IP_END_TIME
End time (in milliseconds since EyeLink tracker was activated) of the interest period.
IP_LABEL Label of the current interest period selected in the viewing session.
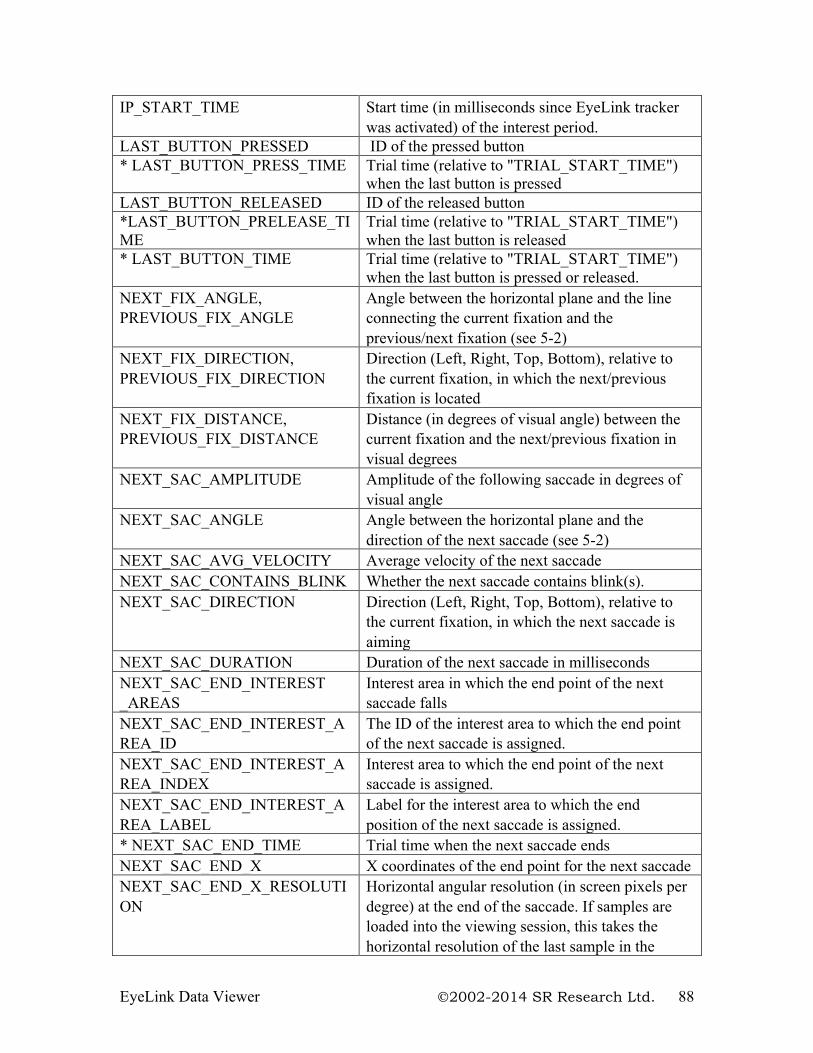
EyeLink Data Viewer 2002-2014 SR Research Ltd. 88
IP_START_TIME Start time (in milliseconds since EyeLink tracker was activated) of the interest period.
LAST_BUTTON_PRESSED ID of the pressed button * LAST_BUTTON_PRESS_TIME Trial time (relative to "TRIAL_START_TIME")
when the last button is pressed LAST_BUTTON_RELEASED ID of the released button *LAST_BUTTON_PRELEASE_TIME
Trial time (relative to "TRIAL_START_TIME") when the last button is released
* LAST_BUTTON_TIME Trial time (relative to "TRIAL_START_TIME") when the last button is pressed or released.
NEXT_FIX_ANGLE, PREVIOUS_FIX_ANGLE
Angle between the horizontal plane and the line connecting the current fixation and the previous/next fixation (see 5-2)
NEXT_FIX_DIRECTION, PREVIOUS_FIX_DIRECTION
Direction (Left, Right, Top, Bottom), relative to the current fixation, in which the next/previous fixation is located
NEXT_FIX_DISTANCE, PREVIOUS_FIX_DISTANCE
Distance (in degrees of visual angle) between the current fixation and the next/previous fixation in visual degrees
NEXT_SAC_AMPLITUDE Amplitude of the following saccade in degrees of visual angle
NEXT_SAC_ANGLE Angle between the horizontal plane and the direction of the next saccade (see 5-2)
NEXT_SAC_AVG_VELOCITY Average velocity of the next saccade NEXT_SAC_CONTAINS_BLINK Whether the next saccade contains blink(s). NEXT_SAC_DIRECTION Direction (Left, Right, Top, Bottom), relative to
the current fixation, in which the next saccade is aiming
NEXT_SAC_DURATION Duration of the next saccade in milliseconds NEXT_SAC_END_INTEREST _AREAS
Interest area in which the end point of the next saccade falls
NEXT_SAC_END_INTEREST_AREA_ID
The ID of the interest area to which the end point of the next saccade is assigned.
NEXT_SAC_END_INTEREST_AREA_INDEX
Interest area to which the end point of the next saccade is assigned.
NEXT_SAC_END_INTEREST_AREA_LABEL
Label for the interest area to which the end position of the next saccade is assigned.
* NEXT_SAC_END_TIME Trial time when the next saccade ends NEXT_SAC_END_X X coordinates of the end point for the next saccade NEXT_SAC_END_X_RESOLUTION
Horizontal angular resolution (in screen pixels per degree) at the end of the saccade. If samples are loaded into the viewing session, this takes the horizontal resolution of the last sample in the
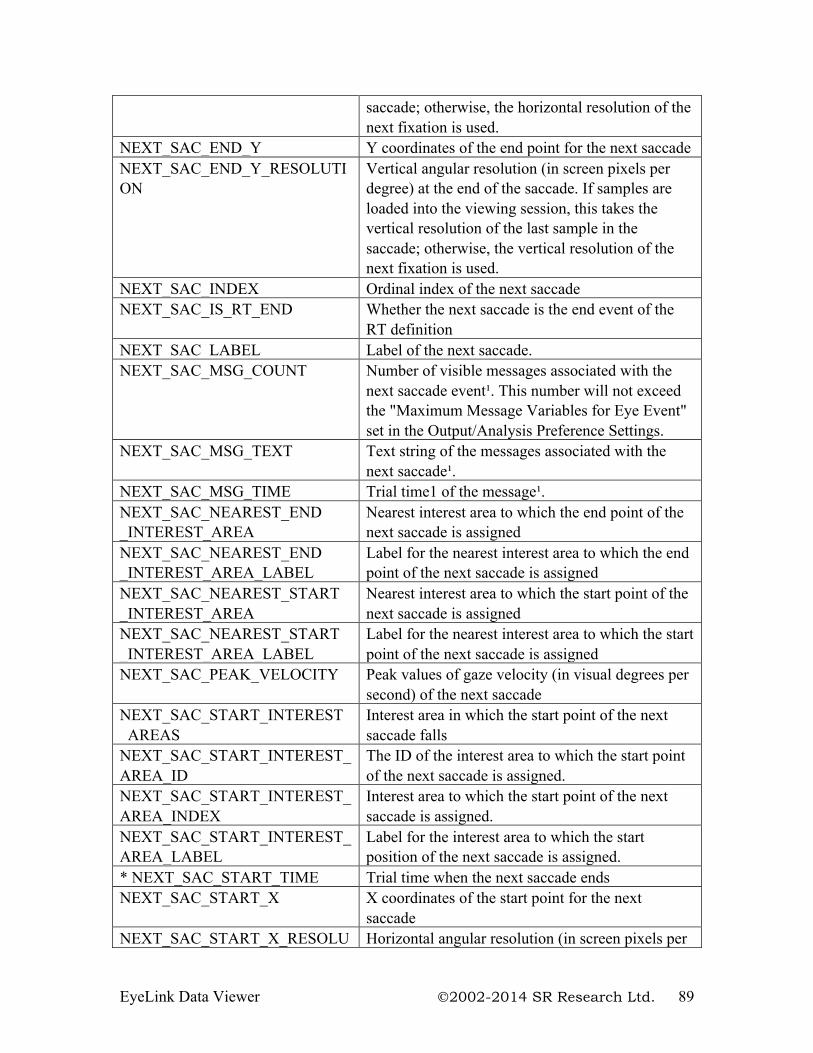
EyeLink Data Viewer 2002-2014 SR Research Ltd. 89
saccade; otherwise, the horizontal resolution of the next fixation is used.
NEXT_SAC_END_Y Y coordinates of the end point for the next saccade NEXT_SAC_END_Y_RESOLUTION
Vertical angular resolution (in screen pixels per degree) at the end of the saccade. If samples are loaded into the viewing session, this takes the vertical resolution of the last sample in the saccade; otherwise, the vertical resolution of the next fixation is used.
NEXT_SAC_INDEX Ordinal index of the next saccade NEXT_SAC_IS_RT_END Whether the next saccade is the end event of the
RT definition NEXT_SAC_LABEL Label of the next saccade. NEXT_SAC_MSG_COUNT
Number of visible messages associated with the next saccade event¹. This number will not exceed the "Maximum Message Variables for Eye Event" set in the Output/Analysis Preference Settings.
NEXT_SAC_MSG_TEXT Text string of the messages associated with the next saccade¹.
NEXT_SAC_MSG_TIME Trial time1 of the message¹. NEXT_SAC_NEAREST_END _INTEREST_AREA
Nearest interest area to which the end point of the next saccade is assigned
NEXT_SAC_NEAREST_END _INTEREST_AREA_LABEL
Label for the nearest interest area to which the end point of the next saccade is assigned
NEXT_SAC_NEAREST_START _INTEREST_AREA
Nearest interest area to which the start point of the next saccade is assigned
NEXT_SAC_NEAREST_START _INTEREST_AREA_LABEL
Label for the nearest interest area to which the start point of the next saccade is assigned
NEXT_SAC_PEAK_VELOCITY Peak values of gaze velocity (in visual degrees per second) of the next saccade
NEXT_SAC_START_INTEREST _AREAS
Interest area in which the start point of the next saccade falls
NEXT_SAC_START_INTEREST_AREA_ID
The ID of the interest area to which the start point of the next saccade is assigned.
NEXT_SAC_START_INTEREST_AREA_INDEX
Interest area to which the start point of the next saccade is assigned.
NEXT_SAC_START_INTEREST_AREA_LABEL
Label for the interest area to which the start position of the next saccade is assigned.
* NEXT_SAC_START_TIME Trial time when the next saccade ends NEXT_SAC_START_X X coordinates of the start point for the next
saccade NEXT_SAC_START_X_RESOLU Horizontal angular resolution (in screen pixels per
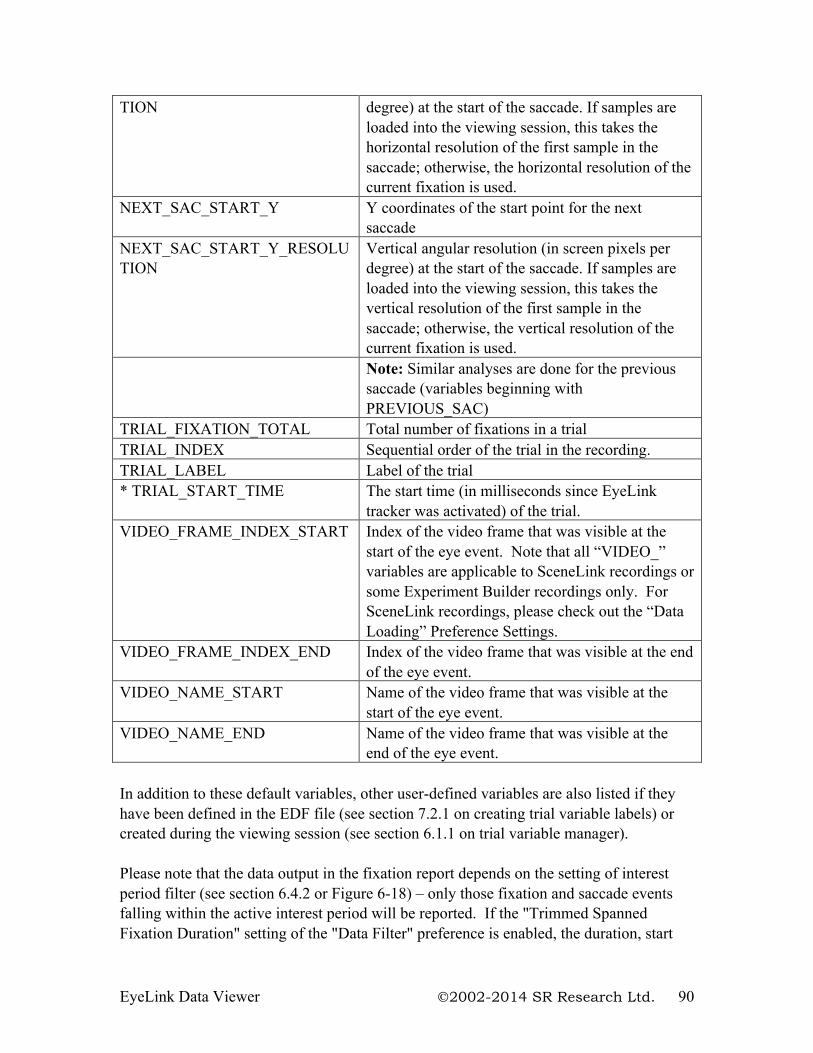
EyeLink Data Viewer 2002-2014 SR Research Ltd. 90
TION degree) at the start of the saccade. If samples are loaded into the viewing session, this takes the horizontal resolution of the first sample in the saccade; otherwise, the horizontal resolution of the current fixation is used.
NEXT_SAC_START_Y Y coordinates of the start point for the next saccade
NEXT_SAC_START_Y_RESOLUTION
Vertical angular resolution (in screen pixels per degree) at the start of the saccade. If samples are loaded into the viewing session, this takes the vertical resolution of the first sample in the saccade; otherwise, the vertical resolution of the current fixation is used.
Note: Similar analyses are done for the previous saccade (variables beginning with PREVIOUS_SAC)
TRIAL_FIXATION_TOTAL Total number of fixations in a trial TRIAL_INDEX Sequential order of the trial in the recording. TRIAL_LABEL Label of the trial * TRIAL_START_TIME The start time (in milliseconds since EyeLink
tracker was activated) of the trial. VIDEO_FRAME_INDEX_START
Index of the video frame that was visible at the start of the eye event. Note that all “VIDEO_” variables are applicable to SceneLink recordings or some Experiment Builder recordings only. For SceneLink recordings, please check out the “Data Loading” Preference Settings.
VIDEO_FRAME_INDEX_END Index of the video frame that was visible at the end of the eye event.
VIDEO_NAME_START
Name of the video frame that was visible at the start of the eye event.
VIDEO_NAME_END Name of the video frame that was visible at the end of the eye event.
In addition to these default variables, other user-defined variables are also listed if they have been defined in the EDF file (see section 7.2.1 on creating trial variable labels) or created during the viewing session (see section 6.1.1 on trial variable manager). Please note that the data output in the fixation report depends on the setting of interest period filter (see section 6.4.2 or Figure 6-18) – only those fixation and saccade events falling within the active interest period will be reported. If the "Trimmed Spanned Fixation Duration" setting of the "Data Filter" preference is enabled, the duration, start
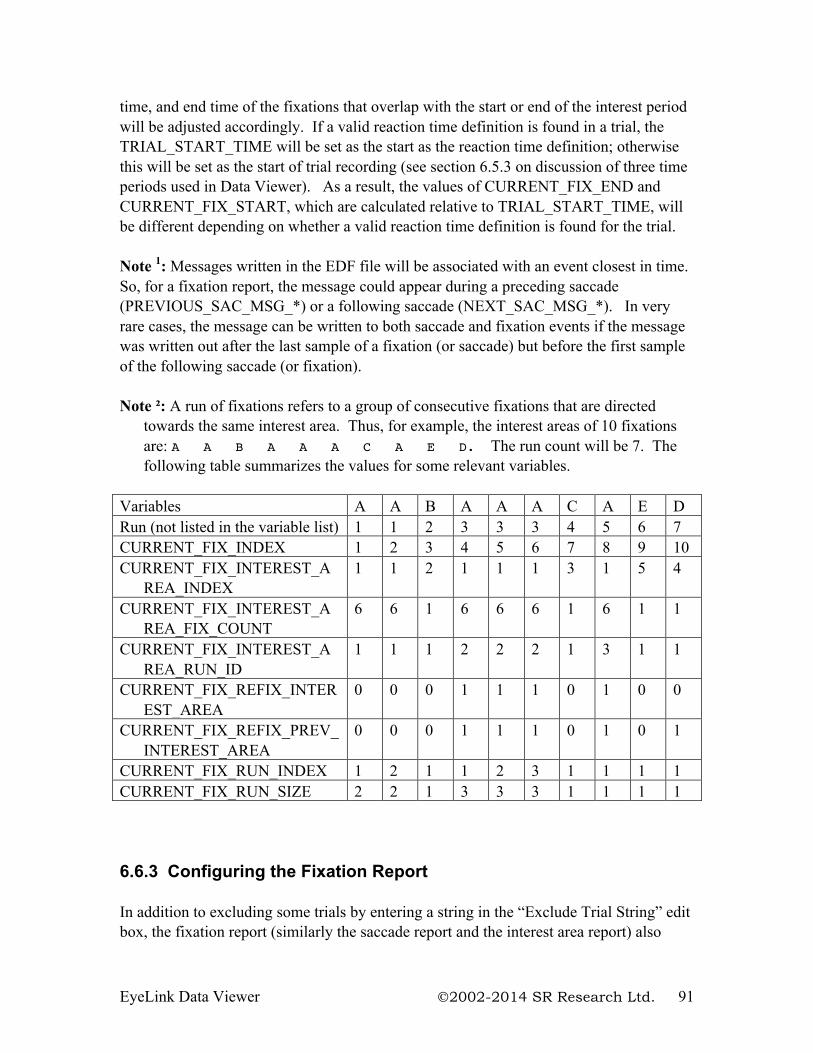
EyeLink Data Viewer 2002-2014 SR Research Ltd. 91
time, and end time of the fixations that overlap with the start or end of the interest period will be adjusted accordingly. If a valid reaction time definition is found in a trial, the TRIAL_START_TIME will be set as the start as the reaction time definition; otherwise this will be set as the start of trial recording (see section 6.5.3 on discussion of three time periods used in Data Viewer). As a result, the values of CURRENT_FIX_END and CURRENT_FIX_START, which are calculated relative to TRIAL_START_TIME, will be different depending on whether a valid reaction time definition is found for the trial. Note 1: Messages written in the EDF file will be associated with an event closest in time. So, for a fixation report, the message could appear during a preceding saccade (PREVIOUS_SAC_MSG_*) or a following saccade (NEXT_SAC_MSG_*). In very rare cases, the message can be written to both saccade and fixation events if the message was written out after the last sample of a fixation (or saccade) but before the first sample of the following saccade (or fixation). Note ²: A run of fixations refers to a group of consecutive fixations that are directed
towards the same interest area. Thus, for example, the interest areas of 10 fixations are: A A B A A A C A E D. The run count will be 7. The following table summarizes the values for some relevant variables.
Variables A A B A A A C A E D Run (not listed in the variable list) 1 1 2 3 3 3 4 5 6 7 CURRENT_FIX_INDEX 1 2 3 4 5 6 7 8 9 10 CURRENT_FIX_INTEREST_A
REA_INDEX 1 1 2 1 1 1 3 1 5 4
CURRENT_FIX_INTEREST_AREA_FIX_COUNT
6 6 1 6 6 6 1 6 1 1
CURRENT_FIX_INTEREST_AREA_RUN_ID
1 1 1 2 2 2 1 3 1 1
CURRENT_FIX_REFIX_INTEREST_AREA
0 0 0 1 1 1 0 1 0 0
CURRENT_FIX_REFIX_PREV_INTEREST_AREA
0 0 0 1 1 1 0 1 0 1
CURRENT_FIX_RUN_INDEX 1 2 1 1 2 3 1 1 1 1 CURRENT_FIX_RUN_SIZE 2 2 1 3 3 3 1 1 1 1 6.6.3 Configuring the Fixation Report In addition to excluding some trials by entering a string in the “Exclude Trial String” edit box, the fixation report (similarly the saccade report and the interest area report) also
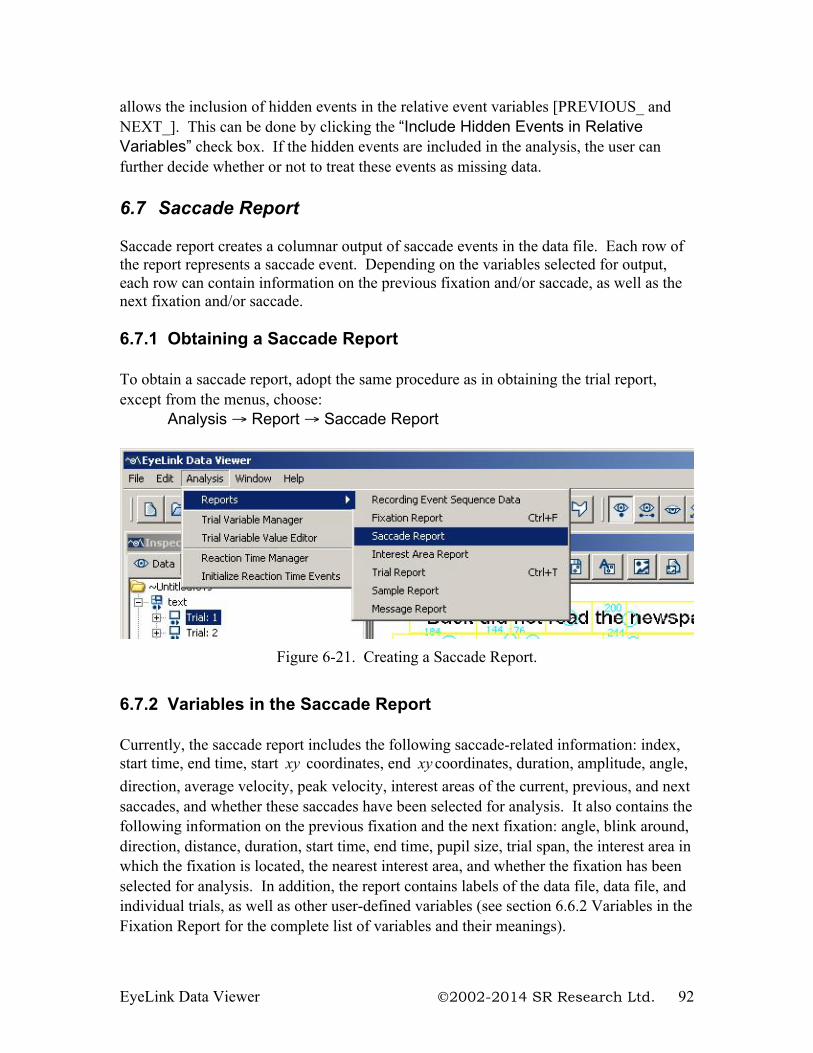
EyeLink Data Viewer 2002-2014 SR Research Ltd. 92
allows the inclusion of hidden events in the relative event variables [PREVIOUS_ and NEXT_]. This can be done by clicking the “Include Hidden Events in Relative Variables” check box. If the hidden events are included in the analysis, the user can further decide whether or not to treat these events as missing data. 6.7 Saccade Report Saccade report creates a columnar output of saccade events in the data file. Each row of the report represents a saccade event. Depending on the variables selected for output, each row can contain information on the previous fixation and/or saccade, as well as the next fixation and/or saccade. 6.7.1 Obtaining a Saccade Report To obtain a saccade report, adopt the same procedure as in obtaining the trial report, except from the menus, choose:
Analysis → Report → Saccade Report
Figure 6-21. Creating a Saccade Report.
6.7.2 Variables in the Saccade Report Currently, the saccade report includes the following saccade-related information: index, start time, end time, start xy coordinates, end xy coordinates, duration, amplitude, angle, direction, average velocity, peak velocity, interest areas of the current, previous, and next saccades, and whether these saccades have been selected for analysis. It also contains the following information on the previous fixation and the next fixation: angle, blink around, direction, distance, duration, start time, end time, pupil size, trial span, the interest area in which the fixation is located, the nearest interest area, and whether the fixation has been selected for analysis. In addition, the report contains labels of the data file, data file, and individual trials, as well as other user-defined variables (see section 6.6.2 Variables in the Fixation Report for the complete list of variables and their meanings).
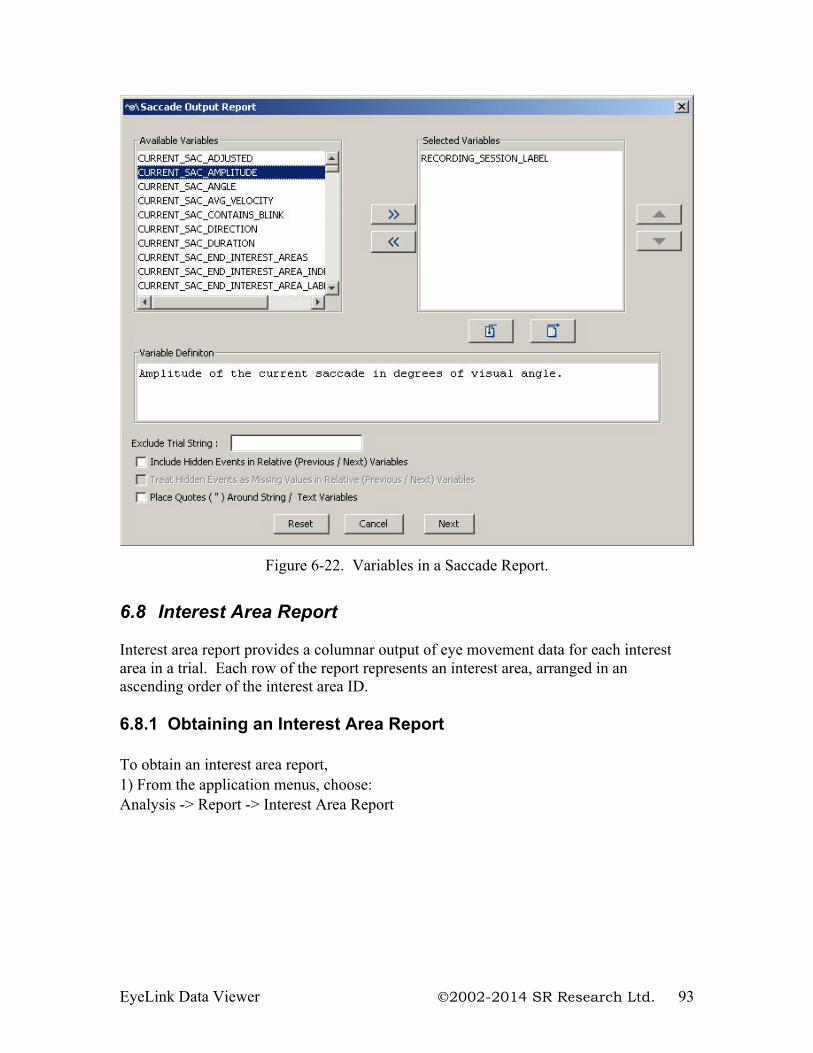
EyeLink Data Viewer 2002-2014 SR Research Ltd. 93
Figure 6-22. Variables in a Saccade Report.
6.8 Interest Area Report Interest area report provides a columnar output of eye movement data for each interest area in a trial. Each row of the report represents an interest area, arranged in an ascending order of the interest area ID. 6.8.1 Obtaining an Interest Area Report To obtain an interest area report, 1) From the application menus, choose: Analysis -> Report -> Interest Area Report
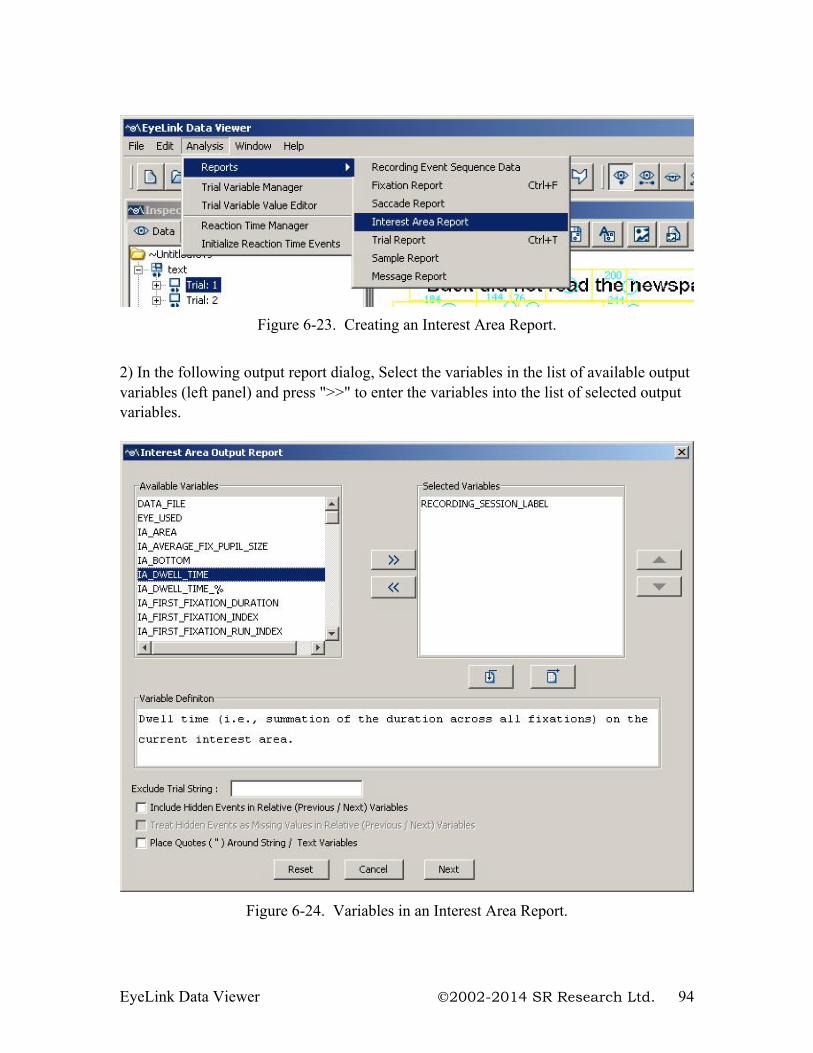
EyeLink Data Viewer 2002-2014 SR Research Ltd. 94
Figure 6-23. Creating an Interest Area Report.
2) In the following output report dialog, Select the variables in the list of available output variables (left panel) and press ">>" to enter the variables into the list of selected output variables.
Figure 6-24. Variables in an Interest Area Report.
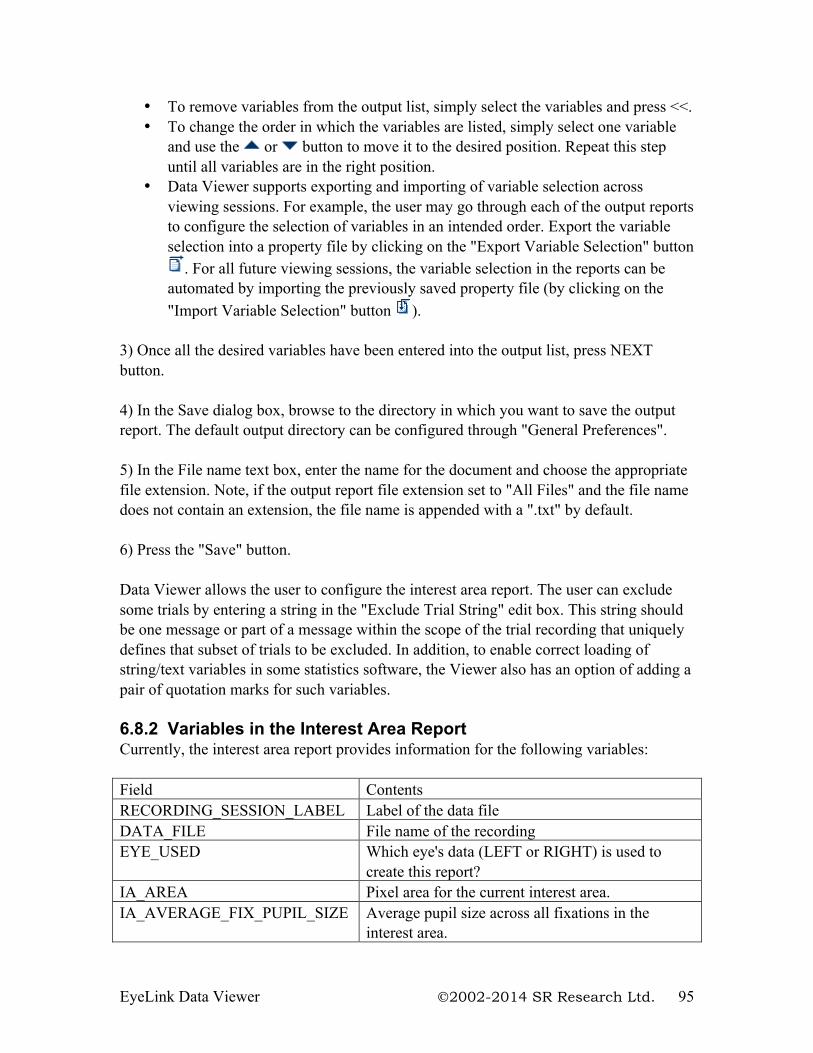
EyeLink Data Viewer 2002-2014 SR Research Ltd. 95
• To remove variables from the output list, simply select the variables and press <<. • To change the order in which the variables are listed, simply select one variable
and use the or button to move it to the desired position. Repeat this step until all variables are in the right position.
• Data Viewer supports exporting and importing of variable selection across viewing sessions. For example, the user may go through each of the output reports to configure the selection of variables in an intended order. Export the variable selection into a property file by clicking on the "Export Variable Selection" button
. For all future viewing sessions, the variable selection in the reports can be automated by importing the previously saved property file (by clicking on the "Import Variable Selection" button ).
3) Once all the desired variables have been entered into the output list, press NEXT button. 4) In the Save dialog box, browse to the directory in which you want to save the output report. The default output directory can be configured through "General Preferences". 5) In the File name text box, enter the name for the document and choose the appropriate file extension. Note, if the output report file extension set to "All Files" and the file name does not contain an extension, the file name is appended with a ".txt" by default. 6) Press the "Save" button. Data Viewer allows the user to configure the interest area report. The user can exclude some trials by entering a string in the "Exclude Trial String" edit box. This string should be one message or part of a message within the scope of the trial recording that uniquely defines that subset of trials to be excluded. In addition, to enable correct loading of string/text variables in some statistics software, the Viewer also has an option of adding a pair of quotation marks for such variables.
6.8.2 Variables in the Interest Area Report Currently, the interest area report provides information for the following variables: Field Contents RECORDING_SESSION_LABEL Label of the data file DATA_FILE File name of the recording EYE_USED Which eye's data (LEFT or RIGHT) is used to
create this report? IA_AREA Pixel area for the current interest area. IA_AVERAGE_FIX_PUPIL_SIZE Average pupil size across all fixations in the
interest area.
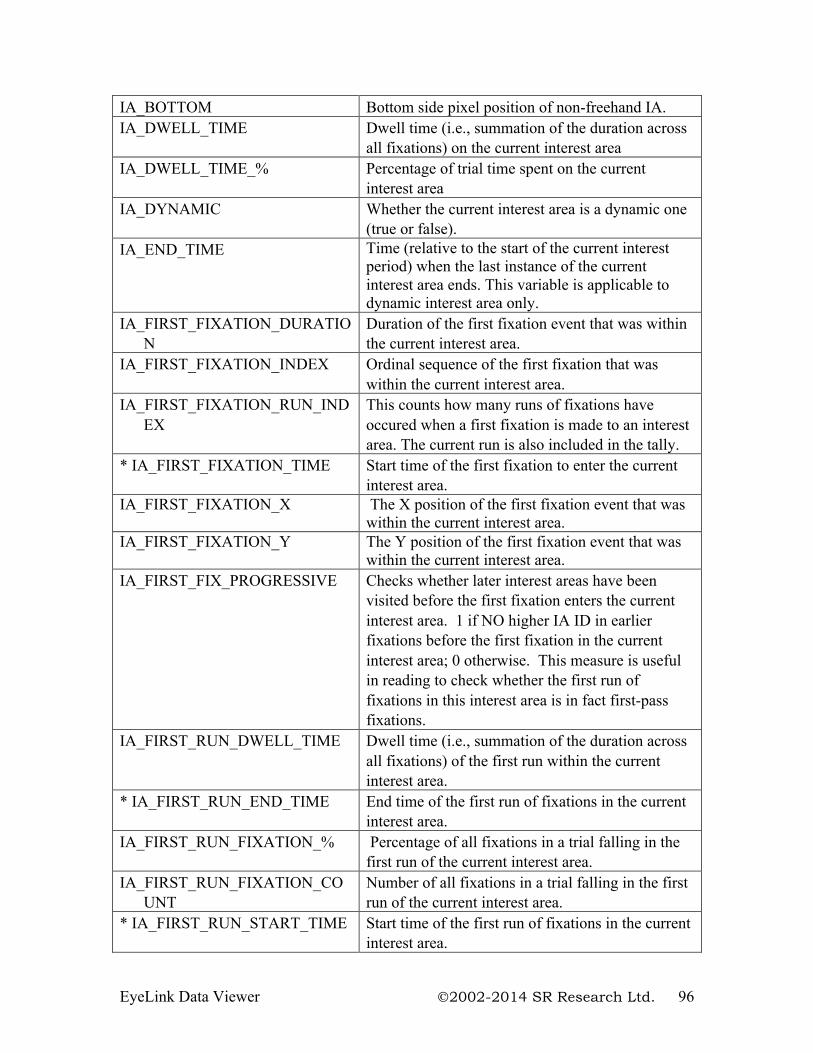
EyeLink Data Viewer 2002-2014 SR Research Ltd. 96
IA_BOTTOM Bottom side pixel position of non-freehand IA. IA_DWELL_TIME Dwell time (i.e., summation of the duration across
all fixations) on the current interest area IA_DWELL_TIME_% Percentage of trial time spent on the current
interest area IA_DYNAMIC Whether the current interest area is a dynamic one
(true or false). IA_END_TIME Time (relative to the start of the current interest
period) when the last instance of the current interest area ends. This variable is applicable to dynamic interest area only.
IA_FIRST_FIXATION_DURATION
Duration of the first fixation event that was within the current interest area.
IA_FIRST_FIXATION_INDEX
Ordinal sequence of the first fixation that was within the current interest area.
IA_FIRST_FIXATION_RUN_INDEX
This counts how many runs of fixations have occured when a first fixation is made to an interest area. The current run is also included in the tally.
* IA_FIRST_FIXATION_TIME Start time of the first fixation to enter the current interest area.
IA_FIRST_FIXATION_X The X position of the first fixation event that was within the current interest area.
IA_FIRST_FIXATION_Y The Y position of the first fixation event that was within the current interest area.
IA_FIRST_FIX_PROGRESSIVE Checks whether later interest areas have been visited before the first fixation enters the current interest area. 1 if NO higher IA ID in earlier fixations before the first fixation in the current interest area; 0 otherwise. This measure is useful in reading to check whether the first run of fixations in this interest area is in fact first-pass fixations.
IA_FIRST_RUN_DWELL_TIME Dwell time (i.e., summation of the duration across all fixations) of the first run within the current interest area.
* IA_FIRST_RUN_END_TIME End time of the first run of fixations in the current interest area.
IA_FIRST_RUN_FIXATION_% Percentage of all fixations in a trial falling in the first run of the current interest area.
IA_FIRST_RUN_FIXATION_COUNT
Number of all fixations in a trial falling in the first run of the current interest area.
* IA_FIRST_RUN_START_TIME Start time of the first run of fixations in the current interest area.
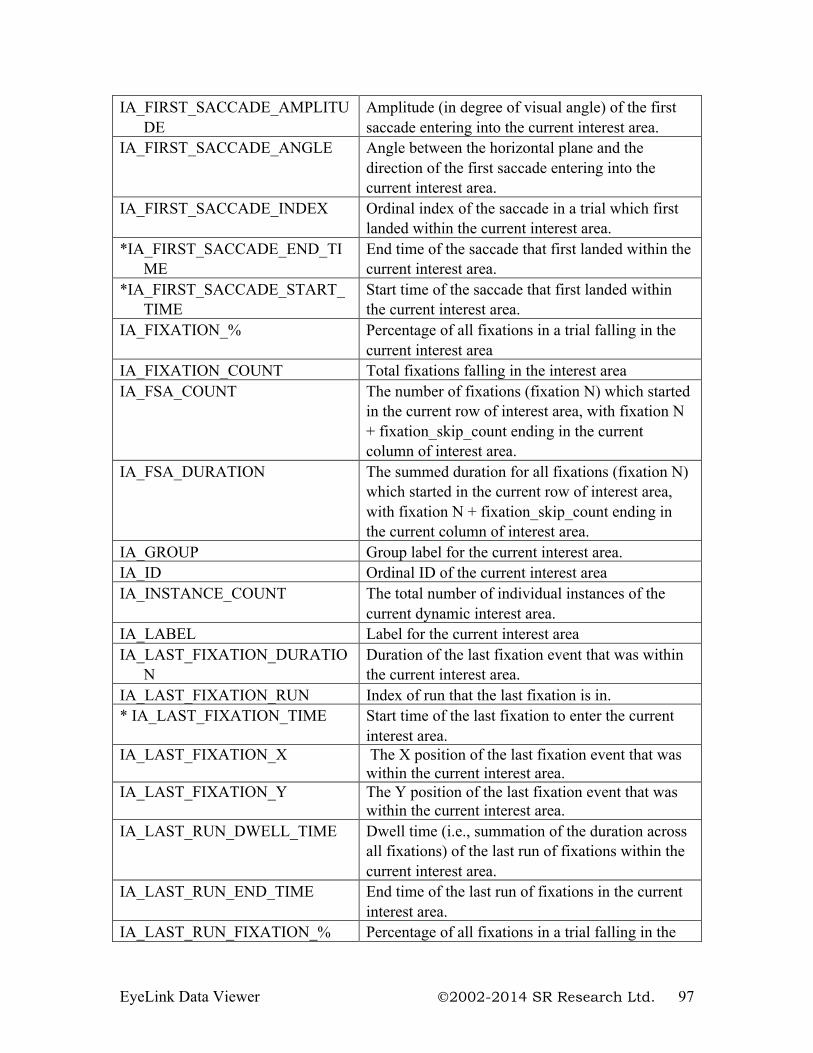
EyeLink Data Viewer 2002-2014 SR Research Ltd. 97
IA_FIRST_SACCADE_AMPLITUDE
Amplitude (in degree of visual angle) of the first saccade entering into the current interest area.
IA_FIRST_SACCADE_ANGLE Angle between the horizontal plane and the direction of the first saccade entering into the current interest area.
IA_FIRST_SACCADE_INDEX Ordinal index of the saccade in a trial which first landed within the current interest area.
*IA_FIRST_SACCADE_END_TIME
End time of the saccade that first landed within the current interest area.
*IA_FIRST_SACCADE_START_TIME
Start time of the saccade that first landed within the current interest area.
IA_FIXATION_% Percentage of all fixations in a trial falling in the current interest area
IA_FIXATION_COUNT Total fixations falling in the interest area IA_FSA_COUNT The number of fixations (fixation N) which started
in the current row of interest area, with fixation N + fixation_skip_count ending in the current column of interest area.
IA_FSA_DURATION The summed duration for all fixations (fixation N) which started in the current row of interest area, with fixation N + fixation_skip_count ending in the current column of interest area.
IA_GROUP Group label for the current interest area. IA_ID Ordinal ID of the current interest area IA_INSTANCE_COUNT The total number of individual instances of the
current dynamic interest area. IA_LABEL Label for the current interest area IA_LAST_FIXATION_DURATIO
N Duration of the last fixation event that was within the current interest area.
IA_LAST_FIXATION_RUN Index of run that the last fixation is in. * IA_LAST_FIXATION_TIME Start time of the last fixation to enter the current
interest area. IA_LAST_FIXATION_X The X position of the last fixation event that was
within the current interest area. IA_LAST_FIXATION_Y The Y position of the last fixation event that was
within the current interest area. IA_LAST_RUN_DWELL_TIME Dwell time (i.e., summation of the duration across
all fixations) of the last run of fixations within the current interest area.
IA_LAST_RUN_END_TIME End time of the last run of fixations in the current interest area.
IA_LAST_RUN_FIXATION_% Percentage of all fixations in a trial falling in the
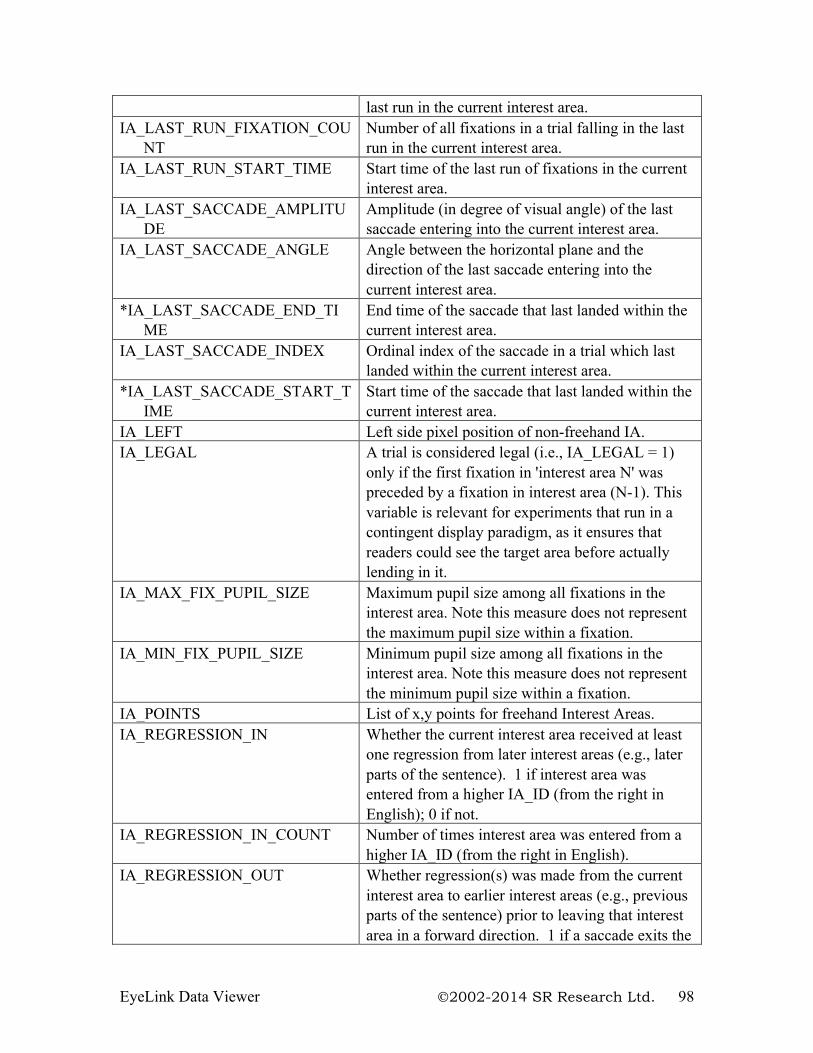
EyeLink Data Viewer 2002-2014 SR Research Ltd. 98
last run in the current interest area. IA_LAST_RUN_FIXATION_COU
NT Number of all fixations in a trial falling in the last run in the current interest area.
IA_LAST_RUN_START_TIME Start time of the last run of fixations in the current interest area.
IA_LAST_SACCADE_AMPLITUDE
Amplitude (in degree of visual angle) of the last saccade entering into the current interest area.
IA_LAST_SACCADE_ANGLE Angle between the horizontal plane and the direction of the last saccade entering into the current interest area.
*IA_LAST_SACCADE_END_TIME
End time of the saccade that last landed within the current interest area.
IA_LAST_SACCADE_INDEX
Ordinal index of the saccade in a trial which last landed within the current interest area.
*IA_LAST_SACCADE_START_TIME
Start time of the saccade that last landed within the current interest area.
IA_LEFT Left side pixel position of non-freehand IA. IA_LEGAL A trial is considered legal (i.e., IA_LEGAL = 1)
only if the first fixation in 'interest area N' was preceded by a fixation in interest area (N-1). This variable is relevant for experiments that run in a contingent display paradigm, as it ensures that readers could see the target area before actually lending in it.
IA_MAX_FIX_PUPIL_SIZE Maximum pupil size among all fixations in the interest area. Note this measure does not represent the maximum pupil size within a fixation.
IA_MIN_FIX_PUPIL_SIZE Minimum pupil size among all fixations in the interest area. Note this measure does not represent the minimum pupil size within a fixation.
IA_POINTS List of x,y points for freehand Interest Areas. IA_REGRESSION_IN
Whether the current interest area received at least one regression from later interest areas (e.g., later parts of the sentence). 1 if interest area was entered from a higher IA_ID (from the right in English); 0 if not.
IA_REGRESSION_IN_COUNT Number of times interest area was entered from a higher IA_ID (from the right in English).
IA_REGRESSION_OUT Whether regression(s) was made from the current interest area to earlier interest areas (e.g., previous parts of the sentence) prior to leaving that interest area in a forward direction. 1 if a saccade exits the
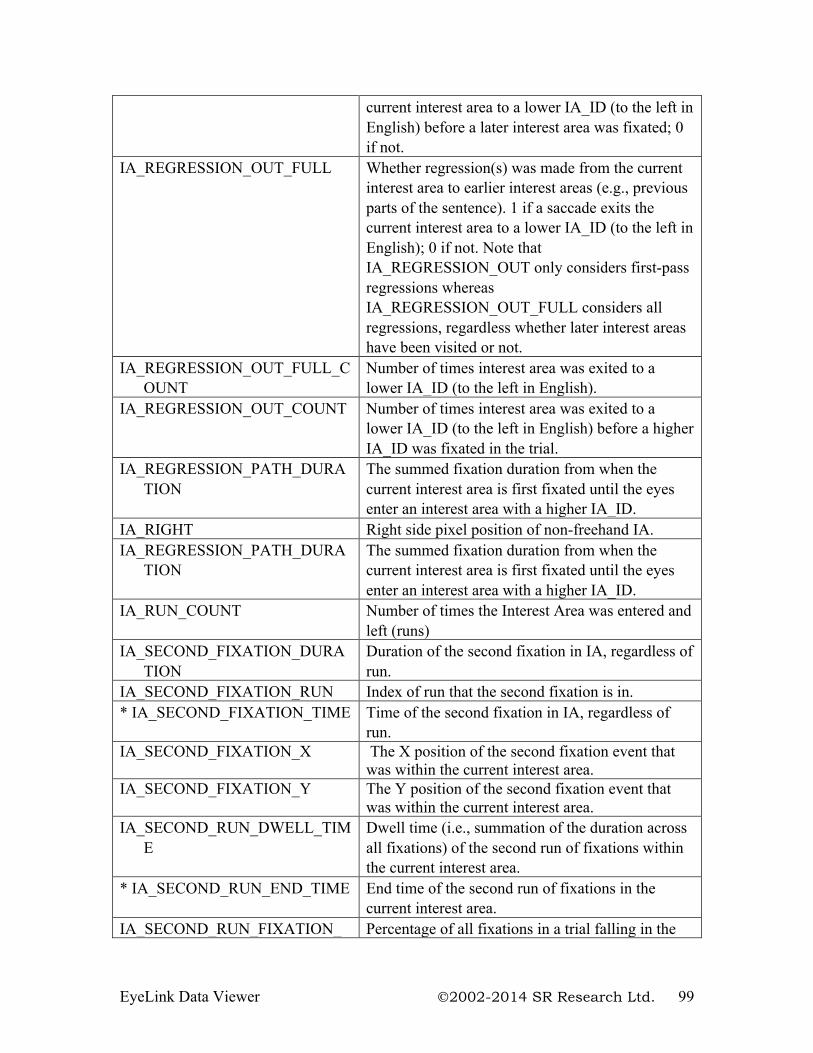
EyeLink Data Viewer 2002-2014 SR Research Ltd. 99
current interest area to a lower IA_ID (to the left in English) before a later interest area was fixated; 0 if not.
IA_REGRESSION_OUT_FULL
Whether regression(s) was made from the current interest area to earlier interest areas (e.g., previous parts of the sentence). 1 if a saccade exits the current interest area to a lower IA_ID (to the left in English); 0 if not. Note that IA_REGRESSION_OUT only considers first-pass regressions whereas IA_REGRESSION_OUT_FULL considers all regressions, regardless whether later interest areas have been visited or not.
IA_REGRESSION_OUT_FULL_COUNT
Number of times interest area was exited to a lower IA_ID (to the left in English).
IA_REGRESSION_OUT_COUNT Number of times interest area was exited to a lower IA_ID (to the left in English) before a higher IA_ID was fixated in the trial.
IA_REGRESSION_PATH_DURATION
The summed fixation duration from when the current interest area is first fixated until the eyes enter an interest area with a higher IA_ID.
IA_RIGHT Right side pixel position of non-freehand IA. IA_REGRESSION_PATH_DURA
TION The summed fixation duration from when the current interest area is first fixated until the eyes enter an interest area with a higher IA_ID.
IA_RUN_COUNT Number of times the Interest Area was entered and left (runs)
IA_SECOND_FIXATION_DURATION
Duration of the second fixation in IA, regardless of run.
IA_SECOND_FIXATION_RUN Index of run that the second fixation is in. * IA_SECOND_FIXATION_TIME Time of the second fixation in IA, regardless of
run. IA_SECOND_FIXATION_X The X position of the second fixation event that
was within the current interest area. IA_SECOND_FIXATION_Y The Y position of the second fixation event that
was within the current interest area. IA_SECOND_RUN_DWELL_TIM
E Dwell time (i.e., summation of the duration across all fixations) of the second run of fixations within the current interest area.
* IA_SECOND_RUN_END_TIME End time of the second run of fixations in the current interest area.
IA_SECOND_RUN_FIXATION_ Percentage of all fixations in a trial falling in the
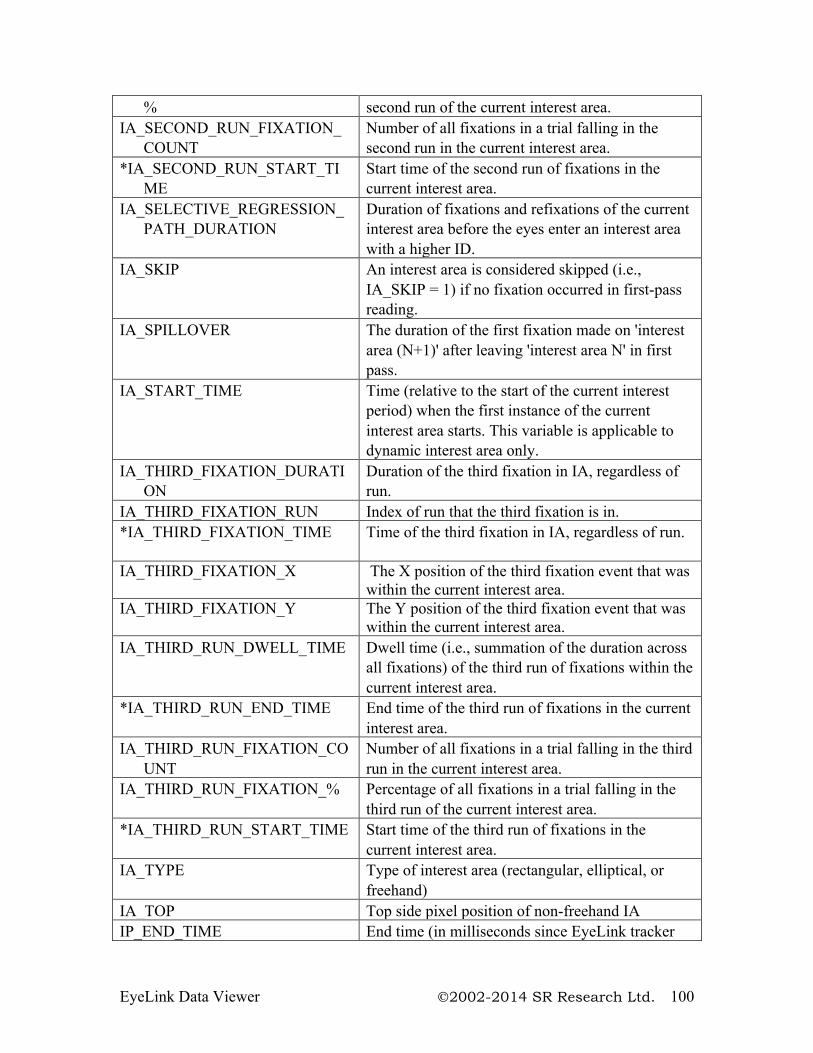
EyeLink Data Viewer 2002-2014 SR Research Ltd. 100
% second run of the current interest area. IA_SECOND_RUN_FIXATION_
COUNT Number of all fixations in a trial falling in the second run in the current interest area.
*IA_SECOND_RUN_START_TIME
Start time of the second run of fixations in the current interest area.
IA_SELECTIVE_REGRESSION_PATH_DURATION
Duration of fixations and refixations of the current interest area before the eyes enter an interest area with a higher ID.
IA_SKIP
An interest area is considered skipped (i.e., IA_SKIP = 1) if no fixation occurred in first-pass reading.
IA_SPILLOVER The duration of the first fixation made on 'interest area (N+1)' after leaving 'interest area N' in first pass.
IA_START_TIME Time (relative to the start of the current interest period) when the first instance of the current interest area starts. This variable is applicable to dynamic interest area only.
IA_THIRD_FIXATION_DURATION
Duration of the third fixation in IA, regardless of run.
IA_THIRD_FIXATION_RUN Index of run that the third fixation is in. *IA_THIRD_FIXATION_TIME
Time of the third fixation in IA, regardless of run.
IA_THIRD_FIXATION_X The X position of the third fixation event that was within the current interest area.
IA_THIRD_FIXATION_Y The Y position of the third fixation event that was within the current interest area.
IA_THIRD_RUN_DWELL_TIME Dwell time (i.e., summation of the duration across all fixations) of the third run of fixations within the current interest area.
*IA_THIRD_RUN_END_TIME End time of the third run of fixations in the current interest area.
IA_THIRD_RUN_FIXATION_COUNT
Number of all fixations in a trial falling in the third run in the current interest area.
IA_THIRD_RUN_FIXATION_% Percentage of all fixations in a trial falling in the third run of the current interest area.
*IA_THIRD_RUN_START_TIME Start time of the third run of fixations in the current interest area.
IA_TYPE Type of interest area (rectangular, elliptical, or freehand)
IA_TOP Top side pixel position of non-freehand IA IP_END_TIME End time (in milliseconds since EyeLink tracker
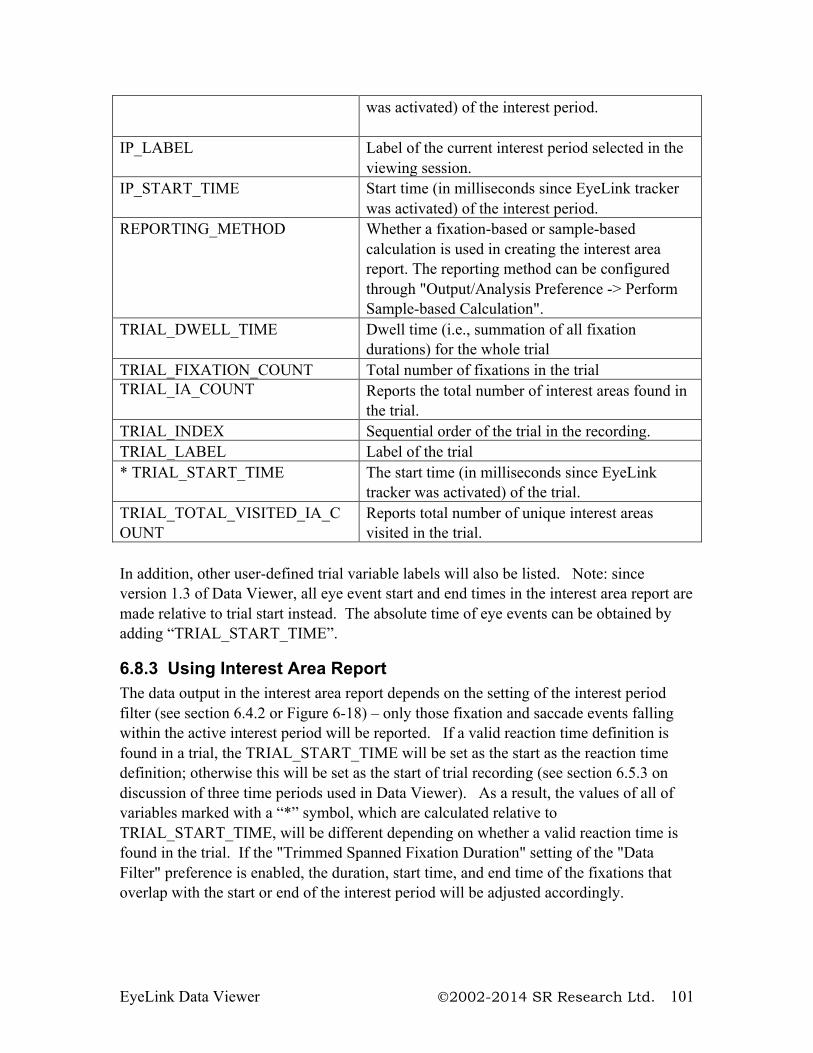
EyeLink Data Viewer 2002-2014 SR Research Ltd. 101
was activated) of the interest period.
IP_LABEL Label of the current interest period selected in the viewing session.
IP_START_TIME Start time (in milliseconds since EyeLink tracker was activated) of the interest period.
REPORTING_METHOD Whether a fixation-based or sample-based calculation is used in creating the interest area report. The reporting method can be configured through "Output/Analysis Preference -> Perform Sample-based Calculation".
TRIAL_DWELL_TIME Dwell time (i.e., summation of all fixation durations) for the whole trial
TRIAL_FIXATION_COUNT Total number of fixations in the trial TRIAL_IA_COUNT Reports the total number of interest areas found in
the trial. TRIAL_INDEX Sequential order of the trial in the recording. TRIAL_LABEL Label of the trial * TRIAL_START_TIME The start time (in milliseconds since EyeLink
tracker was activated) of the trial. TRIAL_TOTAL_VISITED_IA_COUNT
Reports total number of unique interest areas visited in the trial.
In addition, other user-defined trial variable labels will also be listed. Note: since version 1.3 of Data Viewer, all eye event start and end times in the interest area report are made relative to trial start instead. The absolute time of eye events can be obtained by adding “TRIAL_START_TIME”.
6.8.3 Using Interest Area Report The data output in the interest area report depends on the setting of the interest period filter (see section 6.4.2 or Figure 6-18) – only those fixation and saccade events falling within the active interest period will be reported. If a valid reaction time definition is found in a trial, the TRIAL_START_TIME will be set as the start as the reaction time definition; otherwise this will be set as the start of trial recording (see section 6.5.3 on discussion of three time periods used in Data Viewer). As a result, the values of all of variables marked with a “*” symbol, which are calculated relative to TRIAL_START_TIME, will be different depending on whether a valid reaction time is found in the trial. If the "Trimmed Spanned Fixation Duration" setting of the "Data Filter" preference is enabled, the duration, start time, and end time of the fixations that overlap with the start or end of the interest period will be adjusted accordingly.
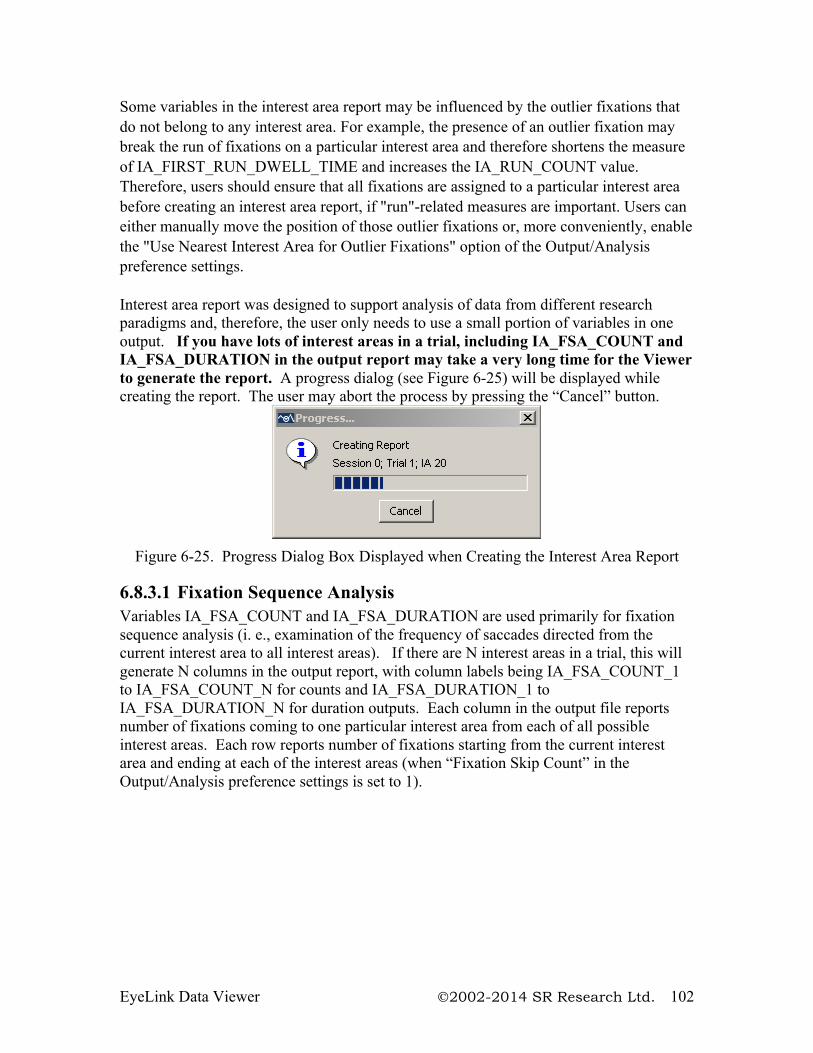
EyeLink Data Viewer 2002-2014 SR Research Ltd. 102
Some variables in the interest area report may be influenced by the outlier fixations that do not belong to any interest area. For example, the presence of an outlier fixation may break the run of fixations on a particular interest area and therefore shortens the measure of IA_FIRST_RUN_DWELL_TIME and increases the IA_RUN_COUNT value. Therefore, users should ensure that all fixations are assigned to a particular interest area before creating an interest area report, if "run"-related measures are important. Users can either manually move the position of those outlier fixations or, more conveniently, enable the "Use Nearest Interest Area for Outlier Fixations" option of the Output/Analysis preference settings. Interest area report was designed to support analysis of data from different research paradigms and, therefore, the user only needs to use a small portion of variables in one output. If you have lots of interest areas in a trial, including IA_FSA_COUNT and IA_FSA_DURATION in the output report may take a very long time for the Viewer to generate the report. A progress dialog (see Figure 6-25) will be displayed while creating the report. The user may abort the process by pressing the “Cancel” button.
Figure 6-25. Progress Dialog Box Displayed when Creating the Interest Area Report
6.8.3.1 Fixation Sequence Analysis Variables IA_FSA_COUNT and IA_FSA_DURATION are used primarily for fixation sequence analysis (i. e., examination of the frequency of saccades directed from the current interest area to all interest areas). If there are N interest areas in a trial, this will generate N columns in the output report, with column labels being IA_FSA_COUNT_1 to IA_FSA_COUNT_N for counts and IA_FSA_DURATION_1 to IA_FSA_DURATION_N for duration outputs. Each column in the output file reports number of fixations coming to one particular interest area from each of all possible interest areas. Each row reports number of fixations starting from the current interest area and ending at each of the interest areas (when “Fixation Skip Count” in the Output/Analysis preference settings is set to 1).
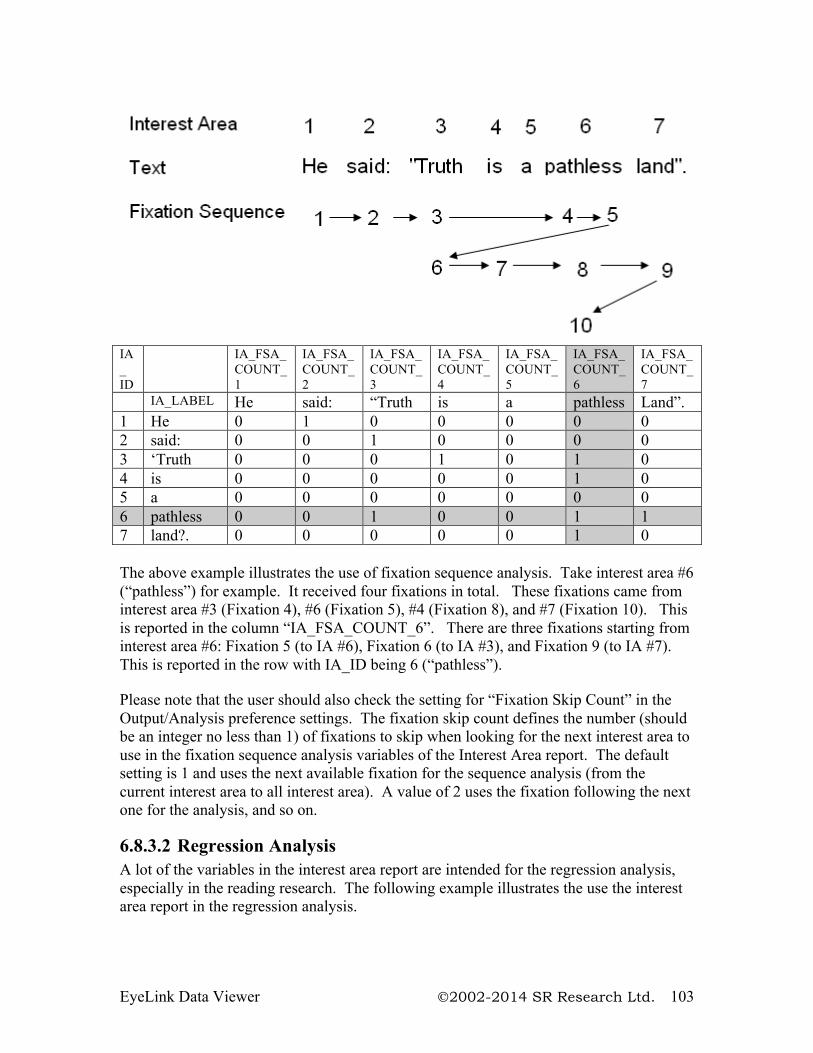
EyeLink Data Viewer 2002-2014 SR Research Ltd. 103
IA_ ID
IA_FSA_COUNT_1
IA_FSA_COUNT_2
IA_FSA_COUNT_3
IA_FSA_COUNT_4
IA_FSA_COUNT_5
IA_FSA_COUNT_6
IA_FSA_COUNT_7
IA_LABEL He said: “Truth is a pathless Land”. 1 He 0 1 0 0 0 0 0 2 said: 0 0 1 0 0 0 0 3 ‘Truth 0 0 0 1 0 1 0 4 is 0 0 0 0 0 1 0 5 a 0 0 0 0 0 0 0 6 pathless 0 0 1 0 0 1 1 7 land?. 0 0 0 0 0 1 0 The above example illustrates the use of fixation sequence analysis. Take interest area #6 (“pathless”) for example. It received four fixations in total. These fixations came from interest area #3 (Fixation 4), #6 (Fixation 5), #4 (Fixation 8), and #7 (Fixation 10). This is reported in the column “IA_FSA_COUNT_6”. There are three fixations starting from interest area #6: Fixation 5 (to IA #6), Fixation 6 (to IA #3), and Fixation 9 (to IA #7). This is reported in the row with IA_ID being 6 (“pathless”). Please note that the user should also check the setting for “Fixation Skip Count” in the Output/Analysis preference settings. The fixation skip count defines the number (should be an integer no less than 1) of fixations to skip when looking for the next interest area to use in the fixation sequence analysis variables of the Interest Area report. The default setting is 1 and uses the next available fixation for the sequence analysis (from the current interest area to all interest area). A value of 2 uses the fixation following the next one for the analysis, and so on.
6.8.3.2 Regression Analysis A lot of the variables in the interest area report are intended for the regression analysis, especially in the reading research. The following example illustrates the use the interest area report in the regression analysis.
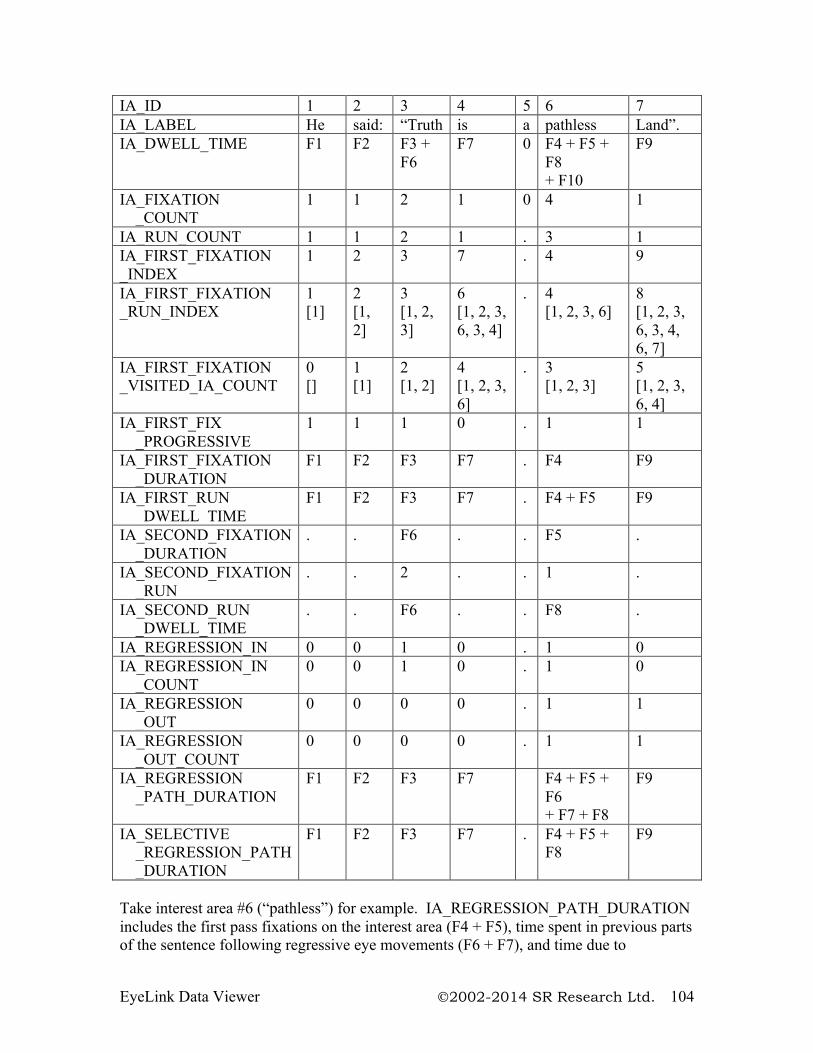
EyeLink Data Viewer 2002-2014 SR Research Ltd. 104
IA_ID 1 2 3 4 5 6 7 IA_LABEL He said: “Truth is a pathless Land”. IA_DWELL_TIME F1 F2 F3 +
F6 F7 0 F4 + F5 +
F8 + F10
F9
IA_FIXATION _COUNT
1 1 2 1 0 4 1
IA_RUN_COUNT 1 1 2 1 . 3 1 IA_FIRST_FIXATION _INDEX
1 2 3 7 . 4 9
IA_FIRST_FIXATION _RUN_INDEX
1 [1]
2 [1, 2]
3 [1, 2, 3]
6 [1, 2, 3, 6, 3, 4]
. 4 [1, 2, 3, 6]
8 [1, 2, 3, 6, 3, 4, 6, 7]
IA_FIRST_FIXATION _VISITED_IA_COUNT
0 []
1 [1]
2 [1, 2]
4 [1, 2, 3, 6]
. 3 [1, 2, 3]
5 [1, 2, 3, 6, 4]
IA_FIRST_FIX _PROGRESSIVE
1 1 1 0 . 1 1
IA_FIRST_FIXATION _DURATION
F1 F2 F3 F7 . F4 F9
IA_FIRST_RUN _DWELL_TIME
F1 F2 F3 F7 . F4 + F5 F9
IA_SECOND_FIXATION _DURATION
. . F6 . . F5 .
IA_SECOND_FIXATION _RUN
. . 2 . . 1 .
IA_SECOND_RUN _DWELL_TIME
. . F6 . . F8 .
IA_REGRESSION_IN 0 0 1 0 . 1 0 IA_REGRESSION_IN _COUNT
0 0 1 0 . 1 0
IA_REGRESSION _OUT
0 0 0 0 . 1 1
IA_REGRESSION _OUT_COUNT
0 0 0 0 . 1 1
IA_REGRESSION _PATH_DURATION
F1 F2 F3 F7 F4 + F5 + F6 + F7 + F8
F9
IA_SELECTIVE _REGRESSION_PATH _DURATION
F1 F2 F3 F7 . F4 + F5 + F8
F9
Take interest area #6 (“pathless”) for example. IA_REGRESSION_PATH_DURATION includes the first pass fixations on the interest area (F4 + F5), time spent in previous parts of the sentence following regressive eye movements (F6 + F7), and time due to
EyeLink Data Viewer 2002-2014 SR Research Ltd. 105
refixations coming from the left before the eyes move past the interest area (F8). The calculation of IA_SELECTIVE_REGRESSION_PATH_DURATION only includes the first run fixation on the interest area (F4+F5) and the refixations on the interest area (F8) before the eyes enter next interest area with a higher IA_ID (“land”). IA_FIRST_FIX_PROGRESSIVE checks whether later interest areas have been visited before the first fixation enters the current interest area. Therefore, this variable would be 0 for the interest area “is” because it was fixated on Fixation 7 while Fixations 4 and 5 were on later part of the sentence (“pathless”). IA_REGRESSION_OUT checks whether at least one regression was made from the current interest area to previous parts of the sentence prior to leaving that interest area in a forward direction. Therefore, the transition from F5 → F6 makes this flag true for the interest area #6 (labeled as “pathless”). IA_REGRESSION_IN checks whether a given interest area received at least one regression from later parts of the sentence. Therefore, this is true for both interest areas #3 “truth” (F5 → F6) and #6 “pathless” (F9 → F10). 6.9 Sample Output Report Sample output report provides a columnar output of eye movement data for each eye sample in a trial. The sample report option will not be available if the samples are not loaded into a viewing session. As in the other reports, sample output report only outputs samples that fall within the active interest period for the trial. 6.9.1 Loading Samples into a Viewing Session Version 1.7 of Data Viewer introduced a change to optimize the viewer performance by not loading the samples by default (see revision history). To make sample data available to a viewing session, you will need to first change the data loading preferences and then reload the EDf file.
1) Before loading any EDF files, please go to "Start -> Programs -> SR Research -> EyeLink -> Data Viewer" to start the software.
2) Once the application starts up, click "Preferences" tab and go to "Data Loading" preferences. Check the "Load Samples" option. If you want this changes to be persistent over future viewing sessions, you may consider saving this as default setting. This can be done by selecting the topmost preference tree node, clicking the right mouse buttons and selecting "Save Properties as Defaults".
3) Once you have done step 2), this will make the properties persist over future data viewing sessions. Now, start loading in the EDF files.
6.9.2 Obtaining a Sample Output Report To obtain an output report for samples, 1) From the application menus, choose: Analysis -> Report -> Sample Report
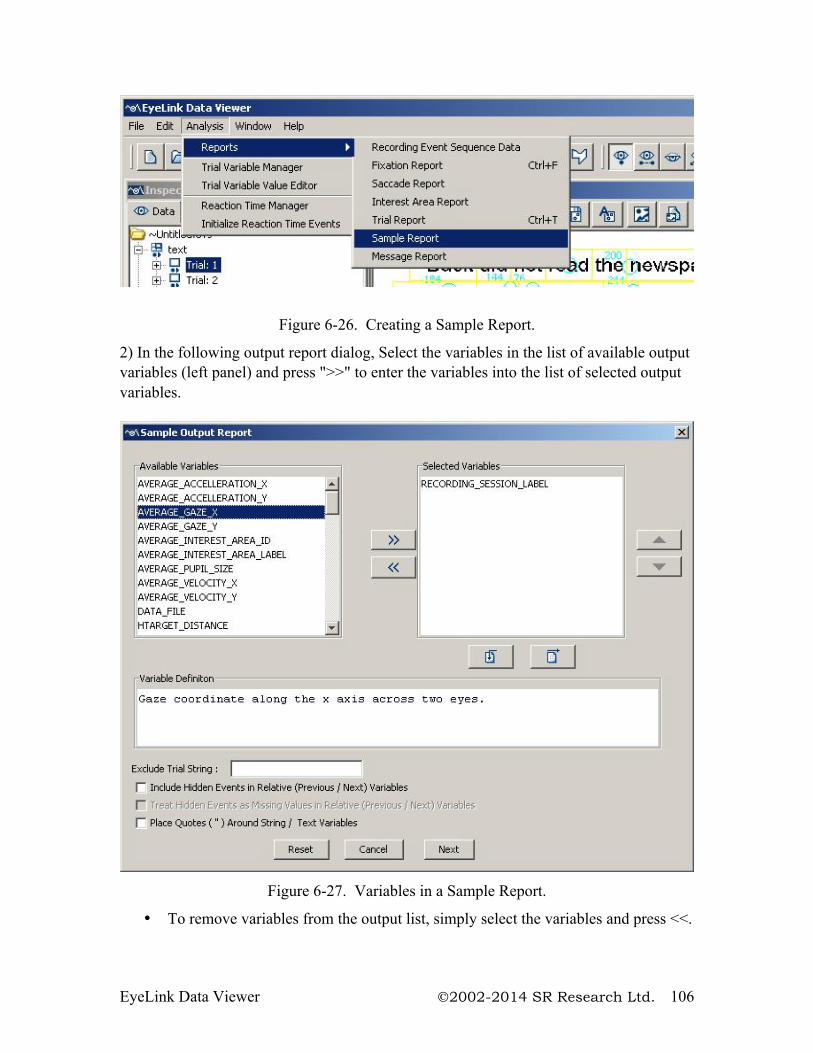
EyeLink Data Viewer 2002-2014 SR Research Ltd. 106
Figure 6-26. Creating a Sample Report.
2) In the following output report dialog, Select the variables in the list of available output variables (left panel) and press ">>" to enter the variables into the list of selected output variables.
Figure 6-27. Variables in a Sample Report.
• To remove variables from the output list, simply select the variables and press <<.
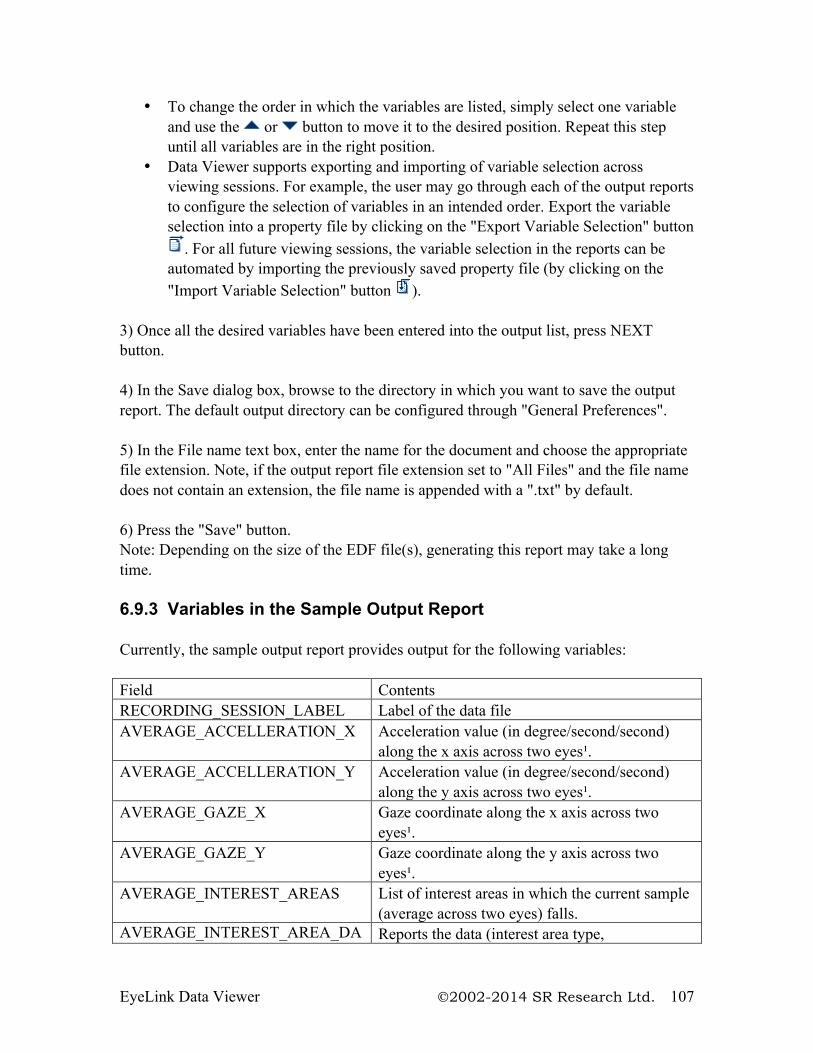
EyeLink Data Viewer 2002-2014 SR Research Ltd. 107
• To change the order in which the variables are listed, simply select one variable and use the or button to move it to the desired position. Repeat this step until all variables are in the right position.
• Data Viewer supports exporting and importing of variable selection across viewing sessions. For example, the user may go through each of the output reports to configure the selection of variables in an intended order. Export the variable selection into a property file by clicking on the "Export Variable Selection" button
. For all future viewing sessions, the variable selection in the reports can be automated by importing the previously saved property file (by clicking on the "Import Variable Selection" button ).
3) Once all the desired variables have been entered into the output list, press NEXT button. 4) In the Save dialog box, browse to the directory in which you want to save the output report. The default output directory can be configured through "General Preferences". 5) In the File name text box, enter the name for the document and choose the appropriate file extension. Note, if the output report file extension set to "All Files" and the file name does not contain an extension, the file name is appended with a ".txt" by default. 6) Press the "Save" button. Note: Depending on the size of the EDF file(s), generating this report may take a long time.
6.9.3 Variables in the Sample Output Report Currently, the sample output report provides output for the following variables: Field Contents RECORDING_SESSION_LABEL Label of the data file AVERAGE_ACCELLERATION_X Acceleration value (in degree/second/second)
along the x axis across two eyes¹. AVERAGE_ACCELLERATION_Y Acceleration value (in degree/second/second)
along the y axis across two eyes¹. AVERAGE_GAZE_X Gaze coordinate along the x axis across two
eyes¹. AVERAGE_GAZE_Y Gaze coordinate along the y axis across two
eyes¹. AVERAGE_INTEREST_AREAS List of interest areas in which the current sample
(average across two eyes) falls. AVERAGE_INTEREST_AREA_DA Reports the data (interest area type,
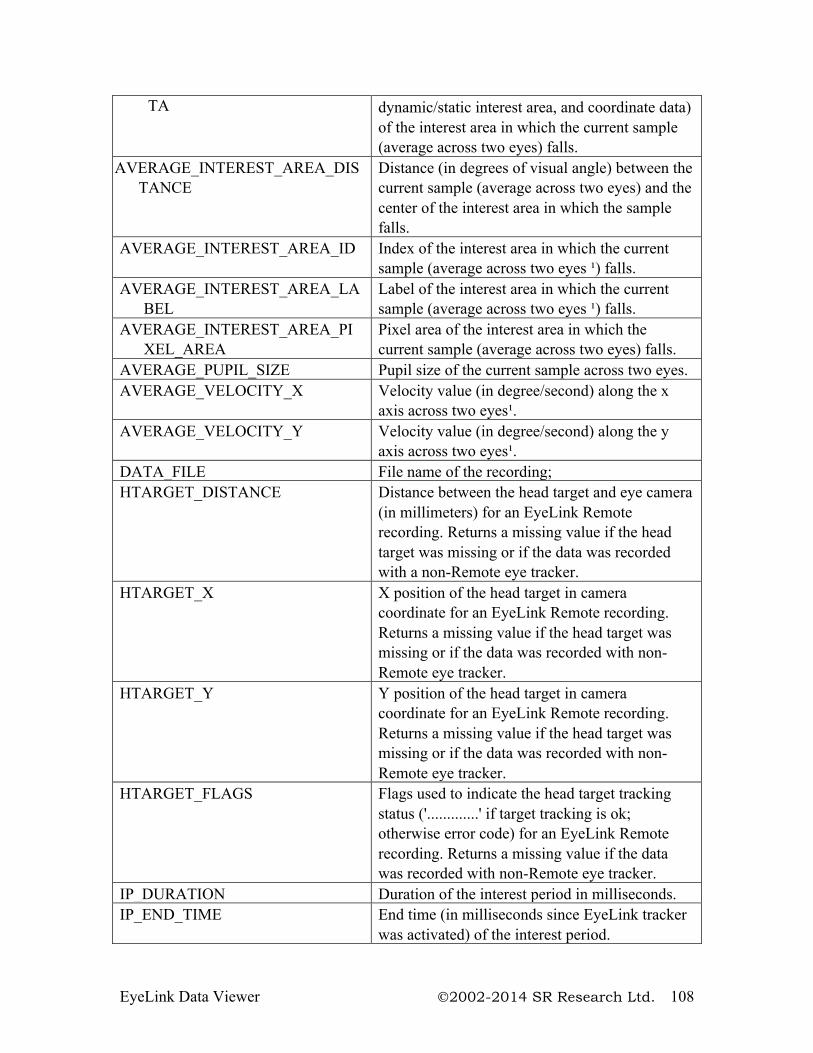
EyeLink Data Viewer 2002-2014 SR Research Ltd. 108
TA dynamic/static interest area, and coordinate data) of the interest area in which the current sample (average across two eyes) falls.
AVERAGE_INTEREST_AREA_DISTANCE
Distance (in degrees of visual angle) between the current sample (average across two eyes) and the center of the interest area in which the sample falls.
AVERAGE_INTEREST_AREA_ID Index of the interest area in which the current sample (average across two eyes ¹) falls.
AVERAGE_INTEREST_AREA_LABEL
Label of the interest area in which the current sample (average across two eyes ¹) falls.
AVERAGE_INTEREST_AREA_PIXEL_AREA
Pixel area of the interest area in which the current sample (average across two eyes) falls.
AVERAGE_PUPIL_SIZE Pupil size of the current sample across two eyes. AVERAGE_VELOCITY_X Velocity value (in degree/second) along the x
axis across two eyes¹. AVERAGE_VELOCITY_Y Velocity value (in degree/second) along the y
axis across two eyes¹. DATA_FILE File name of the recording; HTARGET_DISTANCE Distance between the head target and eye camera
(in millimeters) for an EyeLink Remote recording. Returns a missing value if the head target was missing or if the data was recorded with a non-Remote eye tracker.
HTARGET_X X position of the head target in camera coordinate for an EyeLink Remote recording. Returns a missing value if the head target was missing or if the data was recorded with non-Remote eye tracker.
HTARGET_Y Y position of the head target in camera coordinate for an EyeLink Remote recording. Returns a missing value if the head target was missing or if the data was recorded with non-Remote eye tracker.
HTARGET_FLAGS Flags used to indicate the head target tracking status ('.............' if target tracking is ok; otherwise error code) for an EyeLink Remote recording. Returns a missing value if the data was recorded with non-Remote eye tracker.
IP_DURATION Duration of the interest period in milliseconds. IP_END_TIME End time (in milliseconds since EyeLink tracker
was activated) of the interest period.
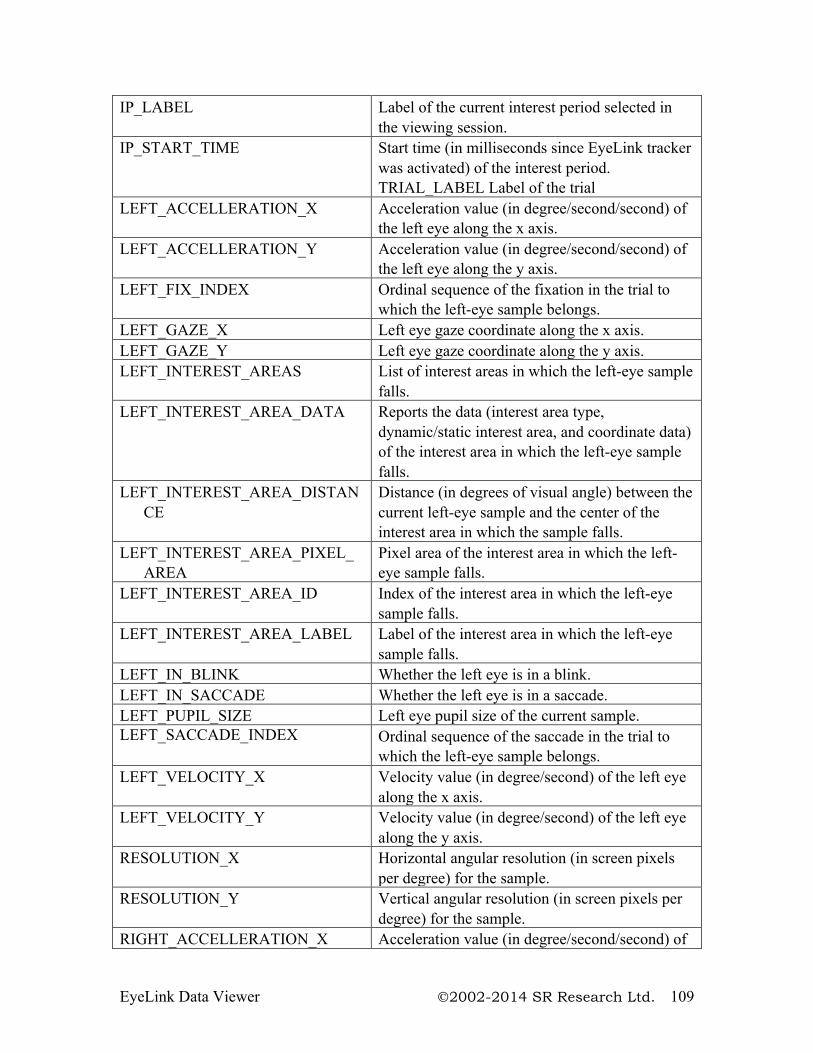
EyeLink Data Viewer 2002-2014 SR Research Ltd. 109
IP_LABEL Label of the current interest period selected in the viewing session.
IP_START_TIME Start time (in milliseconds since EyeLink tracker was activated) of the interest period. TRIAL_LABEL Label of the trial
LEFT_ACCELLERATION_X Acceleration value (in degree/second/second) of the left eye along the x axis.
LEFT_ACCELLERATION_Y Acceleration value (in degree/second/second) of the left eye along the y axis.
LEFT_FIX_INDEX Ordinal sequence of the fixation in the trial to which the left-eye sample belongs.
LEFT_GAZE_X Left eye gaze coordinate along the x axis. LEFT_GAZE_Y Left eye gaze coordinate along the y axis. LEFT_INTEREST_AREAS List of interest areas in which the left-eye sample
falls. LEFT_INTEREST_AREA_DATA Reports the data (interest area type,
dynamic/static interest area, and coordinate data) of the interest area in which the left-eye sample falls.
LEFT_INTEREST_AREA_DISTANCE
Distance (in degrees of visual angle) between the current left-eye sample and the center of the interest area in which the sample falls.
LEFT_INTEREST_AREA_PIXEL_AREA
Pixel area of the interest area in which the left-eye sample falls.
LEFT_INTEREST_AREA_ID Index of the interest area in which the left-eye sample falls.
LEFT_INTEREST_AREA_LABEL Label of the interest area in which the left-eye sample falls.
LEFT_IN_BLINK Whether the left eye is in a blink. LEFT_IN_SACCADE Whether the left eye is in a saccade. LEFT_PUPIL_SIZE Left eye pupil size of the current sample. LEFT_SACCADE_INDEX Ordinal sequence of the saccade in the trial to
which the left-eye sample belongs. LEFT_VELOCITY_X Velocity value (in degree/second) of the left eye
along the x axis. LEFT_VELOCITY_Y Velocity value (in degree/second) of the left eye
along the y axis. RESOLUTION_X Horizontal angular resolution (in screen pixels
per degree) for the sample. RESOLUTION_Y Vertical angular resolution (in screen pixels per
degree) for the sample. RIGHT_ACCELLERATION_X Acceleration value (in degree/second/second) of
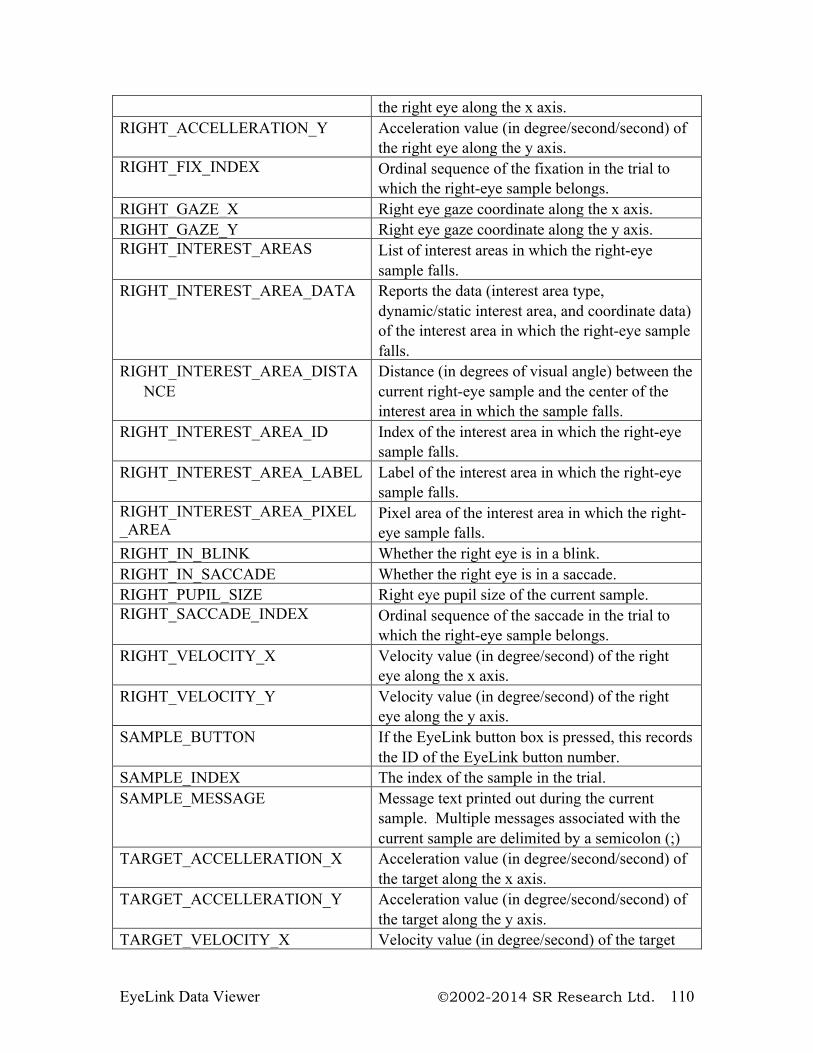
EyeLink Data Viewer 2002-2014 SR Research Ltd. 110
the right eye along the x axis. RIGHT_ACCELLERATION_Y Acceleration value (in degree/second/second) of
the right eye along the y axis. RIGHT_FIX_INDEX Ordinal sequence of the fixation in the trial to
which the right-eye sample belongs. RIGHT_GAZE_X Right eye gaze coordinate along the x axis. RIGHT_GAZE_Y Right eye gaze coordinate along the y axis. RIGHT_INTEREST_AREAS List of interest areas in which the right-eye
sample falls. RIGHT_INTEREST_AREA_DATA Reports the data (interest area type,
dynamic/static interest area, and coordinate data) of the interest area in which the right-eye sample falls.
RIGHT_INTEREST_AREA_DISTANCE
Distance (in degrees of visual angle) between the current right-eye sample and the center of the interest area in which the sample falls.
RIGHT_INTEREST_AREA_ID Index of the interest area in which the right-eye sample falls.
RIGHT_INTEREST_AREA_LABEL Label of the interest area in which the right-eye sample falls.
RIGHT_INTEREST_AREA_PIXEL_AREA
Pixel area of the interest area in which the right-eye sample falls.
RIGHT_IN_BLINK Whether the right eye is in a blink. RIGHT_IN_SACCADE Whether the right eye is in a saccade. RIGHT_PUPIL_SIZE Right eye pupil size of the current sample. RIGHT_SACCADE_INDEX
Ordinal sequence of the saccade in the trial to which the right-eye sample belongs.
RIGHT_VELOCITY_X Velocity value (in degree/second) of the right eye along the x axis.
RIGHT_VELOCITY_Y Velocity value (in degree/second) of the right eye along the y axis.
SAMPLE_BUTTON If the EyeLink button box is pressed, this records the ID of the EyeLink button number.
SAMPLE_INDEX The index of the sample in the trial. SAMPLE_MESSAGE Message text printed out during the current
sample. Multiple messages associated with the current sample are delimited by a semicolon (;)
TARGET_ACCELLERATION_X Acceleration value (in degree/second/second) of the target along the x axis.
TARGET_ACCELLERATION_Y Acceleration value (in degree/second/second) of the target along the y axis.
TARGET_VELOCITY_X Velocity value (in degree/second) of the target
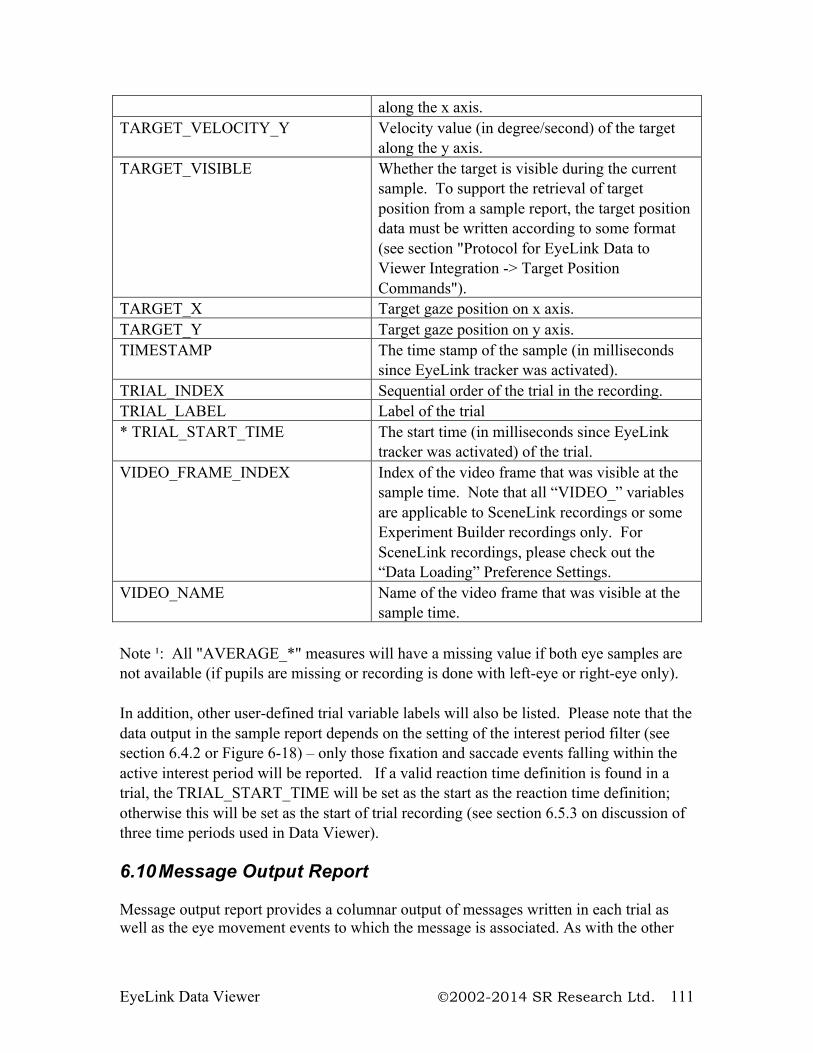
EyeLink Data Viewer 2002-2014 SR Research Ltd. 111
along the x axis. TARGET_VELOCITY_Y Velocity value (in degree/second) of the target
along the y axis. TARGET_VISIBLE Whether the target is visible during the current
sample. To support the retrieval of target position from a sample report, the target position data must be written according to some format (see section "Protocol for EyeLink Data to Viewer Integration -> Target Position Commands").
TARGET_X Target gaze position on x axis. TARGET_Y Target gaze position on y axis. TIMESTAMP The time stamp of the sample (in milliseconds
since EyeLink tracker was activated). TRIAL_INDEX Sequential order of the trial in the recording. TRIAL_LABEL Label of the trial * TRIAL_START_TIME The start time (in milliseconds since EyeLink
tracker was activated) of the trial. VIDEO_FRAME_INDEX
Index of the video frame that was visible at the sample time. Note that all “VIDEO_” variables are applicable to SceneLink recordings or some Experiment Builder recordings only. For SceneLink recordings, please check out the “Data Loading” Preference Settings.
VIDEO_NAME Name of the video frame that was visible at the sample time.
Note ¹: All "AVERAGE_*" measures will have a missing value if both eye samples are not available (if pupils are missing or recording is done with left-eye or right-eye only). In addition, other user-defined trial variable labels will also be listed. Please note that the data output in the sample report depends on the setting of the interest period filter (see section 6.4.2 or Figure 6-18) – only those fixation and saccade events falling within the active interest period will be reported. If a valid reaction time definition is found in a trial, the TRIAL_START_TIME will be set as the start as the reaction time definition; otherwise this will be set as the start of trial recording (see section 6.5.3 on discussion of three time periods used in Data Viewer). 6.10 Message Output Report Message output report provides a columnar output of messages written in each trial as well as the eye movement events to which the message is associated. As with the other
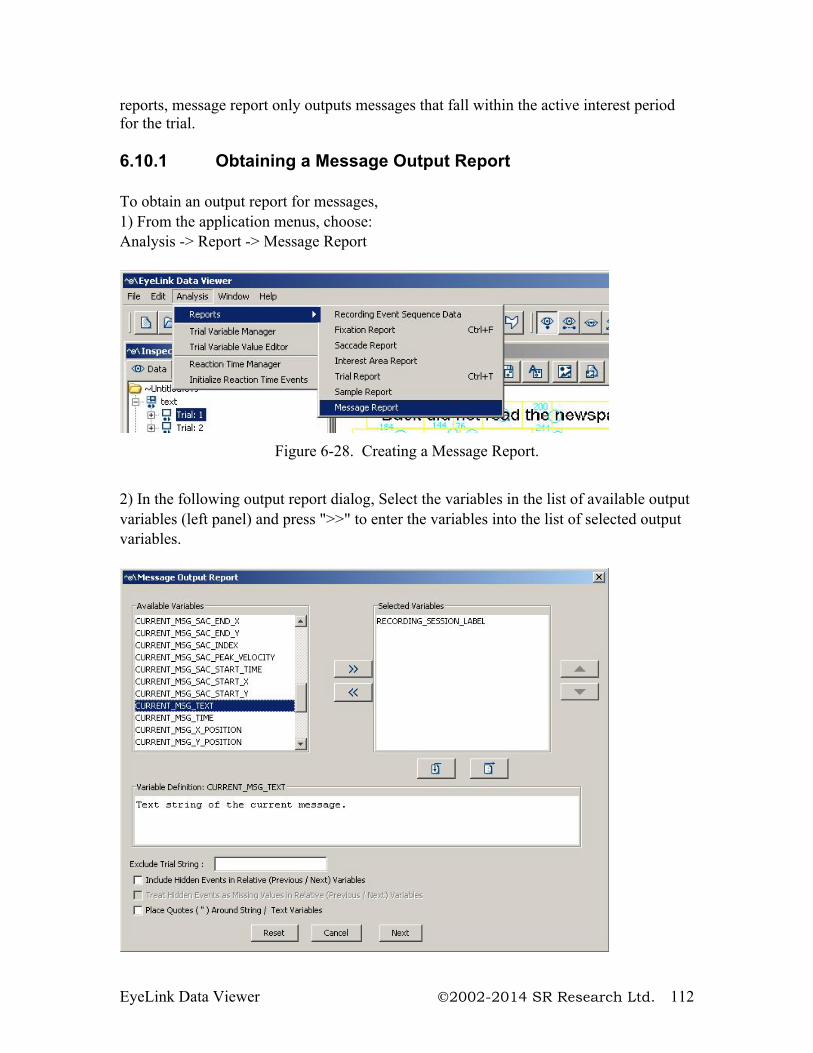
EyeLink Data Viewer 2002-2014 SR Research Ltd. 112
reports, message report only outputs messages that fall within the active interest period for the trial. 6.10.1 Obtaining a Message Output Report To obtain an output report for messages, 1) From the application menus, choose: Analysis -> Report -> Message Report
Figure 6-28. Creating a Message Report.
2) In the following output report dialog, Select the variables in the list of available output variables (left panel) and press ">>" to enter the variables into the list of selected output variables.
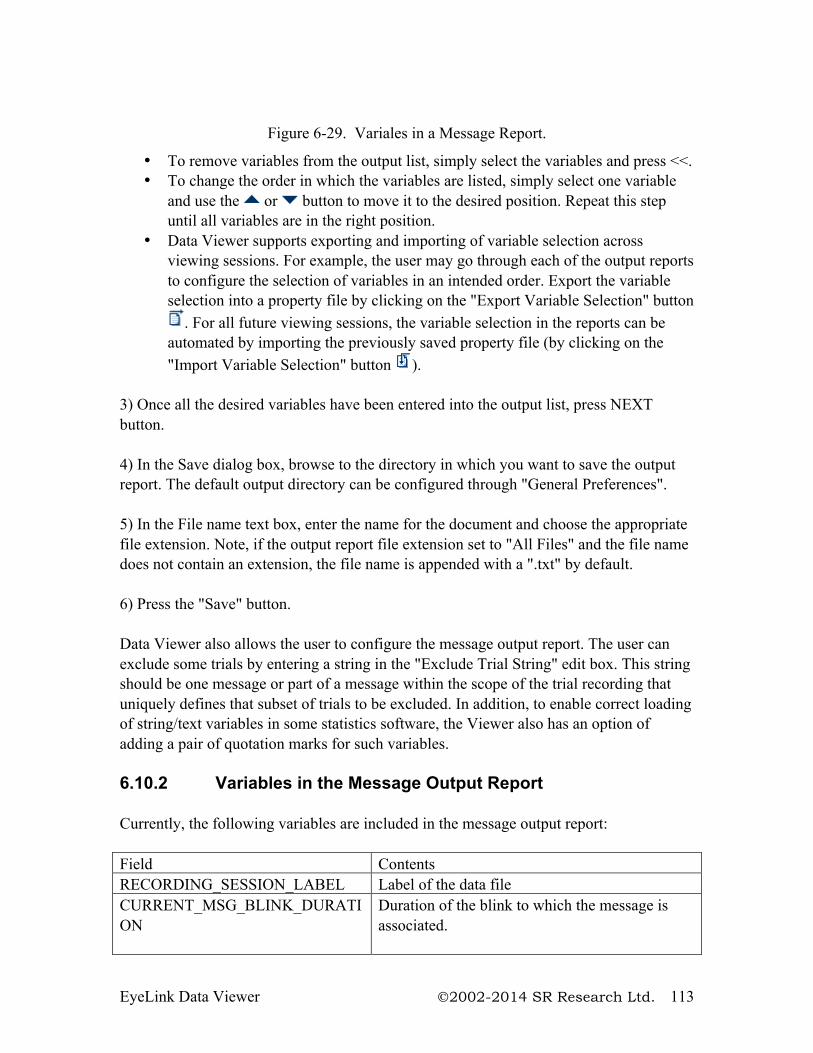
EyeLink Data Viewer 2002-2014 SR Research Ltd. 113
Figure 6-29. Variales in a Message Report.
• To remove variables from the output list, simply select the variables and press <<. • To change the order in which the variables are listed, simply select one variable
and use the or button to move it to the desired position. Repeat this step until all variables are in the right position.
• Data Viewer supports exporting and importing of variable selection across viewing sessions. For example, the user may go through each of the output reports to configure the selection of variables in an intended order. Export the variable selection into a property file by clicking on the "Export Variable Selection" button
. For all future viewing sessions, the variable selection in the reports can be automated by importing the previously saved property file (by clicking on the "Import Variable Selection" button ).
3) Once all the desired variables have been entered into the output list, press NEXT button. 4) In the Save dialog box, browse to the directory in which you want to save the output report. The default output directory can be configured through "General Preferences". 5) In the File name text box, enter the name for the document and choose the appropriate file extension. Note, if the output report file extension set to "All Files" and the file name does not contain an extension, the file name is appended with a ".txt" by default. 6) Press the "Save" button. Data Viewer also allows the user to configure the message output report. The user can exclude some trials by entering a string in the "Exclude Trial String" edit box. This string should be one message or part of a message within the scope of the trial recording that uniquely defines that subset of trials to be excluded. In addition, to enable correct loading of string/text variables in some statistics software, the Viewer also has an option of adding a pair of quotation marks for such variables.
6.10.2 Variables in the Message Output Report Currently, the following variables are included in the message output report: Field Contents RECORDING_SESSION_LABEL Label of the data file CURRENT_MSG_BLINK_DURATION
Duration of the blink to which the message is associated.
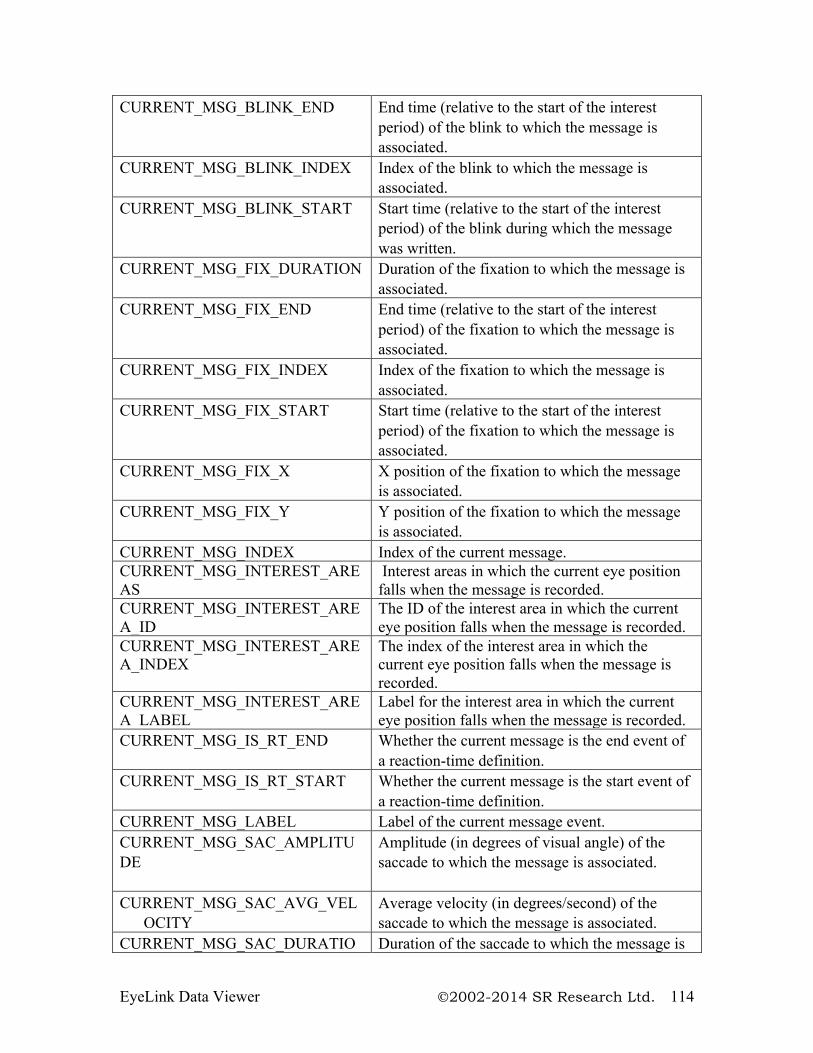
EyeLink Data Viewer 2002-2014 SR Research Ltd. 114
CURRENT_MSG_BLINK_END
End time (relative to the start of the interest period) of the blink to which the message is associated.
CURRENT_MSG_BLINK_INDEX Index of the blink to which the message is associated.
CURRENT_MSG_BLINK_START Start time (relative to the start of the interest period) of the blink during which the message was written.
CURRENT_MSG_FIX_DURATION Duration of the fixation to which the message is associated.
CURRENT_MSG_FIX_END End time (relative to the start of the interest period) of the fixation to which the message is associated.
CURRENT_MSG_FIX_INDEX Index of the fixation to which the message is associated.
CURRENT_MSG_FIX_START Start time (relative to the start of the interest period) of the fixation to which the message is associated.
CURRENT_MSG_FIX_X
X position of the fixation to which the message is associated.
CURRENT_MSG_FIX_Y Y position of the fixation to which the message is associated.
CURRENT_MSG_INDEX Index of the current message. CURRENT_MSG_INTEREST_AREAS
Interest areas in which the current eye position falls when the message is recorded.
CURRENT_MSG_INTEREST_AREA_ID
The ID of the interest area in which the current eye position falls when the message is recorded.
CURRENT_MSG_INTEREST_AREA_INDEX
The index of the interest area in which the current eye position falls when the message is recorded.
CURRENT_MSG_INTEREST_AREA_LABEL
Label for the interest area in which the current eye position falls when the message is recorded.
CURRENT_MSG_IS_RT_END Whether the current message is the end event of a reaction-time definition.
CURRENT_MSG_IS_RT_START Whether the current message is the start event of a reaction-time definition.
CURRENT_MSG_LABEL Label of the current message event. CURRENT_MSG_SAC_AMPLITUDE
Amplitude (in degrees of visual angle) of the saccade to which the message is associated.
CURRENT_MSG_SAC_AVG_VELOCITY
Average velocity (in degrees/second) of the saccade to which the message is associated.
CURRENT_MSG_SAC_DURATIO Duration of the saccade to which the message is
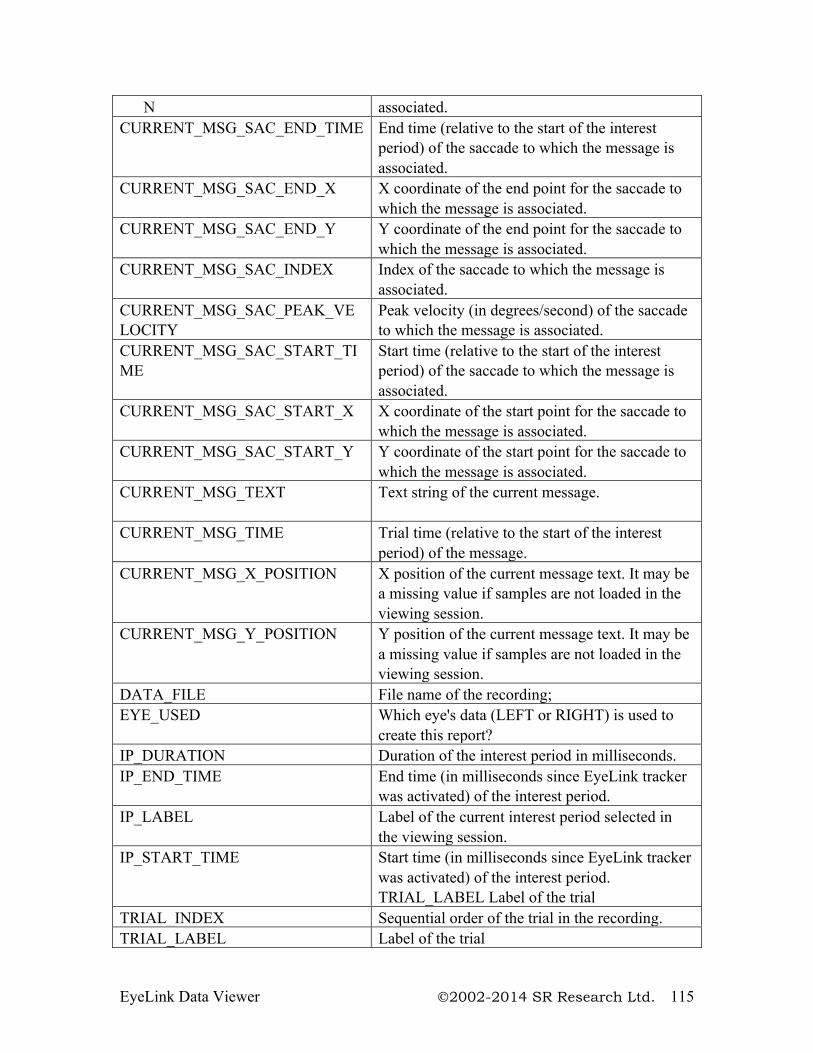
EyeLink Data Viewer 2002-2014 SR Research Ltd. 115
N associated. CURRENT_MSG_SAC_END_TIME End time (relative to the start of the interest
period) of the saccade to which the message is associated.
CURRENT_MSG_SAC_END_X
X coordinate of the end point for the saccade to which the message is associated.
CURRENT_MSG_SAC_END_Y Y coordinate of the end point for the saccade to which the message is associated.
CURRENT_MSG_SAC_INDEX
Index of the saccade to which the message is associated.
CURRENT_MSG_SAC_PEAK_VELOCITY
Peak velocity (in degrees/second) of the saccade to which the message is associated.
CURRENT_MSG_SAC_START_TIME
Start time (relative to the start of the interest period) of the saccade to which the message is associated.
CURRENT_MSG_SAC_START_X X coordinate of the start point for the saccade to which the message is associated.
CURRENT_MSG_SAC_START_Y Y coordinate of the start point for the saccade to which the message is associated.
CURRENT_MSG_TEXT
Text string of the current message.
CURRENT_MSG_TIME Trial time (relative to the start of the interest period) of the message.
CURRENT_MSG_X_POSITION X position of the current message text. It may be a missing value if samples are not loaded in the viewing session.
CURRENT_MSG_Y_POSITION Y position of the current message text. It may be a missing value if samples are not loaded in the viewing session.
DATA_FILE File name of the recording; EYE_USED Which eye's data (LEFT or RIGHT) is used to
create this report? IP_DURATION Duration of the interest period in milliseconds. IP_END_TIME End time (in milliseconds since EyeLink tracker
was activated) of the interest period. IP_LABEL Label of the current interest period selected in
the viewing session. IP_START_TIME Start time (in milliseconds since EyeLink tracker
was activated) of the interest period. TRIAL_LABEL Label of the trial
TRIAL_INDEX Sequential order of the trial in the recording. TRIAL_LABEL Label of the trial
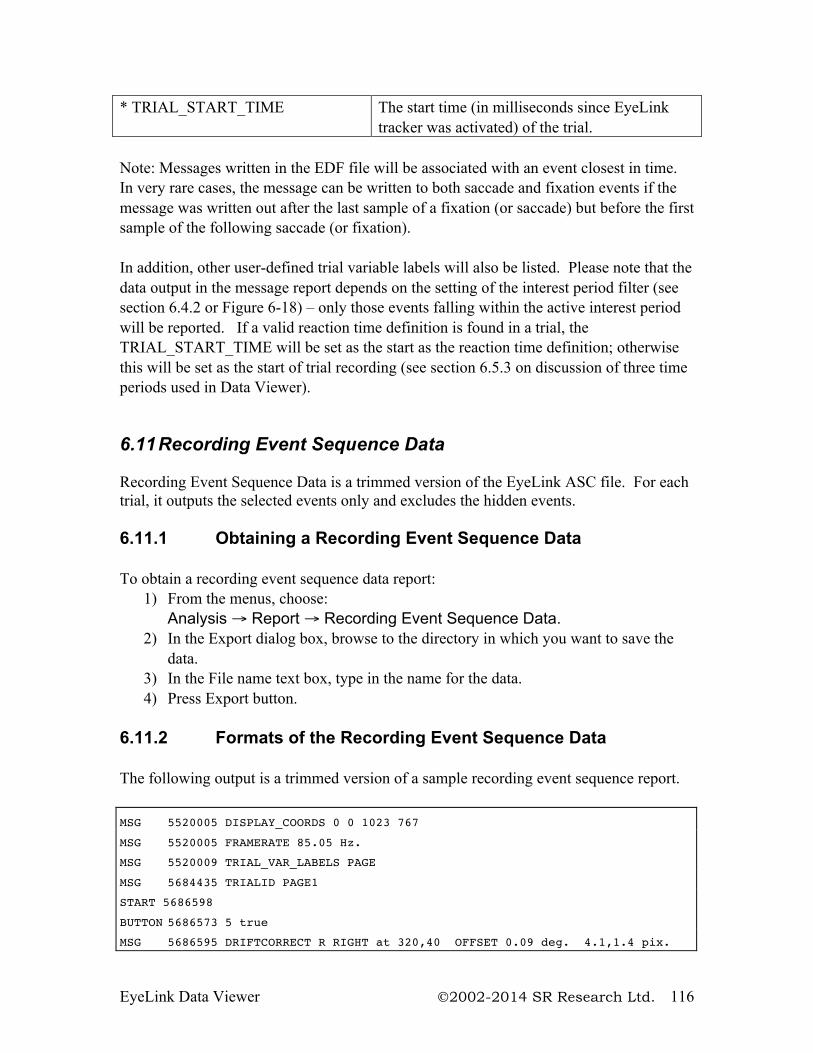
EyeLink Data Viewer 2002-2014 SR Research Ltd. 116
* TRIAL_START_TIME The start time (in milliseconds since EyeLink tracker was activated) of the trial.
Note: Messages written in the EDF file will be associated with an event closest in time. In very rare cases, the message can be written to both saccade and fixation events if the message was written out after the last sample of a fixation (or saccade) but before the first sample of the following saccade (or fixation). In addition, other user-defined trial variable labels will also be listed. Please note that the data output in the message report depends on the setting of the interest period filter (see section 6.4.2 or Figure 6-18) – only those events falling within the active interest period will be reported. If a valid reaction time definition is found in a trial, the TRIAL_START_TIME will be set as the start as the reaction time definition; otherwise this will be set as the start of trial recording (see section 6.5.3 on discussion of three time periods used in Data Viewer). 6.11 Recording Event Sequence Data Recording Event Sequence Data is a trimmed version of the EyeLink ASC file. For each trial, it outputs the selected events only and excludes the hidden events. 6.11.1 Obtaining a Recording Event Sequence Data To obtain a recording event sequence data report:
1) From the menus, choose: Analysis → Report → Recording Event Sequence Data.
2) In the Export dialog box, browse to the directory in which you want to save the data.
3) In the File name text box, type in the name for the data. 4) Press Export button.
6.11.2 Formats of the Recording Event Sequence Data The following output is a trimmed version of a sample recording event sequence report. MSG 5520005 DISPLAY_COORDS 0 0 1023 767
MSG 5520005 FRAMERATE 85.05 Hz.
MSG 5520009 TRIAL_VAR_LABELS PAGE
MSG 5684435 TRIALID PAGE1
START 5686598
BUTTON 5686573 5 true
MSG 5686595 DRIFTCORRECT R RIGHT at 320,40 OFFSET 0.09 deg. 4.1,1.4 pix.
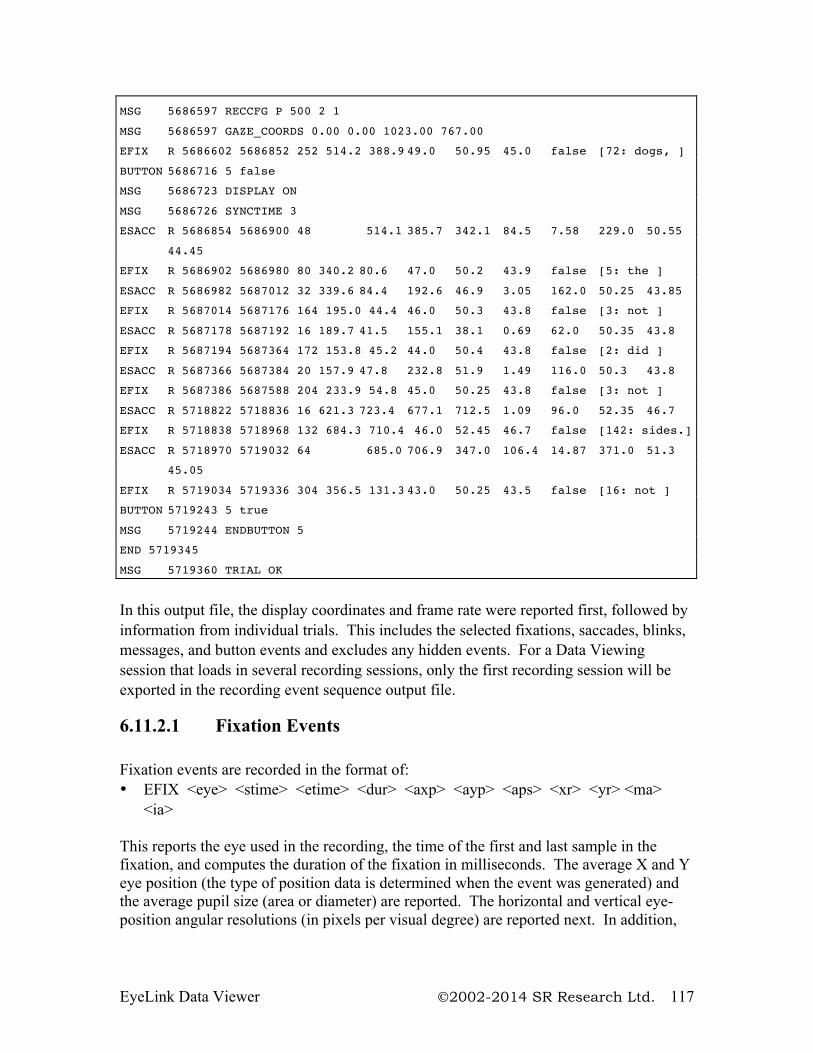
EyeLink Data Viewer 2002-2014 SR Research Ltd. 117
MSG 5686597 RECCFG P 500 2 1
MSG 5686597 GAZE_COORDS 0.00 0.00 1023.00 767.00
EFIX R 5686602 5686852 252 514.2 388.9 49.0 50.95 45.0 false [72: dogs, ]
BUTTON 5686716 5 false
MSG 5686723 DISPLAY ON
MSG 5686726 SYNCTIME 3
ESACC R 5686854 5686900 48 514.1 385.7 342.1 84.5 7.58 229.0 50.55
44.45
EFIX R 5686902 5686980 80 340.2 80.6 47.0 50.2 43.9 false [5: the ]
ESACC R 5686982 5687012 32 339.6 84.4 192.6 46.9 3.05 162.0 50.25 43.85
EFIX R 5687014 5687176 164 195.0 44.4 46.0 50.3 43.8 false [3: not ]
ESACC R 5687178 5687192 16 189.7 41.5 155.1 38.1 0.69 62.0 50.35 43.8
EFIX R 5687194 5687364 172 153.8 45.2 44.0 50.4 43.8 false [2: did ]
ESACC R 5687366 5687384 20 157.9 47.8 232.8 51.9 1.49 116.0 50.3 43.8
EFIX R 5687386 5687588 204 233.9 54.8 45.0 50.25 43.8 false [3: not ]
ESACC R 5718822 5718836 16 621.3 723.4 677.1 712.5 1.09 96.0 52.35 46.7
EFIX R 5718838 5718968 132 684.3 710.4 46.0 52.45 46.7 false [142: sides.]
ESACC R 5718970 5719032 64 685.0 706.9 347.0 106.4 14.87 371.0 51.3
45.05
EFIX R 5719034 5719336 304 356.5 131.3 43.0 50.25 43.5 false [16: not ]
BUTTON 5719243 5 true
MSG 5719244 ENDBUTTON 5
END 5719345
MSG 5719360 TRIAL OK
In this output file, the display coordinates and frame rate were reported first, followed by information from individual trials. This includes the selected fixations, saccades, blinks, messages, and button events and excludes any hidden events. For a Data Viewing session that loads in several recording sessions, only the first recording session will be exported in the recording event sequence output file.
6.11.2.1 Fixation Events Fixation events are recorded in the format of: • EFIX <eye> <stime> <etime> <dur> <axp> <ayp> <aps> <xr> <yr> <ma>
<ia> This reports the eye used in the recording, the time of the first and last sample in the fixation, and computes the duration of the fixation in milliseconds. The average X and Y eye position (the type of position data is determined when the event was generated) and the average pupil size (area or diameter) are reported. The horizontal and vertical eye-position angular resolutions (in pixels per visual degree) are reported next. In addition,
EyeLink Data Viewer 2002-2014 SR Research Ltd. 118
the output contains information on whether the fixation has been manually adjusted <ma> and the ID and name of the interest area in which the current fixation falls <ia>.
6.11.2.2 Saccade Events Saccade events are recorded in the format of:
• ESACC <eye> <stime> <etime> <dur> <sxp> <syp> <exp> <eyp> <ampl> <pv> <xr> <yr>
This reports the time of the first and last sample in the saccade, and computes its duration in milliseconds. The X and Y eye position at the start and end of the saccade (<sxp>, <syp>, <exp>, <eyp>) are listed. The total visual angle covered in the saccade is reported by <ampl>, which can be divided by (<dur>/1000) to obtain the average velocity. Peak velocity is given by <pv>. The horizontal and vertical eye-position angular resolutions (in pixels per visual degree) are given as well.
6.11.2.3 Blink Events Blink events are recorded in the format of: • EBLINK <eye> <stime> <etime> <dur> This reports the eye used in the recording, the time of the first and last sample in the blink, and computes the duration of the blink in milliseconds.
6.11.2.4 Message Events Messages are recorded in the format of: • MSG <time> <message> A message line contains the text of a time stamped message. The <message> text fills the entire line after the timestamp <time> and any blank space following it.
6.11.2.5 Button Events Button events are recorded in the format of: • BUTTON <time > <button #> <button_pressed> Button lines report a change in state of tracker buttons. The <button #> reports which button has changed state. The <button_pressed> value will be true if the button has been pressed, false if it has been released.
EyeLink Data Viewer 2002-2014 SR Research Ltd. 119
7 Protocol for EyeLink Data to Viewer Integration The EyeLink Data Viewer can interpret a set of message commands from an EyeLink data file that allow the viewer to automate some of the viewer configuration for a given data file or trial. Examples of these commands include defining the image to overlay and specifying trial variables. These messages can be written by the display experiment to the EDF file using the API function that allows the writing of a custom message to the EDF file. Messages that make up the EyeLink data file protocol for the viewer are not added to the Message list that is created for viewing within the viewer tool. Message commands are therefore invisible to the viewing windows, and are only interpreted by the Viewer during application loading. Important: Do not use space characters in any component of a viewer message command; the space character is used to tokenize and interpret all viewer messages. Instead of using a space character within a message token, use the _ character. 7.1 Defining the Start and End of a Trial The viewer uses two special message commands to define what should be considered the start and end of a trial for the purpose of parsing the EyeLink data files. 7.1.1 Trial Start Message Identifier (Default): TRIALID Description: This message defines the start of a trial for the viewer. This is different than the start of recording message START that is logged when the trial recording begins. The viewer will not parse any messages, events, or samples, that exist in the data file prior to this message. The command identifier can be changed in the data loading preference settings. Format: TRIALID <Trial ID value list>
Example: MSG 3362269 TRIALID PIX1 images\sacrmeto.jpg
EyeLink Data Viewer 2002-2014 SR Research Ltd. 120
Note: If the trial start message is not found, or if no trial start message is defined for the viewing session, the START message is used to indicate the start of a trial for the Viewer. 7.1.2 Trial End Message Identifier (Default): TRIAL_RESULT Description: This message defines the end of a trial for the viewer. This is different than the end of recording message END that is logged when the trial recording ends. The viewer will not parse any messages, events, or samples that exist in the data file after this message. The command identifier can be changed in the data loading preference settings. Format: TRIAL_RESULT <possible trial result values>
Example: MSG 3383842 TRIAL_RESULT 0
Note: If the trial end message is not found, or if no trial end message is defined for the viewing session, the END message is used to indicate the end of a trial for the Viewer. 7.2 Pre-Trial Message Commands The following message commands, if defined, MUST be sent to the EyeLink data file prior to the Trial Start message defined above (i.e., outside the scope of a trial as defined for the viewer). If they are sent during trial recording, these messages will not be interpreted. 7.2.1 Trial Variable Labels Identifier (Default): TRIAL_VAR_LABELS Description: This message allows the definition of the labels to be used for trial variables within the viewer. The command identifier can be changed in the data loading preference settings. Format: TRIAL_VAR_LABELS <trial variable list>
EyeLink Data Viewer 2002-2014 SR Research Ltd. 121
Example: MSG 3363553 TRIAL_VAR_LABELS TRIAL_VAR_1 TRIAL_VAR_2 TRIAL_VAR_3 7.2.2 Display Coordinates Identifier: DISPLAY_COORDS or GAZE_COORDS Description: This message specifies the display coordinates to be used within the viewer. This message MUST be present for the viewer to function correctly. Format: DISPLAY_COORDS <left> <top> <right> <bottom>
Left, top, right, and bottom refer to the x-y coordinates of the top-left and bottom-right corners of display.
Example: MSG 3325521 DISPLAY_COORDS 0 0 1279 1023
7.2.3 Trial Grouping Identifier: V_TRIAL_GROUPING Description: Trial grouping message is used to group those trials in the same experimental condition together so that they can be manipulated (e.g., selecting, hiding, deleting, applying interest area templates) collectively. This message must be sent after TRIAL_VAR_LABELS message but before first trial start message in EDF file. Format: V_TRIAL_GROUPING <trial variable list>
The trial grouping variable(s) must be a member of the variables listed in the TRIAL_VAR_LABELS; otherwise, this variable is simply ignored. Example: MSG 3363553 V_TRIAL_GROUPING TYPE DIRECTION
EyeLink Data Viewer 2002-2014 SR Research Ltd. 122
Note: Trial variables are space delimited. Trial variables that do not exist in variable list for trial are ignored. 7.3 Trial Message Commands The following message commands MUST be specified within the scope of a trial, or the message commands will not be interpreted by the viewer. IMPORTANT: All message commands within the trial scope must start with a !V directive, or the command will not be interpreted and will instead appear as a regular message in the visible message list of the viewer. Tip: In almost all instances, each of the following commands will be repeated for every trial of an EyeLink data file. 7.3.1 Trial Variable Values Identifier (Default): TRIAL_VAR_DATA Description: This message specifies the list of trial variable values for the trial. The list of trial variable values must be in the same order as was specified in the TRIAL_VAR_LABELS command for the viewer to properly match the variable label with the variable value. The command identifier can be changed in the data loading preference settings. Note: If this command is the same as the Trial Start Command (TRIALID), the values will still be extracted from the Trial Start Line; however a !V is not needed in the message. Format: !V TRIAL_VAR_DATA <trial_variable_list>
Example: MSG 3363553 !V TRIAL_VAR_DATA value1 value2 value3
7.3.2 Single Trial Variable Message Token
EyeLink Data Viewer 2002-2014 SR Research Ltd. 123
Identifier (Default): TRIAL_VAR Description: This command lets the user specify a trial variable and value for the given trial. Send one message for each pair of trial condition variable and its corresponding value. This means that there is really no need to use TRIAL_VAR_LABELS command when using this command. The default command identifier can be changed in the data loading preference settings. Please note that the eye tracker can handle about 20 messages every 10 milliseconds. So be careful not to send messages too quickly when you have many trial condition messages to send. Add one millisecond delay between message lines if this is the case. Format: !V TRIAL_VAR <trial_var_label> <trial_var_value>
<trial_var_label> is the label for the variable being set. If the current Data Viewer session does not have this variable yet, it is created. <trial_var_value> defines the value to set for the variable for the given trial. Example: MSG 9350338 !V TRIAL_VAR trial 1
MSG 9350339 !V TRIAL_VAR condition gap
MSG 9350340 !V TRIAL_VAR direction Left
MSG 9350341 !V TRIAL_VAR gap_duration 200
MSG 9350342 !V TRIAL_VAR t_x 212
MSG 9350343 !V TRIAL_VAR t_y 384
7.3.3 Image Commands The viewer supports a set of commands that display a default image on the overlay mode of the trial viewer screen. All image commands use the IMGLOAD token, followed by a sub command. 7.3.3.1 Image Loading – Fill Full Screen Identifier: FILL Description:
EyeLink Data Viewer 2002-2014 SR Research Ltd. 124
This message specifies the image to be used as the background for the spatial overlay view of a trial within the viewer. The image is sized to fit the dimensions specified in the DISPLAY_COORDS command message. The image should be represented as a relative path. The viewer will look for the image in the following order:
1) In the default image directory specified in the general preference settings. 2) In the directory the EyeLink data file is loaded from. 3) In the directory the viewer application is running from.
Format: !V IMGLOAD FILL <relative_image_path>
Example: MSG 3388468 !V IMGLOAD FILL Sac_blur.jpg 7.3.3.2 Image Loading – Top Left Identifier: TOP_LEFT Description: This message specifies an image to be used as a segment of the spatial overlay view of a trial within the viewer. The image size is not changed (unless width and height parameters are also specified) and will be positioned by using the x and y positions specified as the top left corner of the image. The image should be represented as a relative path. The viewer will look for the image in the following order:
1) In the default image directory specified in the general preference settings. 2) In the directory the EyeLink data file is loaded from. 3) In the directory the viewer application is running from.
Format: !V IMGLOAD TOP_LEFT <relative_image_path> <x_position>
<y_position> [width] [height]
Note: width and height are optional parameters Example: MSG 2740540 !V IMGLOAD TOP_LEFT fixations.gif 200 200
7.3.3.3 Image Loading – Centered
EyeLink Data Viewer 2002-2014 SR Research Ltd. 125
Identifier: CENTER Description: This message specifies an image to be used as a segment of the spatial overlay view of a trial within the viewer. The image size is not changed (unless width and height parameters are specified) and will be positioned centering on the x-y coordinate specified. The image should be represented as a relative path. The viewer will look for the image in the following order:
1) In the default image directory specified in the general preference settings. 2) In the directory the EyeLink data file is loaded from. 3) In the directory the viewer application is running from.
Format: !V IMGLOAD CENTER <relative_image_path> <x_position> <y_position>
[width] [height]
Example: MSG 2740540 !V IMGLOAD CENTER fixations.gif 200 200
7.3.4 Simple Drawing Besides the image loading, the viewer also supports a set of commands that draws simple graphics, such as lines, framed box, filled box, as well as display clearing. 7.3.4.1 Clear Overlay View Identifier: CLEAR Description: This command clears the overlay view to the color specified by the red, blue, green integer values specified in the command. Each RGB value should be an integer between 0 and 255. Format: !V CLEAR <red> <blue> <green>
EyeLink Data Viewer 2002-2014 SR Research Ltd. 126
Example: MSG 2740540 !V CLEAR 255 255 255
This clears the display to white color.
7.3.4.2 Line drawing Identifier: DRAWLINE Description: This command draws a line with the color specified by the red, blue, green integer values specified in the command. Each RGB value should be an integer between 0 and 255. Format: !V DRAWLINE <red> <blue> <green> <x_start> <y_start> <x_end>
<y_end>
Note: <x_start>: x-coordinate of the starting point; <y_start>: y-coordinate of the starting point; <x_end>: x-coordinate of the end position; <y_end>: y-coordinate of the ending position. Example: MSG 9441901 !V DRAWLINE 255 0 0 100 100 300 400
This draws a red line, connecting (100, 100) and (300, 400). 7.3.4.3 Drawing a Rectangle Identifier: DRAWBOX Description: This command draws a framed rectangle with the color specified by the red, blue, green integer values specified in the command. Each RGB value should be an integer between 0 and 255. Format:
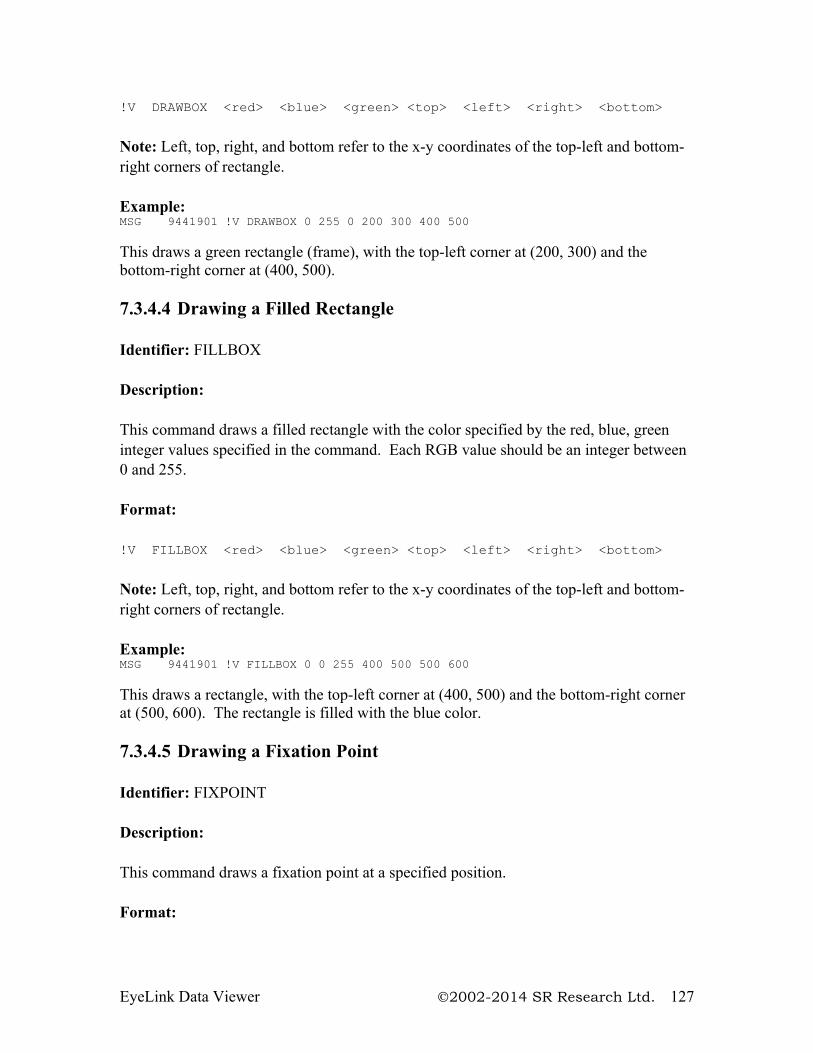
EyeLink Data Viewer 2002-2014 SR Research Ltd. 127
!V DRAWBOX <red> <blue> <green> <top> <left> <right> <bottom>
Note: Left, top, right, and bottom refer to the x-y coordinates of the top-left and bottom-right corners of rectangle. Example: MSG 9441901 !V DRAWBOX 0 255 0 200 300 400 500
This draws a green rectangle (frame), with the top-left corner at (200, 300) and the bottom-right corner at (400, 500). 7.3.4.4 Drawing a Filled Rectangle Identifier: FILLBOX Description: This command draws a filled rectangle with the color specified by the red, blue, green integer values specified in the command. Each RGB value should be an integer between 0 and 255. Format: !V FILLBOX <red> <blue> <green> <top> <left> <right> <bottom>
Note: Left, top, right, and bottom refer to the x-y coordinates of the top-left and bottom-right corners of rectangle. Example: MSG 9441901 !V FILLBOX 0 0 255 400 500 500 600
This draws a rectangle, with the top-left corner at (400, 500) and the bottom-right corner at (500, 600). The rectangle is filled with the blue color. 7.3.4.5 Drawing a Fixation Point Identifier: FIXPOINT Description: This command draws a fixation point at a specified position. Format:
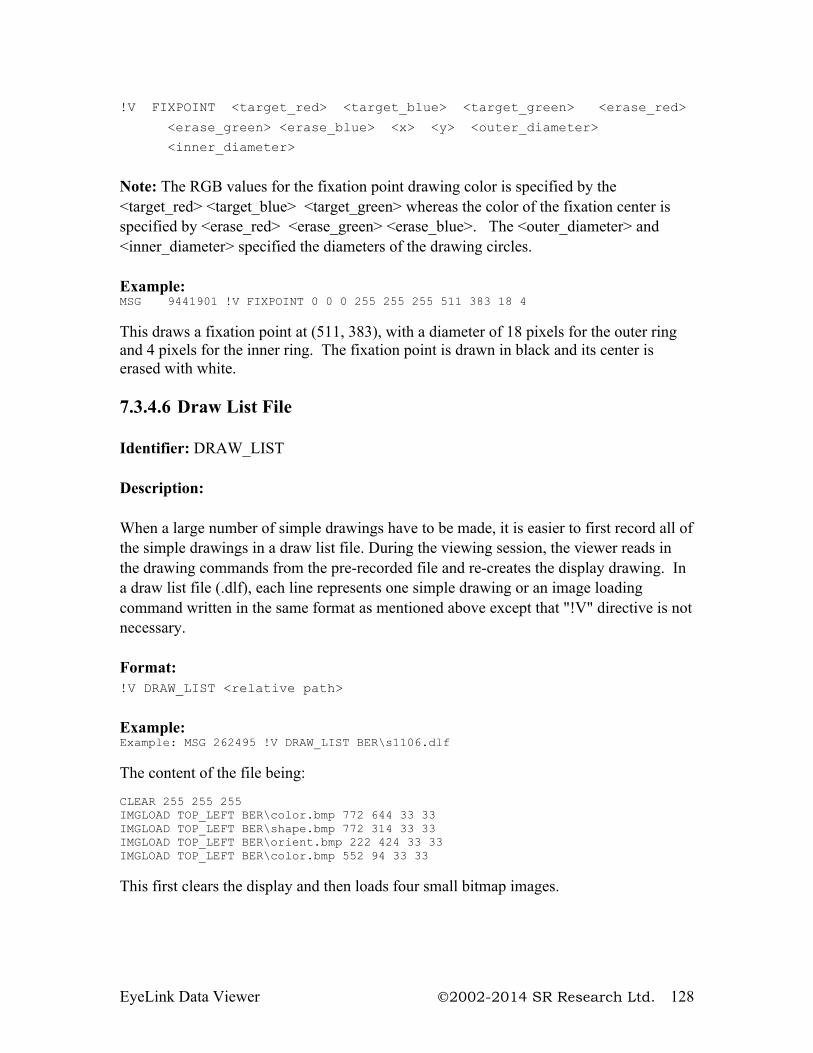
EyeLink Data Viewer 2002-2014 SR Research Ltd. 128
!V FIXPOINT <target_red> <target_blue> <target_green> <erase_red>
<erase_green> <erase_blue> <x> <y> <outer_diameter>
<inner_diameter>
Note: The RGB values for the fixation point drawing color is specified by the <target_red> <target_blue> <target_green> whereas the color of the fixation center is specified by <erase_red> <erase_green> <erase_blue>. The <outer_diameter> and <inner_diameter> specified the diameters of the drawing circles. Example: MSG 9441901 !V FIXPOINT 0 0 0 255 255 255 511 383 18 4
This draws a fixation point at (511, 383), with a diameter of 18 pixels for the outer ring and 4 pixels for the inner ring. The fixation point is drawn in black and its center is erased with white. 7.3.4.6 Draw List File Identifier: DRAW_LIST Description: When a large number of simple drawings have to be made, it is easier to first record all of the simple drawings in a draw list file. During the viewing session, the viewer reads in the drawing commands from the pre-recorded file and re-creates the display drawing. In a draw list file (.dlf), each line represents one simple drawing or an image loading command written in the same format as mentioned above except that "!V" directive is not necessary. Format: !V DRAW_LIST <relative path>
Example: Example: MSG 262495 !V DRAW_LIST BER\s1106.dlf
The content of the file being: CLEAR 255 255 255 IMGLOAD TOP_LEFT BER\color.bmp 772 644 33 33 IMGLOAD TOP_LEFT BER\shape.bmp 772 314 33 33 IMGLOAD TOP_LEFT BER\orient.bmp 222 424 33 33 IMGLOAD TOP_LEFT BER\color.bmp 552 94 33 33
This first clears the display and then loads four small bitmap images.
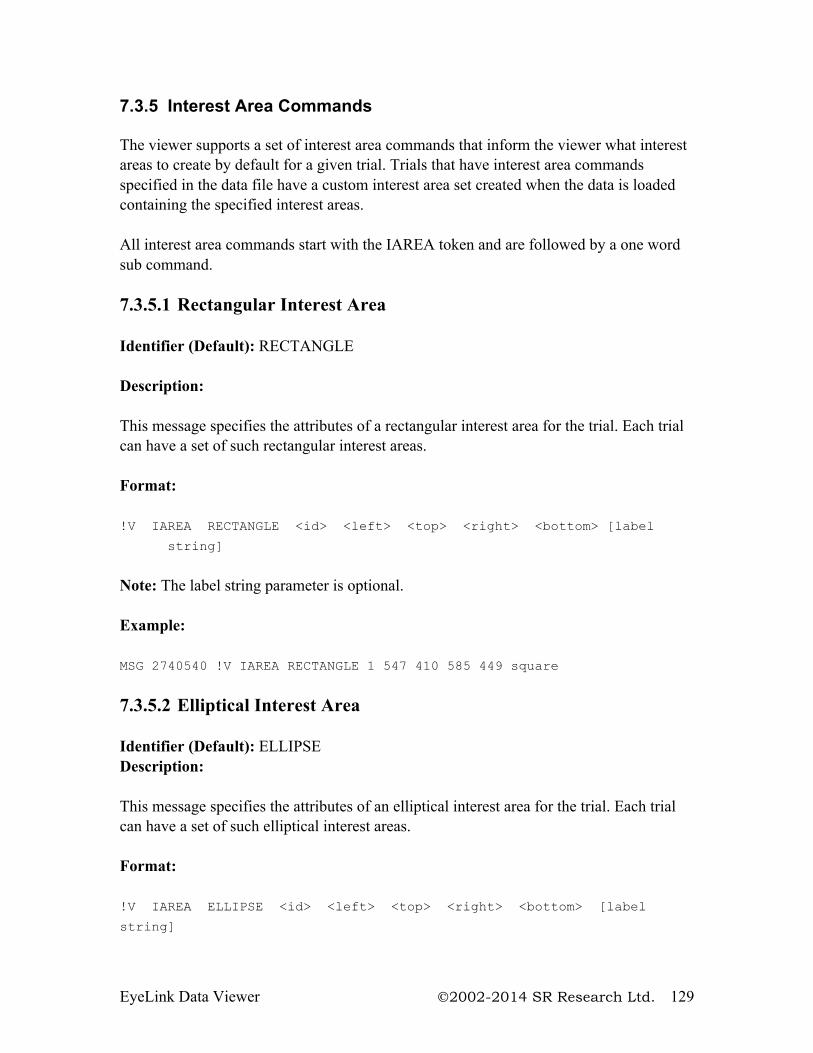
EyeLink Data Viewer 2002-2014 SR Research Ltd. 129
7.3.5 Interest Area Commands The viewer supports a set of interest area commands that inform the viewer what interest areas to create by default for a given trial. Trials that have interest area commands specified in the data file have a custom interest area set created when the data is loaded containing the specified interest areas. All interest area commands start with the IAREA token and are followed by a one word sub command. 7.3.5.1 Rectangular Interest Area Identifier (Default): RECTANGLE Description: This message specifies the attributes of a rectangular interest area for the trial. Each trial can have a set of such rectangular interest areas. Format: !V IAREA RECTANGLE <id> <left> <top> <right> <bottom> [label
string]
Note: The label string parameter is optional. Example: MSG 2740540 !V IAREA RECTANGLE 1 547 410 585 449 square
7.3.5.2 Elliptical Interest Area Identifier (Default): ELLIPSE Description: This message specifies the attributes of an elliptical interest area for the trial. Each trial can have a set of such elliptical interest areas. Format: !V IAREA ELLIPSE <id> <left> <top> <right> <bottom> [label
string]
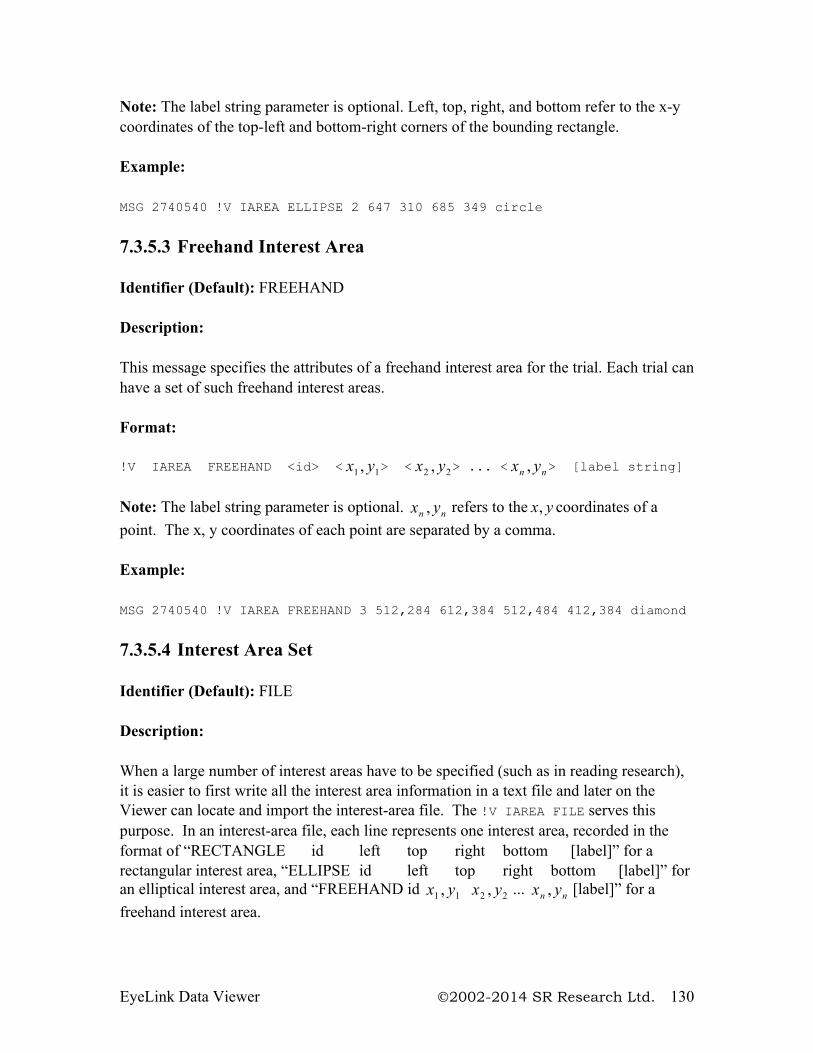
EyeLink Data Viewer 2002-2014 SR Research Ltd. 130
Note: The label string parameter is optional. Left, top, right, and bottom refer to the x-y coordinates of the top-left and bottom-right corners of the bounding rectangle. Example: MSG 2740540 !V IAREA ELLIPSE 2 647 310 685 349 circle
7.3.5.3 Freehand Interest Area Identifier (Default): FREEHAND Description: This message specifies the attributes of a freehand interest area for the trial. Each trial can have a set of such freehand interest areas. Format: !V IAREA FREEHAND <id> < x y1 1, > < x y2 2, > ... < x yn n, > [label string]
Note: The label string parameter is optional. x yn n, refers to the x y, coordinates of a point. The x, y coordinates of each point are separated by a comma. Example: MSG 2740540 !V IAREA FREEHAND 3 512,284 612,384 512,484 412,384 diamond
7.3.5.4 Interest Area Set Identifier (Default): FILE Description: When a large number of interest areas have to be specified (such as in reading research), it is easier to first write all the interest area information in a text file and later on the Viewer can locate and import the interest-area file. The !V IAREA FILE serves this purpose. In an interest-area file, each line represents one interest area, recorded in the format of “RECTANGLE id left top right bottom [label]” for a rectangular interest area, “ELLIPSE id left top right bottom [label]” for an elliptical interest area, and “FREEHAND id x y1 1, x y2 2, ... x yn n, [label]” for a freehand interest area.
EyeLink Data Viewer 2002-2014 SR Research Ltd. 131
Format: !V IAREA FILE <relative_file_path>
Example: MSG 2740540 !V IAREA FILE segments\example.ias
7.3.6 Target Position Commands For experiments in which a moving resource is used, the user may need to keep track of the position of the resource. The Data Viewer allows the user to calculate the position, velocity, and acceleration data for each individual samples in the sample output report. With such messages, position, velocity, and acceleration traces can be displayed in the time plot view. Identifier (Default): TARGET_POS Description: This message specifies the position and visibility of the targets at the specific message time. The command identifier can be changed in the data loading preference settings. A semicolon is required if you are supplying two target positions. Format: !V TARGET_POS <Target1 Key> <(target1 x, target1 y)> <target 1
visibility> <target 1 step>; <Target2 Key> <(target2 x, target2
y)> <target 2 visibility> <target 2 step>
Where <Target1 Key> and <Target2 Key>: the tokens to extract the
position(s) of target(s);
<(target1 x, target1 y)> and <(target2 x, target2 y)>: the
position(s) of the targets. The coordinates must be enclosed in
a pair of brackets;
<target 1 visibility> and <target 2 visibility>: if 1, the
targets are visible; if 0, the targets are hidden;
<target 1 step> and <target 2 step>: if 1, the position of the
target will be in steps; if 0, the position of the target is
interpolated across samples.
Example:
EyeLink Data Viewer 2002-2014 SR Research Ltd. 132
MSG 9071000 -15 !V TARGET_POS TARG1 (351, 278) 1 0; TARG2 (590, 134)
1 0
Note: The user can use any token word to indicate the target ID. The "key" property of the temporal graph preference settings is set to blank by default so that various token words can be used. If two targets are involved and if the order of the two targets is important, set that field to the token strings used in the target position command string.
7.4 Reaction Time Definitions To obtain an accurate reaction time (RT) measure, the EyeLink Data Viewer relies on a set of reaction time definitions to parse the start and end events for RT calculation. The reaction time definition command messages inform the Viewer of the RT start message, the type of RT end events (fixation, saccade, message, or button), the parameters of the end event, as well as the conditions to which the RT definition is applied. Reaction time definition commands can be provided in two ways. The user can employ a pre-trial (condition-based) command messages to specify a RT definition for each of the experimental condition. All pre-trial reaction time commands start with the V_RT token and are followed by a one word subcommand, indicating the type of RT end event (BUTTON, MESSAGE, FIXATION, or SACCADE). Alternatively, the user can supply a custom reaction time definition specifically for each trial. All custom trial-specific reaction time commands start with the !V V_CRT token and are followed by a one word subcommand. Important: When an EyeLink Data File is loaded into the Viewer, any existing Reaction Time Definitions for the Data Viewing Session are removed and reloaded from the data file being imported. Therefore, it is important that each data file contain all the pre-trial (condition-based) command messages required for the full analysis, not just for the given data file. Any previously set custom, trial specific, reaction time definitions are not affected when a new data file is loaded.
7.4.1 Button Events Identifier: BUTTON Description: This will treat a particular button press/release as the reaction time end event. Pre-Trial Message Command Format:
EyeLink Data Viewer 2002-2014 SR Research Ltd. 133
V_RT BUTTON <rt_start_msg> <button_id> <state> [CONDITION LABEL 1]
[condition value 1] [CONDITION LABEL 2] [condition value 2] …
Trial-specific Message Command Format: !V V_CRT BUTTON <rt_start_msg> <button_id> <state>
Note: Button_id refers to the intended button ID (from 1 to 8, use 0 for any button event). Button state could be 0 (button release) or 1 (button press). Condition labels and their values are not required for the trial-specific message command and optional for the pre-trial message command (if not specified, the RT definition is applied to all conditions). In case both a condition-based pre-trial message command and a custom trial specific message command are applicable for one trial, the trial-specific command will override the more general one. Example: MSG 329381 V_RT BUTTON SYNCTIME 5 1 TYPE normal
In this example, the end event for RT calculation is pressing button 5 serves. This RT definition is applicable to the condition in which the value of the variable TYPE is “normal”.
7.4.2 Fixation Events: Identifier: FIXATION Description: This will end the trial by the appearance of a specific fixation. The user can specify the parameters of the fixation end event: the minimum fixation duration (in milliseconds) required, the xy coordinates for the region center, as well as the diameter of the fixation region. Pre-Trial Message Command Format: V_RT FIXATION <rt_start_msg> <fixation_duration> <x> <y>
<diameter> [CONDITION LABEL 1] [condition value 1] [CONDITION
LABEL 2] [condition value 2] …
Trial-specific Message Command Format:
EyeLink Data Viewer 2002-2014 SR Research Ltd. 134
!V V_CRT FIXATION <rt_start_msg> <fixation_duration> <x> <y>
<diameter>
Note: If the location information of the target fixation is not important, set the values of x, y, and diameter as -1. Condition labels and their values are not required for the trial-specific message command and optional for the pre-trial message command (if not specified, the RT definition is applied to all conditions). Example: MSG 329381 V_RT FIXATION SYNCTIME 500 -1 -1 -1
In this example, the RT end event is the occurrence of the first fixation with a minimum duration of 500 milliseconds whereas the location information of the fixation is not important.
7.4.3 Saccade Events: Identifier: SACCADE Description: This will end the trial by the appearance of a specific saccade. The user can specify the parameters of the saccade end event: the minimum saccadic amplitude (in degrees of visual angle) required, the xy coordinates for the region center, as well as the diameter of the fixation region. Pre-Trial Message Command Format: V_RT SACCADE <rt_start_msg> <saccadic_amplitude> <x> <y> <diameter>
[CONDITION LABEL 1] [condition value 1] [CONDITION LABEL 2]
[condition value 2] …
Trial-specific Message Command Format: !V V_CRT SACCADE <rt_start_msg> <saccadic_amplitude> <x> <y>
<diameter>
Note: If the location information of the saccade is not important, set the values of x, y, and diameter as -1. Condition labels and their values are not required for the trial-specific message command and optional for the pre-trial message command (if not specified, the RT definition is applied to all conditions).
EyeLink Data Viewer 2002-2014 SR Research Ltd. 135
Example: MSG 329381 V_RT SACCADE SYNCTIME 5.0 300 400 100 TYPE Normal
In this example, the RT end event is the occurrence of the first saccade with a minimum amplitude of 5.0 degrees of visual angle. The saccade must fall within 50 pixels from the region center (300, 400).
7.4.4 Message Events: Identifier: MESSAGE Description: This will treat the first occurrence of a matching message as the end event for reaction time calculation. Pre-Trial Message Command Format: V_RT MESSAGE <rt_start_msg> <rt_end_msg> [CONDITION LABEL 1]
[condition value 1] [CONDITION LABEL 2] [condition value 2] …
Trial-specific Message Command Format: !V V_CRT MESSAGE <rt_start_msg> <rt_end_msg>
Note: Condition labels and their values are not required for the trial-specific message command and optional for the pre-trial message command (if not specified, the RT definition is applied to all conditions). Example: MSG 329381 V_RT MESSAGE SYNCTIME END_RT
7.4.5 Reaction Time Definition Set Identifier: FILE Description:
EyeLink Data Viewer 2002-2014 SR Research Ltd. 136
When a large number of RT definitions have to be specified, it is easier to first record all RT definitions in a file and later on the viewer can read the RT definition file with the V_RT FILE command. In a reaction-time definition file, each line represents one RT definition, which is written in the same format as the pre-trial message command for each respective type of RT end event, except that in this case V_RT token is not necessary. Pre-Trial Message Command Format: V_RT FILE <relative path>
Example: MSG 329381 V_RT FILE rt\default.rts
7.5 Changes in the Sample Experiments The preceding sections list the special messages and commands that can be sent to the EDF file to enable the EyeLink Data Viewer to extract information in a more efficient way. The current section provides an overview of the changes made in the sample experiment templates. Please refer to the “Programming EyeLink Experiments in Windows Version 2.0” manual for the description of individual templates.
7.5.1 “Simple” Template Two EyeLink Data Viewer commands have been introduced in the “Simple” template: “TRIAL_VAR_LABELS” for the definition of the labels to be used for trial condition variables within the viewer and “TRIAL_VAR_DATA” for the assignment of condition values for each trial. All these changes, listed in the following table, were made in the w32_simple_trials.c file of the template. Data Viewer Functionality Message Commands Trial Variable Labels eyemsg_printf("TRIAL_VAR_LABELS
TRIAL_WORD"); Trial Variable Values eyemsg_printf(“!V TRIAL_VAR_DATA %s”,
trial_word[num-1]);
7.5.2 “Text” Template Along with the “TRIAL_VAR_LABELS” and “TRIAL_VAR_DATA” commands, the “Text” template also uses “IMGLOAD FILL” to load a single image and “IAREA FILE” to import a file containing interest areas for the trial. All of these changes, listed in the following table, were made in the w32_text_trials.c file of the template. Data Viewer Functionality Message Commands
EyeLink Data Viewer 2002-2014 SR Research Ltd. 137
Trial Variable Labels eyemsg_printf("TRIAL_VAR_LABELS PAGE"); Trial Variable Values eyemsg_printf("!V TRIAL_VAR_DATA %d", num); Images eyemsg_printf("!V IMGLOAD FILL Images/%s",
image_fn); Interest Areas eyemsg_printf("!V IAREA FILE Segments/%s", seg_fn);
7.5.3 “Picture” Template One new feature of the “Picture” template is the demonstration of another approach to load images and to specify interest areas for the trial. The third trial of the template loads individual images (IMGLOAD TOP_LEFT) to create a composite image in the Viewer and reads individual rectangular interest areas directly (“IAREA RECTANGLE”). All these changes, listed in the following table, were made in the w32_picture_trials.c file of the template. Data Viewer Functionality Message Commands Trial Variable Labels eyemsg_printf("TRIAL_VAR_LABELS TYPE"); Trial Variable Values eyemsg_printf("!V TRIAL_VAR_DATA %s",
imgname[num-1]); Images
“Normal” image eyemsg_printf("!V IMGLOAD FILL images/sacrmeto.jpg");
“Blurred” image eyemsg_printf("!V IMGLOAD FILL images/sac_blur.jpg");
“Composite” image eyemsg_printf("!V IMGLOAD TOP_LEFT %s %d %d %d %d", small_images[i], points[i].x, points[i].y, SCRWIDTH/2, SCRHEIGHT/2);
Interest Areas “Composite” image eyemsg_printf("!V IAREA
RECTANGLE %d %d %d %d %d %s", i+1, points[i].x, points[i].y, points[i].x + SCRWIDTH/2, points[i].y + SCRHEIGHT/2, small_images[i]);
7.5.4 “EyeData” Template The following table lists all of the changes made to the w32_data_trials.c file of the “EyeData” template. Data Viewer Functionality Message Commands Trial Variable Labels eyemsg_printf("TRIAL_VAR_LABELS CONDITION"); Trial Variable Values eyemsg_printf("!V TRIAL_VAR_DATA Playback"); Images eyemsg_printf("!V IMGLOAD FILL images/grid.png");
EyeLink Data Viewer 2002-2014 SR Research Ltd. 138
Interest Areas eyemsg_printf("!V IAREA FILE segments/grid.ias");
7.5.5 “GCWindow” Template The following table lists all of the changes made to the w32_gcwindow_trials.c file of the “GCWindow” template. Data Viewer Functionality Message Commands Trial Variable Labels eyemsg_printf("TRIAL_VAR_LABELS TYPE
CENTRAL PERIPHERAL"); Trial Variable Values
Trial 1 eyemsg_printf("!V TRIAL_VAR_DATA TEXT TEXT MASK");
Trial 2 eyemsg_printf("!V TRIAL_VAR_DATA TEXT MASK TEXT");
Trial 3 eyemsg_printf("!V TRIAL_VAR_DATA IMAGE IMAGE MASK");
Trial 4 eyemsg_printf("!V TRIAL_VAR_DATA IMAGE MASK IMAGE");
Trial 5 eyemsg_printf("!V TRIAL_VAR_DATA IMAGE IMAGE BLURRED");
Images Trials 1 & 2 eyemsg_printf("!V IMGLOAD FILL images/text.png"); Trials 3, 4, & 5 eyemsg_printf("!V IMGLOAD FILL
images/sacrmeto.jpg"); Interest Areas
Trials 1 & 2 eyemsg_printf("!V IAREA FILE segments/text.ias");
7.5.6 “Control” Template The following messages and commands have been added to the w32_control_trials.c file of the “Control” template. Data Viewer Functionality Message Commands Trial Variable Labels eyemsg_printf(“TRIAL_VAR_LABELS CONDITION”); The following messages and commands have been added to the w32_control_trial.c file of the “Control” template. Data Viewer Functionality Message Commands Trial Variable Values eyemsg_printf("!V TRIAL_VAR_DATA GAZECTRL"); Images eyemsg_printf("!V IMGLOAD FILL images/grid.png"); Interest Areas eyemsg_printf("!V IAREA FILE segments/grid.ias");
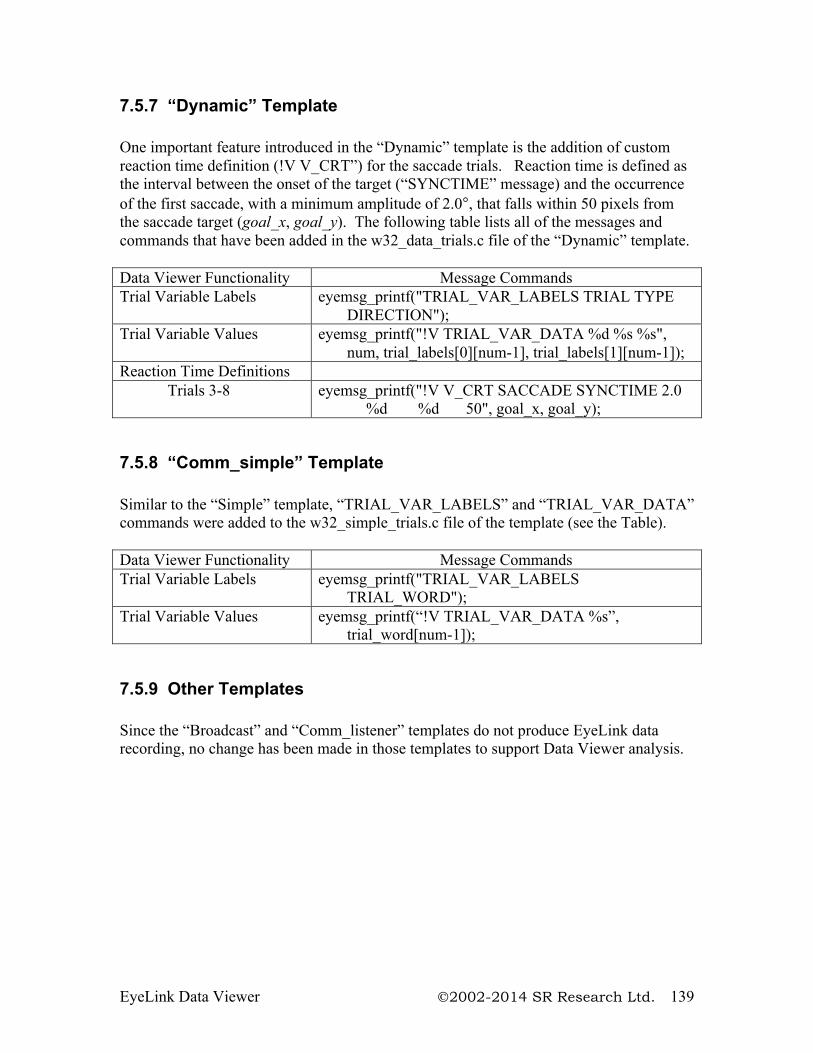
EyeLink Data Viewer 2002-2014 SR Research Ltd. 139
7.5.7 “Dynamic” Template One important feature introduced in the “Dynamic” template is the addition of custom reaction time definition (!V V_CRT”) for the saccade trials. Reaction time is defined as the interval between the onset of the target (“SYNCTIME” message) and the occurrence of the first saccade, with a minimum amplitude of 2.0°, that falls within 50 pixels from the saccade target (goal_x, goal_y). The following table lists all of the messages and commands that have been added in the w32_data_trials.c file of the “Dynamic” template. Data Viewer Functionality Message Commands Trial Variable Labels eyemsg_printf("TRIAL_VAR_LABELS TRIAL TYPE
DIRECTION"); Trial Variable Values eyemsg_printf("!V TRIAL_VAR_DATA %d %s %s",
num, trial_labels[0][num-1], trial_labels[1][num-1]); Reaction Time Definitions
Trials 3-8 eyemsg_printf("!V V_CRT SACCADE SYNCTIME 2.0 %d %d 50", goal_x, goal_y);
7.5.8 “Comm_simple” Template Similar to the “Simple” template, “TRIAL_VAR_LABELS” and “TRIAL_VAR_DATA” commands were added to the w32_simple_trials.c file of the template (see the Table). Data Viewer Functionality Message Commands Trial Variable Labels eyemsg_printf("TRIAL_VAR_LABELS
TRIAL_WORD"); Trial Variable Values eyemsg_printf(“!V TRIAL_VAR_DATA %s”,
trial_word[num-1]);
7.5.9 Other Templates Since the “Broadcast” and “Comm_listener” templates do not produce EyeLink data recording, no change has been made in those templates to support Data Viewer analysis.
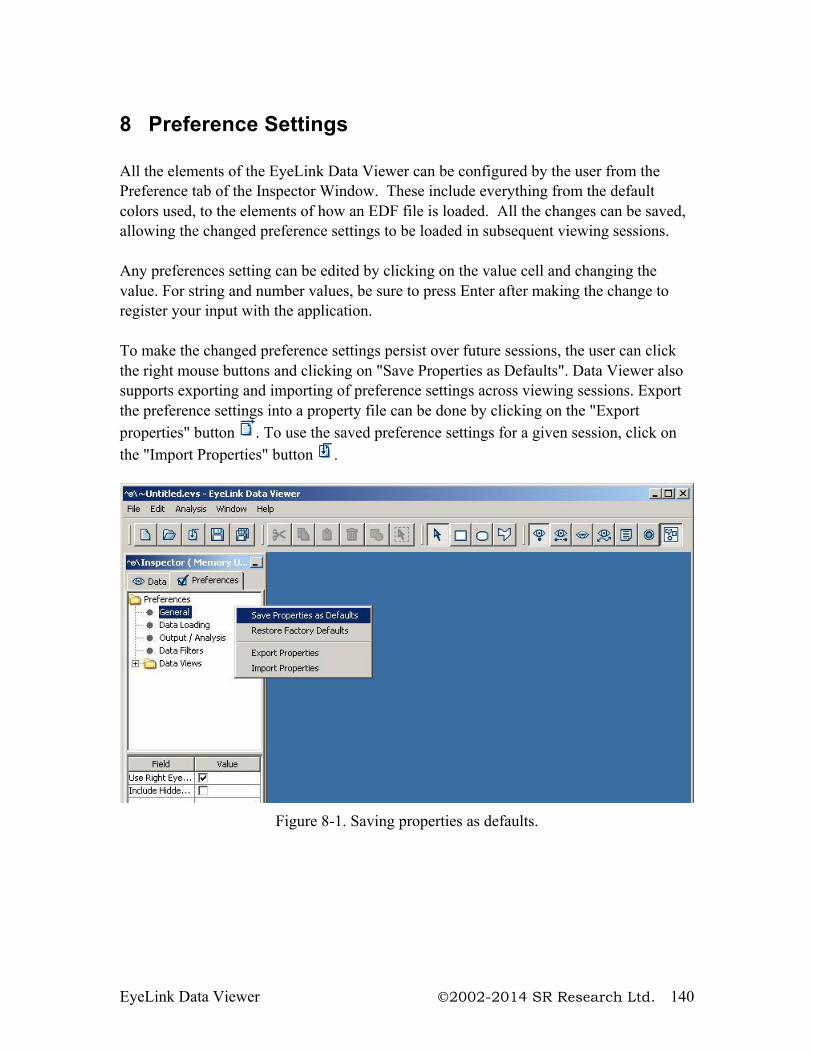
EyeLink Data Viewer 2002-2014 SR Research Ltd. 140
8 Preference Settings All the elements of the EyeLink Data Viewer can be configured by the user from the Preference tab of the Inspector Window. These include everything from the default colors used, to the elements of how an EDF file is loaded. All the changes can be saved, allowing the changed preference settings to be loaded in subsequent viewing sessions. Any preferences setting can be edited by clicking on the value cell and changing the value. For string and number values, be sure to press Enter after making the change to register your input with the application. To make the changed preference settings persist over future sessions, the user can click the right mouse buttons and clicking on "Save Properties as Defaults". Data Viewer also supports exporting and importing of preference settings across viewing sessions. Export the preference settings into a property file can be done by clicking on the "Export properties" button . To use the saved preference settings for a given session, click on the "Import Properties" button .
Figure 8-1. Saving properties as defaults.
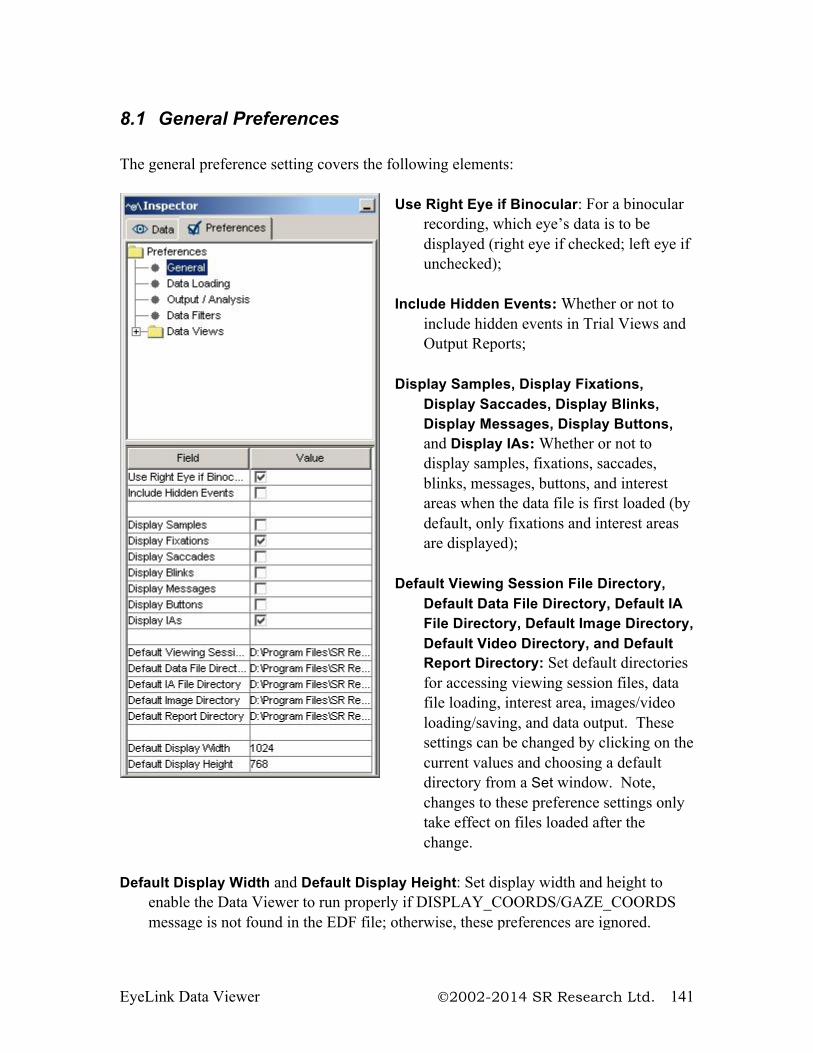
EyeLink Data Viewer 2002-2014 SR Research Ltd. 141
8.1 General Preferences The general preference setting covers the following elements:
Use Right Eye if Binocular: For a binocular recording, which eye’s data is to be displayed (right eye if checked; left eye if unchecked);
Include Hidden Events: Whether or not to
include hidden events in Trial Views and Output Reports;
Display Samples, Display Fixations,
Display Saccades, Display Blinks, Display Messages, Display Buttons, and Display IAs: Whether or not to display samples, fixations, saccades, blinks, messages, buttons, and interest areas when the data file is first loaded (by default, only fixations and interest areas are displayed);
Default Viewing Session File Directory,
Default Data File Directory, Default IA File Directory, Default Image Directory, Default Video Directory, and Default Report Directory: Set default directories for accessing viewing session files, data file loading, interest area, images/video loading/saving, and data output. These settings can be changed by clicking on the current values and choosing a default directory from a Set window. Note, changes to these preference settings only take effect on files loaded after the change.
Default Display Width and Default Display Height: Set display width and height to
enable the Data Viewer to run properly if DISPLAY_COORDS/GAZE_COORDS message is not found in the EDF file; otherwise, these preferences are ignored.
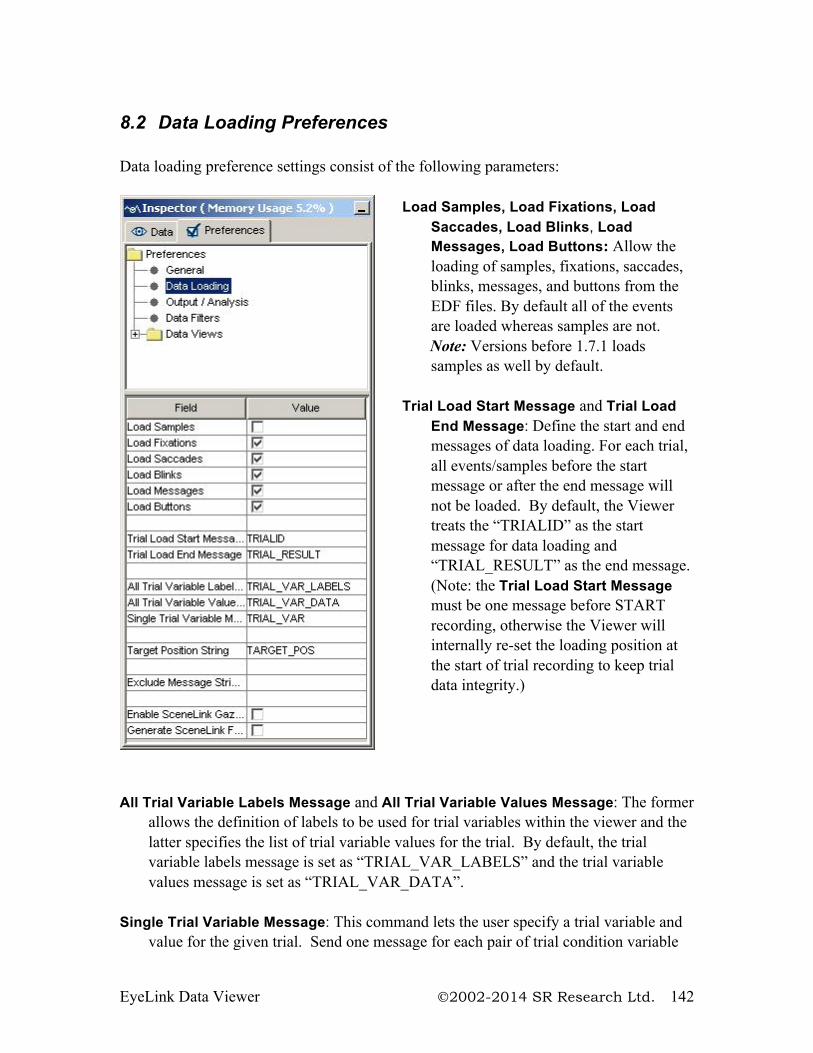
EyeLink Data Viewer 2002-2014 SR Research Ltd. 142
8.2 Data Loading Preferences Data loading preference settings consist of the following parameters:
Load Samples, Load Fixations, Load Saccades, Load Blinks, Load Messages, Load Buttons: Allow the loading of samples, fixations, saccades, blinks, messages, and buttons from the EDF files. By default all of the events are loaded whereas samples are not.
Note: Versions before 1.7.1 loads samples as well by default.
Trial Load Start Message and Trial Load
End Message: Define the start and end messages of data loading. For each trial, all events/samples before the start message or after the end message will not be loaded. By default, the Viewer treats the “TRIALID” as the start message for data loading and “TRIAL_RESULT” as the end message. (Note: the Trial Load Start Message must be one message before START recording, otherwise the Viewer will internally re-set the loading position at the start of trial recording to keep trial data integrity.)
All Trial Variable Labels Message and All Trial Variable Values Message: The former
allows the definition of labels to be used for trial variables within the viewer and the latter specifies the list of trial variable values for the trial. By default, the trial variable labels message is set as “TRIAL_VAR_LABELS” and the trial variable values message is set as “TRIAL_VAR_DATA”.
Single Trial Variable Message: This command lets the user specify a trial variable and
value for the given trial. Send one message for each pair of trial condition variable
EyeLink Data Viewer 2002-2014 SR Research Ltd. 143
and its corresponding value. This means that there is really no need to use TRIAL_VAR_LABELS command when using TRIAL_VAR command. Default command token is "TRIAL_VAR".
Target Position String: String used to specify the position of the targets at the specific
message time. Exclude Message String: Any messages (within the scope of a trial as defined by the
Trial Load Start Message and Trial Load End Message) containing the string will be ignored by the Viewer. Add a “;” to separate multiple message strings.
Collapse Identical Interest Areas with Different Time Stamps: If checked (the default
setting), all interest areas with identical coordinates and label will be merged together (and thus treated as one single interest area). If unchecked, interest areas are organized based on the time stamps and therefore interest areas with identical coordinates and label but different time stamps are treated as separate items. In general, the former approach is typically used if the data analysis is done on the whole trial recording whereas the latter setting is used if the data analysis are done based on individual interest periods.
Enable SceneLink Gaze Mapping: If checked, allows the user to load EDF file with
mapped gaze data to scene video coordinates. Generate SceneLink Frame Message: If checked, allows the user to generate frame
number messages when loading file. The frame number message will only be written if a lookup table has been created for synchronized playback of eye movement data over the scene video (see section 5.1 of the "EyeLink II Scene Camera User Manual").
Default Encoding: This option is used in case the interest area files are saved in a
different encoding type. Note: The user has to save the preferences and reload the data file before the changes in the above preference settings take effect.
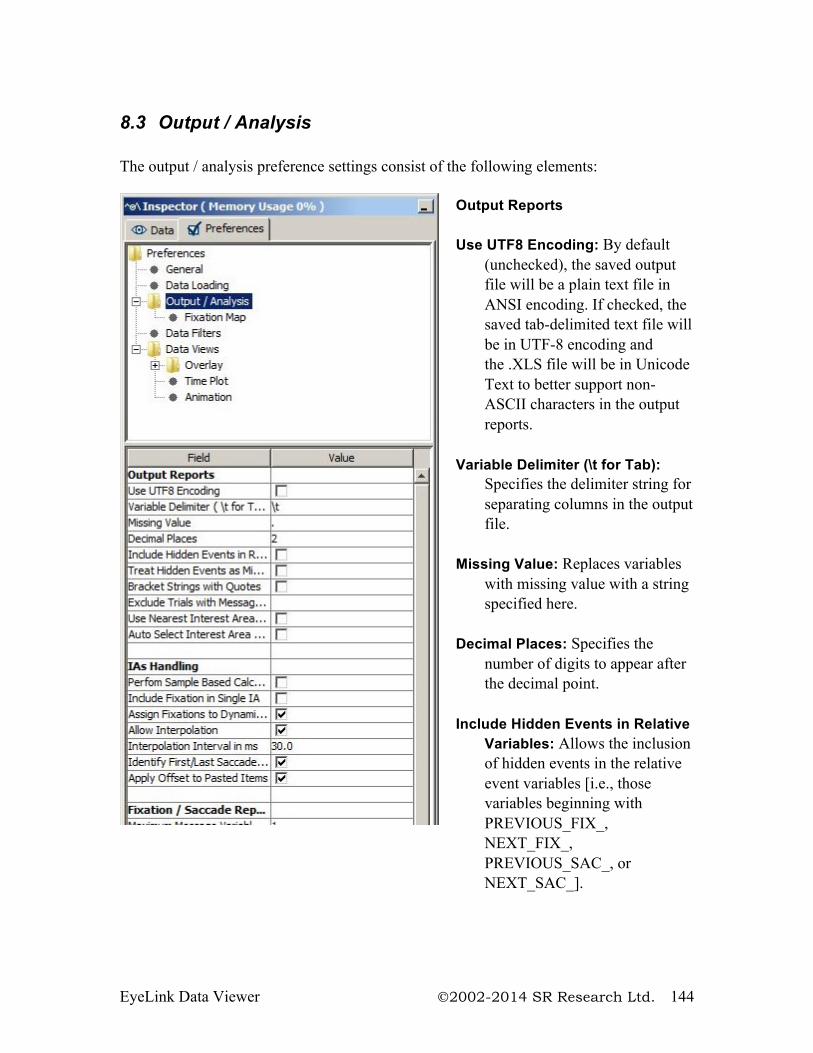
EyeLink Data Viewer 2002-2014 SR Research Ltd. 144
8.3 Output / Analysis The output / analysis preference settings consist of the following elements:
Output Reports Use UTF8 Encoding: By default
(unchecked), the saved output file will be a plain text file in ANSI encoding. If checked, the saved tab-delimited text file will be in UTF-8 encoding and the .XLS file will be in Unicode Text to better support non-ASCII characters in the output reports.
Variable Delimiter (\t for Tab):
Specifies the delimiter string for separating columns in the output file.
Missing Value: Replaces variables
with missing value with a string specified here.
Decimal Places: Specifies the
number of digits to appear after the decimal point.
Include Hidden Events in Relative
Variables: Allows the inclusion of hidden events in the relative event variables [i.e., those variables beginning with PREVIOUS_FIX_, NEXT_FIX_, PREVIOUS_SAC_, or NEXT_SAC_].
EyeLink Data Viewer 2002-2014 SR Research Ltd. 145
Treat Hidden Events as Missing Values: If hidden events in the relative variables are included in the analysis, the user can further decide whether or not to treat these events as missing data.
Bracket Strings with Quotes: Adds a pair of quotation marks for string variables. Exclude Trials with Message String: Excludes trials containing the specified message
string. This string should be one message or part of a message within the scope of a trial that uniquely defines that subset of trials to be excluded.
Auto Select IAS for Trial: If true, trial interest area set association is done automatically
by using "Image Name mapping" attribute of interest area set templates in the Data Viewer session (see section 5.8.8 “Automatic Trial Image-Interest Area Set Association” for details). The default is false.
Use Nearest Interest Area for Outlier Fixations: If the current fixation is not in any
defined interest areas, assigns the nearest interest area as the current interest area. IAs Handling: Perform Sample Based Calculation: If selected, samples within fixations (if loaded)
are used for interest area matching and report calculation. If disabled (default option), the average x, y position of the fixation is used. This option makes a difference for those data sets where fixations have a large spatial spread (e.g., smooth pursuit).
Include Fixation in Single IA: When selected, the fixation is assigned to one of the
interest areas only - the interest area assigned gets the full length of the fixation when calculating dwell times. If this option is disabled (default setting), the fixation can be assigned to multiple interest areas, and effective duration (the total amount of time that fixation and instances of the same IA intersect) for each of the interest areas is used for the calculation of dwell times.
Assign fixations to dynamic IA ordered by relative duration: Some variables (e.g.,
“CURRENT_FIX_INTEREST_AREA_INDEX” in the Fixation Report) require a fixation to be assigned to a single interest area. If a fixation lands in multiple dynamic interest areas, the assignment by default will be based on the duration of fixation on respective interest areas - the interest area with the longest duration gets the fixation assignment. Unchecking this option will do the fixation assignment by interest area index.
Allow Interpolation: If selected, any dynamic interest area that has its interpolation
property enabled will interpolate specially across its duration to the next instance’s position and shape (if it’s of the same shape type).
EyeLink Data Viewer 2002-2014 SR Research Ltd. 146
Interpolation Interval in ms: How often are dynamic interest areas interpolated? Identify First/Last Saccade Based on First/Last Fixation: The end point of a saccade
doesn't necessarily have the same coordinate as the following fixation event (because the eye is not absolutely still during a fixation; small eye movements such as drifts, tremors, microsaccades can occur during a fixation). As a result, a saccade and the following fixation may end into different interest areas. If the "Identify First/Last Saccade Based on First/Last Fixation" option is checked, Data Viewer first identifies the first and last fixation event in a trial and then find the preceding saccade of the fixation event and use this as the first/last saccade of the trial, despite occasionally the identified saccade may not end into the current interest areas. If this option is unchecked, the saccades are identified based on the actual end point and there might be a disconnect between the first/last saccade and the first/last fixation identified for the trial.
Apply Offset to Pasted Items: If checked, then pasted interest areas or interest area
instances will be offset slightly down and to the right from the location of the original interest area or interest area instance that has been cut/copied to the clipboard.
Fixation/Saccade Report Maximum Message Variables for Eye Event: Maximum number of messages
associated with a given fixation or saccade that will be shown in the output report. Eye Event Msg. Variable String Match Token: If left blank, all messages associated
with an eye event will be reported; otherwise, only those messages containing the "token" will be reported.
Fixation Stream Analysis Fixation Skip Count: Defines the number of fixations to skip when looking for the next
interest area to use in the fixation sequence analysis variables of the Interest Area report. Default is 1. Cannot be less than 1.
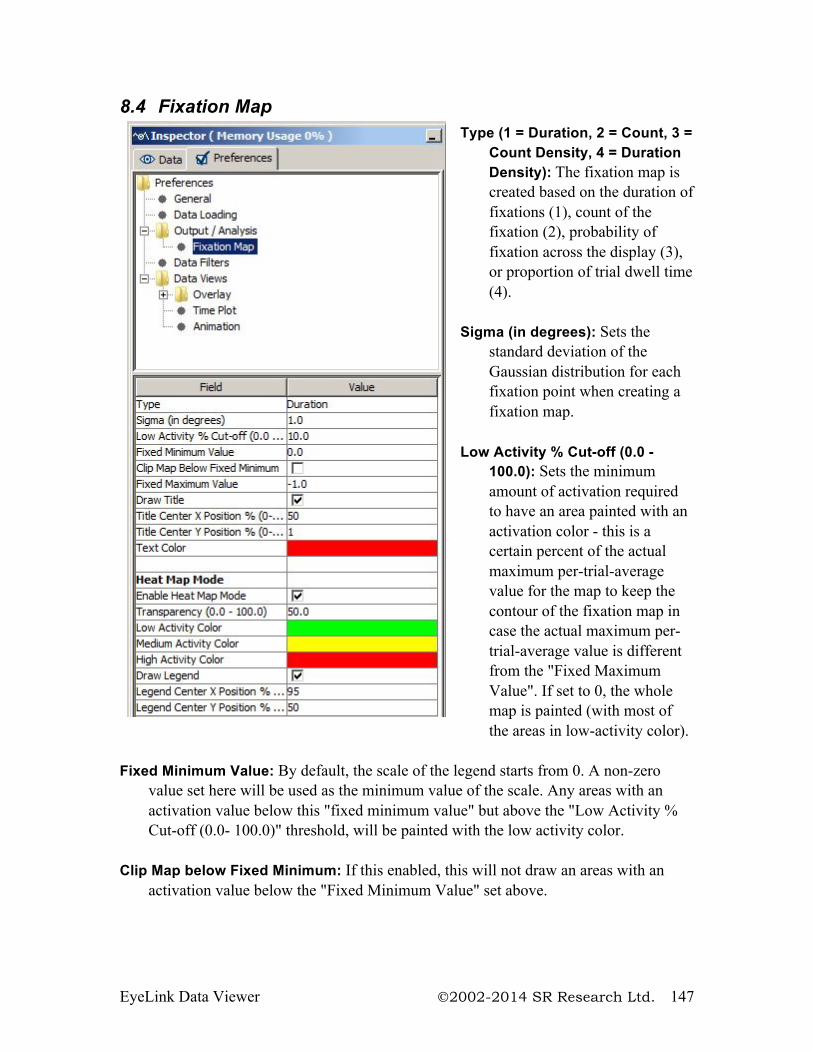
EyeLink Data Viewer 2002-2014 SR Research Ltd. 147
8.4 Fixation Map
Type (1 = Duration, 2 = Count, 3 = Count Density, 4 = Duration Density): The fixation map is created based on the duration of fixations (1), count of the fixation (2), probability of fixation across the display (3), or proportion of trial dwell time (4).
Sigma (in degrees): Sets the standard deviation of the Gaussian distribution for each fixation point when creating a fixation map.
Low Activity % Cut-off (0.0 -
100.0): Sets the minimum amount of activation required to have an area painted with an activation color - this is a certain percent of the actual maximum per-trial-average value for the map to keep the contour of the fixation map in case the actual maximum per-trial-average value is different from the "Fixed Maximum Value". If set to 0, the whole map is painted (with most of the areas in low-activity color).
Fixed Minimum Value: By default, the scale of the legend starts from 0. A non-zero
value set here will be used as the minimum value of the scale. Any areas with an activation value below this "fixed minimum value" but above the "Low Activity % Cut-off (0.0- 100.0)" threshold, will be painted with the low activity color.
Clip Map below Fixed Minimum: If this enabled, this will not draw an areas with an
activation value below the "Fixed Minimum Value" set above.
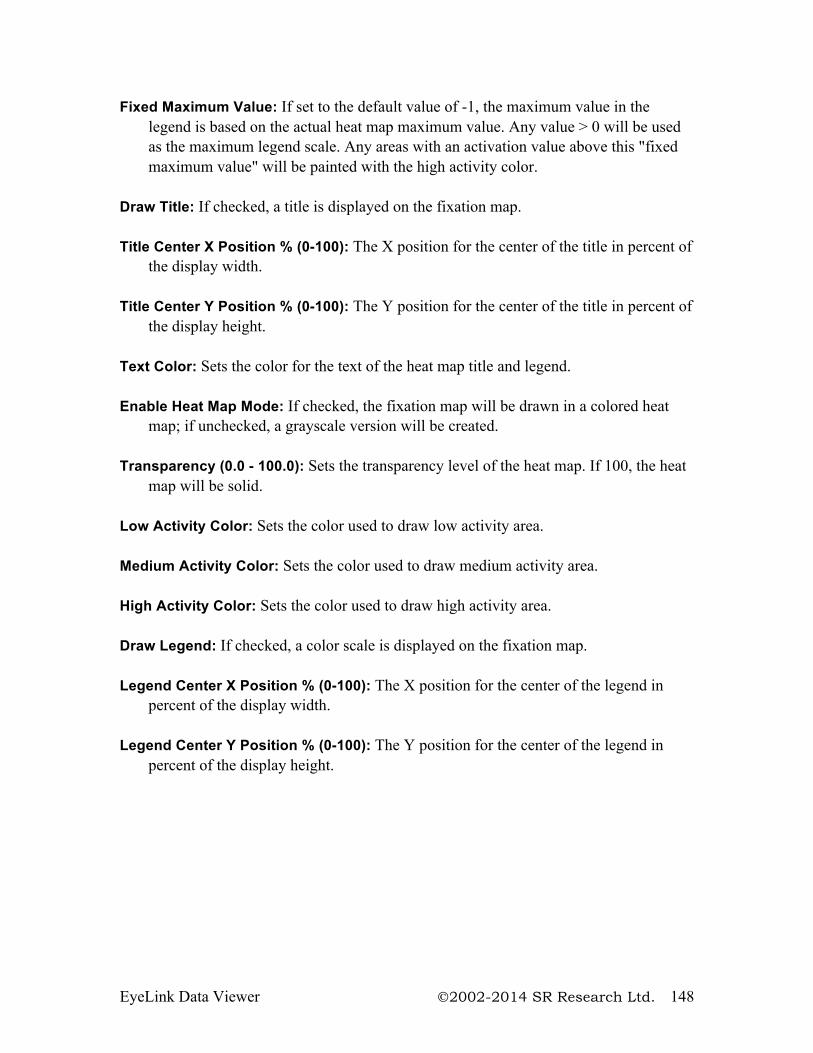
EyeLink Data Viewer 2002-2014 SR Research Ltd. 148
Fixed Maximum Value: If set to the default value of -1, the maximum value in the legend is based on the actual heat map maximum value. Any value > 0 will be used as the maximum legend scale. Any areas with an activation value above this "fixed maximum value" will be painted with the high activity color.
Draw Title: If checked, a title is displayed on the fixation map. Title Center X Position % (0-100): The X position for the center of the title in percent of
the display width. Title Center Y Position % (0-100): The Y position for the center of the title in percent of
the display height. Text Color: Sets the color for the text of the heat map title and legend. Enable Heat Map Mode: If checked, the fixation map will be drawn in a colored heat
map; if unchecked, a grayscale version will be created. Transparency (0.0 - 100.0): Sets the transparency level of the heat map. If 100, the heat
map will be solid. Low Activity Color: Sets the color used to draw low activity area. Medium Activity Color: Sets the color used to draw medium activity area. High Activity Color: Sets the color used to draw high activity area. Draw Legend: If checked, a color scale is displayed on the fixation map. Legend Center X Position % (0-100): The X position for the center of the legend in
percent of the display width. Legend Center Y Position % (0-100): The Y position for the center of the legend in
percent of the display height.
EyeLink Data Viewer 2002-2014 SR Research Ltd. 149
8.5 Data Filter Preferences The data filter preference settings consist of the following elements:
Merge Nearby Fixations: If checked, merge the neighboring brief fixations. A fixation to be merged must have a duration of less than that specified by Fixation Duration Threshold and be within 1° of the target fixation. These default thresholds are set in the “Amplitude Threshold” and “Fixation Duration Threshold” fields.
Fixation Merging Amplitude Threshold: Sets
the amplitude threshold for fixation merging. The default value is 1.0º.
Fixation Duration Threshold: Sets the
fixation duration threshold for fixation merging. A fixation will be merged if “Merge Nearby Fixations” is on and its duration is less than the specified duration threshold.
Saccade Amplitude Threshold: Sets the
minimum size of a saccade to be displayed in the viewing session. All saccades will be displayed with an amplitude threshold set to 0.0.
Blink Correction for Pupil Size Calculation: Duration to Exclude Before Blinks (msec):
Milliseconds of samples to exclude before the start of the blink events for pupil size calculation.
Duration to Exclude After Blinks (msec): Milliseconds of samples to exclude after the end of the blink events for pupil size calculation.
Display Blink Saccades: Shows flanking
saccades of a blink.
EyeLink Data Viewer 2002-2014 SR Research Ltd. 150
Hide Fixations Beyond Display Bounds: Whether or not to hide the fixations falling beyond the display boundaries;
Show Interest Areas Pre Interest Period: If interest periods are defined, whether or not
to display interest area timed before the start of a selected interest period. If no interest periods are defined, the interest areas are displayed anyway.
Show Interest Areas Post Interest Period: If interest periods are defined, whether or not
to display interest area timed after the end of a selected interest period. If no interest periods are defined, the interest areas are displayed anyway.
Hide Eye Events Only: If checked, filters out eye events (fixations, saccades, and
blinks) falling outside of the RT definition. If unchecked, filter out all events, including buttons events and messages.
Hide Spanned Events at Start of IP: Hide fixations that start before the beginning of the
currently-selected interest period and end after the beginning of the currently-selected interest period. This will hide them from the various views of Data Viewer and will exclude them completely from Reports and Fixation Maps.
Hide Spanned Events at End of IP: Hide fixations that start before the end of the
currently-selected interest period and end after the end of the currently-selected interest period. This will hide them from the various views of Data Viewer and will exclude them completely from Reports and Fixation Maps.
Trim Spanned Fixation Duration at Start of IP: Trim the duration of fixations that start
before the beginning of the currently-selected interest period and end after the beginning of the currently-selected interest period. Trimming them will effectively exclude the portion of the spanned fixation that falls outside the interest period. This will influence the spanned fixations' durations in the various views of Data Viewer and in the output that goes into Reports and Fixation Maps.
Trim Spanned Fixation Duration at End of IP: Trim the duration of fixations that start
before the end of the currently-selected interest period and end after the end of the currently-selected interest period. Trimming them will effectively exclude the portion of the spanned fixation that falls outside the interest period. This will influence the spanned fixations' durations in the various views of Data Viewer and in the output that goes into Reports and Fixation Maps.
Include Display Command Messages: Whether display command messages (i.e.,
command message starts with “!V” listed in sections 7.3.2 image loading and 7.3.3 simple graphics) should be visible.

EyeLink Data Viewer 2002-2014 SR Research Ltd. 151
Include Audio Command Messages: Whether audio command messages should be visible. The following built in audio messages are supported: "!V ARECSTART", "!V ARECSTOP", "!V VOICEKEY", "!V APLAYSTART", and "!V APLAYSTOP".
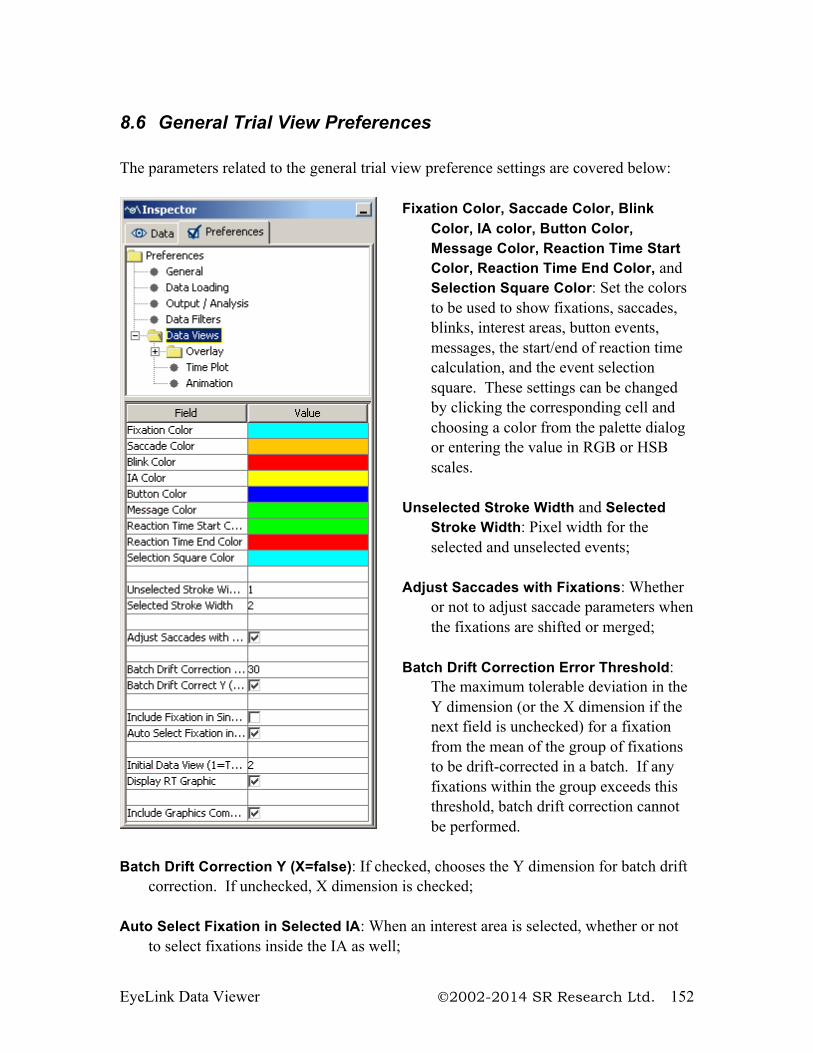
EyeLink Data Viewer 2002-2014 SR Research Ltd. 152
8.6 General Trial View Preferences The parameters related to the general trial view preference settings are covered below:
Fixation Color, Saccade Color, Blink Color, IA color, Button Color, Message Color, Reaction Time Start Color, Reaction Time End Color, and Selection Square Color: Set the colors to be used to show fixations, saccades, blinks, interest areas, button events, messages, the start/end of reaction time calculation, and the event selection square. These settings can be changed by clicking the corresponding cell and choosing a color from the palette dialog or entering the value in RGB or HSB scales.
Unselected Stroke Width and Selected
Stroke Width: Pixel width for the selected and unselected events;
Adjust Saccades with Fixations: Whether
or not to adjust saccade parameters when the fixations are shifted or merged;
Batch Drift Correction Error Threshold:
The maximum tolerable deviation in the Y dimension (or the X dimension if the next field is unchecked) for a fixation from the mean of the group of fixations to be drift-corrected in a batch. If any fixations within the group exceeds this threshold, batch drift correction cannot be performed.
Batch Drift Correction Y (X=false): If checked, chooses the Y dimension for batch drift
correction. If unchecked, X dimension is checked; Auto Select Fixation in Selected IA: When an interest area is selected, whether or not
to select fixations inside the IA as well;
EyeLink Data Viewer 2002-2014 SR Research Ltd. 153
Initial Data View (1 = TP; 2 = OL; 3 = AV): Selects the mode (1= temporal graph mode;
2 = spatial overlay mode; 3 = animation playback mode) of the trial view window when the data is first loaded;
Display RT Graphics: If reaction time definitions are initialized, whether or not to show
the “RT” symbol in the spatial overlay view and to draw the Reaction Time Start/End lines in the temporal graph view of the trial data.
Include Graphics Commands Sent Prior to IP: If no graphics commands are found
within the current interest period, uses those sent prior to the current interest period.
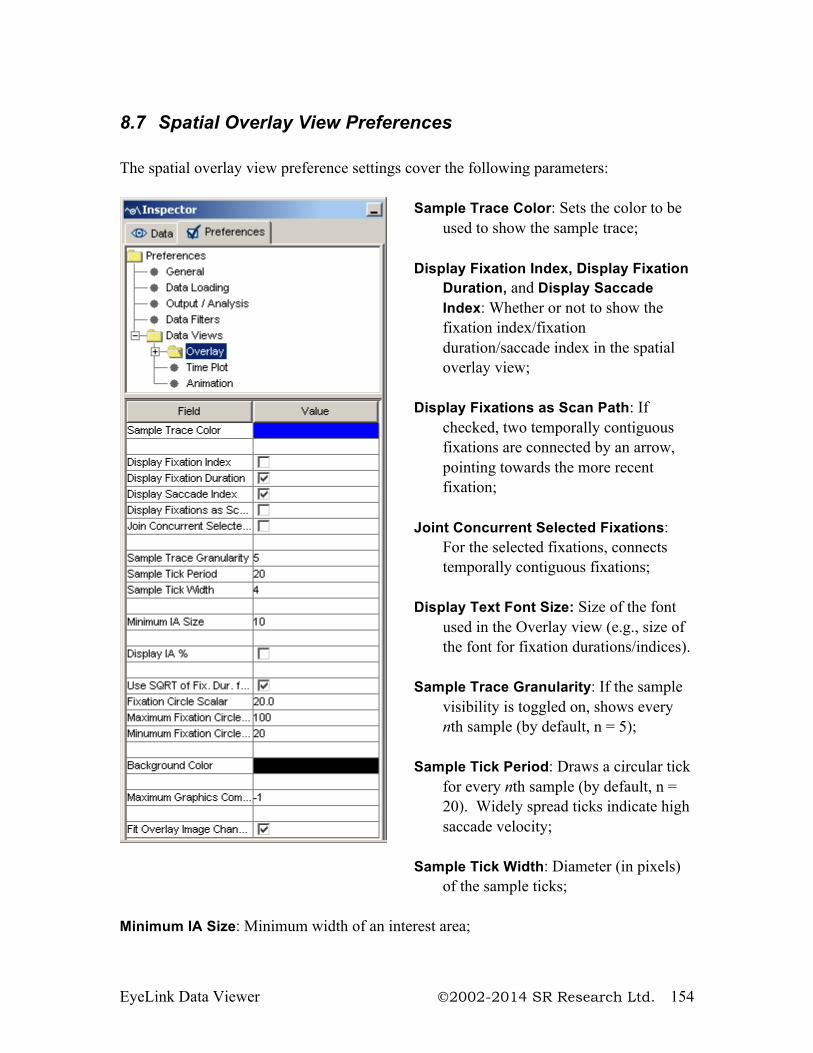
EyeLink Data Viewer 2002-2014 SR Research Ltd. 154
8.7 Spatial Overlay View Preferences The spatial overlay view preference settings cover the following parameters:
Sample Trace Color: Sets the color to be used to show the sample trace;
Display Fixation Index, Display Fixation
Duration, and Display Saccade Index: Whether or not to show the fixation index/fixation duration/saccade index in the spatial overlay view;
Display Fixations as Scan Path: If
checked, two temporally contiguous fixations are connected by an arrow, pointing towards the more recent fixation;
Joint Concurrent Selected Fixations:
For the selected fixations, connects temporally contiguous fixations;
Display Text Font Size: Size of the font
used in the Overlay view (e.g., size of the font for fixation durations/indices).
Sample Trace Granularity: If the sample
visibility is toggled on, shows every nth sample (by default, n = 5);
Sample Tick Period: Draws a circular tick
for every nth sample (by default, n = 20). Widely spread ticks indicate high saccade velocity;
Sample Tick Width: Diameter (in pixels)
of the sample ticks; Minimum IA Size: Minimum width of an interest area;
EyeLink Data Viewer 2002-2014 SR Research Ltd. 155
Display IA%: If selected, shows percentage of trial dwell time spent on the selected interest area
Use SQRT of Fixation Duration for Circle Size: Uses the square root of fixation
duration to calculate the width of the fixation circle if checked. Fixation Circle Scalar, Maximum Fixation Circle Width, and Minimum Fixation
Circle Width: If the above Use SQRT of Fixation Duration for Circle Size option is not used, use Fixation Circle Scalar to define a scalar for fixation circle width calculation. The maximum and minimum circle widths are set with the Maximum Fixation Circle Width/Minimum Fixation Circle Width elements;
Background Color: Background color for the spatial overlay view (used only if the trial
bitmap is not loaded). Maximum Graphics Commands to Process: Sets the maximum number of
graphics commands to process in each trial. This command is useful for those trials in which there are many viewer graphics commands while the user may just need to see a few of them. If it is set to -1, the viewer will process all graphics commands. For all other entries of integer numbers, the viewer will process the number of graphics commands specified when creating background image for overlay view.
Fit Overlay Image Change to Display: If True, when the background image for a trial is manually changed, the image is scaled to fit the display dimensions for the trial. If false, the image size is not altered and the image is centered on the trial overlay view.
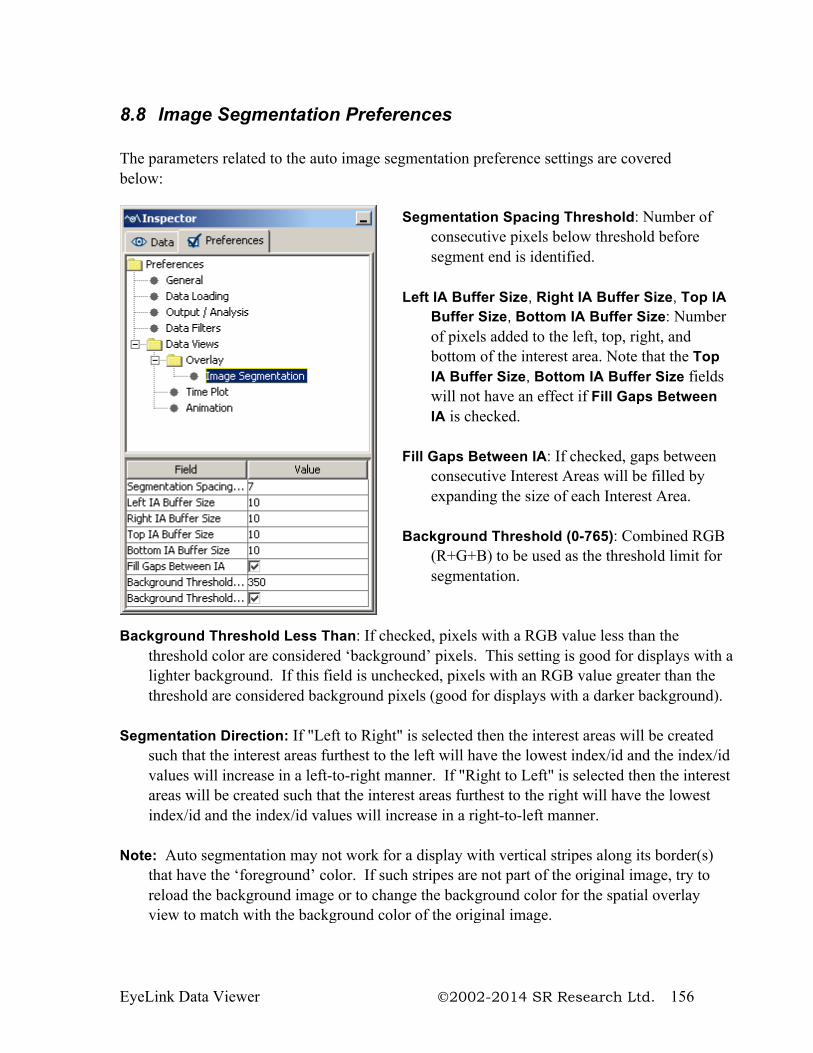
EyeLink Data Viewer 2002-2014 SR Research Ltd. 156
8.8 Image Segmentation Preferences The parameters related to the auto image segmentation preference settings are covered below:
Segmentation Spacing Threshold: Number of consecutive pixels below threshold before segment end is identified.
Left IA Buffer Size, Right IA Buffer Size, Top IA
Buffer Size, Bottom IA Buffer Size: Number of pixels added to the left, top, right, and bottom of the interest area. Note that the Top IA Buffer Size, Bottom IA Buffer Size fields will not have an effect if Fill Gaps Between IA is checked.
Fill Gaps Between IA: If checked, gaps between
consecutive Interest Areas will be filled by expanding the size of each Interest Area.
Background Threshold (0-765): Combined RGB
(R+G+B) to be used as the threshold limit for segmentation.
Background Threshold Less Than: If checked, pixels with a RGB value less than the threshold color are considered ‘background’ pixels. This setting is good for displays with a lighter background. If this field is unchecked, pixels with an RGB value greater than the threshold are considered background pixels (good for displays with a darker background).
Segmentation Direction: If "Left to Right" is selected then the interest areas will be created
such that the interest areas furthest to the left will have the lowest index/id and the index/id values will increase in a left-to-right manner. If "Right to Left" is selected then the interest areas will be created such that the interest areas furthest to the right will have the lowest index/id and the index/id values will increase in a right-to-left manner.
Note: Auto segmentation may not work for a display with vertical stripes along its border(s)
that have the ‘foreground’ color. If such stripes are not part of the original image, try to reload the background image or to change the background color for the spatial overlay view to match with the background color of the original image.
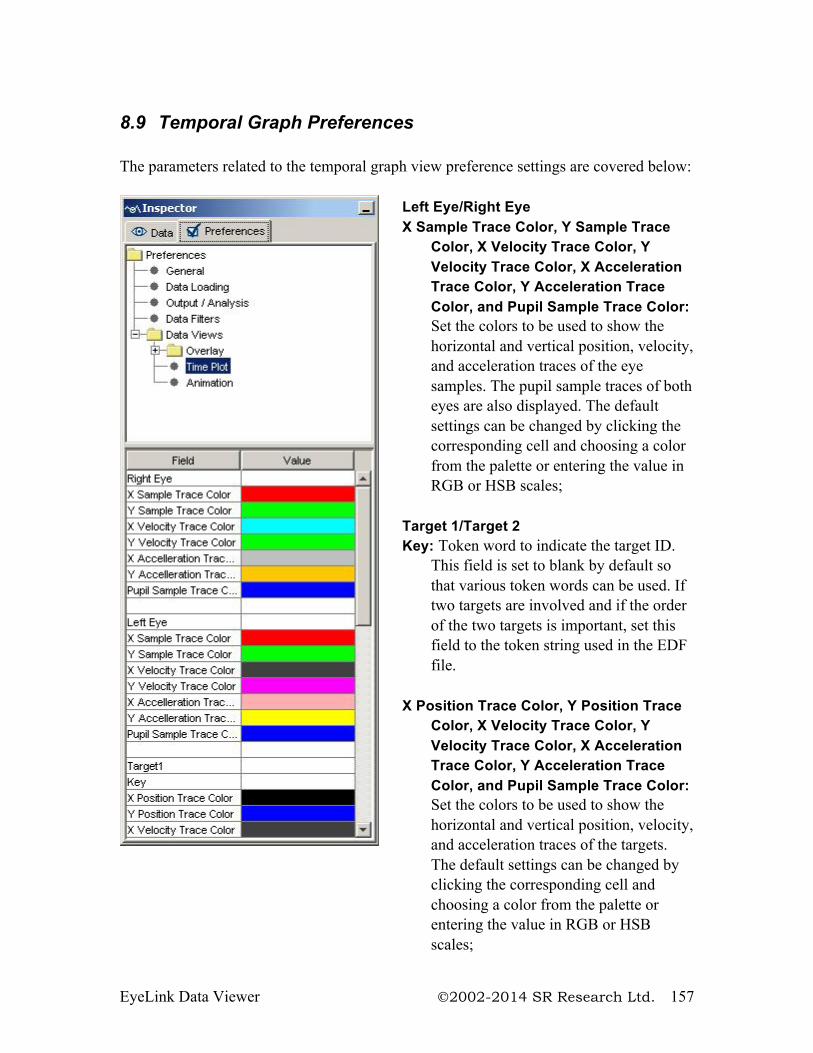
EyeLink Data Viewer 2002-2014 SR Research Ltd. 157
8.9 Temporal Graph Preferences The parameters related to the temporal graph view preference settings are covered below:
Left Eye/Right Eye X Sample Trace Color, Y Sample Trace
Color, X Velocity Trace Color, Y Velocity Trace Color, X Acceleration Trace Color, Y Acceleration Trace Color, and Pupil Sample Trace Color: Set the colors to be used to show the horizontal and vertical position, velocity, and acceleration traces of the eye samples. The pupil sample traces of both eyes are also displayed. The default settings can be changed by clicking the corresponding cell and choosing a color from the palette or entering the value in RGB or HSB scales;
Target 1/Target 2 Key: Token word to indicate the target ID.
This field is set to blank by default so that various token words can be used. If two targets are involved and if the order of the two targets is important, set this field to the token string used in the EDF file.
X Position Trace Color, Y Position Trace
Color, X Velocity Trace Color, Y Velocity Trace Color, X Acceleration Trace Color, Y Acceleration Trace Color, and Pupil Sample Trace Color: Set the colors to be used to show the horizontal and vertical position, velocity, and acceleration traces of the targets. The default settings can be changed by clicking the corresponding cell and choosing a color from the palette or entering the value in RGB or HSB scales;
EyeLink Data Viewer 2002-2014 SR Research Ltd. 158
Acceleration Trace Scaling Factor and Velocity Trace Scaling Factor: Set the scaling factor for the acceleration and velocity data so that these two traces can be displayed appropriately in this view;
Message Triangle Width, Message Triangle Height, Button Triangle Width, and
Button Triangle Height: Set the width and height of the symbols for message and button events;
Background Color and Ruler color: Set the colors for background and ruler of the
temporal graph view. Split Y axis: If true, 0 appear in the middle of the screen, positive values on the top and
negative values at the bottom; otherwise, a descending scale is used, with large values on the Y-axis appearing at the bottom of the screen. Note, this setting will only be effective when the data are loaded in a new viewing session.
X Trace Highlighted, Y Trace Highlighted, and Pupil Trace Highlighted: Whether or
not by default the X trace, y trace, and pupil trace are highlighted; Initial Visible Sample Count: Total number of initially visible samples in the temporal
graph view window (the default is 5000). Use X Position for Fixation Location: If checked, use the X position to indicate the
position of a fixation event in the temporal graph view; otherwise, use the Y position.
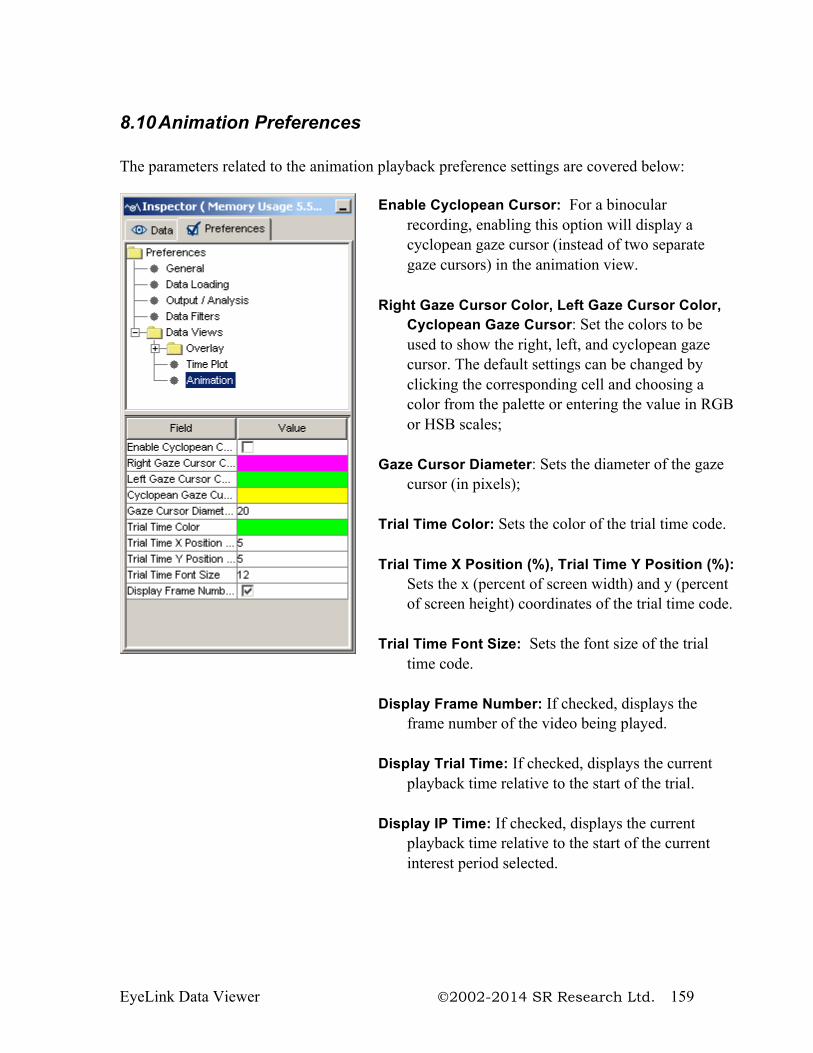
EyeLink Data Viewer 2002-2014 SR Research Ltd. 159
8.10 Animation Preferences The parameters related to the animation playback preference settings are covered below:
Enable Cyclopean Cursor: For a binocular recording, enabling this option will display a cyclopean gaze cursor (instead of two separate gaze cursors) in the animation view.
Right Gaze Cursor Color, Left Gaze Cursor Color,
Cyclopean Gaze Cursor: Set the colors to be used to show the right, left, and cyclopean gaze cursor. The default settings can be changed by clicking the corresponding cell and choosing a color from the palette or entering the value in RGB or HSB scales;
Gaze Cursor Diameter: Sets the diameter of the gaze
cursor (in pixels); Trial Time Color: Sets the color of the trial time code. Trial Time X Position (%), Trial Time Y Position (%):
Sets the x (percent of screen width) and y (percent of screen height) coordinates of the trial time code.
Trial Time Font Size: Sets the font size of the trial
time code. Display Frame Number: If checked, displays the
frame number of the video being played. Display Trial Time: If checked, displays the current
playback time relative to the start of the trial. Display IP Time: If checked, displays the current
playback time relative to the start of the current interest period selected.
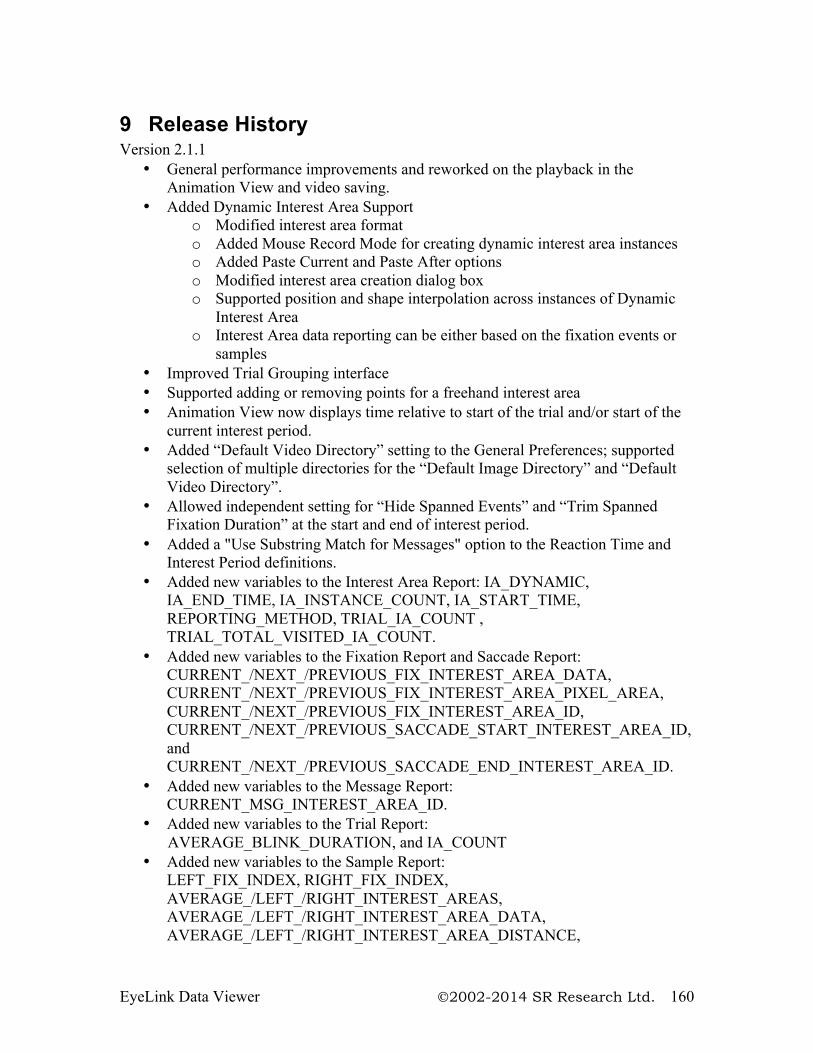
EyeLink Data Viewer 2002-2014 SR Research Ltd. 160
9 Release History Version 2.1.1
• General performance improvements and reworked on the playback in the Animation View and video saving.
• Added Dynamic Interest Area Support o Modified interest area format o Added Mouse Record Mode for creating dynamic interest area instances o Added Paste Current and Paste After options o Modified interest area creation dialog box o Supported position and shape interpolation across instances of Dynamic
Interest Area o Interest Area data reporting can be either based on the fixation events or
samples • Improved Trial Grouping interface • Supported adding or removing points for a freehand interest area • Animation View now displays time relative to start of the trial and/or start of the
current interest period. • Added “Default Video Directory” setting to the General Preferences; supported
selection of multiple directories for the “Default Image Directory” and “Default Video Directory”.
• Allowed independent setting for “Hide Spanned Events” and “Trim Spanned Fixation Duration” at the start and end of interest period.
• Added a "Use Substring Match for Messages" option to the Reaction Time and Interest Period definitions.
• Added new variables to the Interest Area Report: IA_DYNAMIC, IA_END_TIME, IA_INSTANCE_COUNT, IA_START_TIME, REPORTING_METHOD, TRIAL_IA_COUNT , TRIAL_TOTAL_VISITED_IA_COUNT.
• Added new variables to the Fixation Report and Saccade Report: CURRENT_/NEXT_/PREVIOUS_FIX_INTEREST_AREA_DATA, CURRENT_/NEXT_/PREVIOUS_FIX_INTEREST_AREA_PIXEL_AREA, CURRENT_/NEXT_/PREVIOUS_FIX_INTEREST_AREA_ID, CURRENT_/NEXT_/PREVIOUS_SACCADE_START_INTEREST_AREA_ID, and CURRENT_/NEXT_/PREVIOUS_SACCADE_END_INTEREST_AREA_ID.
• Added new variables to the Message Report: CURRENT_MSG_INTEREST_AREA_ID.
• Added new variables to the Trial Report: AVERAGE_BLINK_DURATION, and IA_COUNT
• Added new variables to the Sample Report: LEFT_FIX_INDEX, RIGHT_FIX_INDEX, AVERAGE_/LEFT_/RIGHT_INTEREST_AREAS, AVERAGE_/LEFT_/RIGHT_INTEREST_AREA_DATA, AVERAGE_/LEFT_/RIGHT_INTEREST_AREA_DISTANCE,
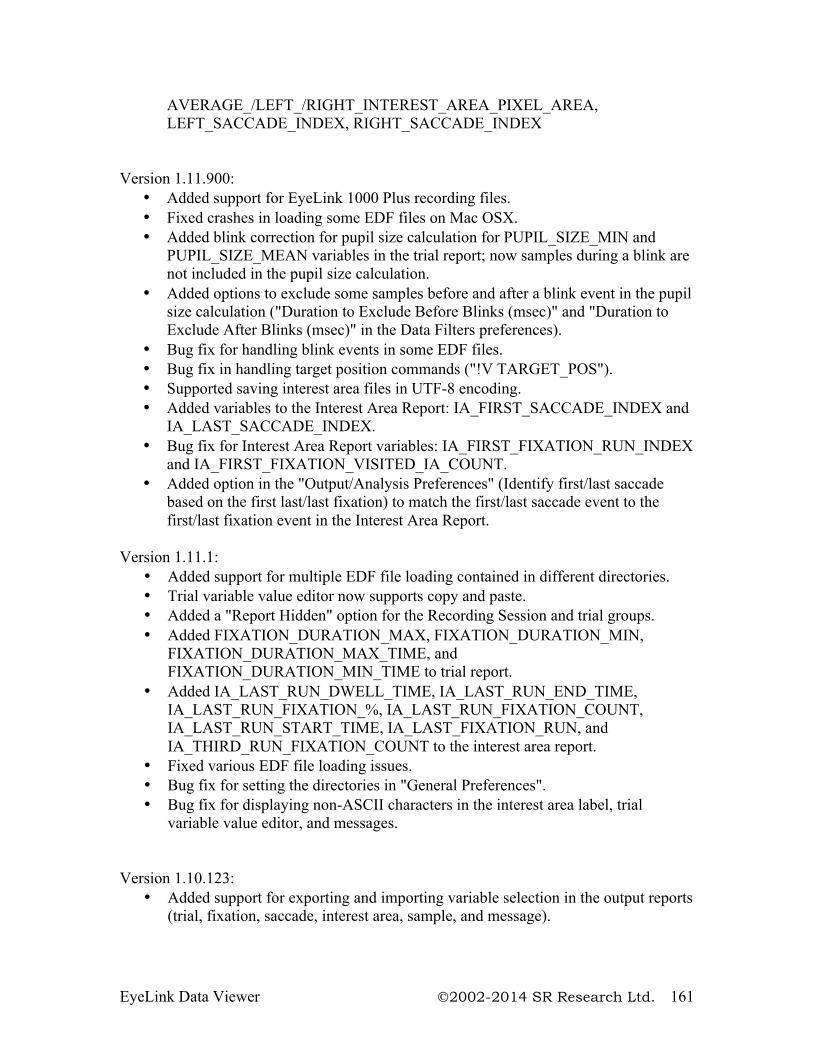
EyeLink Data Viewer 2002-2014 SR Research Ltd. 161
AVERAGE_/LEFT_/RIGHT_INTEREST_AREA_PIXEL_AREA, LEFT_SACCADE_INDEX, RIGHT_SACCADE_INDEX
Version 1.11.900:
• Added support for EyeLink 1000 Plus recording files. • Fixed crashes in loading some EDF files on Mac OSX. • Added blink correction for pupil size calculation for PUPIL_SIZE_MIN and
PUPIL_SIZE_MEAN variables in the trial report; now samples during a blink are not included in the pupil size calculation.
• Added options to exclude some samples before and after a blink event in the pupil size calculation ("Duration to Exclude Before Blinks (msec)" and "Duration to Exclude After Blinks (msec)" in the Data Filters preferences).
• Bug fix for handling blink events in some EDF files. • Bug fix in handling target position commands ("!V TARGET_POS"). • Supported saving interest area files in UTF-8 encoding. • Added variables to the Interest Area Report: IA_FIRST_SACCADE_INDEX and
IA_LAST_SACCADE_INDEX. • Bug fix for Interest Area Report variables: IA_FIRST_FIXATION_RUN_INDEX
and IA_FIRST_FIXATION_VISITED_IA_COUNT. • Added option in the "Output/Analysis Preferences" (Identify first/last saccade
based on the first last/last fixation) to match the first/last saccade event to the first/last fixation event in the Interest Area Report.
Version 1.11.1:
• Added support for multiple EDF file loading contained in different directories. • Trial variable value editor now supports copy and paste. • Added a "Report Hidden" option for the Recording Session and trial groups. • Added FIXATION_DURATION_MAX, FIXATION_DURATION_MIN,
FIXATION_DURATION_MAX_TIME, and FIXATION_DURATION_MIN_TIME to trial report.
• Added IA_LAST_RUN_DWELL_TIME, IA_LAST_RUN_END_TIME, IA_LAST_RUN_FIXATION_%, IA_LAST_RUN_FIXATION_COUNT, IA_LAST_RUN_START_TIME, IA_LAST_FIXATION_RUN, and IA_THIRD_RUN_FIXATION_COUNT to the interest area report.
• Fixed various EDF file loading issues. • Bug fix for setting the directories in "General Preferences". • Bug fix for displaying non-ASCII characters in the interest area label, trial
variable value editor, and messages. Version 1.10.123:
• Added support for exporting and importing variable selection in the output reports (trial, fixation, saccade, interest area, sample, and message).
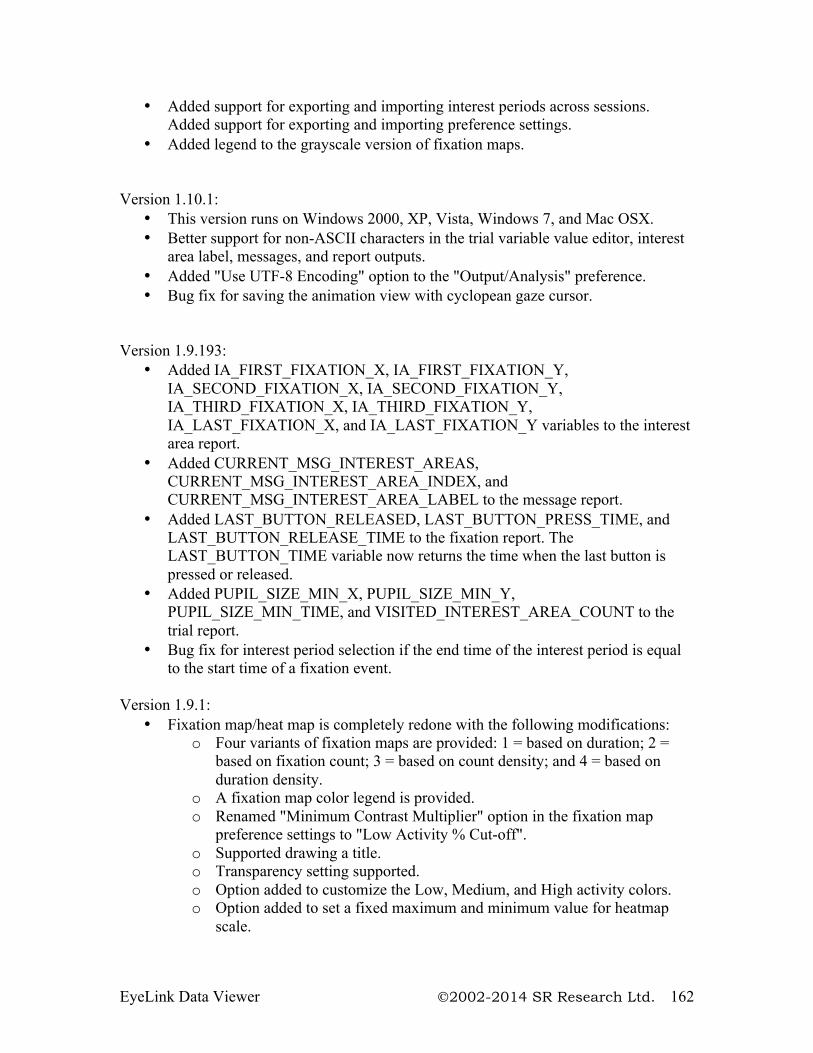
EyeLink Data Viewer 2002-2014 SR Research Ltd. 162
• Added support for exporting and importing interest periods across sessions. Added support for exporting and importing preference settings.
• Added legend to the grayscale version of fixation maps. Version 1.10.1:
• This version runs on Windows 2000, XP, Vista, Windows 7, and Mac OSX. • Better support for non-ASCII characters in the trial variable value editor, interest
area label, messages, and report outputs. • Added "Use UTF-8 Encoding" option to the "Output/Analysis" preference. • Bug fix for saving the animation view with cyclopean gaze cursor.
Version 1.9.193:
• Added IA_FIRST_FIXATION_X, IA_FIRST_FIXATION_Y, IA_SECOND_FIXATION_X, IA_SECOND_FIXATION_Y, IA_THIRD_FIXATION_X, IA_THIRD_FIXATION_Y, IA_LAST_FIXATION_X, and IA_LAST_FIXATION_Y variables to the interest area report.
• Added CURRENT_MSG_INTEREST_AREAS, CURRENT_MSG_INTEREST_AREA_INDEX, and CURRENT_MSG_INTEREST_AREA_LABEL to the message report.
• Added LAST_BUTTON_RELEASED, LAST_BUTTON_PRESS_TIME, and LAST_BUTTON_RELEASE_TIME to the fixation report. The LAST_BUTTON_TIME variable now returns the time when the last button is pressed or released.
• Added PUPIL_SIZE_MIN_X, PUPIL_SIZE_MIN_Y, PUPIL_SIZE_MIN_TIME, and VISITED_INTEREST_AREA_COUNT to the trial report.
• Bug fix for interest period selection if the end time of the interest period is equal to the start time of a fixation event.
Version 1.9.1:
• Fixation map/heat map is completely redone with the following modifications: o Four variants of fixation maps are provided: 1 = based on duration; 2 =
based on fixation count; 3 = based on count density; and 4 = based on duration density.
o A fixation map color legend is provided. o Renamed "Minimum Contrast Multiplier" option in the fixation map
preference settings to "Low Activity % Cut-off". o Supported drawing a title. o Transparency setting supported. o Option added to customize the Low, Medium, and High activity colors. o Option added to set a fixed maximum and minimum value for heatmap
scale.
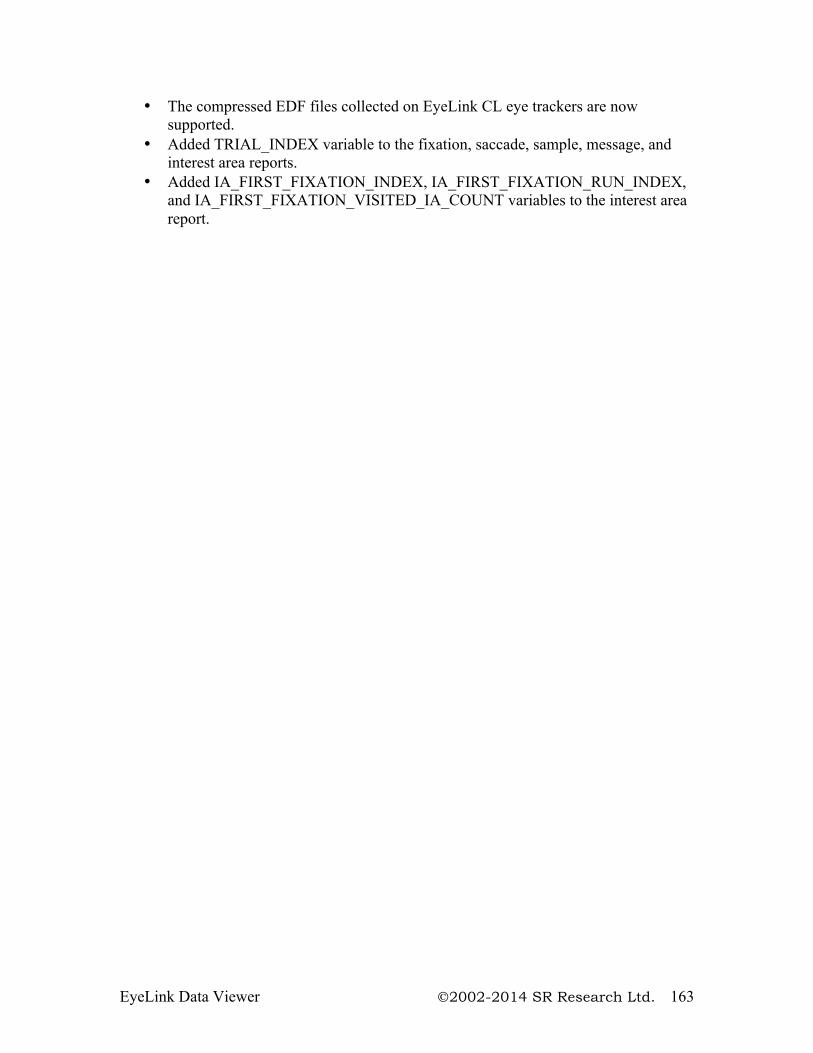
EyeLink Data Viewer 2002-2014 SR Research Ltd. 163
• The compressed EDF files collected on EyeLink CL eye trackers are now supported.
• Added TRIAL_INDEX variable to the fixation, saccade, sample, message, and interest area reports.
• Added IA_FIRST_FIXATION_INDEX, IA_FIRST_FIXATION_RUN_INDEX, and IA_FIRST_FIXATION_VISITED_IA_COUNT variables to the interest area report.