Embed Size (px)
Citation preview
Factor Markets and the Distribution of Income
1

A factor of production is any resource that is used by firms to produce goods and services, items that are consumed by households.
Factors of production are bought and sold in factor markets, and the prices in factor markets are known as factor prices.
What are these factors of production, and why do factor prices matter?
The Economy’s Factors of Production
2

Factor prices play a key role in the allocation of resources among producers due to two features that make these markets special:
Demand for the factor is derived from the firm’s output choice.
Factor markets are where most of us get the largest shares of our income
Why Factor Prices Matter: The Allocation of Resources
3
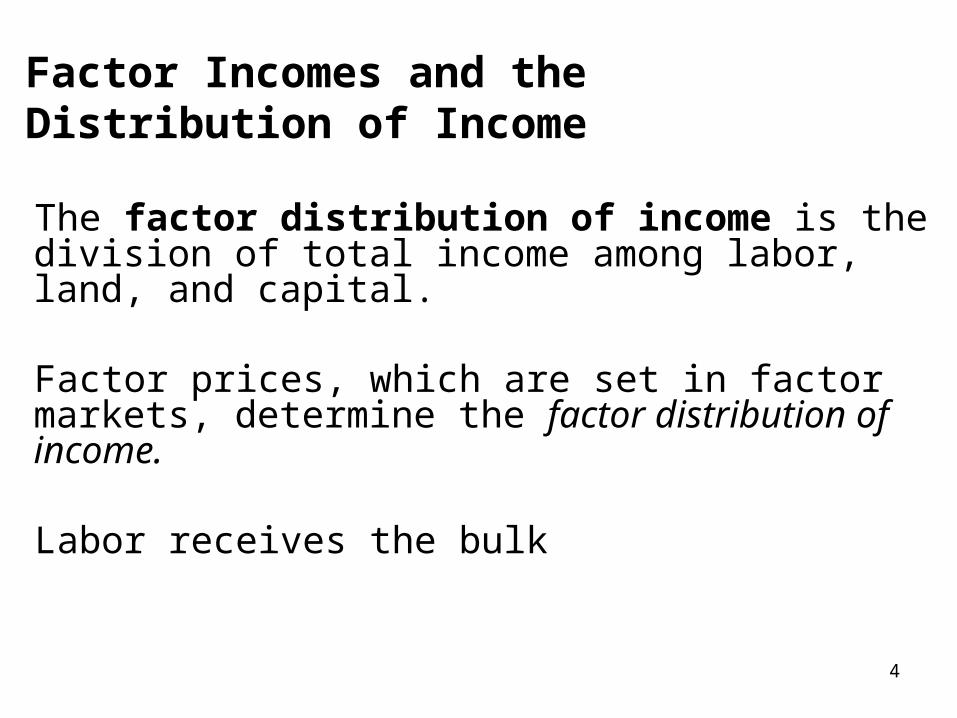
The factor distribution of income is the division of total income among labor, land, and capital.
Factor prices, which are set in factor markets, determine the factor distribution of income.
Labor receives the bulk
Factor Incomes and the Distribution of Income
4

All economic decisions are about comparing costs and benefits. For a producer, it could be deciding whether to hire an additional worker…But what is the marginal benefit of that worker? We will use the production function, which relates inputs to output to answer that question. We will assume that all producers are price-takers—they operate in a perfectly competitive industry.
Marginal Productivity and Factor Demand
5

Panel (a) uses the total product curve to show how total wheat production depends on the number of workers employed on the farm; panel (b) shows how the marginal product of labor, the increase in output from employing one more worker, depends on the number of workers employed.
The Production Function for George and Martha’s Farm
6
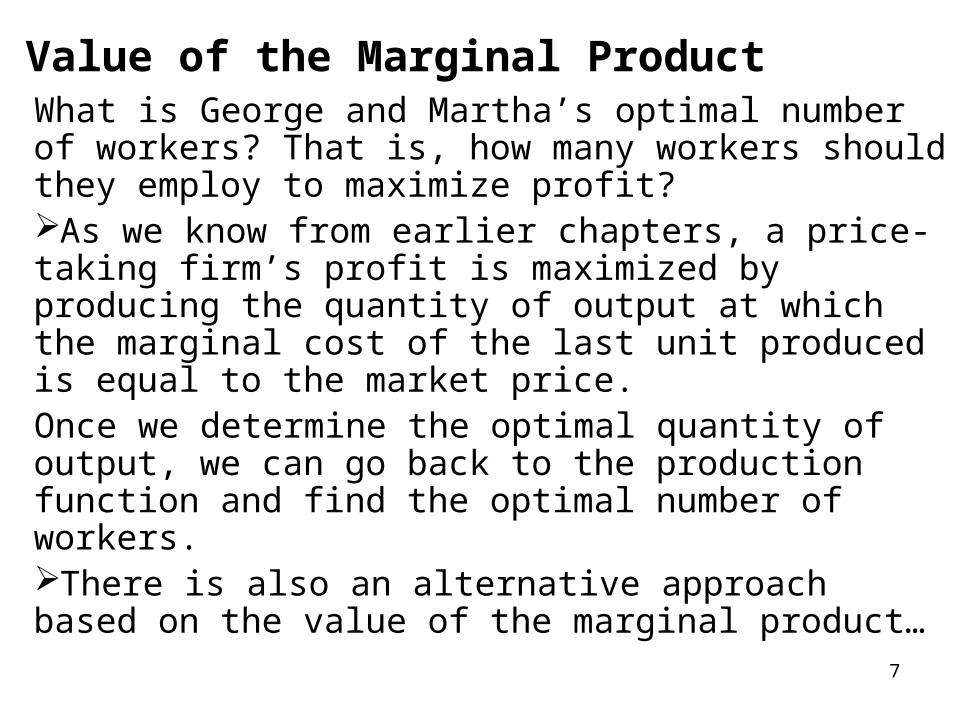
What is George and Martha’s optimal number of workers? That is, how many workers should they employ to maximize profit?As we know from earlier chapters, a price-taking firm’s profit is maximized by producing the quantity of output at which the marginal cost of the last unit produced is equal to the market price. Once we determine the optimal quantity of output, we can go back to the production function and find the optimal number of workers. There is also an alternative approach based on the value of the marginal product…
Value of the Marginal Product
7

Value of the Marginal Product
The value of the marginal product of a factor is the value of the additional output generated by employing one more unit of that factor. Value of the marginal product of labor =
VMPL = P × MPLThe general rule is that a profit-maximizing, price-taking producer employs each factor of production up to the point at which the value of the marginal product of the last unit of the factor employed is equal to that factor’s price.
8
Value of the Marginal Product
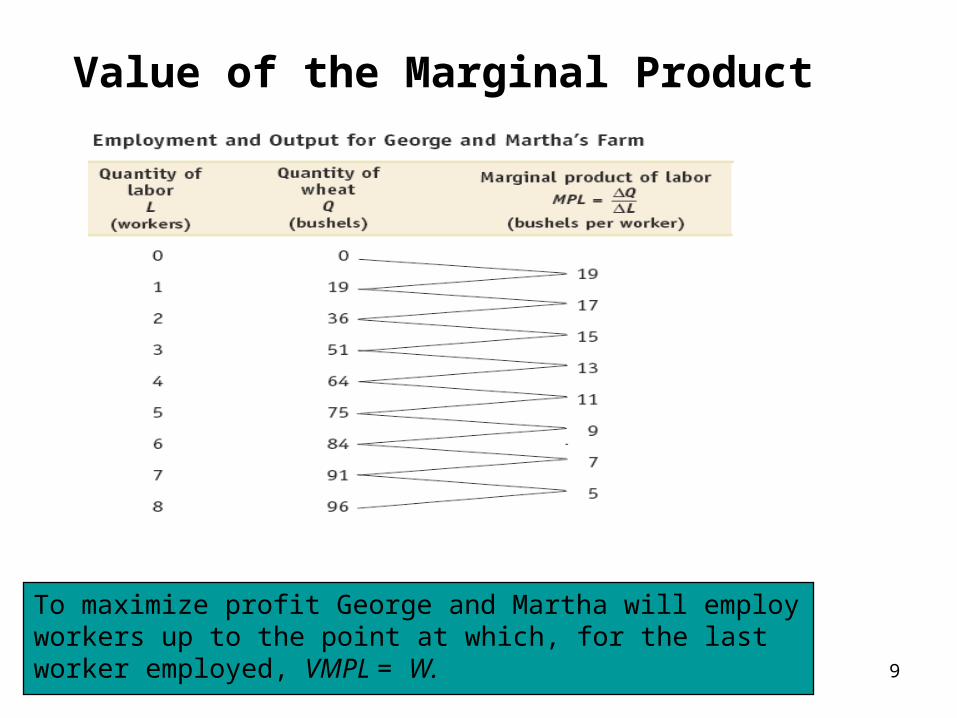
To maximize profit George and Martha will employ workers up to the point at which, for the last worker employed, VMPL = W.
9
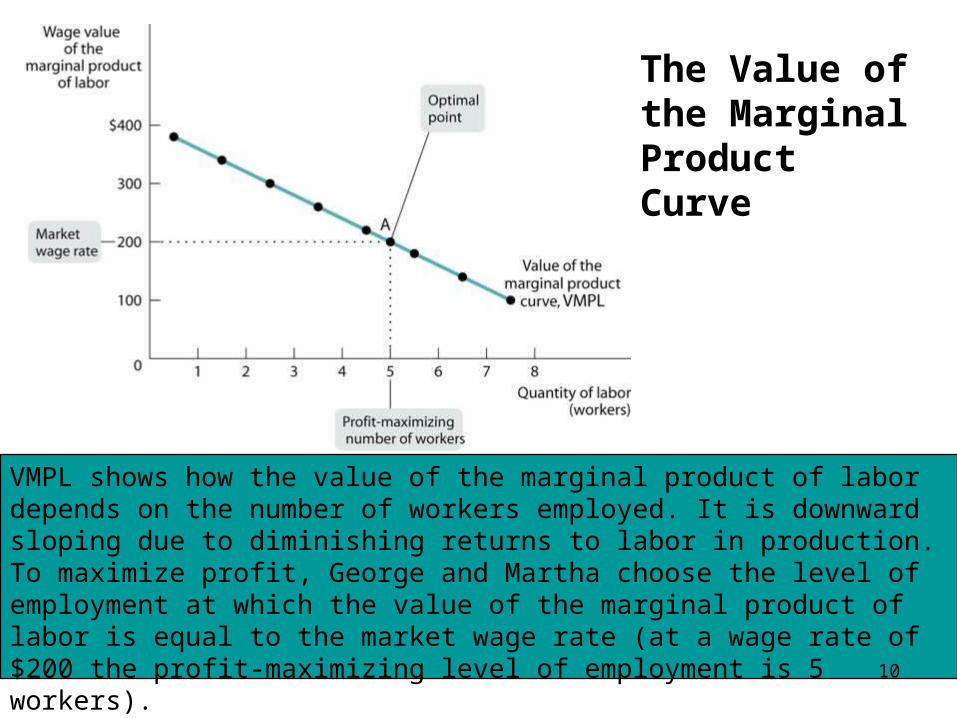
The Value of the Marginal Product Curve
VMPL shows how the value of the marginal product of labor depends on the number of workers employed. It is downward sloping due to diminishing returns to labor in production. To maximize profit, George and Martha choose the level of employment at which the value of the marginal product of labor is equal to the market wage rate (at a wage rate of $200 the profit-maximizing level of employment is 5 workers).
10
Shifts of the Factor Demand Curve
What causes factor demand curves to shift? There are three main causes: Changes in prices of goods Changes in supply of other factors Changes in technology
11

Shifts of the Value of the Marginal Product Curve
Panel (a) shows the effect of a rise in the price of wheat on George and Martha’s demand for labor. The value of the marginal product curve shifts upward, from VMPL1 to VMPL2. If the market wage rate remains at $200, profit maximizing employment rises from 5 workers to 8 workers (A B).
Panel (b) shows the effect of a fall in the price of wheat. The value of the marginal product curve shifts downward, from VMPL1 to VMPL3. At the market wage rate of $200, profit-maximizing employment falls from 5 workers to 2 workers (A C).
12
The Marginal Productivity Theory of Income Distribution
We have learned that when the markets for goods and services and the factor markets are perfectly competitive, factors of production will be employed up to the point at which their value of the marginal product is equal to their price. What does this say about the factor distribution of income?
13

All Producers Face the Same Wage Rate
Although Farmer Jones grows wheat and Farmer Smith grows corn, they both compete in the same market for labor and must therefore pay the same wage rate, $200. Each producer hires labor up to the point at which VMPL = $200: 5 workers for Jones, 7 workers for Smith.
14

Equilibrium in the Labor Market
Each firm will hire labor up to the point at which the value of the marginal product of labor is equal to the equilibrium wage rate. This means that, in equilibrium, the marginal product of labor will be the same for all employers. So the equilibrium (or market) wage rate is equal to the equilibrium value of the marginal product of labor—the additional value produced by the last unit of labor employed in the labor market as a whole.
15
Equilibrium in the Labor Market
It doesn’t matter where that additional unit is employed, since VMPL is the same for all producers.
The theory that each factor is paid the value of the output generated by the last unit employed in the factor market as a whole is known as the marginal productivity theory of income distribution.
16

Equilibrium in the Labor Market
So, labor is paid its equilibrium value of the marginal product, the value of the marginal product of the last worker hired in the labor market as a whole.
The market labor demand curve is the horizontal sum of the individual labor demand curves of all producers. Here the equilibrium wage rate is W*, the equilibrium employment level is L*, and every producer hires labor up to the point at which VMPL = W*.
17

Compensating differentials are wage differences across jobs that reflect the fact that some jobs are less pleasant than others.Compensating differentials, as well as differences in the values of the marginal products of workers that arise from differences in talent, job experience, and human capital, account for some wage disparities.Those with a high school diploma earn more than those without one, and those with a college degree earn substantially more than those with only a high school diploma…
Marginal Productivity and Wage Inequality
18

Market power, in the form of unions or collective action by employers, as well as the efficiency-wage model, also explain how some wage disparities arise.Unions are organizations of workers that try to raise wages and improve working conditions for their members.According to the efficiency-wage model, some employers pay an above equilibrium wage as an incentive for better performance.
Marginal Productivity and Wage Inequality
19

The Supply of LaborWork Versus Leisure Decisions about labor supply result from decisions about time allocation: how many hours to spend on different activities.
Leisure is time available for purposes other than earning money to buy marketed goods.
In the following graph, the individual labor supply curve shows how the quantity of labor supplied by an individual depends on that individual’s wage rate. 20
The Supply of Labor
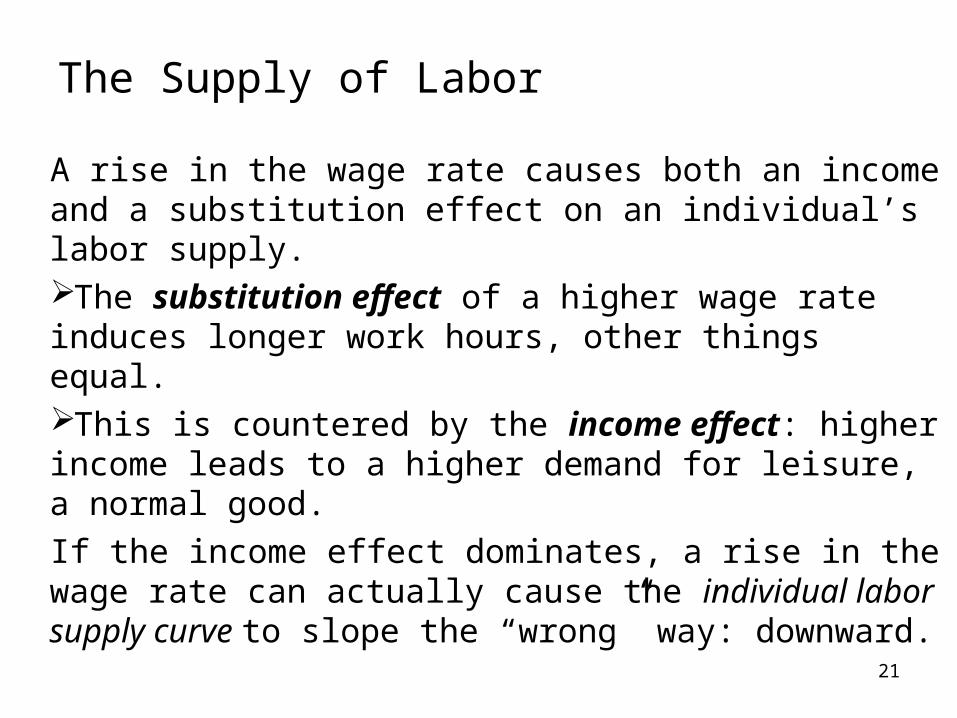
A rise in the wage rate causes both an income and a substitution effect on an individual’s labor supply. The substitution effect of a higher wage rate induces longer work hours, other things equal. This is countered by the income effect: higher income leads to a higher demand for leisure, a normal good. If the income effect dominates, a rise in the wage rate can actually cause the individual labor supply curve to slope the “wrong” way: downward. 21

When the substitution effect of a wage increase dominates the income effect, the individual labor supply curve is upward sloping as in panel (a). Here a rise in the wage rate from $10 to $20 per hour increases the number of hours worked from 40 to 50.
The Individual Labor Supply Curve
But when the income effect of a wage increase dominates the substitution effect, the individual labor supply curve is downward sloping as in panel (b). Here the same rise in the wage rate reduces the number of hours worked from 40 to 30.
22

Shifts of the Labor Supply CurveThe market labor supply curve is the horizontal sum of the individual supply curves of all workers in that market. It shifts for four main reasons: changes in preferences and social norms,changes in population, changes in opportunities, and changes in wealth.
23

Rent, Interest, and Profit
24

• What is land?• Economic rent• Are prices high because rents are high, or are
rents high because prices are high?• What is capital?• How is the interest rate determined?• The net productivity of capital• The capitalization of assets• The present value of future income• How are profits determined?• Theories of profit
25

What Is Rent?• What is land?
– Land is a resource or a factor of production
– The owner of land is paid rent for allowing its use in the production process
– The amount of rent paid for a piece of land is based on the supply of and the demand for land
26

What Is Land?• Land is land
• How land is used depends on its location, its fertility, and whether it possesses any valuable minerals
• Sometimes we confuse land with what is built on it– Land with an apartment building on it
will rent for more than a vacant lot• However in economic terms we pay rent on
the land itself27

How Does One Piece of Land Differ From Another?
• A plot of land may have a few alternative uses
• If it is used at all, it will be used by the highest bidder – the one willing to pay the most for it
• The basic way one piece of land differs from another is location– An acre of land in the middle of a desert
is worth a lot less than an acre of land in a metropolitan area
28
How Is the Supply of Land Arrived at?
• In economics we say the supply of land is fixed
• We can make more efficient use of land
• We represent the supply of land as a vertical line
29
How Is the Demand for Land Derived?
• The demand for land, like the demand for labor and capital, is derived from a firm’s MRP (Marginal Revenue Product) curve
• The land will go to the highest bidder• The demand curve for land slopes
downward to the right because its marginal physical product declines with output (due to diminishing returns)– If the firm is an imperfect competitor, it
must lower price to increase sales, thereby further depressing MRP as output expands
30

Determination of Rent
The demand for rent is the MRP schedule of the highest bidder for a specific piece of land. The supply of land is fixed, so its supply curve is perfectly inelastic. The rent, like the price of anything else, is set by supply and demand
31

Increase in Demand for Land
200,000
160,000
120,000
80,000
40,000
Amount of land
S
D2
D1
Since the supply of land is perfectly inelastic, an increase in demand is reflected entirely in an increase in price (and not an increase in the quantity of land).
32

Economic Rent
• Economic rent is payment in excess of what people would be willing to accept
• Rent paid to landlords (exclusive of any payment for buildings and property improvement ) is, by definition, economic rent
33

Are Prices High Because Rents Are High, or Are Rents High Because Prices Are High?
• High rents don’t cause high prices• Desirable locations attract many prosperous renters,
who bid up rents because they believe they will get a lot of business
• Rents are high because the demand for the final product(s) – and consequently the derived demand – is high
• If low rents lead to low prices stores (with low rent) would have lower prices, but they have higher prices
34

Capital• What is capital
– Capital consists of office buildings, factories, stores, machinery and equipment, computer systems, and other synthetic goods used in the production process
– When we invest we are spending money on new capital
– The stock of capital increases by means of a flow of investment
• Say you have a capital stock of four machines. You buy two more. That’s your investment for the year. Now you have a capital stock of six machines
35

How Is the Interest Rate Determined?
D
Quantity of loanable funds
Q1
2
4
6
8
10
12
14
16 SThe interest rate is determined by the demand for loanable funds and the supply of loanable funds
The supply of loanable funds (or savings) slopes upward to the right because the amount of money people save is somewhat responsive to interest rates
36

Interest Rates and Consumer Loans
• High interest rates deter borrowing for consumer loans
• Banks arguably charge too much on credit card loans
• Should this justify a legal ceiling (usury laws) on the interest that may be charged on these and other loans?
37

Usury Laws
• Usury laws place limits on how much interest may be charged
• Usury laws are price ceilings because they prevent the interest rates from rising to their equilibrium level– This creates a shortage of loanable
funds
38

Usury Laws• How do usury laws hurt borrowers?
– Since usury laws create a shortage of loanable funds, the funds that are available go to the most creditworthy individuals and businesses first
– Borrowers with poor credit ratings are completely left out
• These borrowers are left with consumer finance companies that may not be subject to usury laws
• This means that if they can find money to borrow they will end up paying much higher interest rates than without usury laws
39

Interest Rate Ceiling
Quantity of loanable funds (in $billions)
100 200 300 400 500 600 700 800
Ceiling
D
S
4
8
12
16
20
24
28
32
36
Shortage of $350 billion
40

Determination of the Level of Investment
Amount of investment (in $millions)
10 20 30 40 50 60
2
4
6
8
10
12
14
16
18
20
22
24
Net productivityof capital
Net Productivity of CapitalThe net productivity of capital is, in effect, a firm’s MRP schedule. In this case, given this firm’s net productivity of capital, it would borrow $40 million if the interest rate were 10 percent. The lower the interest rate, the more that would be borrowed and invested
41
The Net Productivity of Capital
• Economist have developed the concept of net productivity of capital, which translates into the expected profit rate– Subtract all cost (including an allowance
for a normal profit) from sales. This give us the dollar value of net productivity
– Assuming this value is positive, we divide it by capital cost to give us the net productivity of capital, which we express as a percentage
42
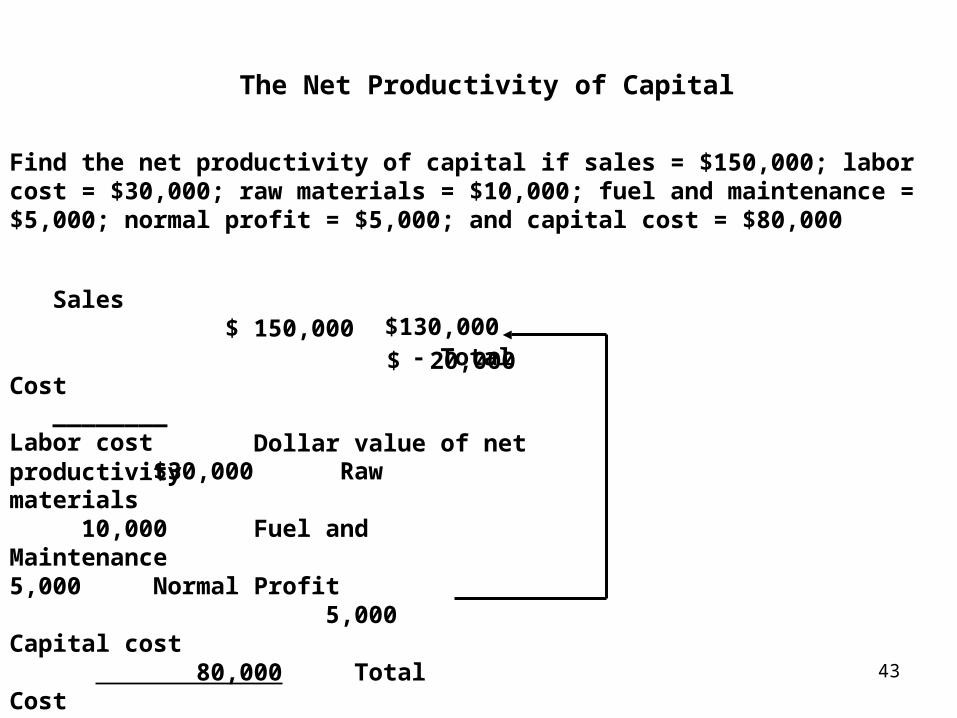
The Net Productivity of Capital
Find the net productivity of capital if sales = $150,000; labor cost = $30,000; raw materials = $10,000; fuel and maintenance = $5,000; normal profit = $5,000; and capital cost = $80,000
Sales $ 150,000 - Total Cost ________ x Dollar value of net productivity
Labor cost $30,000 Raw materials 10,000 Fuel and Maintenance 5,000 Normal Profit 5,000 Capital cost 80,000 Total Cost $130,000
$130,000
$ 20,000
43

The Net Productivity of Capital
Find the net productivity of capital is sales = $150,000; labor cost = $30,000; Raw materials = $10,000; Fuel and maintenance = $5,000; Normal profit = $5,000; and Capital Cost = $80,000 ( are included in Total Cost)
Sales $ 150,000 - Total Cost ________ x Dollar value of net productivity
$ 130,000
$ 20,000
----------------------------------------------------- = Net productivity of capital (25 percent)Dollar value of net productivity ($20,000)
Capital cost ($80,000)
You would invest right up the point (or just short of the point) at which the interest rate equals the net productivity of capital
44

The Capitalization of Assets
• The capitalization of assets is just an alternate way of dealing with capital investment
• This concept enables a business firm to make a decision about purchasing a capital asset
• To make this decision a firm needs to know what is the value of that asset– To do this the firm must also know what the
current interest rate is
45

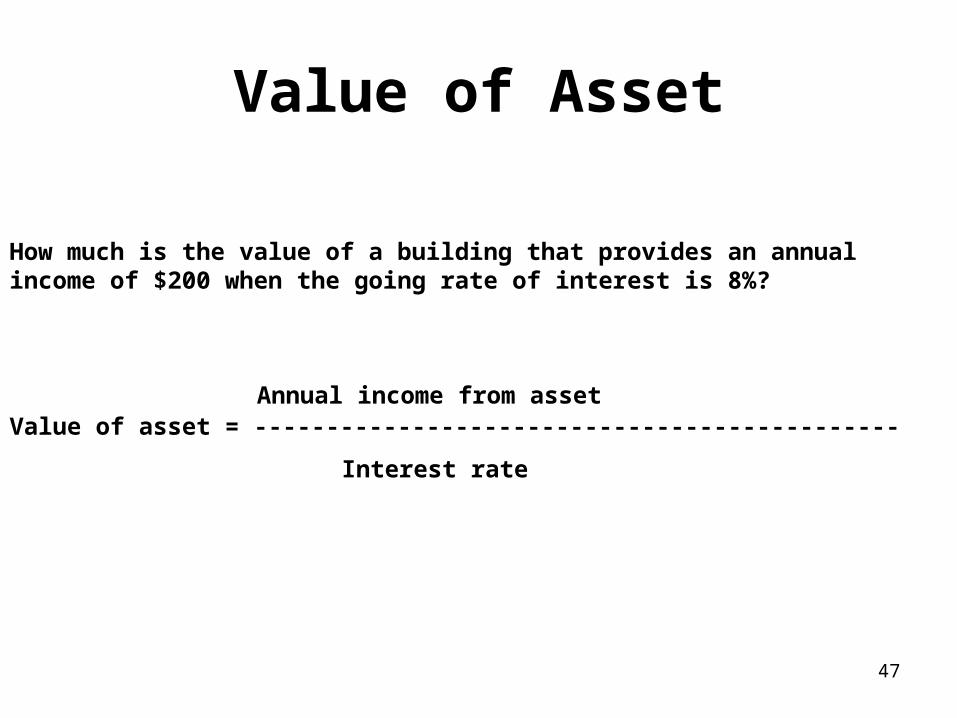
Value of Asset
How much is the value of a building that provides an annual income of $200 when the going rate of interest is 8%?
46
Value of Asset
How much is the value of a building that provides an annual income of $200 when the going rate of interest is 8%?
Value of asset = ---------------------------------------------Annual income from asset
Interest rate
47

Value of Asset
How much is the value of a building that provides an annual income of $200 when the going rate of interest is 8%?
Value of asset = --------------------------------------------- = ----------------- = $2,500Annual income from asset
Interest rate
$200
.08
If the interest rate rises, the value of an asset falls. If the interest rate falls, the value of an asset rises.
48

The Present Value of Future Income
• A dollar today is worth more than a dollar in the future– Because of inflation– Because the dollar can be lent out to earn
interest
49

The Present Value of Future Income
Present value of a dollar received n years from now = ----------------------1
(1 + r)n
r = the interest rate; n = the number of years
50

The Present Value of Future Income
Present value of a dollar received n years from now = -------------------------------------
1
(1 + r)n
r = the interest rate; n = the number of years
If the interest rate were 5%, how much would a dollar received one year from now be worth today?
= --------------------------------
1
(1 + .05)1
51

The Present Value of Future Income
Present value of a dollar received n years from now = ---------------------1
(1 + r)n
r = the interest rate; n = the number of years
If the interest rate were 5%, how much would a dollar deceived one year from now be worth today?
= ------------------------1
(1 + .05)1
= -------------------------1
1.05 = 95.24 cents
52

The Present Value of Future Income
Present value of a dollar received n years from now = -------------------1
(1 + r)n
r = the interest rate; n = the number of years
What is the present value of $1,000 that will be paid to you in three years if the interest rate is 5%. Work out to the nearest cent
53

The Present Value of Future Income
Present value of a dollar received n years from now = -------------------------------------
1
(1 + r)n
r = the interest rate; n = the number of years
= $1,000 X --------------------------------1
(1.05)3
What is the present value of $1,000 that will be paid to you in three years if the interest rate is 5%. Work out to the nearest cent
54
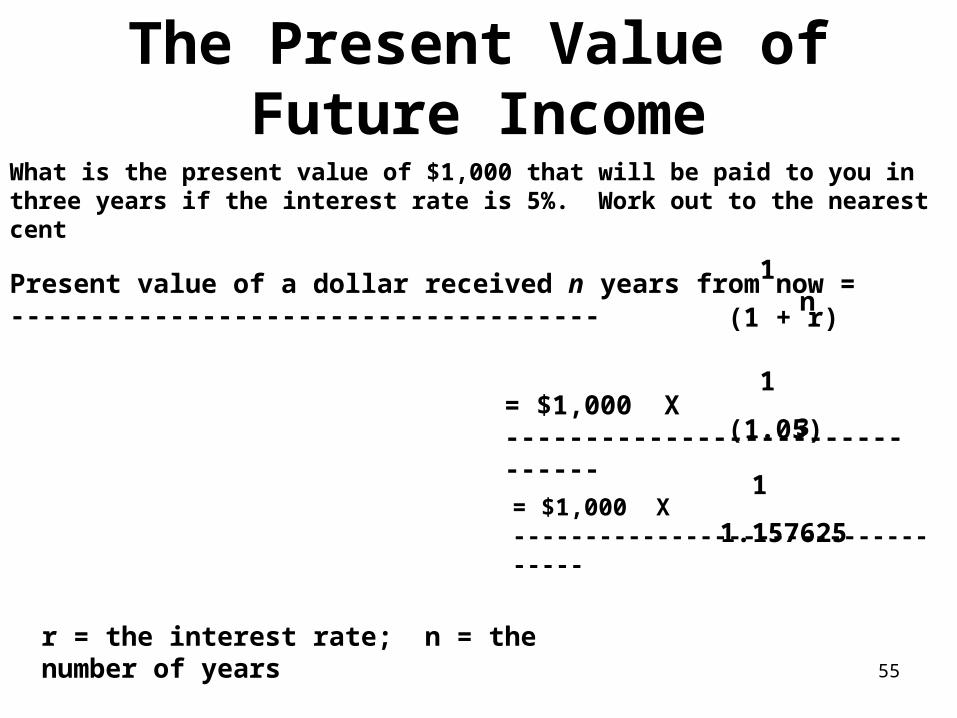
The Present Value of Future Income
Present value of a dollar received n years from now = -------------------------------------
1
(1 + r)n
r = the interest rate; n = the number of years
= $1,000 X -------------------------------
1
(1.05)3
= $1,000 X ---------------------------------- 1
1.157625
What is the present value of $1,000 that will be paid to you in three years if the interest rate is 5%. Work out to the nearest cent
55

The Present Value of Future Income
Present value of a dollar received n years from now = --------------------------1
(1 + r)n
r = the interest rate; n = the number of years
= $1,000 X ------------------------------
1
(1.05)3
= $,1000 X ---------------------------------- 1
1.157625
= $1,000 X .863838 = $863.84
What is the present value of $1,000 that will be paid to you in three years if the interest rate is 5%. Work out to the nearest cent
56

How Are Profits Determined?
• Economist treat profits as a residual left to the entrepreneur after rent, interest, and wages have been paid– One could argue that because these three
resource payments are determined by supply and demand, then what is left over, profits, are indirectly determined by supply and demand
57

Theories of Profiting
• The Entrepreneur as a Risk Taker
• The Entrepreneur as an Innovator
• The Entrepreneur as a Monopolist
• The Entrepreneur as an Exploiter of Labor
58

The Entrepreneur as a Risk Taker
• The entrepreneur is indeed a risk taker
• Starting a business is a risky endeavor– Most new businesses fail in the first five
years
• Why then do people start a new business?– If they succeed they will get a high rate of
return
59

The Entrepreneur as an Innovator
• An innovation is not an invention– An invention is a new idea, a new product,
or a new way of producing things– An innovation is the act of putting the
invention to practical use– Innovation is what entrepreneurs do
60

The Entrepreneur as a Monopolist
• Monopolist and oligopolist make profits (economic) because of a shortage of competition
• If this shortage of competition is due to hard work, foresight, and innovation, one could hardly complain of the evils of big business– The shortage of competition is due to “natural
scarcities”
• If this shortage of competition is due to “contrived scarcities” and the business restricts output so it can make monopoly profits, that is another story –
61
The Entrepreneur as an Exploiter of Labor
• Karl Marx based his theory of profits on the supposition that the capitalist exploits the worker by taking the surplus value of the worker’s labor (profits) and using this to buy more capital to be able to exploit even more workers– Marx sees the capitalist’s role as that of exploiting
the employees
62