Embed Size (px)
Citation preview
Factorial Designs: Research Hypotheses & Describing Results
• Research Hypotheses of Factorial Designs• Inspecting tables to describe factorial data patterns• Inspecting line graphs to describe factorial data patterns• Inspecting bar graphs to describe factorial data patterns• Choosing among tables & graphs
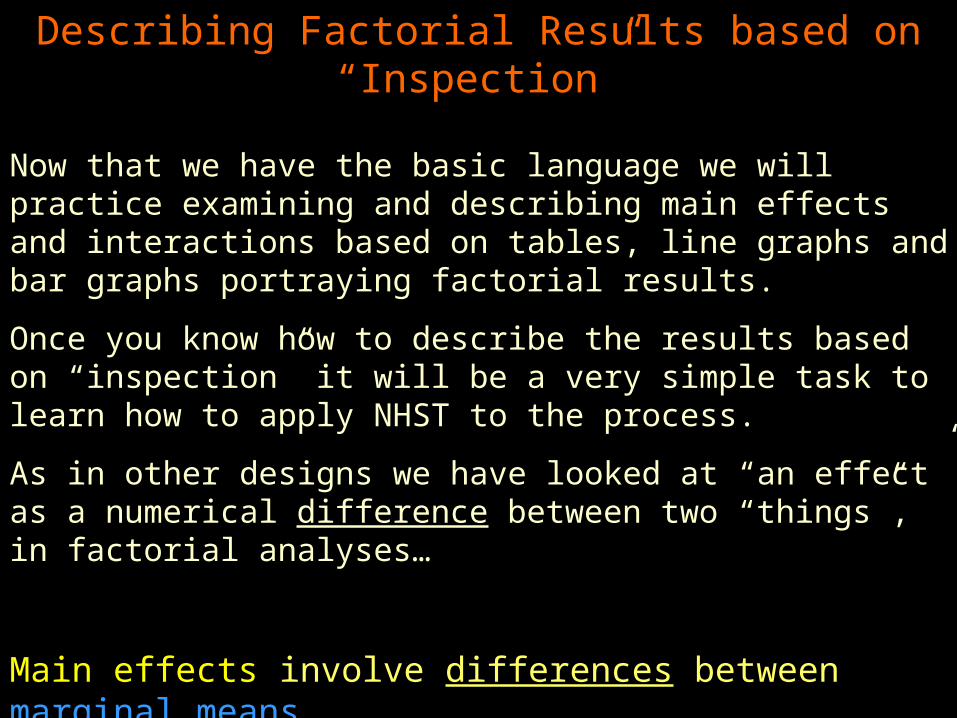
Describing Factorial Results based on “Inspection”
Now that we have the basic language we will practice examining and describing main effects and interactions based on tables, line graphs and bar graphs portraying factorial results.
Once you know how to describe the results based on “inspection” it will be a very simple task to learn how to apply NHST to the process.
As in other designs we have looked at “an effect” as a numerical difference between two “things”, in factorial analyses…
Main effects involve differences between marginal means.
Simple effects involve differences between cell means.
Interactions involve the differences between simple effects.
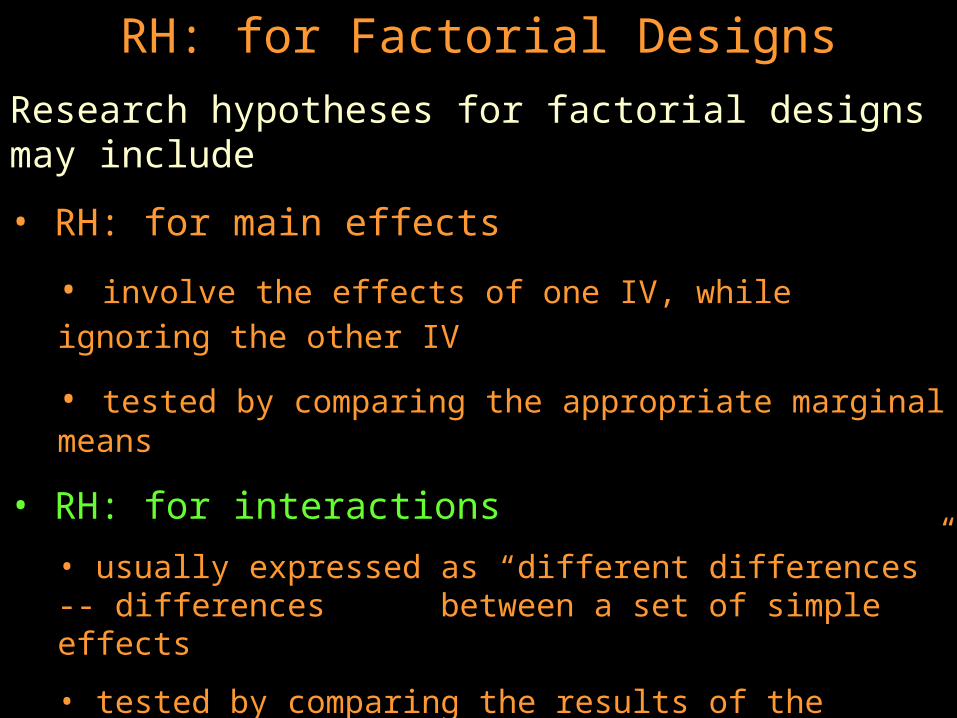
RH: for Factorial Designs
Research hypotheses for factorial designs may include
• RH: for main effects
• involve the effects of one IV, while ignoring the other IV
• tested by comparing the appropriate marginal means
• RH: for interactions
• usually expressed as “different differences” -- differences between a set of simple effects
• tested by comparing the results of the appropriate set of simple effects
• That’s the hard part -- determining which set of simple effects gives the most direct test of the interaction RH:
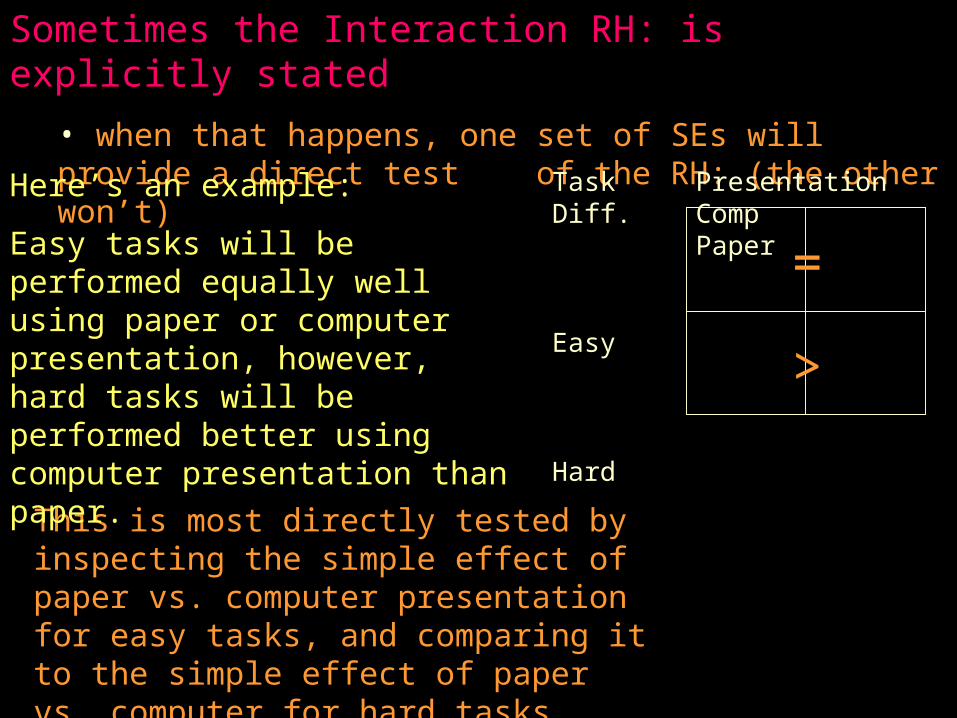
Sometimes the Interaction RH: is explicitly stated
• when that happens, one set of SEs will provide a direct test of the RH: (the other won’t)
This is most directly tested by inspecting the simple effect of paper vs. computer presentation for easy tasks, and comparing it to the simple effect of paper vs. computer for hard tasks.
Here’s an example:
Easy tasks will be performed equally well using paper or computer presentation, however, hard tasks will be performed better using computer presentation than paper.
Presentation Comp PaperTask Diff.
Easy
Hard
=
>
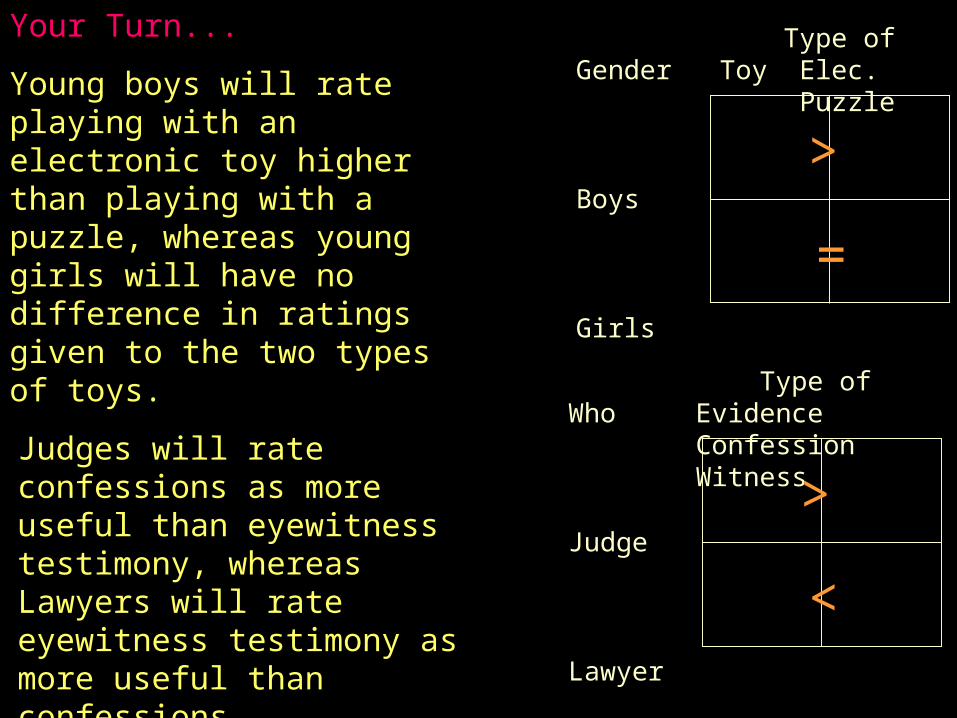
Your Turn...
Young boys will rate playing with an electronic toy higher than playing with a puzzle, whereas young girls will have no difference in ratings given to the two types of toys.
Type of Toy Elec. PuzzleGender
Boys
Girls =
>
Judges will rate confessions as more useful than eyewitness testimony, whereas Lawyers will rate eyewitness testimony as more useful than confessions.
Type of Evidence Confession WitnessWho
Judge
Lawyer <
>
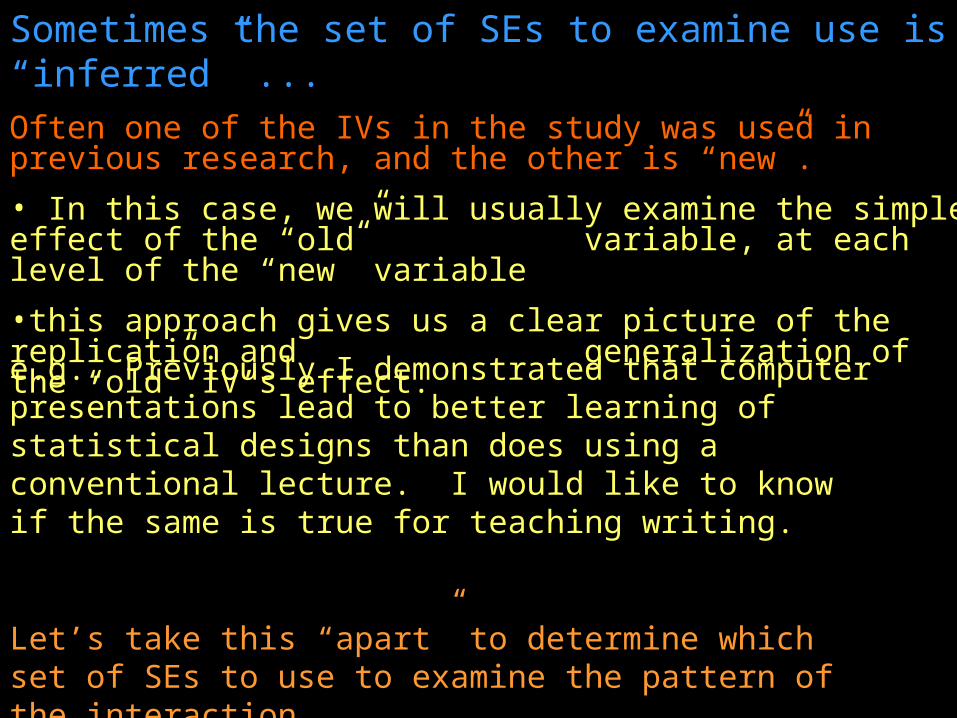
Sometimes the set of SEs to examine use is “inferred” ...Often one of the IVs in the study was used in previous research, and the other is “new”.
• In this case, we will usually examine the simple effect of the “old” variable, at each level of the “new” variable
•this approach gives us a clear picture of the replication and generalization of the “old” IV’s effect.
e.g., Previously I demonstrated that computer presentations lead to better learning of statistical designs than does using a conventional lecture. I would like to know if the same is true for teaching writing.
Let’s take this “apart” to determine which set of SEs to use to examine the pattern of the interaction...
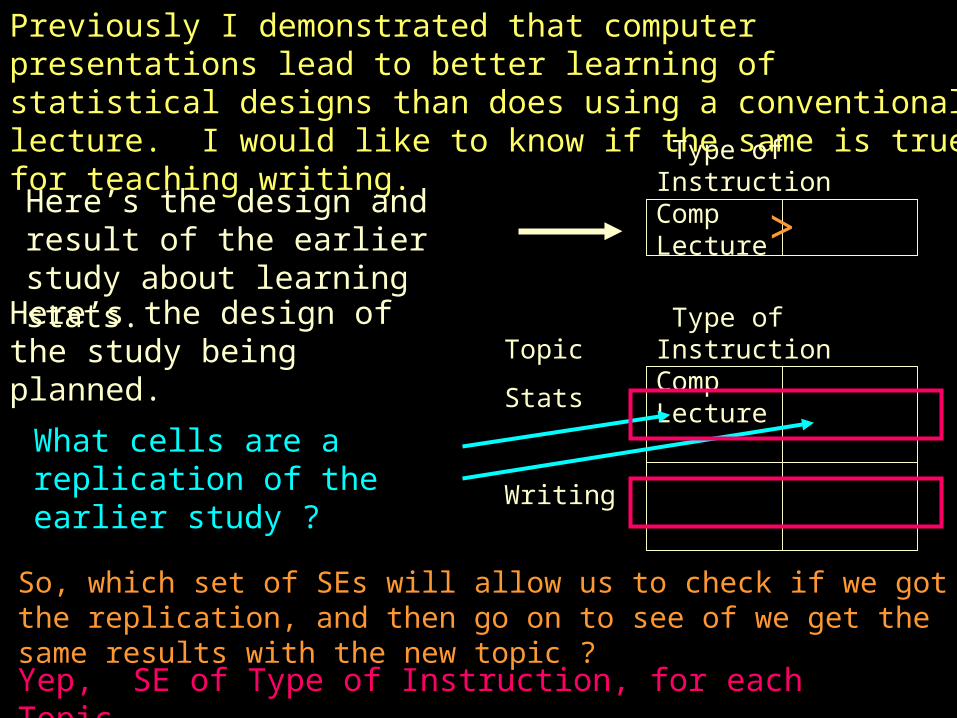
Previously I demonstrated that computer presentations lead to better learning of statistical designs than does using a conventional lecture. I would like to know if the same is true for teaching writing.
Here’s the design and result of the earlier study about learning stats.
Type of Instruction Comp Lecture
>
Here’s the design of the study being planned.
Type of Instruction Comp LectureTopic
Stats
Writing
What cells are a replication of the earlier study ?
So, which set of SEs will allow us to check if we got the replication, and then go on to see of we get the same results with the new topic ?
Yep, SE of Type of Instruction, for each Topic ...
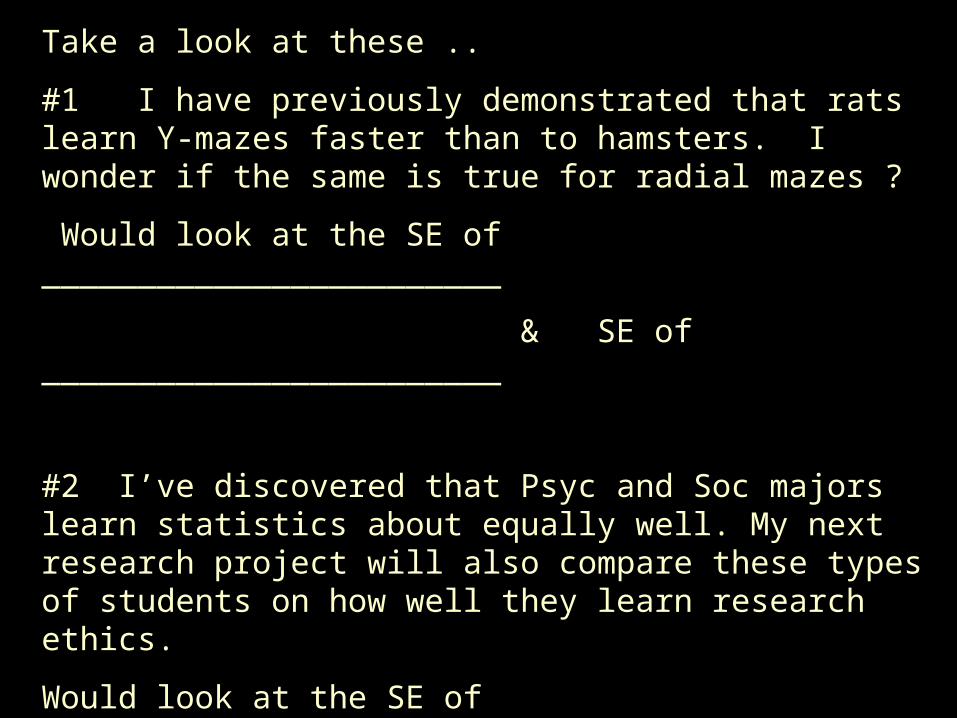
Take a look at these ..
#1 I have previously demonstrated that rats learn Y-mazes faster than to hamsters. I wonder if the same is true for radial mazes ?
Would look at the SE of ________________________
& SE of ________________________
#2 I’ve discovered that Psyc and Soc majors learn statistics about equally well. My next research project will also compare these types of students on how well they learn research ethics.
Would look at the SE of ________________________
& SE of ________________________
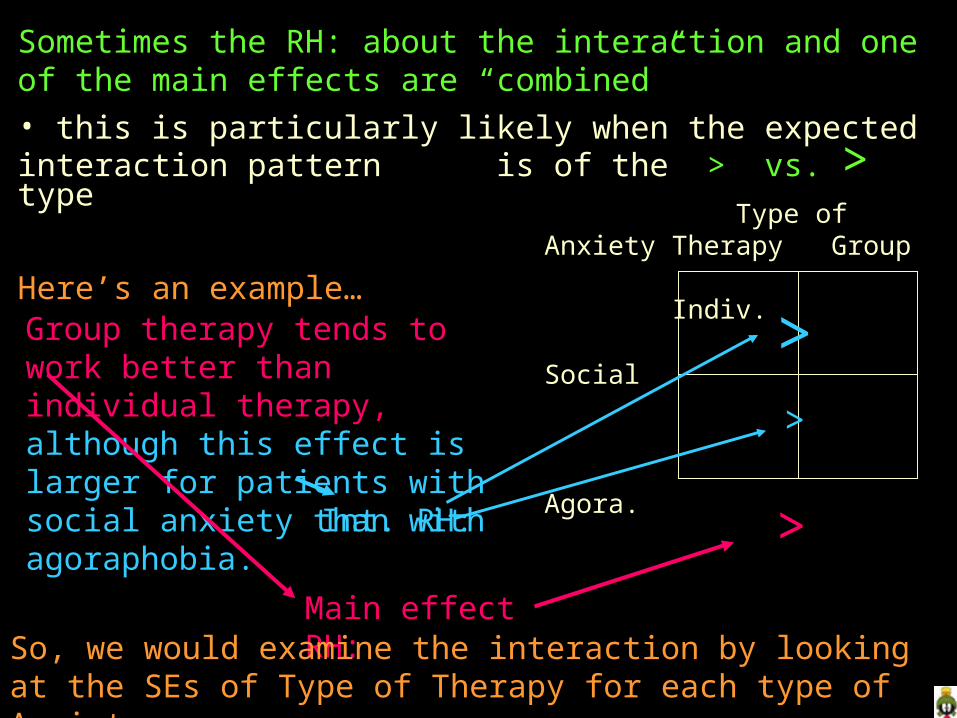
Sometimes the RH: about the interaction and one of the main effects are “combined”
• this is particularly likely when the expected interaction pattern is of the > vs. > type
Here’s an example…
Group therapy tends to work better than individual therapy, although this effect is larger for patients with social anxiety than with agoraphobia.
Type of Therapy Group Indiv.Anxiety
Social
Agora.>
>
Main effect RH:
>Int. RH:
So, we would examine the interaction by looking at the SEs of Type of Therapy for each type of Anxiety.
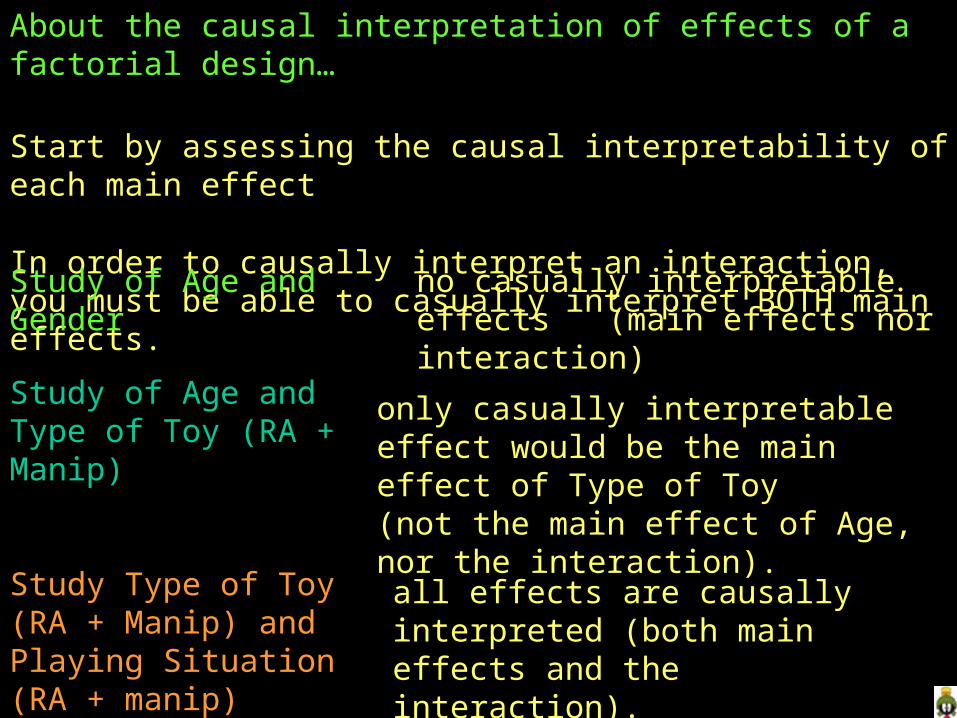
About the causal interpretation of effects of a factorial design…
Start by assessing the causal interpretability of each main effect
In order to causally interpret an interaction, you must be able to casually interpret BOTH main effects.
Study of Age and Gender no casually interpretable effects (main effects nor interaction)
Study of Age and Type of Toy (RA + Manip)
only casually interpretable effect would be the main effect of Type of Toy (not the main effect of Age, nor the interaction).
Study Type of Toy (RA + Manip) and Playing Situation (RA + manip)
all effects are causally interpreted (both main effects and the interaction).
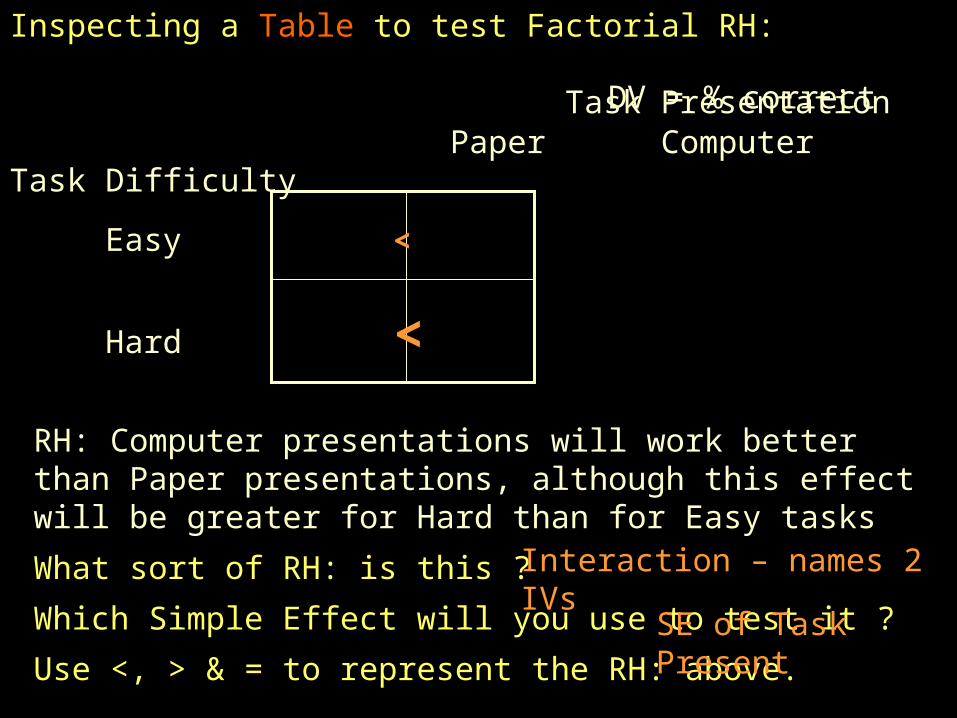
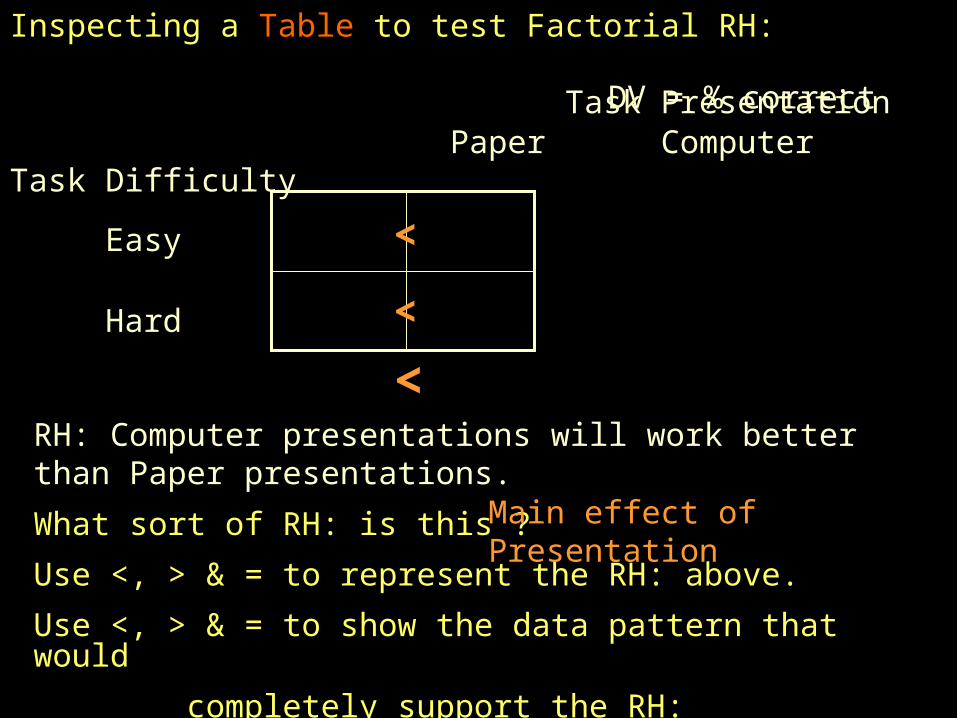
Inspecting a Table to test Factorial RH:
Task Presentation Paper Computer
Task Difficulty
Easy
Hard
<
RH: Computer presentations will work better than Paper presentations, although this effect will be greater for Hard than for Easy tasks
What sort of RH: is this ?
Which Simple Effect will you use to test it ?
Use <, > & = to represent the RH: above.
Interaction – names 2 IVs
SE of Task Present
DV = % correct
<
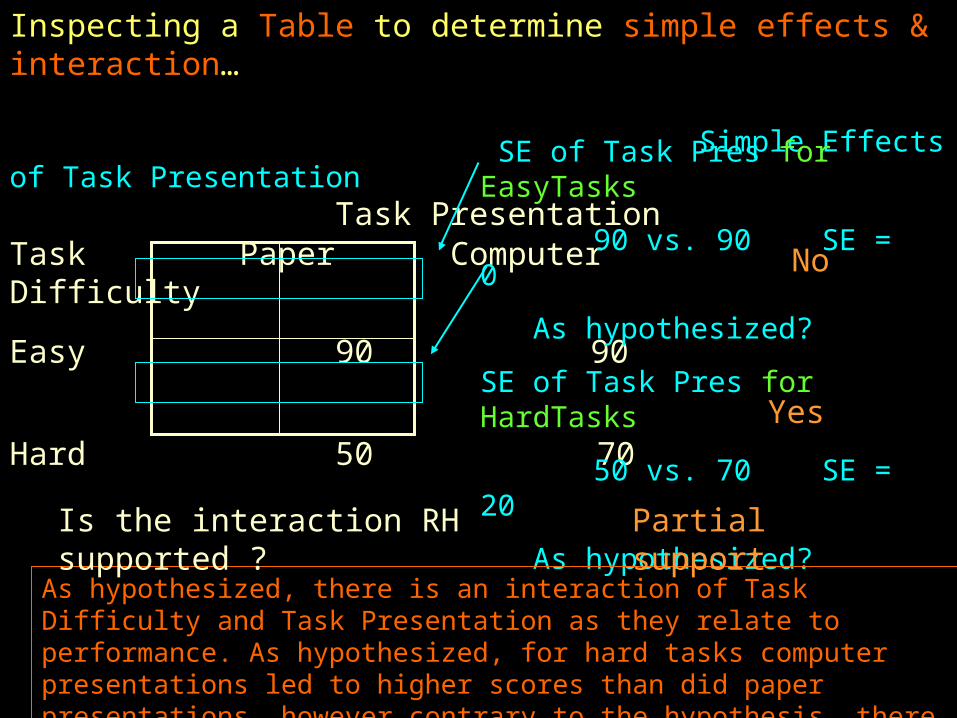
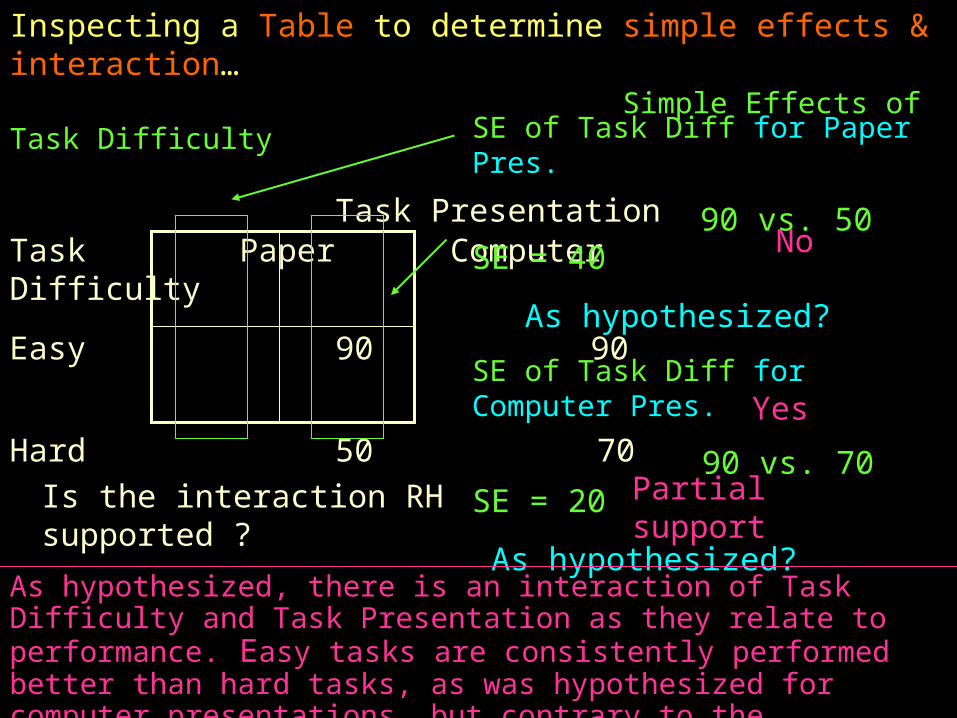
Inspecting a Table to determine simple effects & interaction…
Simple Effects of Task Presentation Task PresentationTask Paper ComputerDifficulty
Easy 90 90
Hard 50 70
SE of Task Pres for EasyTasks
90 vs. 90 SE = 0
As hypothesized?
SE of Task Pres for HardTasks
50 vs. 70 SE = 20
As hypothesized?
As hypothesized, there is an interaction of Task Difficulty and Task Presentation as they relate to performance. As hypothesized, for hard tasks computer presentations led to higher scores than did paper presentations, however contrary to the hypothesis, there was no difference for easy tasks.
No
Yes
Is the interaction RH supported ? Partial support
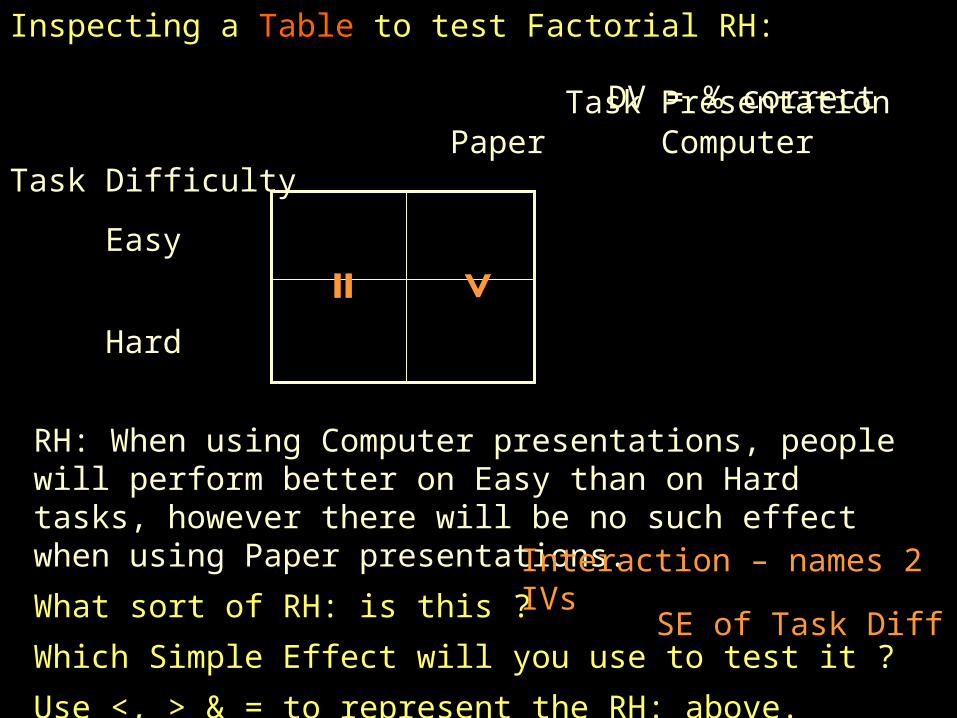
Inspecting a Table to test Factorial RH:
Task Presentation Paper Computer
Task Difficulty
Easy
Hard
RH: When using Computer presentations, people will perform better on Easy than on Hard tasks, however there will be no such effect when using Paper presentations.
What sort of RH: is this ?
Which Simple Effect will you use to test it ?
Use <, > & = to represent the RH: above.
Interaction – names 2 IVs
SE of Task Diff
DV = % correct
<=
Inspecting a Table to determine simple effects & interaction… Simple Effects of Task Difficulty
Task Presentation Task Paper ComputerDifficulty
Easy 90 90
Hard 50 70
SE of Task Diff for Paper Pres.
90 vs. 50 SE = 40
As hypothesized?
SE of Task Diff for Computer Pres.
90 vs. 70 SE = 20
As hypothesized?
As hypothesized, there is an interaction of Task Difficulty and Task Presentation as they relate to performance. Easy tasks are consistently performed better than hard tasks, as was hypothesized for computer presentations, but contrary to the hypothesis for paper presentations
No
Yes
Is the interaction RH supported ? Partial support
Inspecting a Table to test Factorial RH:
Task Presentation Paper Computer
Task Difficulty
Easy
Hard
RH: Computer presentations will work better than Paper presentations.
What sort of RH: is this ?
Use <, > & = to represent the RH: above.
Use <, > & = to show the data pattern that would
completely support the RH:
Main effect of Presentation
DV = % correct
<
<
<
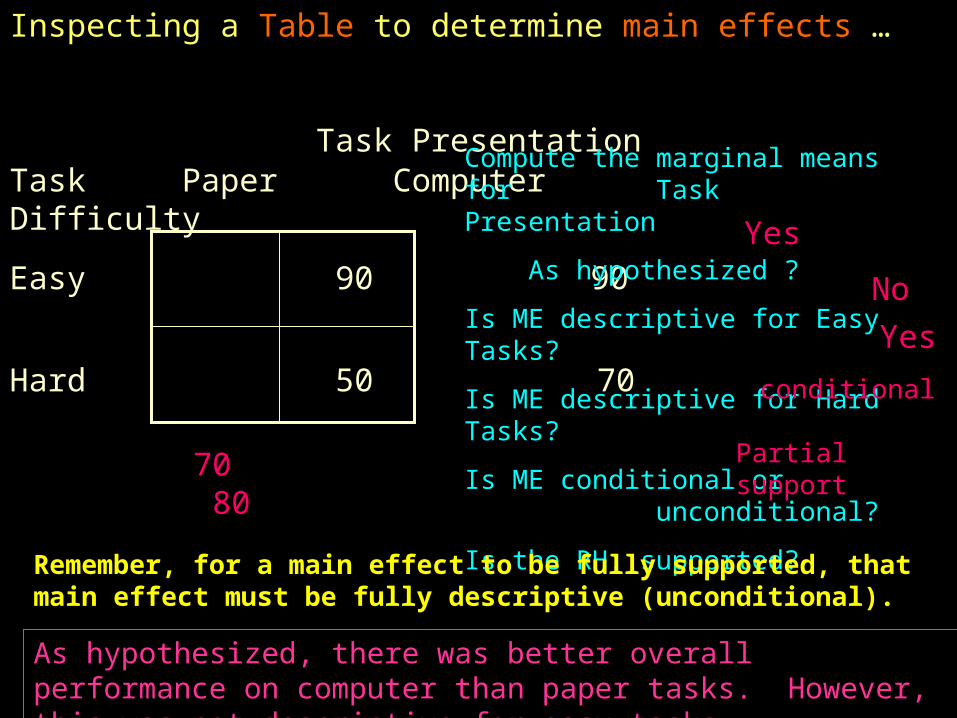
Inspecting a Table to determine main effects …
Task PresentationTask Paper ComputerDifficulty
Easy 90 90
Hard 50 70
As hypothesized, there was better overall performance on computer than paper tasks. However, this was not descriptive for easy tasks.
Compute the marginal means for Task Presentation
As hypothesized ?
Is ME descriptive for Easy Tasks?
Is ME descriptive for Hard Tasks?
Is ME conditional or unconditional?
Is the RH: supported?70 80
Yes
No
Yes
conditional
Partial support
Remember, for a main effect to be fully supported, that main effect must be fully descriptive (unconditional).
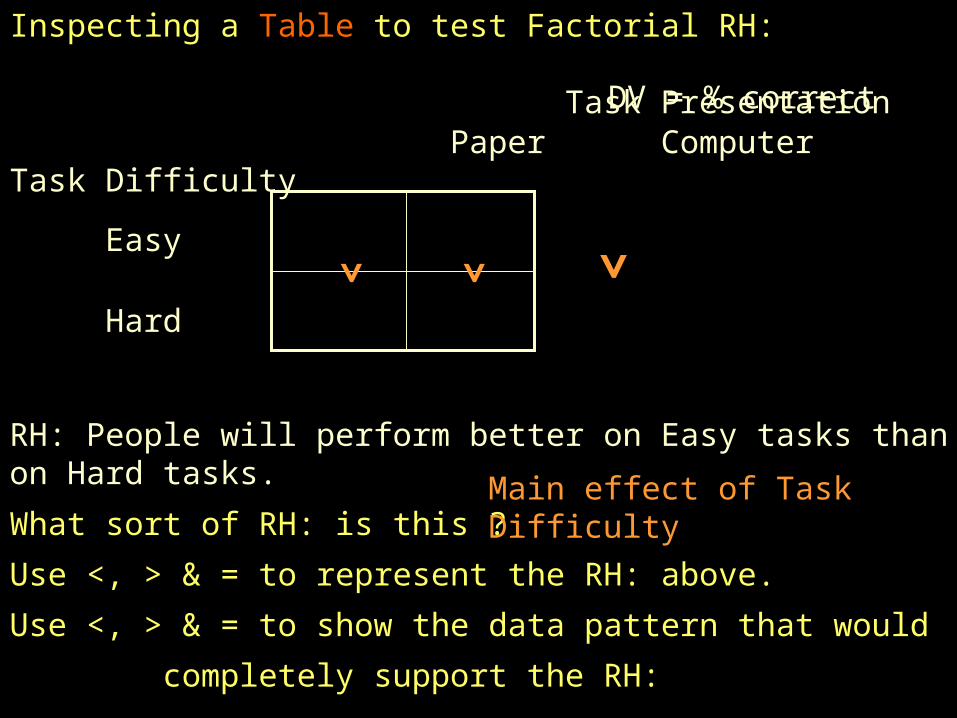
Inspecting a Table to test Factorial RH:
Task Presentation Paper Computer
Task Difficulty
Easy
Hard
RH: People will perform better on Easy tasks than on Hard tasks.
What sort of RH: is this ?
Use <, > & = to represent the RH: above.
Use <, > & = to show the data pattern that would
completely support the RH:
Main effect of Task Difficulty
DV = % correct
<< <
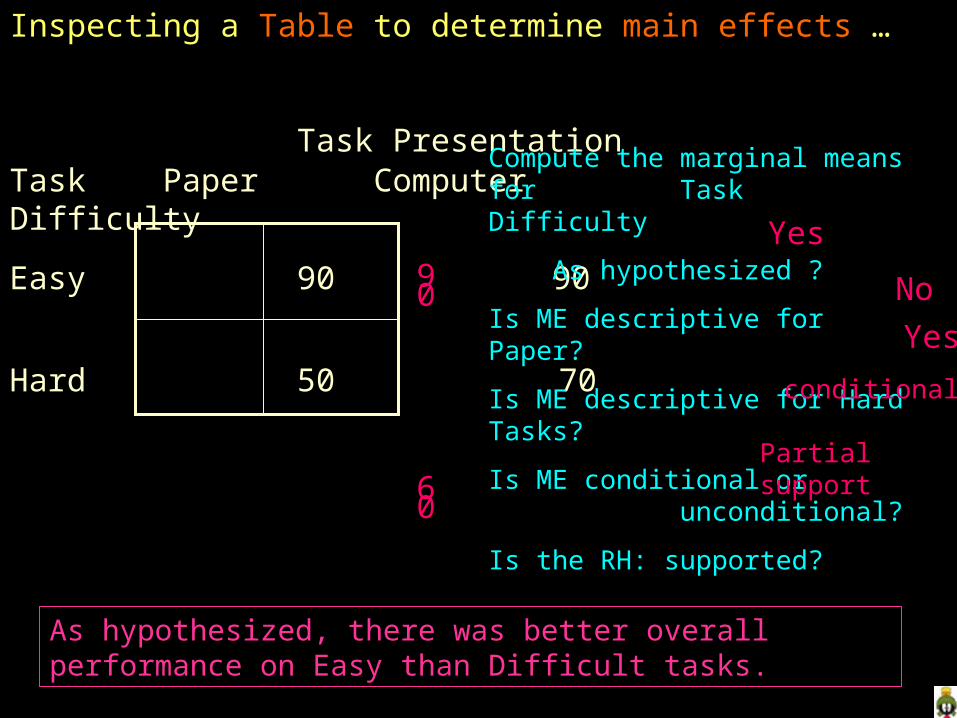
Inspecting a Table to determine main effects …
Task PresentationTask Paper ComputerDifficulty
Easy 90 90
Hard 50 70
As hypothesized, there was better overall performance on Easy than Difficult tasks.
Compute the marginal means for Task Difficulty
As hypothesized ?
Is ME descriptive for Paper?
Is ME descriptive for Hard Tasks?
Is ME conditional or unconditional?
Is the RH: supported?
90
60
Yes
No
Yes
conditional
Partial support
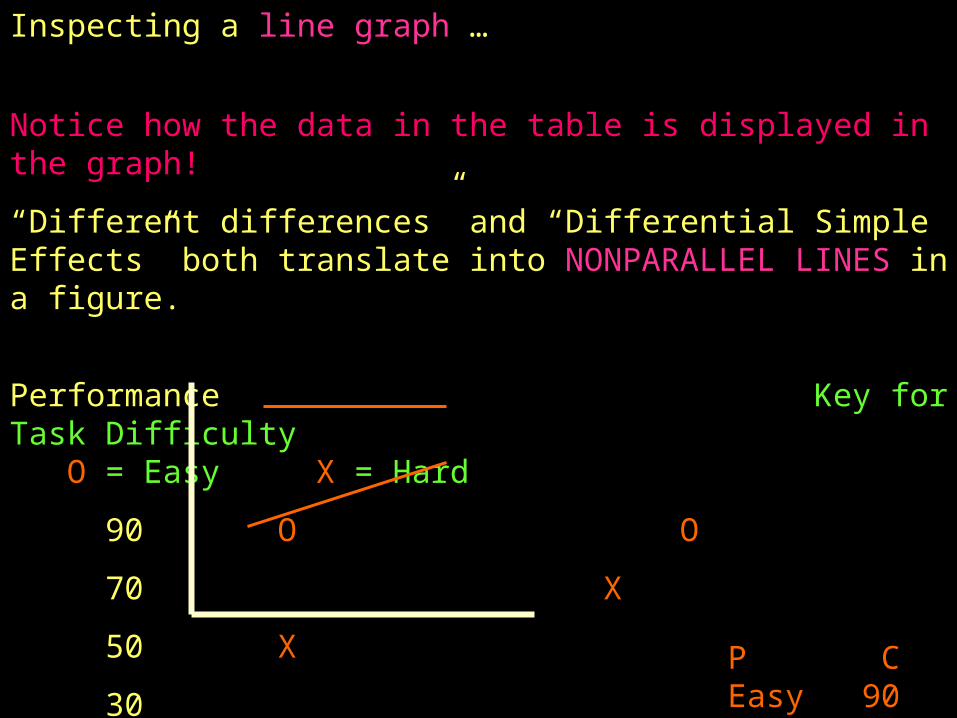
Inspecting a line graph …
Notice how the data in the table is displayed in the graph!
“Different differences” and “Differential Simple Effects” both translate into NONPARALLEL LINES in a figure.
Performance Key for Task Difficulty O = Easy X = Hard
90 O O
70 X
50 X
30
Paper Computer
Task Presentation
P CEasy 90 90Hard 50 70
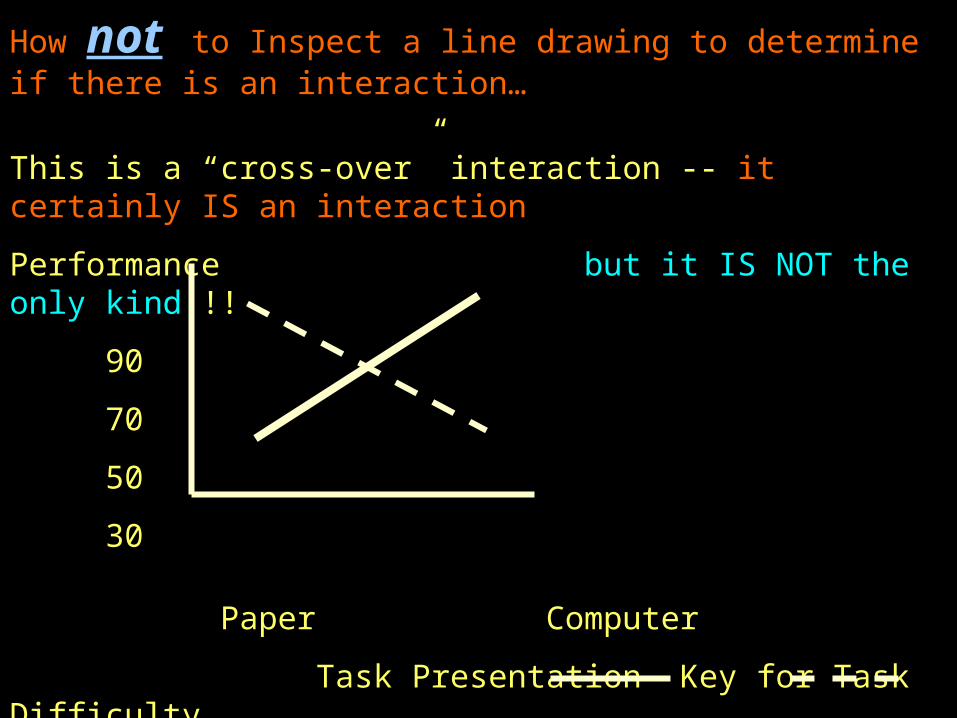
How not to Inspect a line drawing to determine if there is an interaction…
This is a “cross-over” interaction -- it certainly IS an interaction
Performance but it IS NOT the only kind !!
90
70
50
30
Paper Computer
Task Presentation Key for Task Difficulty
Easy Hard
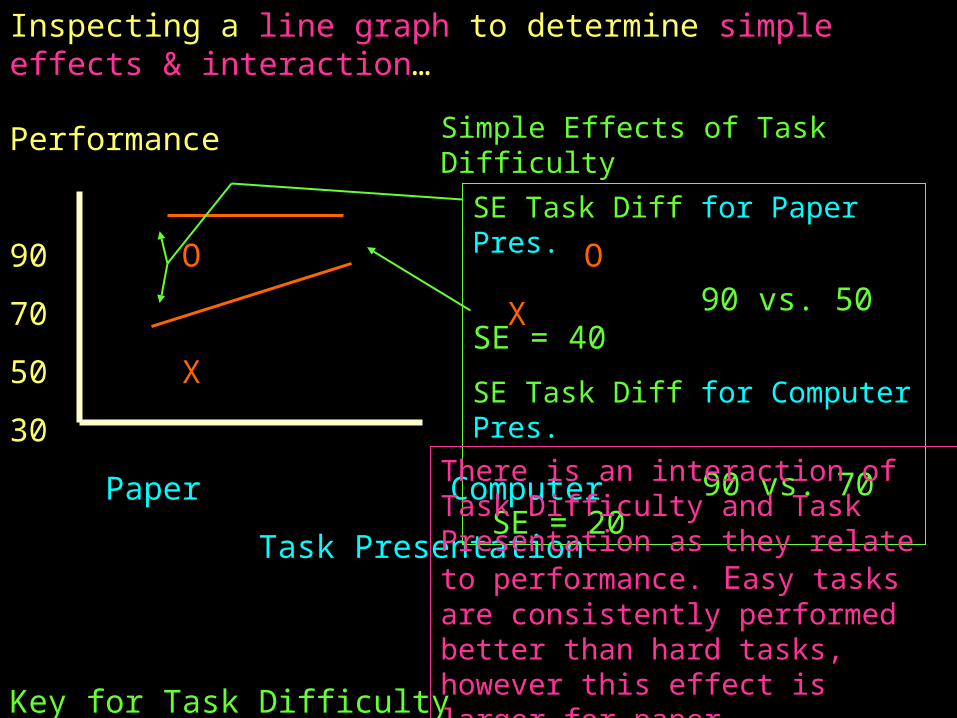
Inspecting a line graph to determine simple effects & interaction…
Performance
90 O O
70 X
50 X
30
Paper Computer
Task Presentation
Key for Task Difficulty
O = Easy X = Hard
Simple Effects of Task Difficulty
SE Task Diff for Paper Pres.
90 vs. 50 SE = 40
SE Task Diff for Computer Pres.
90 vs. 70 SE = 20
There is an interaction of Task Difficulty and Task Presentation as they relate to performance. Easy tasks are consistently performed better than hard tasks, however this effect is larger for paper presentations than for computer presentations.
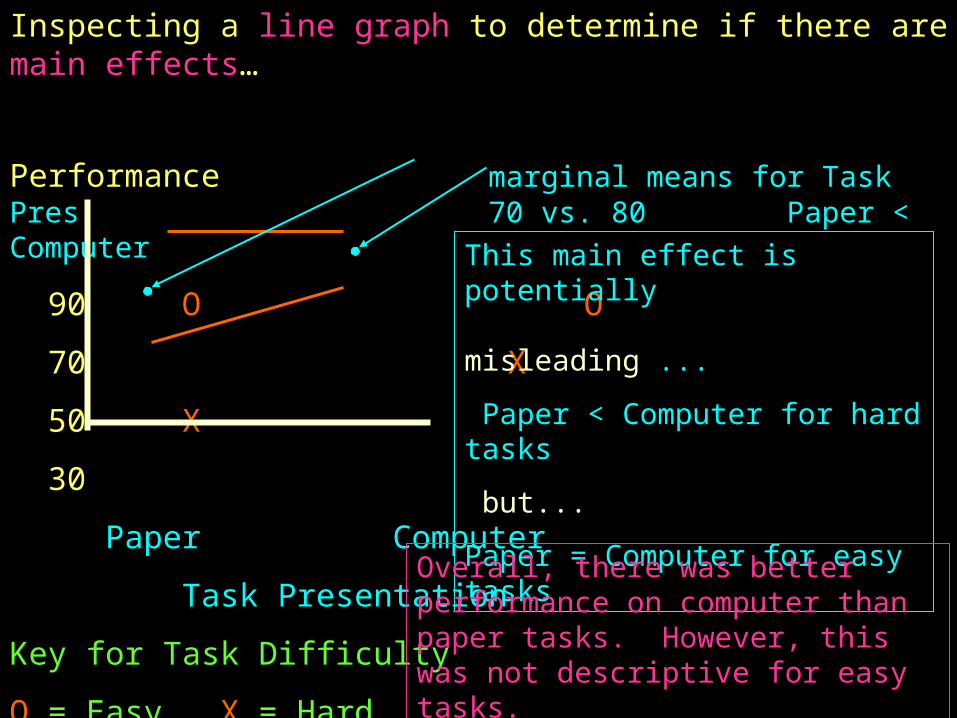
Inspecting a line graph to determine if there are main effects…
Performance marginal means for Task Pres 70 vs. 80 Paper < Computer
90 O O
70 X
50 X
30
Paper Computer
Task Presentation
Key for Task Difficulty
O = Easy X = Hard
This main effect is potentially misleading ...
Paper < Computer for hard tasks
but...
Paper = Computer for easy tasks
Overall, there was better performance on computer than paper tasks. However, this was not descriptive for easy tasks.
Inspecting a line graph to determine simple effects & interaction…
Performance
90 O
70 O X
50
30 X
Paper Computer Task Presentation
Key for Task Difficulty O = Easy
X = Hard
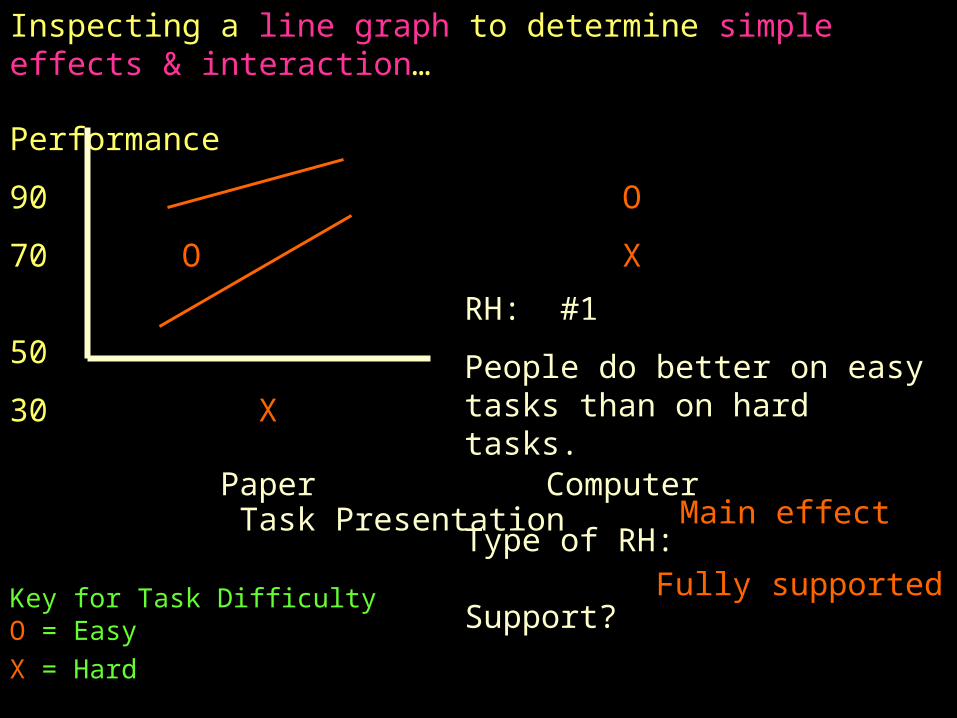
RH: #1
People do better on easy tasks than on hard tasks.
Type of RH:
Support?
Main effect
Fully supported
Inspecting a line graph to determine simple effects & interaction…
Performance
90 O
70 O X
50
30 X
Paper Computer Task Presentation
Key for Task Difficulty O = Easy
X = Hard
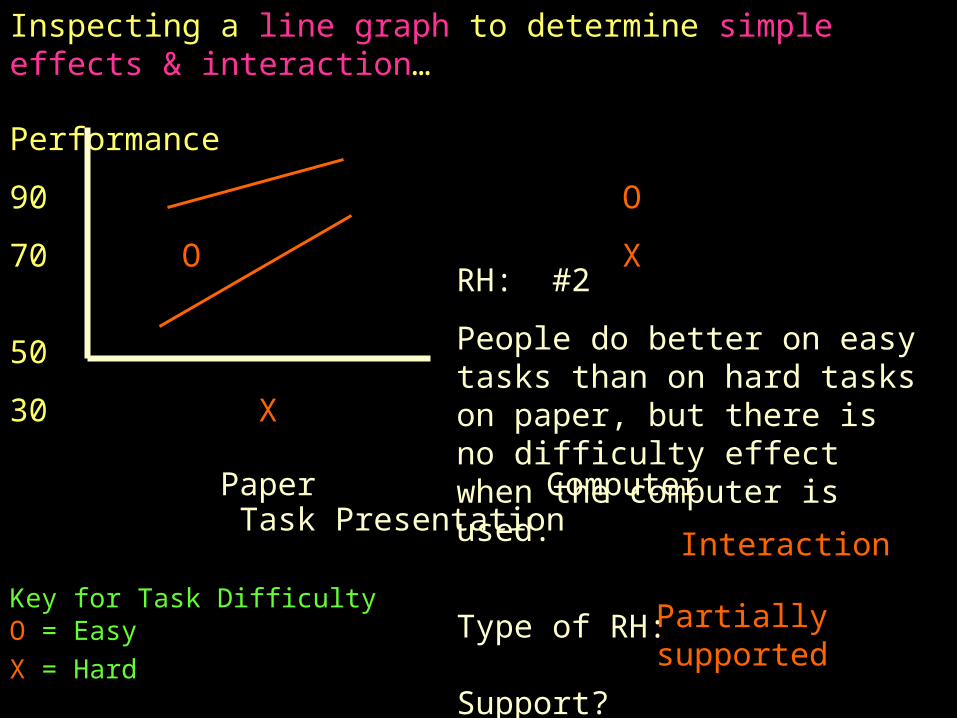
RH: #2
People do better on easy tasks than on hard tasks on paper, but there is no difficulty effect when the computer is used.
Type of RH:
Support?
Interaction
Partially supported
Inspecting a line graph to determine simple effects & interaction…
Performance
90 O
70 O X
50
30 X
Paper Computer Task Presentation
Key for Task Difficulty O = Easy
X = Hard
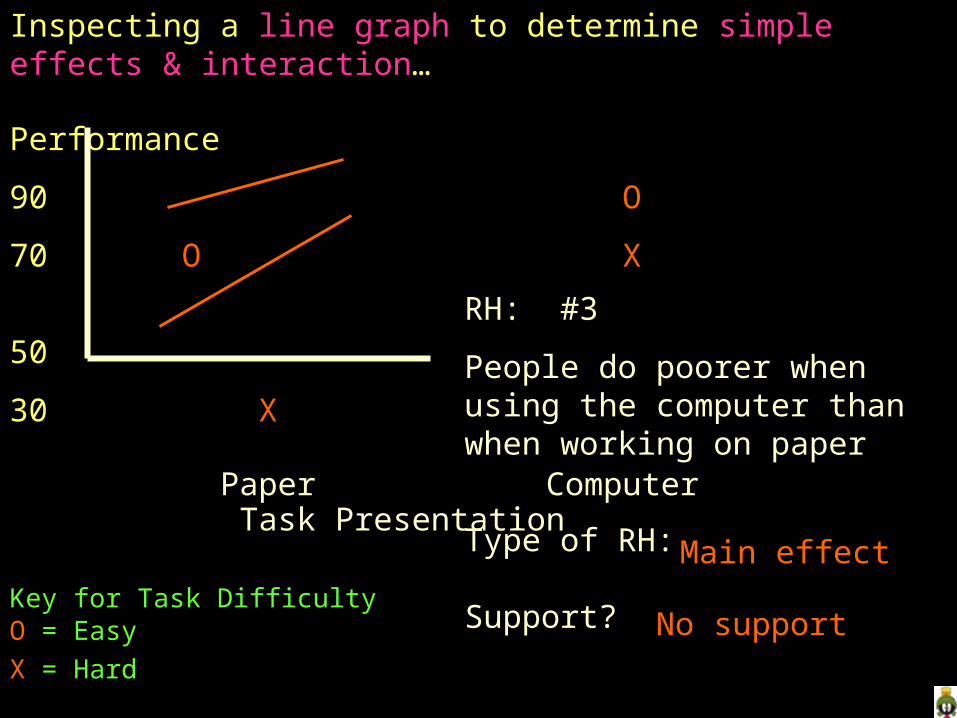
RH: #3
People do poorer when using the computer than when working on paper
Type of RH:
Support?
Main effect
No support
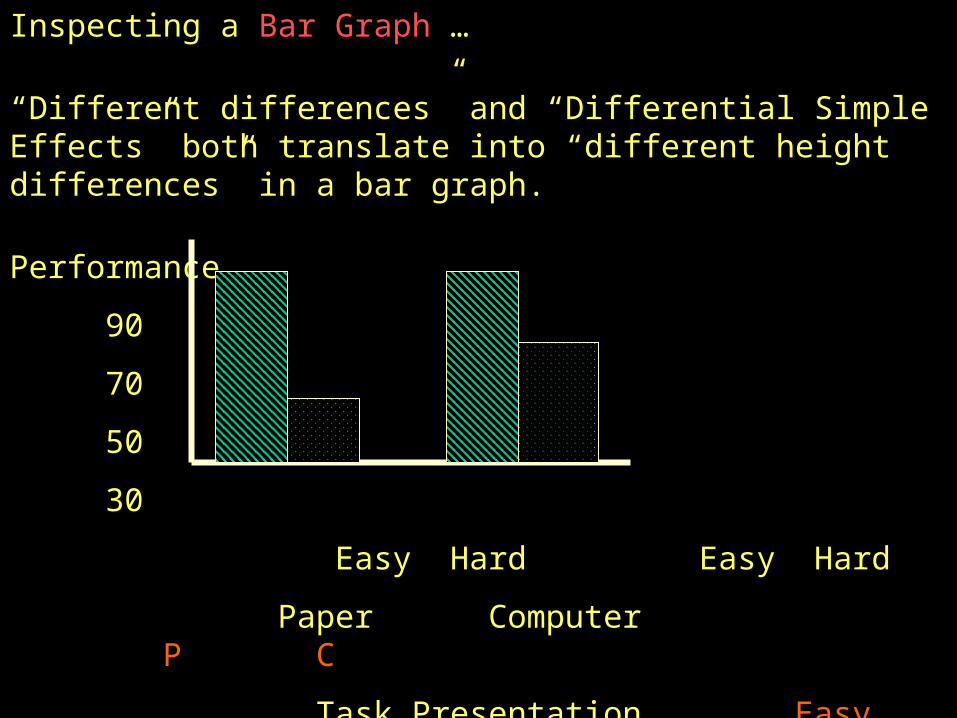
Inspecting a Bar Graph …
“Different differences” and “Differential Simple Effects” both translate into “different height differences” in a bar graph.
Performance
90
70
50
30
Easy Hard Easy Hard
Paper Computer P C
Task Presentation Easy 90 90
Hard 50 70
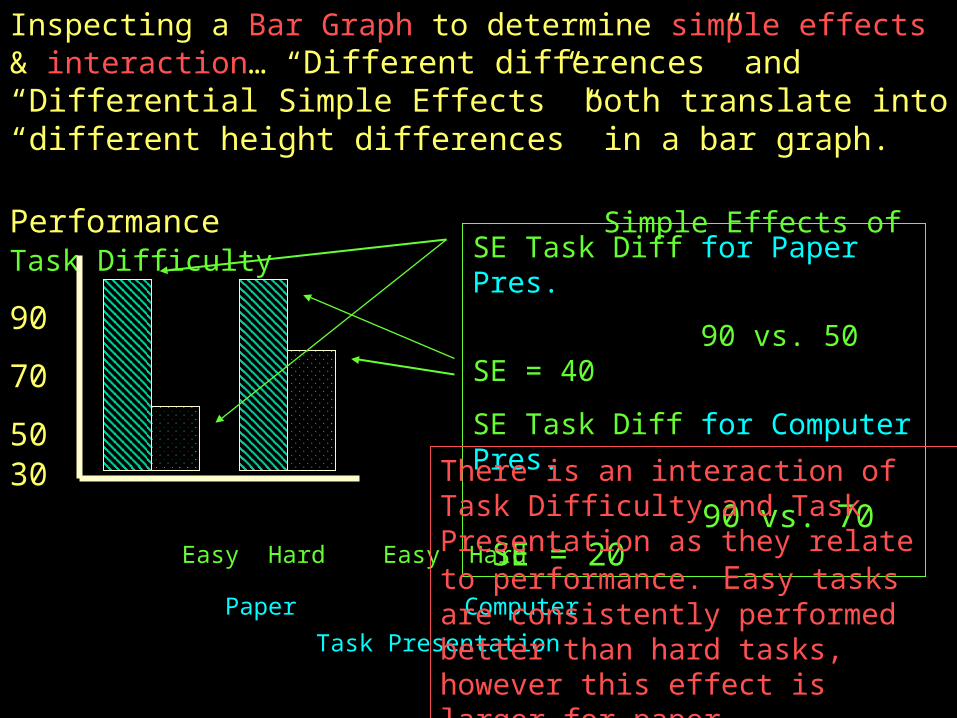
Inspecting a Bar Graph to determine simple effects & interaction… “Different differences” and “Differential Simple Effects” both translate into “different height differences” in a bar graph.
Performance Simple Effects of Task Difficulty
90
70
50 30 Easy Hard Easy Hard
Paper Computer
Task Presentation
SE Task Diff for Paper Pres.
90 vs. 50 SE = 40
SE Task Diff for Computer Pres.
90 vs. 70 SE = 20
There is an interaction of Task Difficulty and Task Presentation as they relate to performance. Easy tasks are consistently performed better than hard tasks, however this effect is larger for paper presentations than for computer presentations.
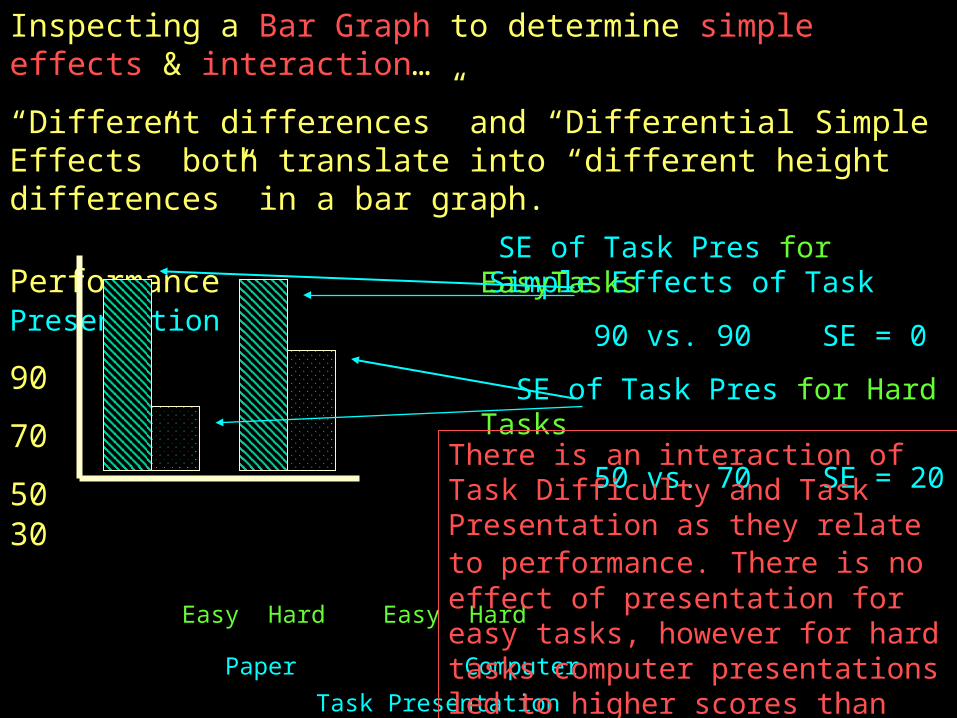
Inspecting a Bar Graph to determine simple effects & interaction…
“Different differences” and “Differential Simple Effects” both translate into “different height differences” in a bar graph.
Performance Simple Effects of Task Presentation
90
70
50 30 Easy Hard Easy Hard
Paper Computer
Task Presentation
SE of Task Pres for EasyTasks
90 vs. 90 SE = 0
SE of Task Pres for Hard Tasks
50 vs. 70 SE = 20
There is an interaction of Task Difficulty and Task Presentation as they relate to performance. There is no effect of presentation for easy tasks, however for hard tasks computer presentations led to higher scores than did paper presentations.
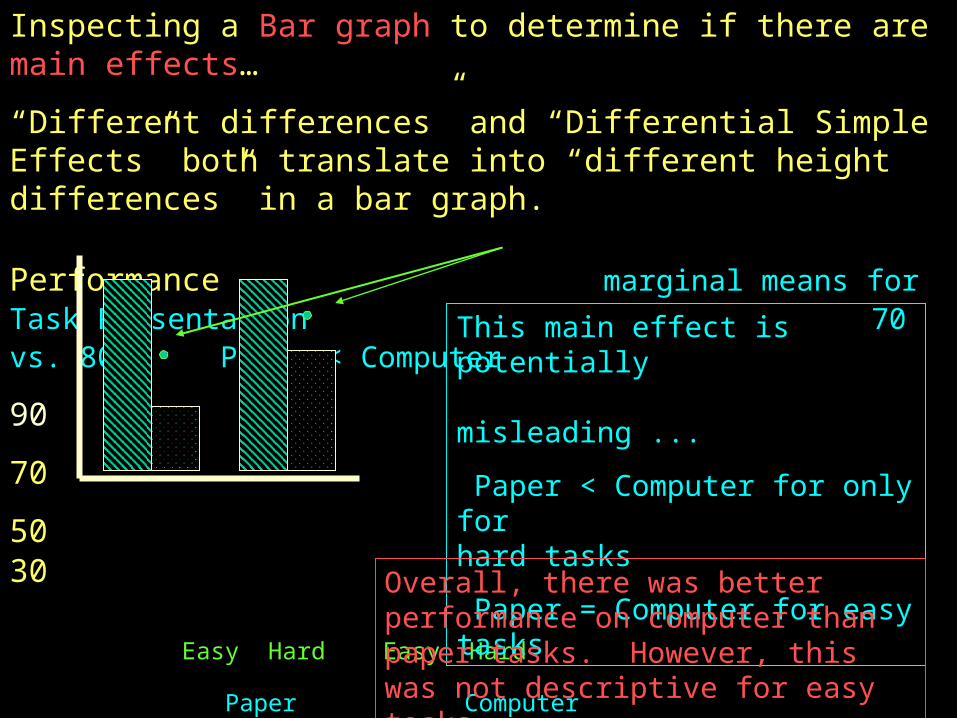
Inspecting a Bar graph to determine if there are main effects…
“Different differences” and “Differential Simple Effects” both translate into “different height differences” in a bar graph.
Performance marginal means for Task Presentation
70 vs. 80 Paper < Computer
90
70
50 30 Easy Hard Easy Hard
Paper Computer
Task Presentation
This main effect is potentially misleading ...
Paper < Computer for only for hard tasks
Paper = Computer for easy tasks
Overall, there was better performance on computer than paper tasks. However, this was not descriptive for easy tasks.
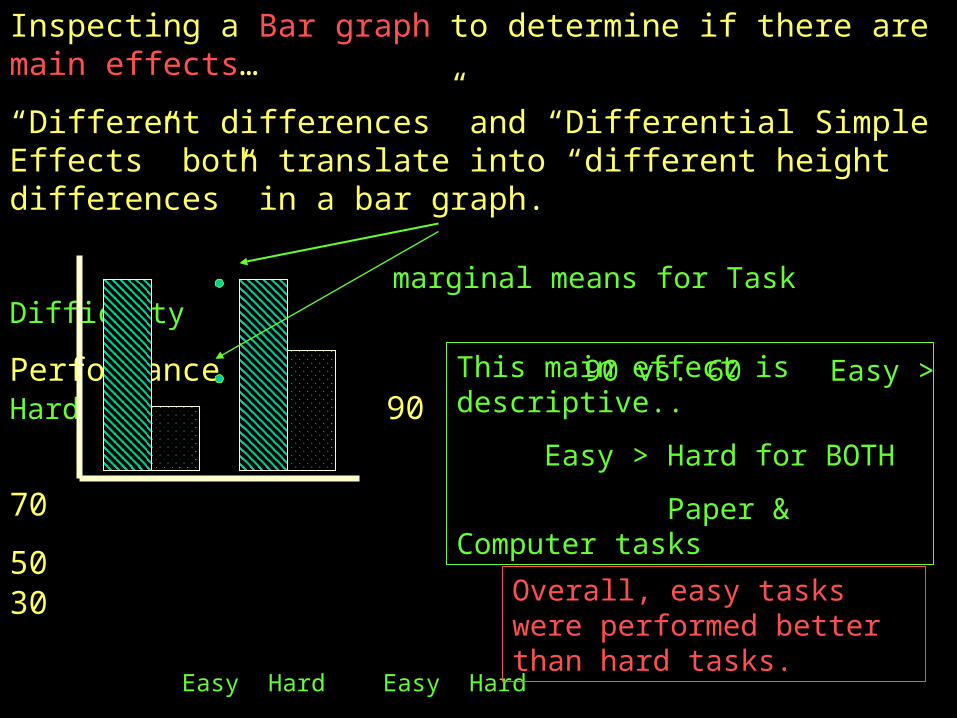
Inspecting a Bar graph to determine if there are main effects…
“Different differences” and “Differential Simple Effects” both translate into “different height differences” in a bar graph.
marginal means for Task Difficulty
Performance 90 vs. 60 Easy > Hard 90
70
50 30 Easy Hard Easy Hard
Paper Computer
Task Presentation
This main effect is descriptive..
Easy > Hard for BOTH
Paper & Computer tasks
Overall, easy tasks were performed better than hard tasks.
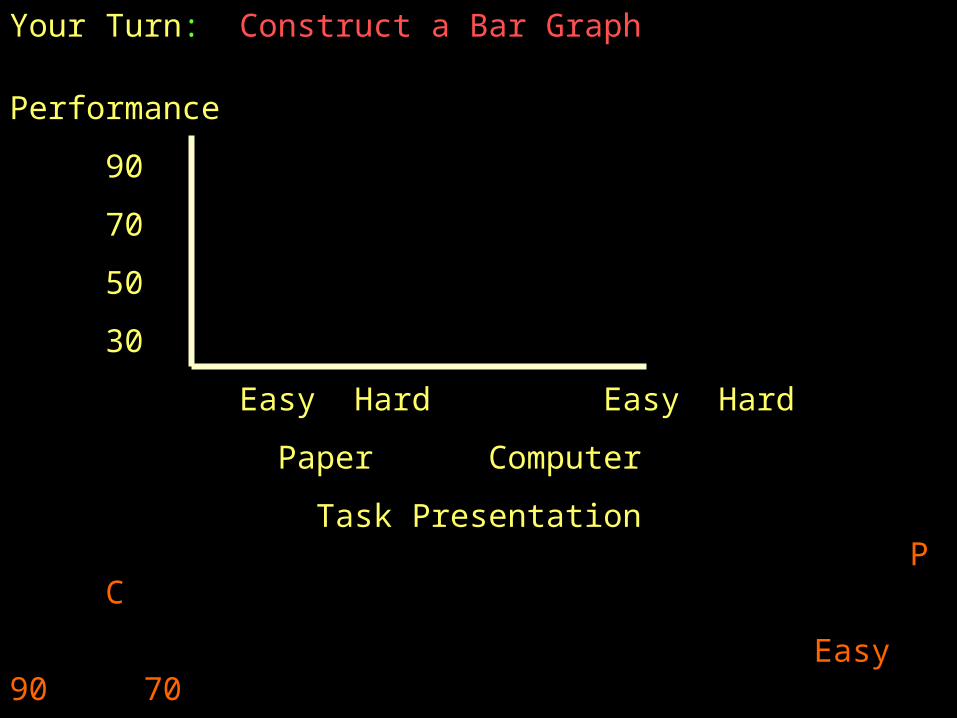
Your Turn: Construct a Bar Graph
Performance
90
70
50
30
Easy Hard Easy Hard
Paper Computer
Task Presentation P C
Easy 90 70
Hard 50 70
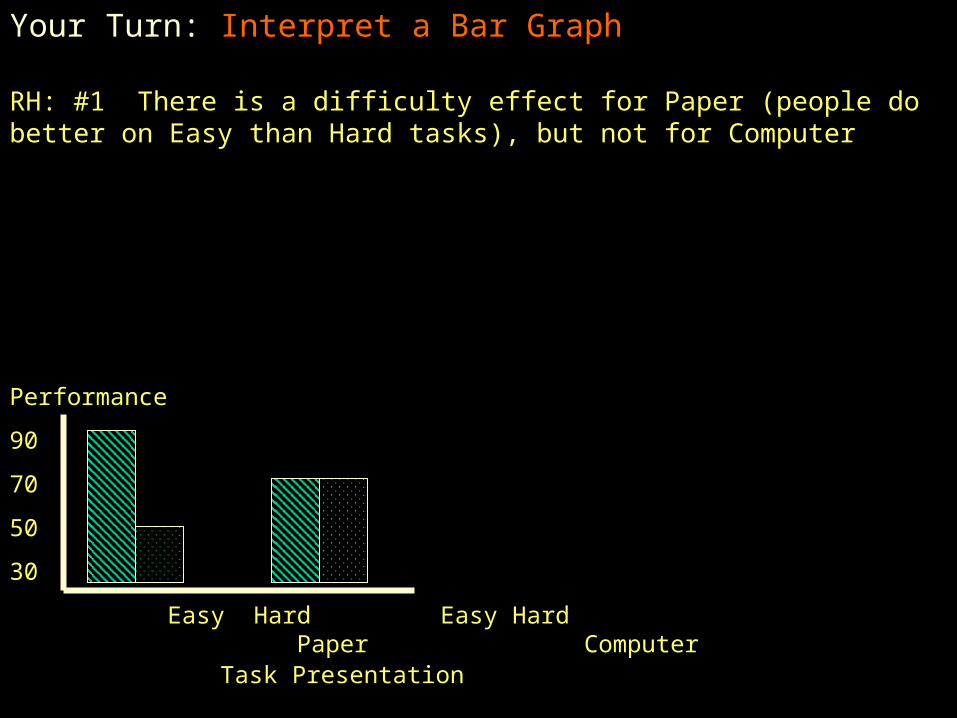
Your Turn: Interpret a Bar Graph
RH: #1 There is a difficulty effect for Paper (people do better on Easy than Hard tasks), but not for Computer
Performance
90
70
50
30
Easy Hard Easy HardPaper Computer Task Presentation
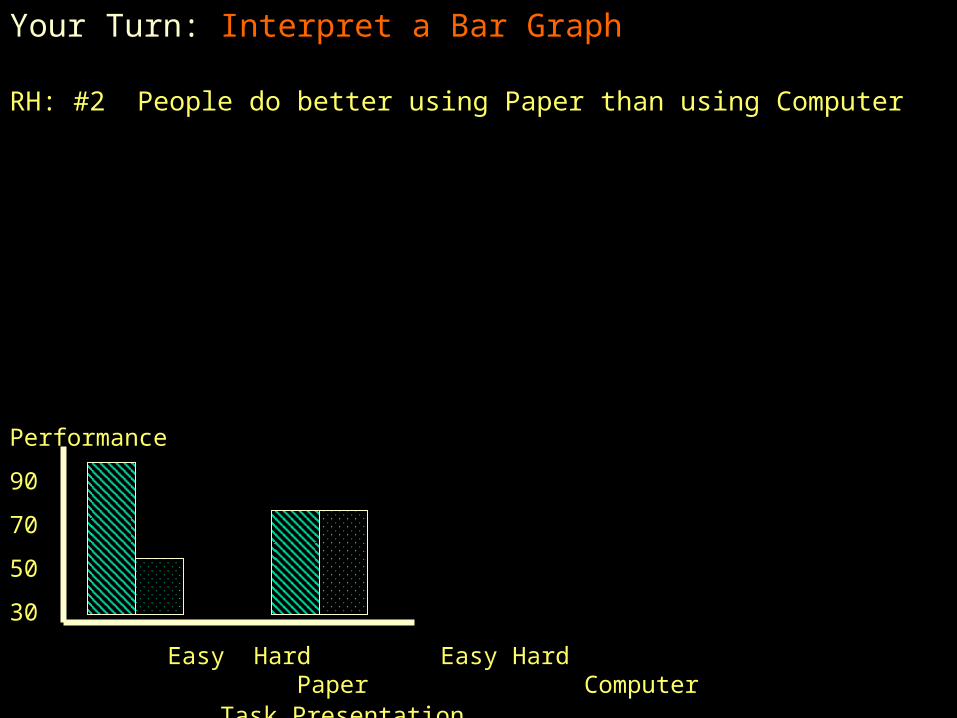
Your Turn: Interpret a Bar Graph
RH: #2 People do better using Paper than using Computer
Performance
90
70
50
30
Easy Hard Easy HardPaper Computer Task Presentation
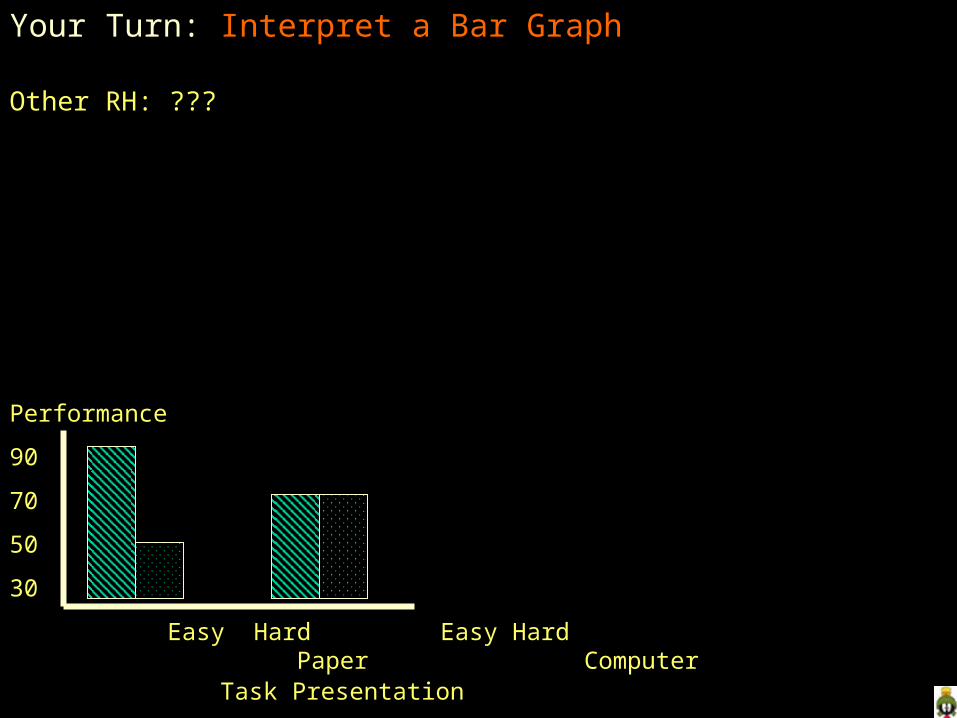
Your Turn: Interpret a Bar Graph
Other RH: ???
Performance
90
70
50
30
Easy Hard Easy HardPaper Computer Task Presentation
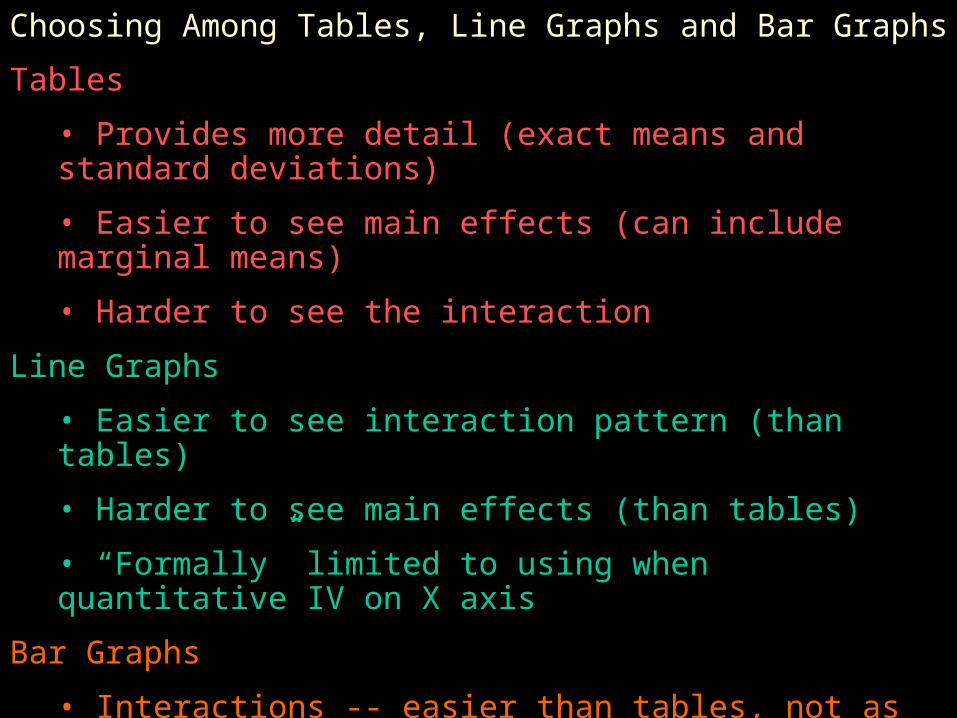
Choosing Among Tables, Line Graphs and Bar Graphs
Tables
• Provides more detail (exact means and standard deviations)
• Easier to see main effects (can include marginal means)
• Harder to see the interaction
Line Graphs
• Easier to see interaction pattern (than tables)
• Harder to see main effects (than tables)
• “Formally” limited to using when quantitative IV on X axis
Bar Graphs
• Interactions -- easier than tables, not as easy as line graphs
• Mains -- harder to see than tables
Note: Any of these can include std, or SEM “whiskers”