Embed Size (px)
Citation preview

Factors Impacting Science Achievement 1
Running head: FACTORS IMPACTING SCIENCE ACHIEVEMENT
A Multi-level Model Approach to Investigating Factors Impacting Science Achievement for
Secondary School Students – PISA Hong Kong Sample
Letao Sun1 and Kelly D. Bradley
University of Kentucky
1. Use L. Sun as author of contact. She may be reached at [email protected]
Factors Impacting Science Achievement 2
A Multi-level Model Approach to Investigating Factors Impacting Science Achievement for
Secondary School Students – PISA Hong Kong Sample
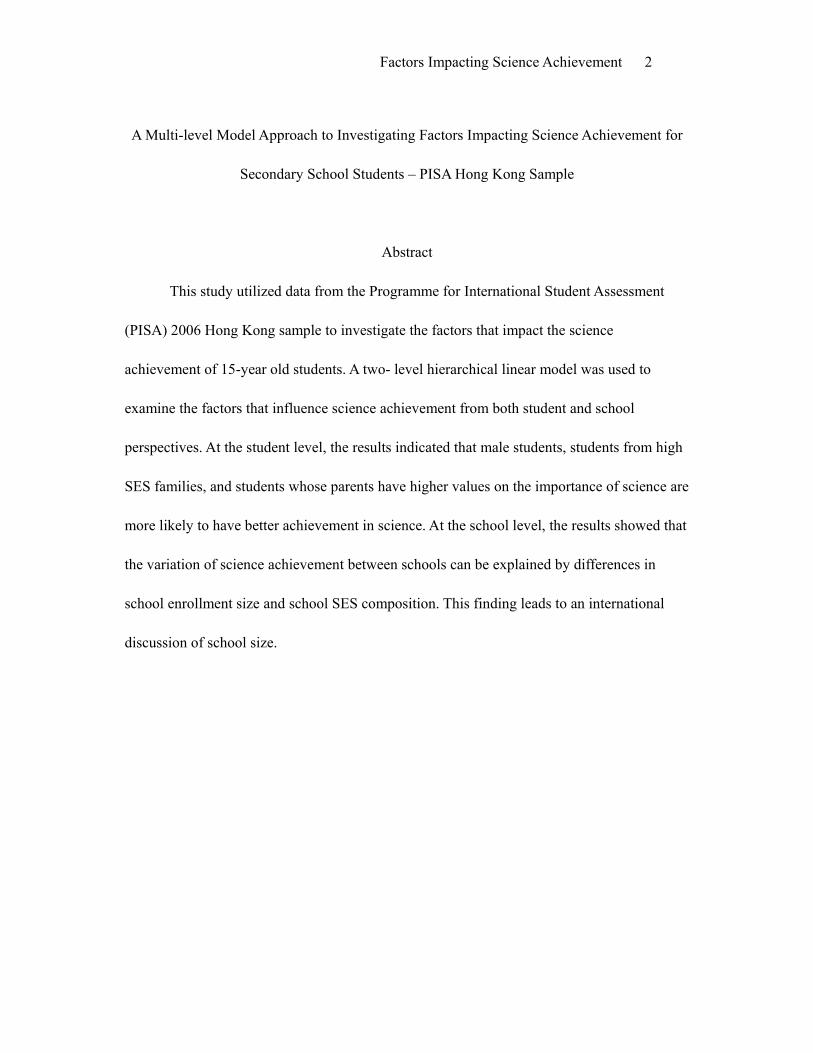
Abstract
This study utilized data from the Programme for International Student Assessment
(PISA) 2006 Hong Kong sample to investigate the factors that impact the science
achievement of 15-year old students. A two- level hierarchical linear model was used to
examine the factors that influence science achievement from both student and school
perspectives. At the student level, the results indicated that male students, students from high
SES families, and students whose parents have higher values on the importance of science are
more likely to have better achievement in science. At the school level, the results showed that
the variation of science achievement between schools can be explained by differences in
school enrollment size and school SES composition. This finding leads to an international
discussion of school size.

Factors Impacting Science Achievement 3
A Multi-level Model Approach to Investigating Factors Impacting Science Achievement for
Secondary School Students – PISA Hong Kong Sample
Science and technology play an important role in the modern world. Science
education is believed to serve as the foundation of technological development and a key
factor in economic growth. Given the United States’ goal of being the most scientifically
advanced country in the world, the lag behind other countries in student science achievement
scores is alarming (Beaton et al, 1996). International comparative studies such as
International Assessment of Educational Progress (IAEP), and the Third International
Mathematics and Science Study (TIMSS), have found that while students from Hong Kong,
the People’s Republic of China and Taiwan perform consistently higher than students from
the U.S., no significant differences were found in curriculum, aptitude or expenditure per
student (Wang, 2001). Other factors, such as family value system, family background, or
school characteristics may play an important role in determining the academic success of the
students. Studies of the academic achievement of Chinese immigrant groups (Fuligni, 1997)
and Indochinese refugee families (Caplan, Choy, & Whitmore, 1992) living in the United
States have demonstrated such impacts.
A distinct gender gap has been found by previous studies in science achievement
scores of students at middle school and high school (Good, Woodzicka, & Wingfield, 2010;
Sanchez & Wiley, 2010). Comparing scores on the National Center for Education Statistics
(NAPE) across three decades, researchers found that although the gender gap in science
scores has decreased since 1969, male students still outperformed female students on the
assessment at middle school and high school. (Campbell, Hombo, & Mazzeo, 2001).

Factors Impacting Science Achievement 4
Family influences can be separated into several components. Coleman (1997)
proposed that family influences can be divided into economic, human, and social capital
components. Steinberg (1996) divided family influences into three different aspects including
parenting style, established academic goals for their children, and the practices adopted to
help children attain those goals. Mashile (2001) pointed out that family aspects such as
parenting style, socioeconomic status (SES), parental involvement, and parental belief and
attitude are particularly related to children’s science achievement and academic attitude.
Parental attitudes have been show to impact students’ science outcome in two ways.
First, parental attitudes toward science influence the students’ science attitude. Children tend
to develop similar attitudes toward science as their parents. Bourdieu (1998) claimed that
within social groups, parents provide experiences that result in children developing similar
tastes, academic motivations and preferences. Eventually, these attributes are related to
differences in academic and occupational outcomes of the students. Papanastasiou (2002)
found that parents’ reinforcement, like high expectation on science performance, has the
second strongest direct influence on students’ attitude towards science. In turn, students’
attitudes have a major influence on science achievement and the pursuance of science careers.
Second, parental attitude has a significant effect on parental involvement of students’ science
studies. This can be either direct participation in science activities or indirect improvement on
home resources. George and Kaplan (1998) reported that parents with positive attitudes
toward science have more interactions with schools regarding schoolwork and are more likely
to take their children to libraries and science museums. In their study, the availability of home
resources like computers and science books were also found to be highly correlated to parents’

Factors Impacting Science Achievement 5
science attitudes.
The role of family SES in determining student academic performance has always been
an area of considerable attention in educational studies. A great number of studies have
established an empirical relationship between students’ family SES and their academic
achievement, even though the strength of the relationship varies to a great extent. Family SES,
which will largely determine the location of the child's neighborhood and school, not only
directly provides home resources but also indirectly provides "social capital," that is,
supportive relationships among schools and individuals (i.e., parent-school collaborations)
that promote the sharing of societal norms and values, which are necessary to success in
school (Dika & Singh, 2002).
School factors explain student academic achievements from another perspective.
OECD 2007 reported that on average of OECD countries, about one-third of all variation in
student performance (33%) was between schools. In Germany and Bulgaria, the performance
variation between schools was about twice the OECD average. Research on school effects
plays a critical role in many on-going educational reforms. In America, the enactment of No
Child Left Behind (NCLB, 2002) federal legislation requires states to develop content-based
standards to assess students’ academic performance annually, and to hold schools accountable
for substandard student outcomes. Previous studies classified school characteristics into two
types: context and climate. Context characteristics describe the physical background (e.g.,
school location and resources), the student body (e.g., school socioeconomic status), and the
teacher body (e.g., teacher education levels and teaching experience). Climate variables
referred to as evaluative variables, which describe the learning environment (e.g.,

Factors Impacting Science Achievement 6
instructional organization and school operation) (Ma, Ma, & Bradley, 2008).
Before 2009, the structure of the education system (a 6-5-2-3 system) in Hong Kong
followed the typical British system of 6 years of primary school (G.1 to G.6), 5 years of
secondary school (G.7 to G. 11 leading to a certificate examination), 2 years of pre-university
study (G.12 and G.13, leading to an advanced-level examination), and 3 years of university
study. The first 9 years of schooling (G.1 to G.9) are considered basic education and are
compulsory for all children (typically from age 6 to 15). Beginning in 2009, the education
system structure changed from 6-5-2-3 system to a 6-3-3-4 structure (6 years of primary
school, 3 years of junior secondary school, 3 years of senior secondary school, and 4 years of
university).
Hong Kong students have been ranked one of the highest scorers in the international
assessments of student science performance since 2000: 15 year-old students ranked third in
2000 and 2003, second in 2006 in Programme for International Student Assessment (PISA);
both 4th and 8th grade students ranked fourth in 2003, 4th grade students ranked third and 8th
grade students ranked ninth in the 2007 in Trends in International Mathematics and Science
Study (TIMSS).
The purpose of this study is to use Hierarchical Linear Model (HLM) to investigate the
factors that affect Hong Kong students’ science achievement. Hierarchical Linear Model or
Multilevel Modeling is the most appropriate statistical technique for hierarchical structure such as
students nested within schools. Using a two - level hierarchical linear model, the factors that
influence science outcomes were examined from both student and school perspectives.

Factors Impacting Science Achievement 7
Method
Data Sources
Data for the present study were from the Programme for International Student
Assessment (PISA) 2006 Hong Kong sample (see www.pisa.oecd.org). PISA is an
internationally standardized assessment that measures students’ capabilities in mathematics,
reading, and science literacy. According to OECD (2001), PISA focuses on young people’s
ability to use their knowledge and skills to meet real-life challenges, rather than merely on the
extent to which they have mastered a specific school curriculum. Beginning from 2000, PISA
is administrated every three years to groups of 15-year-old students in principal industrialized
countries. One of the subject or literacy areas is focused on at each administration. As the
2006 PISA study was focused on science, the 2006 PISA survey was utilized in this study. In
2006 PISA, three different questionnaires were designed for students, parents and schools
respectively, and each form contained a number of scales to assess student, parent, and school
effects on science achievement. The Hong Kong sample contains 4,645 7th to 11th grade students
(M = 9.51, SD = .756) from 146 schools.
Variables
The dependent variable in this study is identified as student science literacy test scores.
Scientific literacy was defined as “the capacity to use scientific knowledge, to identify
questions and to draw evidence-based conclusions in order to understand and help make
decisions about the natural world and the changes made to it through human activity” (Artlet,
Baumert, Julius-McElvany, & Peschar, 2003, p. 15). PISA assessed students’ science
competencies over three areas:

Factors Impacting Science Achievement 8
1. Identifying scientific issues. This involves recognizing issues that are possible to
investigate scientifically, identifying keywords to search for scientific information and
recognizing the key features of a scientific investigation.
2. Explaining phenomena scientifically. This involves applying knowledge of science
in a given situation, describing or interpreting phenomena scientifically and predicting
changes and identifying appropriate descriptions, explanations and predictions.
3. Using scientific evidence. This involves interpreting scientific evidence and
making and communicating conclusions, identifying the assumptions, evidence and reasoning
behind conclusions, and reflecting on the societal implications of science and technological
developments.
To reduce the length of the test, PISA applied matrix sampling, which splits one long
test booklet into several short test booklets. Therefore, each student works on one booklet
only. Because students complete different tests, science achievement cannot be obtained
using traditional test scores, but instead by using plausible values. Plausible values are
multiple imputations of unobservable latent achievement for each student. Simply put,
plausible values are some kind of student ability estimates. Instead of obtaining a
point-estimate for student ability, which is a traditional test score for each student, an
estimated probability distribution was derived empirically from the observed values on
students’ tests and their background variables. Plausible values then are drawn at random
from this probability distribution for each student (Ma, Ma, & Bradley, 2008). Adams and Wu
(2002) provided details about how plausible values are created and used. PISA 2006 used five
plausible values to present students’ science achievement.

Factors Impacting Science Achievement 9
The independent variables in this study included student level variables and school
level variables. Many of the variables in these two levels were index variables from PISA
surveys 2006. PISA used a number of questionnaire items to construct these indicators. Adam
and Wu (2002) provided details on how those indicators were constructed.
Sex (dummy coded for female=0 and male=1), student socioeconomic status (SES),
and parental values on science were selected as student level variables. At the school level,
variables descriptive of school context and school climate were selected. School enrollment
size, school socioeconomic composition, shortage of science teachers, and quality of
education resources were selected as school context variables; school science promotion,
teaching strategies, and school autonomy were used as school climate variables in this study.
Table B2 in the Appendix lists how the variables were constructed.
Statistical Models and Analysis
A two-level Hierarchical Linear Model (HLM) was developed to explore the factors
that affect student science literacy scores at both student and school levels. Hierarchical
structure exists in a large number of educational studies. For example, students are nested
within the schools, students are nested within classes, and schools are nested within districts,
and so on (Hox, 2002). Because of these grouping effects, the interaction between students
makes students in the same group more alike than the students in different groups.
Consequently, the observation of students within group can no longer be considered
statistically independent, which means the traditional statistical approaches, like regression or
ANOVA, are seriously flawed and not really applicable (Goldstein, 1995; Raudenbush &
Bryk, 2002). Failure to recognize the hierarchical nature of data in educational settings, or

Factors Impacting Science Achievement 10
any setting for that matter, results in unreliable estimation of the effectiveness of schools and
their practices, which could lead to misinformed educational policies or practices
(Raudenbush & Bryk, 2002).
Hierarchical Linear Model (HLM) or Multilevel Modeling is the most appropriate
statistical technique for hierarchical data. With hierarchical linear models, each of the levels
in this structure is represented by its own submodel. These submodels express relationships
among variables within a given level, and specify how variables at a higher level influence
characteristics and processes at a lower or parallel level. Another advantage of this technique
is that the software program on multilevel data analysis, Hierarchical Linear Modeling (HLM)
enables the usage of plausible values. During the process of reading, the software integrates
the plausible values and creates the outcome variable. (Raudenbush, Bryk, Cheong, &
Congdon, 2000).
Sampling weights for students and schools were used in the analysis to correct for
imperfections in the sample that might have led to bias and other departures between the
sample and the reference population. In order to limit the possibility of multicollinearity, the
variables at student level and school level were centered around their means. In this way, the
grand mean from the multilevel model can become a meaningful average measure of science
achievement of the students in Hong Kong.
A backward elimination process was used to determine whether each variable have a
significant relative effect on the dependent variable when other variables are controlled,
therefore, each variable was treated as fixed effect in their level. The goal is to find the least
complex model to best predict the science achievement. According to Micceri (2007),

Factors Impacting Science Achievement 11
“Because all social science contexts are complex, only analyses that can isolate the unique
impact (unique variation) of specific factors at their various levels, such as multilevel
modeling, are appropriate. Effectively, Multilevel Modeling uses Backward Elimination
rather than Stepwise to model equations thereby primarily unique rather than shared variance
to determine a variables contribution to a model” (p. 13).
The HLM modeling procedure in this study has three steps. At first step, the analysis
produced the null model with only student level outcome variable but no independent
variables at the student level or school level. This null model was similar to a random-effect
ANOVA model, providing the information of the variances within and between schools for
science achievement measure (Ma & Klinger, 2000). At the second step, a student level
model was developed without variables at the school level. This step is to examine the effects
of student characteristics on the dependent variable. School variables were added to the
student model at the third step. This ‘full’ model was created to examine what school
background characteristics influence the relationship between science achievement and
student level variables. Raudenbush and Bryk (2002) provided the details about the statistical
theory and methodological approach of HLM.
Results
Table 1 shows the descriptive statistics for independent variables at both student and
school levels.

Factors Impacting Science Achievement 12
Table 1.
Description of independent variables.
Variable M SD Student characteristics Sex (1=female; 2=male) Student SES -.68 .93Parental values on science .50 2.18
School characteristics School enrollment size 1040.37 174.17School SES composition -.68 .48Shortage of science teachers 1.34 .70quality of education resources .34 .96school science promotion .94 .65Teaching strategies 2.26 .13School autonomy .33 .17
Table 2 and Table 3 present statistical results from the null model estimated based on (1):
Level 1 Model:
Science achievement = β (1)
Level 2 Model:
β
In this null model, the intercept β represented the average science achievement for
the J school (j= 1, 2, … J). These intercepts vary at the school level. Results show that the
average science achievement of Hong Kong students is reported to be around 534 points.
Given the PISA science international scale (M = 500, SD = 100), the Hong Kong students
scored higher than the international average. The variance component at student level is
5441.40 and the variance component at school level is 3280.61, the result indicating a large
variance of average science achievement across Hong Kong schools ( (143)= 2874.87, p <
0.01). Intra-class correlation indicates that about 37.61% of the total variance in science
achievement is attributable to school effects.

Factors Impacting Science Achievement 13
Table 2.
Fixed effects of the null model
Coefficient SE T-ratio pIntercept (science achievement) 533.63 5.68 94.01 <.01 Table 3. Random effects of the null model Variance df Chi-square pBetween-school variability (intercept) 3280.61 143 2874.87 <.01Within-school variability 5441.40
The final full model equation of present study is shown below. (See Equation (2)),
The intercept of the full model, β , represent adjusted mean for each school.
Level 1 Model:
Science achievement = β β SEX β Student SES
β Parental values on science
Level 2 Model: (2)
β School enrollment size School SES composition
β
β
β
Table 4 and Table 5 show the statistical results of the full model suggested by HLM
software program. The reliability estimate of .899 suggests that it is well for us to
discriminate schools using least square estimate of the coefficient β ).

Factors Impacting Science Achievement 14
Table 4. Fixed effects of the full model Coefficient SE T-ratio pIntercept (science achievement) 542.01 3.83 141.65 <.01Student characteristics Sex (0=female; 1=male) 19.53 2.76 7.09 <.01Student SES 8.47 1.83 4.62 <.01Parental views on science 3.85 0.63 6.08 <.01
School characteristics School enrollment size 0.15 0.02 7.11 <.01School SES composition 38.76 8.40 4.61 <.01
Table 5. Random effects of the full model Variance df Chi-square pBetween-school variability (intercept) 1482.92 141 1388.75 <.01Within-school variability 5133.06
When the hierarchical model is fit at both student and school levels, the effects of
student level variables can be interpreted more meaningfully (Ma, Ma & Bradley, 2008). Sex,
student SES, and parental values on science at student level all impact the student science
achievement. Coefficient value ( ) of each independent variable is the relative effect which
was adjusted /controlled for other variables in the model For example, for every one unit (SD)
increase in students’ SES, the student science score will increase 8.47 points when controlling
all other variables as constant ( =8.47).
At the school level, school enrollment size and school SES composition were found to
be the predictors of the average science achievement at each school. In this full model, the
intercept of variables at school level can be explained like: for every unit (SD) increase of
school enrollment size, the student science achievement will increase 0.15 points when all

Factors Impacting Science Achievement 15
other variables were controlled ( =0.15). All the slops (coefficients) we found to be
positive, which suggests that: (1) on average, a male student’s science literacy scores will be
19.53 points higher than female students; (2) students from higher SES families are more
likely to have better achievement in science; (3) students whose parents have higher values
on the importance of science are more likely to have higher science scores; (4) students from
schools with bigger enrollment size are more likely to have science achievement; and (5)
students from the higher average SES schools are more likely to have science achievement.
In comparison with the null model, the final student model explained about 6% of the
variance at student level and about 55% of the variance at the school level.
Discussion
There was a relatively large gap found between male and female scores in the present
study (γ = 19.53). This is consistent with previous studies, which have indicated that male
students perform better than female students in math and science. However, the present study
points out an additional reason that could widen the gap between males and females in the
Hong Kong sample. This factor is related to the Chinese culture that is more patriarchal and
male-dominated, which results in more investment and higher expectations placed on males
than on females (Chen, Lee, & Stevenson, 1996; Liu, 2006). Still, there is a common trend in
current research to demonstrate a decline in male/female differences in science performance,
yet female representation in science-related fields is still low (Jacobs, 2005).
The present findings seem to be consistent with other studies which found that
students’ SES performs as a statistically significant positive contributor to students’ science
learning outcomes; however, this effect here was not very substantial compares to previous

Factors Impacting Science Achievement 16
similar studies. The governmental intervention could be an influential component in
education; Hong Kong government provides subsidized education or financial aid to support
all 6 to 15-year-old students (Post, 2003).
Parental values on the importance of science was also found to be a statistically
significant factor. The results suggest that the with one unit increase of parental views,
student science achievement will increase 3.85 points when controlling all other variables.
This factor was ranged from -8.65 to 5.76 with a mean score of 2.18 and SD of .5, these
findings suggest that on average, Hong Kong parents have a higher value on the importance
of science.
More than half of the variances on science achievements were found to be explained
by school factors in this study. In contrast to earlier findings that smaller schools is better for
student learning (Cotton, 2002; Steward, 2009), however, no evidence of negative
relationship between school enrollment size and student science learning outcomes was
detected. Instead, the findings indicate that the school enrollment size acts as a facilitating
factor for students’ science performance. In addition, a bivariate correlation test between
school size and school average science score suggests a positive linear relationship and no
suppressor effect in this model. A possible explanation for this might be that larger student
body schools are more likely to have more grants or financial opportunities, and greater
support from parents (There is a positive correlation between school enrollment size and
school SES, r = .363, p < .001), therefore, they are more likely to attract and retain qualified
and talented teachers, as well as create larger peer effect as more active and bright students
work together.
Factors Impacting Science Achievement 17
Significance
The current study adds supplementary information to the existing body of literature on
the parental factors influencing the students’ learning outcomes. The impact of parental
values on the importance of science was found to be statistically significant in explaining
differences in academic achievement. Therefore, it is recommended that parents orient their
children toward more scientific disciplines for their instrumental and pragmatic importance.
This study has policy implications by generating more interaction/cooperation between
schools and parents. Schools should expend more effort in informing parents about how to
better invest cultural resources than material resources at home, so that the latter becomes
more informed about the significance of scientific studies and therefore influence their
children’s preference and academic choices.
Also, it is suggested by TIMSS study (Kifer & Robitaille, 1989), indicators of home
support was found to have positive effects on students’ math achievements in some countries
but have negative effects in other countries. Such contradictory findings suggest similar
studies on parental values on science in other countries and regions in order to generalize the
findings of this research at the international level.
The present effective learning reform of school reconstruction is taking the trends of
both consolidating smaller schools into larger schools and breaking large schools into small
learning environments. The findings of present study suggest a reconsideration of criticizing
larger schools. The impact of school size on student achievement is associated with other
factors both at student level and school level (e.g., SES, teacher-student ratio, race, location,
curriculum and instruction). Some recent studies had found that bigger school size is benefit

Factors Impacting Science Achievement 18
for learning outcomes in high school and for high SES students (Howley & Howley, 2004;
McMillen, 2004; Weiss, Carolan, & Baker-Smith, 2010). Therefore, public policy makers
should not be in a hurry to conclude that “smaller is better” before accurately assessing the
downside of large school system. Simply creating smaller schools or dividing larger schools
may not produce the desired effect. Because of the sample limits, even though the Hong
Kong 2006 sample shows a pattern of positive correlation between school size and science
achievement, the influence of schools which size is bigger than 1400 or less than 500 had not
been explored. Also, researchers are suggested to use more functional factors like the
student-teacher ratio, class size to replace school size or to explore what is the best unit size
for student learning in future studies.
References
Adams, R., & Wu, M. (Eds.) (2002). Programme for International Student Assessment (PISA):
PISA 2000 technical report. Paris, France: Organization for Economic Cooperation
and Development.
Artlet, C., Baumert, J., Julius-McElvany, N., & Peschar, J. (2003). Learners for life: Student
approaches to learning. Results from PISA 2000. Paris: Organisation for Economic
Co-operation and Development.
Beaton, A. E., Martin, M. O., Mullis, I. V. S., Gonzalez, E. J., Smith, T., & Kelly, D. L.
(1996b) Science achievement in the middle school years: IEA’s third international
mathematics and science study. Chestnut Hill, MA: Center for the Study of Testing,
Evaluation, and Educational Policy, Boston College.
Bourdieu, P. (1998). Practical reason: On the theory of action. Cambridge, UK: Polity Press.

Factors Impacting Science Achievement 19
Campbell, J. R., Hombo, C. M., Mazzeo, J. (2000). NAEP 1999 trends in academic progress:
Three decades of student performance. Washington, DC: U.S. Department of
Education, National Center for Education Statistics.
Caplan, N., Choy, M. H. & Whitmore, J. K. (1992). Indochinese refugee families and
academic achievement. Scientific American, 266, 36-42.
Chen, C., Lee, S. Y., & Stevenson, H. W. (1996). Long-term prediction of academic
achievement of American, Chinese, and Japanese adolescents. Journal of Educational
Psychology, 18(4), 750–759.
Coleman, J. S. (1997). Family, school, and social capital. In Saha, L. J. (Ed.), International
Encyclopedia of the Sociology of Education, (pp. 623-625). Oxford, UK: Pergamon.
Cotton, K. (2002). New small learning communities: Findings from recent literature. Portland,
OR: Northwest Regional Educational Laboratory.
Dika, D. L., & Singh, K. (2002). Applications of social capital in educational literature: A
critical synthesis. Review of Educational Research, 72, 31-60.
Fuligni, A. J. (1997). The academic achievement of adolescents from immigrant families: The
roles of family back-ground, attitudes, and behavior. Child Development, 68, 351-363.
George, R., & Kaplan, D. (1998). A structural model of parent and teacher influences on
science attitudes of eighth graders: Evidence from NELS. Science Education, 82,
93–109.
Goldstein, H. (1995). Kendall’s library of statistics 3: Multilevel statistical models. New York:
Edward Arnold.
Good, J., Woodzicka, J., & Wingfield, L. (2010). The effects of gender stereotypic and

Factors Impacting Science Achievement 20
counter-stereotypic textbook images on science performance. The Journal of Social
Psychology, 150, 132-147.
Howley, C. B., & Howley, A. A. (2004). School size and the influence of socioeconomic
status on student achievement: Confronting the threat of size bias in national data sets.
Education Policy Analysis Archives, 12, 52. Retrieved August 28, 2010 from
http://epaa.asu.edu/ojs/article/view/207
Hox, J. (2002). Multilevel analysis: Techniques and application. Mahwah, NJ: Erlbaum.
Jacobs, J. E. (2005). Twenty-five years of research on gender and ethnic differences in math
and science career choices: What have we learned? New Directions for child and
adolescent development, 110, 85-94.
Kifer, E., & Robitaille, D. F. (1989). Attitudes, preferences and opinions. In D.F. Robitaille &
R. A. Garden (Eds.), The IEA study of mathematics II: Contexts and outcomes of
school mathematics (pp. 178-208). Oxford: Pergamon Press.
Liu, F. (2006). Boys as only-children and girls as only-children—Parental gendered
expectations of the only-child in the nuclear Chinese family in present-day China.
Gender and Education, 18, 491-505.
Ma, X., & Klinger, D. A. (2000). Hierarchical linear modeling of student and school effects
on academic achievement. Canadian Journal of Education, 25, 41-55.
Ma, X., Ma, L., & Bradley, K. D. (2008). Using multilevel modeling to investigate school
effects. In A. A. O’Connell & D. B. McCoach (Eds.), Multilevel modeling of
educational data (pp. 59-110). Charlotte, NC: Information Age.
Mashile, E. O. (2001). Science achievement determinants: Factorial structure of family

Factors Impacting Science Achievement 21
variables. South African Journal of Education, 21, 335-338.
McMillen, B. (2004). School size, achievement, and achievement gaps. Education Policy
Analysis Archives, 12, 58. Retrieved August 22, 2010 from
http://epaa.asu.edu/ojs/article/view/213
Micceri, T. (2007). The use of multilevel modeling to estimate which measures are most
influential in determining an institution's placement in carnegie's new
doctoral/research university classification schema. Retrieved July 2, 2010 from
www.eric.ed.gov/ERICWebPortal/recordDetail?accno=ED497454
OECD. (2001). Knowledge and skills for life: First results from PISA 2000. Paris:
Organisation for Economic Co-operation and Development.
OECD. (2009). PISA 2006 Technical Report. Retrieved from
www.oecd.org/dataoecd/0/47/42025182.pdf
Papanastasiou, C. (2002). School, teaching and family influence on student attitudes toward
science: Based on TIMSS data for Cyprus. Studies in Educational Evaluation, 28,
71-86.
Post, D. (2003). Post-secondary education in Hong Kong: Repercussions for inequality and
civil society. Asian Survey, 43, 989-1011.
Rasbash, J., Browne, W., Goldstein, H., Yang, M., Plewis, I., Healy, M., Woodhouse, G.,
Draper, D., Langford, I., & Lewis, T. (2000). A User's Guide to MLwiN (2nd ed.).
University of London.
Raudenbush, S. W., & Bryk, A. S. (2002). Hierarchical linear models (2nd ed.). Newbury
Park, CA: Sage.

Factors Impacting Science Achievement 22
Raudenbush, S.W., Bryk, A.S., Cheong, Y.F., & Congdon, R. (2000). HLM: Hierarchical
linear and nonlinear modeling (Version 5) [Computer software]. Chicago, IL:
Scientific Software International.
Raudenbush, S. W., & Willms, J. D. (Eds.). (1991). Schools, classrooms, and pupils:
International studies of schooling from a multilevel perspective. San Diego: Academic
Press.
Sanchez, C.A., & Wiley, J. (2010). Sex difference in science learning: Closing the gap
through animations. Learning and Individual Difference, 20, 271-275.
Steinberg, L. (1996). Beyond the Classroom. New York: Simon & Schuster.
Stewart, L. (2009). Achievement differences between large and small schools in Texas. The
Rural Educator, 30(2), 20-28.
Wang, D. B. (2001). Towards an understanding of Hong Kong and United States’ Students’
mathematics achievement. Unpublished doctoral dissertation, University of Illinois,
Chicago.
Wang, D. B. (2004). Family background factors and mathematics success: A comparison of
Chinese and US students. International Journal of Educational Research, 41(1),
40-54.
Weiss, C. C., Carolan, B. V., & Baker-Smith, E. C. (2010). Big school, small school:
(Re)Testing assumptions about high school size, school engagement and mathematics
achievement. Journal of Youth Adolescences, 39, 163-176.

Factors Impacting Science Achievement 23
APPENDIX
Table A1: Description of weights.
N Mean SD Min Max Student Weight 4645 16.18 5.21 11.29 80.21 School Weight 146 3.28 2.11 2.05 24.70
Table B1: Variables at the student level.
Variable Questionnaire Sex *Are you female (1) or male (2)? Student socioeconomic status (SES) ( ª ESCS in PISA 2006 dataset)
Parental values on science (derived from � PQSCIMP, � PQGENSCI, and � PQPERSCI in PISA 2006 dataset)
Note: * indicates items from the Student Questionnaire. ª ESCS is explained in PISA 2006 Technical Report (OECD, 2009, p. 346), measures economic, social and cultural status. � PQSCIMP is explained in PISA 2006 Technical Report (OECD, 2009, p. 343), measures parent’s views on importance of science. � PQGENSCI is explained in PISA 2006 Technical Report (OECD, 2009, p. 344), measures parents’ view on general value of science. � PQPERSCI is explained in PISA 2006 Technical Report (OECD, 2009, p. 344), measures parents’ view on personal value of science.
Table B2: Variables at school level.
Variable Questionnaire School enrollment size ***As at <February 1, 2006>, What was the total school
enrolment (number of students)? School socioeconomic composition (created by averaging the SES of students within each school)
Shortage of teachers ***Is your school’s capacity to provide instruction hindered by any of the following?
a) A lack of qualified science teachers

Factors Impacting Science Achievement 24
Table B2: Variables at school level (continued)
Quality of education resources ( ª SCMATEDU in PISA 2006 dataset)
School science promotion ( � SCIPROM in PISA 2006 dataset)
Teaching strategies *When learning <school science> topics at school, how often do the following activities occur?
a) Students are given opportunities to explain their ideas
b) Students spend time in the laboratory doing practical experiments
c) Students are required to design how a school science question could be investigated in the laboratory
d) The students are asked to apply a school science concept to everyday problems
e) The lessons involve students’ opinions about the topics
f) Students are asked to draw conclusions from an experiment they have concluded
g) The teacher explains how a school science idea can be applied to a number of different phenomena (e.g. the movement of objects, substances with similar properties)
h) Students are allowed to design their own experiments
i) There is a class debate or discussion j) Experiments are done by the teacher as
demonstrations k) Students are given the chance to choose their own
investigations l) The teacher uses school science to help students
understand the world outside school m) Students have discussions about the topics n) Students do experiments by following the
instructions of the teacher o) The teacher clearly explains the relevance of broad
science concepts to our lives p) Students are asked to do an investigation to test out
their own ideas q) The teacher uses examples of technological

Factors Impacting Science Achievement 25
application to show how school science is relevant to society.
School autonomy ***Regarding your school, who has a considerable responsibility for the following tasks?
a) Selecting teachers for hire b) Firing teachers c) Establishing teachers’ starting salaries d) Determining teachers’ salaries increases e) Formulating the school budget f) Deciding on budget allocations within the school g) Establishing student disciplinary policies h) Establish student assessment policies i) Approving students for admission to the school j) Choosing which textbooks are used k) Determining course content l) Deciding which courses are offered.
Note: * indicates items from the Student Questionnaire; ***indicates item from the School Questionnaire. Categories relate to Shortage of teachers and Shortage of instructional resources were “not at all”, “very little”, “to some extent” and “a lot”. Categories relate to Science promotion program were “yes” and “no”. Categories relate to Teaching strategies were “in all lessons”, “in most lessons”, “in some lessons”, and “never or hardly ever”. Categories relate to School autonomy were “principal or teachers”, “school governing board”, “regional or local education authority”, and “national education authority”. ª SCMATEDU is explained in PISA 2006 Technical Report (OECD, 2009, p. 340), measures of quality of educational resources. � SCIPROM is explained in PISA 2006 Technical Report (OECD, 2009, p. 341), measures of school activities to promote the learning of science.