Embed Size (px)
Citation preview
CHAPTER 8Failure Analysis and
Prevention
The repetitive loading of engineering materi-als opens up additional opportunities for struc-tural failure. Shown here is a mechanical test-ing machine, introduced in Chapter 6, modifiedto provide rapid cycling of a given level of me-chanical stress. The resulting fatigue failure is amajor concern for design engineers. ( Courtesyof Instron Corporation)
Anvil
End of swing
Pointer
Specimenh
h′
Starting position
Hammer
Scale
Figure 8-1 Charpy test of impact energy. (From H. W. Hayden, W. G. Moffatt,and J. Wulff, The Structure and Properties of Materials, Vol. 3: MechanicalBehavior, John Wiley & Sons, Inc., New York, 1965.)
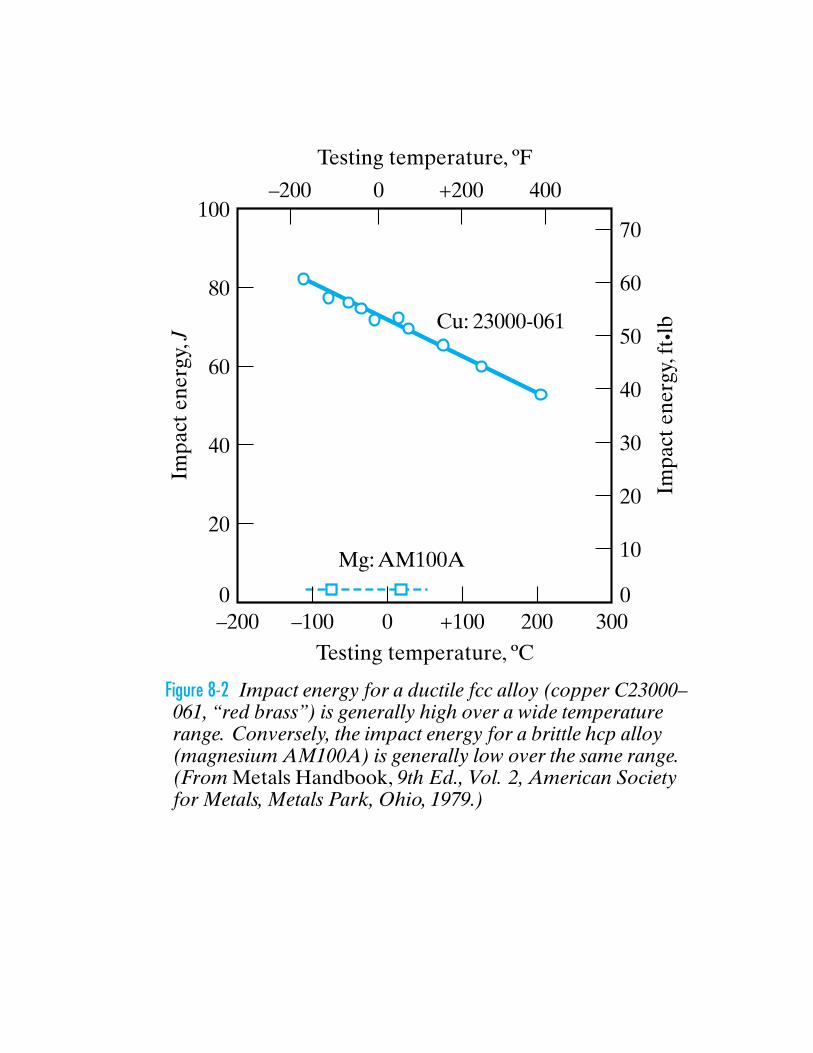
Cu: 23000-061
–200 0 +200
Testing temperature, ºF
Testing temperature, ºC
400
70
Impa
ct e
nerg
y, ft
•lb
Impa
ct e
nerg
y, J
100
80
60
40
20
0–200 –100 0 +100 200 300
60
50
40
30
20
10
0
Mg: AM100A
Figure 8-2 Impact energy for a ductile fcc alloy (copper C23000–061, “red brass”) is generally high over a wide temperaturerange. Conversely, the impact energy for a brittle hcp alloy(magnesium AM100A) is generally low over the same range.(From Metals Handbook, 9th Ed., Vol. 2, American Societyfor Metals, Metals Park, Ohio, 1979.)
Temperature, F
Temperature, F
Temperature, C
Impa
ct e
nerg
y, J
Impa
ct e
nerg
y, ft
•lb
Impa
ct e
nerg
y, J
Impa
ct e
nerg
y, ft
•lb
(a)
Temperature, C
(b)
250
200
150
100
50
0
0–100
–100
0
50
100
150
200
250
300
–50 –25 0 25 50 75 100 125 150
–50
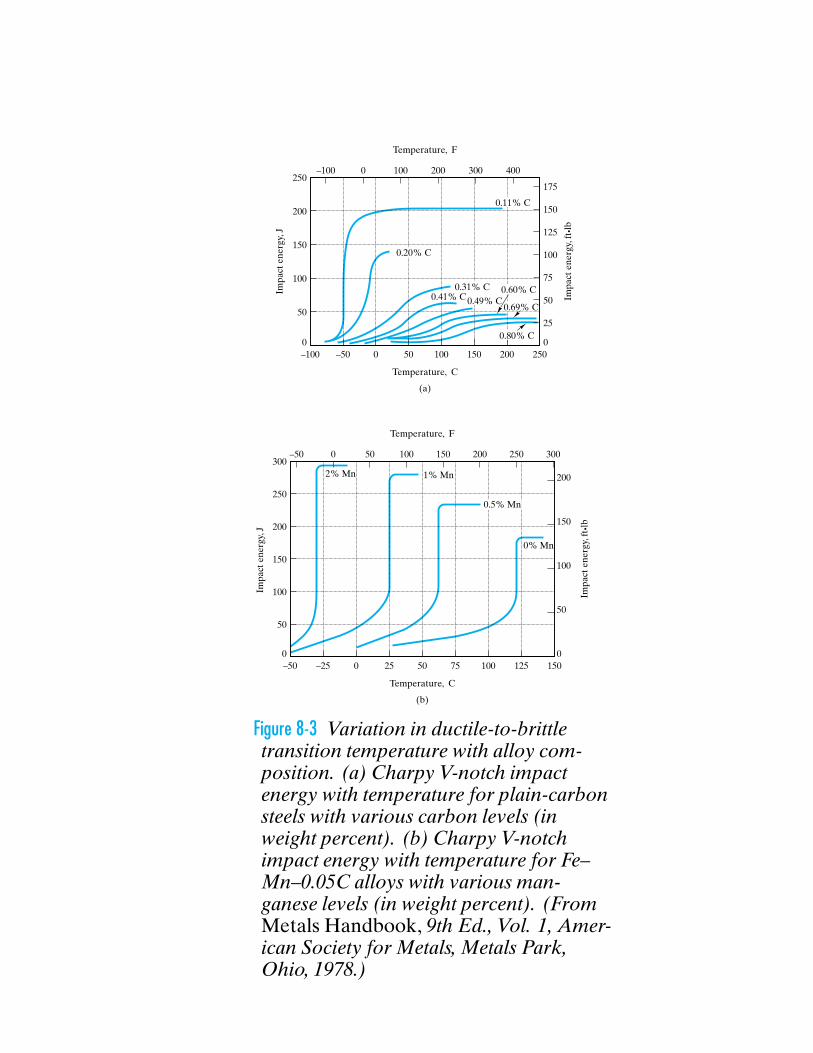
2% Mn
0.5% Mn
0% Mn
1% Mn
0 50 100 150 200 250 300
–50 0 50 100 150 200 250
175
150
125
100
75
50
25
200
150
100
50
0
0
100 200 300 400
0.11% C
0.20% C
0.31% C 0.60% C0.41% C
0.80% C
0.49% C0.69% C
Figure 8-3 Variation in ductile-to-brittletransition temperature with alloy com-position. (a) Charpy V-notch impactenergy with temperature for plain-carbonsteels with various carbon levels (inweight percent). (b) Charpy V-notchimpact energy with temperature for Fe–Mn–0.05C alloys with various man-ganese levels (in weight percent). (FromMetals Handbook, 9th Ed., Vol. 1, Amer-ican Society for Metals, Metals Park,Ohio, 1978.)
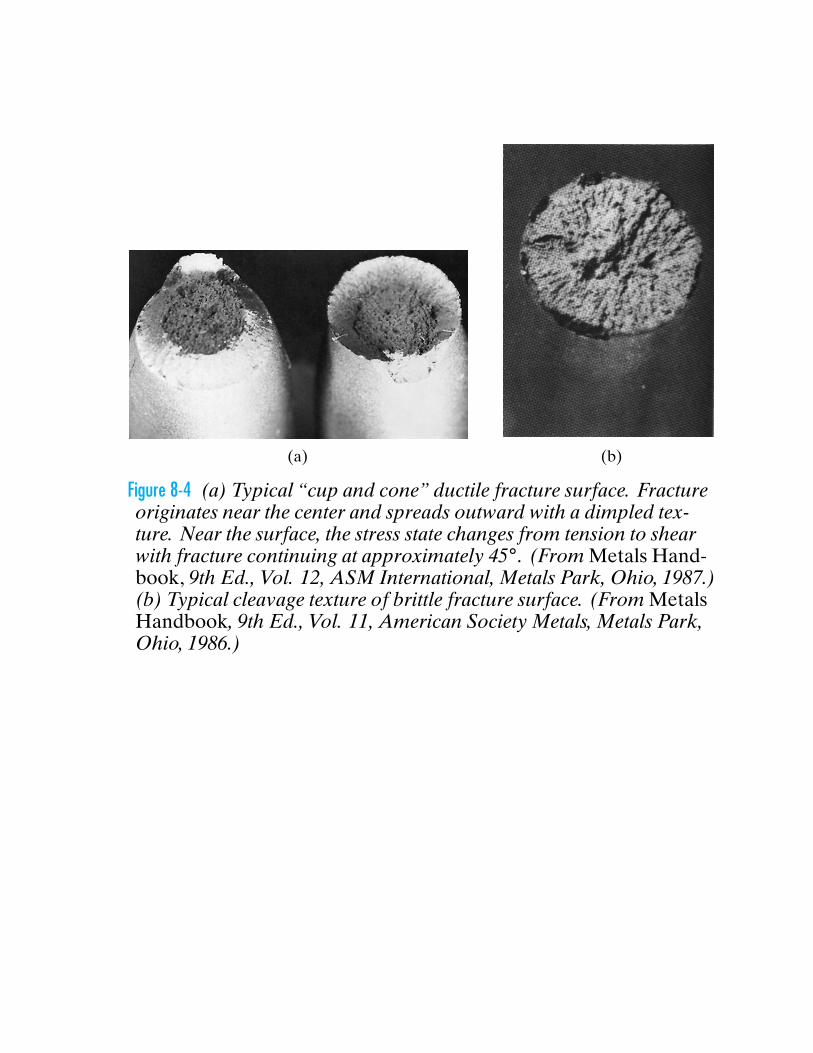
(a) (b)
Figure 8-4 (a) Typical “cup and cone” ductile fracture surface. Fractureoriginates near the center and spreads outward with a dimpled tex-ture. Near the surface, the stress state changes from tension to shearwith fracture continuing at approximately 45◦. (From Metals Hand-book, 9th Ed., Vol. 12, ASM International, Metals Park, Ohio, 1987.)(b) Typical cleavage texture of brittle fracture surface. (From MetalsHandbook, 9th Ed., Vol. 11, American Society Metals, Metals Park,Ohio, 1986.)
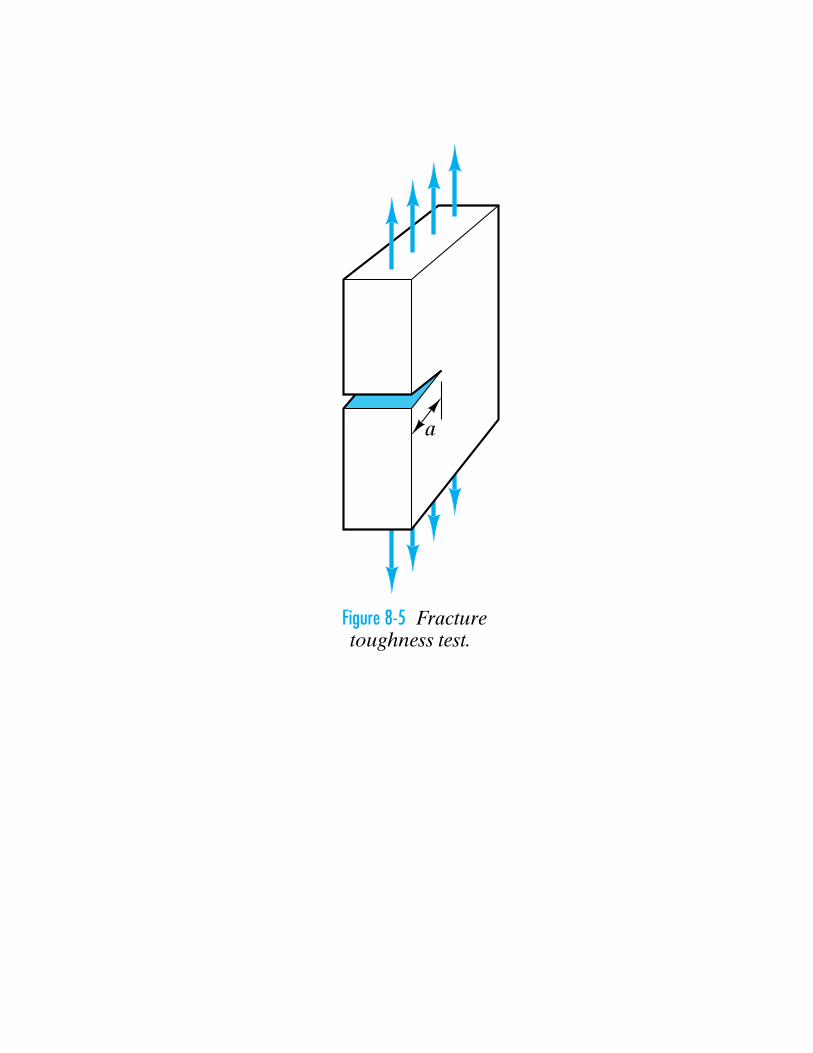
a
Figure 8-5 Fracturetoughness test.
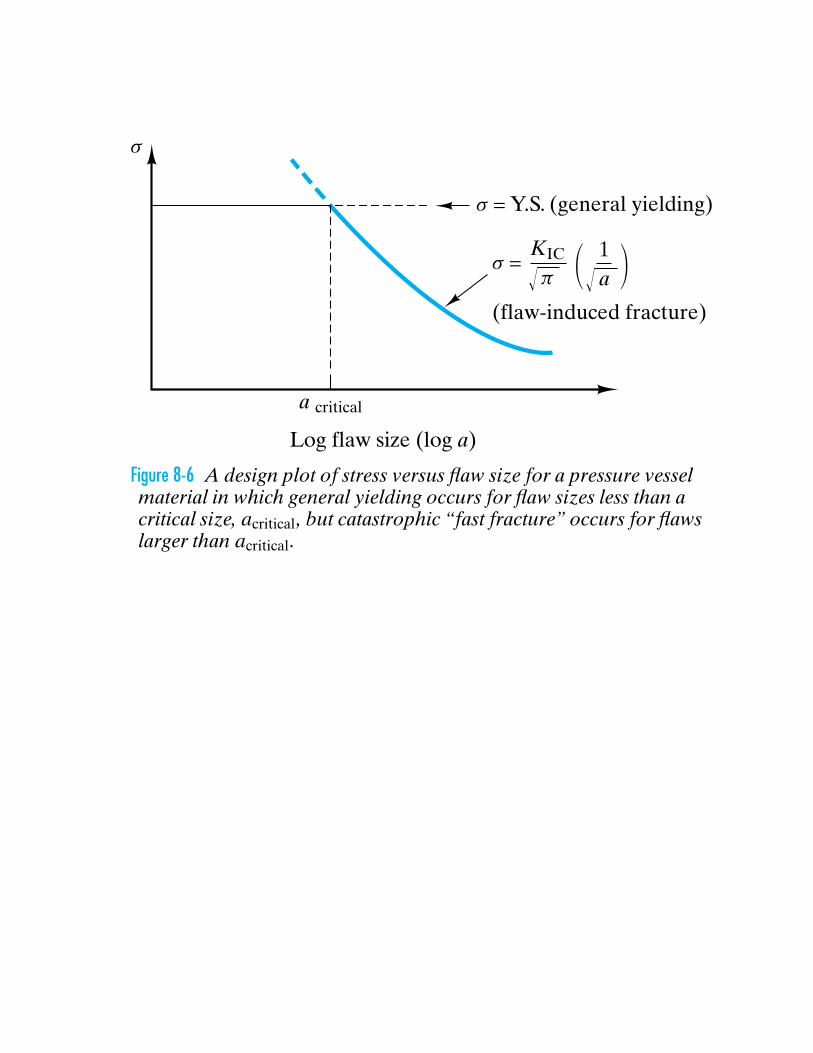
Log flaw size (log a)
a critical
(flaw-induced fracture)
1a1 2!!
Figure 8-6 A design plot of stress versus flaw size for a pressure vesselmaterial in which general yielding occurs for flaw sizes less than acritical size, acritical, but catastrophic “fast fracture” occurs for flawslarger than acritical.
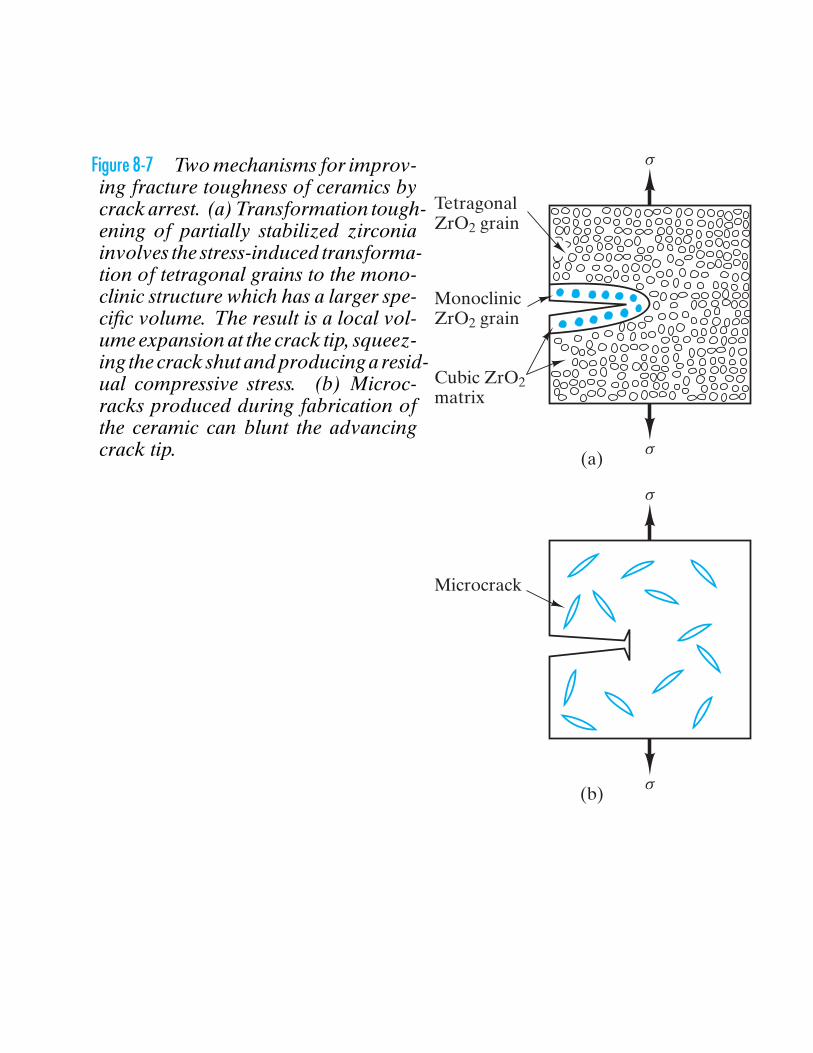
Figure 8-7 Two mechanisms for improv-ing fracture toughness of ceramics bycrack arrest. (a) Transformation tough-ening of partially stabilized zirconiainvolves the stress-induced transforma-tion of tetragonal grains to the mono-clinic structure which has a larger spe-cific volume. The result is a local vol-ume expansion at the crack tip, squeez-ing the crack shut and producing a resid-ual compressive stress. (b) Microc-racks produced during fabrication ofthe ceramic can blunt the advancingcrack tip.
TetragonalZrO2 grain
MonoclinicZrO2 grain
Microcrack
(a)
Cubic ZrO2matrix
(b)
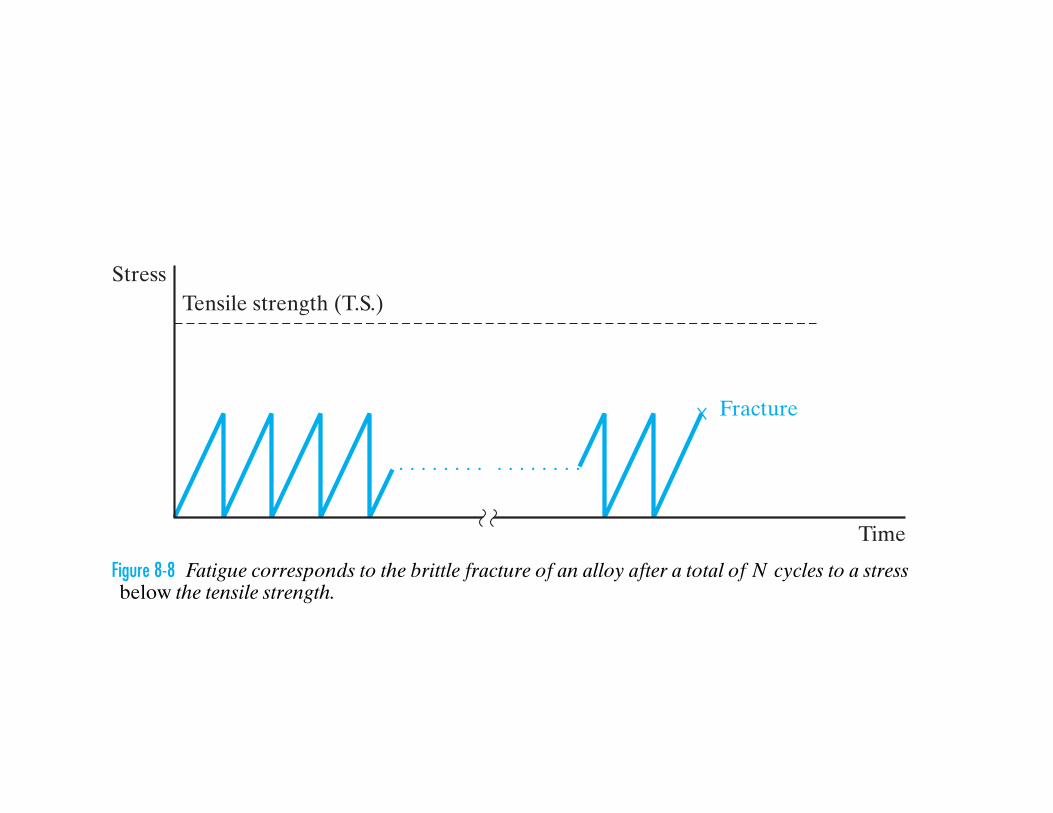
StressTensile strength (T.S.)
Fracture
Time
Figure 8-8 Fatigue corresponds to the brittle fracture of an alloy after a total of N cycles to a stressbelow the tensile strength.
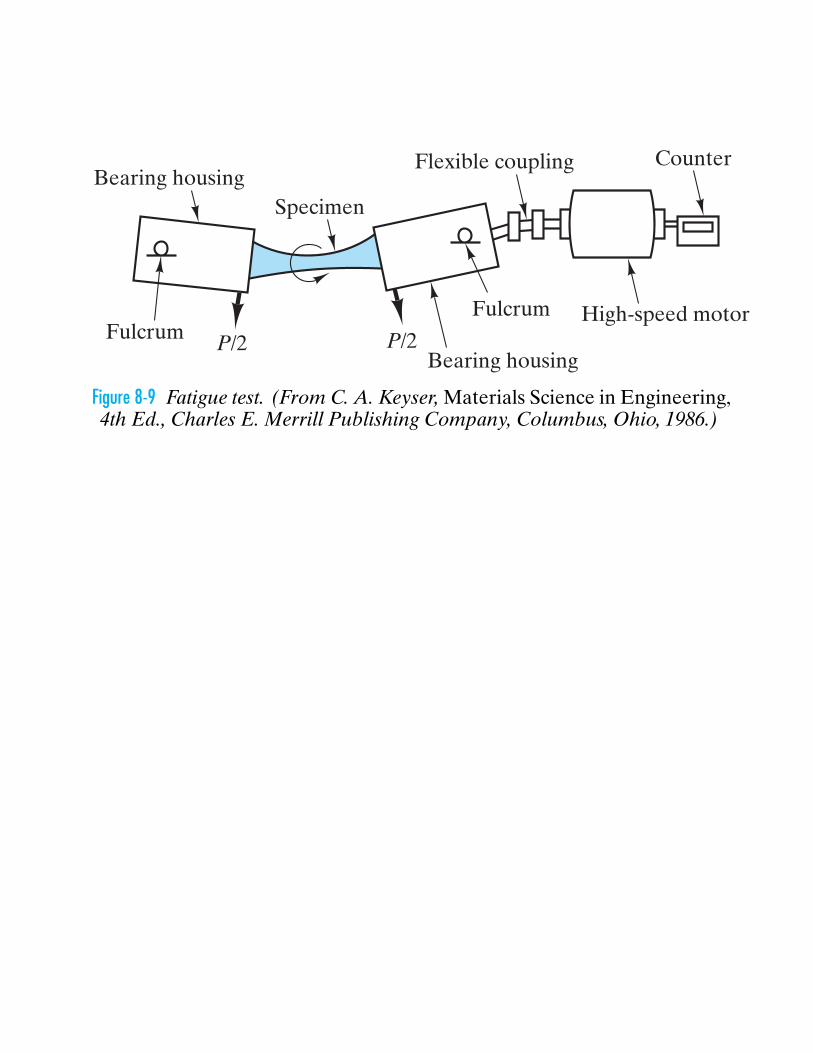
Bearing housing
Bearing housing
Flexible coupling Counter
High-speed motor
Specimen
FulcrumFulcrum
P/2 P/2
Figure 8-9 Fatigue test. (From C. A. Keyser, Materials Science in Engineering,4th Ed., Charles E. Merrill Publishing Company, Columbus, Ohio, 1986.)
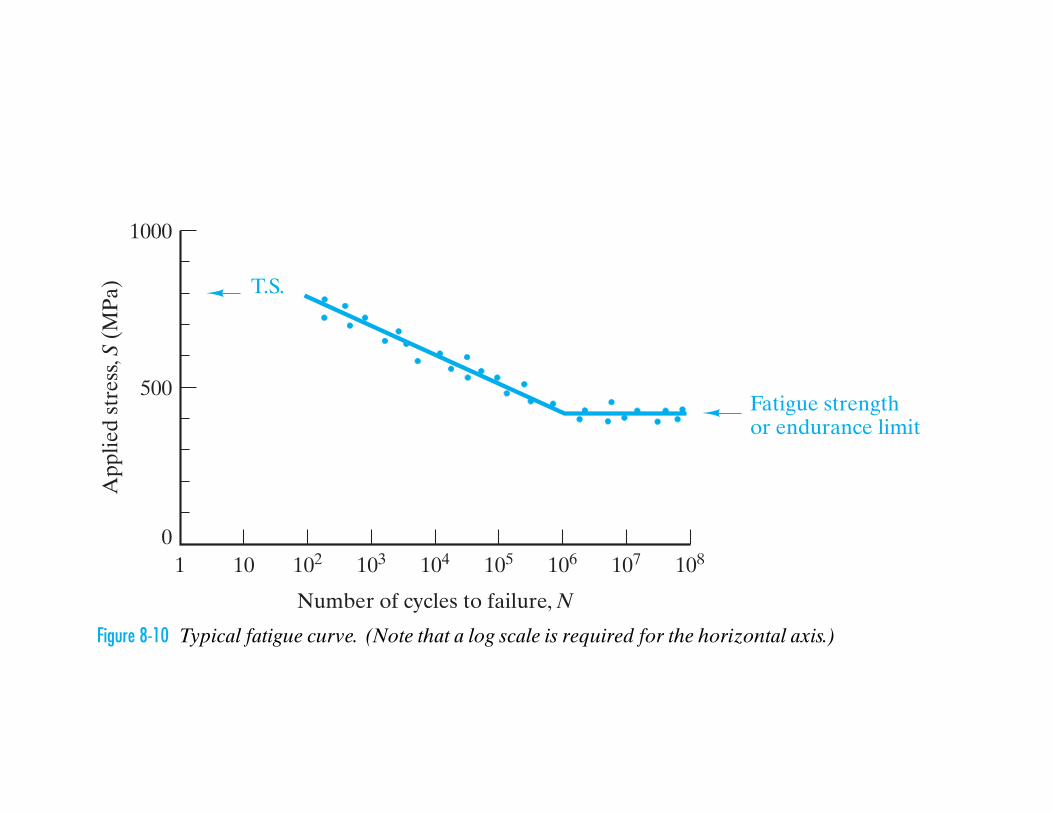
1000
500
T.S.
Fatigue strengthor endurance limit
01 102 104
Number of cycles to failure, N
App
lied
stre
ss, S
(M
Pa)
10 103 105 107106 108
Figure 8-10 Typical fatigue curve. (Note that a log scale is required for the horizontal axis.)
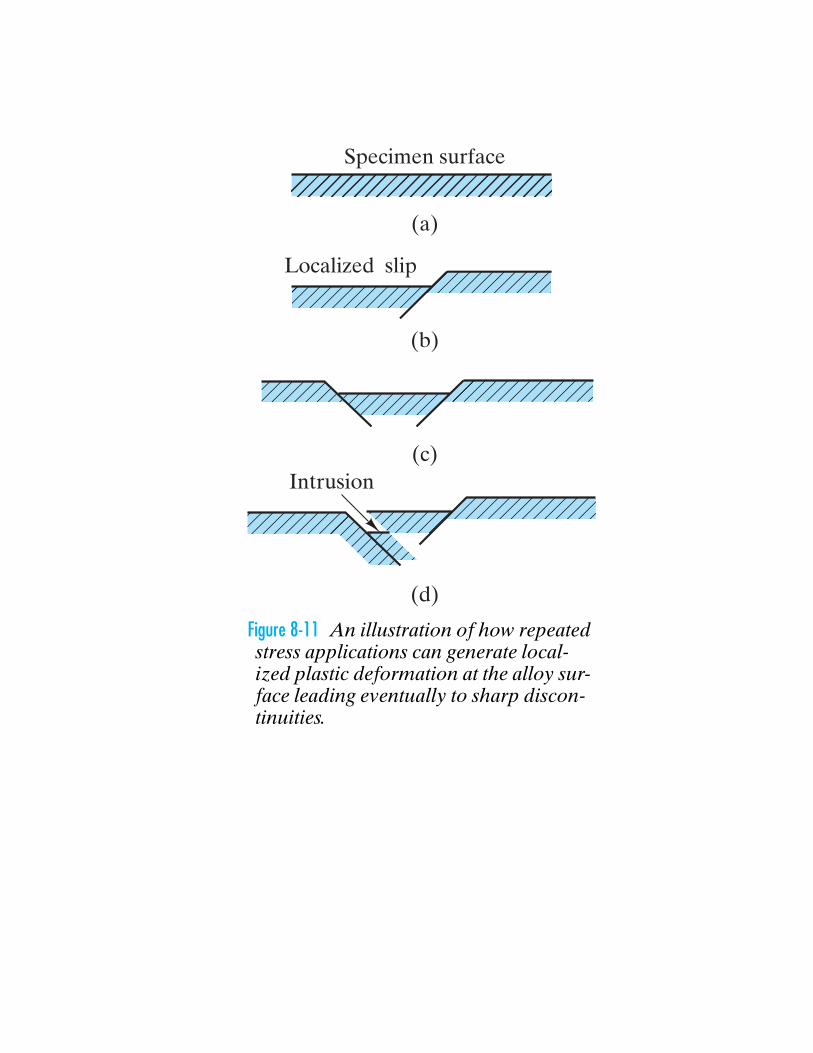
Specimen surface
Localized slip
Intrusion
(a)
(b)
(c)
(d)
Figure 8-11 An illustration of how repeatedstress applications can generate local-ized plastic deformation at the alloy sur-face leading eventually to sharp discon-tinuities.
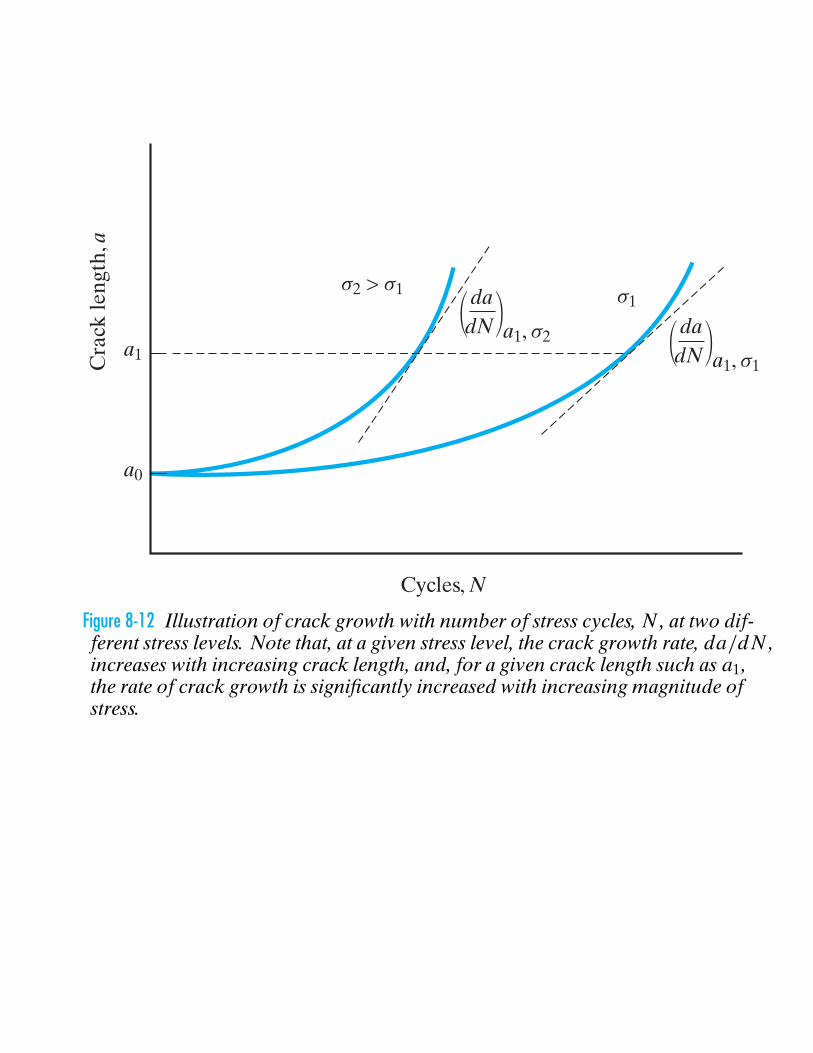
Cycles, N
Cra
ck le
ngth
, a
a1
a0
dadN 1 2 da
dN 1 2
Figure 8-12 Illustration of crack growth with number of stress cycles, N , at two dif-ferent stress levels. Note that, at a given stress level, the crack growth rate, da/dN ,increases with increasing crack length, and, for a given crack length such as a1,the rate of crack growth is significantly increased with increasing magnitude ofstress.
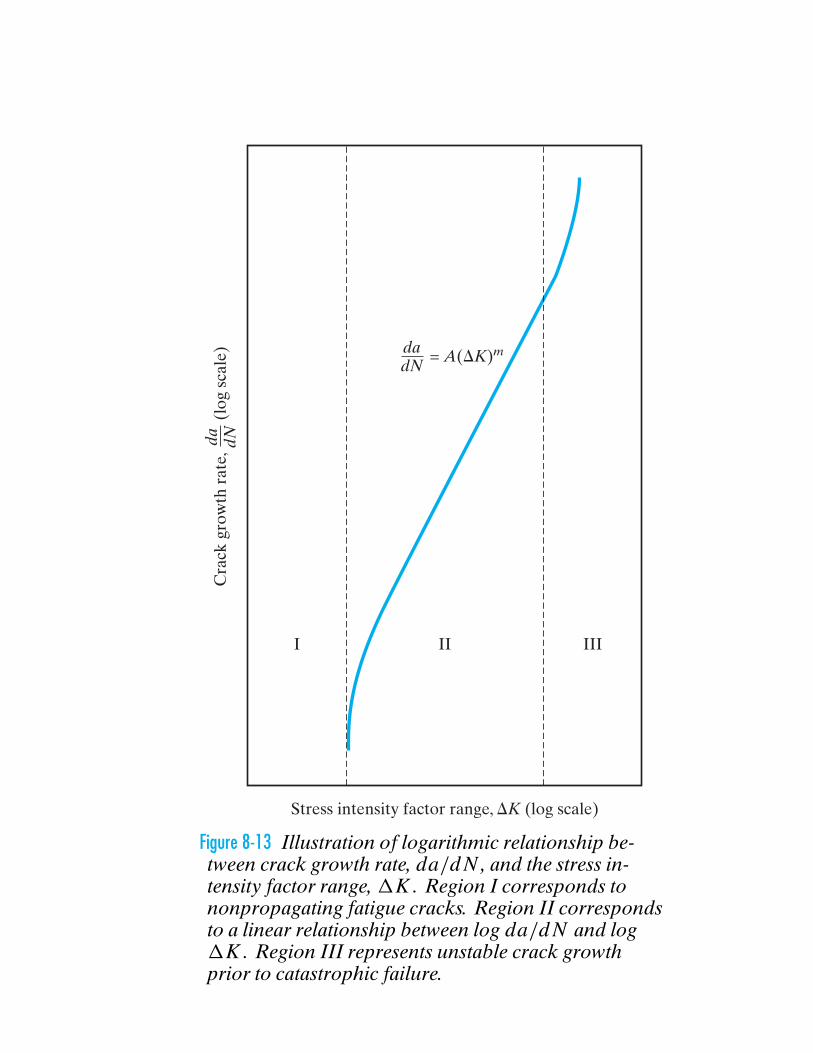
Stress intensity factor range, DK (log scale)
Cra
ck g
row
th r
ate,
(lo
g sc
ale)
da dN
= A(DK)mdadN
I II III
Figure 8-13 Illustration of logarithmic relationship be-tween crack growth rate, da/dN , and the stress in-tensity factor range, 1K . Region I corresponds tononpropagating fatigue cracks. Region II correspondsto a linear relationship between log da/dN and log1K . Region III represents unstable crack growthprior to catastrophic failure.
(a)
(b) (c)
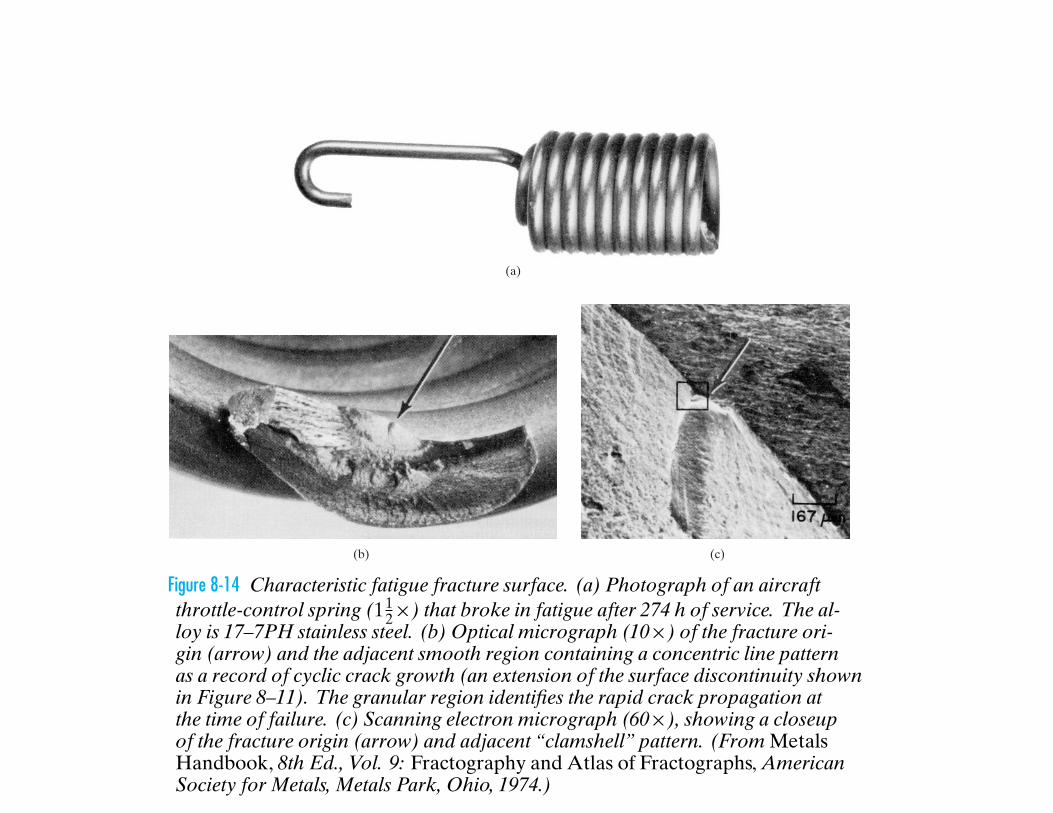
Figure 8-14 Characteristic fatigue fracture surface. (a) Photograph of an aircraftthrottle-control spring (11
2×) that broke in fatigue after 274 h of service. The al-loy is 17–7PH stainless steel. (b) Optical micrograph (10×) of the fracture ori-gin (arrow) and the adjacent smooth region containing a concentric line patternas a record of cyclic crack growth (an extension of the surface discontinuity shownin Figure 8–11). The granular region identifies the rapid crack propagation atthe time of failure. (c) Scanning electron micrograph (60×), showing a closeupof the fracture origin (arrow) and adjacent “clamshell” pattern. (From MetalsHandbook, 8th Ed., Vol. 9: Fractography and Atlas of Fractographs, AmericanSociety for Metals, Metals Park, Ohio, 1974.)
Pearlitic (80 – 55 – 06 as cast) unnotched
40
400
350
300
250
200
150
100
50104 105 106 107 108
20
Fatigue life, cycles
Fati
gue
stre
ngth
, MP
a
200
150
100
50
Fati
gue
stre
ngth
, MP
a
Fati
gue
stre
ngth
, ksi
26
22
18
14
10
Fati
gue
stre
ngth
, ksi
(a)
21 C (70 F)
65 C (150 F)
100 C (212 F)
107 108106
Stress cycles
(b)
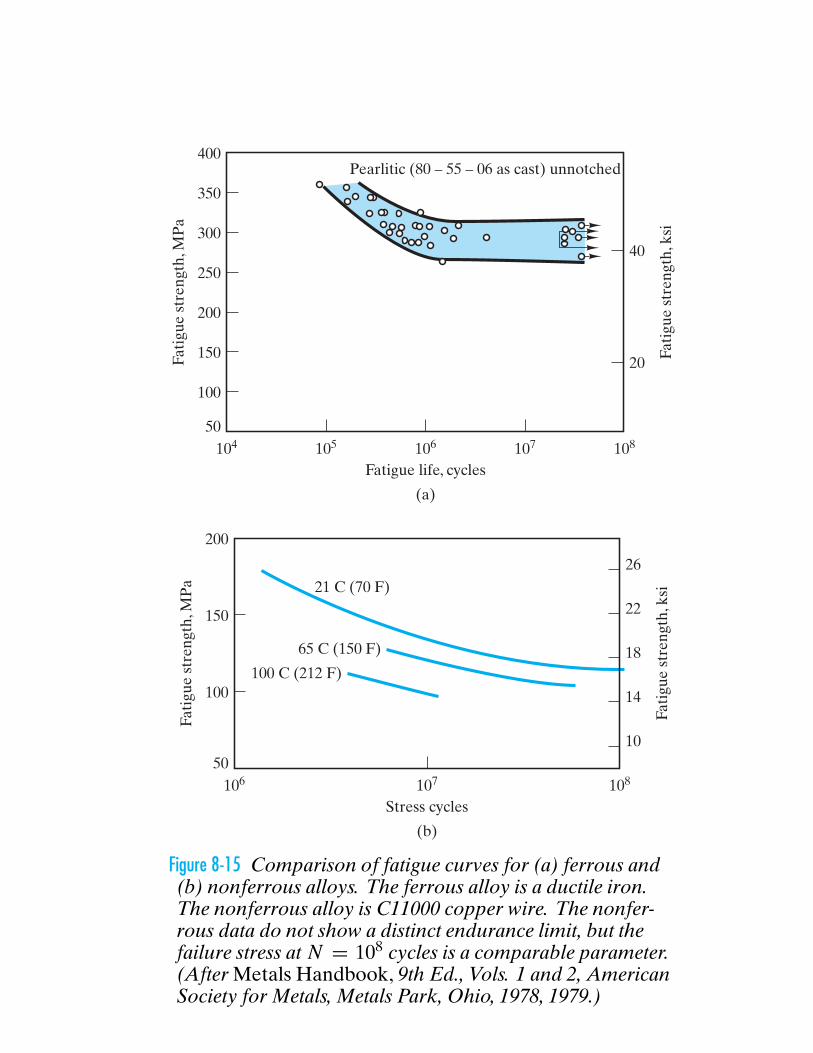
Figure 8-15 Comparison of fatigue curves for (a) ferrous and(b) nonferrous alloys. The ferrous alloy is a ductile iron.The nonferrous alloy is C11000 copper wire. The nonfer-rous data do not show a distinct endurance limit, but thefailure stress at N = 108 cycles is a comparable parameter.(After Metals Handbook, 9th Ed., Vols. 1 and 2, AmericanSociety for Metals, Metals Park, Ohio, 1978, 1979.)
500
00 500
Tensile strength, T.S. (MPa)
Fati
gue
stre
ngth
, F.S
. (M
Pa)
1000
F.S. = T.S.1
2
F.S. = T.S.1
4
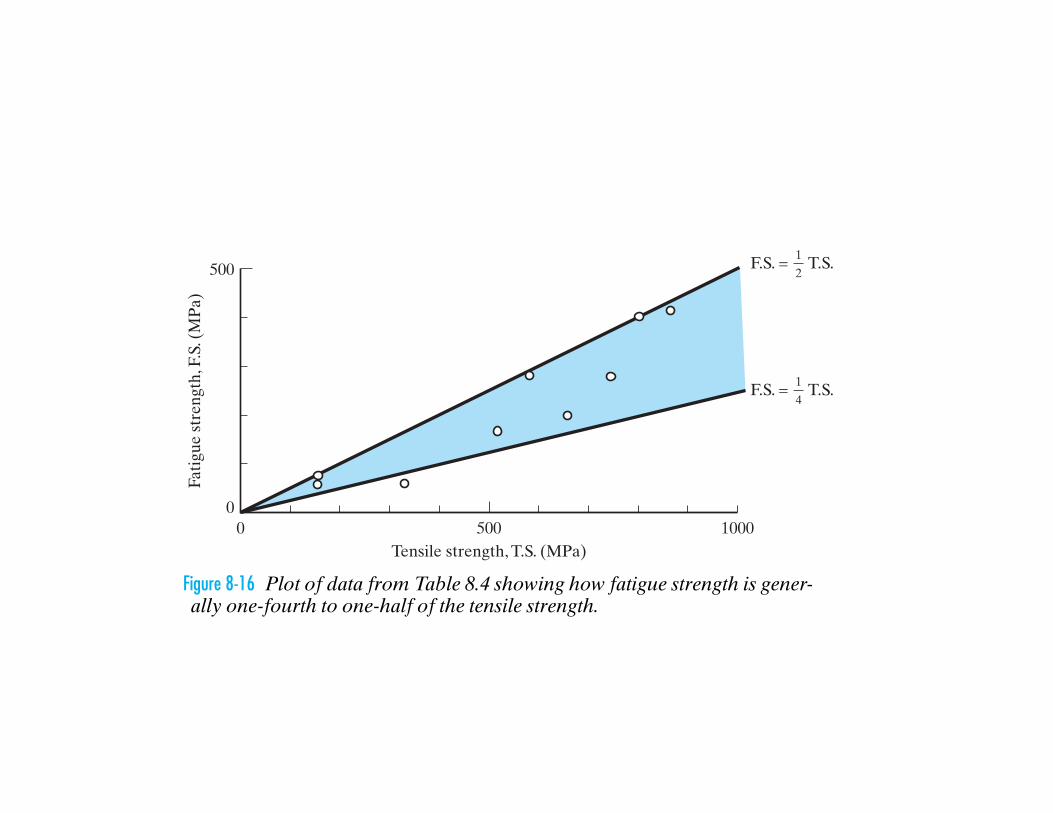
Figure 8-16 Plot of data from Table 8.4 showing how fatigue strength is gener-ally one-fourth to one-half of the tensile strength.
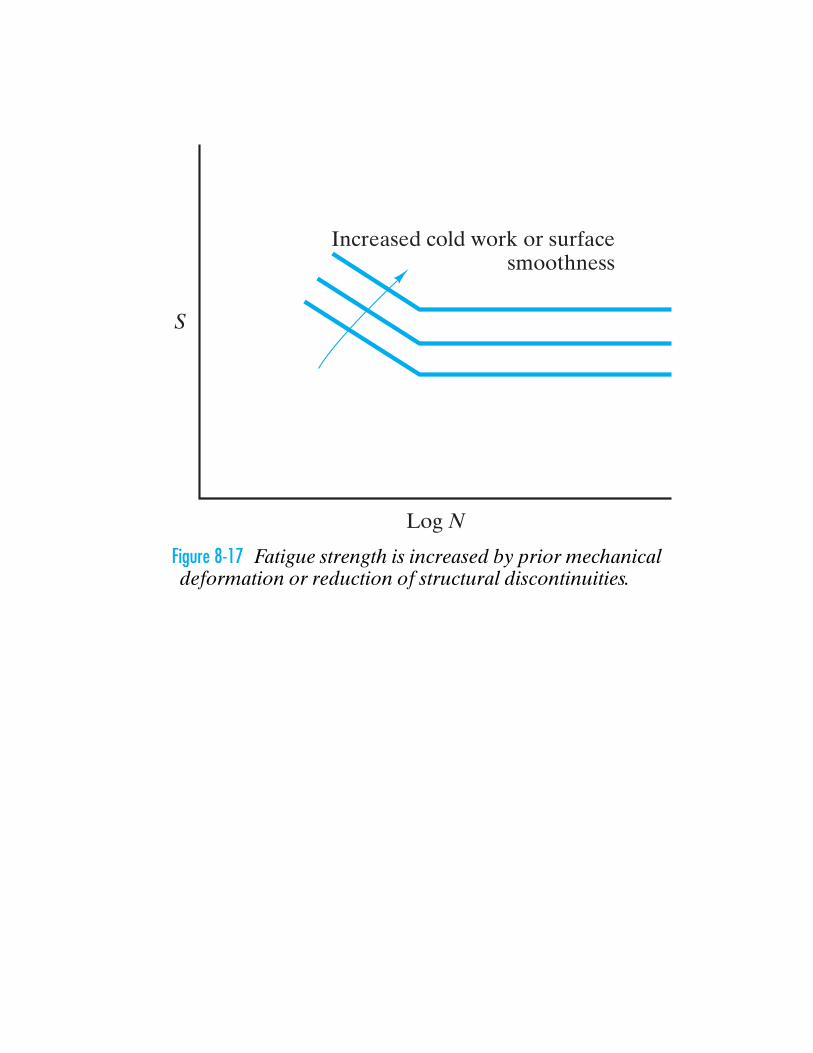
Increased cold work or surfacesmoothness
S
Log N
Figure 8-17 Fatigue strength is increased by prior mechanicaldeformation or reduction of structural discontinuities.
25,000
Fused silica glass (wet)
Soda-limesilica glass
(wet)
10–3 10–1 10Stress duration, sec.
Bre
akin
g st
ress
, psi
10–2 1 102 104103 105
20,000
15,000
10,000
5,000
0
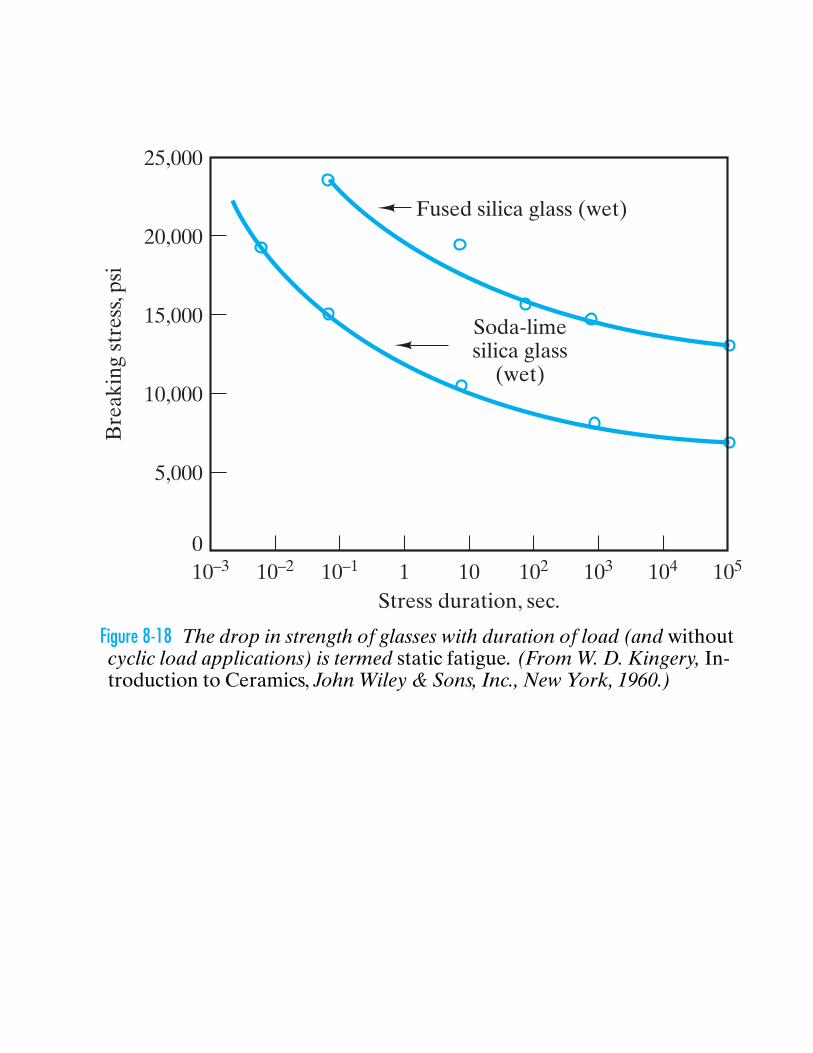
Figure 8-18 The drop in strength of glasses with duration of load (and withoutcyclic load applications) is termed static fatigue. (From W. D. Kingery, In-troduction to Ceramics, John Wiley & Sons, Inc., New York, 1960.)
O
O
+
Si
OHSi
Si
HO Si
H H
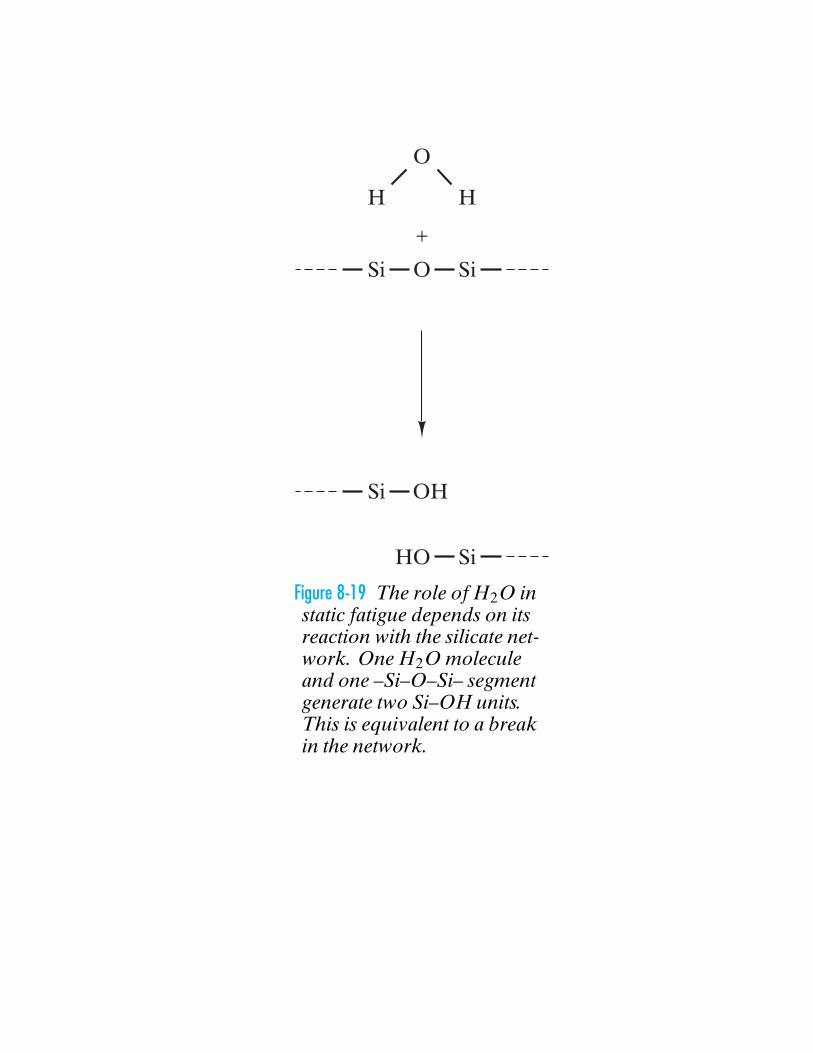
Figure 8-19 The role of H2O instatic fatigue depends on itsreaction with the silicate net-work. One H2O moleculeand one –Si–O–Si– segmentgenerate two Si–OH units.This is equivalent to a breakin the network.
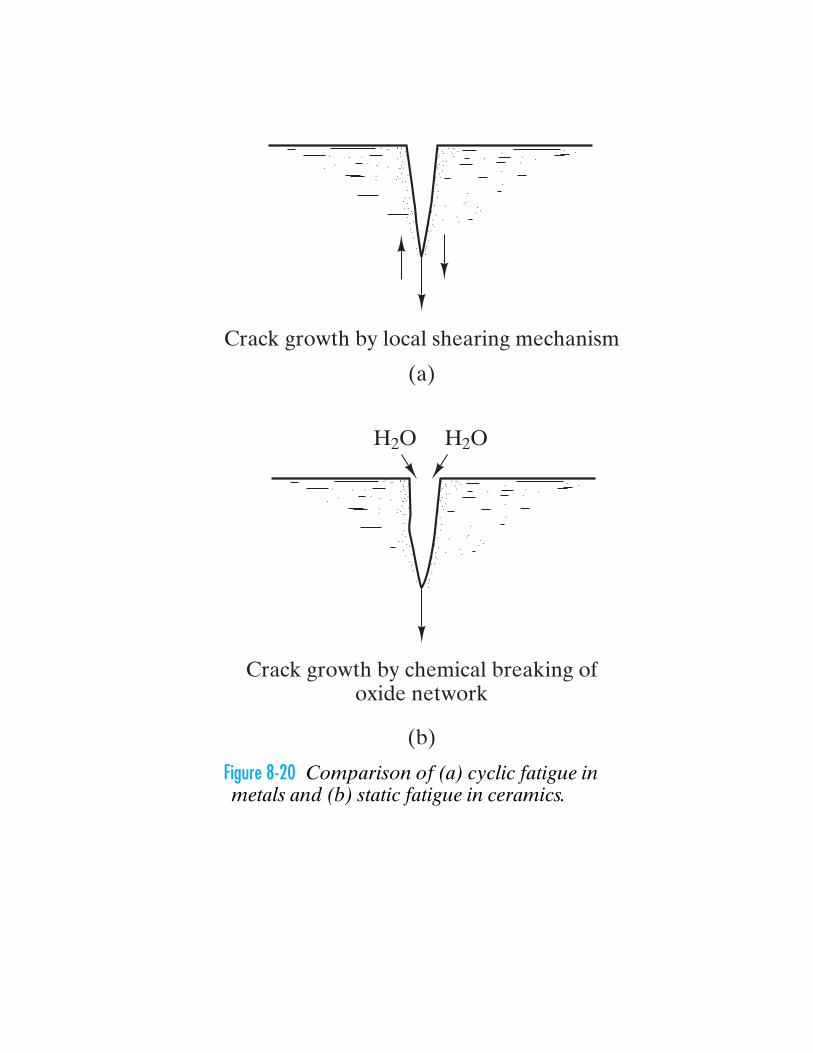
Crack growth by local shearing mechanism
(a)
H2O H2O
Crack growth by chemical breaking ofoxide network
(b)
Figure 8-20 Comparison of (a) cyclic fatigue inmetals and (b) static fatigue in ceramics.
601800 cycles per minute
23˚C(73˚F)
1
2
3
4
21˚C(73˚F)
66˚C(150˚F)
100˚C(212˚F)
50
40
30
20
10
0
8
7
6
5
4
3
2
1
0103 104 105
Cycles to failure
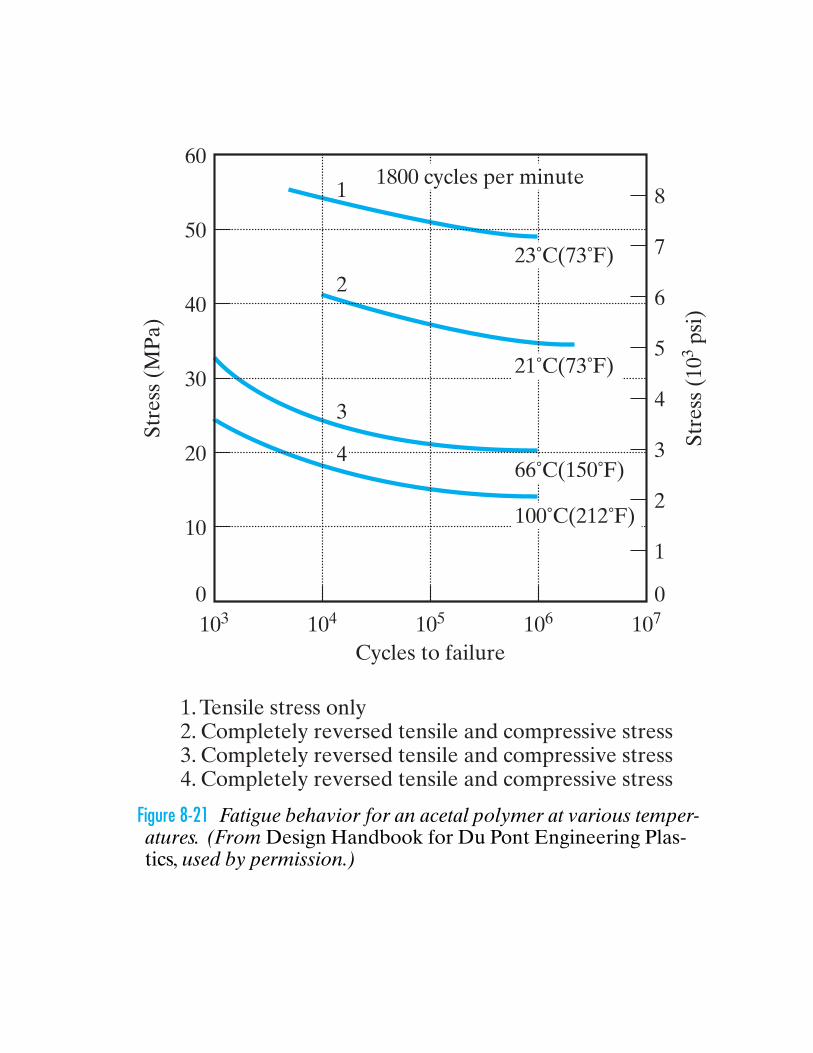
1. Tensile stress only2. Completely reversed tensile and compressive stress3. Completely reversed tensile and compressive stress4. Completely reversed tensile and compressive stress
106 107
Stre
ss (
MP
a)
Stre
ss (
103 p
si)
Figure 8-21 Fatigue behavior for an acetal polymer at various temper-atures. (From Design Handbook for Du Pont Engineering Plas-tics, used by permission.)
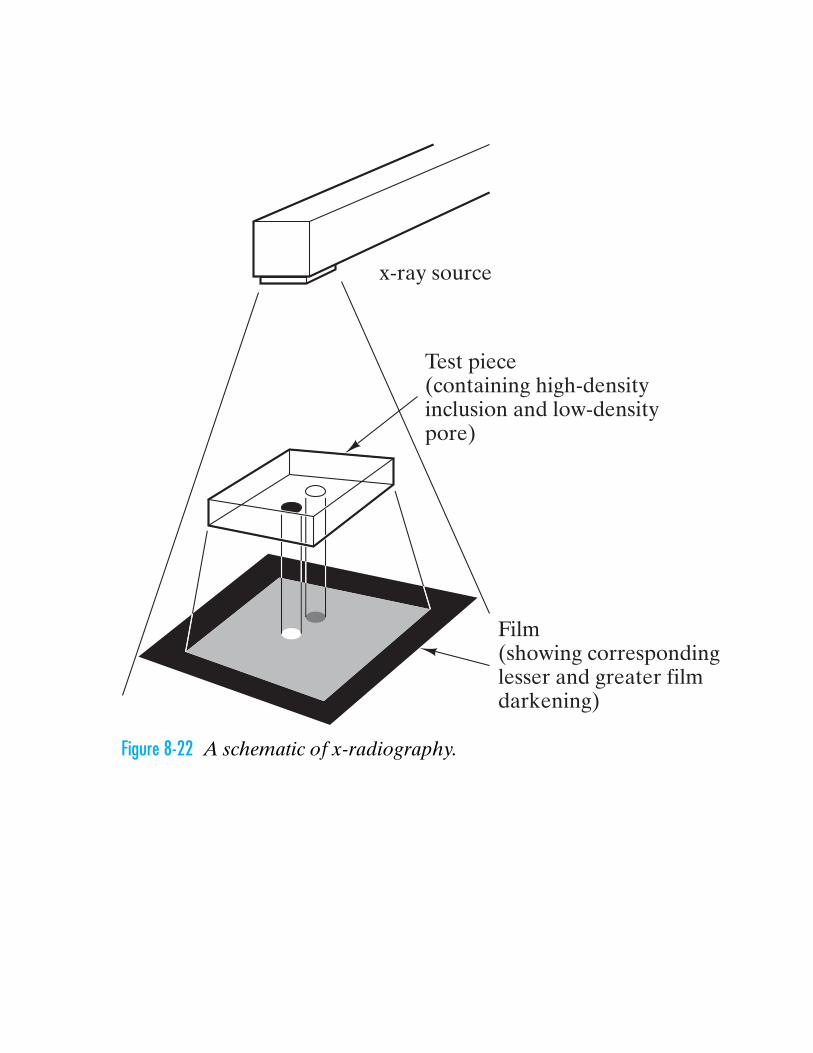
x-ray source
Test piece(containing high-densityinclusion and low-densitypore)
Film(showing correspondinglesser and greater filmdarkening)
Figure 8-22 A schematic of x-radiography.
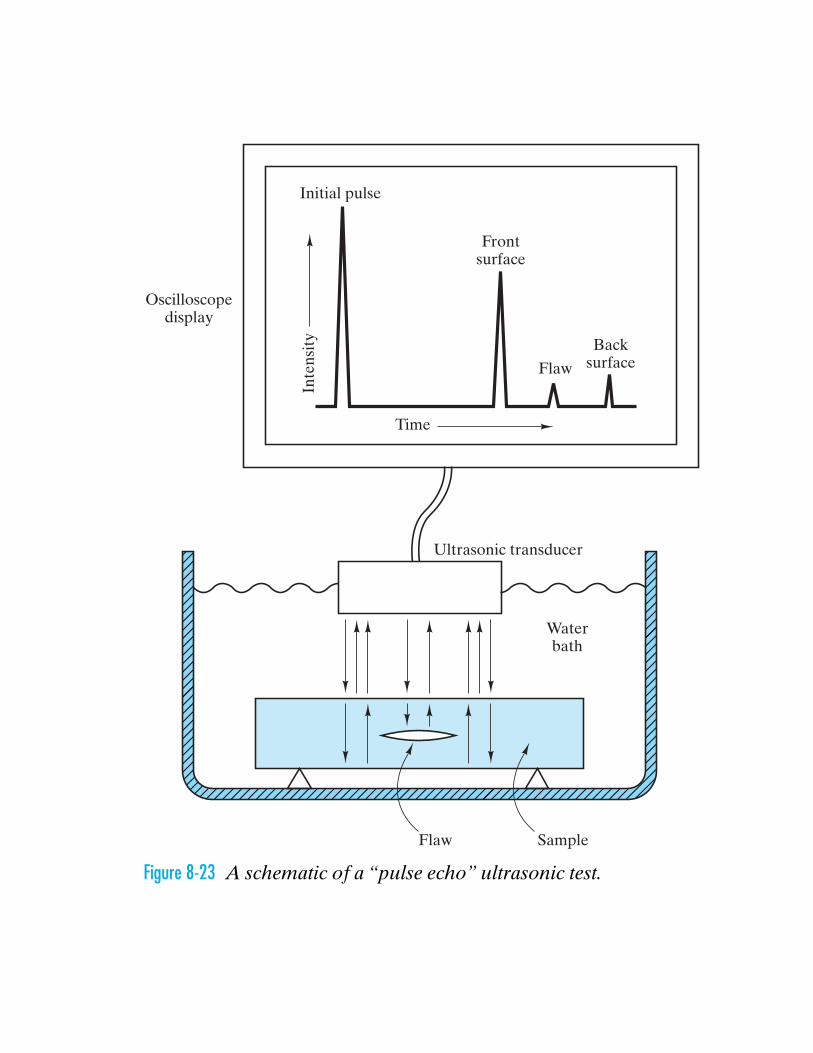
Waterbath
Frontsurface
Oscilloscopedisplay
Flaw
Backsurface
Flaw
Time
Inte
nsit
y
Sample
Ultrasonic transducer
Initial pulse
Figure 8-23 A schematic of a “pulse echo” ultrasonic test.
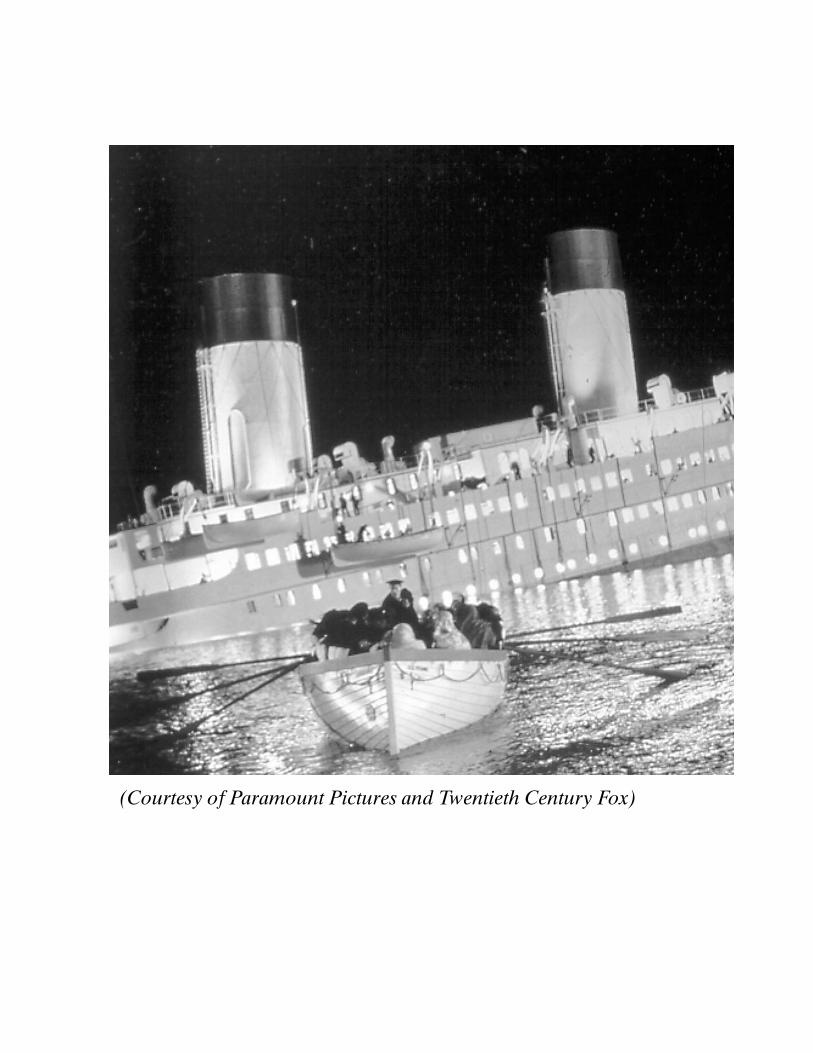
(Courtesy of Paramount Pictures and Twentieth Century Fox)

![Engineering Failure Analysis - ایران عرضهiranarze.ir/wp-content/uploads/2017/01/5995-English-IranArze.pdf · Engineering Failure Analysis 60 (2016) 96–106 ... [10], the](https://img.pdfslide.tips/doc/110x75/5a8767ac7f8b9ac96a8db4fa/engineering-failure-analysis-failure-analysis-60-2016-96106.jpg)


![Failure Analysis of Resist Pattern CollapseTalk- J ïb ÿÑæ]s](https://img.pdfslide.tips/doc/110x75/629b4a6eb28c061f5c5a4c0d/failure-analysis-of-resist-pattern-collapsetalk-j-b-s.jpg)