Embed Size (px)
Citation preview

““FFiirrmmss’’ iinnnnoovvaattiioonn aaccrroossss rreeggiioonnss:: aann eexxpplloorraattoorryy
ssttuuddyy””
AAnnaa PPaauullaa FFaarriiaa
NNaattáálliiaa BBaarrbboossaa
VVaassccoo EEiirriizz
NIPE WP 12/ 2013

““FFiirrmmss’’ iinnnnoovvaattiioonn aaccrroossss rreeggiioonnss:: aann eexxpplloorraattoorryy
ssttuuddyy””
AAnnaa PPaauullaa FFaarriiaa
NNaattáálliiaa BBaarrbboossaa
VVaassccoo EEiirriizz
NNIIPPEE** WWPP 1122// 22001133
URL: http://www.eeg.uminho.pt/economia/nipe

Firms’ innovation across regions: an exploratory
study
Ana Paula Faria§, Natália Barbosa§, Vasco Eiriz‡
§ Department of Economics, University of Minho, Campus de Gualtar, 4710-057
Braga,
‡ Department of Management, University of Minho, Campus de Gualtar, 4710-
057 Braga, Portugal
Abstract
This paper investigates the geographical distribution and concentration of firms’
innovation persistence and innovation type - product and process - based upon
three waves of the Community Innovation Survey data covering the period 1998-
2006. The main findings are: (i) both innovation persistence and innovation type
are asymmetrically distributed across Portuguese regions; (ii) the degree of
correlation between geographical location and innovative output varies with the
innovation type; and (iii); the correlation between geographical unit and innovation
increases when the spatial unit of analysis is narrower. Overall, results indicate
that firm’s choice of geographical location have a long-lasting effect, engendering
no equal probabilities of being persistently innovator.
JEL Code: O31, L25, R11
Keywords: product innovation, process innovation, persistence, location.

2
1. Introduction
Studies on the geographical distribution of innovation have substantially
documented that innovative activity and knowledge investments tend to be
highly agglomerated in some locations (e.g., Jaffe et al., 1993; Audretsch and
Feldman, 1996; Audretsch, 1998; Bottazi and Peri, 2003; Orlando, 2004;
Thompson and Fox-Kean, 2004; Thompson, 2006; Muscio, 2006). It has been
argued that co-location of firms (physical proximity) facilitate knowledge
exhange. This happens for both explicit and tacit knowledge, but the latter
travels badly and its returns can only be optimised through face-to-face
interations. Despite the vast number of studies arguing in favour of the existence
of knowledge spillovers bounded in space, there has been a growing criticism
with regard to the role of co-location on innovation (Torre and Gilly, 1999; Rallet
and Torre, 2000; Breschi and Lissoni, 2001; Boschma, 2005).
Conversely, geographical concentration of innovation might be caused by
dynamics within the creation of innovations itself. Innovations involve a
cumulative mechanism because people who generate an innovation are often in a
good position to use their technological advancement to create further
innovations (Lundvall, 1992; Morgan, 1997; Cooke, 2001). As such, if a firm’s or
region’s past investment in innovation affects its technical and organizational
capabilities, then those with lower current rates of innovation will find it harder
to invest in innovation in the future. As a consequence, knowledge is not equally
spread across individuals, firms, and geographical units of observation, such as
regions or countries. Moreover, there may not be convergence across regions (in

3
the context of regions, this problem has been termed the ‘regional innovation
paradox’ by Oughton et al., 2002).
There is some supporting evidence of a path-dependent effect at the regional
level. For instance, Cantwell and Piscitello (2005) found that locations that
accumulate a wide range of technological competences and develop potential for
inter-industry spillovers are more likely to attract R&D investments from
multinational firms. At the firm level, studies on firms’ innovation persistence
also show that past experience in innovation increases the likelihood of
innovating (Geroski et al., 1997; Cefis 2003; Roper and Hewitt-Dundas, 2008;
Peters, 2009; Raymond et al., 2010; Huergo and Moreno, 2011).
However, studies of firms’ innovation persistence across regions are, to our
knowledge, almost inexistent. The closest evidence on this topic is on
convergence/divergence across regions (Moreno et al., 2005; Drivera and
Oughton, 2008). However, they use regions as the unit of analysis, overlooking
what is happening at the firm-level within a region. Therefore, this paper
attempts to contribute to this topical issue by assessing whether firm-level
innovation activities are related to their location. More specifically we attempt to
identify empirical regularities relating firms’ innovation activities across
Portuguese regions and across different types of innovation.
Portugal provides a particularly interesting and useful case for building upon
the relationship between firm-level innovation activities and co-location of firms.
It is a developed country but, within the context of the European Union (EU), it
is a small, open and peripheral economy. These particular features might be
challenging to firm’s engaging in innovation activities that are based on
connections with international innovative networks. This is so because the

4
openness may guarantee the presence of considerable interactions with the
outside world but the peripheral position may refrain them, thus reinforcing the
role of geographical co-location. Moreover, EU membership and the creation of
the European single market triggered the need for a continuous and persistent
innovative focus of Portuguese firms as a way to overcome smallness and the
peripheral position.
Therefore, our aim is twofold. First, using survey data from the Community
Innovation Survey (CIS), we examine whether co-location of firms is able to foster
firm-level innovation, leading to significant regional asymmetries on firm’s
innovation output. Second, we analyze whether firms’ innovation persistence is
specific to some locations or evenly distributed. Existing evidence shows that only
a small number of firms tend to be persistent innovators and that these firms
generate a high-share of all innovative activities (Geroski et al., 1997; Cefis,
2003; Roper and Hewitt-Dundas, 2008; Peters, 2009; Raymond et al., 2010;
Huergo and Moreno, 2011). Thus, investigating firms’ innovation persistence
across regions may help us to understand firms’ innovation intensity differences
across regions.
The analysis of innovation persistence across regions and types of innovation
is important because if persistence and type of innovation are somehow
associated with location then public policy should take it into account as there
might be different input factors in the innovation production function of each
type of innovation. Also, if persistent innovators strongly rely upon spillover
effects and geographical proximity, then differences across regions are likely to
persist across time and space in a path-dependent way.

5
The remainder of the paper is organized as follow. The second section reviews
the theoretical arguments put forward to explain the agglomeration of innovation
activities, the arguments against co-location and the recent empirical evidence
sustaining these arguments. The third section reports the data and the empirical
findings. The final section provides the concluding remarks and it indicates an
agenda for future research.
2. Firms’ innovation activities and location
In seeking to understand how geographical location affects innovation, a large
number of studies have stressed the importance of region-specific characteristics
as key drivers of innovation (e.g., Jaffe et al., 1993; Audretsch and Feldman,
1996; Almeida and Kogut, 1997; 1999; Orlando, 2004; Funke and Niebuhr, 2005;
Asheim et al., 2011; Brenner and Broekel, 2011). According to this literature the
agglomeration of innovation activities is largely explained by region-specific
characteristics that promote knowledge spillovers, attract tacit knowledge and
innovation activities, and make firms more or less productive in their innovation
activities. Physical proximity is seen as a necessary condition to knowledge
exchange when face-to-face contact is needed. It is also a pre-requisite for
interactive learning and innovation (see e.g. Howells (2002), Morgan (2004),
Aydogana and Lyon (2004), Asheim et al. (2011)).
The geographical dimension of innovation is due to both knowledge spillovers
and tacit knowledge, which are perceived as important sources of firms’
innovation and are seen as geographically bounded. Tacit knowledge is difficult
to exchange over long distances making spillovers limited in space. Moreover,
knowledge arises from the social and institutional context in which is produced

6
which makes social interaction a necessary condition to the production and
diffusion of knowledge (Howells, 2002; Morgan, 2004; Aydogana and Lyon, 2004;
Asheim et al., 2010).
Yet there is increasing awareness that this view tends to overemphasize the
role of spillovers and co-location in the transfer of knowledge between firms and,
hence, in innovation activities and output (Torre and Gilly, 1999; Rallet and
Torre, 2000; Breschi and Lissoni, 2001; Boschma, 2005). In some cases knowledge
is shared on-request or intentionally, thus the knowledge spillover concept has
been used to describe other mechanisms of knowledge transfer that have been
market-mediated. For instance, firms strategically use R&D alliances as a means
to limit knowledge flows and protect competences, rather than to promote
knowledge flows (Narula and Santangelo, 2009). Also other studies have been
able to identify and measure the role of other knowledge transmission
mechanisms besides spillovers, such as social capital (Tappeiner et al., 2008;
Akçomak and Weel, 2009; Fitjar and Rodríguez-Pose, 2011), workers mobility
(Almeida and Kogutt, 1999; Filatotchev et al., 2011) networks and collaboration
(Narula and Santangelo, 2009; Fitjar and Rodríguez-Pose, 2011). In most of those
cases, knowledge flows is the result of a conscious and often costly attempt made
by firms in order to generate greater innovation and reap economic benefits.
On the other hand, knowledge spillovers are being mistaken by other benefits
of agglomeration, such as natural advantages or shared intermediate inputs, that
is, pecuniary externalities. Various studies aimed at investigating whether the
apparent geographic localization of spillovers from industrial R&D may be an
artifact of other agglomerative forces. This evidence is mixed. Some evidence
finds that intraregional spillovers are significant and that physical distance also

7
matters, implying that spillovers decay gradually as regions become farther
apart (Duranton and Puga, 2001; Orlando, 2004; Greenstone et al., 2010;
Lychagin et al., 2010), while an emerging literature suggests that technological
spillovers and demographics are not the main contributing cause of the higher
performance observed for firms located within geographic clusters (Smith et al.,
2002; Boschma and Wal, 2007; Glaeser and Kerr, 2009).
In line with this last evidence, some authors have argued that physical
proximity may not be a necessary condition for knowledge exchange, as other
types of proximity, such as cultural proximity (Zeller 2002), organizational and
relational proximity (Torre and Gilly, 1999; Torre and Rallet, 2005; Boschma,
2005; Oerlemans and Meeus, 2005), might provide the advantages of physical
proximity to firms’ innovation activities. The extent of knowledge transfer is
shown not to depend exclusively on physical proximity but also on firms’
capabilities, absorptive capacity and their ability to renew capabilities over time
(Boschma and Wal, 2007).
For instance, Zucker et al. (1998) found that the concentration of startups in
the biotechnology industry in the U.S.A. is more the result of a preference of
scientists to locate near their home university rather than the result of social ties
and meetings between local firms and scientists. Other studies have found that
clustering alone is not conducive to higher innovative performance (Beaudry and
Breschi, 2003; Boschma and Wal, 2007; Tappeiner et al., 2008; Gilbert et al.,
2008), providing evidence in favoring of the view that firm-specific characteristics
may be more important for innovation output than firm’s location, and that
region-specific factors may impact differently on firm’s innovation output.

8
Recently, Fitjar and Rodríguez-Pose (2011) found that innovation in
southwest of Norway does not stem from agglomeration and physical proximity,
but from other types of proximity, such as cognitive and organizational
proximity, rooted in soft institutional arrangements. They argue that the
formation of regional hubs with strong connections to international innovative
networks may be a way to overcome peripherally in order to innovate.
This mixed evidence and theoretical arguments on the role of firm’s co-
location on firm-level innovation emphasize the opportunity, usefulness and
relevance in researching this topic in Portugal.
3. Empirical analysis
3.1 The dataset
In order to investigate the geographical distribution of innovation output and
persistence across different types of innovation, we observed firms over three
waves of the Portuguese Community Innovation Survey, covering the time period
from 1998 to 2006. The surveys that were used in the analysis are: CIS3 (1998-
2000), CIS4 (2002-2004) and CIS6 (2004-2006).
The CIS provides information on firms’ innovation activities, like the different
types of innovation, the sources of innovation, the effects of innovation and it
follows the OECD recommendations published in the Oslo Manual
(OECD/Eurostat, 2005). The CIS data has been widely used and the validity of
its innovative indicators recognized (see e.g. Kleinknecht et al. (2002), Mairesse
and Mohnen (2002)). In a comparative analysis of innovative indicators,

9
Kleinknecht et al. (2002) showed that the CIS indicators measure innovation
input and output more comprehensively and more directly than earlier measures.
The surveys are representative of the Portuguese manufacturing and service
industries, hence can be considered globally valid for the manufacturing and
services population. Firms with 10 or more employees were sampled randomly by
industry and size strata. There are three size-classes: 10–49 employees, 50–249
employees, and 250 or more employees. The industrial stratification is by NACE
codes at the 2-digit level. When a stratum size was too small for sampling, a
census was done within the specific stratum. The data regarding innovation
activities is made up of retrospective answers that cover the three years
preceding the survey.
Due to data protection reasons we were not allowed to access data on the
location of the firms sampled in the CIS4 and CIS6 surveys. Thus we had to
restrict our analysis to the firms that were sampled in the CIS3 survey and
showed up in the following surveys. Our final sample comprises 788 firms from
both manufacturing and services which we followed over the period 1998-2006.
In order to investigate the geographical distribution of innovating firms
across types of innovation we followed the distinction made clear on the
questionnaire. That is, product innovation was assumed to have taken place
when the firm declared it had introduced completely new products or services
with important modifications, products with new functions resulting from
innovation, or had made changes to the design, presentation, materials or
composition of the product, while process innovation was assumed to have
happened when the firm indicated it had introduced some significant
modification in the production process. This modification may involve the

10
introduction of new machines or new methods of organization, or the introduction
of both.
As such, our innovation indicator is an output indicator that takes into
account innovation activities that have been introduced in the market over the
previous three years. As for the geographical break up, we followed the
classification provided by EUROSTAT through NUTS (Nomenclature des Unités
Territoriales Statistiques) at the 2-and 3-digit level. Based on this information
we constructed our innovation indicators. Previous studies on innovation tend to
use R&D expenditures or patents as a proxy for innovation. Yet, it has been
argued that R&D expenditures and patents may not be the most adequate
indicators to study persistence, since R&D expenditures only relate to input
effort and persistence in patenting amounts to persistence in winning the patent
race. Thus we overcome these limitations by using as innovation indicator the
actual introduction in the market or by the firm of a product or process
innovation.
3.2 Geographical distribution and concentration of firms’
innovation activities
Our aim is to evaluate whether there are noteworthy regional asymmetries on
firms’ innovative output. Thus we seek to answer the following questions: Does
the geographical distribution of firms’ innovation persistence and innovation type
differs across Portuguese regions? Do we observe a relationship between the
geographical unit, and innovation type and innovation persistence?
3.2.1 Distribution pattern of firms’ innovation activities

11
In order to answer these questions we computed the geographical distribution
of innovative firms at the NUTS2 and NUTS3 aggregation level, respectively,
over the period 1998-2006, and its breakup by innovation type – product and
process - and persistence. For all cases, statistical tests were performed to assess
whether there is a statistically significant different distribution of innovation
activity across regions and whether there is a statistically significant association
between location and firms’ innovation output.
As shown in Table 1, the percentage of innovative firms, around of 43% of
sampled firms, has remained stable over the period 1998-2006. However, when
looking at the data across NUTS2 regions, we observe some differences in the
evolution of the regional distribution of innovative firms. For instance, whereas
Alentejo, Centro and Norte regions account for an increase in the percentage of
innovative firms over time, the Lisboa and Algarve regions report an opposite
evolution, suggesting that region-specific characteristics have an impact on firm’s
ability and effectiveness of their innovation activities.
[Table 1 here]
The statistical tests Pearson Chi2, the Likelihood-ratio Chi2 and Levene’s F
statistic confirm that the distribution of innovation intensity differs across
NUTS2 regions and the Cramer’s V coefficient confirms that there is a
statistically significant association between innovation output and the location in
which innovation takes place, suggesting that firms’ location may have power to
explain firms’ innovation output. In the following waves only the Levene’s F
statistic indicates that the variability of firms’ innovation output across regions is
significantly heterogeneous but we do not observe a strong association between

12
innovation and location given the low values of the Cramer’s V statistic. This
result could be interpreted as indicating that knowledge spillovers between
regions may occur over time and yield positive effects on firm’s innovation
activities, regardless its location.
Looking at product innovation and process innovation, we observe that
Portuguese firms do more process innovation than product innovation. The
distributional pattern is consistent across regions, regardless the geographical
aggregation level, indicating that Portuguese firms are using innovation process
as a means to increase production. A similar result has been found by Hall et al.
(2009) in Italian firms. In both cases, that empirical regularity may be explained
by the predominance of low- and medium-technology industries, which tend to
focus on process innovations to a considerable greater extent than other
industries (Heidenreich, 2009).
Worth noting is that we observe statistically significant differences in the
distribution of product innovation across regions as well as a statistically
significant association between product innovation intensity and the firms’
region. Moreover, there are interesting differences in firms’ innovation type over
time and across regions. The Centro and Lisboa regions exhibit a downward
trend on the percentage of firms introducing product innovations, while in the
other regions it is not possible to identify a clear trend. Regarding process
innovation we observe that the Norte region is the only one showing an
unambiguous and increase in percentage of firms introducing this type of
innovation. In brief, the data suggest that initial differences in the distribution of
innovation type across regions as well as the strength of the association between
innovation type and NUTS2 regions have decreased over time.

13
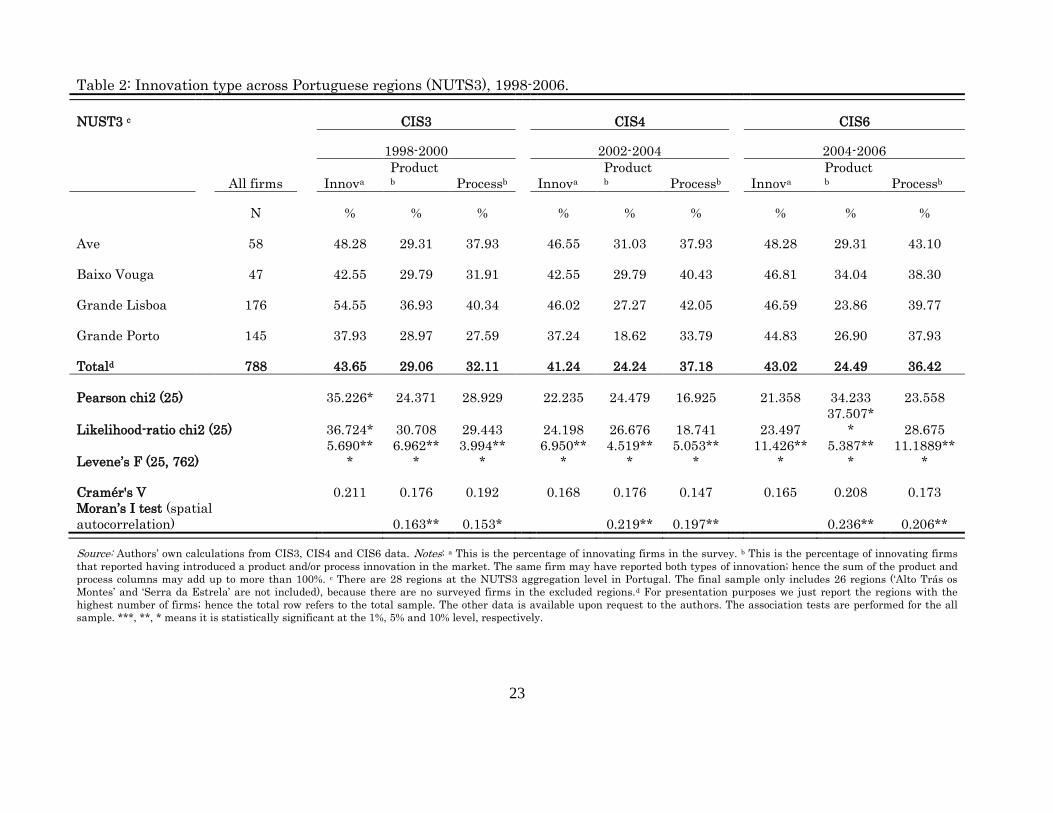
Looking at NUTS3 regions, the most relevant change emerging from the data
is the increase in the value of the Cramer’s V statistic throughout the entire
sample period, providing evidence for a clear association between geographical
location and innovation, a result that is also valid even when we break up the
data by innovation type. In this case, the association is stronger with product
innovation than with process innovation. Third, the statistically significant value
of Levene’s F statistic provides statistical evidence of heterogeneous variability
on firms’ innovation intensity and innovation type across regions. The increase in
the association between innovation and location is consistent with previous
evidence as a narrower definition of space is considered (Aharonson et al., 2008).
[Table 2 here]
Specifically, Grande Lisboa, a metropolitan region, reports a decreasing
percentage of innovative firms, which seems to cast doubt on the hypothesis of
the importance of geographic proximity to metropolitan centers to innovative
activities. However, the other important Portuguese metropolitan region -
Grande Porto - reports positive evolution on the percentage of innovative firms.
This result was mainly driven by the positive evolution on the percentage of
firms that have introduced process innovation, while in the case of Grande
Lisboa the downward evolution was driven by the evolution on the percentage of
firms that have introduced product innovation. Therefore, location appears to
matter to firms’ innovative activities, as regions differ on the factors that have an
impact on firm’s innovation activities and performance.
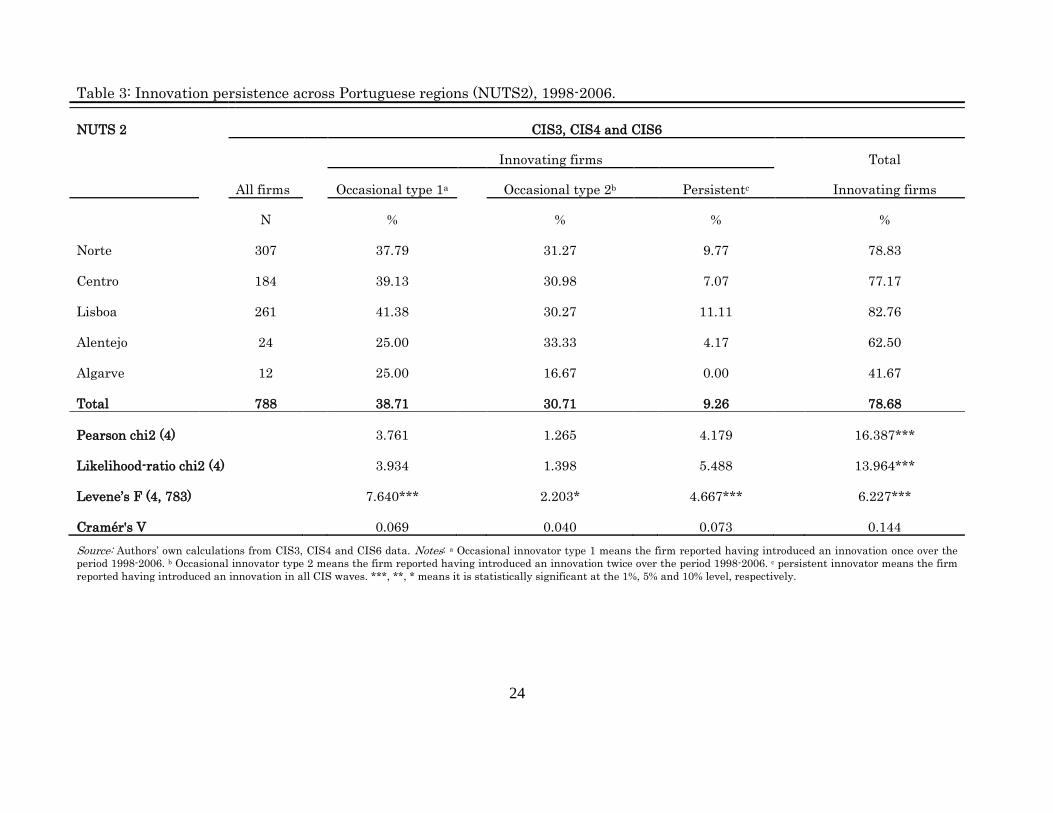
Regarding innovation persistence, Table 3 reveals that only a small
percentage of firms are persistent innovators (9.26%), which is in line with
previous evidence (Geroski et al., 1997; Cefis, 2003; Roper and Hewitt-Dundas,

14
2008; Raymond et al., 2010; Huergo and Moreno, 2011). Likewise, the percentage
of occasional innovator type 1 firms - those that introduced an innovation once -
is larger than the percentage of occasional innovator type 2, 38.71% and 30.71%
respectively.
[Table 3 and Table 4 here]
Looking at the distribution of persistent innovators across regions we observe
some differences across regions. Specifically, at NUTS2 level, Lisboa has the
highest percentage of persistent innovators (11.11%), whereas Algarve has none
(see Table 3). Yet, only one statistical test (Levene’s F) confirms these differences
across regions as being statistically significant, irrespectively the geographical
aggregation level considered.
When narrower regions are considered (see Table 4), there is a statistically
significant relationship between innovation persistence and location. Whereas
the Cramer’s V statistic does not reveal a relevant association between
innovation persistence and location at NUTS2 level, it discloses some strength in
the association between these variables. These findings suggest that the degree
of physical proximity, evaluated here through the definition of narrower regions,
has an association with differences on firms’ persistent innovative behavior. This
finding is further confirmed through the Moran I test for spatial dependence (see
last row in Table 4). The analysis of spatial dependence shows a strong positive
spatial autocorrelation for the innovation persistence, regardless the firm’s type.
This outcome suggests that there is a spatial clustering of innovating firms,
which can be interpreted as given support of the view that local learning and
knowledge spillovers are important channels for generating innovative firms.

15
Nonetheless, the strength of the relationship between location and innovation
type is stronger than between location and persistence, which suggests that
region-specific factors is more likely to have power to explain the pattern of firms’
innovation type than to explain the regional pattern of innovation persistence.
3.2.2 Geographical concentration of innovating firms
If co-location of firms has to have impact on firms’ innovation activities,
the geographical concentration ratio, which describes the proportion of high
ranking regions in terms of innovation activities, should reflect it. Comparing
data in Table 5, in general, the geographical concentration ratio of innovating
firms is higher than the spatial concentration ratio of Portuguese firms,
suggesting that the distribution of innovating firms is more uneven than the
distribution of firms.
[Table 5 here]
Looking at product or process innovation over the three CIS waves, the
differences on geographical concentration ratio are not so noticeable suggesting
that concentration on innovation activities follows strictly concentration on firms’
locational choices. However, looking at innovation persistence, another
interesting and promising outcome emerges. The biggest impact of co-location
appears to be on innovation persistence. The four high-ranking regions account
for 67.1% of innovating firms that reported having introduced an innovation in
all CIS waves (1998-2006). Overall, this seems to imply that firms have no equal
probabilities of being persistently innovators, given their previous choice of
geographical location. Moreover, this appears to corroborate the argument that

16
there is some sort of dynamics within the creation of innovation itself (see, e.g.,
Cooke, 2001), leading to a divergent innovative path across firms and regions.
4. Conclusions
The aim of this paper was to provide empirical evidence on firms’ innovative
activity by disclosing regularities in the distribution and concentration of
innovation activity across Portuguese regions. Using survey data, we contributed
to the recent and still scarce literature that investigates innovation by employing
novel quantitative indicators of innovative output at firm-level.
Consistent with previous evidence (e.g. Hall et al. (2009)), our data show that
innovating firms are more likely to perform process innovation rather than
product innovation, which suggests that Portuguese firms appear to be
particularly concerned with efficiency gains. Also, a low rate of firms can be
classified as persistent innovators.
When looking at the spatial distribution of innovating firms over time we
observe a change in innovation intensity across regions and a movement towards
convergence, which has been observed by others (Moreno et al., 2005; Driver and
Oughton, 2008). Additionally, when looking at the spatial distribution of firms by
innovation type and persistent behaviour we find statistical support for both
differences across regions in the distributions, and an association relationship
between location and innovation. These results are stronger or in some cases only
present when a narrower definition of region is considered, which is also
consistent with previous evidence regarding the association between location and
innovation activities measured by R&D expenses or patents (Aharonson et al.,
2008).

17
We have also found some evidence for differences in the degree of correlation
between location and innovation type. Specifically, the statistical tests show that
this association is stronger and statistically significant in product innovation but
not in process innovation. This result suggests that different types of innovation
may have different determinants which are specific to location. One possible
explanation could be the McCann’s (2007) hypothesis that different types of
innovation require different face-to-face contacts, an argument also sustained by
Shearmur and Doloreux (2009).
These explorative findings are promising and provide motivation for future
research. One possible extension of this research would be to assess which
region-specific factors have power to explain firms’ innovation activities and
effectiveness. Another potentially fruitful extension would be to attempt to
investigate the role of region-specific factors on determining different types of
firms’ innovative output as well as innovation persistence.
References
Aharonson, B., Baum, J. and Plunket, A. (2008). Inventive and uninventive
clusters: The case of Canadian biotechnology, Research Policy, 37, pp. 1108-1131.
Akçomak, I. and Weel, B. (2009). Social capital, innovation and growth: Evidence
from Europe, European Economic Review, 53, pp. 544-567.
Almeida, P. and B. Kogut (1997). The Exploration of Technological Diversity and
the Geographic Localisation of Innovation, Small Business Economics, pp. 9, 21-
31.
Almeida, P. and B. Kogut (1999). Localisation of Knowledge and the Mobility of
Engineers in Regional Networks, Management Science, 45, pp. 905-917.
Asheim, B., Smith, H. and Oughton, C. (2011). Regional Innovation Systems:
Theory, Empirics and Policy, Regional Studies, 45(7), pp. 875-891.
Audretsch, D. and Feldman, M. (1996). R&D Spillovers and the Geography of
Innovation and Production, The American Economic Review, 86(3), pp. 630-640.

18
Audretsch, D. B. (1998), ‘Agglomeration and the Location of Innovative Activity,’
Oxford Review of Economic Policy, 14(2), 18-29.
Aydogana, N., and Lyon, T. (2004). Spatial proximity and complementarities in
the trading of tacit knowledge, International Journal of Industrial Organization
22, pp. 1115-1135.
Beaudry, C. and Breschi, S. (2003). Are firms in clusters really more innovative?,
Economics of Innovation and New Technology, 12(4),pp. 325-342.
Boschma, R. 2005. Proximity and innovation: a critical assessment, Regional Studies, 39(1), pp. 61-74.
Boschma, R. and Wal, A. (2007). Knowledge Networks and Innovative
Performance in an Industrial District: The Case of a Footwear District in the
South of Italy, Industry and Innovation, 14(2), pp.177-199.
Bottazzi, L. and Peri, G. (2003). Innovation and spillovers in regions: Evidence
from European patent data, European Economic Review, 47(4), pp. 687-710.
Brenner, T. and Broekel, T (2011). Methodological Issues in Measuring
Innovation Performance of Spatial Units, Industry and Innovation, 18 (1), pp. 7-
37.
Breschi, S. (2000). The Geography of Innovation: A Cross-sector Analysis,
Regional Studies, 34(3), pp. 213–229.
Breschi, S., and Lissoni, F. (2001). Knowledge spillovers and local innovation
systems: a critical survey, Industrial and Corporate Change, 10, pp. 975–1005.
Cantwell, J. and Piscitello, L. (2005). Recent Location of Foreign-owned Research
and Development Activities by Large Multinational Corporations in the
European Regions: The Role of Spillovers and Externalities, Regional Studies,
39(1), pp. 1–16.
Cefis, E. (2003). Is There Persistence in Innovative Activities?, International Journal of Industrial Organization, 21, pp. 489–515.
Cooke, P. (2001). Regional innovation systems, clusters, and the knowledge
economy, Industrial and Corporate Change, 10(4), pp. 945–974.
Driver, C. and Oughton, C. (2008). Dynamic models of regional innovation:
explorations with British time-series data, Cambridge Journal of Regions, Economy and Society , 1, pp. 205–217.
Duranton, G and Puga, D. (2001). Nursery Cities: Urban Diversity, Process
Innovation, and the Life Cycle of Products, The American Economic Review,
91(5), pp. 1454-1477.
Filatotchev, I., Liuc, X., Lud, J. and Wright, M. (2001). Knowledge spillovers
through human mobility across national borders: Evidence from Zhongguancun
Science Park in China, Research Policy, 40, pp. 453–462.
Fitjar, R. and Rodríguez-Pose, A. (2011). Innovating in the Periphery: Firms,
Values and Innovation in Southwest Norway, European Planning Studies, 19(4),
pp. 555-574.

19
Fornahl, D. and Brenner, T. (2009). Geographic concentration of innovative
activities in Germany, Structural Change and Economic Dynamics, 20, pp. 163-
182.
Funke, M. and Niebuhr, A. (2005). Regional Geographic Research and
Development Spillovers and Economic Growth: Evidence from West Germany,
Regional Studies, 39(1), pp. 143–153.
Geroski, P. van Reenen, A. and Walters, C. (1997). How persistently do firms
innovate?, Research Policy, 26(1), pp. 33–48.
Gilbert, B., McDougall, P. and Audretsch, D. (2008). Clusters, knowledge
spillovers and new venture performance: An empirical examination, Journal of Business Venturing, 23, pp. 405–422.
Glaeser, E. and Kerr, W. (2009). Local Industrial Conditions and
Entrepreneurship: How Much of the Spatial Distribution Can We Explain?,
Journal of Economics & Management Strategy, 18(3), pp. 623-663.
Greenstone, M., Hornbeck, R. and Moretti, E. (2010). Identifying agglomeration
spillovers: Evidence from winners and losers of large plant openings, Journal of Political Economy, 118(3), pp. 536-598.
Hall, B., Lotti, F. and Mairesse, J. (2009). Innovation and productivity in SMEs:
empirical evidence for Italy, Small Business Economics, 33(1), pp. 13–33.
Heidenreich, M. (2009). Innovation patterns and location of European low- and
medium-technology industries, Research Policy, 38(3), pp. 483–494.
Howells, J. (2002). Tacit knowledge, innovation and economic geography, Urban Studies, 39, pp. 871–884.
Huergo, E. and Moreno, L. (2011). Does history matter for the relationship
between R&D, innovation, and productivity?, Industrial and Corporate Change,
20(5), pp. 1335-1368.
Jaffe, A., Trajtenberg, M. and Henderson, R. (1993). Geographic localization of
knowledge spillovers as evidenced by patent citations, The Quarterly Journal of Economics, 108, pp. 577–598.
Kleinknecht, A., van Montfort, K. and Brouwer, E. (2002). The non-trivial choice
between innovation indicators, Economics of Innovation and New Technology,
11(2), pp. 109–121.
Lundvall, B.-A. (1992). National Systems of Innovation: Towards a Theory of Innovation and Interactive Learning. London: Pinter.
Lychagin, S., Pinkse, J., Slade, M. and John Van Reenen, J. (2010). Spillovers in
space does geography matter?, CEPR Discussion Paper No. 7928.
Mairesse, J., and P. Mohnen (2002). Accounting for innovation and measuring
innovativeness: an illustrative framework and an application, The American Economic Review, 92, pp. 226–231.
McCann, P. (2007). Sketching Out a Model of Innovation, Face-to-face Interaction
and Economic Geography, Spatial Economic Analysis, 2(2), pp. 117–134.
Moreno, R., Raffaele, P. and Usai, S. (2005). Geographical and sectoral clusters of
innovation in Europe, Annals Regional Science, 39, pp. 715–739.

20
Morgan, K. (1997). The learning region: institutions, innovation and regional
renewal, Research Policy, 31, pp. 491–503.
Morgan, K. (2004). The exaggerated death of geography: learning, proximity and
territorial innovation systems, Journal of Economic Geography, 4, pp. 3–21.
Muscio, A. (2006). Patterns of Innovation in Industrial Districts: An Empirical
Analysis, Industry and Innovation, 13(3), pp. 291-312.
Narula, R. and Santangelo, G. (2009). Location, collocation and R&D alliances in
the European ICT industry, Research Policy, 38, pp. 393–403.
Oerlemans, L, and Meeus, M. (2005). Do Organizational and Spatial Proximity
Impact on Firm Performance?, Regional Studies, 39(1), pp. 89–104.
Orlando, M. (2004). Measuring Spillovers from Industrial R&D: On the
Importance of Geographic and Technological Proximity, RAND Journal of Economics, 35, pp. 777–786.
Oughton C., Landabaso, M. and Morgan, K. (2002). Regional innovation systems
and regional innovation strategies: catalyzing innovation and growth, Journal of Technology Transfer, 27(1), pp. 97–110.
Peters, B. (2009). Persistence of Innovation: Stylized Facts and Panel Data
Evidence, Journal of Technology Transfer, 34, pp. 226–243.
Rallet, A. and Torre, A. (2000). Is geographical proximity necessary in the
innovation networks in the era of global economy?, GeoJournal, 49, pp. 373–380.
Raymond, W., Mohen, Palm, P. and van der Loeff, S. (2010). Persistence of
Innovation in Dutch Manufacturing: Is it Spurious?, Review of Economics and Statistics, 92(3), pp. 495-504.
Roper, S. and Hewitt-Dundas, N. (2008). Innovation persistence: Survey and
case-study evidence, Research Policy, 37, pp. 149–162.
Shearmur, R. and Doloreux, D. (2009). Space and Distance: Towards a
Geography of Knowledge Intensive Business Services Innovation, Industry and Innovation, 16(1), pp. 79–102.
Smith, V., Broberg, A. and Overgaard, J. (2002). Does Location Matter for Firms’
R&D Behaviour? Empirical Evidence for Danish Firms, Regional Studies, 36(8),
pp. 825–832.
Tappeiner, G., Hauser, C. and Walde, J. (2008). Regional knowledge spillovers:
Fact or artifact?, Research Policy, 37, pp. 861–874.
Thompson, P. (2006). Patent citations and the geography of knowledge spillovers:
evidence from inventor- and examiner-added citations, Review of Economics and Statistics, 88(2), pp. 383–389.
Thompson, P. and Fox-Kean, M. (2004). Patent citations and the geography of
knowledge spillovers: a reassessment, The American Economic Review, 95(1), pp.
450–460.
Torre, A. and Gilly, J. (1999). On the analytical dimension of proximity dynamics,
Regional Studies, 34, pp. 169–180.

21
Torre, A. and Rallet, A. (2005). Proximity and Localization, Regional Studies,
39(1), pp. 47–59.
Zeller, C. (2002). Project teams as means of restructuring research and
development in the pharmaceutical industry, Regional Studies, 36, pp. 275–289.
Zucker, L., Darby, M., and Brewer, M. (1998). Intellectual human capital and the
birth of Biotechnology enterprises, The American Economic Review, 88, pp.290-
306.

22
Table 1: Innovation type across Portuguese regions (NUTS2), 1998-2006.
NUTS2
CIS3 CIS4 CIS6
All
firms
1998-2000 2002-2004 2004-2006
Innova Productb Processb Innova Productb Processb Innova Productb Processb
N % % % % % % % % %
Norte
307 43.65 29.32 32.90 41.69 24.43 37.13 44.30 27.36 37.79
Centro
184 39.67 26.09 28.26 39.13 25.00 34.78 43.48 25.54 36.41
Lisboa
261 49.04 33.33 35.25 42.91 24.52 39.46 43.30 21.84 36.02
Alentejo
24 29.17 16.67 25.00 37.50 16.67 33.33 37.50 16.67 37.50
Algarve
12 16.67 0.00 16.67 33.33 16.67 33.33 8.33 8.33 8.33
Total
788 43.65 29.06 32.11 41.24 24.24 37.18 43.02 24.49 36.42
Pearson chi2(4) 9.867** 9.814** 4.388 1.113 1.120 1.264 6.417 4.959 4.366
Likelihood-ratio
chi2(4) 10.362** 13.130*** 4.586 1.123 1.297 1.267 7.708 5.436 5.376
Levene’s F (4, 783) 29.760*** 20.758*** 5.999*** 1.479 1.549 1.293 68.809*** 6.491*** 17.389***
Cramér's V 0.112 0.112 0.075 0.038 0.039 0.040 0.090 0.079 0.074
Source: Authors’ own calculations from CIS3, CIS4 and CIS6 data. Notes: a This is the percentage of innovating firms in the survey. b This is
the percentage of innovating firms that reported having introduced in the market a product and/or process innovation. The same firm may
have reported both types of innovation; hence the sum of the product and process columns may add up to more than 100%. ***, **, * means it
is statistically significant at the 1%, 5% and 10% level, respectively.
23
Table 2: Innovation type across Portuguese regions (NUTS3), 1998-2006.
NUST3 c
CIS3
CIS4
CIS6
All firms
1998-2000
2002-2004
2004-2006
Innova
Productb Processb
Innova
Productb Processb
Innova
Productb Processb
N % % %
% % %
% % %
Ave
58 48.28 29.31 37.93 46.55 31.03 37.93 48.28 29.31 43.10
Baixo Vouga
47 42.55 29.79 31.91 42.55 29.79 40.43 46.81 34.04 38.30
Grande Lisboa
176 54.55 36.93 40.34 46.02 27.27 42.05 46.59 23.86 39.77
Grande Porto
145 37.93 28.97 27.59 37.24 18.62 33.79 44.83 26.90 37.93
Totald
788 43.65 29.06 32.11 41.24 24.24 37.18 43.02 24.49 36.42
Pearson chi2 (25) 35.226* 24.371 28.929 22.235 24.479 16.925 21.358 34.233 23.558
Likelihood-ratio chi2 (25) 36.724* 30.708 29.443 24.198 26.676 18.741 23.497
37.507*
* 28.675
Levene’s F (25, 762)
5.690**
*
6.962**
*
3.994**
*
6.950**
*
4.519**
*
5.053**
*
11.426**
*
5.387**
*
11.1889**
*
Cramér's V 0.211 0.176 0.192 0.168 0.176 0.147 0.165 0.208 0.173
Moran’s I test (spatial
autocorrelation) 0.163** 0.153* 0.219** 0.197** 0.236** 0.206**
Source: Authors’ own calculations from CIS3, CIS4 and CIS6 data. Notes: a This is the percentage of innovating firms in the survey. b This is the percentage of innovating firms
that reported having introduced a product and/or process innovation in the market. The same firm may have reported both types of innovation; hence the sum of the product and
process columns may add up to more than 100%. c There are 28 regions at the NUTS3 aggregation level in Portugal. The final sample only includes 26 regions (‘Alto Trás os
Montes’ and ‘Serra da Estrela’ are not included), because there are no surveyed firms in the excluded regions.d For presentation purposes we just report the regions with the
highest number of firms; hence the total row refers to the total sample. The other data is available upon request to the authors. The association tests are performed for the all
sample. ***, **, * means it is statistically significant at the 1%, 5% and 10% level, respectively.
24
Table 3: Innovation persistence across Portuguese regions (NUTS2), 1998-2006.
NUTS 2 CIS3, CIS4 and CIS6
Innovating firms Total
All firms Occasional type 1a Occasional type 2b Persistentc Innovating firms
N % % % %
Norte 307 37.79 31.27 9.77 78.83
Centro 184 39.13 30.98 7.07 77.17
Lisboa 261 41.38 30.27 11.11 82.76
Alentejo 24 25.00 33.33 4.17 62.50
Algarve 12 25.00 16.67 0.00 41.67
Total 788 38.71 30.71 9.26 78.68
Pearson chi2 (4) 3.761 1.265 4.179 16.387***
Likelihood-ratio chi2 (4) 3.934 1.398 5.488 13.964***
Levene’s F (4, 783) 7.640*** 2.203* 4.667*** 6.227***
Cramér's V 0.069 0.040 0.073 0.144
Source: Authors’ own calculations from CIS3, CIS4 and CIS6 data. Notes: a Occasional innovator type 1 means the firm reported having introduced an innovation once over the
period 1998-2006. b Occasional innovator type 2 means the firm reported having introduced an innovation twice over the period 1998-2006. c persistent innovator means the firm
reported having introduced an innovation in all CIS waves. ***, **, * means it is statistically significant at the 1%, 5% and 10% level, respectively.

25
Table 4: Innovation persistence across Portuguese regions (NUTS3), 1998-2006.
NUTS 3d
CIS3, CIS4 and CIS6
Innovating firms Total
All firms Occasional type 1a Occasional type 2b Persistentc Innovating firms
N % % % %
Ave 58 29.31 36.21 13.79 79.31
Baixo Vouga 47 38.30 34.04 8.51 80.85
Grande Lisboa 176 41.48 32.39 13.64 87.50
Grande Porto 145 39.31 31.03 6.21 76.55
Totale 788 38.71 30.71 9.26 78.68
Pearson chi2(25) 23.055 14.947 24.773 51.276***
Likelihood-ratio chi2(25) 27.484 15.265 32.793 48.367***
Levene’s F (25, 762) 10.019*** 2.229*** 4.702*** 4.507***
Cramér's V 0.171 0.138 0.177 0.255
Moran’s I test (spatial
autocorrelation) 0.168* 0.196** 0.152** 0.190**
Source: Authors’ own calculations from CIS3, CIS4 and CIS6 data. Notes: a Occasional innovator type 1 means the firm reported having introduced an innovation once over the
period 1998-2006; b Occasional innovator type 2 means the firm reported having introduced an innovation twice over the period 1998-2006; c persistent innovator means the firm
reported having introduced an innovation in all CIS waves. d There are 28 regions at the NUTS3 aggregation level in Portugal. The final sample only includes 26 regions because
there are no surveyed firms in the excluded regions (‘Alto Trás os Montes’ and ‘Serra da Estrela’ are not included). e For presentation purposes we just report the regions with the
highest number of firms; hence the total row refers to the total sample. The other data is available upon request to the authors. The association tests are performed for the all
sample. ***, **, * means it is statistically significant at the 1%, 5% and 10% level, respectively.

26
Table 5: The concentration ratio of innovation activities in Portuguese regions (NUTS3), 1998-2006 (%).
CIS3
CIS4
CIS6 3 Waves of CIS6
1998-2000
2002-2004
2004-2006 1998-2006
Innovating firms
-
Product 61.1 56.5 59.1 -
Process 59.3 56.3 59.2 -
Occasional type 1 - - - 54.4
Occasional type2 - - - 57.4
Persistent - - - 67.1
Firms in 1998 (population) 56.3
Source: Authors’ own calculations from CIS3, CIS4 and CIS6 data. Notes: Occasional innovator type 1 means the firm reported having introduced an innovation once over the
period 1998-2006; Occasional innovator type 2 means the firm reported having introduced an innovation twice over the period 1998-2006; Persistent innovator means the firm
reported having introduced an innovation in all CIS waves.

Most Recent Working Paper
NIPE WP
12/2013
Faria, Ana Paula, Natália Barbosa e Vasco Eiriz, “Firms’ innovation across regions: an
exploratory study”, 2013
NIPE WP
11/2013
Veiga, Francisco José, “Instituições, Estabilidade Política e Desempenho Económico
Implicações para Portugal”, 2013
NIPE WP
10/2013
Barbosa, Natália, Ana Paula Faria e Vasco Eiriz, “Industry- and firm-specific factors of
innovation novelty”, 2013
NIPE WP
09/2013
Castro, Vítor e Megumi Kubota, “Duration dependence and change-points in the likelihood of
credit booms ending”, 2013
NIPE WP
08/2013
Monteiro, Natália Pimenta e Geoff Stewart “Scale, Scope and Survival: A Comparison of
Cooperative and Capitalist Modes of Production”, 2013
NIPE WP
07/2013
Esteves, Rosa-Branca e Joana Resende, “Competitive Targeted Advertising with Price
Discrimination”, 2013
NIPE WP
06/2013
Barbosa, Natália, Maria Helena Guimarães e Ana Paula Faria, “Single Market non-
compliance: how relevant is the institutional setting?”, 2013
NIPE WP
05/2013
Lommerud, Kjell Erik, Odd Rune Straume e Steinar Vagstad, “Mommy tracks and public
policy: On self-fulfilling prophecies and gender gaps in promotion”, 2013
NIPE WP
04/2013
Brekke, Kurt R., Luigi Siciliani e Odd Rune Straume, “Hospital Mergers: A Spatial
Competition Approach”, 2013
NIPE WP
03/2013
Faria, Ana Paula e Natália Barbosa, “Does venture capital really foster innovation?”, 2013
NIPE WP
02/2013
Esteves, Rosa Branca, “Customer Poaching with Retention Strategies”, 2013
NIPE WP
01/2013
Aguiar-Conraria, Luís, Teresa Maria Rodrigues e Maria Joana Soares, “Oil Shocks and the
Euro as an Optimum Currency Area”, 2013
NIPE WP
27/2012 RRiiccaarrddoo MM.. SSoouussaa,, “The Effects of Monetary Policy in a Small Open Economy: The Case of
Portugal” 22001122
NIPE WP
26/2012
Sushanta K. Mallick e RRiiccaarrddoo MM.. SSoouussaa,, “Is Technology Factor-Neutral? Evidence from the US
Manufacturing Sector” 22001122
NIPE WP
25/2012
Jawadi, F. e RRiiccaarrddoo MM.. SSoouussaa,, “Structural Breaks and Nonlinearity in US and UK Public Debt”
22001122
NIPE WP
24/2012
Jawadi, F. e RRiiccaarrddoo MM.. SSoouussaa,, “Consumption and Wealth in the US, the UK and the Euro Area:
A Nonlinear Investigation” 22001122
NIPE WP
23/2012
Jawadi, F. e RRiiccaarrddoo MM.. SSoouussaa,, “ Modelling Money Demand: Further Evidence from an
International Comparison” 22001122
NIPE WP
22/2012
Jawadi, F. e RRiiccaarrddoo MM.. SSoouussaa,, “ Money Demand in the euro area, the US and the UK:
Assessing the Role of Nonlinearity” 22001122
NIPE WP
21/2012
Agnello, L, Sushanta K. Mallick e RRiiccaarrddoo MM.. SSoouussaa,, “Financial Reforms and Income
Inequality” 22001122
NIPE WP
20/2012
Agnello, L, Gilles Dufrénot e RRiiccaarrddoo MM.. SSoouussaa,, “Adjusting the U.S. Fiscal Policy for Asset
Prices: Evidence from a TVP-MS Framework t” 22001122
NIPE WP
19/2012
Agnello, L e RRiiccaarrddoo MM.. SSoouussaa,, “Fiscal Adjustments and Income Inequality: A First
Assessment” 22001122
NIPE WP
18/2012
Agnello, L, Vitor Castro ee RRiiccaarrddoo MM.. SSoouussaa,, “Are there change-points in the likelihood of a
fiscal consolidation ending?” 22001122
NIPE WP
17/2012
Agnello, L, Vitor Castro ee RRiiccaarrddoo MM.. SSoouussaa,, ““What determines the duration of a fiscal
consolidation program?” 22001122
NIPE WP
16/2012 VVeeiiggaa,, LLiinnddaa,, ““VVoottiinngg ffuunnccttiioonnss iinn tthhee EEUU--1155””,, 22001122
NIPE WP
15/2012 AAlleexxaannddrree,, FFeerrnnaannddoo ee PPeeddrroo BBaaççããoo,, ““Portugal before and after the European Union: Facts on
Nontradables”, 2012
NIPE WP
14/2012 EEsstteevveess,, RRoossaa BBrraannccaa ee CCaarrlloo RReeggggiiaannii,, ““BBeehhaavviioouurr--BBaasseedd PPrriiccee DDiissccrriimmiinnaattiioonn wwiitthh EEllaassttiicc
DDeemmaanndd””,, 22001122