Embed Size (px)
Citation preview
Printed in Japan FD-2009-HY-01
FINANCIAL DATA 2009
2nd Quarter �� � ����2008.4.1�2008.9.30
目次 CONTENTS
<連結データ> <Consolidated Data> 連結決算概要 Financial Summary(Consolidated) 1
連結貸借対照表 Consolidated Balance Sheets 2
連結損益計算書 Consolidated Income Statement 4
連結キャッシュフロー計算書 Consolidated Cash Flow Statement 5
収益の状況 Sales and Profit 6
資産および負債・純資産の状況 Assets, Liabilities and Net Assets 7
設備投資の状況 Capital Expenditure 8
地域別・事業別・品目別売上高 Net Sales by Destination, Business and Product type 9
地域別・事業別売上高 Net Sales by Destination (Net Sales to customers in the Region) and Business 10
所在地別売上高および営業利益の状況 Net Sales and Operating Income (Loss) by Geographical Region (Net Sales and Operating Income (Loss) of subsidiaries in the Region) 14
<単独データ> <Non-Consolidated Data>
主要単独財務指標 Non-Consolidated Financial Summary 16
<関連データ> <Associated Data>
株式情報 Stock Information 17
一株当たり指標 Per Share Data 18
会社概要 Corporate Data 20
連結子会社および関連会社 Consolidated Subsidiaries and Affiliates 21
● 2009年3月期第1四半期の連結決算よりシスメックス・ビオメリュー株式会社の業績が反映されています。
● At the beginning of 1st quarter of fiscal year ended March 31, 2009, the consolidated figures include the results of SYSMEX bioMerieux Co., Ltd.
● 2007年3月期通期の連結決算よりシスメックスデジタナの業績が反映されています。● The consolidated figures for fiscal year ended March 31, 2007 include the results of
the annual period of SYSMEX DIGITANA AG.
● 2006年3月期の第1四半期より、一部を除く連結子会社の決算期を親会社に統一しています。
● At the beginning of 1st quarter of fiscal year ended March 31, 2006, closing date of most consolidated subsidiaries was changed to be aligned with SysmexCorporation.
● 2005年11月18日付で1株を2株に株式分割を実施しました。 ● The shares of shareholders was split two for one on November 18, 2005.
本資料のうち、業績見通し等に記載されている各数値は、現在入手可能な情報による判断および仮定に基づき算出しており、判断や仮定に内在する不確定性および今後の事業運営や内外の状況変化により、実際の業績等が見通しの数値と大きく異なる可能性があります。 Forward-looking Statements This material contains forward-looking statements about Sysmex Corporation and its group companies (the Sysmex Group). These forward-looking statements are based on current judgments and assumptions of the Sysmex Group in light of the information currently available to it, and involve known and unknown risks, uncertainties and other factors, including but not limited to: global economic conditions, competitive situations and changes in exchange rates. Such risks, uncertainties and other factors may cause our actual results, performance, achievements or financial position to be materially different from any future results, performance, achievements or financial position expressed or implied by these forward-looking statements.
1
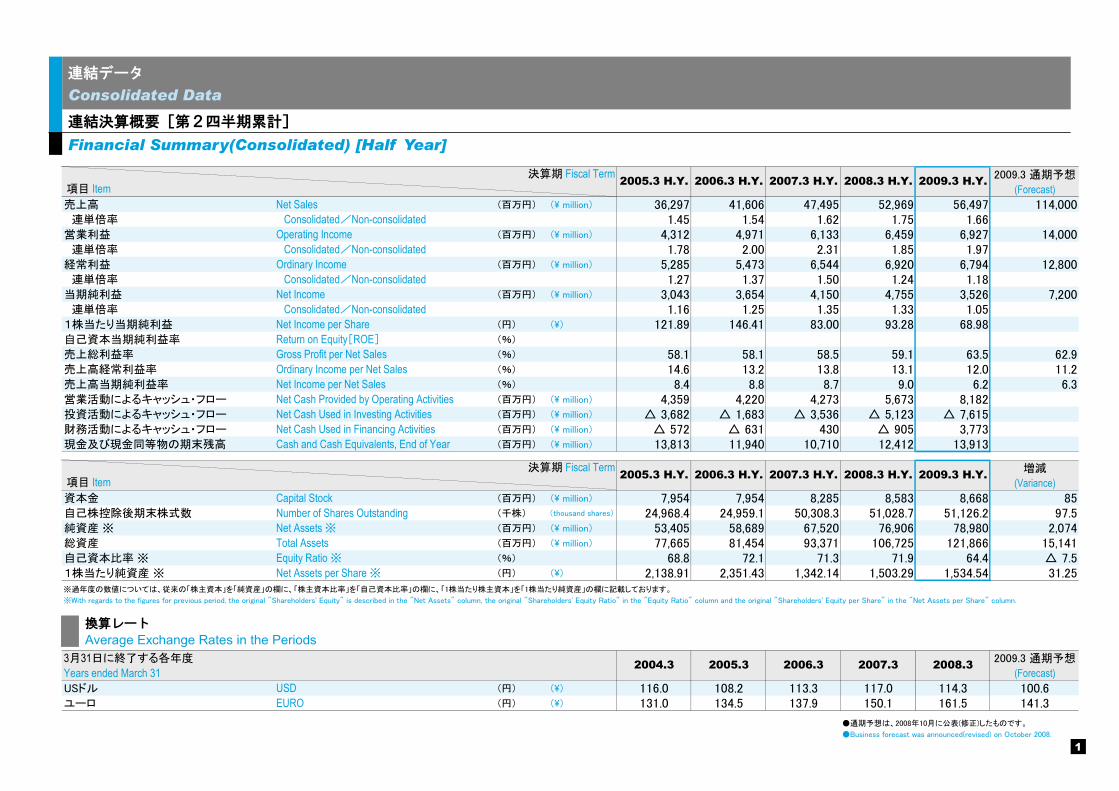
2009.3 通期予想
(Forecast)売上高 Net Sales (百万円) (\ million) 36,297 41,606 47,495 52,969 56,497 114,000 連単倍率 Consolidated/Non-consolidated 1.45 1.54 1.62 1.75 1.66営業利益 Operating Income (百万円) (\ million) 4,312 4,971 6,133 6,459 6,927 14,000 連単倍率 Consolidated/Non-consolidated 1.78 2.00 2.31 1.85 1.97経常利益 Ordinary Income (百万円) (\ million) 5,285 5,473 6,544 6,920 6,794 12,800 連単倍率 Consolidated/Non-consolidated 1.27 1.37 1.50 1.24 1.18当期純利益 Net Income (百万円) (\ million) 3,043 3,654 4,150 4,755 3,526 7,200 連単倍率 Consolidated/Non-consolidated 1.16 1.25 1.35 1.33 1.051株当たり当期純利益 Net Income per Share (円) (\) 121.89 146.41 83.00 93.28 68.98自己資本当期純利益率 Return on Equity[ROE] (%)
売上総利益率 Gross Profit per Net Sales (%) 58.1 58.1 58.5 59.1 63.5 62.9売上高経常利益率 Ordinary Income per Net Sales (%) 14.6 13.2 13.8 13.1 12.0 11.2売上高当期純利益率 Net Income per Net Sales (%) 8.4 8.8 8.7 9.0 6.2 6.3営業活動によるキャッシュ・フロー Net Cash Provided by Operating Activities (百万円) (\ million) 4,359 4,220 4,273 5,673 8,182投資活動によるキャッシュ・フロー Net Cash Used in Investing Activities (百万円) (\ million) △ 3,682 △ 1,683 △ 3,536 △ 5,123 △ 7,615財務活動によるキャッシュ・フロー Net Cash Used in Financing Activities (百万円) (\ million) △ 572 △ 631 430 △ 905 3,773現金及び現金同等物の期末残高 Cash and Cash Equivalents, End of Year (百万円) (\ million) 13,813 11,940 10,710 12,412 13,913
増減
(Variance)資本金 Capital Stock (百万円) (\ million) 7,954 7,954 8,285 8,583 8,668 85自己株控除後期末株式数 Number of Shares Outstanding (千株) (thousand shares) 24,968.4 24,959.1 50,308.3 51,028.7 51,126.2 97.5純資産 ※ Net Assets ※ (百万円) (\ million) 53,405 58,689 67,520 76,906 78,980 2,074総資産 Total Assets (百万円) (\ million) 77,665 81,454 93,371 106,725 121,866 15,141自己資本比率 ※ Equity Ratio ※ (%) 68.8 72.1 71.3 71.9 64.4 △ 7.51株当たり純資産 ※ Net Assets per Share ※ (円) (\) 2,138.91 2,351.43 1,342.14 1,503.29 1,534.54 31.25
3月31日に終了する各年度 2009.3 通期予想
Years ended March 31 (Forecast)USドル USD (円) (\) 116.0 108.2 113.3 117.0 114.3 100.6ユーロ EURO (円) (\) 131.0 134.5 137.9 150.1 161.5 141.3
●通期予想は、2008年10月に公表(修正)したものです。
●Business forecast was announced(revised) on October 2008.
※過年度の数値については、従来の「株主資本」を「純資産」の欄に、「株主資本比率」を「自己資本比率」の欄に、「1株当たり株主資本」を「1株当たり純資産」の欄に記載しております。
※With regards to the figures for previous period, the original "Shareholders' Equity" is described in the "Net Assets" column, the original "Shareholders' Equity Ratio" in the "Equity Ratio" column and the original "Shareholders' Equity per Share" in the "Net Assets per Share" column.
2005.3 2006.3 2007.3 2008.3
2009.3 H.Y.2005.3 H.Y. 2007.3 H.Y. 2008.3 H.Y. 項目 Item 2006.3 H.Y.決算期 Fiscal Term
2004.3
項目 Item決算期 Fiscal Term 2005.3 H.Y. 2006.3 H.Y. 2009.3 H.Y.2007.3 H.Y. 2008.3 H.Y.
換算レート
Average Exchange Rates in the Periods
連結決算概要[第2四半期累計] Financial Summary(Consolidated) [Half Year]
連結データ Consolidated Data
2
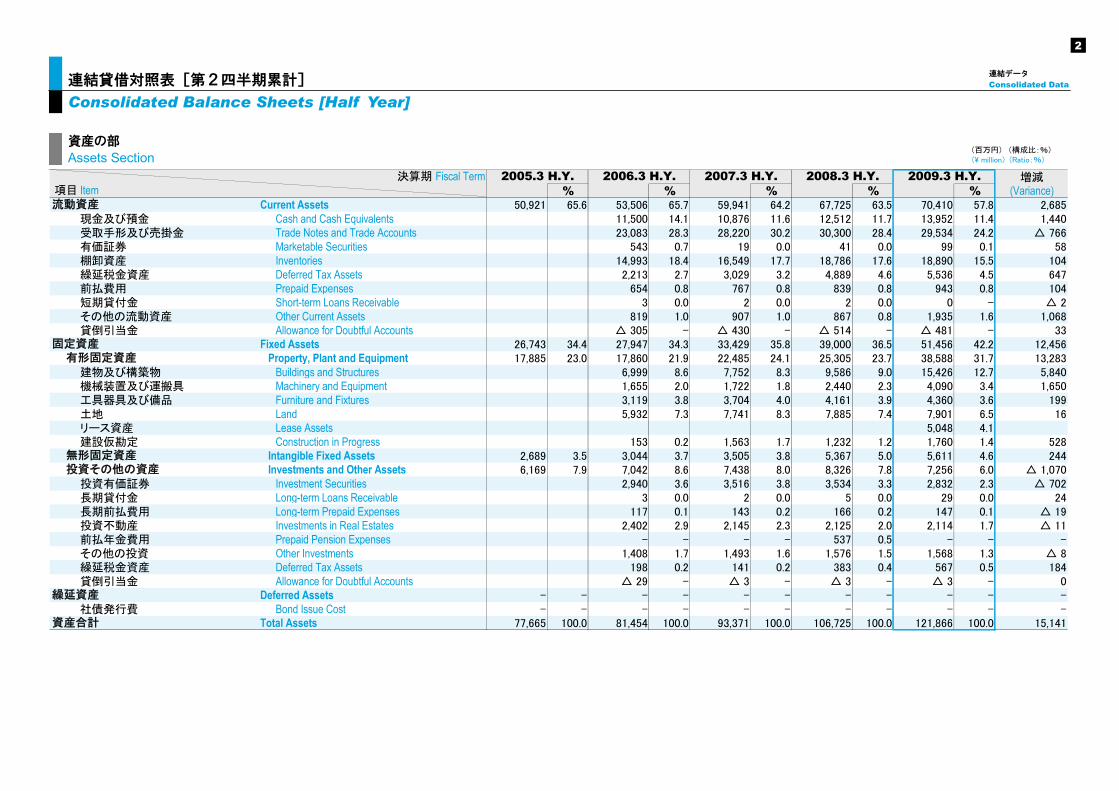
連結データ Consolidated Data 連結貸借対照表[第2四半期累計]
Consolidated Balance Sheets [Half Year]
増減% % % % % (Variance)
Current Assets 50,921 65.6 53,506 65.7 59,941 64.2 67,725 63.5 70,410 57.8 2,685現金及び預金 Cash and Cash Equivalents 11,500 14.1 10,876 11.6 12,512 11.7 13,952 11.4 1,440受取手形及び売掛金 Trade Notes and Trade Accounts 23,083 28.3 28,220 30.2 30,300 28.4 29,534 24.2 △ 766有価証券 Marketable Securities 543 0.7 19 0.0 41 0.0 99 0.1 58棚卸資産 Inventories 14,993 18.4 16,549 17.7 18,786 17.6 18,890 15.5 104繰延税金資産 Deferred Tax Assets 2,213 2.7 3,029 3.2 4,889 4.6 5,536 4.5 647前払費用 Prepaid Expenses 654 0.8 767 0.8 839 0.8 943 0.8 104短期貸付金 Short-term Loans Receivable 3 0.0 2 0.0 2 0.0 0 - △ 2その他の流動資産 Other Current Assets 819 1.0 907 1.0 867 0.8 1,935 1.6 1,068貸倒引当金 Allowance for Doubtful Accounts △ 305 - △ 430 - △ 514 - △ 481 - 33
Fixed Assets 26,743 34.4 27,947 34.3 33,429 35.8 39,000 36.5 51,456 42.2 12,456 Property, Plant and Equipment 17,885 23.0 17,860 21.9 22,485 24.1 25,305 23.7 38,588 31.7 13,283
建物及び構築物 Buildings and Structures 6,999 8.6 7,752 8.3 9,586 9.0 15,426 12.7 5,840機械装置及び運搬具 Machinery and Equipment 1,655 2.0 1,722 1.8 2,440 2.3 4,090 3.4 1,650工具器具及び備品 Furniture and Fixtures 3,119 3.8 3,704 4.0 4,161 3.9 4,360 3.6 199土地 Land 5,932 7.3 7,741 8.3 7,885 7.4 7,901 6.5 16リース資産 Lease Assets 5,048 4.1建設仮勘定 Construction in Progress 153 0.2 1,563 1.7 1,232 1.2 1,760 1.4 528
Intangible Fixed Assets 2,689 3.5 3,044 3.7 3,505 3.8 5,367 5.0 5,611 4.6 244 Investments and Other Assets 6,169 7.9 7,042 8.6 7,438 8.0 8,326 7.8 7,256 6.0 △ 1,070
投資有価証券 Investment Securities 2,940 3.6 3,516 3.8 3,534 3.3 2,832 2.3 △ 702長期貸付金 Long-term Loans Receivable 3 0.0 2 0.0 5 0.0 29 0.0 24長期前払費用 Long-term Prepaid Expenses 117 0.1 143 0.2 166 0.2 147 0.1 △ 19投資不動産 Investments in Real Estates 2,402 2.9 2,145 2.3 2,125 2.0 2,114 1.7 △ 11前払年金費用 Prepaid Pension Expenses - - - - 537 0.5 - - -その他の投資 Other Investments 1,408 1.7 1,493 1.6 1,576 1.5 1,568 1.3 △ 8繰延税金資産 Deferred Tax Assets 198 0.2 141 0.2 383 0.4 567 0.5 184貸倒引当金 Allowance for Doubtful Accounts △ 29 - △ 3 - △ 3 - △ 3 - 0
Deferred Assets - - - - - - - - - - -社債発行費 Bond Issue Cost - - - - - - - - - - -
Total Assets 77,665 100.0 81,454 100.0 93,371 100.0 106,725 100.0 121,866 100.0 15,141
決算期 Fiscal Term
(百万円) (構成比:%)(\ million) (Ratio:%)
2005.3 H.Y. 2006.3 H.Y. 2007.3 H.Y. 2008.3 H.Y. 2009.3 H.Y. 項目 Item
資産合計
繰延資産
投資その他の資産無形固定資産
有形固定資産固定資産
流動資産
資産の部
Assets Section
3
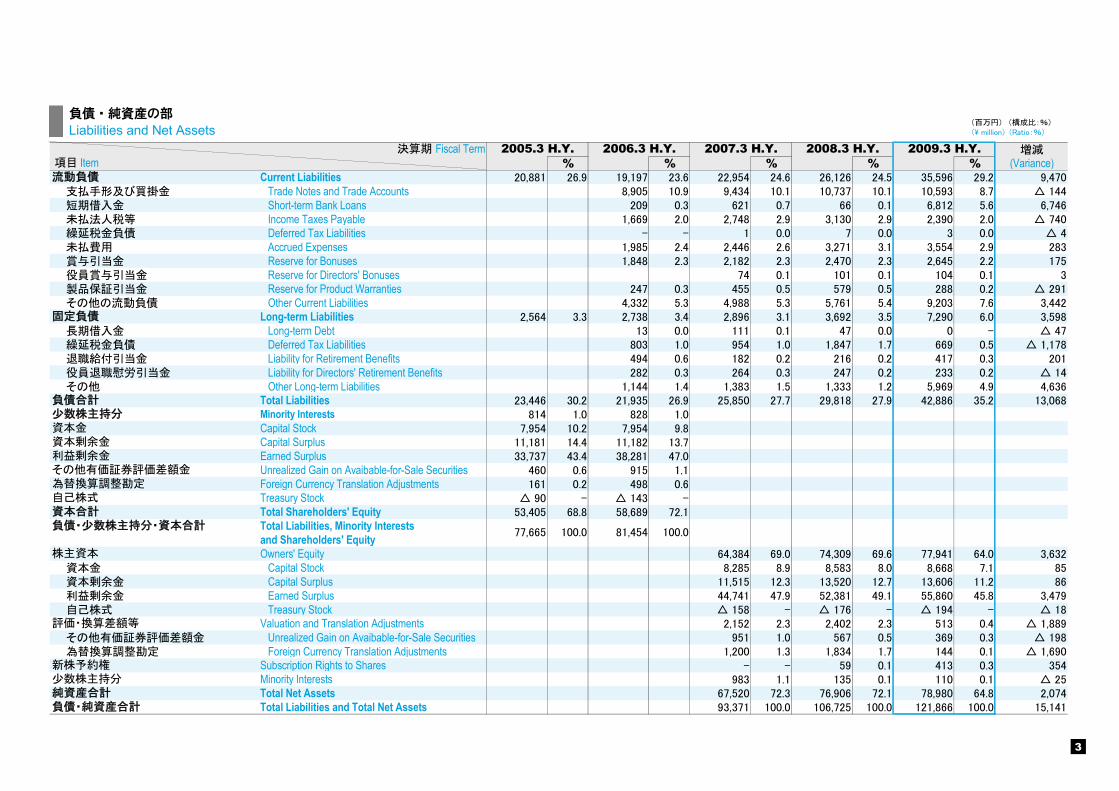
増減% % % % % (Variance)
Current Liabilities 20,881 26.9 19,197 23.6 22,954 24.6 26,126 24.5 35,596 29.2 9,470支払手形及び買掛金 Trade Notes and Trade Accounts 8,905 10.9 9,434 10.1 10,737 10.1 10,593 8.7 △ 144短期借入金 Short-term Bank Loans 209 0.3 621 0.7 66 0.1 6,812 5.6 6,746未払法人税等 Income Taxes Payable 1,669 2.0 2,748 2.9 3,130 2.9 2,390 2.0 △ 740繰延税金負債 Deferred Tax Liabilities - - 1 0.0 7 0.0 3 0.0 △ 4未払費用 Accrued Expenses 1,985 2.4 2,446 2.6 3,271 3.1 3,554 2.9 283賞与引当金 Reserve for Bonuses 1,848 2.3 2,182 2.3 2,470 2.3 2,645 2.2 175役員賞与引当金 Reserve for Directors' Bonuses 74 0.1 101 0.1 104 0.1 3製品保証引当金 Reserve for Product Warranties 247 0.3 455 0.5 579 0.5 288 0.2 △ 291その他の流動負債 Other Current Liabilities 4,332 5.3 4,988 5.3 5,761 5.4 9,203 7.6 3,442
Long-term Liabilities 2,564 3.3 2,738 3.4 2,896 3.1 3,692 3.5 7,290 6.0 3,598長期借入金 Long-term Debt 13 0.0 111 0.1 47 0.0 0 - △ 47繰延税金負債 Deferred Tax Liabilities 803 1.0 954 1.0 1,847 1.7 669 0.5 △ 1,178退職給付引当金 Liability for Retirement Benefits 494 0.6 182 0.2 216 0.2 417 0.3 201役員退職慰労引当金 Liability for Directors' Retirement Benefits 282 0.3 264 0.3 247 0.2 233 0.2 △ 14その他 Other Long-term Liabilities 1,144 1.4 1,383 1.5 1,333 1.2 5,969 4.9 4,636
Total Liabilities 23,446 30.2 21,935 26.9 25,850 27.7 29,818 27.9 42,886 35.2 13,068Minority Interests 814 1.0 828 1.0Capital Stock 7,954 10.2 7,954 9.8Capital Surplus 11,181 14.4 11,182 13.7Earned Surplus 33,737 43.4 38,281 47.0Unrealized Gain on Avaibable-for-Sale Securities 460 0.6 915 1.1Foreign Currency Translation Adjustments 161 0.2 498 0.6Treasury Stock △ 90 - △ 143 -Total Shareholders' Equity 53,405 68.8 58,689 72.1Total Liabilities, Minority Interestsand Shareholders' EquityOwners' Equity 64,384 69.0 74,309 69.6 77,941 64.0 3,632
資本金 Capital Stock 8,285 8.9 8,583 8.0 8,668 7.1 85資本剰余金 Capital Surplus 11,515 12.3 13,520 12.7 13,606 11.2 86利益剰余金 Earned Surplus 44,741 47.9 52,381 49.1 55,860 45.8 3,479自己株式 Treasury Stock △ 158 - △ 176 - △ 194 - △ 18
Valuation and Translation Adjustments 2,152 2.3 2,402 2.3 513 0.4 △ 1,889その他有価証券評価差額金 Unrealized Gain on Avaibable-for-Sale Securities 951 1.0 567 0.5 369 0.3 △ 198為替換算調整勘定 Foreign Currency Translation Adjustments 1,200 1.3 1,834 1.7 144 0.1 △ 1,690
Subscription Rights to Shares - - 59 0.1 413 0.3 354Minority Interests 983 1.1 135 0.1 110 0.1 △ 25Total Net Assets 67,520 72.3 76,906 72.1 78,980 64.8 2,074Total Liabilities and Total Net Assets 93,371 100.0 106,725 100.0 121,866 100.0 15,141
決算期 Fiscal Term
負債・純資産合計純資産合計少数株主持分新株予約権
評価・換算差額等
株主資本
固定負債
項目 Item流動負債
(百万円) (構成比:%)(\ million) (Ratio:%)
2005.3 H.Y. 2006.3 H.Y. 2007.3 H.Y. 2008.3 H.Y. 2009.3 H.Y.
100.0
負債合計少数株主持分
資本合計
資本金
為替換算調整勘定その他有価証券評価差額金
資本剰余金
自己株式
利益剰余金
負債・少数株主持分・資本合計77,665 81,454 100.0
負債・純資産の部
Liabilities and Net Assets
4
連結データ Consolidated Data 連結損益計算書[第2四半期累計]
Consolidated Income Statement [Half Year]
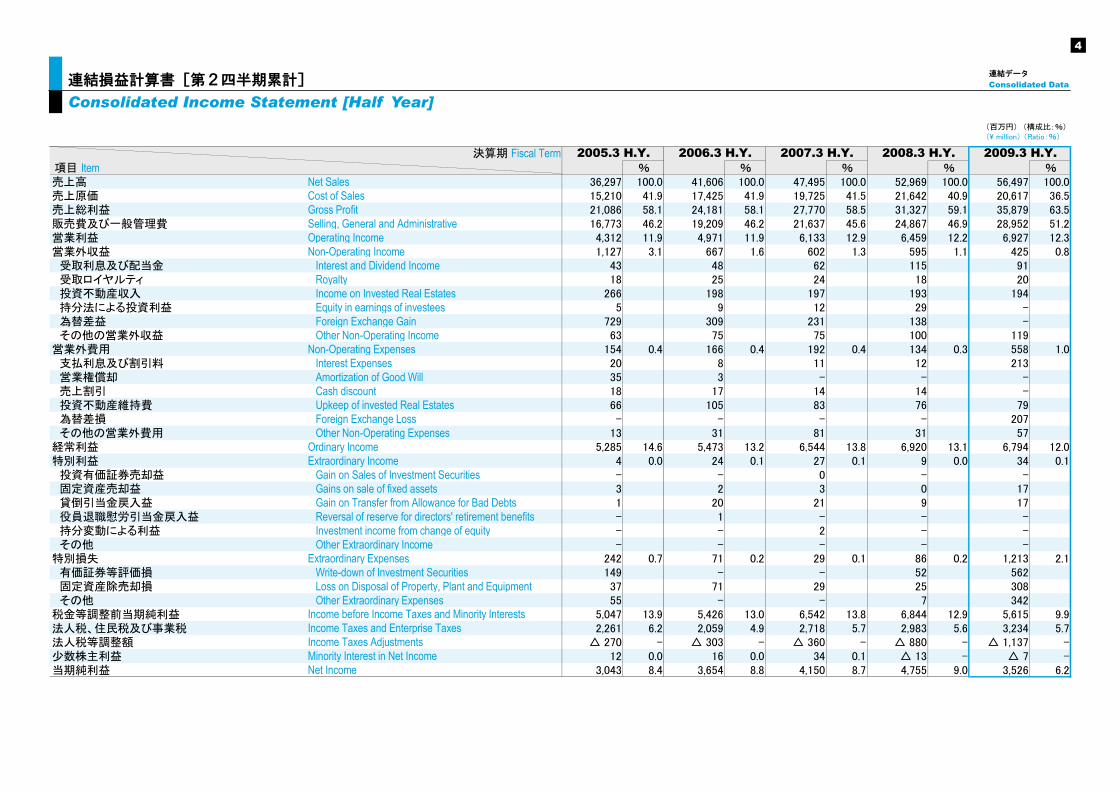
項目 Item % % % % %売上高 Net Sales 36,297 100.0 41,606 100.0 47,495 100.0 52,969 100.0 56,497 100.0売上原価 Cost of Sales 15,210 41.9 17,425 41.9 19,725 41.5 21,642 40.9 20,617 36.5売上総利益 Gross Profit 21,086 58.1 24,181 58.1 27,770 58.5 31,327 59.1 35,879 63.5販売費及び一般管理費 Selling, General and Administrative 16,773 46.2 19,209 46.2 21,637 45.6 24,867 46.9 28,952 51.2営業利益 Operating Income 4,312 11.9 4,971 11.9 6,133 12.9 6,459 12.2 6,927 12.3営業外収益 Non-Operating Income 1,127 3.1 667 1.6 602 1.3 595 1.1 425 0.8 受取利息及び配当金 Interest and Dividend Income 43 48 62 115 91 受取ロイヤルティ Royalty 18 25 24 18 20 投資不動産収入 Income on Invested Real Estates 266 198 197 193 194 持分法による投資利益 Equity in earnings of investees 5 9 12 29 - 為替差益 Foreign Exchange Gain 729 309 231 138 - その他の営業外収益 Other Non-Operating Income 63 75 75 100 119営業外費用 Non-Operating Expenses 154 0.4 166 0.4 192 0.4 134 0.3 558 1.0 支払利息及び割引料 Interest Expenses 20 8 11 12 213 営業権償却 Amortization of Good Will 35 3 - - - 売上割引 Cash discount 18 17 14 14 - 投資不動産維持費 Upkeep of invested Real Estates 66 105 83 76 79 為替差損 Foreign Exchange Loss - - - - 207 その他の営業外費用 Other Non-Operating Expenses 13 31 81 31 57経常利益 Ordinary Income 5,285 14.6 5,473 13.2 6,544 13.8 6,920 13.1 6,794 12.0特別利益 Extraordinary Income 4 0.0 24 0.1 27 0.1 9 0.0 34 0.1 投資有価証券売却益 Gain on Sales of Investment Securities - - 0 - - 固定資産売却益 Gains on sale of fixed assets 3 2 3 0 17 貸倒引当金戻入益 Gain on Transfer from Allowance for Bad Debts 1 20 21 9 17 役員退職慰労引当金戻入益 Reversal of reserve for directors' retirement benefits - 1 - - - 持分変動による利益 Investment income from change of equity - - 2 - - その他 Other Extraordinary Income - - - - -特別損失 Extraordinary Expenses 242 0.7 71 0.2 29 0.1 86 0.2 1,213 2.1 有価証券等評価損 Write-down of Investment Securities 149 - - 52 562 固定資産除売却損 Loss on Disposal of Property, Plant and Equipment 37 71 29 25 308 その他 Other Extraordinary Expenses 55 - - 7 342税金等調整前当期純利益 Income before Income Taxes and Minority Interests 5,047 13.9 5,426 13.0 6,542 13.8 6,844 12.9 5,615 9.9法人税、住民税及び事業税 Income Taxes and Enterprise Taxes 2,261 6.2 2,059 4.9 2,718 5.7 2,983 5.6 3,234 5.7法人税等調整額 Income Taxes Adjustments △ 270 - △ 303 - △ 360 - △ 880 - △ 1,137 -少数株主利益 Minority Interest in Net Income 12 0.0 16 0.0 34 0.1 △ 13 - △ 7 -当期純利益 Net Income 3,043 8.4 3,654 8.8 4,150 8.7 4,755 9.0 3,526 6.2
決算期 Fiscal Term
(百万円) (構成比:%)(\ million) (Ratio:%)
2005.3 H.Y. 2006.3 H.Y. 2007.3 H.Y. 2009.3 H.Y.2008.3 H.Y.
5
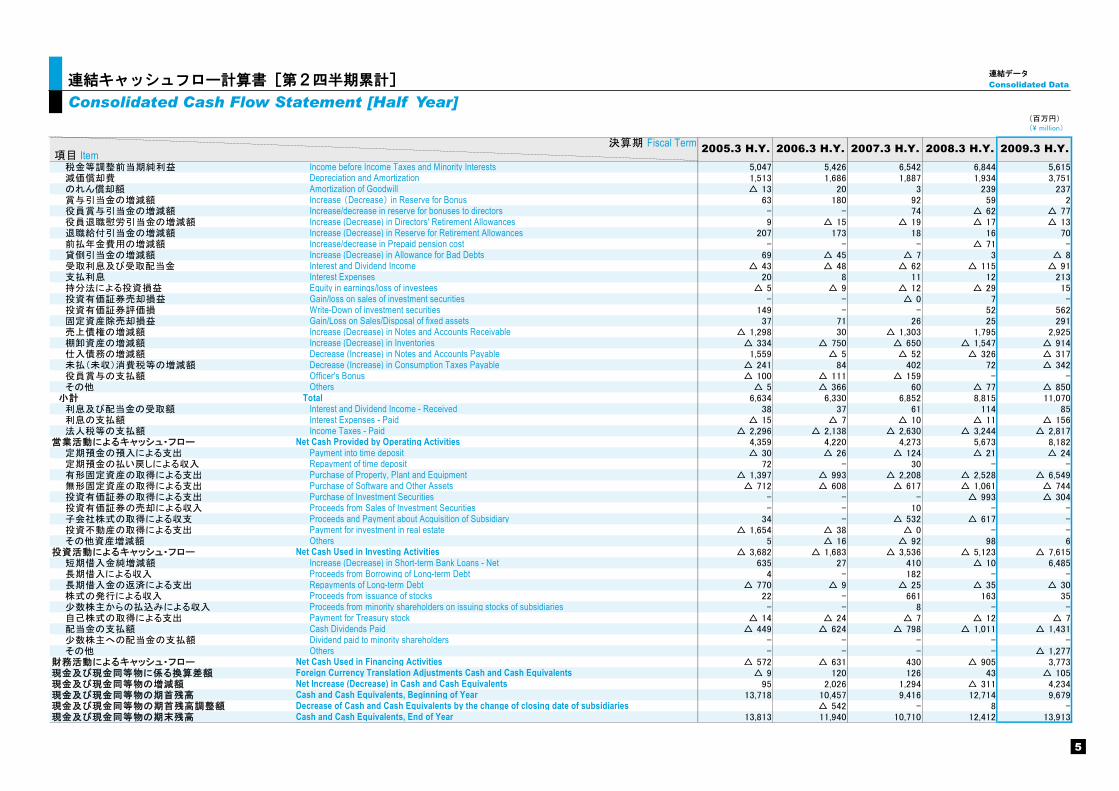
連結データ Consolidated Data 連結キャッシュフロー計算書[第2四半期累計]
Consolidated Cash Flow Statement [Half Year] (百万円)(\ million)
項目 Item 税金等調整前当期純利益 Income before Income Taxes and Minority Interests 5,047 5,426 6,542 6,844 5,615 減価償却費 Depreciation and Amortization 1,513 1,686 1,887 1,934 3,751 のれん償却額 Amortization of Goodwill △ 13 20 3 239 237 賞与引当金の増減額 Increase (Decrease) in Reserve for Bonus 63 180 92 59 2 役員賞与引当金の増減額 Increase/decrease in reserve for bonuses to directors - - 74 △ 62 △ 77 役員退職慰労引当金の増減額 Increase (Decrease) in Directors' Retirement Allowances 9 △ 15 △ 19 △ 17 △ 13 退職給付引当金の増減額 Increase (Decrease) in Reserve for Retirement Allowances 207 173 18 16 70 前払年金費用の増減額 Increase/decrease in Prepaid pension cost - - - △ 71 - 貸倒引当金の増減額 Increase (Decrease) in Allowance for Bad Debts 69 △ 45 △ 7 3 △ 8 受取利息及び受取配当金 Interest and Dividend Income △ 43 △ 48 △ 62 △ 115 △ 91 支払利息 Interest Expenses 20 8 11 12 213 持分法による投資損益 Equity in earnings/loss of investees △ 5 △ 9 △ 12 △ 29 15 投資有価証券売却損益 Gain/loss on sales of investment securities - - △ 0 7 - 投資有価証券評価損 Write-Down of investment securities 149 - - 52 562 固定資産除売却損益 Gain/Loss on Sales/Disposal of fixed assets 37 71 26 25 291 売上債権の増減額 Increase (Decrease) in Notes and Accounts Receivable △ 1,298 30 △ 1,303 1,795 2,925 棚卸資産の増減額 Increase (Decrease) in Inventories △ 334 △ 750 △ 650 △ 1,547 △ 914 仕入債務の増減額 Decrease (Increase) in Notes and Accounts Payable 1,559 △ 5 △ 52 △ 326 △ 317 未払(未収)消費税等の増減額 Decrease (Increase) in Consumption Taxes Payable △ 241 84 402 72 △ 342 役員賞与の支払額 Officer's Bonus △ 100 △ 111 △ 159 - - その他 Others △ 5 △ 366 60 △ 77 △ 850 小計 Total 6,634 6,330 6,852 8,815 11,070 利息及び配当金の受取額 Interest and Dividend Income - Received 38 37 61 114 85 利息の支払額 Interest Expenses - Paid △ 15 △ 7 △ 10 △ 11 △ 156 法人税等の支払額 Income Taxes - Paid △ 2,296 △ 2,138 △ 2,630 △ 3,244 △ 2,817営業活動によるキャッシュ・フロー Net Cash Provided by Operating Activities 4,359 4,220 4,273 5,673 8,182 定期預金の預入による支出 Payment into time deposit △ 30 △ 26 △ 124 △ 21 △ 24 定期預金の払い戻しによる収入 Repayment of time deposit 72 - 30 - - 有形固定資産の取得による支出 Purchase of Property, Plant and Equipment △ 1,397 △ 993 △ 2,208 △ 2,528 △ 6,549 無形固定資産の取得による支出 Purchase of Software and Other Assets △ 712 △ 608 △ 617 △ 1,061 △ 744 投資有価証券の取得による支出 Purchase of Investment Securities - - - △ 993 △ 304 投資有価証券の売却による収入 Proceeds from Sales of Investment Securities - - 10 - - 子会社株式の取得による収支 Proceeds and Payment about Acquisition of Subsidiary 34 - △ 532 △ 617 - 投資不動産の取得による支出 Payment for investment in real estate △ 1,654 △ 38 △ 0 - - その他資産増減額 Others 5 △ 16 △ 92 98 6投資活動によるキャッシュ・フロー Net Cash Used in Investing Activities △ 3,682 △ 1,683 △ 3,536 △ 5,123 △ 7,615 短期借入金純増減額 Increase (Decrease) in Short-term Bank Loans - Net 635 27 410 △ 10 6,485 長期借入による収入 Proceeds from Borrowing of Long-term Debt 4 - 182 - - 長期借入金の返済による支出 Repayments of Long-term Debt △ 770 △ 9 △ 25 △ 35 △ 30 株式の発行による収入 Proceeds from issuance of stocks 22 - 661 163 35 少数株主からの払込みによる収入 Proceeds from minority shareholders on issuing stocks of subsidiaries - - 8 - - 自己株式の取得による支出 Payment for Treasury stock △ 14 △ 24 △ 7 △ 12 △ 7 配当金の支払額 Cash Dividends Paid △ 449 △ 624 △ 798 △ 1,011 △ 1,431 少数株主への配当金の支払額 Dividend paid to minority shareholders - - - - - その他 Others - - - - △ 1,277財務活動によるキャッシュ・フロー Net Cash Used in Financing Activities △ 572 △ 631 430 △ 905 3,773現金及び現金同等物に係る換算差額 Foreign Currency Translation Adjustments Cash and Cash Equivalents △ 9 120 126 43 △ 105現金及び現金同等物の増減額 Net Increase (Decrease) in Cash and Cash Equivalents 95 2,026 1,294 △ 311 4,234現金及び現金同等物の期首残高 Cash and Cash Equivalents, Beginning of Year 13,718 10,457 9,416 12,714 9,679現金及び現金同等物の期首残高調整額 Decrease of Cash and Cash Equivalents by the change of closing date of subsidiaries △ 542 - 8 -現金及び現金同等物の期末残高 Cash and Cash Equivalents, End of Year 13,813 11,940 10,710 12,412 13,913
2008.3 H.Y. 2009.3 H.Y.決算期 Fiscal Term 2005.3 H.Y. 2006.3 H.Y. 2007.3 H.Y.
6
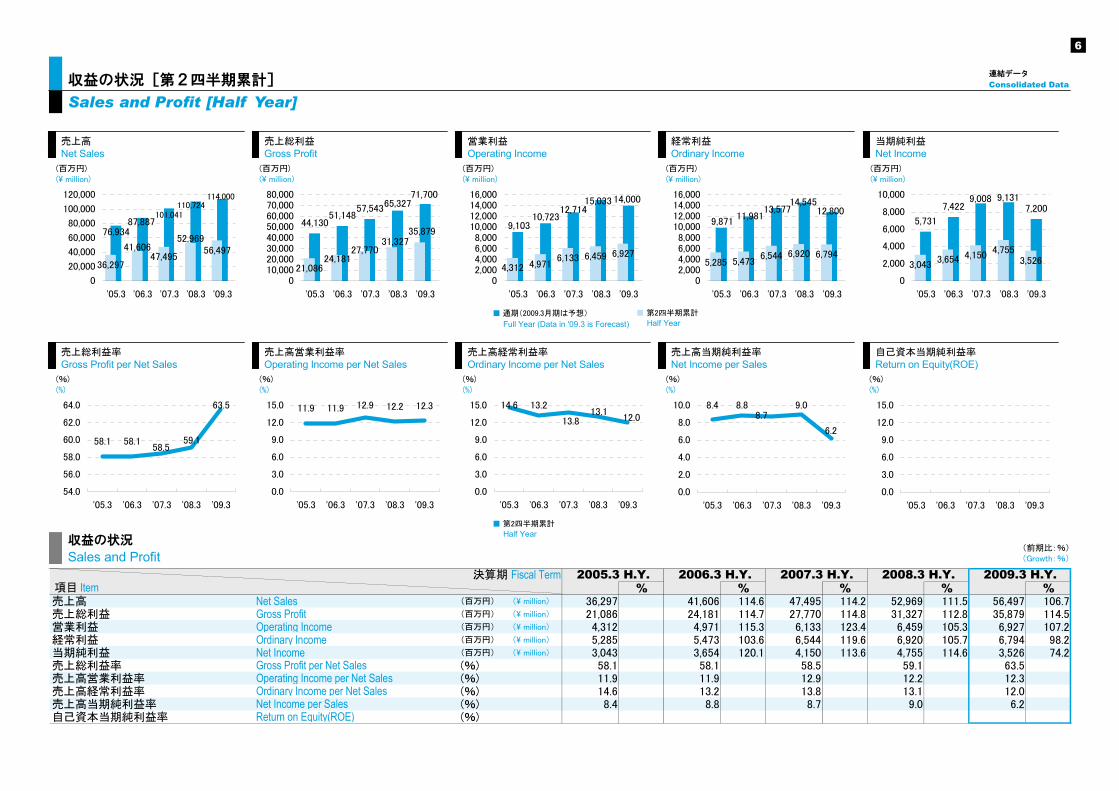
% % % % %売上高 Net Sales (百万円) (\ million) 36,297 41,606 114.6 47,495 114.2 52,969 111.5 56,497 106.7売上総利益 Gross Profit (百万円) (\ million) 21,086 24,181 114.7 27,770 114.8 31,327 112.8 35,879 114.5営業利益 Operating Income (百万円) (\ million) 4,312 4,971 115.3 6,133 123.4 6,459 105.3 6,927 107.2経常利益 Ordinary Income (百万円) (\ million) 5,285 5,473 103.6 6,544 119.6 6,920 105.7 6,794 98.2当期純利益 Net Income (百万円) (\ million) 3,043 3,654 120.1 4,150 113.6 4,755 114.6 3,526 74.2売上総利益率 Gross Profit per Net Sales (%) 58.1 58.1 58.5 59.1 63.5売上高営業利益率 Operating Income per Net Sales (%) 11.9 11.9 12.9 12.2 12.3売上高経常利益率 Ordinary Income per Net Sales (%) 14.6 13.2 13.8 13.1 12.0売上高当期純利益率 Net Income per Sales (%) 8.4 8.8 8.7 9.0 6.2自己資本当期純利益率 Return on Equity(ROE) (%)
(前期比:%)(Growth:%)
項目 Item2008.3 H.Y. 2009.3 H.Y.2005.3 H.Y. 2006.3 H.Y. 2007.3 H.Y.決算期 Fiscal Term
収益の状況
Sales and Profit
(百万円)(\ million)
売上高Net Sales
114,000110,724
76,93487,887
101,041
36,297
41,60652,969
56,49747,495
0
20,000
40,000
60,000
80,000
100,000
120,000
'05.3 '06.3 '07.3 '08.3 '09.3
(%)(%)
売上総利益率Gross Profit per Net Sales
58.1 58.1 59.158.5
63.5
54.0
56.0
58.0
60.0
62.0
64.0
'05.3 '06.3 '07.3 '08.3 '09.3
(百万円)(\ million)
売上総利益Gross Profit
44,13051,148
57,543
71,70065,327
21,086
27,770
35,87931,327
24,181
010,00020,00030,00040,00050,00060,00070,00080,000
'05.3 '06.3 '07.3 '08.3 '09.3
(%)(%)
売上高営業利益率Operating Income per Net Sales
11.9 11.9 12.9 12.2 12.3
0.0
3.0
6.0
9.0
12.0
15.0
'05.3 '06.3 '07.3 '08.3 '09.3
(百万円)(\ million)
営業利益Operating Income
10,7239,103
12,71415,033 14,000
4,312 4,9716,459 6,9276,133
02,0004,0006,0008,000
10,00012,00014,00016,000
'05.3 '06.3 '07.3 '08.3 '09.3
(百万円)(\ million)
経常利益Ordinary Income
9,87112,80011,981
13,57714,545
5,2856,920 6,7946,544
5,473
02,0004,0006,0008,000
10,00012,00014,00016,000
'05.3 '06.3 '07.3 '08.3 '09.3
(百万円)(\ million)
当期純利益Net Income
7,2005,731
7,4229,008 9,131
3,043 3,5264,755
4,1503,654
0
2,000
4,000
6,000
8,000
10,000
'05.3 '06.3 '07.3 '08.3 '09.3
(%)(%)
売上高経常利益率Ordinary Income per Net Sales
14.6 13.212.0
13.113.8
0.0
3.0
6.0
9.0
12.0
15.0
'05.3 '06.3 '07.3 '08.3 '09.3
(%)(%)
売上高当期純利益率Net Income per Sales
8.4 8.8 9.0
6.2
8.7
0.0
2.0
4.0
6.0
8.0
10.0
'05.3 '06.3 '07.3 '08.3 '09.3
(%)(%)
自己資本当期純利益率Return on Equity(ROE)
0.0
3.0
6.0
9.0
12.0
15.0
'05.3 '06.3 '07.3 '08.3 '09.3
■ 第2四半期累計
Half Year
■ 通期(2009.3月期は予想)
Full Year (Data in '09.3 is Forecast)■ 第2四半期累計
Half Year
連結データ Consolidated Data 収益の状況[第2四半期累計]
Sales and Profit [Half Year]
7
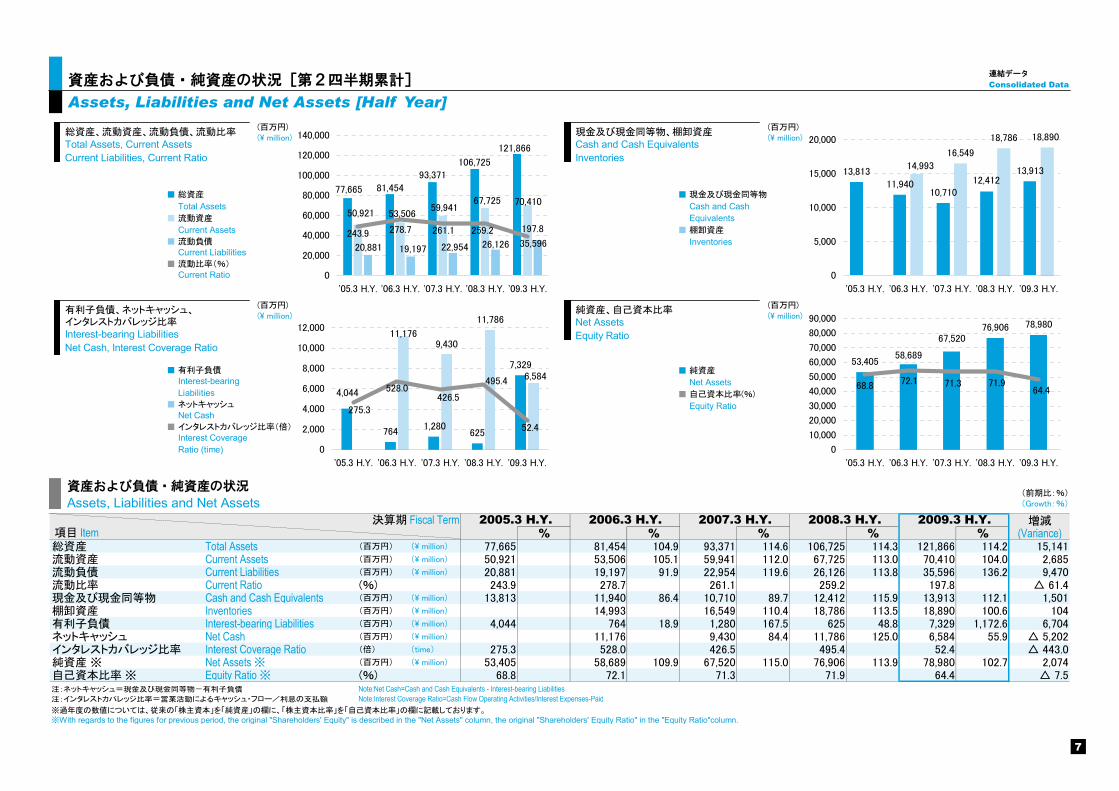
連結データ Consolidated Data 資産および負債・純資産の状況[第2四半期累計]
Assets, Liabilities and Net Assets [Half Year]
増減% % % % % (Variance)
総資産 Total Assets (百万円) (\ million) 77,665 81,454 104.9 93,371 114.6 106,725 114.3 121,866 114.2 15,141流動資産 Current Assets (百万円) (\ million) 50,921 53,506 105.1 59,941 112.0 67,725 113.0 70,410 104.0 2,685流動負債 Current Liabilities (百万円) (\ million) 20,881 19,197 91.9 22,954 119.6 26,126 113.8 35,596 136.2 9,470流動比率 Current Ratio (%) 243.9 278.7 261.1 259.2 197.8 △ 61.4現金及び現金同等物 Cash and Cash Equivalents (百万円) (\ million) 13,813 11,940 86.4 10,710 89.7 12,412 115.9 13,913 112.1 1,501棚卸資産 Inventories (百万円) (\ million) 14,993 16,549 110.4 18,786 113.5 18,890 100.6 104有利子負債 Interest-bearing Liabilities (百万円) (\ million) 4,044 764 18.9 1,280 167.5 625 48.8 7,329 1,172.6 6,704ネットキャッシュ Net Cash (百万円) (\ million) 11,176 9,430 84.4 11,786 125.0 6,584 55.9 △ 5,202インタレストカバレッジ比率 Interest Coverage Ratio (倍) (time) 275.3 528.0 426.5 495.4 52.4 △ 443.0純資産 ※ Net Assets ※ (百万円) (\ million) 53,405 58,689 109.9 67,520 115.0 76,906 113.9 78,980 102.7 2,074自己資本比率 ※ Equity Ratio ※ (%) 68.8 72.1 71.3 71.9 64.4 △ 7.5注:ネットキャッシュ=現金及び現金同等物-有利子負債 Note:Net Cash=Cash and Cash Equivalents - Interest-bearing Liabilities注:インタレストカバレッジ比率=営業活動によるキャッシュ・フロー/利息の支払額 Note:Interest Coverage Ratio=Cash Flow Operating Activities/Interest Expenses-Paid※過年度の数値については、従来の「株主資本」を「純資産」の欄に、「株主資本比率」を「自己資本比率」の欄に記載しております。※With regards to the figures for previous period, the original "Shareholders' Equity" is described in the "Net Assets" column, the original "Shareholders' Equity Ratio" in the "Equity Ratio"column.
2007.3 H.Y. 2008.3 H.Y. 項目 Item
2005.3 H.Y. 2006.3 H.Y.決算期 Fiscal Term
(前期比:%)(Growth:%)
2009.3 H.Y.
純資産、自己資本比率Net AssetsEquity Ratio
現金及び現金同等物、棚卸資産Cash and Cash EquivalentsInventories
資産および負債・純資産の状況
Assets, Liabilities and Net Assets
有利子負債、ネットキャッシュ、インタレストカバレッジ比率Interest-bearing LiabilitiesNet Cash, Interest Coverage Ratio
764 625
7,329
11,786
4,044
1,280
11,176
6,584
9,430
52.4
495.4
275.3426.5
528.0
0
2,000
4,000
6,000
8,000
10,000
12,000
'05.3 H.Y. '06.3 H.Y. '07.3 H.Y. '08.3 H.Y. '09.3 H.Y.
■ 有利子負債
Interest-bearing Liabilities■ ネットキャッシュ
Net Cash■ インタレストカバレッジ比率(倍)
Interest Coverage Ratio (time)
(百万円)(\ million)
総資産、流動資産、流動負債、流動比率Total Assets, Current AssetsCurrent Liabilities, Current Ratio
81,454
93,371106,725
77,665
121,866
50,921 53,50659,941
70,41067,725
22,95420,881 35,59626,12619,197
197.8243.9 261.1 259.2278.7
0
20,000
40,000
60,000
80,000
100,000
120,000
140,000
'05.3 H.Y. '06.3 H.Y. '07.3 H.Y. '08.3 H.Y. '09.3 H.Y.
(百万円)(\ million)
■ 総資産
Total Assets■ 流動資産
Current Assets■ 流動負債
Current Liabilities■ 流動比率(%)
Current Ratio
(百万円)(\ million)
53,405
76,906 78,980
58,689
67,520
64.471.968.8 72.1 71.3
0
10,000
20,000
30,000
40,000
50,000
60,000
70,000
80,000
90,000
'05.3 H.Y. '06.3 H.Y. '07.3 H.Y. '08.3 H.Y. '09.3 H.Y.
■ 純資産
Net Assets■ 自己資本比率(%)
Equity Ratio
13,81311,940
10,710
13,913
16,549
18,786 18,890
12,412
14,993
0
5,000
10,000
15,000
20,000
'05.3 H.Y. '06.3 H.Y. '07.3 H.Y. '08.3 H.Y. '09.3 H.Y.
(百万円)(\ million)
■ 現金及び現金同等物
Cash and Cash Equivalents■ 棚卸資産
Inventories
8
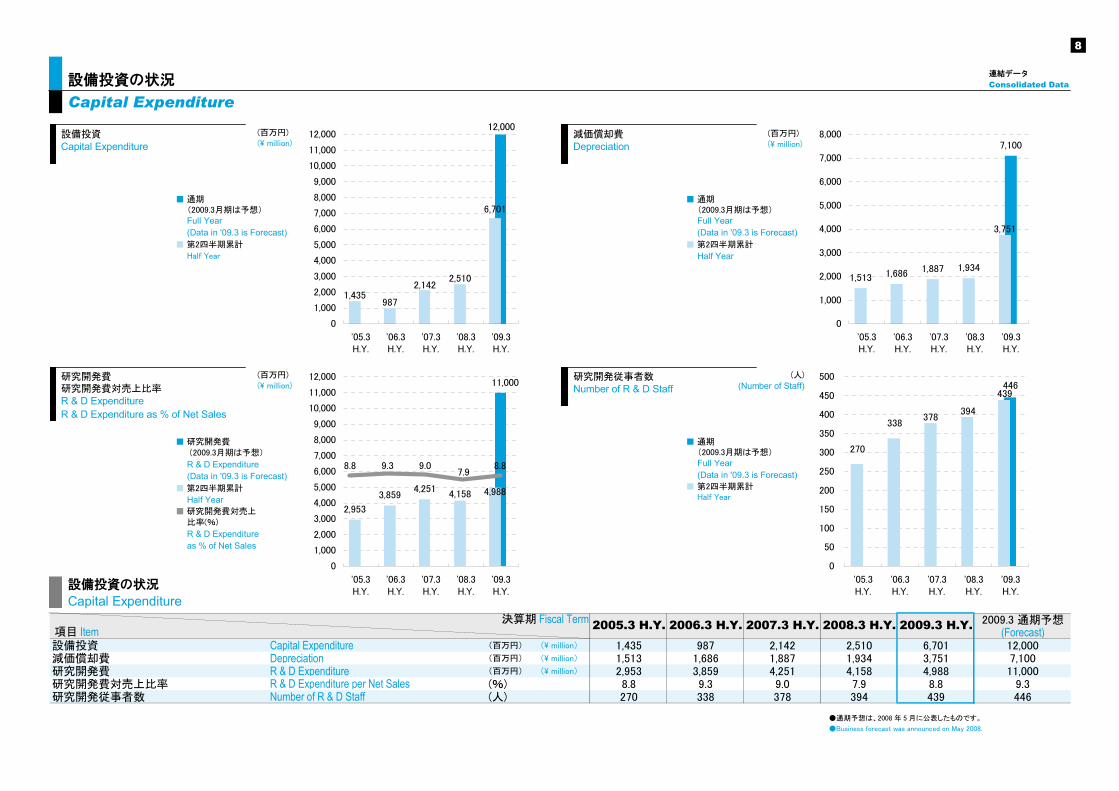
連結データ Consolidated Data 設備投資の状況
Capital Expenditure
2009.3 通期予想(Forecast)
設備投資 Capital Expenditure (百万円) (\ million) 1,435 987 2,142 2,510 6,701 12,000減価償却費 Depreciation (百万円) (\ million) 1,513 1,686 1,887 1,934 3,751 7,100研究開発費 R & D Expenditure (百万円) (\ million) 2,953 3,859 4,251 4,158 4,988 11,000研究開発費対売上比率 R & D Expenditure per Net Sales (%) 8.8 9.3 9.0 7.9 8.8 9.3研究開発従事者数 Number of R & D Staff (人) 270 338 378 394 439 446
●通期予想は、2008年10月に公表(修正)したものです。
●Business forecast was announced(revised) on October 2008.
決算期 Fiscal Term 2009.3 H.Y.2008.3 H.Y.2005.3 H.Y. 2006.3 H.Y. 2007.3 H.Y. 項目 Item
設備投資Capital Expenditure
減価償却費Depreciation
研究開発費研究開発費対売上比率R & D ExpenditureR & D Expenditure as % of Net Sales
研究開発従事者数Number of R & D Staff
■ 研究開発費 (2009.3月期は予想)
R & D Expenditure (Data in '09.3 is Forecast)■ 第2四半期累計
Half Year■ 研究開発費対売上 比率(%)
R & D Expenditure as % of Net Sales
11,000
2,953
3,8594,251
4,158 4,988
0
1,000
2,000
3,000
4,000
5,000
6,000
7,000
8,000
9,000
10,000
11,000
12,000
'05.3H.Y.
'06.3H.Y.
'07.3H.Y.
'08.3H.Y.
'09.3H.Y.
8.87.9
9.09.38.8
(百万円)(\ million)
12,000
1,4352,142
2,510
987
6,701
0
1,000
2,000
3,000
4,000
5,000
6,000
7,000
8,000
9,000
10,000
11,000
12,000
'05.3H.Y.
'06.3H.Y.
'07.3H.Y.
'08.3H.Y.
'09.3H.Y.
(百万円)(\ million)
■ 通期 (2009.3月期は予想)
Full Year (Data in '09.3 is Forecast)■ 第2四半期累計
Half Year
(百万円)(\ million) 7,100
3,751
1,513 1,686 1,887 1,934
0
1,000
2,000
3,000
4,000
5,000
6,000
7,000
8,000
'05.3H.Y.
'06.3H.Y.
'07.3H.Y.
'08.3H.Y.
'09.3H.Y.
■ 通期 (2009.3月期は予想)
Full Year (Data in '09.3 is Forecast)■ 第2四半期累計
Half Year
446
394338
270
378
439
0
50
100
150
200
250
300
350
400
450
500
'05.3H.Y.
'06.3H.Y.
'07.3H.Y.
'08.3H.Y.
'09.3H.Y.
(人)(Number of Staff)
■ 通期 (2009.3月期は予想)
Full Year (Data in '09.3 is Forecast)■ 第2四半期累計 Half Year
設備投資の状況
Capital Expenditure
●通期予想は、2008 年 5 月に公表したものです。
●Business forecast was announced on May 2008.
9
(百万円)(\ million)
2009.3 通期予想(Forecast)
Ratio Growth Ratio Growth Ratio Growth Ratio Growth Ratio Growth(%) (%) (%) (%) (%) (%) (%) (%) (%) (%)
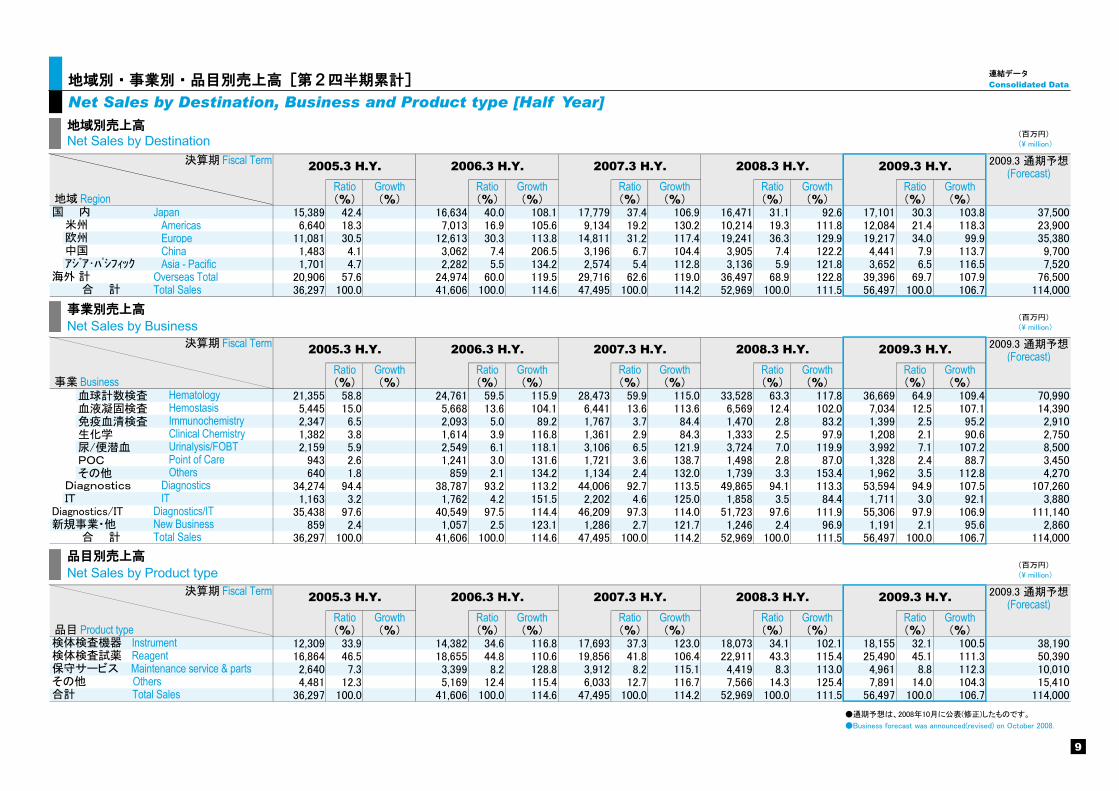
Japan 15,389 42.4 16,634 40.0 108.1 17,779 37.4 106.9 16,471 31.1 92.6 17,101 30.3 103.8 37,500 Americas 6,640 18.3 7,013 16.9 105.6 9,134 19.2 130.2 10,214 19.3 111.8 12,084 21.4 118.3 23,900 Europe 11,081 30.5 12,613 30.3 113.8 14,811 31.2 117.4 19,241 36.3 129.9 19,217 34.0 99.9 35,380 China 1,483 4.1 3,062 7.4 206.5 3,196 6.7 104.4 3,905 7.4 122.2 4,441 7.9 113.7 9,700 Asia - Pacific 1,701 4.7 2,282 5.5 134.2 2,574 5.4 112.8 3,136 5.9 121.8 3,652 6.5 116.5 7,520Overseas Total 20,906 57.6 24,974 60.0 119.5 29,716 62.6 119.0 36,497 68.9 122.8 39,396 69.7 107.9 76,500Total Sales 36,297 100.0 41,606 100.0 114.6 47,495 100.0 114.2 52,969 100.0 111.5 56,497 100.0 106.7 114,000
(百万円)(\ million)
2009.3 通期予想(Forecast)
Ratio Growth Ratio Growth Ratio Growth Ratio Growth Ratio Growth(%) (%) (%) (%) (%) (%) (%) (%) (%) (%)
血球計数検査 21,355 58.8 24,761 59.5 115.9 28,473 59.9 115.0 33,528 63.3 117.8 36,669 64.9 109.4 70,990血液凝固検査 5,445 15.0 5,668 13.6 104.1 6,441 13.6 113.6 6,569 12.4 102.0 7,034 12.5 107.1 14,390免疫血清検査 2,347 6.5 2,093 5.0 89.2 1,767 3.7 84.4 1,470 2.8 83.2 1,399 2.5 95.2 2,910生化学 1,382 3.8 1,614 3.9 116.8 1,361 2.9 84.3 1,333 2.5 97.9 1,208 2.1 90.6 2,750尿/便潜血 2,159 5.9 2,549 6.1 118.1 3,106 6.5 121.9 3,724 7.0 119.9 3,992 7.1 107.2 8,500POC 943 2.6 1,241 3.0 131.6 1,721 3.6 138.7 1,498 2.8 87.0 1,328 2.4 88.7 3,450その他 640 1.8 859 2.1 134.2 1,134 2.4 132.0 1,739 3.3 153.4 1,962 3.5 112.8 4,270
34,274 94.4 38,787 93.2 113.2 44,006 92.7 113.5 49,865 94.1 113.3 53,594 94.9 107.5 107,2601,163 3.2 1,762 4.2 151.5 2,202 4.6 125.0 1,858 3.5 84.4 1,711 3.0 92.1 3,880
35,438 97.6 40,549 97.5 114.4 46,209 97.3 114.0 51,723 97.6 111.9 55,306 97.9 106.9 111,140859 2.4 1,057 2.5 123.1 1,286 2.7 121.7 1,246 2.4 96.9 1,191 2.1 95.6 2,860
36,297 100.0 41,606 100.0 114.6 47,495 100.0 114.2 52,969 100.0 111.5 56,497 100.0 106.7 114,000
(百万円)(\ million)
2009.3 通期予想(Forecast)
Ratio Growth Ratio Growth Ratio Growth Ratio Growth Ratio Growth(%) (%) (%) (%) (%) (%) (%) (%) (%) (%)
12,309 33.9 14,382 34.6 116.8 17,693 37.3 123.0 18,073 34.1 102.1 18,155 32.1 100.5 38,19016,864 46.5 18,655 44.8 110.6 19,856 41.8 106.4 22,911 43.3 115.4 25,490 45.1 111.3 50,3902,640 7.3 3,399 8.2 128.8 3,912 8.2 115.1 4,419 8.3 113.0 4,961 8.8 112.3 10,0104,481 12.3 5,169 12.4 115.4 6,033 12.7 116.7 7,566 14.3 125.4 7,891 14.0 104.3 15,410
36,297 100.0 41,606 100.0 114.6 47,495 100.0 114.2 52,969 100.0 111.5 56,497 100.0 106.7 114,000
●通期予想は、2008年10月に公表(修正)したものです。
●Business forecast was announced(revised) on October 2008.
決算期 Fiscal Term
Immunochemistry Clinical Chemistry
New Business新規事業・他Total Sales合 計
Diagnostics
Diagnostics/IT Diagnostics/IT
合計 Total Salesその他 Others
検体検査機器 Instrument 品目 Product type
検体検査試薬 Reagent保守サービス Maintenance service & parts
2009.3 H.Y.
2009.3 H.Y.
2005.3 H.Y. 2006.3 H.Y. 2007.3 H.Y. 2008.3 H.Y.
2007.3 H.Y. 2008.3 H.Y. 2009.3 H.Y.2006.3 H.Y.
Diagnostics
2005.3 H.Y.
Point of Care Others
海外 計合 計
IT
決算期 Fiscal Term
Hemostasis Hematology
事業 Business
IT
Urinalysis/FOBT
2008.3 H.Y.2006.3 H.Y. 2007.3 H.Y.決算期 Fiscal Term 2005.3 H.Y.
地域 Region
米州欧州
アジア・パシフィック中国
国 内
事業別売上高
Net Sales by Business
品目別売上高
Net Sales by Product type
地域別売上高Net Sales by Destination
連結データ Consolidated Data 地域別・事業別・品目別売上高[第2四半期累計]
Net Sales by Destination, Business and Product type [Half Year]
10
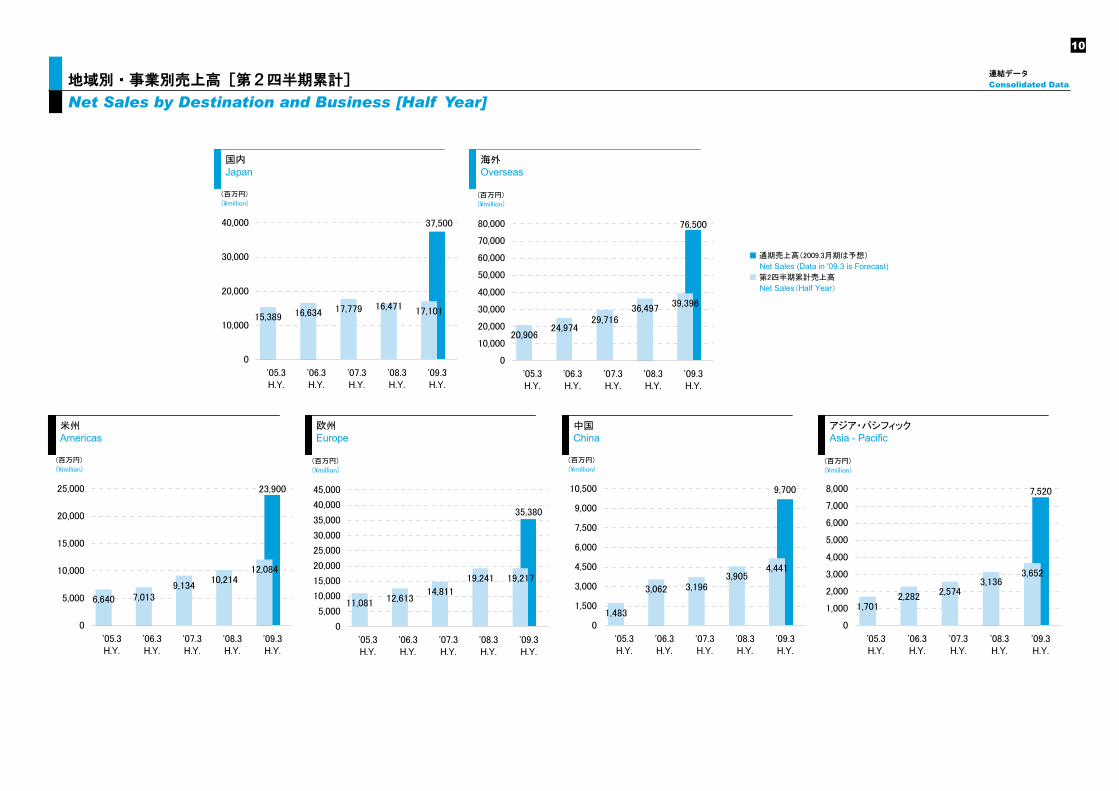
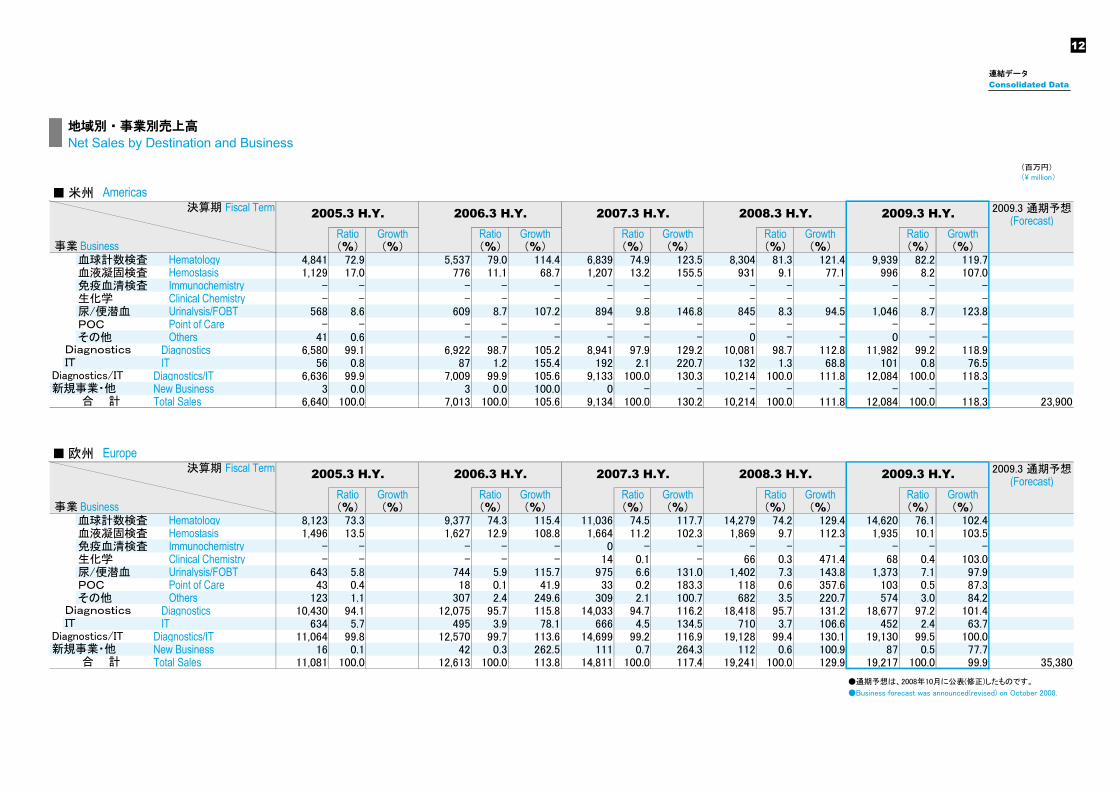
連結データ Consolidated Data 地域別・事業別売上高[第2四半期累計]
Net Sales by Destination and Business [Half Year]
米州Americas
23,900
12,08410,214
6,640 7,0139,134
0
5,000
10,000
15,000
20,000
25,000
'05.3H.Y.
'06.3H.Y.
'07.3H.Y.
'08.3H.Y.
'09.3H.Y.
(百万円)(\million)
海外Overseas
76,500
39,39636,497
20,90624,974
29,716
0
10,000
20,000
30,000
40,000
50,000
60,000
70,000
80,000
'05.3H.Y.
'06.3H.Y.
'07.3H.Y.
'08.3H.Y.
'09.3H.Y.
(百万円)(\million)
国内Japan
37,500
16,47117,77916,63415,38917,101
0
10,000
20,000
30,000
40,000
'05.3H.Y.
'06.3H.Y.
'07.3H.Y.
'08.3H.Y.
'09.3H.Y.
(百万円)(\million)
中国China
9,700
4,4413,905
1,483
3,062 3,196
0
1,500
3,000
4,500
6,000
7,500
9,000
10,500
'05.3H.Y.
'06.3H.Y.
'07.3H.Y.
'08.3H.Y.
'09.3H.Y.
(百万円)(\million)
アジア・パシフィックAsia - Pacific
7,520
2,5742,2821,701
3,1363,652
0
1,000
2,000
3,000
4,000
5,000
6,000
7,000
8,000
'05.3H.Y.
'06.3H.Y.
'07.3H.Y.
'08.3H.Y.
'09.3H.Y.
(百万円)(\million)
欧州Europe
35,380
19,21719,241
11,081 12,61314,811
0
5,000
10,000
15,000
20,000
25,000
30,000
35,000
40,000
45,000
'05.3H.Y.
'06.3H.Y.
'07.3H.Y.
'08.3H.Y.
'09.3H.Y.
(百万円)(\million)
■ 通期売上高(2009.3月期は予想)
Net Sales (Data in '09.3 is Forecast)■ 第2四半期累計売上高
Net Sales(Half Year)
11
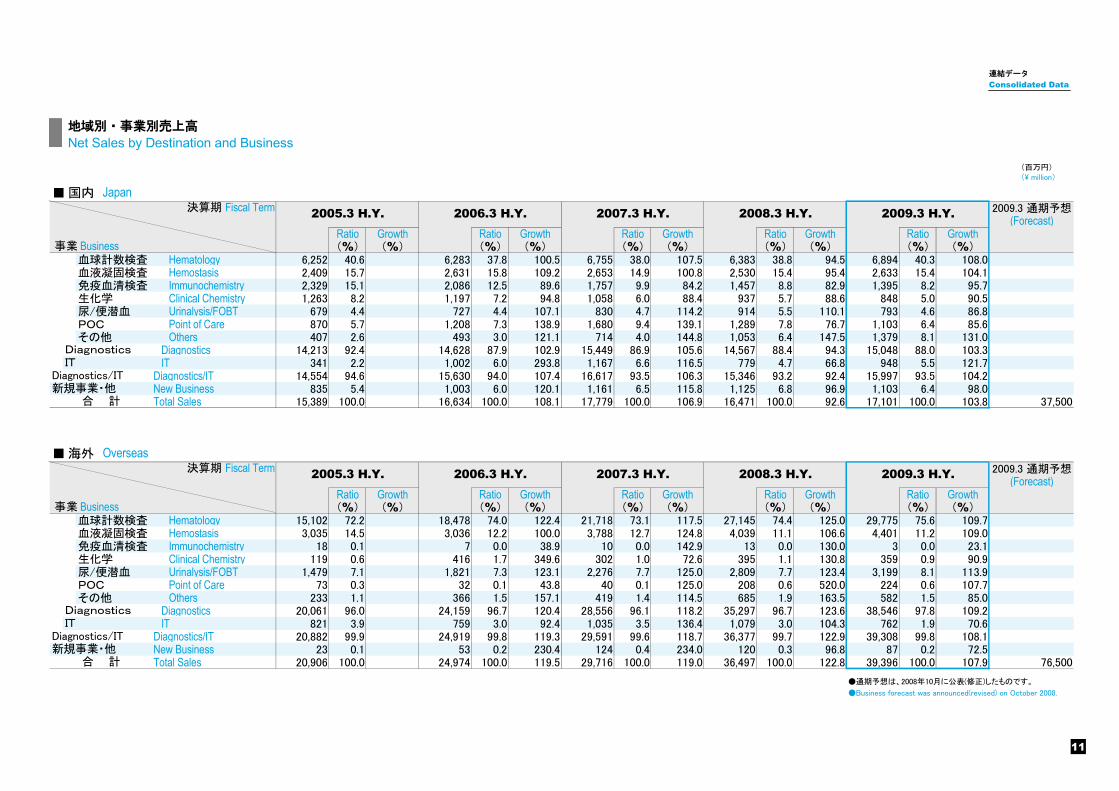
連結データ Consolidated Data
(百万円)(\ million)
■ 国内 Japan2009.3 通期予想
(Forecast)Ratio Growth Ratio Growth Ratio Growth Ratio Growth Ratio Growth(%) (%) (%) (%) (%) (%) (%) (%) (%) (%)
血球計数検査 Hematology 6,252 40.6 6,283 37.8 100.5 6,755 38.0 107.5 6,383 38.8 94.5 6,894 40.3 108.0血液凝固検査 Hemostasis 2,409 15.7 2,631 15.8 109.2 2,653 14.9 100.8 2,530 15.4 95.4 2,633 15.4 104.1免疫血清検査 Immunochemistry 2,329 15.1 2,086 12.5 89.6 1,757 9.9 84.2 1,457 8.8 82.9 1,395 8.2 95.7生化学 Clinical Chemistry 1,263 8.2 1,197 7.2 94.8 1,058 6.0 88.4 937 5.7 88.6 848 5.0 90.5尿/便潜血 Urinalysis/FOBT 679 4.4 727 4.4 107.1 830 4.7 114.2 914 5.5 110.1 793 4.6 86.8POC Point of Care 870 5.7 1,208 7.3 138.9 1,680 9.4 139.1 1,289 7.8 76.7 1,103 6.4 85.6その他 Others 407 2.6 493 3.0 121.1 714 4.0 144.8 1,053 6.4 147.5 1,379 8.1 131.0
Diagnostics 14,213 92.4 14,628 87.9 102.9 15,449 86.9 105.6 14,567 88.4 94.3 15,048 88.0 103.3 IT 341 2.2 1,002 6.0 293.8 1,167 6.6 116.5 779 4.7 66.8 948 5.5 121.7Diagnostics/IT 14,554 94.6 15,630 94.0 107.4 16,617 93.5 106.3 15,346 93.2 92.4 15,997 93.5 104.2New Business 835 5.4 1,003 6.0 120.1 1,161 6.5 115.8 1,125 6.8 96.9 1,103 6.4 98.0Total Sales 15,389 100.0 16,634 100.0 108.1 17,779 100.0 106.9 16,471 100.0 92.6 17,101 100.0 103.8 37,500
■ 海外 Overseas2009.3 通期予想
(Forecast)Ratio Growth Ratio Growth Ratio Growth Ratio Growth Ratio Growth(%) (%) (%) (%) (%) (%) (%) (%) (%) (%)
血球計数検査 Hematology 15,102 72.2 18,478 74.0 122.4 21,718 73.1 117.5 27,145 74.4 125.0 29,775 75.6 109.7血液凝固検査 Hemostasis 3,035 14.5 3,036 12.2 100.0 3,788 12.7 124.8 4,039 11.1 106.6 4,401 11.2 109.0免疫血清検査 Immunochemistry 18 0.1 7 0.0 38.9 10 0.0 142.9 13 0.0 130.0 3 0.0 23.1生化学 Clinical Chemistry 119 0.6 416 1.7 349.6 302 1.0 72.6 395 1.1 130.8 359 0.9 90.9尿/便潜血 Urinalysis/FOBT 1,479 7.1 1,821 7.3 123.1 2,276 7.7 125.0 2,809 7.7 123.4 3,199 8.1 113.9POC Point of Care 73 0.3 32 0.1 43.8 40 0.1 125.0 208 0.6 520.0 224 0.6 107.7その他 Others 233 1.1 366 1.5 157.1 419 1.4 114.5 685 1.9 163.5 582 1.5 85.0
Diagnostics 20,061 96.0 24,159 96.7 120.4 28,556 96.1 118.2 35,297 96.7 123.6 38,546 97.8 109.2 IT 821 3.9 759 3.0 92.4 1,035 3.5 136.4 1,079 3.0 104.3 762 1.9 70.6Diagnostics/IT 20,882 99.9 24,919 99.8 119.3 29,591 99.6 118.7 36,377 99.7 122.9 39,308 99.8 108.1New Business 23 0.1 53 0.2 230.4 124 0.4 234.0 120 0.3 96.8 87 0.2 72.5Total Sales 20,906 100.0 24,974 100.0 119.5 29,716 100.0 119.0 36,497 100.0 122.8 39,396 100.0 107.9 76,500
●通期予想は、2008年10月に公表(修正)したものです。
●Business forecast was announced(revised) on October 2008.
2009.3 H.Y.2005.3 H.Y.
決算期 Fiscal Term 2005.3 H.Y. 2006.3 H.Y. 2007.3 H.Y. 2008.3 H.Y. 2009.3 H.Y.
事業 Business
新規事業・他
Diagnostics
Diagnostics
IT
合 計
Diagnostics/IT
2006.3 H.Y. 2007.3 H.Y. 2008.3 H.Y.
合 計
Diagnostics/IT新規事業・他
決算期 Fiscal Term
事業 Business
IT
地域別・事業別売上高
Net Sales by Destination and Business
12
連結データ Consolidated Data
(百万円)(\ million)
■ 米州 Americas2009.3 通期予想
(Forecast)Ratio Growth Ratio Growth Ratio Growth Ratio Growth Ratio Growth(%) (%) (%) (%) (%) (%) (%) (%) (%) (%)
血球計数検査 Hematology 4,841 72.9 5,537 79.0 114.4 6,839 74.9 123.5 8,304 81.3 121.4 9,939 82.2 119.7血液凝固検査 Hemostasis 1,129 17.0 776 11.1 68.7 1,207 13.2 155.5 931 9.1 77.1 996 8.2 107.0免疫血清検査 Immunochemistry - - - - - - - - - - - - - -生化学 Clinical Chemistry - - - - - - - - - - - - - -尿/便潜血 Urinalysis/FOBT 568 8.6 609 8.7 107.2 894 9.8 146.8 845 8.3 94.5 1,046 8.7 123.8POC Point of Care - - - - - - - - - - - - - -その他 Others 41 0.6 - - - - - - 0 - - 0 - -
Diagnostics 6,580 99.1 6,922 98.7 105.2 8,941 97.9 129.2 10,081 98.7 112.8 11,982 99.2 118.9 IT 56 0.8 87 1.2 155.4 192 2.1 220.7 132 1.3 68.8 101 0.8 76.5Diagnostics/IT 6,636 99.9 7,009 99.9 105.6 9,133 100.0 130.3 10,214 100.0 111.8 12,084 100.0 118.3New Business 3 0.0 3 0.0 100.0 0 - - - - - - - -Total Sales 6,640 100.0 7,013 100.0 105.6 9,134 100.0 130.2 10,214 100.0 111.8 12,084 100.0 118.3 23,900
■ 欧州 Europe2009.3 通期予想
(Forecast)Ratio Growth Ratio Growth Ratio Growth Ratio Growth Ratio Growth(%) (%) (%) (%) (%) (%) (%) (%) (%) (%)
血球計数検査 Hematology 8,123 73.3 9,377 74.3 115.4 11,036 74.5 117.7 14,279 74.2 129.4 14,620 76.1 102.4血液凝固検査 Hemostasis 1,496 13.5 1,627 12.9 108.8 1,664 11.2 102.3 1,869 9.7 112.3 1,935 10.1 103.5免疫血清検査 Immunochemistry - - - - - 0 - - - - - - - -生化学 Clinical Chemistry - - - - - 14 0.1 - 66 0.3 471.4 68 0.4 103.0尿/便潜血 Urinalysis/FOBT 643 5.8 744 5.9 115.7 975 6.6 131.0 1,402 7.3 143.8 1,373 7.1 97.9POC Point of Care 43 0.4 18 0.1 41.9 33 0.2 183.3 118 0.6 357.6 103 0.5 87.3その他 Others 123 1.1 307 2.4 249.6 309 2.1 100.7 682 3.5 220.7 574 3.0 84.2
Diagnostics 10,430 94.1 12,075 95.7 115.8 14,033 94.7 116.2 18,418 95.7 131.2 18,677 97.2 101.4 IT 634 5.7 495 3.9 78.1 666 4.5 134.5 710 3.7 106.6 452 2.4 63.7Diagnostics/IT 11,064 99.8 12,570 99.7 113.6 14,699 99.2 116.9 19,128 99.4 130.1 19,130 99.5 100.0New Business 16 0.1 42 0.3 262.5 111 0.7 264.3 112 0.6 100.9 87 0.5 77.7Total Sales 11,081 100.0 12,613 100.0 113.8 14,811 100.0 117.4 19,241 100.0 129.9 19,217 100.0 99.9 35,380
●通期予想は、2008年10月に公表(修正)したものです。
●Business forecast was announced(revised) on October 2008.
2006.3 H.Y. 2009.3 H.Y.2007.3 H.Y. 2008.3 H.Y.
2009.3 H.Y.
Diagnostics
事業 Business
2006.3 H.Y. 2007.3 H.Y. 2008.3 H.Y.決算期 Fiscal Term 2005.3 H.Y.
IT
合 計
DiagnosticsIT
事業 Business
決算期 Fiscal Term 2005.3 H.Y.
新規事業・他
新規事業・他Diagnostics/IT
合 計
Diagnostics/IT
地域別・事業別売上高
Net Sales by Destination and Business
13
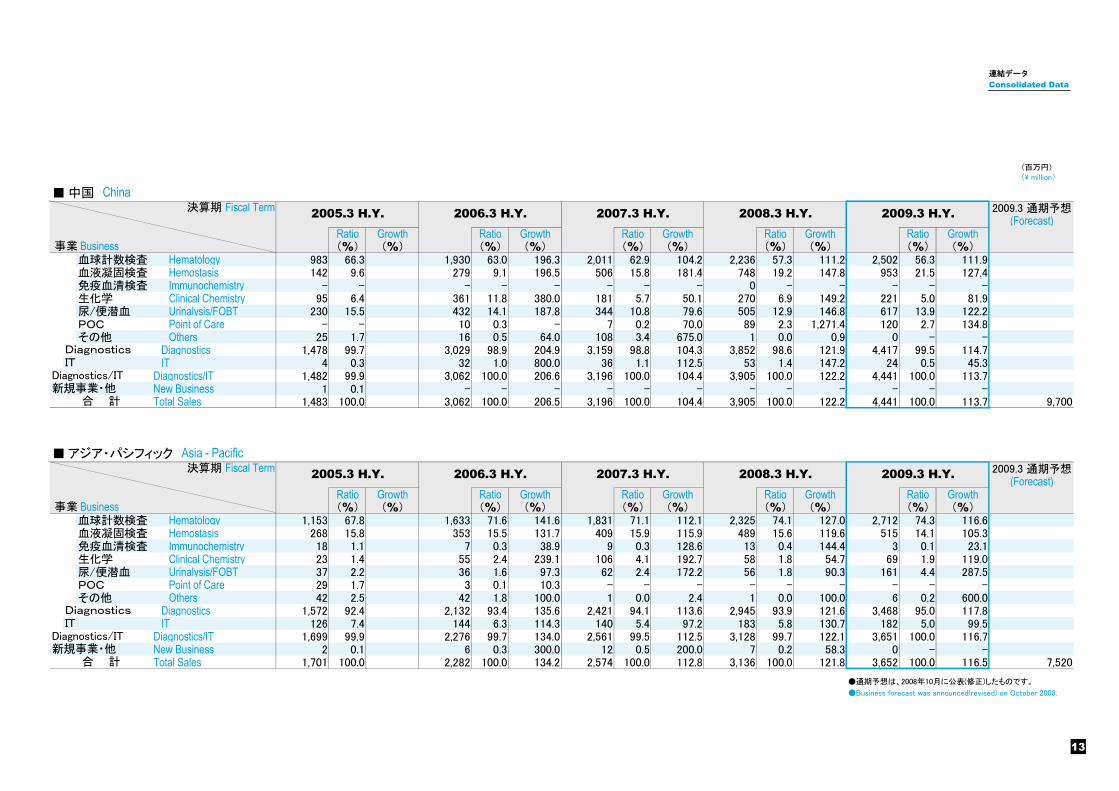
連結データ Consolidated Data
(百万円)(\ million)
■ 中国 China2009.3 通期予想
(Forecast)Ratio Growth Ratio Growth Ratio Growth Ratio Growth Ratio Growth(%) (%) (%) (%) (%) (%) (%) (%) (%) (%)
血球計数検査 Hematology 983 66.3 1,930 63.0 196.3 2,011 62.9 104.2 2,236 57.3 111.2 2,502 56.3 111.9血液凝固検査 Hemostasis 142 9.6 279 9.1 196.5 506 15.8 181.4 748 19.2 147.8 953 21.5 127.4免疫血清検査 Immunochemistry - - - - - - - - 0 - - - - -生化学 Clinical Chemistry 95 6.4 361 11.8 380.0 181 5.7 50.1 270 6.9 149.2 221 5.0 81.9尿/便潜血 Urinalysis/FOBT 230 15.5 432 14.1 187.8 344 10.8 79.6 505 12.9 146.8 617 13.9 122.2POC Point of Care - - 10 0.3 - 7 0.2 70.0 89 2.3 1,271.4 120 2.7 134.8その他 Others 25 1.7 16 0.5 64.0 108 3.4 675.0 1 0.0 0.9 0 - -
Diagnostics 1,478 99.7 3,029 98.9 204.9 3,159 98.8 104.3 3,852 98.6 121.9 4,417 99.5 114.7 IT 4 0.3 32 1.0 800.0 36 1.1 112.5 53 1.4 147.2 24 0.5 45.3Diagnostics/IT 1,482 99.9 3,062 100.0 206.6 3,196 100.0 104.4 3,905 100.0 122.2 4,441 100.0 113.7New Business 1 0.1 - - - - - - - - - - - -Total Sales 1,483 100.0 3,062 100.0 206.5 3,196 100.0 104.4 3,905 100.0 122.2 4,441 100.0 113.7 9,700
■ アジア・パシフィック Asia - Pacific2009.3 通期予想
(Forecast)Ratio Growth Ratio Growth Ratio Growth Ratio Growth Ratio Growth(%) (%) (%) (%) (%) (%) (%) (%) (%) (%)
血球計数検査 Hematology 1,153 67.8 1,633 71.6 141.6 1,831 71.1 112.1 2,325 74.1 127.0 2,712 74.3 116.6血液凝固検査 Hemostasis 268 15.8 353 15.5 131.7 409 15.9 115.9 489 15.6 119.6 515 14.1 105.3免疫血清検査 Immunochemistry 18 1.1 7 0.3 38.9 9 0.3 128.6 13 0.4 144.4 3 0.1 23.1生化学 Clinical Chemistry 23 1.4 55 2.4 239.1 106 4.1 192.7 58 1.8 54.7 69 1.9 119.0尿/便潜血 Urinalysis/FOBT 37 2.2 36 1.6 97.3 62 2.4 172.2 56 1.8 90.3 161 4.4 287.5POC Point of Care 29 1.7 3 0.1 10.3 - - - - - - - - -その他 Others 42 2.5 42 1.8 100.0 1 0.0 2.4 1 0.0 100.0 6 0.2 600.0
Diagnostics 1,572 92.4 2,132 93.4 135.6 2,421 94.1 113.6 2,945 93.9 121.6 3,468 95.0 117.8 IT 126 7.4 144 6.3 114.3 140 5.4 97.2 183 5.8 130.7 182 5.0 99.5Diagnostics/IT 1,699 99.9 2,276 99.7 134.0 2,561 99.5 112.5 3,128 99.7 122.1 3,651 100.0 116.7New Business 2 0.1 6 0.3 300.0 12 0.5 200.0 7 0.2 58.3 0 - -Total Sales 1,701 100.0 2,282 100.0 134.2 2,574 100.0 112.8 3,136 100.0 121.8 3,652 100.0 116.5 7,520
●通期予想は、2008年10月に公表(修正)したものです。
●Business forecast was announced(revised) on October 2008.
2009.3 H.Y.2005.3 H.Y. 2006.3 H.Y. 2007.3 H.Y. 2008.3 H.Y.
2009.3 H.Y.2005.3 H.Y. 2006.3 H.Y. 2007.3 H.Y. 2008.3 H.Y.
Diagnostics/IT
Diagnostics
合 計
DiagnosticsIT
Diagnostics/IT新規事業・他
新規事業・他
決算期 Fiscal Term
IT
事業 Business
決算期 Fiscal Term
事業 Business
合 計
14
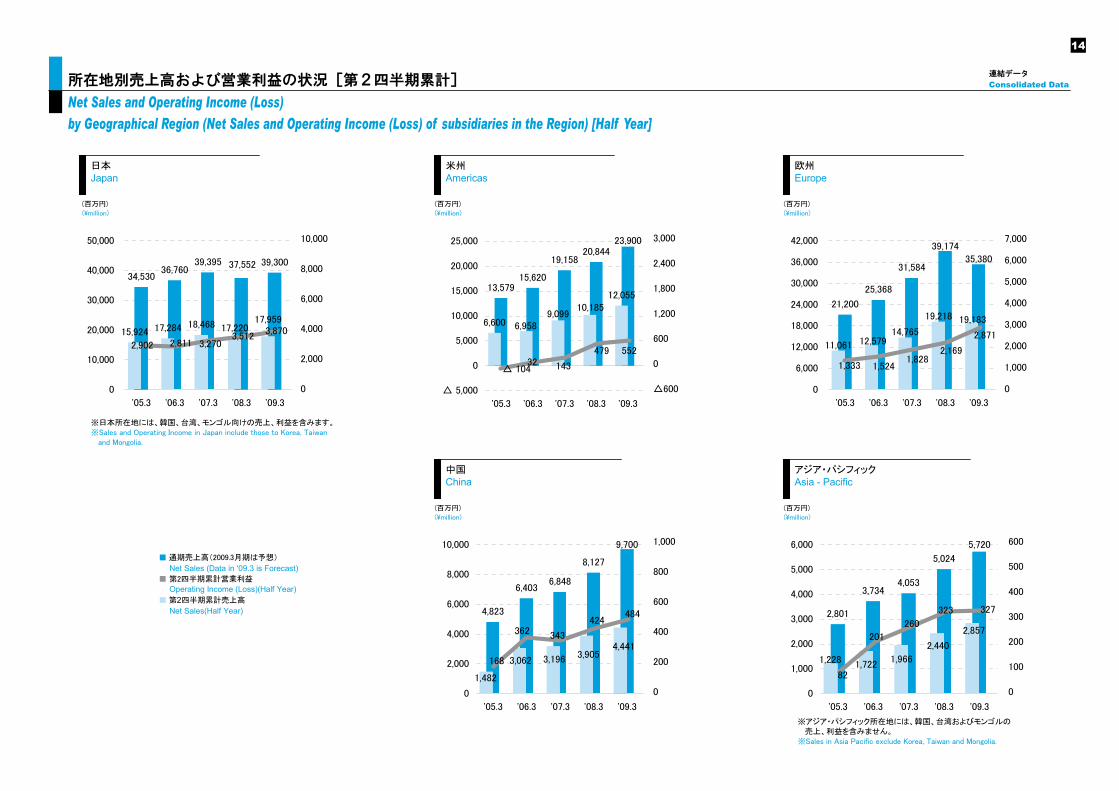
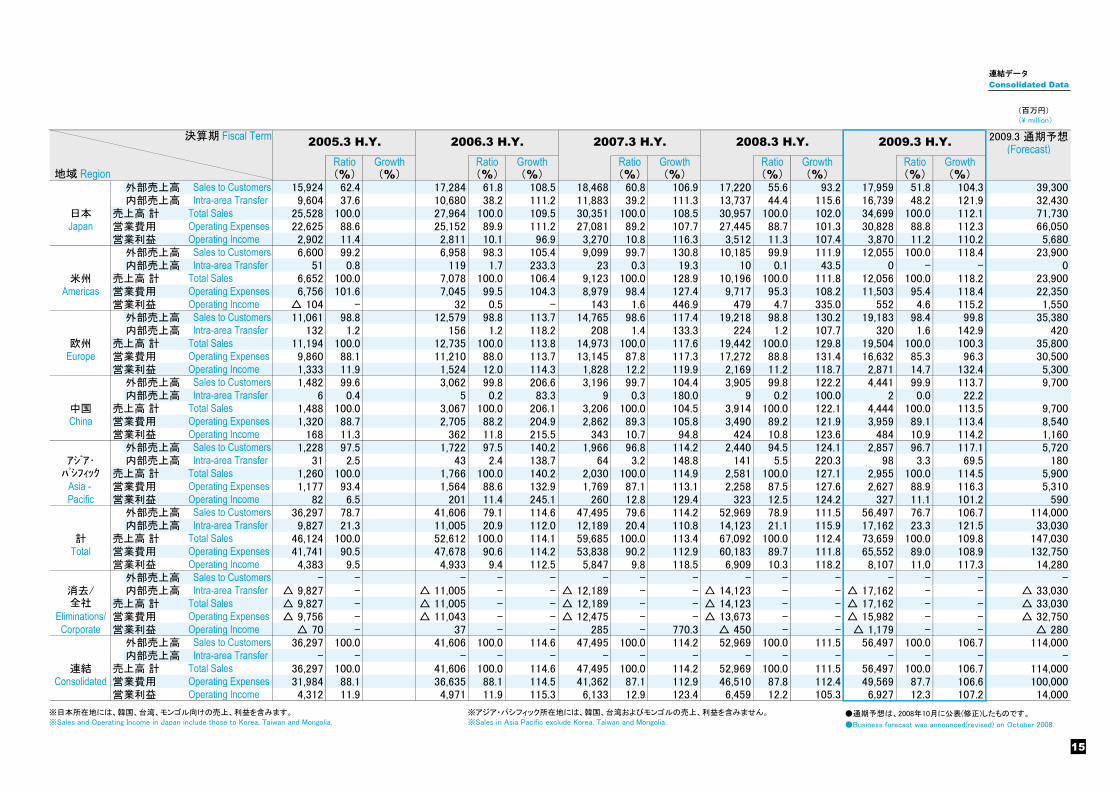
連結データ Consolidated Data 所在地別売上高および営業利益の状況[第2四半期累計]
Net Sales and Operating Income (Loss) by Geographical Region (Net Sales and Operating Income (Loss) of subsidiaries in the Region) [Half Year]
34,53036,760
39,395 39,30037,552
15,924 17,22017,284 18,468 17,959
0
10,000
20,000
30,000
40,000
50,000
'05.3 '06.3 '07.3 '08.3 '09.3
0
10,000
20,000
30,000
40,000
50,000
(百万円)(\million)
3,870
2,902 2,811 3,2703,512
0
2,000
4,000
6,000
8,000
10,000
日本Japan
(百万円)(\million)
4,823
6,4036,848
8,127
9,700
1,482
3,062 3,196
4,4413,905
0
2,000
4,000
6,000
8,000
10,000
'05.3 '06.3 '07.3 '08.3 '09.3
0
2,000
4,000
6,000
8,000
10,000
168
362 343
424484
0
200
400
600
800
1,000
中国China
(百万円)(\million)
13,57915,620
19,15820,844
23,900
6,600
12,05510,185
9,0996,958
△ 5,000
0
5,000
10,000
15,000
20,000
25,000
'05.3 '06.3 '07.3 '08.3 '09.3
(5,000)
0
5,000
10,000
15,000
20,000
25,000
552
△ 10432 143
479
△600
0
600
1,200
1,800
2,400
3,000
米州Americas
■ 通期売上高(2009.3月期は予想)
Net Sales (Data in '09.3 is Forecast)■ 第2四半期累計営業利益
Operating Income (Loss)(Half Year)■ 第2四半期累計売上高
Net Sales(Half Year)
(百万円)(\million)
21,200
25,368
31,584
39,174
35,380
19,183
11,061 12,57914,765
19,218
0
6,000
12,000
18,000
24,000
30,000
36,000
42,000
'05.3 '06.3 '07.3 '08.3 '09.3
0
6,000
12,000
18,000
24,000
30,000
36,000
42,000
2,871
2,1691,828
1,5241,333
0
1,000
2,000
3,000
4,000
5,000
6,000
7,000
欧州Europe
(百万円)(\million)
2,801
3,7344,053
5,024
5,720
1,228 1,7221,966
2,440
2,857
0
1,000
2,000
3,000
4,000
5,000
6,000
'05.3 '06.3 '07.3 '08.3 '09.3
0
1,000
2,000
3,000
4,000
5,000
6,000
327
82
201
260
323
0
100
200
300
400
500
600
アジア・パシフィックAsia - Pacific
※日本所在地には、韓国、台湾、モンゴル向けの売上、利益を含みます。※Sales and Operating Income in Japan include those to Korea, Taiwan and Mongolia.
※アジア・パシフィック所在地には、韓国、台湾およびモンゴルの 売上、利益を含みません。※Sales in Asia Pacific exclude Korea, Taiwan and Mongolia.
15
連結データ Consolidated Data
(百万円)(\ million)
2009.3 通期予想(Forecast)
Ratio Growth Ratio Growth Ratio Growth Ratio Growth Ratio Growth(%) (%) (%) (%) (%) (%) (%) (%) (%) (%)
外部売上高 Sales to Customers 15,924 62.4 17,284 61.8 108.5 18,468 60.8 106.9 17,220 55.6 93.2 17,959 51.8 104.3 39,300内部売上高 Intra-area Transfer 9,604 37.6 10,680 38.2 111.2 11,883 39.2 111.3 13,737 44.4 115.6 16,739 48.2 121.9 32,430
日本 売上高 計 Total Sales 25,528 100.0 27,964 100.0 109.5 30,351 100.0 108.5 30,957 100.0 102.0 34,699 100.0 112.1 71,730Japan 営業費用 Operating Expenses 22,625 88.6 25,152 89.9 111.2 27,081 89.2 107.7 27,445 88.7 101.3 30,828 88.8 112.3 66,050
営業利益 Operating Income 2,902 11.4 2,811 10.1 96.9 3,270 10.8 116.3 3,512 11.3 107.4 3,870 11.2 110.2 5,680外部売上高 Sales to Customers 6,600 99.2 6,958 98.3 105.4 9,099 99.7 130.8 10,185 99.9 111.9 12,055 100.0 118.4 23,900内部売上高 Intra-area Transfer 51 0.8 119 1.7 233.3 23 0.3 19.3 10 0.1 43.5 0 - - 0
米州 売上高 計 Total Sales 6,652 100.0 7,078 100.0 106.4 9,123 100.0 128.9 10,196 100.0 111.8 12,056 100.0 118.2 23,900Americas 営業費用 Operating Expenses 6,756 101.6 7,045 99.5 104.3 8,979 98.4 127.4 9,717 95.3 108.2 11,503 95.4 118.4 22,350
営業利益 Operating Income △ 104 - 32 0.5 - 143 1.6 446.9 479 4.7 335.0 552 4.6 115.2 1,550外部売上高 Sales to Customers 11,061 98.8 12,579 98.8 113.7 14,765 98.6 117.4 19,218 98.8 130.2 19,183 98.4 99.8 35,380内部売上高 Intra-area Transfer 132 1.2 156 1.2 118.2 208 1.4 133.3 224 1.2 107.7 320 1.6 142.9 420
欧州 売上高 計 Total Sales 11,194 100.0 12,735 100.0 113.8 14,973 100.0 117.6 19,442 100.0 129.8 19,504 100.0 100.3 35,800Europe 営業費用 Operating Expenses 9,860 88.1 11,210 88.0 113.7 13,145 87.8 117.3 17,272 88.8 131.4 16,632 85.3 96.3 30,500
営業利益 Operating Income 1,333 11.9 1,524 12.0 114.3 1,828 12.2 119.9 2,169 11.2 118.7 2,871 14.7 132.4 5,300外部売上高 Sales to Customers 1,482 99.6 3,062 99.8 206.6 3,196 99.7 104.4 3,905 99.8 122.2 4,441 99.9 113.7 9,700内部売上高 Intra-area Transfer 6 0.4 5 0.2 83.3 9 0.3 180.0 9 0.2 100.0 2 0.0 22.2
中国 売上高 計 Total Sales 1,488 100.0 3,067 100.0 206.1 3,206 100.0 104.5 3,914 100.0 122.1 4,444 100.0 113.5 9,700China 営業費用 Operating Expenses 1,320 88.7 2,705 88.2 204.9 2,862 89.3 105.8 3,490 89.2 121.9 3,959 89.1 113.4 8,540
営業利益 Operating Income 168 11.3 362 11.8 215.5 343 10.7 94.8 424 10.8 123.6 484 10.9 114.2 1,160外部売上高 Sales to Customers 1,228 97.5 1,722 97.5 140.2 1,966 96.8 114.2 2,440 94.5 124.1 2,857 96.7 117.1 5,720
アジア・ 内部売上高 Intra-area Transfer 31 2.5 43 2.4 138.7 64 3.2 148.8 141 5.5 220.3 98 3.3 69.5 180パシフィック 売上高 計 Total Sales 1,260 100.0 1,766 100.0 140.2 2,030 100.0 114.9 2,581 100.0 127.1 2,955 100.0 114.5 5,900
Asia - 営業費用 Operating Expenses 1,177 93.4 1,564 88.6 132.9 1,769 87.1 113.1 2,258 87.5 127.6 2,627 88.9 116.3 5,310Pacific 営業利益 Operating Income 82 6.5 201 11.4 245.1 260 12.8 129.4 323 12.5 124.2 327 11.1 101.2 590
外部売上高 Sales to Customers 36,297 78.7 41,606 79.1 114.6 47,495 79.6 114.2 52,969 78.9 111.5 56,497 76.7 106.7 114,000内部売上高 Intra-area Transfer 9,827 21.3 11,005 20.9 112.0 12,189 20.4 110.8 14,123 21.1 115.9 17,162 23.3 121.5 33,030
計 売上高 計 Total Sales 46,124 100.0 52,612 100.0 114.1 59,685 100.0 113.4 67,092 100.0 112.4 73,659 100.0 109.8 147,030Total 営業費用 Operating Expenses 41,741 90.5 47,678 90.6 114.2 53,838 90.2 112.9 60,183 89.7 111.8 65,552 89.0 108.9 132,750
営業利益 Operating Income 4,383 9.5 4,933 9.4 112.5 5,847 9.8 118.5 6,909 10.3 118.2 8,107 11.0 117.3 14,280外部売上高 Sales to Customers - - - - - - - - - - - - - - -
消去/ 内部売上高 Intra-area Transfer △ 9,827 - △ 11,005 - - △ 12,189 - - △ 14,123 - - △ 17,162 - - △ 33,030全社 売上高 計 Total Sales △ 9,827 - △ 11,005 - - △ 12,189 - - △ 14,123 - - △ 17,162 - - △ 33,030
Eliminations/ 営業費用 Operating Expenses △ 9,756 - △ 11,043 - - △ 12,475 - - △ 13,673 - - △ 15,982 - - △ 32,750Corporate 営業利益 Operating Income △ 70 - 37 - - 285 - 770.3 △ 450 - - △ 1,179 - - △ 280
外部売上高 Sales to Customers 36,297 100.0 41,606 100.0 114.6 47,495 100.0 114.2 52,969 100.0 111.5 56,497 100.0 106.7 114,000内部売上高 Intra-area Transfer - - - - - - - - - - - - - - -
連結 売上高 計 Total Sales 36,297 100.0 41,606 100.0 114.6 47,495 100.0 114.2 52,969 100.0 111.5 56,497 100.0 106.7 114,000Consolidated 営業費用 Operating Expenses 31,984 88.1 36,635 88.1 114.5 41,362 87.1 112.9 46,510 87.8 112.4 49,569 87.7 106.6 100,000
営業利益 Operating Income 4,312 11.9 4,971 11.9 115.3 6,133 12.9 123.4 6,459 12.2 105.3 6,927 12.3 107.2 14,000
●通期予想は、2008年10月に公表(修正)したものです。
●Business forecast was announced(revised) on October 2008.
地域 Region
2009.3 H.Y.決算期 Fiscal Term 2005.3 H.Y. 2006.3 H.Y. 2007.3 H.Y. 2008.3 H.Y.
※日本所在地には、韓国、台湾、モンゴル向けの売上、利益を含みます。※Sales and Operating Income in Japan include those to Korea, Taiwan and Mongolia.
※アジア・パシフィック所在地には、韓国、台湾およびモンゴルの売上、利益を含みません。※Sales in Asia Pacific exclude Korea, Taiwan and Mongolia.
16
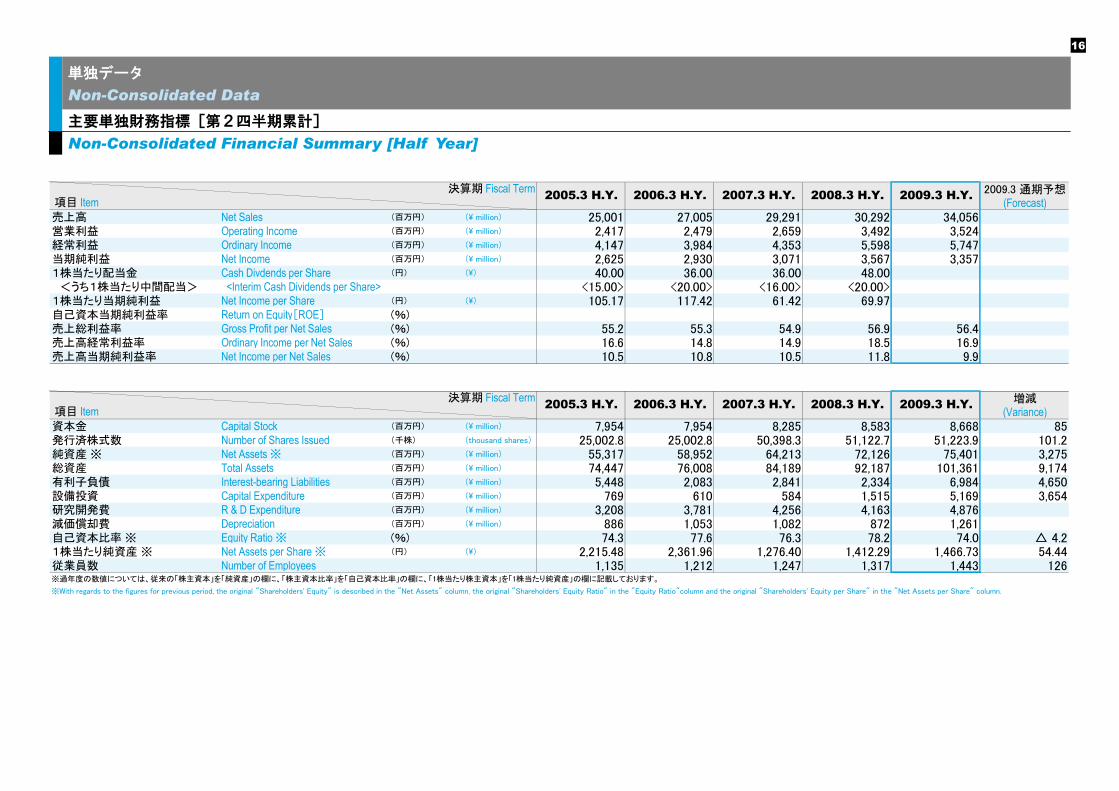
主要単独財務指標[第2四半期累計] Non-Consolidated Financial Summary [Half Year]
単独データ Non-Consolidated Data
(百万円)(\ million)
2009.3 通期予想(Forecast)
売上高 Net Sales (百万円) (\ million) 25,001 27,005 29,291 30,292 34,056営業利益 Operating Income (百万円) (\ million) 2,417 2,479 2,659 3,492 3,524経常利益 Ordinary Income (百万円) (\ million) 4,147 3,984 4,353 5,598 5,747当期純利益 Net Income (百万円) (\ million) 2,625 2,930 3,071 3,567 3,3571株当たり配当金 Cash Divdends per Share (円) (\) 40.00 36.00 36.00 48.00 <うち1株当たり中間配当> <Interim Cash Dividends per Share> <15.00> <20.00> <16.00> <20.00> <> <>1株当たり当期純利益 Net Income per Share (円) (\) 105.17 117.42 61.42 69.97自己資本当期純利益率 Return on Equity[ROE] (%)売上総利益率 Gross Profit per Net Sales (%) 55.2 55.3 54.9 56.9 56.4売上高経常利益率 Ordinary Income per Net Sales (%) 16.6 14.8 14.9 18.5 16.9売上高当期純利益率 Net Income per Net Sales (%) 10.5 10.8 10.5 11.8 9.9
増減(Variance)
資本金 Capital Stock (百万円) (\ million) 7,954 7,954 8,285 8,583 8,668 85発行済株式数 Number of Shares Issued (千株) (thousand shares) 25,002.8 25,002.8 50,398.3 51,122.7 51,223.9 101.2純資産 ※ Net Assets ※ (百万円) (\ million) 55,317 58,952 64,213 72,126 75,401 3,275総資産 Total Assets (百万円) (\ million) 74,447 76,008 84,189 92,187 101,361 9,174有利子負債 Interest-bearing Liabilities (百万円) (\ million) 5,448 2,083 2,841 2,334 6,984 4,650設備投資 Capital Expenditure (百万円) (\ million) 769 610 584 1,515 5,169 3,654研究開発費 R & D Expenditure (百万円) (\ million) 3,208 3,781 4,256 4,163 4,876減価償却費 Depreciation (百万円) (\ million) 886 1,053 1,082 872 1,261自己資本比率 ※ Equity Ratio ※ (%) 74.3 77.6 76.3 78.2 74.0 △ 4.21株当たり純資産 ※ Net Assets per Share ※ (円) (\) 2,215.48 2,361.96 1,276.40 1,412.29 1,466.73 54.44従業員数 Number of Employees 1,135 1,212 1,247 1,317 1,443 126※過年度の数値については、従来の「株主資本」を「純資産」の欄に、「株主資本比率」を「自己資本比率」の欄に、「1株当たり株主資本」を「1株当たり純資産」の欄に記載しております。
決算期 Fiscal Term
2007.3 H.Y.
※With regards to the figures for previous period, the original "Shareholders' Equity" is described in the "Net Assets" column, the original "Shareholders' Equity Ratio" in the "Equity Ratio"column and the original "Shareholders' Equity per Share" in the "Net Assets per Share" column.
2005.3 H.Y. 2006.3 H.Y. 2008.3 H.Y.
項目 Item 2009.3 H.Y.2005.3 H.Y. 2006.3 H.Y. 2007.3 H.Y. 2008.3 H.Y.
決算期 Fiscal Term 2009.3 H.Y. 項目 Item
17
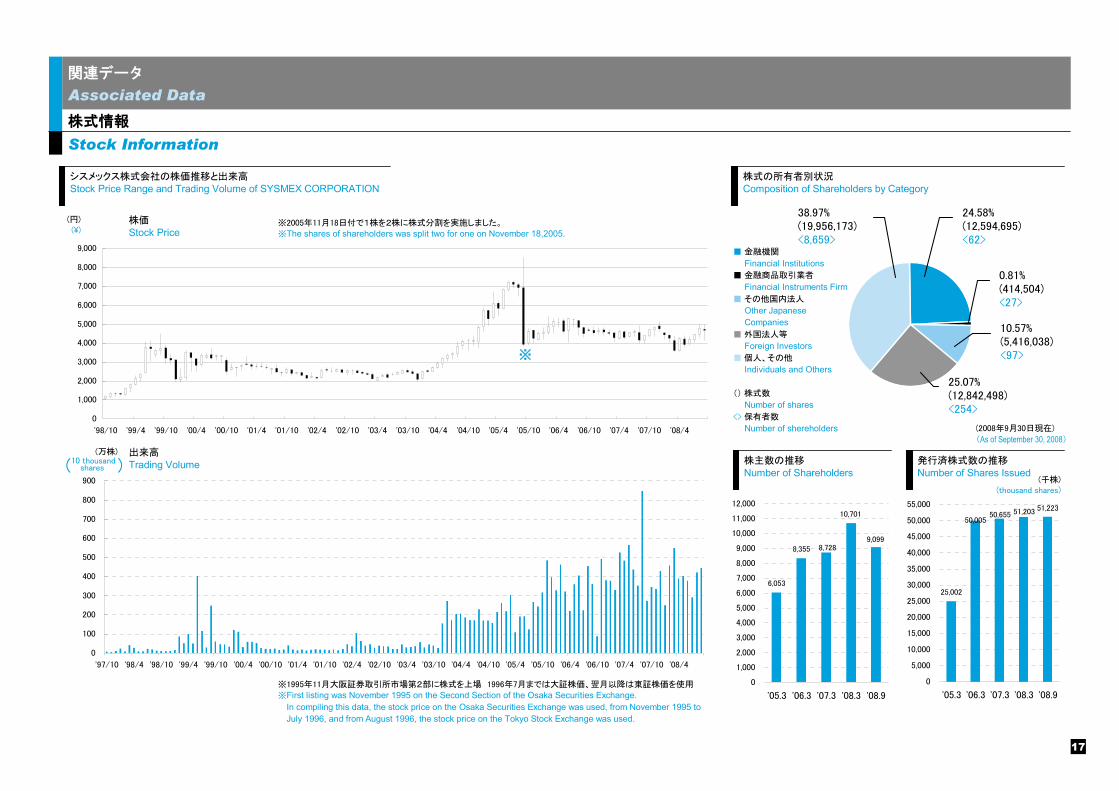
株式情報 Stock Information
関連データ Associated Data
0
1,000
2,000
3,000
4,000
5,000
6,000
7,000
8,000
9,000
'98/10 '99/4 '99/10 '00/4 '00/10 '01/4 '01/10 '02/4 '02/10 '03/4 '03/10 '04/4 '04/10 '05/4 '05/10 '06/4 '06/10 '07/4 '07/10 '08/4
シスメックス株式会社の株価推移と出来高Stock Price Range and Trading Volume of SYSMEX CORPORATION
0
100
200
300
400
500
600
700
800
900
'97/10 '98/4 '98/10 '99/4 '99/10 '00/4 '00/10 '01/4 '01/10 '02/4 '02/10 '03/4 '03/10 '04/4 '04/10 '05/4 '05/10 '06/4 '06/10 '07/4 '07/10 '08/4
shares
(万株)10 thousand( )
出来高Trading Volume
※1995年11月大阪証券取引所市場第2部に株式を上場 1996年7月までは大証株価、翌月以降は東証株価を使用
※First listing was November 1995 on the Second Section of the Osaka Securities Exchange. In compiling this data, the stock price on the Osaka Securities Exchange was used, from November 1995 to July 1996, and from August 1996, the stock price on the Tokyo Stock Exchange was used.
株式の所有者別状況Composition of Shareholders by Category
■ 金融機関
Financial Institutions■ 金融商品取引業者
Financial Instruments Firm■ その他国内法人
Other Japanese Companies■ 外国法人等
Foreign Investors■ 個人、その他
Individuals and Others
() 株式数
Number of shares<> 保有者数
Number of shereholders
24.58%(12,594,695)<62>
10.57%(5,416,038)<97>
25.07%(12,842,498)<254>
38.97%(19,956,173)<8,659>
(2008年9月30日現在)
(As of September 30, 2008)
株価Stock Price
(円)(\)
※2005年11月18日付で1株を2株に株式分割を実施しました。
※The shares of shareholders was split two for one on November 18,2005.
※
株主数の推移Number of Shareholders
6,053
8,355 8,728
10,701
9,099
0
1,000
2,000
3,000
4,000
5,000
6,000
7,000
8,000
9,000
10,000
11,000
12,000
'05.3 '06.3 '07.3 '08.3 '08.9
発行済株式数の推移Number of Shares Issued
25,002
50,65550,005
51,203 51,223
0
5,000
10,000
15,000
20,000
25,000
30,000
35,000
40,000
45,000
50,000
55,000
'05.3 '06.3 '07.3 '08.3 '08.9
(千株)(thousand shares)
0.81%(414,504)<27>
18
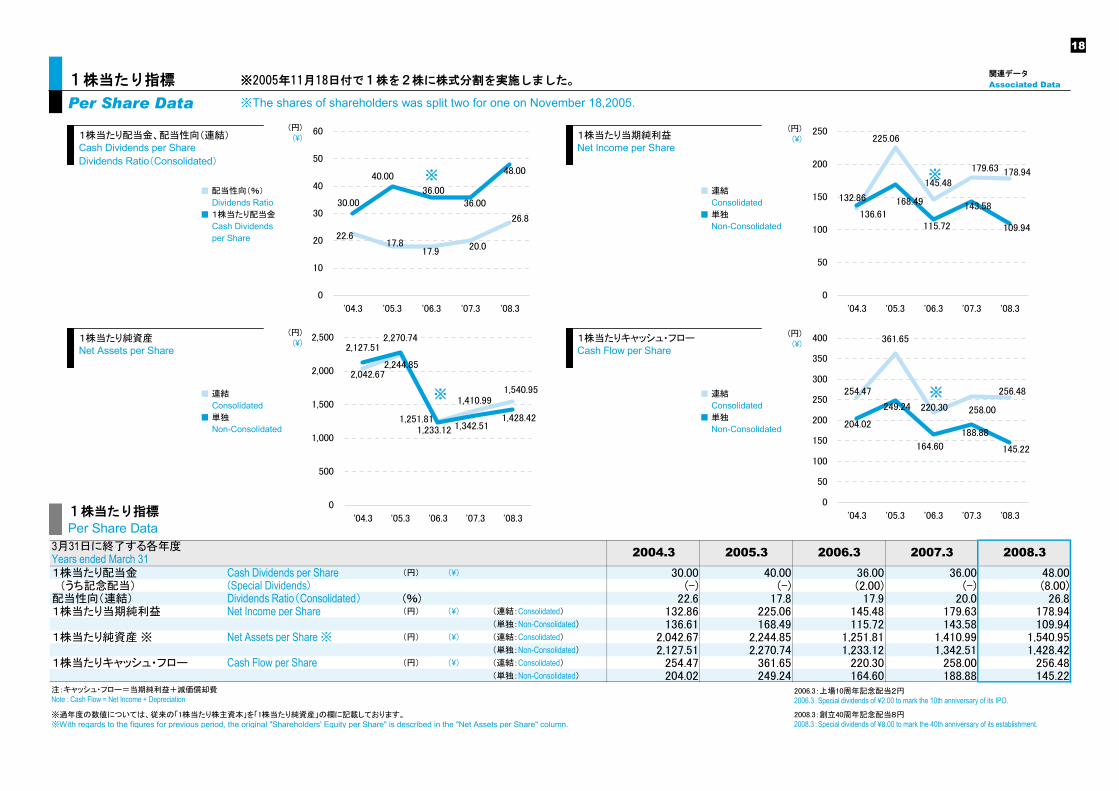
1株当たり指標 Per Share Data
※2005年11月18日付で1株を2株に株式分割を実施しました。
※The shares of shareholders was split two for one on November 18,2005.
関連データ Associated Data
1株当たり配当金 Cash Dividends per Share (円) (\) 30.00 40.00 36.00 36.00 48.00 (うち記念配当) (Special Dividends) (-) (-) (2.00) (-) (8.00)配当性向(連結) Dividends Ratio(Consolidated) (%) 22.6 17.8 17.9 20.0 26.81株当たり当期純利益 Net Income per Share (円) (\) (連結:Consolidated) 132.86 225.06 145.48 179.63 178.94
(単独:Non-Consolidated) 136.61 168.49 115.72 143.58 109.941株当たり純資産 ※ Net Assets per Share ※ (円) (\) (連結:Consolidated) 2,042.67 2,244.85 1,251.81 1,410.99 1,540.95
(単独:Non-Consolidated) 2,127.51 2,270.74 1,233.12 1,342.51 1,428.421株当たりキャッシュ・フロー Cash Flow per Share (円) (\) (連結:Consolidated) 254.47 361.65 220.30 258.00 256.48
(単独:Non-Consolidated) 204.02 249.24 164.60 188.88 145.22注:キャッシュ・フロー=当期純利益+減価償却費 2006.3:上場10周年記念配当2円Note : Cash Flow = Net Income + Depreciation 2006.3:Special dividends of \2.00 to mark the 10th anniversary of its IPO.※過年度の数値については、従来の「1株当たり株主資本」を「1株当たり純資産」の欄に記載しております。 2008.3:創立40周年記念配当8円※With regards to the figures for previous period, the original "Shareholders' Equity per Share" is described in the "Net Assets per Share" column. 2008.3:Special dividends of \8.00 to mark the 40th anniversary of its establishment.
2008.32007.32006.33月31日に終了する各年度 2004.3 2005.3Years ended March 31
1株当たり配当金、配当性向(連結)Cash Dividends per ShareDividends Ratio(Consolidated)
1株当たり純資産Net Assets per Share
(円)(\)
48.00
36.00
40.00
36.0030.00
17.917.8
22.6
26.8
20.0
0
10
20
30
40
50
60
'04.3 '05.3 '06.3 '07.3 '08.3
■ 配当性向(%)
Dividends Ratio■ 1株当たり配当金
Cash Dividends per Share
(円)(\)
※
1,540.951,410.99
2,042.672,244.85
1,251.81 1,428.421,342.511,233.12
2,270.742,127.51
0
500
1,000
1,500
2,000
2,500
'04.3 '05.3 '06.3 '07.3 '08.3
■ 連結
Consolidated■ 単独
Non-Consolidated
※
1株当たり当期純利益Net Income per Share
1株当たりキャッシュ・フローCash Flow per Share
(円)(\)
256.48254.47
361.65
220.30 258.00
164.60
249.24
204.02
145.22
188.88
0
50
100
150
200
250
300
350
400
'04.3 '05.3 '06.3 '07.3 '08.3
■ 連結
Consolidated■ 単独
Non-Consolidated
※
(円)(\)
178.94145.48
179.63
225.06
132.86
136.61
168.49
115.72
143.58
109.94
0
50
100
150
200
250
'04.3 '05.3 '06.3 '07.3 '08.3
■ 連結
Consolidated■ 単独
Non-Consolidated
※
1株当たり指標
Per Share Data
19
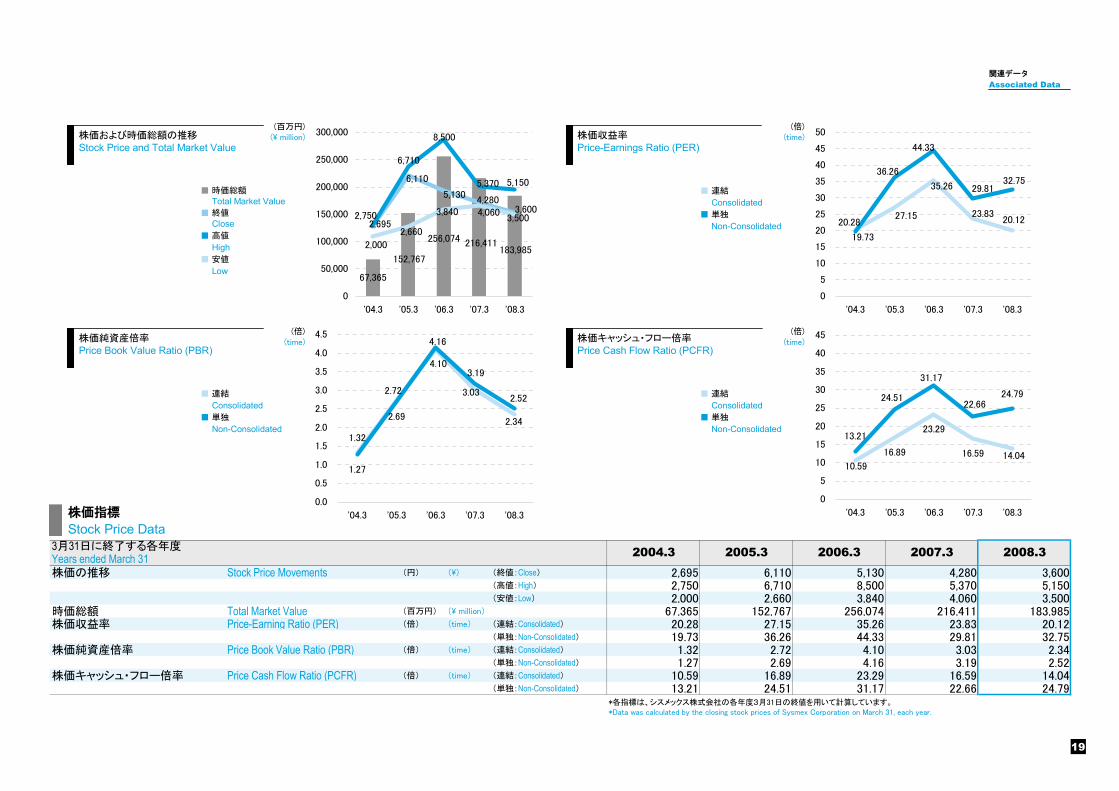
関連データ Associated Data
株価の推移 Stock Price Movements (円) (\) (終値:Close) 2,695 6,110 5,130 4,280 3,600(高値:High) 2,750 6,710 8,500 5,370 5,150(安値:Low) 2,000 2,660 3,840 4,060 3,500
時価総額 Total Market Value (百万円) (\ million) 67,365 152,767 256,074 216,411 183,985株価収益率 Price-Earning Ratio (PER) (倍) (time) (連結:Consolidated) 20.28 27.15 35.26 23.83 20.12
(単独:Non-Consolidated) 19.73 36.26 44.33 29.81 32.75株価純資産倍率 Price Book Value Ratio (PBR) (倍) (time) (連結:Consolidated) 1.32 2.72 4.10 3.03 2.34
(単独:Non-Consolidated) 1.27 2.69 4.16 3.19 2.52株価キャッシュ・フロー倍率 Price Cash Flow Ratio (PCFR) (倍) (time) (連結:Consolidated) 10.59 16.89 23.29 16.59 14.04
(単独:Non-Consolidated) 13.21 24.51 31.17 22.66 24.79
2007.3
*各指標は、シスメックス株式会社の各年度3月31日の終値を用いて計算しています。*Data was calculated by the closing stock prices of Sysmex Corporation on March 31, each year.
2008.32006.3Years ended March 313月31日に終了する各年度 2004.3 2005.3
株価および時価総額の推移Stock Price and Total Market Value
(百万円)(\ million)
株価指標
Stock Price Data
67,365
183,985216,411256,074
152,767
4,2805,130
6,110
2,695
3,600
5,150
8,500
6,710
2,750
5,370
4,060
2,000
3,840
2,660
3,500
0
50,000
100,000
150,000
200,000
250,000
300,000
'04.3 '05.3 '06.3 '07.3 '08.3
20.12
35.26
20.2823.8327.15
36.26
44.33
32.7529.81
19.73
0
5
10
15
20
25
30
35
40
45
50
'04.3 '05.3 '06.3 '07.3 '08.3
株価収益率Price-Earnings Ratio (PER)
株価純資産倍率Price Book Value Ratio (PBR)
4.10
2.72
1.32
3.03
2.34
1.27
2.69
4.16
3.19
2.52
0.0
0.5
1.0
1.5
2.0
2.5
3.0
3.5
4.0
4.5
'04.3 '05.3 '06.3 '07.3 '08.3
■ 連結
Consolidated■ 単独
Non-Consolidated13.21
24.79
14.0410.59
16.89
23.29
16.59
31.17
22.6624.51
0
5
10
15
20
25
30
35
40
45
'04.3 '05.3 '06.3 '07.3 '08.3
株価キャッシュ・フロー倍率Price Cash Flow Ratio (PCFR)
■ 連結
Consolidated■ 単独
Non-Consolidated
■ 連結
Consolidated■ 単独
Non-Consolidated
(倍)(time)
(倍)(time)
(倍)(time)
■ 時価総額
Total Market Value■ 終値
Close■ 高値
High■ 安値
Low

20
Sysmex Corporation
本社所在地 Address of Head Office
神戸市中央区脇浜海岸通1丁目5番1号 1-5-1, Wakinohama-Kaigandori, Chuo-ku, Kobe, Hyogo 651-0073, Japan
電話番号 Telephone F A X Facsimile
(078)265-0500(代表) (078)265-0524
設立年月日 Date of Establishment
昭和43年2月20日 February 20, 1968
資本金 Paid-in Capital 8,668,533
(千円) (\ thousand)
従業員数 Number of Employees
1,443名(単独/Non-Consolidated) 3,524名(連結/Consolidated) ※嘱託及びパートタイマーは含んでおりません。 ※Non-Including part-time employees 従業員平均年齢 38.3才 従業員平均勤続年数 10.5年
51,223 千株 (thousand shares) 発行済株式総数
Number of Shares Issued ※2005年11月18日付で1株を2株に株式分割を実施しました。
※The shares of shareholders was split two for one on November 18, 2005.
決算期 Settlement Day
3月31日 March 31
上場市場 Stock Listings
東京証券取引所 市場第一部 Tokyo Stock Exchange, First Section 大阪証券取引所 市場第一部 Osaka Securities Exchange, First Section
証券コードNo. Stock Exchange Code Number 6869
主な事業内容 Main Line of Business
臨床検査機器、検査用試薬、粒子分析機器ならびに関連ソフトウェアなどの開発・製造・販売・輸出入 Development,manufacture, sales, import and export of diagnostics testing instruments and reagents, particle analyzers, and related software
主な販売先 Customers
国立病院、一般病院、大学、研究所、その他医療機関 National and public hospitals, general hospitals, and other medical institutions, universities, and research institutes
本社 Head Office ソリューションセンター Solution Center テクノパーク Technopark 研究開発センター R & D Center 加古川工場 Kakogawa Factory 仙台支店 Sendai Office 北関東支店 Kita Kanto Office
東京支社/東京支店 Tokyo Office/Tokyo Branch 名古屋支店 Nagoya Office 大阪支店 Osaka Office 広島支店 Hiroshima Office 福岡支店 Fukuoka Office 札幌営業所 Sapporo Sales Office 盛岡営業所 Morioka Sales Office 長野営業所 Nagano Sales Office 新潟営業所 Niigata Sales Office
千葉営業所 Chiba Sales Office 静岡営業所 Shizuoka Sales Office 金沢営業所 Kanazawa Sales Office 京都営業所 Kyoto Sales Office 神戸営業所 Kobe Sales Office 高松営業所 Takamatsu Sales Office 岡山営業所 Okayama Sales Office 鹿児島営業所 Kagoshima Sales Office 首都圏サービスセンター Metropolitan Area Service Center
事業所 Offices
(2008年9月30日現在)(As of September 30,2008)
会社概要 Corporate Data
21
会社名 Corporate Name
所在地 Location
グループ出資比率 Equity Qwnership by Group
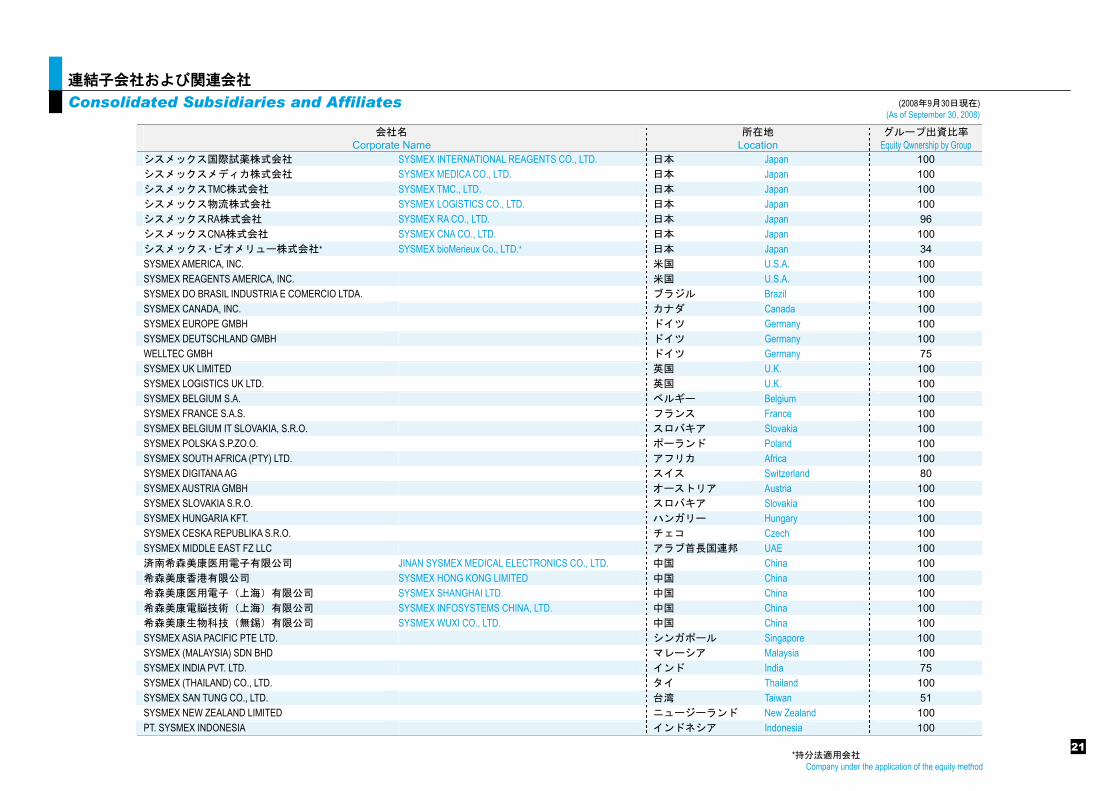
シスメックス国際試薬株式会社 SYSMEX INTERNATIONAL REAGENTS CO., LTD. 日本 Japan 100 シスメックスメディカ株式会社 SYSMEX MEDICA CO., LTD. 日本 Japan 100 シスメックスTMC株式会社 SYSMEX TMC., LTD. 日本 Japan 100 シスメックス物流株式会社 SYSMEX LOGISTICS CO., LTD. 日本 Japan 100 シスメックスRA株式会社 SYSMEX RA CO., LTD. 日本 Japan 96 シスメックスCNA株式会社 SYSMEX CNA CO., LTD. 日本 Japan 100 シスメックス・ビオメリュー株式会社* SYSMEX bioMerieux Co., LTD.* 日本 Japan 34 SYSMEX AMERICA, INC. 米国 U.S.A. 100 SYSMEX REAGENTS AMERICA, INC. 米国 U.S.A. 100 SYSMEX DO BRASIL INDUSTRIA E COMERCIO LTDA. ブラジル Brazil 100 SYSMEX CANADA, INC. カナダ Canada 100 SYSMEX EUROPE GMBH ドイツ Germany 100 SYSMEX DEUTSCHLAND GMBH ドイツ Germany 100 WELLTEC GMBH ドイツ Germany 75 SYSMEX UK LIMITED 英国 U.K. 100 SYSMEX LOGISTICS UK LTD. 英国 U.K. 100 SYSMEX BELGIUM S.A. ベルギー Belgium 100 SYSMEX FRANCE S.A.S. フランス France 100 SYSMEX BELGIUM IT SLOVAKIA, S.R.O. スロバキア Slovakia 100 SYSMEX POLSKA S.P.ZO.O. ポーランド Poland 100 SYSMEX SOUTH AFRICA (PTY) LTD. アフリカ Africa 100 SYSMEX DIGITANA AG スイス Switzerland 80 SYSMEX AUSTRIA GMBH オーストリア Austria 100 SYSMEX SLOVAKIA S.R.O. スロバキア Slovakia 100 SYSMEX HUNGARIA KFT. ハンガリー Hungary 100 SYSMEX CESKA REPUBLIKA S.R.O. チェコ Czech 100 SYSMEX MIDDLE EAST FZ LLC アラブ首長国連邦 UAE 100 済南希森美康医用電子有限公司 JINAN SYSMEX MEDICAL ELECTRONICS CO., LTD. 中国 China 100 希森美康香港有限公司 SYSMEX HONG KONG LIMITED 中国 China 100 希森美康医用電子(上海)有限公司 SYSMEX SHANGHAI LTD. 中国 China 100 希森美康電脳技術(上海)有限公司 SYSMEX INFOSYSTEMS CHINA, LTD. 中国 China 100 希森美康生物科技(無錫)有限公司 SYSMEX WUXI CO., LTD. 中国 China 100 SYSMEX ASIA PACIFIC PTE LTD. シンガポール Singapore 100 SYSMEX (MALAYSIA) SDN BHD マレーシア Malaysia 100 SYSMEX INDIA PVT. LTD. インド India 75 SYSMEX (THAILAND) CO., LTD. タイ Thailand 100 SYSMEX SAN TUNG CO., LTD. 台湾 Taiwan 51 SYSMEX NEW ZEALAND LIMITED ニュージーランド New Zealand 100 PT. SYSMEX INDONESIA インドネシア Indonesia 100
連結子会社および関連会社 Consolidated Subsidiaries and Affiliates (2008年9月30日現在)
(As of September 30, 2008)
*持分法適用会社 Company under the application of the equity method
Printed in Japan FD-2009-HY-01
FINANCIAL DATA 2009
2nd Quarter �������2008.4.1�2008.9.30