Embed Size (px)
Citation preview

Financial Highlights for FY2017 3Q
2018年3月期第3四半期 決算概要
(For the 9 months from April 1, 2017 to December 31, 2017)
【Contents】
P1 - 2 ・Summary of Account Settlement in FY2017 3Q: Overview
決算概要 総括
P3 - 4 ・Summary of Profits
損益の概要
P5 - 6 ・Consolidated Balance Sheets
連結貸借対照表
P7 - 8 ・Business Segment Information
セグメント情報
P9 ・Breakdown of Rental Real Estates
賃貸等不動産の内訳
P10 - 12 ・Business Performance Forecasts for FY2017
2018年3月期 業績予想
P13 - 14 ・Orders Received and Sales by Business Segment (Non-consolidated)
事業別受注高・売上高(個別)
P15 ・Status of Investment Plan
投資計画の進捗状況
・Consolidated Statements of Cash Flows
連結キャッシュ・フローの状況
P16 ・Rental Housing Business
賃貸住宅事業
・Condominiums Business
マンション事業
P17 ・Overseas Business
海外事業注:1.本資料の予想数値は、当資料の発表日までに入手可能な情
報に基づき作成したものであり、実際の業績は、今後様々な要因に
よって異なる結果となる場合があります。
2.単位未満は切り捨てて表示しております。
Notes: 1. The business forecasts are based on assumptions in light of information available as of the date of announcement of this material, and the factors of uncertainty that may possibly impact the future results of operations. The Company's actual results may differ significantly from those presented herein as a consequence of numerous factors.2. Amounts less than one unit are omitted in this material.
(2018.02)

大和ハウスグループ 2018年3月期 第3四半期 決算概要
Daiwa House Group Financial Highlights for FY2017 3Q
Summary of Account Settlement in FY2017 3Q : Overview 決算概要 総括
2018年3月期 第3四半期は、売上高・営業利益・経常利益・四半期純利益とも過去最高を更新しました。
売上高・営業利益・経常利益については、8期連続の増収増益。四半期純利益は、6期連続の増益です。
Amounts Ratio Amounts Ratio増減額 増減率 増減額 増減率
Net sales
売上高
Operating income
営業利益
Ordinary income
経常利益Net income attributable toowners of the parent
親会社株主に帰属する
四半期純利益
Earnings per share
1株当たり四半期純利益
Amounts Ratio Amounts Ratio増減額 増減率 増減額 増減率
Total assets
総資産
Net assets
純資産
Book-value per share
1株当たり純資産
■ Group companiesグループの概要
Mar. 31, 2017 Dec. 31, 2017 Change
2017 / 3末 2017 / 12末 増減
Parent company (Daiwa House Industry)
親会社(大和ハウス工業)
Consolidated subsidiaries Included: 112 (92) ; Excluded: 7 (4)
連結子会社 増加 112社 (92) ; 減少 7社 (4)
Equity-method affiliates Included: 5 (1); Excluded: 3(2)
持分法適用関連会社 増加 5社 (1) ; 減少 3社(2)
Unconsolidated subsidiaries Excluded: 1(0)
非連結子会社 減少 1社(0)
Affiliated companies not accounted for by equity method Included: 2 (0)
持分法非適用関連会社 増加 2社 (0)
Total
計
* Overseas companies are shown in parentheses ( ). / ※( ) 内は、海外会社数です。
Consolidated
1,978
Non-consolidated
連結 個別
FY2016 3Q2016 / 12月期
FY2017 3Q2017 / 12月期
YOYFY2016 3Q
2016 / 12月期
FY2017 3Q2017 / 12月期
6.4%
2,094 2,521 427 20.4% 1,304
YOY前年同期比 前年同期比
25,146 26,958 1,812 12,889 779
¥264.17 ¥49.86 23.3%
1,708 403 30.9%
473 31.5%
1,421 1,754 333 23.4% 1,085 1,466 381 35.1%
2,103
12,110
437
1
24,106 26,570
1
¥1,971.66 ¥2,154.10 ¥182.44 9.3%
13,299 14,638 1,339 10.1% 10,501
Number of companies 企業数
2,463 10.2%
Notes
備考
Consolidated Non-consolidated
¥214.31
In the FY2017 3Q, we achieved record highs for net sales, operating income, ordinary income, and net income. Net sales, operating income andordinary income grew for the 8th consecutive year. Net income grew for the 6th consecutive year.
(\ 100 Million/億円)
(\ 100 Million/億円)
11,423 922 8.8%
35,558 39,527 3,968 11.2%
20.8% 1,504
連結 個別
Mar. 31,2017
2017 / 3末
Dec. 31,2017
2017 / 12末
Change Mar. 31,2017
2017 / 3末
Dec. 31,2017
2017 / 12末
Change前期末比
2,540
7.2%
前期末比
2 4
196 304
-
28 30
3 2
108
105
2
-1
2
162 267
1

大和ハウスグループ 2018年3月期 第3四半期 決算概要
Daiwa House Group Financial Highlights for FY2017 3Q
Summary of Account Settlement in FY2017 3Q : Overview 決算概要 総括
■ Major factors for changes in net sales and operating income売上高、営業利益の増減要因
■ Net sales
売上高 (¥ 100 Million/億円)
■ Operating income 営業利益 (¥ 100 Million/億円)
Sales increased
売上高増加
Income from sales of development properties increased
開発物件売却利益の増加
SG&A expenses increased
管理販売費の増加
+130Sales of overseas condominium increased
+419
Sales in Commercial Facilities business increased [Sales by Daiwa House: +139 (excl. sales of development properties) ]
Sales in Rental Housing business increased [Sales by Daiwa House: -21 (excl. sales of development properties) ; Sales by Daiwa Living: +377 ]
海外分譲マンションの売上高増加
26,958
Sales decreased in development properties[ Rental housing: +99, Commercial facilities: +97,Logistics, business & corporate facilities business: -294 ]
開発物件の売上高減少 [ 賃貸住宅 +99、商業施設 +97、事業施設 △294 ]
-97
+409
Other sales increased [Sales in Single-Family Houses business:+28, Sales in Condominiums business: +38, Sales in ExistingHome business: +32 ]
その他、売上高増加 [ 戸建住宅 +28、マンション +38、住宅ストック +32 ]
エネルギー事業の売上高増加
Sales by inclusion of Stanley-Martin as a consolidated subsidiary
スタンレーマーチン社の新規連結子会社化による増加
Sales in Logistics, Business & Corporate Facilities business increased [Sales by Daiwa House: +19 (excl. sales of development properties) ; Sales by Fujita: +158 ]
事業施設事業の売上高増加 [大和ハウス +19 ( 開発物件売却 除く)、フジタ +158 ]
商業施設事業の売上高増加 [ 大和ハウス +139 ( 開発物件売却 除く) ]
賃貸住宅事業の売上高増加 [ 大和ハウス △21 ( 開発物件売却 除く)、大和リビング +377 ]
+182 Sales in energy business increased
FY2016 3Q2016 / 12月期
FY2017 3Q2017 / 12月期
FY2016 3Q2016 / 12月期
FY2017 3Q2017 / 12月期
2,521
+144
+280
+343
+389
+243
-206
2,094
25,146
+189
+111
+1,812
+427
2

大和ハウスグループ 2018年3月期 第3四半期 決算概要
Daiwa House Group Financial Highlights for FY2017 3Q
Summary of Profits ①
損益の概要 ①
(\ 100 Million/億円)
増減額 増減率
Net sales
売上高
Cost of sales
売上原価
Gross margin
売上総利益
SG&A expenses
管理販売費
Operating income
営業利益
Non-operating income
営業外収益
Non-operating expenses
営業外費用
Ordinary income
経常利益
Extraordinary income
特別利益
Extraordinary losses
特別損失
Income before income taxes
税金等調整前四半期純利益
Net income attributable to owners ofthe parent
親会社株主に帰属する
四半期純利益
2,100 21.0%
16.6%
1,421 5.7% 6.5% 333
11 4 39.4%
0.2%15
2,542
1,754
123
2,094 8.3% 9.4% 427
3,050 206
2,103 8.4% 9.4% 437
96 8
105 17
104
2,540
3,257
2,521
20,001 1,177
6.8%
FY2016 3Q2016年12月期
Results Proportion ProportionYOY
前年同期比Results
12.3%
実績 構成比 構成比
25,146 100.0% 100.0%
5,144 20.5% 21.4% 634
16
15
23.4%
20.4%
20.8%
8.6%
441
0
2017年12月期
FY2017 3Q
実績
26,958
21,179
5,779
1,812 7.2%
5.9%
Amounts Ratio
3

大和ハウスグループ 2018年3月期 第3四半期 決算概要
Daiwa House Group Financial Highlights for FY2017 3Q
Summary of Profits ②
損益の概要 ②
■ Lower of cost or market methods (inventories) (\ 100 Million/億円)
たな卸低価法 FY2016 3Q FY2017 3Q Change
2016 / 12月期 2017 / 12月期 増減額
たな卸低価法
single-family houses
住宅
condominiums
マンション
■ SG&A expenses (\ 100 Million/億円)
管理販売費 FY2016 3Q FY2017 3Q Change
2016 / 12月期 2017 / 12月期 増減額
人件費 (福利厚生費含む)
広告宣伝費・販売促進費
販売手数料
通信交通費
その他
Total
管理販売費 計
■ Extraordinary income (\ 100 Million/億円)
特別利益 FY2016 3Q FY2017 3Q Change
2016 / 12月期 2017 / 12月期 増減額
固定資産売却益
投資有価証券売却益
Total
特別利益 計
■ Extraordinary losses (\ 100 Million/億円)
特別損失 FY2016 3Q FY2017 3Q Change
2016 / 12月期 2017 / 12月期 増減額
減損損失
その他
Total
特別損失 計
9 1 -7
0 8 7
15 15 0
9 9 -0
814 79
2 7 5
Lower of cost or market methods (inventories)10 10 -0
11 16 4
Gain on sales of investment securities
Others15 10 -4
Impairment loss- 4 4
Correspondence & transportation expenses141 151 10
Others734
3,050 3,257 206
Gain on sales of noncurrent assets
Personnel costs (incl. welfare expenses)1,760 1,875 114
Sales commission124 126 2
Advertising & promotion expenses289 289 0
4

大和ハウスグループ 2018年3月期 第3四半期 決算概要
Daiwa House Group Financial Highlights for FY2017 3Q
Consolidated Balance Sheets ① Assets 連結貸借対照表 ①資産の部
(\ 100 Million/億円)
Amounts Ratio増減額 増減率
Current assets
流動資産
Noncurrent assets
固定資産
Property, plant and equipment
有形固定資産
Intangible assets
無形固定資産
Investments and other assets
投資その他の資産
Total assets
資産 合計
(\ 100 Million/億円) (\ 100 Million/億円)
■ Inventoriesたな卸資産
Amounts Ratio 有形固定資産 Amounts Ratio
増減額 増減率 増減額 増減率
Buildings & structures
建物・構築物
未成工事支出金 Land
Land for sale 土地
販売用土地 Others
for houses その他
内、戸建
for condominiums
内、マンション
内、事業用等
内、海外事業
Buildings for sale
販売用建物
for houses
内、戸建
for condominiums
内、マンション
内、事業用等
内、海外事業
Others
その他
Total Inventories
たな卸資産 合計6,242 7,685 1,442 23.1%
for others304 280 -23 -7.8%
271 311 40 14.9%
for overseas business
675 852 177 26.2%
237 313 76 32.4%
1,541 1,863 321 20.9%
201 280 78 39.0%
22.1%
1,654 1,768
184 595 411 223.5%
for others1,088 1,219 131 12.1%
for overseas business
Costs on uncompletedconstruction contracts 494 706 212 42.9%
4,820
9.0%1,632 1,844 211 13.0%
有形固定資産 合計
113 6.8%
938 1,034 96 10.3%Total property, plant andequipment 14,073 15,333 1,259
3,934 4,803
2017 / 3末 2017 / 12末 2017 / 3末 2017 / 12末
Mar. 31,2017
Dec. 31,2017
Change ■ Property, plant and equipment
Mar. 31,2017
Dec. 31,2017
Mar. 31, 2017 Dec. 31, 2017Change前期末比
2017 / 3末 2017 / 12末
6,563 6,793 230 3.5%
14,073 15,333 1,259 9.0%
869 1,003 133 15.4%
14,051 16,396 2,344 16.7%
21,506 23,131 1,624 7.6%
35,558 39,527 3,968 11.2%
Change
前期末比 前期末比
5,429 608 12.6%
7,598 8,136 538 7.1%
868
5

大和ハウスグループ 2018年3月期 第3四半期 決算概要
Daiwa House Group Financial Highlights for FY2017 3Q
Consolidated Balance Sheets ② Liabilities and Net Assets 連結貸借対照表 ②負債・純資産の部
(\ 100 Million/億円)
2017 / 3末 2017 / 12末 Amounts Ratio
増減額 増減率
Liabilities
負債
Current liabilities
流動負債
Noncurrent liabilities
固定負債
Net assets
純資産
Shareholders’ equity
株主資本
Accumulated othercomprehensive income
その他の包括利益累計額
Subscription rights to shares
新株予約権
Non-controlling interests
非支配株主持分
(\ 100 Million/億円)
■ Interest-bearing liabilities 有利子負債
2017 / 3末 2017 / 12末 Amounts Ratio
増減額 増減率
Net assets ratio36.8% 36.2% -0.6pt
自己資本比率
Debt-equity ratio 0.49 0.66 +0.17pt
D/Eレシオ
Net debt-equity ratio0.32 0.48 +0.16pt
ネットD/Eレシオ
3,000 46.8%有利子負債(リース債務除く)計
Long-term loans payable2,923 3,364 441 15.1%
長期借入金
Total (excl. lease obligations)6,406 9,407
Current portion of bonds payable0 201 200 -
1年内償還予定の社債
Bonds payable2,000 2,873 873 43.7%
社債
Current portion of long-term loans payable694 520 -173 -25.0%
1年内返済予定の長期借入金
Commercial papers- 1,110 1,110 -
コマーシャル・ペーパー
39,527 3,968 11.2%負債・純資産 合計
Mar. 31, 2017 Dec. 31, 2017
Change
前期末比
Short-term loans payable789 1,337 548 69.5%
短期借入金
Total liabilities & net assets35,558
Mar. 31, 2017 Dec. 31, 2017
Change
前期末比
22,259 24,889 2,629 11.8%
1,094 1,222 128 11.8%
13,299 14,638 1,339 10.1%
11,988 13,093 1,104 9.2%
10,219 11,503 1,283 12.6%
12,040 13,386 1,345 11.2%
1 1 -0 -0.1%
214 321 106 49.4%
6

大和ハウスグループ 2018年3月期 第3四半期 決算概要
Daiwa House Group Financial Highlights for FY2017 3Q
Business Segment Information ① セグメント情報 ①
■ Sales FY2016 3Q 売上高 2016 / 12月期
Amounts Ratio
(\ 100 Million/億円) 増減額 増減率
Single-Family Houses
戸建住宅
Rental Housing
賃貸住宅
Condominiums
マンション
Existing Home Business
住宅ストック
Commercial Facilities
商業施設
Logistics, Business &Corporate Facilities事業施設
Other Businesses
その他
Total
合計
■ Operating income FY2016 3Q
営業利益 2016 / 12月期
Amounts Ratio YOY Change
(\ 100 Million/億円) 増減額 増減率 増減
Single-Family Houses
戸建住宅
Rental Housing
賃貸住宅
Condominiums
マンション
Existing Home Business
住宅ストック
Commercial Facilities
商業施設
Logistics, Business &Corporate Facilities事業施設
Other Businesses
その他
Total
合計
Note: Sales and operating income by segment include intragroup transactions between segments. / 注:上記実績には、セグメント間の内部取引を含んでいます。
FY2017 3Q
2017 / 12月期
155
前年同期比
74.8%66
115 17.5%
99
774
42
93
812
678
53.8%283
2,521 427 20.4%
+2.3pt
-0.9pt
10.3%
2.6%
11.6%
-1.1pt
+1.0pt
13.1%
9.4% +1.1pt
+1.1pt
+1.0pt
OP margin営業利益率
5.6%
前年同期比
377 9.3%
32 4.3%
1,616 38 2.4%
28 1.0%
7,058
25,146
実績
2,725
Results YOYResults
実績
2,753
7,501
1,654
801
3,706 987 26.6%4,693
-149 -2.4%
実績
26,958
Results
実績
768
4,055
6,164
4,432
6,014
442 6.3%
-3 -3.2%
-16 -28.5%
116 16.7% 18.3%
11.3%
6.0%
599
696
96
59
+1.6pt78
FY2017 3Q2017 / 12月期
2,094
184
Results YOY
1,812 7.2%
659
88
7
大和ハウスグループ 2018年3月期 第3四半期 決算概要
Daiwa House Group Financial Highlights for FY2017 3Q
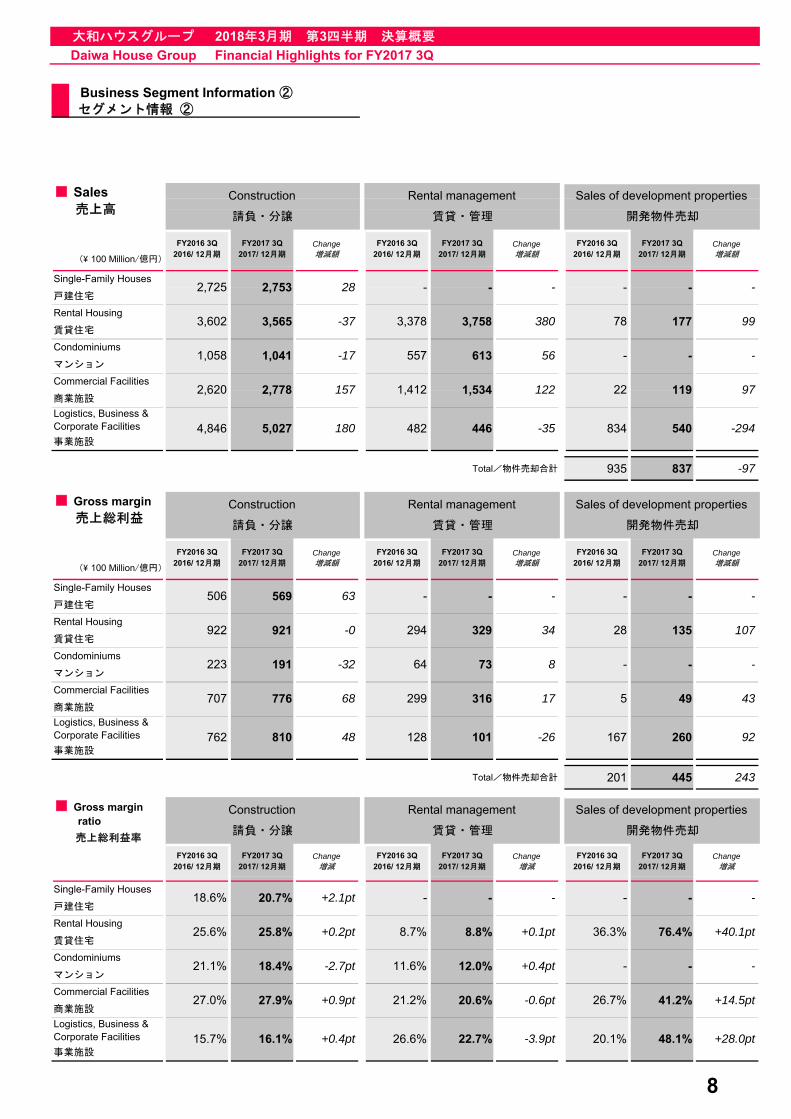
Business Segment Information ② セグメント情報 ②
(\ 100 Million/億円)
FY2016 3Q2016/ 12月期
FY2017 3Q2017/ 12月期
Change増減額
FY2016 3Q2016/ 12月期
FY2017 3Q2017/ 12月期
Change増減額
FY2016 3Q2016/ 12月期
FY2017 3Q2017/ 12月期
Change増減額
Total/物件売却合計 935 837 -97
(\ 100 Million/億円)
FY2016 3Q2016/ 12月期
FY2017 3Q2017/ 12月期
Change増減額
FY2016 3Q2016/ 12月期
FY2017 3Q2017/ 12月期
Change増減額
FY2016 3Q2016/ 12月期
FY2017 3Q2017/ 12月期
Change増減額
Total/物件売却合計 201 445 243
FY2016 3Q2016/ 12月期
FY2017 3Q2017/ 12月期
Change増減
FY2016 3Q2016/ 12月期
FY2017 3Q2017/ 12月期
Change増減
FY2016 3Q2016/ 12月期
FY2017 3Q2017/ 12月期
Change増減
事業施設
22.7% -3.9pt 20.1% 48.1% +28.0ptLogistics, Business &Corporate Facilities 15.7% 16.1% +0.4pt 26.6%
商業施設
マンション
Commercial Facilities27.0% 27.9% +0.9pt 21.2% 20.6% -0.6pt
12.0% +0.4ptCondominiums
21.1% 18.4% -2.7pt 11.6%
36.3% 76.4% +40.1pt
26.7% 41.2% +14.5pt
- - -
- - -Single-Family Houses
18.6% 20.7% +2.1pt -
賃貸住宅
戸建住宅
Rental Housing25.6% 25.8% +0.2pt 8.7% 8.8% +0.1pt
- -
事業施設
■ Gross margin ratio
売上総利益率
Construction Rental management Sales of development properties
請負・分譲 賃貸・管理 開発物件売却
101 -26 167 260 92Logistics, Business &Corporate Facilities 762 810 48 128
商業施設
マンション
Commercial Facilities707 776 68 299 316 17
73 8Condominiums
223 191 -32 64
28 135 107
5 49 43
- - -
- - -Single-Family Houses
506 569 63 -
賃貸住宅
戸建住宅
Rental Housing922 921 -0 294 329 34
- -
事業施設
■ Gross margin
売上総利益Construction Rental management Sales of development properties
請負・分譲 賃貸・管理 開発物件売却
446 -35 834 540 -294Logistics, Business &Corporate Facilities 4,846 5,027 180 482
78 177 99
22 119 97商業施設
マンション
Commercial Facilities2,620 2,778 157 1,412 1,534 122
613 56 - - -Condominiums
1,058
28 -
1,041 -17 557
■ Sales 売上高
Construction Rental management Sales of development properties
請負・分譲 賃貸・管理 開発物件売却
賃貸住宅
戸建住宅
Rental Housing3,602 3,565 -37 3,378 3,758 380
- - - - -Single-Family Houses
2,725 2,753
8

大和ハウスグループ 2018年3月期 第3四半期 決算概要
Daiwa House Group Financial Highlights for FY2017 3Q
Breakdown of Investment Real Estates 投資不動産の内訳
(\ 100 Million/億円)
Investment real estates being rented not being rented Total
投資不動産 稼働中 未稼働 合計
Rental Housing
流動化不動産 賃貸住宅
being rented Commercial Facilities
稼働中 商業施設
not being rented
未稼働
Profit-earning real estates Overseas
収益不動産 海外
being rented Total
稼働中 合計
Breakdown of rented real estates available for sale
稼働中 流動化不動産の内訳
(\ 100 Million/億円)
Book value簿価
NOI yieldNOI利回り
Book value簿価
NOI yieldNOI利回り
Rental Housing
賃貸住宅
Commercial Facilities
商業施設
物流施設・事業施設
Overseas
海外
Breakdown of rented profit-earning real estates
(\ 100 Million/億円)
Book value簿価
NOI yieldNOI利回り
Book value簿価
NOI yieldNOI利回り
Rental Housing
賃貸住宅
Commercial Facilities
商業施設
物流施設・事業施設
9,039
572
6,7882,045
105
10,025
169
4,007
95
4,742
733
1,112
Real estates available for sale流動化不動産の内訳
(¥ 100 Million/億円)
物流施設・事業施設
Logistics, Business & Corporate Facilities
193
902
5,120
88
1,892 12.1% 1,994 12.7%
8.3%Logistics, Business &Corporate Facilities 415 8.1% 424
Total2,741 11.6% 2,925
合計
932
105
1,112
■
2017 / 03 2017 / 12
稼働中 収益不動産の内訳
6.2%
1,693合計
6.5%
Logistics, Business &Corporate Facilities 5.9%
117 4.6%
7.6%
6.3%
Real estates available for sale
733
154 6.3%
7.2%
2017 / 12
6,788
4,197 4,742
10.2%488
■
1,693 2,045
2017 / 03 2017 / 12
2,045
3,149
Total
2017 / 03
Book value簿価
3,237
2,741 2,925
5,890
Note 1. [Definitions of rental real estates] Real estates available for sale:After investing for capital gain, immediately turn into available-for-sale real estate.Profit-earning real estates:Investment and development real estate for income gain (rental income).2. NOI = (rental business revenue total) - (rental business expenses total) + (depreciation expenses total), NOI yield = NOI/book value
注)1. [投資不動産の定義] 流動化不動産:値上がり益を得る目的で投資後、早期に売却可能な不動産。収益不動産:賃貸収益を得る目的で投資・開発した不動産
2. NOI = (賃貸事業収入合計) - (賃貸事業費用合計) + (減価償却費の合計)、NOI利回り = NOI / 簿価
323 14.0%
476
4.8%95
385 13.1%
11.9%
9
大和ハウスグループ 2018年3月期 第3四半期 決算概要
Daiwa House Group Financial Highlights for FY2017 3Q
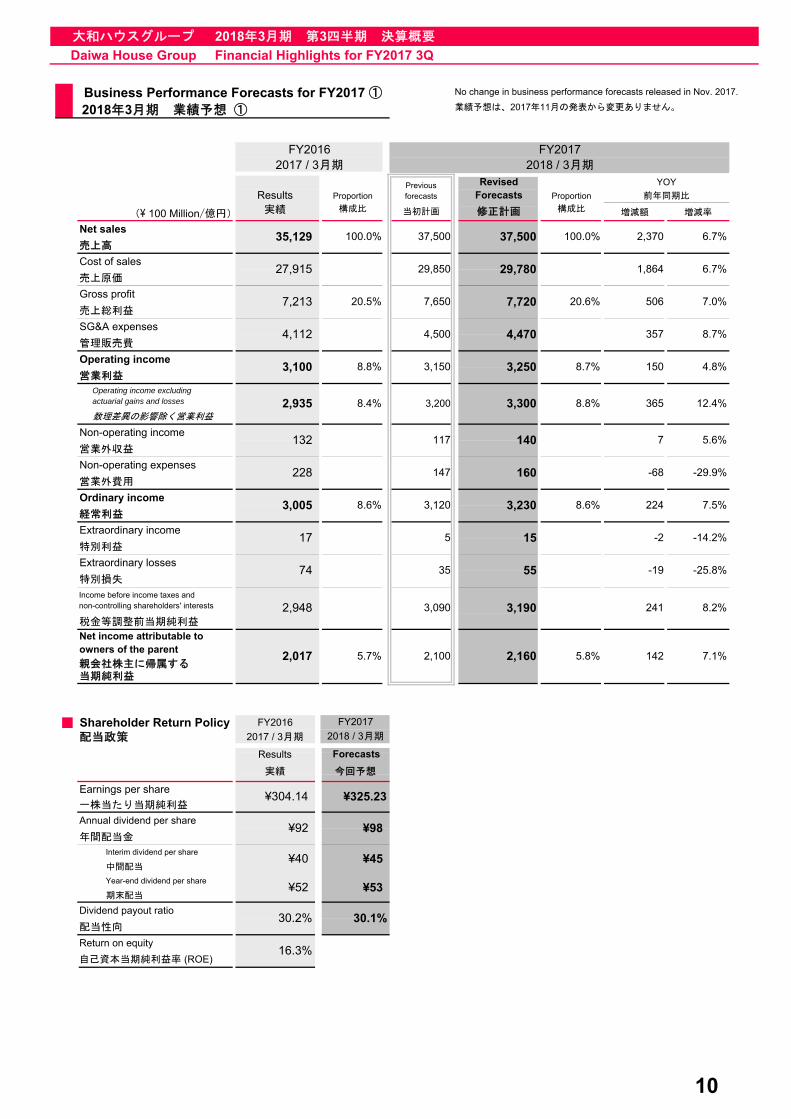
Business Performance Forecasts for FY2017 ① 2018年3月期 業績予想 ①
(\ 100 Million/億円) 増減額 増減率
Net sales
売上高
Cost of sales
売上原価
Gross profit
売上総利益
SG&A expenses
管理販売費
Operating income
営業利益
Operating income excludingactuarial gains and losses
数理差異の影響除く営業利益
Non-operating income
営業外収益
Non-operating expenses
営業外費用
Ordinary income
経常利益
Extraordinary income
特別利益
Extraordinary losses
特別損失
Income before income taxes andnon-controlling shareholders' interests
税金等調整前当期純利益
Net income attributable toowners of the parent
親会社株主に帰属する当期純利益
■ Shareholder Return Policy FY2016
配当政策 2017 / 3月期
Earnings per share
一株当たり当期純利益
Annual dividend per share
年間配当金
Interim dividend per share
中間配当
Year-end dividend per share
期末配当
Dividend payout ratio
配当性向
Return on equity
自己資本当期純利益率 (ROE)
RevisedForecasts Proportion
YOY
2018 / 3月期
FY2017
前年同期比
実績 構成比 当初計画 修正計画 構成比
FY2017
2018 / 3月期
今回予想
Forecasts
FY20162017 / 3月期
Results ProportionPreviousforecasts
74 35
2,017 5.7% 2,100
27,915 29,850 29,780 1,864 6.7%
35,129 100.0% 37,500 37,500 100.0% 2,370 6.7%
8.7%
117
3,100 8.8% 3,150 3,250 8.7%
2,935 8.4% 3,200 3,300 8.8%
132
150
4,112 4,500 4,470
7.0%7,213 20.5% 7,650 7,720 20.6% 506
357
-29.9%-68
7 5.6%
4.8%
365 12.4%
224
228 147 160
3,120 3,230 8.6%
2,160 5.8%
2,948 3,090 3,190
15
142 7.1%
-2
55
17 5
30.2%
16.3%
¥92
¥40
¥52
30.1%
¥53
¥45
¥98
No change in business performance forecasts released in Nov. 2017.
業績予想は、2017年11月の発表から変更ありません。
Results
実績
¥304.14 ¥325.23
3,005 8.6% 7.5%
140
-14.2%
8.2%241
-19 -25.8%
10

大和ハウスグループ 2018年3月期 第3四半期 決算概要
Daiwa House Group Financial Highlights for FY2017 3Q
Business Performance Forecasts for FY2017 ② No change in business performance forecasts released in Nov. 2017.
2018年3月期 業績予想 ② 業績予想は、2017年11月の発表から変更ありません。
FY20162017 / 3月期
Amounts Ratio Amounts Ratio増減額 増減率 増減額 増減率
FY20162017 / 3月期
Amounts Ratio Amounts Ratio YOY Change change増減額 増減率 増減額 増減率 増減 増減
Note: Sales and operating income by segment include intragroup transactions between segments. / 注:上記実績には、セグメント間の内部取引を含んでいます。
3,100 3,150 +0.3pt
1.9%
40 4.8%
30 11.1%270
1,007
+0.4pt
-
20
4.4%4.8%
3.9%
10.2%
192 220
134 110 -24 -18.1% 4.2%
10.2%
合計
Total
事業施設
Logistics, Business &Corporate Facilities
商業施設
Commercial Facilities
住宅ストック
Other Businesses
その他
Results前年同期比
修正計画
37,500 2,370 6.7%
27 14.0%
3,903
前年同期比
5.6%
実績 修正計画
21.9%
5,900 202 3.5%
-
-80
-
-
9,772
Results
■Sales
Rental Housing
(\ 100 Million / 億円)
Single-Family Houses
戸建住宅
Rental Housing
賃貸住宅
Condominiums
マンション
Existing Home Business
住宅ストック
Commercial Facilities
商業施設
Logistics, Business &Corporate Facilities
事業施設
Other Businesses
その他
Total
Single-Family Houses
(\ 100 Million / 億円)
■Operating income
合計
戸建住宅
売上高
営業利益
1,070 62 6.2%
130 131 0 0.1%
942 1,050 107 11.3%
1,055 1,100 44
8,284
5,697
Existing Home Business
マンション
Condominiums
実績
賃貸住宅
2,628
RevisedForecasts
YOY
3,910 6 0.2%
PreviousForecasts
当初計画
3,910 -
計画対比
Difference between forecasts
-
8,550 265 3.2%
-
-2.8%
-
-
-
5,135 6,260 1,124
35,129
789 80
168 300 131 77.9%
10.2%
-37,500
PreviousForecasts
当初計画
200
1,050
120
131
1,050
830
RevisedForecasts
YOY
870
Difference between forecasts
計画対比
20
100149 4.8% 3.2%3,250
FY20172018 / 3月期
10,320
2,880
1,100
5,900
8,550
6,180
2,800 171 6.5%
4.2%
計画対比
Operating margin
営業利益率
18.1% 17.8%
Revised修正
+0.5pt
Previous当初
5.1%
-
-0.3pt
-11.9%11.9%
2018 / 3月期
-
10,320 547 5.6%
-
80
-
8.4%-0.1pt
9.7%
+1.5pt
-1.2pt
+0.4pt
-0.5pt
+0.7pt
+0.6pt
10.2% +0.7pt
1.3%
8.7%
10.0%
- -
-10 -8.3%
FY2017
+0.3pt
+0.5pt
Difference between forecasts
11
大和ハウスグループ 2018年3月期 第3四半期 決算概要
Daiwa House Group Financial Highlights for FY2017 3Q
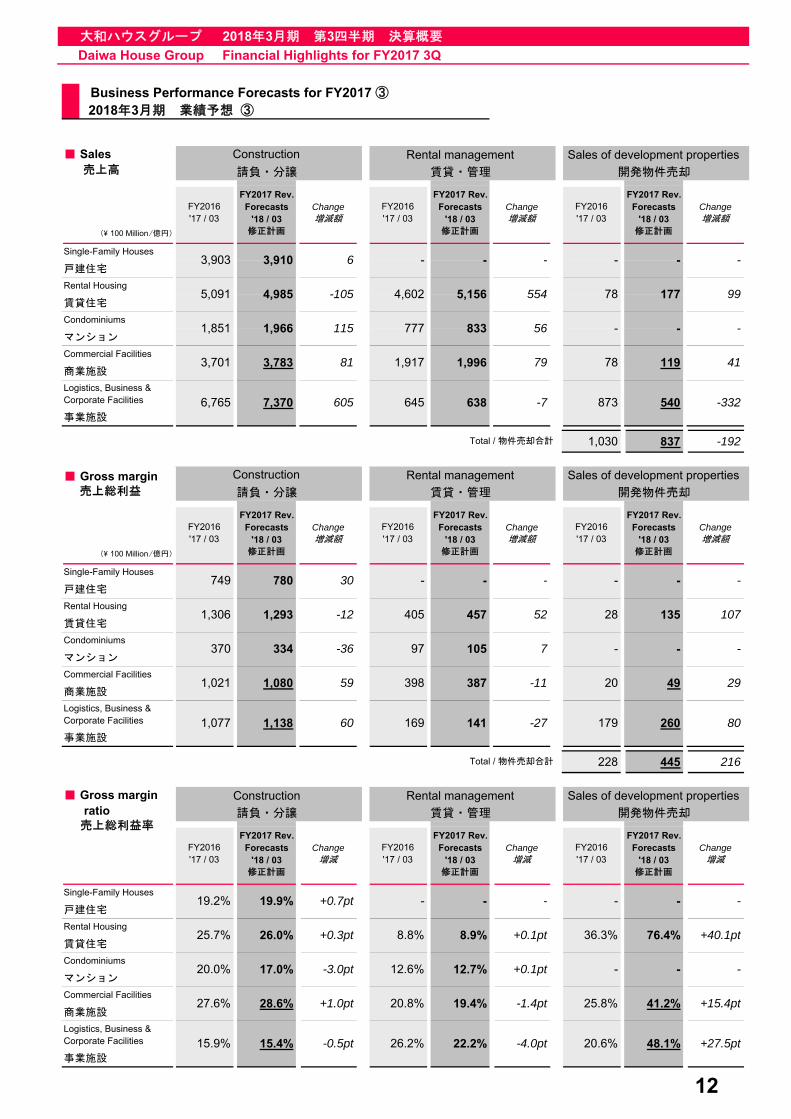
Business Performance Forecasts for FY2017 ③ 2018年3月期 業績予想 ③
Rental management Sales of development properties
請負・分譲 賃貸・管理 開発物件売却
(\ 100 Million/億円)
FY2016'17 / 03
FY2017 Rev.Forecasts
'18 / 03修正計画
Change増減額
FY2016'17 / 03
FY2017 Rev.Forecasts
'18 / 03修正計画
Change増減額
FY2016'17 / 03
FY2017 Rev.Forecasts
'18 / 03修正計画
Change増減額
1,030 837 -192
Rental management Sales of development properties
請負・分譲 賃貸・管理 開発物件売却
(\ 100 Million/億円)
FY2016'17 / 03
FY2017 Rev.Forecasts
'18 / 03修正計画
Change増減額
FY2016'17 / 03
FY2017 Rev.Forecasts
'18 / 03修正計画
Change増減額
FY2016'17 / 03
FY2017 Rev.Forecasts
'18 / 03修正計画
Change増減額
228 445 216
Construction Rental management Sales of development properties
請負・分譲 賃貸・管理 開発物件売却
FY2016'17 / 03
FY2017 Rev.Forecasts
'18 / 03修正計画
Change増減
FY2016'17 / 03
FY2017 Rev.Forecasts
'18 / 03修正計画
Change増減
FY2016'17 / 03
FY2017 Rev.Forecasts
'18 / 03修正計画
Change増減
+27.5pt事業施設
26.2% 22.2% -4.0pt 20.6% 48.1%
+15.4pt商業施設
Logistics, Business &Corporate Facilities 15.9% 15.4% -0.5pt
Commercial Facilities27.6% 28.6% +1.0pt 20.8% 19.4%
+40.1pt賃貸住宅
Condominiums20.0% 17.0% -3.0pt -
マンション- -
Rental Housing 25.7% 26.0% +0.3pt 8.8% 8.9% +0.1pt
12.6% 12.7% +0.1pt
80事業施設
Total / 物件売却合計
-戸建住宅
- -
Logistics, Business &Corporate Facilities 1,077 1,138 60 169 141
- - -
■ Gross margin ratio 売上総利益率
Single-Family Houses19.2% 19.9% +0.7pt
- -マンション
Commercial Facilities1,021 1,080 59 29
商業施設20 49
Condominiums370 334 -36 97 105
107賃貸住宅
28 135
Logistics, Business &Corporate Facilities 6,765 7,370 605
-
-332事業施設
Total / 物件売却合計
■ Gross margin 売上総利益
Single-Family Houses749 780 30 -
645 638 -7 873
405Rental Housing
540
戸建住宅
Condominiums1,851 1,966 115 -
マンション
Commercial Facilities3,701 3,783 81 1,917 1,996
777 833 56 - -
79 78 119 41商業施設
-戸建住宅
Rental Housing 5,091 4,985 -105 4,602 5,156
- - - - -
554 78 177 99賃貸住宅
■ Sales 売上高
Single-Family Houses3,903 3,910 6
Construction
Construction
260-27
-
457 52
7 -
-
1,306 1,293 -12
- -
398 387 -11
36.3%
179
76.4%
-1.4pt 25.8% 41.2%
12

大和ハウスグループ 2018年3月期 第3四半期 決算概要
Daiwa House Group Financial Highlights for FY2017 3Q
Orders Received by Business Segment (Non-consolidated) 事業別受注高(個別)
■ Orders received事業別受注高
Amounts Ratio増減額 増減率
Custom-built houses
戸建住宅
Houses in housing development projects
分譲住宅
住宅 Land (including residential lots
of housing development projects)
土地
Sub-total
小 計
■ Orders received forecasts事業別受注高 計画
Amounts Ratio増減額 増減率
Custom-built houses
戸建住宅
Houses in housing development projects
分譲住宅
住宅 Land (including residential lots
of housing development projects)
土地
Sub-total
小 計3,914
4.0%
9,300 3,950
31
Logistics, Business & Corporate Facilities- 2,866 - 3,150
事業施設
Commercial Facilities- 3,990
283
75
39
1,124 2,300 1,200
集合住宅
Rental Housing
商業施設
Condominiums (for sale)
マンション
9,431
2.2%Total
合計
Notes: In the Rental Housing, Condominiums, Commercial Facilities, and Logistics, Business & Corporate Facilities businesses, the figures in the charts includeland and buildings. The YOY ratio is calculated on a value basis. Although Existing Home business, Leisure business, and Environment and Energy business havebeen omitted from the charts since they had no material impact on the total amount, the total has been calculated including each value.注:集合住宅・マンション・商業施設・事業施設は、土地・建物を含みます。増減率は金額ベースで算出しています。また、「住宅ストック」「観光」「環境エネルギー」は合計金額に与える影響が軽微の為、省略していますが、「合計」の欄には、各々の数値を含んで算出しています。
9.9%
1.0%
6.7%
-
54,161 17,983 53,200 18,370
42,508 5,296 41,600 5,150
- 4,030
2,222
Units Amounts
3 0.1%
386
35
-2.8%-146
0.9%
合計
-
Single-FamilyHouses
2,160 542 2,220 544
2,597 7,080
FY2016
2017 / 3月期
42,267 13,374
(\ 100 Million/億円)戸数 金額
7,271
FY2017 Forecasts (announced in Nov. 2017)
1 0.2%
773
金額
前年同期比
- 2,950 -33 -1.1%
13,956 581 4.4%
- 2,789 653 30.6%
38,283
2018 / 3月期 計画 (2017.11公表)
YOY
Units Amounts
805
戸数
2,601
マンション
集合住宅
Condominiums (for sale)1,614 769
Commercial Facilities- 2,983
Total
商業施設
事業施設
Logistics, Business & Corporate Facilities- 2,135
1,586 835 65
3,876 -73 -1.9%
Single-FamilyHouses
1,539 389 1,669 403 13 3.5%
Rental Housing33,486 3,949 29,954
- 580 - 595 14 2.5%
8.5%
(\ 100 Million/億円) 戸数 金額 戸数 金額
5,628 1,995 5,074 1,889
FY2016 3Q FY2017 3Q
2016 / 12月期 2017 / 12月期
Units Amounts Units Amounts
7,167 2,966 6,743 2,888 -78 -2.6%
-106 -5.3%
YOY 前年同期比
13
14
大和ハウスグループ 2018年3月期 第3四半期 決算概要
Daiwa House Group Financial Highlights for FY2017 3Q
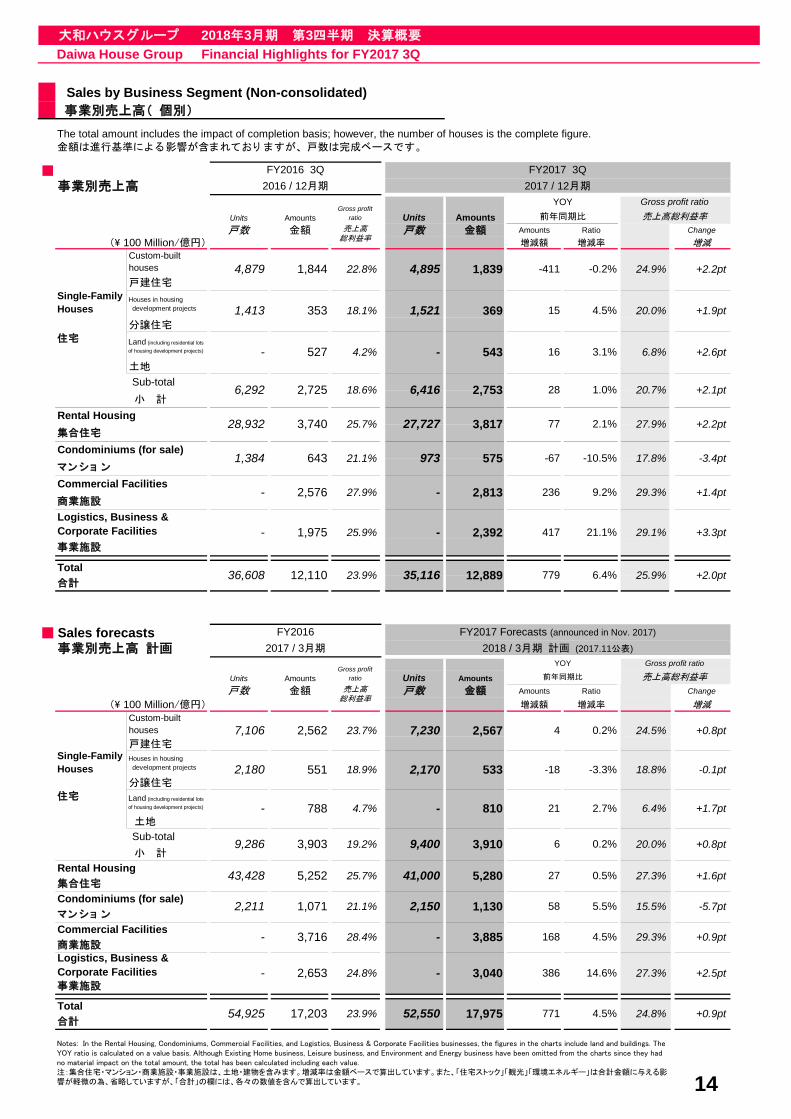
Sales by Business Segment (Non-consolidated) 事業別売上高( 個別)
■事業別売上高
Amounts Ratio Change
(\ 100 Million/億円) 増減額 増減率 増減
Custom-builthouses戸建住宅
Houses in housing development projects
分譲住宅
住宅 Land (including residential lotsof housing development projects)
土地
Sub-total 小 計
■ Sales forecasts
Amounts Ratio Change
(\ 100 Million/億円) 増減額 増減率 増減
Custom-builthouses戸建住宅Houses in housing development projects
分譲住宅
住宅 Land (including residential lotsof housing development projects)
土地
Sub-total 小 計
24.9%
- 527 4.2% - 543 16 3.1% 6.8%
1,521 369 15 4.5%
FY2016 3Q2016 / 12月期
Single-FamilyHouses 1,413
4,879 1,844 22.8%
+2.6pt
+2.1pt6,292 2,725
-411
3,910
Notes: In the Rental Housing, Condominiums, Commercial Facilities, and Logistics, Business & Corporate Facilities businesses, the figures in the charts include land and buildings. TheYOY ratio is calculated on a value basis. Although Existing Home business, Leisure business, and Environment and Energy business have been omitted from the charts since they hadno material impact on the total amount, the total has been calculated including each value.注:集合住宅・マンション・商業施設・事業施設は、土地・建物を含みます。増減率は金額ベースで算出しています。また、「住宅ストック」「観光」「環境エネルギー」は合計金額に与える影響が軽微の為、省略していますが、「合計」の欄には、各々の数値を含んで算出しています。
Total
集合住宅
Condominiums (for sale)2,211 1,071 21.1%
386 14.6%
+1.9pt
合計52,550 17,975 771 4.5% +0.9pt
27.3%
Units AmountsGross profit
ratio Units AmountsYOY Gross profit ratio
前年同期比 売上高総利益率
-0.2%4,895 1,839
353 18.1%
25.7%
-10.5% 17.8% -3.4pt
2.1% 27.9% +2.2pt
4 0.2% 24.5%
18.8%
+3.3pt
25.9%
+0.8pt
+2.2pt
20.0%
Amounts
2,813 236
-67
戸数 金額 売上高総利益率
戸数 金額
2,753 2818.6% 6,416 1.0% 20.7%
29.3% +1.4pt9.2%
29.1%
集合住宅
Condominiums (for sale)1,384 643 21.1% 973 575
77Rental Housing
28,932 3,740 27,727 3,817
マン ショ ン
Logistics, Business &Corporate Facilities事業施設
Commercial Facilities- 2,576 27.9% -
商業施設
- 1,975 25.9% - 2,392 417 21.1%
-
YOY
戸数
前年同期比
金額 売上高総利益率
戸数 金額
4.7% -
2017 / 3月期
Units AmountsGross profit
ratio Units
2,567
2.7%
事業別売上高 計画
+2.0ptTotal
36,608 12,110 23.9% 35,116合計
FY2016
12,889 779 6.4%
2018 / 3月期 計画 (2017.11公表)
533 -18 -3.3%
+1.7pt
Gross profit ratio
売上高総利益率
2,170
7,106 2,562 23.7% 7,230
9,286 3,903 19.2% 9,400
27 27.3% +1.6pt
21
6 0.2% 20.0% +0.8pt
6.4%
0.5%
15.5% -5.7pt
3,040
Single-FamilyHouses 2,180 551 18.9%
商業施設Logistics, Business &Corporate Facilities +2.5pt
168 4.5% 29.3% +0.9pt- 3,885
- 2,653 24.8%
-0.1pt
788 810
24.8%
事業施設
- 3,716 28.4%Commercial Facilities
-
54,925 17,203 23.9%
マン ショ ン2,150 1,130 58 5.5%
41,000 5,280Rental Housing43,428 5,252 25.7%
The total amount includes the impact of completion basis; however, the number of houses is the complete figure.金額は進行基準による影響が含まれており ますが、 戸数は完成ベースです。
FY2017 3Q2017 / 12月期
FY2017 Forecasts (announced in Nov. 2017)

大和ハウスグループ 2018年3月期 第3四半期 決算概要
Daiwa House Group Financial Highlights for FY2017 3Q
Status of Investment Plan 投資計画の進捗状況
FY2016Results
2017/12Results
Cumulative actual
(\100 Million/億円)
2016年度実績
実績('17/4-'17/12)
累計実績('16/4-'17/12)
Rental Housing 賃貸住宅 211 72 284
Commercial Facilities 商業施設 483 298 781
Logistics, Business & CorporateFacilities 事業施設 1,659 1,094 2,754
Overseas 海外 451 226 678
Real Estate Development 不動産開発 2,806 1,691 4,498
Capital Investments 771 545 1,316
M&A 12 352 365
3,590 2,589 6,180
Consolidated Statements of Cash Flows 連結キャッシュ・フローの状況
(\ 100 Million / 億円)
FY2016 3Q FY2017 3Q Change
2016/ 12月期 2017/ 12月期 増減
Net cash provided by (used in) operating activities
営業活動によるキャッシュ・フロー
Depreciation and amortization
減価償却費
Net cash provided by (used in) investing activities
投資活動によるキャッシュ・フロー
Net cash provided by (used in) financing activities
財務活動によるキャッシュ・フロー
Net increase (decrease) in cash and cash equivalents
現金及び現金同等物の増減額(△は減少)
Cash and cash equivalents at beginning of period
現金及び現金同等物の期首残高
Cash and cash equivalents at the end of the period
現金及び現金同等物の期末残高
1,008
468
243
98
289
30
設備投資(事務所・工場等)
1,638
617
1,889
2,789
2,035
275
2,133
2,4092,507
719
438
1,707 1,081
396
341
Total 合計
15
大和ハウスグループ 2018年3月期 第3四半期 決算概要
Daiwa House Group Financial Highlights for FY2017 3Q
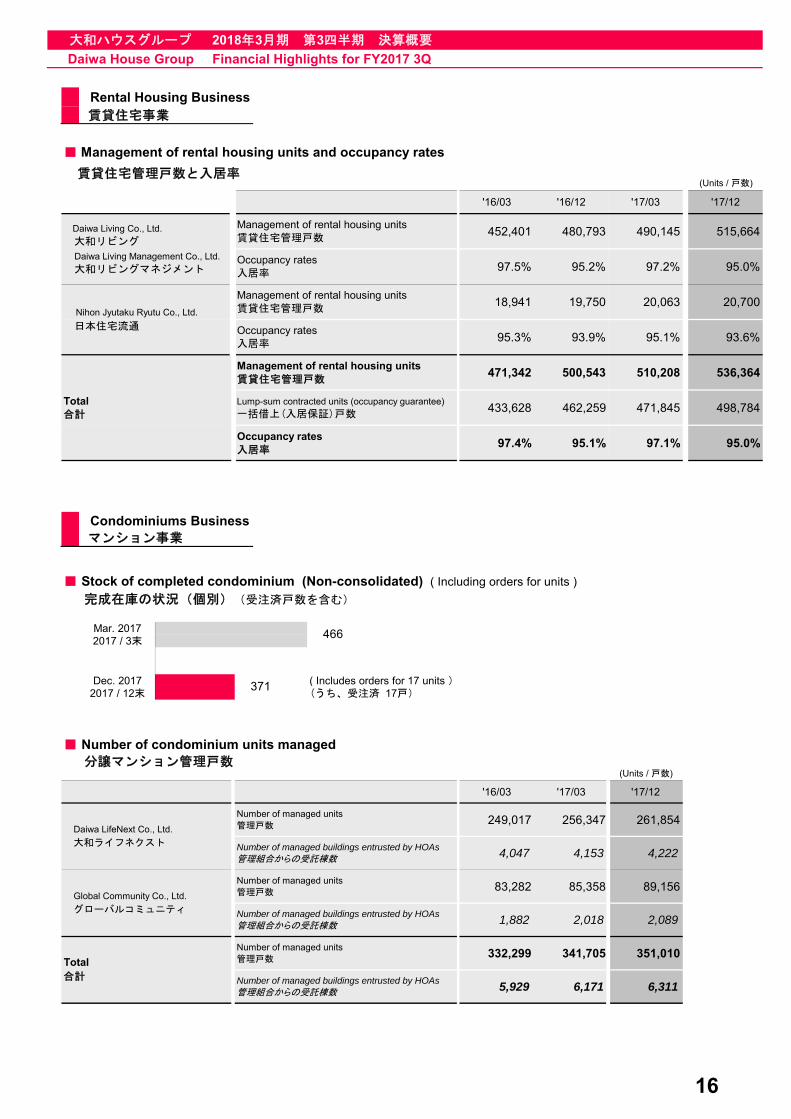
Rental Housing Business 賃貸住宅事業
■ Management of rental housing units and occupancy rates
賃貸住宅管理戸数と入居率
'16/03 '16/12 '17/03 '17/12
452,401 480,793 490,145 515,664
97.5% 95.2% 97.2% 95.0%
18,941 19,750 20,063 20,700
95.3% 93.9% 95.1% 93.6%
471,342 500,543 510,208 536,364
433,628 462,259 471,845 498,784
97.4% 95.1% 97.1% 95.0%
Condominiums Business マンション事業
■ Stock of completed condominium (Non-consolidated) ( Including orders for units )
完成在庫の状況(個別)(受注済戸数を含む)
Mar. 20172017 / 3末
Dec. 2017 ( Includes orders for 17 units )2017 / 12末 (うち、受注済 17戸)
■ Number of condominium units managed 分譲マンション管理戸数
'16/03 '17/03 '17/12
Daiwa LifeNext Co., Ltd.249,017 256,347 261,854
大和ライフネクスト4,047 4,153 4,222
Global Community Co., Ltd.83,282 85,358 89,156
グローバルコミュニティ1,882 2,018 2,089
Total332,299 341,705 351,010
合計5,929 6,171 6,311
Number of managed buildings entrusted by HOAs管理組合からの受託棟数
Number of managed units管理戸数
Number of managed buildings entrusted by HOAs管理組合からの受託棟数
Number of managed units管理戸数
Number of managed buildings entrusted by HOAs管理組合からの受託棟数
Number of managed units管理戸数
(Units / 戸数)
(Units / 戸数)
Daiwa Living Co., Ltd.
大和リビング
Daiwa Living Management Co., Ltd.
大和リビングマネジメント
Nihon Jyutaku Ryutu Co., Ltd.
日本住宅流通
Total合計
371
466
Occupancy rates入居率
Lump-sum contracted units (occupancy guarantee)
一括借上(入居保証)戸数
Management of rental housing units賃貸住宅管理戸数
Occupancy rates入居率
Management of rental housing units賃貸住宅管理戸数
Occupancy rates入居率
Management of rental housing units賃貸住宅管理戸数
16

大和ハウスグループ 2018年3月期 第3四半期 決算概要
Daiwa House Group Financial Highlights for FY2017 3Q
Overseas Business 海外事業
■ Cumulative overseas investment balance 海外出資残高累計
2017 / 12
China 中国 825
USA アメリカ 509
ASEAN ASEAN 309
Australia オーストラリア 67
Other その他 14
Total 合計 1,726
■ Sales status of condominium for sale development 分譲マンションの販売状況
(Units / 戸数)
Project Name/ プロジェクト名 Location/ 地域 2017/09 2017/12
Units for sale販売戸数
2,105 2,107
Contract units契約戸数
2,026 2,041
: 2,108 Contract ratio契約率
96.2% 96.9%
Units for sale販売戸数
1,077 1,077
Contract units契約戸数
1,077 1,077
: 1,178 Contract ratio契約率
100.0% 100.0%
Units for sale販売戸数
119 167
Contract units契約戸数
71 132
: 308 Contract ratio契約率
59.7% 79.0%
Units for sale販売戸数
407 418
Contract units契約戸数
386 391
: 436 Contract ratio契約率
94.8% 93.5%
Units for sale販売戸数
229 229
Contract units契約戸数
135 143
: 233 Contract ratio契約率
59.0% 62.4%
Units for sale販売戸数
164 164
Contract units契約戸数
163 163
: 164 Contract ratio契約率
99.4% 99.4%
Units for sale販売戸数
714 714
Contract units契約戸数
679 709
: 714 Contract ratio契約率
95.1% 99.3%
*SOHO stands for Small Office/ Home Office
※SOHOは、スモールオフィス・ホームオフィス(Small Office/ Home Office)の略です。
Total units for sale販売総戸数
(Phase 1)
Total units for sale販売総戸数
Tempo (Drummoyne)テンポ
(ドゥルモイン)
Canada Bay New SouthWales, Australia
豪州・ニュー・サウス・ウェールズ州カナダベイ市
Mid-Town Projectミッドタウン・プロジェクト
"Phu My Hung" area,Hồ Chí Minh, Vietnamベトナム・ホーチミン
『フーミーフン』エリア
Total units for sale販売総戸数
Total units for sale販売総戸数
Total units for sale販売総戸数(Stage Ⅲ・Ⅳ)
Total units for sale販売総戸数
(\ 100 Million/億円)
(Ref./参考) SOHOTotal units for sale
販売総戸数
Flour Mill ofSummer Hill
フラワー・ミル・オブ・サマー・ヒル
Inner West New SouthWales, Australia
豪州・ニュー・サウス・ウェールズ州
インナーウェスト市
Yihe Xinghaiイワ・セイカイ(頤和星海)
Dalian, China中国・大連市
Moonlit Gardenムーンリット・
ガーデン(呉月雅境)
Wuxi, China中国・無錫市
The Grace Residenceグレース・レジデンス(龍洲伊都)
Changzhou, China中国・常州市
17


![第8期決算説明資料 統合版 Final.pptx[読み取り専用]...(2016年2月末) 第5期末 (2016年8月末) 第6期末 (2017年2月末) 第7期末 (2017年8月末) 第8期末](https://img.pdfslide.tips/doc/110x75/5f897c4f5e4a39466a6e5ca0/c8oecee-cc-finalpptxec-20162oeoe.jpg)