Embed Size (px)
Citation preview

37Kurita Water Industries Ltd. Annual Report 2017
Financial Section38 Management’s Discussion and Analysis
48 Consolidated Balance Sheets
50 Consolidated Statements of Income and Consolidated Statements of Comprehensive Income
51 Consolidated Statements of Changes in Net Assets
52 Consolidated Statements of Cash Flows
53 Notes to Consolidated Financial Statements
78 Report of Independent Certified Public Accountants
38 Kurita Water Industries Ltd. Annual Report 2017
MANAGEMENT’S DISCUSSION AND ANALYSIS
Business OverviewDuring the fiscal year ended March 31, 2017, the U.S. and European
economies continued to recover, and China and other emerging
economies in Asia shifted to economic recovery due largely to economic
policies. As a result, the global economy overall grew gradually.
The Japanese economy continued to grow, though not vigorously,
because of a gradual pickup in consumer spending, improved corporate
earnings due to the slowdown in yen appreciation in the second half,
and moderate growth in overseas economies.
Looking at the market environment surrounding the Kurita Group,
signs of recovery were seen in production in the Japanese manufacturing
industry, but capital expenditures have plateaued because of worries about
the future due to the stronger yen in the first half. Overseas, demand for
water treatment continued to grow in East and Southeast Asia.
In this environment, based on its three-year medium-term man-
agement plan Competitive Kurita 2017 (CK-17) begun in the fiscal year
ended March 31, 2016, the Group focused on expanding its overseas
businesses, improving profitability, and creating competitive products
and services.
Regarding expanding our overseas businesses, to accelerate our
business development in the United States, the Group purchased Fre-
mont Industries, LLC, a U.S. limited liability company that manufactures
and sells water treatment chemicals, thereby acquiring a business base
in the American Midwest. Also, to increase its management effectiveness
in Europe, the Middle East, and Africa (EMEA), the Group merged Kurita
Europe GmbH and Kurita Europe APW GmbH and worked to unite their
possessed technology and know-how and to reorganize their sales
and manufacturing systems. It also decided to establish in Singapore
a new company that carries out research and development in order to
speed up technological development related to seawater desalination
and wastewater reclamation and reuse and to gather information on
leading-edge technology.
As for improving profitability, the Group worked hard to combine
its proprietary sensing technology and water treatment data analysis
expertise with existing technology and products to improve its ability
to propose solutions to customers. Moreover, the Group improved the
profitability of its installation projects by focusing on those in which it
could add a large amount of value, while promoting the revision and
standardization of processes in its manufacturing work.
Regarding the creation of competitive products and services, the
Group developed a standardized wastewater reclamation system that
combines the elemental water treatment equipment and chemicals
technology it possesses and contributes to water reuse. The Group
also invested in APANA Inc., an American venture firm, which is rolling
out a service in the United States that contributes to saving water in
commercial and industrial facilities through big data analysis using IoT,
and is considering a new service business collaboration with APANA.
Factors behind reduced net sales for the Group include a drop in the
converted yen amount of overseas sales due to appreciation of the yen
and revisions of contracts with a customer in the ultrapure water supply

39Kurita Water Industries Ltd. Annual Report 2017
business. Nevertheless, because of improved profitability as a result of
strict cost management of water treatment facilities and the elimination
of previously incurred one-off costs associated with retirement benefits
and the acquisition of a company in Europe, we were able to maintain
operating income at almost the same level as the previous fiscal year.
Consolidated net income attributable to owners of parent increased
because of a reduced tax burden attributable to a revision to the
corporate tax rate.
Operating Results
a) Orders
In the Water Treatment Chemicals segment, since the rate of operation of
customer factories in Japan recovered moderately and problem-solving
proposals using new products and services were promoted, not only did
orders for boiler water treatment chemicals shift to growth, orders for cool-
ing water treatment chemicals and process treatment chemicals for iron
and steel expanded and the amount of orders increased. Overseas, the
yen equivalent amount of orders taken by overseas subsidiaries decreased
because of yen appreciation, and the overall amount of orders fell.
In the Water Treatment Facilities segment, for the electronics
industry, in addition to slow orders for large, overseas water treatment
facilities, due to revisions of contracts with a customer in the ultrapure
water supply business, the overall amount of orders decreased.
As a result, total consolidated orders were ¥218,730 million, a
decrease of 1.1% compared with the previous fiscal year.
b) Net Sales
In Japan, sales of water treatment chemicals, maintenance services, and
soil remediation increased, but domestic net sales decreased slightly
because sales were down for our ultrapure water supply business.
Overseas, sales by consolidated subsidiaries fell in yen terms because of
the strengthening of the yen, but sales of water treatment facilities to
the electronics industry in China and Korea increased, leading to a slight
increase in overseas sales.
As a result, total net sales amounted to ¥214,187 million, a decrease
of 0.1% compared with the previous fiscal year.
c) Cost of Sales and Gross Profit
Cost of sales increased 1.0%, from ¥143,964 million in the previous fiscal
year, to ¥145,455 million. Cost of sales as a percentage of sales came to
67.9%, compared with 67.2% in the previous fiscal year.
d) Selling, General and Administrative (SG&A) Expenses
SG&A expenses were ¥49,280 million, down 2.6% from the previous fiscal
year’s ¥50,574 million. As salaries and bonuses increased, retirement
benefit expenses and R&D expenses decreased.
Orders by SegmentYears ended March 31(Millions of yen)
Water Treatment Chemicals
Water Treatment Facilities
130,700
186,741
56,040
114,049 121,928 137,832
173,463 181,282
221,273
59,413 59,353 83,440
2013 2014 2015 2016
136,611
218,730
82,118
2017
Sales by SegmentYears ended March 31(Millions of yen)
Water Treatment Chemicals
Water Treatment Facilities
180,143
56,091
178,137
58,844
124,052 119,292
189,398
59,999
129,399
2013 2014 2015
214,372
83,680
130,692
2016
214,187
81,883
132,304
2017
Gross Pro�tYears ended March 31(Millions of yen)
59,09655,267
58,889
2013 2014 2015
70,407
2016
68,732
2017
40 Kurita Water Industries Ltd. Annual Report 2017
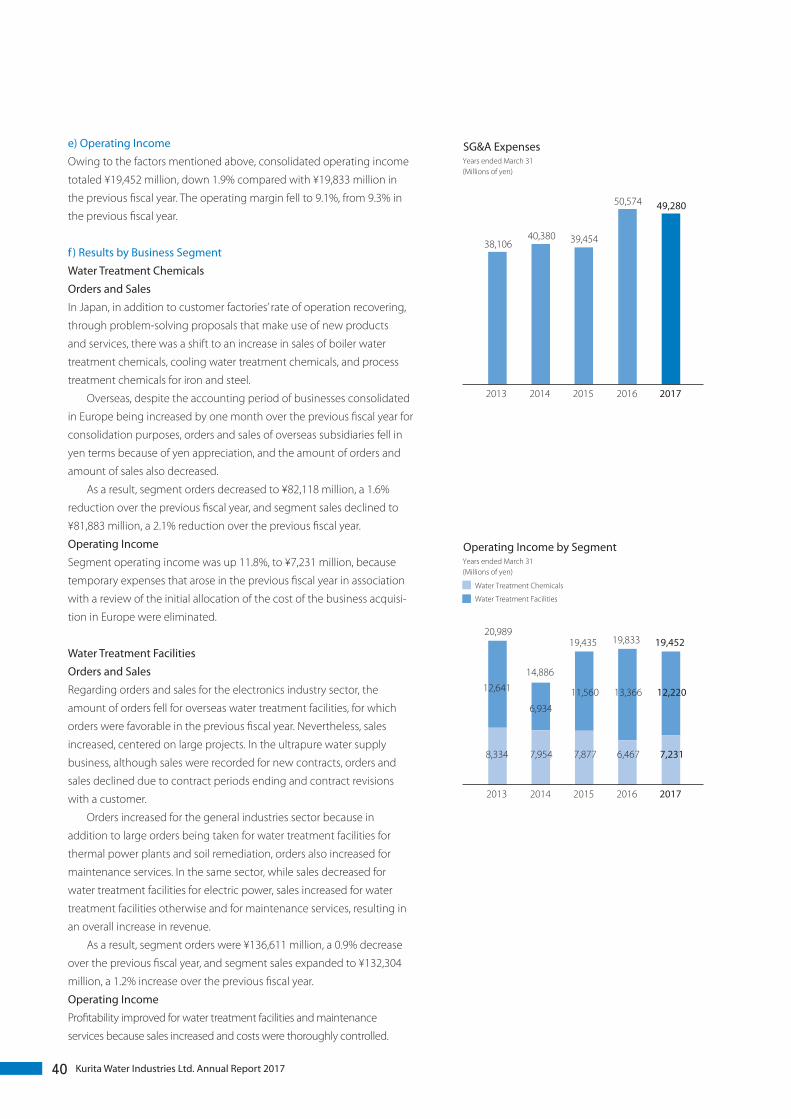
e) Operating Income
Owing to the factors mentioned above, consolidated operating income
totaled ¥19,452 million, down 1.9% compared with ¥19,833 million in
the previous fiscal year. The operating margin fell to 9.1%, from 9.3% in
the previous fiscal year.
f ) Results by Business Segment
Water Treatment Chemicals
Orders and Sales
In Japan, in addition to customer factories’ rate of operation recovering,
through problem-solving proposals that make use of new products
and services, there was a shift to an increase in sales of boiler water
treatment chemicals, cooling water treatment chemicals, and process
treatment chemicals for iron and steel.
Overseas, despite the accounting period of businesses consolidated
in Europe being increased by one month over the previous fiscal year for
consolidation purposes, orders and sales of overseas subsidiaries fell in
yen terms because of yen appreciation, and the amount of orders and
amount of sales also decreased.
As a result, segment orders decreased to ¥82,118 million, a 1.6%
reduction over the previous fiscal year, and segment sales declined to
¥81,883 million, a 2.1% reduction over the previous fiscal year.
Operating Income
Segment operating income was up 11.8%, to ¥7,231 million, because
temporary expenses that arose in the previous fiscal year in association
with a review of the initial allocation of the cost of the business acquisi-
tion in Europe were eliminated.
Water Treatment Facilities
Orders and Sales
Regarding orders and sales for the electronics industry sector, the
amount of orders fell for overseas water treatment facilities, for which
orders were favorable in the previous fiscal year. Nevertheless, sales
increased, centered on large projects. In the ultrapure water supply
business, although sales were recorded for new contracts, orders and
sales declined due to contract periods ending and contract revisions
with a customer.
Orders increased for the general industries sector because in
addition to large orders being taken for water treatment facilities for
thermal power plants and soil remediation, orders also increased for
maintenance services. In the same sector, while sales decreased for
water treatment facilities for electric power, sales increased for water
treatment facilities otherwise and for maintenance services, resulting in
an overall increase in revenue.
As a result, segment orders were ¥136,611 million, a 0.9% decrease
over the previous fiscal year, and segment sales expanded to ¥132,304
million, a 1.2% increase over the previous fiscal year.
Operating Income
Profitability improved for water treatment facilities and maintenance
services because sales increased and costs were thoroughly controlled.
Operating Income by SegmentYears ended March 31(Millions of yen)
Water Treatment Chemicals
Water Treatment Facilities
20,989
12,641 14,886
7,954 8,334
6,934
19,435
7,877
11,560
2013 2014 2015
19,833
6,467
13,366
2016
19,452
7,231
12,220
2017
SG&A ExpensesYears ended March 31(Millions of yen)
38,10640,380 39,454
2013 2014 2015
50,574
2016
49,280
2017

41Kurita Water Industries Ltd. Annual Report 2017
However, because of reduced income for our ultrapure water supply
business, segment operating income decreased 8.6%, to ¥12,220 million.
g) Overseas Sales
Sales by Region
Overseas sales for the fiscal year under review were ¥64,199 million (an
increase of 0.5% over the previous fiscal year). The overseas sales ratio
within consolidated net sales increased to 30.0%, from 29.8% in the
previous fiscal year.
Regional Breakdown
Asia: Up 5.6%, to ¥39,899 million; 62.1% of total overseas sales
North America: Down 22.5%, to ¥1,885 million; 2.9% of total
overseas sales
EMEA*: Down 4.5%, to ¥19,774 million; 30.8% of total overseas sales
Other regions: Down 11.1%, to ¥2,641 million; 4.1% of total
overseas sales * EMEA includes Europe, the Middle East, and Africa.
h) Other Income and Expenses
Other income and expenses–net came to income of ¥1,013 million,
compared with ¥578 million in the previous fiscal year.
The main reason was the elimination of a ¥176 million loss on
liquidation of business recorded in the previous fiscal year and a ¥391
million gain on sales of investment securities that was not in the
previous fiscal year.
i) Income Before Income Taxes
Income before income taxes increased 0.3%, to ¥20,465 million,
compared with ¥20,411 million in the previous fiscal year.
The pretax profit margin increased to 9.6%, from 9.5% in the
previous fiscal year.
j) Net Income Attributable to Owners of Parent
After deducting income taxes and profit attributable to non-controlling
interests from pretax profits, Kurita recorded consolidated net income
attributable to owners of parent of ¥14,506 million for the fiscal year
ended March 31, 2017, an increase of 15.3% compared with ¥12,577
million in the previous fiscal year. This was due to a reduced tax burden
from a revision to the corporate tax rate.
Net income per share increased to ¥125.23, from ¥108.24 in the
previous fiscal year. The net income margin rose to 6.8%, from 5.9%.
Return on equity (ROE) increased to 6.4%, from 5.6%.
k) Policies on Shareholder Returns
Kurita’s basic policy is to pay stable dividends on an ongoing basis.
Setting a payout ratio of 30–50% as our target, we will continuously
work to increase dividends, making decisions based on the payout
ratios for the most recent five years to respond flexibly to fluctuations
in business performance each year. With regard to the use of excess
internal reserves, we prioritize business investment for growth, after
Overseas Sales by RegionFiscal year ended March 31, 2017
62.1%
2.9%
30.8%
Asia .....................................................................¥39,899 million
North America ................................................¥1,885 million
EMEA .................................................................¥19,774 million
Other regions..................................................¥2,641 million
4.1%
Overseas Sales
¥64,199million
Operating Margin by SegmentYears ended March 31 (%)
Water Treatment Chemicals
Total
Water Treatment Facilities
14.9
11.7
10.2
13.513.1
10.28.4
10.3
9.39.1
9.2
5.8
8.97.7
8.8
2013 2014 2015 2016 2017
Net Income per ShareYears ended March 31(Yen)
92.43
78.4887.81
2013 2014 2015
108.24
2016
125.23
2017

42 Kurita Water Industries Ltd. Annual Report 2017
securing precautionary funds to prepare for working capital and rapid
fluctuations in the operating environment. If excess funds remain, we
consider a buyback of our own stock, taking the share price into consid-
eration, and take steps to improve capital efficiency and return profits to
shareholders.
During the fiscal year under review, the Company paid dividends
of ¥50 per share, including an interim dividend of ¥25. This amount
corresponds to a ¥2 increase from ¥48 per share in the previous fiscal year.
Capital ExpendituresThe Kurita Group is committed to making investments necessary for
technological innovation and production capacity expansion, and to
enhancing competitiveness in response to intensified sales competition.
In the fiscal year ended March 31, 2017, capital expenditures totaled
¥10,087 million, a decrease of ¥9,536 million compared with the previous
fiscal year, mainly due to the acquisition of business facilities.
The Water Treatment Chemicals segment undertook capital expen-
ditures totaling ¥2,175 million, mainly for upgrading water treatment
chemicals production facilities. This represented a decrease of ¥259
million compared with the previous fiscal year.
The Water Treatment Facilities segment carried out capital expendi-
tures totaling ¥7,911 million, mainly for the installation and expansion
of facilities for the ultrapure water supply business. This represented a
¥9,277 million decrease compared with the previous fiscal year.
Depreciation and amortization increased 0.7%, to ¥15,857 million.
Research and DevelopmentThe Kurita Group engages in technological development to reinforce
its core businesses. These include technologies related to boiler and
cooling water treatment, ultrapure water production, water and
wastewater treatment, water reclamation, and soil and groundwater
remediation. We also strive to deepen our understanding of the assay
and analysis technologies that underpin our technologies, as well as new
materials development and other basic technologies. Furthermore, we
are engaged in development to promote new ventures.
Going forward, we will proactively engage in product and tech-
nology development that meets the broad-ranging needs of industry
and society from the perspectives of environmental burden reduction,
resource recycling, and productivity improvement. We will also aggres-
sively pursue research and development involving new water functions
that will lead to new business developments.
Kurita’s R&D activities are performed mainly by the Research and
Development Division. R&D staff number approximately 200, accounting
for 3.6% of overall Group employees. In the fiscal year ended March 31,
2017, Kurita’s R&D expenses totaled ¥5,038 million, equivalent to 2.4% of
net sales.
In the Water Treatment Chemicals segment, Kurita is engaged in the
development of chemicals for water treatment, environmental improve-
ment, and production processes, which contribute to customers’ energy
Dividends per ShareYears ended March 31(Yen)
42.0044.00 46.00
2013 2014 2015
48.00
2016
50.00
2017
Capital Expenditures and Depreciation and AmortizationYears ended March 31(Millions of yen)
6,688
15,054 14,774 14,863
5,709
12,864
2013 2014 2015
15,749
19,623
2016
15,857
10,087
2017
Capital expenditures
Depreciation and amortization
Return on EquityYears ended March 31(%)
5.5
4.4
4.7
5.6
6.4
2013 2014 2015 2016 2017
Note: Return on equity = Net income attributable to owners of parent ÷ Equity (Average) × 100 Equity is de�ned as net assets less non-controlling interests.

43Kurita Water Industries Ltd. Annual Report 2017
savings, environmental burden reduction, and productivity enhance-
ments. Other development activities include diagnostic technology for
chemical effectiveness.
The segment’s main achievements during the fiscal year were as
follows.
• Kurita developed a highly safe film-forming corrosion inhibitor as
an alternative to the conventional oxygen absorber for medium- to
high-pressure boilers, such as power boilers, which are increasing in
use in Japan and abroad. It also developed a water treatment control
support system to prevent trouble by detecting signs of boiler facility
malfunction.
• Kurita developed solid cartridge-type water treatment chemicals that
prevent the growth of Legionella bacteria and are effective for reducing
the adhesion of dirt and inhibiting corrosion in small cooling towers over
a long time just by placing the cartridge in the tower.
• Kurita developed a dehydrating agent that reduces the total slurry
treatment cost in the slurry shield method used in tunnel construction
work by increasing the performance of slurry dehydration and the
filtration rate.
R&D expenses for the Water Treatment Chemicals segment for the
fiscal year ended March 31, 2017, totaled ¥2,123 million.
In the Water Treatment Facilities segment, Kurita is taking up the
challenge of realizing further advances in the quality of ultrapure water
that will contribute to productivity improvements in such industries
as electronics. The Group is also pursuing development in wastewater
treatment to stay ahead of the curve vis-à-vis environmental regulations.
Another focus area is the development of technologies to meet the
needs of a recycling-oriented society. These include wastewater recla-
mation and reuse technology, and sludge reduction technology.
The segment’s main achievements during the fiscal year were as
follows.
• Kurita developed a space-saving, low-cost standardized wastewater
reclamation system that is easy to design and install, as it consists
mainly of membrane treatment units. Stable operation is achieved
by combining Kurita’s unique chemical treatment technologies.
• Kurita developed technology that is highly efficient at treating
high-concentration nitrogen wastewater from methane fermentation.
The technology is for facilities that conduct biogas power generation
through methane fermentation of liquid waste from the food industry.
• By improving the performance of functional materials that make up
the ultrapure water production system, revising the purifying method
while still maintaining quality, Kurita was able to achieve cost reduc-
tions throughout the entire production system as well as maintain the
water standards required by a major semiconductor manufacturing
company.
R&D expenses for the Water Treatment Facilities segment for the
fiscal year ended March 31, 2017, amounted to ¥2,914 million.
R&D ExpensesYears ended March 31(Millions of yen)
4,3624,534 4,397
2013 2014 2015
5,269
2016
5,038
2017

44 Kurita Water Industries Ltd. Annual Report 2017
Financial Positiona) Assets
As of March 31, 2017, Kurita had total assets of ¥299,249 million, an
increase of ¥1,142 million compared with ¥298,107 million as of March
31, 2016.
Breakdown of AssetsCurrent Assets
Current assets as of March 31, 2017, totaled ¥155,930 million, an increase
of ¥5,384 million compared with March 31, 2016. This rise was primarily
attributable to an increase of ¥7,413 million in cash reserves—cash and
time deposits and marketable securities—which outweighed a decrease
of ¥2,734 million in notes and accounts receivable, trade due to the
smooth collection of them.
Investments and Long-Term Receivables, Property, Plant and
Equipment, and Intangible Assets
As of March 31, 2017, investments and long-term receivables came to
¥43,972 million, a decrease of ¥998 million from ¥44,970 million as of
March 31, 2016.
Property, plant and equipment, net as of March 31, 2017, amounted
to ¥74,036 million, a decrease of ¥4,352 million compared with ¥78,388
million as of March 31, 2016.
Intangible assets as of March 31, 2017, were ¥25,308 million, up
¥1,106 million compared with ¥24,202 million as of March 31, 2016.
The decrease in investments and long-term receivables was mainly
due to lower unrealized gains on investment securities due to drops in
the market prices of the shares held by the Group.
The decrease in property, plant and equipment was attributable
chiefly to the recorded amount of depreciation of facilities for the ultra-
pure water supply being greater than the amount of capital investment.
The increase in intangible assets chiefly reflected the fact that
while we posted ¥2,609 million in amortization of intangible fixed
assets including mainly amortization of goodwill, with the acquisition
of Fremont Industries of the United States during the fiscal year under
review we posted goodwill of ¥2,096 million and customer-related assets
of ¥1,983 million.
b) Liabilities
As of March 31, 2017, liabilities totaled ¥70,490 million, an increase of
¥1,348 million compared with ¥69,142 million as of March 31, 2016.
Current Liabilities
Current liabilities as of March 31, 2017, amounted to ¥44,410 million, an
increase of just ¥3 million from ¥44,407 million as of March 31, 2016.
Long-Term Liabilities
Long-term liabilities were ¥26,080 million as of March 31, 2017,
an increase of ¥1,345 million from ¥24,735 million as of March 31,
2016. This was mainly due to a ¥1,213 million rise in other long-term
Total Assets and Return on AssetsYears ended March 31(Millions of yen) (%)
4.3
3.5
3.74.2 4.9
263,580 274,925294,492 298,107
2013 2014 2015 2016
299,249
2017
Return on assets
Total assets
Note: Return on assets = Net income attributable to owners of parent ÷ Total assets (Average) × 100
Property, Plant and Equipment, NetYears ended March 31(Millions of yen)
86,820
77,855 75,033
2013 2014 2015
78,388
2016
74,036
2017

45Kurita Water Industries Ltd. Annual Report 2017
liabilities due to the recording of long-term debt of overseas consoli-
dated subsidiaries.
c) Net Assets
Net assets totaled ¥228,758 million as of March 31, 2017, a decrease of
¥206 million from ¥228,964 million as of March 31, 2016.
This was primarily due to an increase of ¥3,602 million in
shareholders’ equity and a decrease of ¥3,875 million in accumulated
other comprehensive income. The main factors behind the increase
in shareholders’ equity were an increase of ¥8,797 million in retained
earnings, mainly due to net income attributable to owners of parent
of ¥14,506 million for the fiscal year under review, which exceeded
dividend payments of ¥5,693 million—the sum of year-end dividends
for the previous fiscal year and interim dividends for the fiscal year under
review—and a ¥5,195 million rise in treasury stock (net assets fell) mainly
through market purchases due to a resolution of the Board of Directors
dated February 28, 2017, and acquisitions accompanying the introduc-
tion of a performance-linked stock compensation system for directors.
Accumulated other comprehensive income declined, chiefly reflecting
a ¥2,975 million decline in foreign currency translation adjustments due
to the stronger yen, and a decrease of ¥1,269 million in unrealized gains
on available-for-sale securities associated with a decline in unrealized
capital gains for investment securities.
As a result, total liabilities and net assets amounted to ¥299,249
million as of March 31, 2017, an increase of ¥1,142 million compared
with ¥298,107 million as of March 31, 2016. Kurita’s equity ratio was
76.1%, down 0.3 percentage point from 76.4% a year earlier. Net assets
per share as of March 31, 2017, were ¥1,991.91, an increase of ¥30.61
compared with ¥1,961.30 as of March 31, 2016.
Note: Equity is defined as net assets less non-controlling interests.
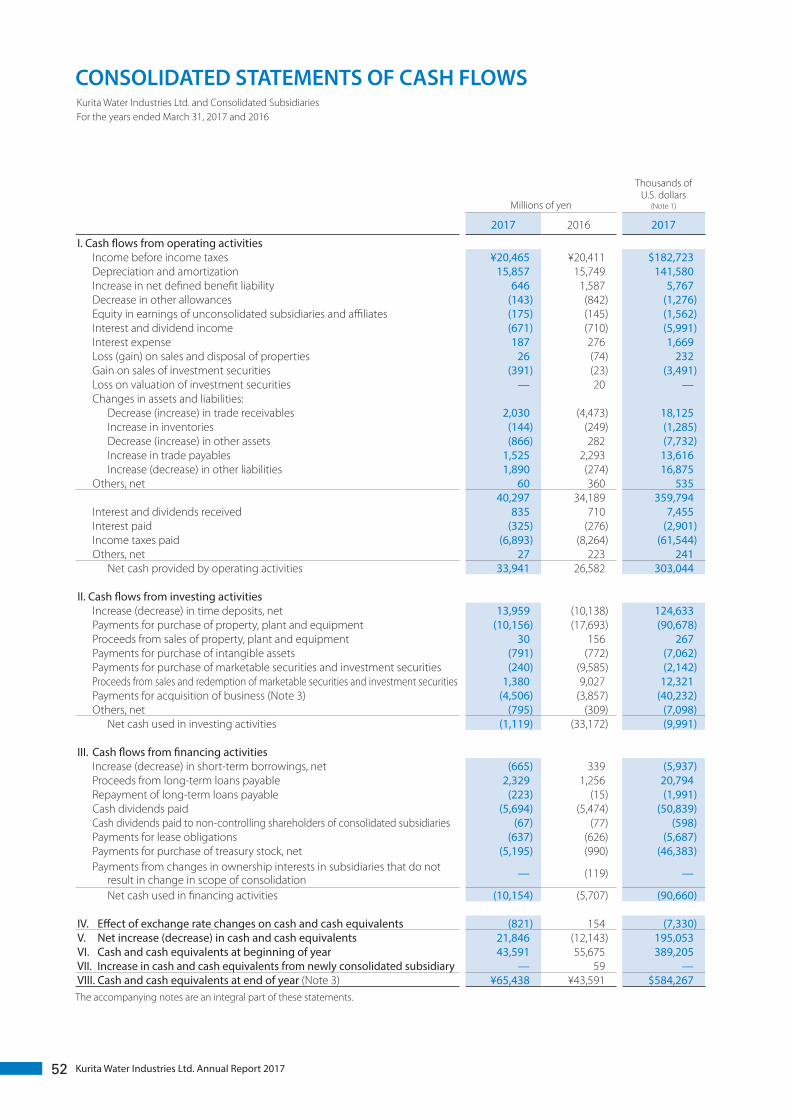
Cash FlowsCash Flows from Operating Activities
Net cash provided by operating activities during the fiscal year ended
March 31, 2017, totaled ¥33,941 million, an increase of ¥7,359 million
from the previous fiscal year. Inflows from income before income taxes
of ¥20,465 million, depreciation and amortization of ¥15,857 million
including goodwill amortization, a decrease of ¥2,030 million in trade
receivables, and an increase in trade payables of ¥1,525 million were
partially offset by an increase of ¥866 million in other assets and income
taxes paid of ¥6,893 million.
Cash Flows from Investing Activities
Net cash used in investing activities amounted to ¥1,119 million, a decline
of ¥32,053 million from the previous fiscal year. Net cash decreased mainly
because an increase in time deposits, net of ¥13,959 million was offset by
payments for purchase of property, plant and equipment totaling ¥10,156
million, including capital expenditures for the ultrapure water supply
business; and payments for acquisition of business of ¥4,506 million (after
deducting cash and cash equivalents included in acquired assets).
EquityYears ended March 31(Millions of yen)
207,871 217,691 222,330
2013 2014 2015
227,896
2016
227,623
2017

46 Kurita Water Industries Ltd. Annual Report 2017
Cash Flows from Financing Activities
Net cash used in financing activities came to ¥10,154 million, an increase
of ¥4,447 million from the previous fiscal year. The main cash outflows
were cash dividends paid of ¥5,694 million, payments for purchase
of treasury stock, net of ¥5,195 million and a decrease in short-term
borrowings, net of ¥665 million, which were partially offset by proceeds
from long-term loans payable of ¥2,329 million.
Cash and Cash Equivalents at End of Year
As of March 31, 2017, Kurita had cash and cash equivalents totaling
¥65,438 million, an increase of ¥21,846 million compared with ¥43,591
million as of March 31, 2016.
Business RisksThe following are summaries of major foreseeable risks present in
the business environments in which the Kurita Group operates.
Forward-looking statements herein are based on judgments made
by management as of March 31, 2017.
1. Economic and Market Conditions
The Group’s Water Treatment Chemicals and Water Treatment
Facilities businesses are affected by economic conditions in Japan
and countries and regions outside Japan where the Group operates.
Demand in the Water Treatment Chemicals business fluctuates
in response to factory capacity utilization rates in industries such
as steel, petroleum refining and petrochemicals, and pulp and
paper—the main areas of demand for the business. Such demand
fluctuations may affect the Group’s financial results. Demand in the
Water Treatment Facilities business fluctuates in response to trends in
capital expenditure in electronics—the main area of demand for the
business—and other industries. Such demand fluctuations may affect
the Group’s financial results.
More intense competition with rivals in the Group’s business
domains could lead to declines in prices of products and services, which
could lower the Group’s profitability.
2. Materials and Parts Procurement
The Group procures raw materials and parts from outside the Group
for the manufacture of products and fabrication of facilities. The prices
of raw materials and parts fluctuate based on changes in market
conditions, and this may affect the Group’s financial results.
3. Overseas Business Development
The Group is striving to expand its business outside Japan. In contrast
to the Japanese market, doing business in overseas markets involves a
number of inherent risks, including the risk of changes to local laws and
regulations, the risk of political and economic instability, and the risk of
foreign exchange rate fluctuations. If such risks materialized, the Group’s
financial results could be affected.
Cash Flows from Operating ActivitiesYears ended March 31(Millions of yen)
27,27629,666
23,314
2013 2014 2015
26,582
2016
33,941
2017

47Kurita Water Industries Ltd. Annual Report 2017
4. New Product Development
The Group continuously endeavors to develop new technology and
appealing new products.
The success of new technology and product development efforts
cannot be guaranteed. The Group may not be able to offer new technol-
ogies and products that meet the needs of its customers or launch new
products in a timely fashion. The Group may also fail to keep pace with rapid
technological innovation and changing customer needs. If the Group were
to fail to develop outstanding new products, this could hamper its future
growth and profitability or otherwise affect its financial results.
5. Intellectual Property
The Group recognizes the importance of intellectual property and
continually seeks to register its own intellectual property while avoiding
infringing the intellectual property rights held by third parties, both
in Japan and overseas. Given the wide scope of the Group’s business,
however, there is potential for the Group’s intellectual property rights to
be infringed and potential for the Group to infringe the rights held by
third parties. Such occurrences may affect the Group’s financial results.
6. Dependence on Information Systems
The Group’s use of information systems is increasing, as is the impor-
tance of information systems to the Group’s business. If a computer
virus or some other factor were to obstruct the functions of the Group’s
information systems, the Group’s business activities, financial results, and
financial condition could be negatively affected.
7. Large-Scale Natural Disasters
If an earthquake, typhoon, or other kind of natural disaster were to
directly or indirectly upset the Group’s business execution, the Group’s
business activities, financial results, and financial condition could be
negatively affected.

Millions of yen
Thousands of U.S. dollars
(Note 1)
Assets 2017 2016 2017
Current assets:
Cash and time deposits (Notes 3, 4 and 6) ¥ 72,750 ¥ 58,374 $ 649,553
Notes and accounts receivable, trade (Note 4) 68,282 71,016 609,660
Allowance for doubtful accounts (246) (185) (2,196)
Marketable securities (Notes 4 and 5) 603 7,566 5,383
Inventories (Note 7) 9,525 9,254 85,044
Deferred tax assets (Note 9) 1,568 1,652 14,000
Other current assets 3,447 2,866 30,776
Total current assets 155,930 150,546 1,392,232
Investments and long-term receivables:
Investment securities (Notes 4 and 5) 32,157 34,324 287,116
Investments in unconsolidated subsidiaries and affiliates (Note 4) 2,687 2,739 23,991
Deferred tax assets (Note 9) 4,275 4,232 38,169
Other investments 5,042 3,879 45,017
Allowance for doubtful accounts (189) (204) (1,687)
Total investments and long-term receivables 43,972 44,970 392,607
Property, plant and equipment, at cost (Note 15):
Land (Note 12) 13,881 13,941 123,937
Buildings and structures 62,093 61,278 554,401
Machinery and equipment 121,311 109,735 1,083,133
Construction in progress 2,852 8,586 25,464
Other facilities 13,755 13,105 122,812
Leased assets 8,352 8,315 74,571
Total 222,247 214,964 1,984,348
Accumulated depreciation (148,210) (136,575) (1,323,303)
Property, plant and equipment, net 74,036 78,388 661,035
Intangible assets:
Goodwill 15,049 15,114 134,366
Other intangible assets 10,259 9,088 91,598
Total intangible assets 25,308 24,202 225,964
Total assets ¥299,249 ¥298,107 $2,671,866
The accompanying notes are an integral part of these statements.
CONSOLIDATED BALANCE SHEETSKurita Water Industries Ltd. and Consolidated SubsidiariesAs of March 31, 2017 and 2016
48 Kurita Water Industries Ltd. Annual Report 2017

Millions of yen
Thousands of U.S. dollars
(Note 1)
Liabilities and Net Assets 2017 2016 2017
Current liabilities: Short-term borrowings and current portion of long-term debt (Note 8) ¥ 1,646 ¥ 2,300 $ 14,696 Notes and accounts payable, trade (Note 4) 23,426 22,780 209,160 Accounts payable, other 8,019 6,897 71,598 Income taxes payable 2,875 3,705 25,669 Advances received 1,934 1,496 17,267 Accrued employees’ bonuses 2,361 2,365 21,080 Provision for product warranties 801 768 7,151 Provision for loss on construction contracts 81 284 723 Other current liabilities 3,263 3,809 29,133 Total current liabilities 44,410 44,407 396,517
Long-term liabilities: Long-term debt (Note 8) 4,339 4,763 38,741 Net defined benefit liability (Note 10) 16,054 15,467 143,339 Accrued retirement benefits for directors and corporate auditors 25 57 223 Deferred tax liabilities on revaluation of land (Note 12) 1,119 1,119 9,991 Other long-term liabilities (Note 8) 4,540 3,327 40,535 Total long-term liabilities 26,080 24,735 232,857 Total liabilities 70,490 69,142 629,375
Net assets:Shareholders’ equity (Note 11): Common stock, 2017 and 2016 Authorized: 531,000,000 shares Issued: 119,164,594 shares 13,450 13,450 120,089 Capital surplus 10,993 10,993 98,151 Retained earnings 205,586 196,788 1,835,589 Treasury stock, at cost 2017—4,890,513 shares 2016—2,967,674 shares (13,891) (8,695) (124,026) Total shareholders’ equity 216,138 212,536 1,929,803Accumulated other comprehensive income: Unrealized gains on available-for-sale securities 14,792 16,061 132,071 Deferred gains or losses on hedges 670 398 5,982 Revaluation reserve for land (Note 12) (380) (380) (3,392) Foreign currency translation adjustments (3,593) (618) (32,080) Remeasurements of defined benefit plans (Note 10) (3) (101) (26) Total accumulated other comprehensive income 11,484 15,360 102,535Non-controlling interests 1,135 1,067 10,133 Total net assets 228,758 228,964 2,042,482 Total liabilities and net assets ¥299,249 ¥298,107 $2,671,866
49Kurita Water Industries Ltd. Annual Report 2017

Kurita Water Industries Ltd. and Consolidated SubsidiariesFor the years ended March 31, 2017 and 2016
CONSOLIDATED STATEMENTS OF INCOME AND
CONSOLIDATED STATEMENTS OF COMPREHENSIVE INCOME
CONSOLIDATED STATEMENTS OF INCOME
Millions of yen
Thousands of U.S. dollars
(Note 1)
2017 2016 2017Net sales (Note 18) ¥214,187 ¥214,372 $1,912,383Cost of sales (Note 13) 145,455 143,964 1,298,705 Gross profit 68,732 70,407 613,678Selling, general and administrative expenses (Note 14) 49,280 50,574 440,000 Operating income (Note 18) 19,452 19,833 173,678Other income (expenses): Interest and dividend income 671 710 5,991 Foreign exchange losses (39) (102) (348) Interest expense (187) (276) (1,669) Equity in earnings of unconsolidated subsidiaries and affiliates 175 145 1,562 Gain on sales of properties (Note 15) — 148 — Gain on sales of investment securities 391 — 3,491 Acquisition-related costs (259) (221) (2,312) Loss on liquidation of business — (176) — Other, net 260 348 2,321 Other income, net 1,013 578 9,044Income before income taxes 20,465 20,411 182,723Income taxes (Note 9): Current 5,996 7,027 53,535 Deferred (193) 626 (1,723) Total income taxes 5,803 7,654 51,812Net income 14,661 12,757 130,901Net income attributable to non-controlling interests 155 180 1,383Net income attributable to owners of parent ¥ 14,506 ¥ 12,577 $ 129,517
CONSOLIDATED STATEMENTS OF COMPREHENSIVE INCOME
Millions of yen
Thousands of U.S. dollars
(Note 1)
2017 2016 2017Net income ¥14,661 ¥12,757 $130,901Other comprehensive income (Note 16): Unrealized gains or losses on available-for-sale securities (1,263) 1,293 (11,276) Deferred gains or losses on hedges 271 332 2,419 Revaluation reserve for land — 62 — Foreign currency translation adjustments (2,897) (2,113) (25,866) Remeasurements of defined benefit plans 97 (109) 866 Share of other comprehensive income of entities accounted for using equity method (83) (86) (741) Total other comprehensive income (3,876) (621) (34,607)Comprehensive income ¥10,784 ¥12,136 $ 96,285Comprehensive income attributable to: Comprehensive income attributable to owners of parent ¥10,649 ¥11,997 $ 95,080 Comprehensive income attributable to non-controlling interests 134 138 1,196
YenU.S. dollars
(Note 1)
2017 2016 2017Per share of common stock (Note 20): Net income ¥125.23 ¥108.24 $1.12 Cash dividends applicable to the year 50.00 48.00 0.45The accompanying notes are an integral part of these statements.
50 Kurita Water Industries Ltd. Annual Report 2017

Millions of yenShareholders’ equity (Note 11) Accumulated other comprehensive income
Commonstock
Capitalsurplus
Retainedearnings
Treasurystock
Totalshareholders’
equity
Unrealizedgains on
available-for-sale securities
Deferredgains or
losses on hedges
Revaluationreserve for
land (Note 12)
Foreigncurrency
translationadjustments
Remeasure-ments ofdefined
benefit plans
Total accumu-lated other
comprehensiveincome
Non-controlling
interestsTotal net
assetsBalance as of March 31, 2015 ¥13,450 ¥10,980 ¥189,693 ¥ (7,705) ¥206,419 ¥14,768 ¥ 66 ¥(442) ¥ 1,510 ¥ 8 ¥ 15,911 ¥1,147 ¥223,478Changes during the year Cash dividends paid (5,469) (5,469) (5,469) Net income attributable to
owners of parent 12,577 12,577 12,577
Acquisition of treasury stock (990) (990) (990) Changes in equity interest
in consolidated subsidiaries 12 12 12
Other (13) (13) (13) Net changes of net assets other
than shareholders’ equity 1,293 332 62 (2,129) (109) (551) (79) (630)
Total changes during the year — 12 7,094 (990) 6,117 1,293 332 62 (2,129) (109) (551) (79) 5,486Balance as of March 31, 2016 ¥13,450 ¥10,993 ¥196,788 ¥ (8,695) ¥212,536 ¥16,061 ¥398 ¥(380) ¥ (618) ¥(101) ¥ 15,360 ¥1,067 ¥228,964Changes during the year Cash dividends paid (5,693) (5,693) (5,693) Net income attributable
to owners of parent 14,506 14,506 14,506
Acquisition of treasury stock (5,195) (5,195) (5,195) Changes in equity interest in
consolidated subsidiaries — —
Other (15) (15) (15) Net changes of net assets other
than shareholders’ equity — (1,269) 271 — (2,975) 97 (3,875) 67 (3,807)
Total changes during the year — — 8,797 (5,195) 3,602 (1,269) 271 — (2,975) 97 (3,875) 67 (205)Balance as of March 31, 2017 ¥13,450 ¥10,993 ¥205,586 ¥(13,891) ¥216,138 ¥14,792 ¥670 ¥(380) ¥(3,593) ¥ (3) ¥11,484 ¥1,135 ¥228,758
Thousands of U.S. dollars (Note 1)Shareholders’ equity (Note 11) Accumulated other comprehensive income
Commonstock
Capitalsurplus
Retainedearnings
Treasurystock
Totalshareholders’
equity
Unrealizedgains on
available-for-sale securities
Deferredgains or
losses on hedges
Revaluationreserve for
land (Note 12)
Foreigncurrency
translationadjustments
Remeasure-ments ofdefined
benefit plans
Total accumu-lated other
comprehensiveincome
Non-controlling
interestsTotal net
assetsBalance as of March 31, 2016 $120,089 $98,151 $1,757,035 $ (77,633) $1,897,642 $143,401 $3,553 $(3,392) $ (5,517) $(901) $137,142 $ 9,526 $2,044,321Changes during the year Cash dividends paid (50,830) (50,830) (50,830) Net income attributable
to owners of parent 129,517 129,517 129,517
Acquisition of treasury stock (46,383) (46,383) (46,383) Changes in equity interest in
consolidated subsidiaries — —
Other (133) (133) (133) Net changes of net assets other
than shareholders’ equity — (11,330) 2,419 — (26,562) 866 (34,598) 598 (33,991)
Total changes during the year — — 78,544 (46,383) 32,160 (11,330) 2,419 — (26,562) 866 (34,598) 598 (1,830)Balance as of March 31, 2017 $120,089 $98,151 $1,835,589 $(124,026) $1,929,803 $132,071 $5,982 $(3,392) $(32,080) $ (26) $102,535 $10,133 $2,042,482
The accompanying notes are an integral part of these statements.
CONSOLIDATED STATEMENTS OF CHANGES IN NET ASSETSKurita Water Industries Ltd. and Consolidated SubsidiariesFor the years ended March 31, 2017 and 2016
51Kurita Water Industries Ltd. Annual Report 2017
The accompanying notes are an integral part of these statements.
CONSOLIDATED STATEMENTS OF CASH FLOWSKurita Water Industries Ltd. and Consolidated SubsidiariesFor the years ended March 31, 2017 and 2016
Millions of yen
Thousands of U.S. dollars
(Note 1)
2017 2016 2017
I. Cash flows from operating activities Income before income taxes ¥20,465 ¥20,411 $182,723 Depreciation and amortization 15,857 15,749 141,580 Increase in net defined benefit liability 646 1,587 5,767 Decrease in other allowances (143) (842) (1,276) Equity in earnings of unconsolidated subsidiaries and affiliates (175) (145) (1,562) Interest and dividend income (671) (710) (5,991) Interest expense 187 276 1,669 Loss (gain) on sales and disposal of properties 26 (74) 232 Gain on sales of investment securities (391) (23) (3,491) Loss on valuation of investment securities — 20 — Changes in assets and liabilities: Decrease (increase) in trade receivables 2,030 (4,473) 18,125 Increase in inventories (144) (249) (1,285) Decrease (increase) in other assets (866) 282 (7,732) Increase in trade payables 1,525 2,293 13,616 Increase (decrease) in other liabilities 1,890 (274) 16,875 Others, net 60 360 535
40,297 34,189 359,794 Interest and dividends received 835 710 7,455 Interest paid (325) (276) (2,901) Income taxes paid (6,893) (8,264) (61,544) Others, net 27 223 241 Net cash provided by operating activities 33,941 26,582 303,044
II. Cash flows from investing activities Increase (decrease) in time deposits, net 13,959 (10,138) 124,633 Payments for purchase of property, plant and equipment (10,156) (17,693) (90,678) Proceeds from sales of property, plant and equipment 30 156 267 Payments for purchase of intangible assets (791) (772) (7,062) Payments for purchase of marketable securities and investment securities (240) (9,585) (2,142) Proceeds from sales and redemption of marketable securities and investment securities 1,380 9,027 12,321 Payments for acquisition of business (Note 3) (4,506) (3,857) (40,232) Others, net (795) (309) (7,098) Net cash used in investing activities (1,119) (33,172) (9,991)
III. Cash flows from financing activities Increase (decrease) in short-term borrowings, net (665) 339 (5,937) Proceeds from long-term loans payable 2,329 1,256 20,794 Repayment of long-term loans payable (223) (15) (1,991) Cash dividends paid (5,694) (5,474) (50,839) Cash dividends paid to non-controlling shareholders of consolidated subsidiaries (67) (77) (598) Payments for lease obligations (637) (626) (5,687) Payments for purchase of treasury stock, net (5,195) (990) (46,383) Payments from changes in ownership interests in subsidiaries that do not
result in change in scope of consolidation — (119) —
Net cash used in financing activities (10,154) (5,707) (90,660)
IV. Effect of exchange rate changes on cash and cash equivalents (821) 154 (7,330)V. Net increase (decrease) in cash and cash equivalents 21,846 (12,143) 195,053VI. Cash and cash equivalents at beginning of year 43,591 55,675 389,205VII. Increase in cash and cash equivalents from newly consolidated subsidiary — 59 —VIII. Cash and cash equivalents at end of year (Note 3) ¥65,438 ¥43,591 $584,267
52 Kurita Water Industries Ltd. Annual Report 2017
NOTES TO CONSOLIDATED FINANCIAL STATEMENTSKurita Water Industries Ltd. and Consolidated Subsidiaries
1. Basis of presentation of consolidated financial statements .......................................................................Kurita Water Industries Ltd. (the “Company”) and its domestic subsidiaries maintain their books of account and prepare their financial statements in accordance with accounting principles and practices generally accepted in Japan, while its foreign subsidiaries maintain their books of account and prepare their financial statements in conformity with those of the countries of their domicile. Certain accounting principles and practices generally accepted in Japan are different from International Financial Reporting Standards and standards in other countries in certain respects as to application and disclosure requirements. Accordingly, the accompanying consolidated financial statements are intended for use by those who are informed about Japanese accounting principles and practices. The Company’s consolidated financial statements, prepared in accordance with accounting principles and practices generally accepted in Japan, were filed with the Japanese Ministry of Finance and the Tokyo Stock Exchange as required by the Financial Instruments and Exchange Law of Japan. Certain reclassifications of accounts and modifications have been made in the accompanying consolidated financial statements to facilitate understanding by readers outside Japan. In addition, certain reclassifications have been made in the 2016 financial statements to conform to the classification used in 2017. All figures in the consolidated financial statements and notes are stated in millions of Japanese yen by discarding fractional amounts of less than ¥1 million. As a result, the totals shown in the consolidated financial statements and notes in yen do not necessarily agree with the sum of the individual amounts. The translation of yen amounts as of or for the year ended March 31, 2017 into U.S. dollars is included solely for the convenience of readers and has been made, as a matter of arithmetical computation only, at the rate of ¥112 to US$1, the prevailing rate on the Tokyo Foreign Exchange Market on March 31, 2017. The translation should not be construed as a representation that yen amounts have been, could have been or could in the future be converted into U.S. dollars at the above or any other rate.
2. Significant accounting policies .........................................................................................................................(1) ConsolidationScope of consolidationThe consolidated financial statements included the accounts of the Company and its significant subsidiaries (together, the “Group”). For the years ended March 31, 2017 and 2016, 49 and 45 subsidiaries were consolidated, respectively. Under the control concept, those companies in which the Company, directly or indirectly, is able to exercise control over operations are fully consolidated. All significant intercompany transactions and balances have been eliminated in consolidation. Names of principal consolidated subsidiaries: Kurita Europe GmbH Kurita Water Industries (Jiangyin) Co., Ltd. Hansu Technical Service Ltd. Kuritaz Co., Ltd. Kurita Engineering Co., Ltd. Kuritec Service Co. Ltd. Kurita Chemical Manufacturing Ltd. From the year ended March 31, 2017, Kurita Polska SP. z. o. o., Kuritaz Hokuriku Co., Ltd., Kurita America Holdings Inc. and Kurita-GK Vietnam Co., Ltd. were newly included in the scope of consolidation due to incorporation, and Fremont Industries, LLC was also included due to acquisition.
53Kurita Water Industries Ltd. Annual Report 2017
Kurita Europe GmbH was excluded from the scope of consolidation due to absorption by Kurita Europe APW GmbH, a consolidated subsidiary. Kurita Europe APW GmbH changed its name to Kurita Europe GmbH.
Fiscal years of consolidated subsidiariesThe fiscal years of all of the foreign consolidated subsidiaries (Kurita (Singapore) Pte. Ltd. and others) end on December 31. For these consolidated subsidiaries, the financial statements as of December 31 were used for consolidation purposes. However, material transactions that have occurred during the three-month period from January 1 to March 31 of the following year have been adjusted as necessary for consolidation.
Amortization of goodwillGoodwill is amortized using the straight-line method over a reasonable number of years, not exceeding 20 years, on a case-by-case basis, except for minor amounts that are charged to income in the period of acquisition.
(2) Equity methodScope of equity method applicationUnder the influence concept, significant investments in unconsolidated subsidiaries and affiliates over which the Company has the ability to exercise significant influence with regard to the operating and financial policies of the investees are accounted for by the equity method. For the years ended March 31, 2017 and 2016, 5 and 5 companies were accounted for by the equity method, respectively. Name of principal company applying the equity method: Matsuyama Safety Water Investments in the remaining unconsolidated subsidiaries and affiliates were stated at cost. If the equity method of accounting had been applied to the investments in these companies, the effect on the accompanying consolidated financial statements would not be material.
Fiscal years of companies accounted for by the equity methodThe companies accounted for by the equity method that have different closing dates are included in the consolidated financial statements based on their respective fiscal year-end.
(3) Cash and cash equivalentsCash and cash equivalents in the consolidated statements of cash flows are composed of cash on hand, readily available bank deposits and short-term investments with an original maturity of three months or less and subject to a minor risk of fluctuations in value.
(4) Available-for-sale securitiesAvailable-for-sale securities that have available fair values are stated at fair value at the balance sheet date, with resulting unrealized holding gains and losses reported as a separate component of net assets. Available-for-sale securities with no available fair values are stated at cost computed by the moving-average method. The cost of sold securities is computed by the moving-average method.
(5) InventoriesInventories held for sale in the ordinary course of business are stated at the lower of cost determined by the moving-average method, except for work in process determined by the specific-identification method, or net selling value.
54 Kurita Water Industries Ltd. Annual Report 2017

(6) Derivative transactionsDerivative transactions are measured at fair value in principle.
(7) Depreciation of property, plant and equipmentProperty, plant and equipment is depreciated by the declining-balance method for the Company and its domestic consolidated subsidiaries, except for buildings (other than building equipment) acquired on and after April 1, 1998, building equipment and structures acquired on and after April 1, 2016 and ultrapure water supply equipment located at clients’ sites, for which the straight-line method is applied. The straight-line method is applied by foreign consolidated subsidiaries. The estimated useful lives of these assets are as follows: Buildings and structures: 2–65 years Machinery and equipment: 4–10 years
(Change in accounting policies)Effective from the year ended March 31, 2017, due to amendments to the Japanese Corporation Tax Act, the Company and its domestic subsidiaries adopted “Practical Solution on a Change in Depreciation Method due to Tax Reform 2016” (Accounting Standards Board of Japan (“ASBJ”) Practice Issue Task Force No. 32, June 17, 2016) and changed the depreciation method for building equipment and structures acquired on and after April 1, 2016 from the declining-balance method to the straight-line method. The effect of this change on profit and loss for the year ended March 31, 2017 was immaterial.
(8) Intangible assetsIntangible assets are amortized by the straight-line method.
(9) Impairment of long-lived assetsThe Company reviews its long-lived assets for impairment in accordance with the accounting standards for impairment of fixed assets whenever events or changes in circumstances indicate the carrying amount of an asset or asset group may not be recoverable. An impairment loss would be recognized if the carrying amount of an asset or asset group exceeds the sum of the undiscounted future cash flows expected to result from the continued use and eventual disposition of the asset or asset group. The impairment loss would be measured as the amount by which the carrying amount of the asset exceeds its recoverable amount, which is the higher of the discounted cash flows from the continued use and eventual disposition of the asset or the net selling price at disposition.
(10) Accrued employees’ bonusesThe Company and its domestic consolidated subsidiaries accrue the amount of employees’ bonuses based on the anticipated bonus payments to employees.
(11) HedgesGain or loss on derivatives designated as hedging instruments is deferred until the gain or loss on the underlying hedged items is recognized. The Company uses forward foreign exchange contracts only in order to manage certain risks arising from fluctuations in foreign exchange rates and do not use derivative transactions for speculative purposes. The Company evaluates the effectiveness of its hedging activities by comparing cumulative changes in cash flows on the hedging instruments with those of the related hedged items.
Hedging instruments: Forward foreign exchange contractsHedged items: Forecasted transactions denominated in foreign currencies
55Kurita Water Industries Ltd. Annual Report 2017

(12) Accounting method for employees’ retirement benefitsThe straight-line method is used as a method of attributing expected benefits to be paid to the current period in calculating retirement benefit obligations. Actuarial differences are subject to amortization over a period of 1–2 years from the year when they are incurred.
(13) LeasesFinance leases which do not transfer ownership are capitalized to recognize leased assets and lease obligations in the consolidated balance sheets. Leased assets are depreciated using the straight-line method over the respective lease periods without residual value.
(14) Consumption taxesConsumption taxes are accounted for separately from transaction prices and are not reflected in the consolidated statements of income.
(15) Construction contractsThe percentage-of-completion method has been applied to the contracts if the outcome of the construction activity is deemed certain for the percentage of performance of the contractor’s obligation at the end of the balance sheet date, otherwise the completed-contract method is applied. The percentage of completion is determined using the cost incurred to the estimated total cost.
(16) Foreign currency translationMonetary receivables and payables denominated in foreign currency are translated using the spot exchange rate prevailing at the balance sheet date, and the differences are charged to income as foreign exchange gains or losses. Foreign subsidiaries’ assets and liabilities are translated using the spot exchange rate at their balance sheet dates, and their income and expenses are translated using the average exchange rate during the year. The translation differences are recorded in “Foreign currency translation adjustments” and “Non-controlling interests” in net assets.
(17) Appropriation of retained earningsThe accompanying consolidated statements of changes in net assets reflect the appropriations of retained earnings of the Company in the fiscal year in which the appropriations are approved at the general shareholders’ meeting.
(18) Earnings per shareEarnings per share are computed by dividing net income attributable to common shareholders of parent by the weighted-average number of common shares outstanding.
(19) Additional informationImplementation Guidance on Recoverability of Deferred Tax AssetsEffective from the year ended March 31, 2017, the Company and its domestic subsidiaries adopted “Implementation Guidance on Recoverability of Deferred Tax Assets” (ASBJ Guidance No. 26, March 28, 2016).
56 Kurita Water Industries Ltd. Annual Report 2017
Performance-linked Stock Compensation Plan for DirectorsThe shareholders’ meeting of the Company held on June 29, 2016 resolved to introduce a performance-linked stock compensation plan for directors (excluding outside directors; the same shall apply hereinafter) to increase motivation to work toward the Group’s continued medium- to long-term growth as well as to contribute to increasing the value of the Company. The plan was implemented as proposed.(1) Outline of the planThe plan is a performance-linked compensation plan whereby the Company will grant points to directors according to their position and performance and, at the time of their retirement, will distribute to them such number of shares of the Company’s stock as would be equivalent to the cumulative number of points granted to them. In introducing the plan, the Company adopted a structure of a Stock Distribution Trust for Officers (the “Trust”) that is created with money the Company contributes.
(2) The Company’s stock remaining in the TrustThe Company’s stock remaining in the Trust is presented as treasury stock in net assets on the consolidated balance sheets. The carrying value and the number of shares of the Company’s stock held by the Trust are ¥779 million ($6,955 thousand) and 339 thousand shares at March 31, 2017.
(20) ReclassificationsCertain reclassifications have been made in the 2016 consolidated financial statements to conform to the 2017 presentation. These reclassifications had no impact on previously reported results of operations.
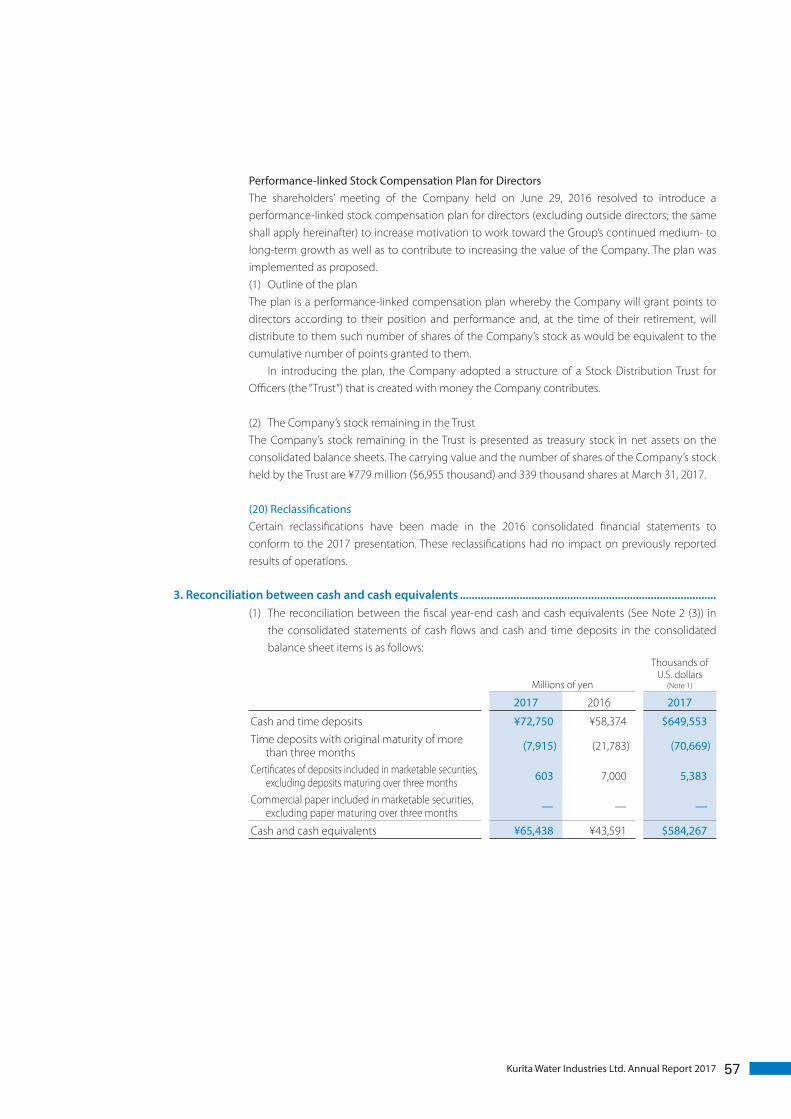
3. Reconciliation between cash and cash equivalents ......................................................................................(1) The reconciliation between the fiscal year-end cash and cash equivalents (See Note 2 (3)) in
the consolidated statements of cash flows and cash and time deposits in the consolidated balance sheet items is as follows:
Millions of yen
Thousands of U.S. dollars
(Note 1)
2017 2016 2017
Cash and time deposits ¥72,750 ¥58,374 $649,553 Time deposits with original maturity of more
than three months (7,915) (21,783) (70,669)
Certificates of deposits included in marketable securities, excluding deposits maturing over three months 603 7,000 5,383
Commercial paper included in marketable securities, excluding paper maturing over three months — — —
Cash and cash equivalents ¥65,438 ¥43,591 $584,267
57Kurita Water Industries Ltd. Annual Report 2017
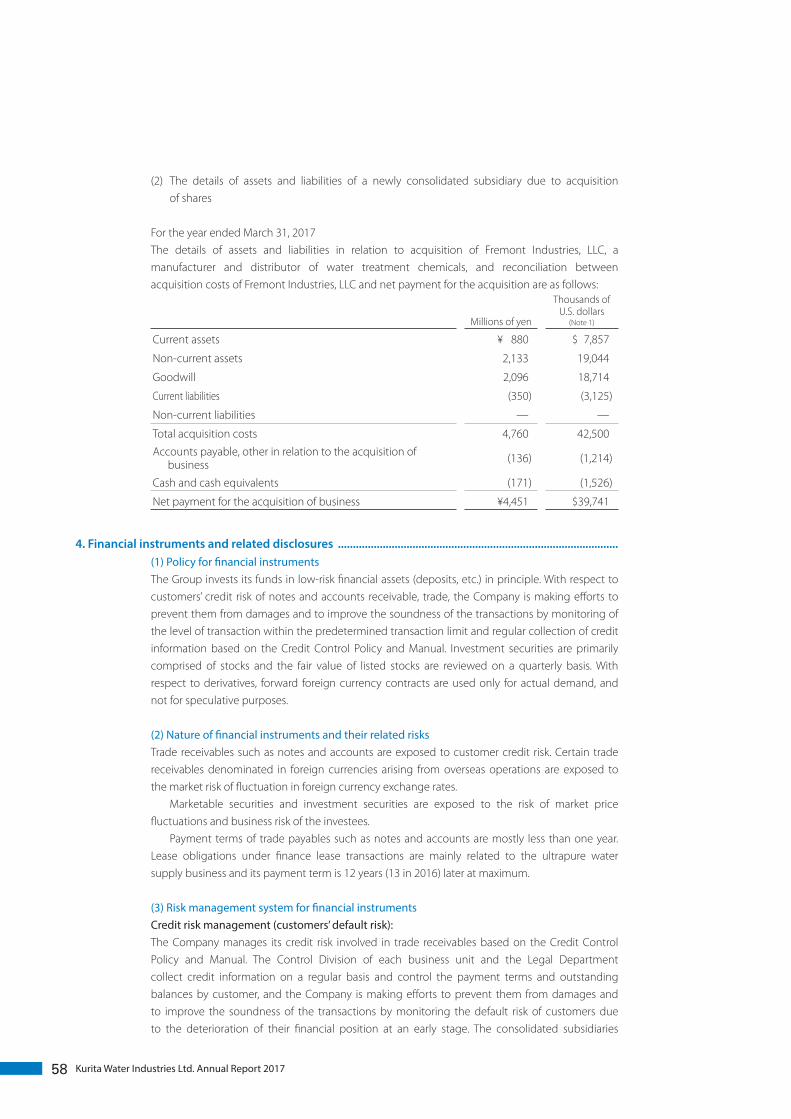
(2) The details of assets and liabilities of a newly consolidated subsidiary due to acquisition of shares
For the year ended March 31, 2017The details of assets and liabilities in relation to acquisition of Fremont Industries, LLC, a manufacturer and distributor of water treatment chemicals, and reconciliation between acquisition costs of Fremont Industries, LLC and net payment for the acquisition are as follows:
Millions of yen
Thousands of U.S. dollars
(Note 1)
Current assets ¥ 880 $ 7,857
Non-current assets 2,133 19,044
Goodwill 2,096 18,714
Current liabilities (350) (3,125)
Non-current liabilities — —
Total acquisition costs 4,760 42,500Accounts payable, other in relation to the acquisition of
business (136) (1,214)
Cash and cash equivalents (171) (1,526)
Net payment for the acquisition of business ¥4,451 $39,741
4. Financial instruments and related disclosures ..............................................................................................(1) Policy for financial instrumentsThe Group invests its funds in low-risk financial assets (deposits, etc.) in principle. With respect to customers’ credit risk of notes and accounts receivable, trade, the Company is making efforts to prevent them from damages and to improve the soundness of the transactions by monitoring of the level of transaction within the predetermined transaction limit and regular collection of credit information based on the Credit Control Policy and Manual. Investment securities are primarily comprised of stocks and the fair value of listed stocks are reviewed on a quarterly basis. With respect to derivatives, forward foreign currency contracts are used only for actual demand, and not for speculative purposes.
(2) Nature of financial instruments and their related risksTrade receivables such as notes and accounts are exposed to customer credit risk. Certain trade receivables denominated in foreign currencies arising from overseas operations are exposed to the market risk of fluctuation in foreign currency exchange rates. Marketable securities and investment securities are exposed to the risk of market price fluctuations and business risk of the investees. Payment terms of trade payables such as notes and accounts are mostly less than one year. Lease obligations under finance lease transactions are mainly related to the ultrapure water supply business and its payment term is 12 years (13 in 2016) later at maximum.
(3) Risk management system for financial instrumentsCredit risk management (customers’ default risk):The Company manages its credit risk involved in trade receivables based on the Credit Control Policy and Manual. The Control Division of each business unit and the Legal Department collect credit information on a regular basis and control the payment terms and outstanding balances by customer, and the Company is making efforts to prevent them from damages and to improve the soundness of the transactions by monitoring the default risk of customers due to the deterioration of their financial position at an early stage. The consolidated subsidiaries
58 Kurita Water Industries Ltd. Annual Report 2017
are also making efforts to reduce credit risk by controlling payment terms and outstanding balances of customers. Counterparties of forward foreign currency contracts to be used to avoid foreign exchange risk when necessary are limited to high-credit-rating financial institutions and, accordingly, we believe there is very little credit risk.
Market risk management (foreign exchange risk and interest rate risk):The Company and certain consolidated subsidiaries utilize forward foreign currency contracts to hedge the market risk of fluctuations in foreign exchange rates involved in trade receivables and payables by currency and by month. Forward foreign currency contracts are executed and controlled by the Finance & Accounting Department after the individual contract is approved in accordance with the predetermined rule. The fair value of marketable securities and investment securities and the financial position of the issuers are regularly reviewed. The Finance & Accounting Department of the Company executes and monitors each of the forward foreign currency contracts individually, followed by appropriate authorization procedures prescribed in the internal rules.
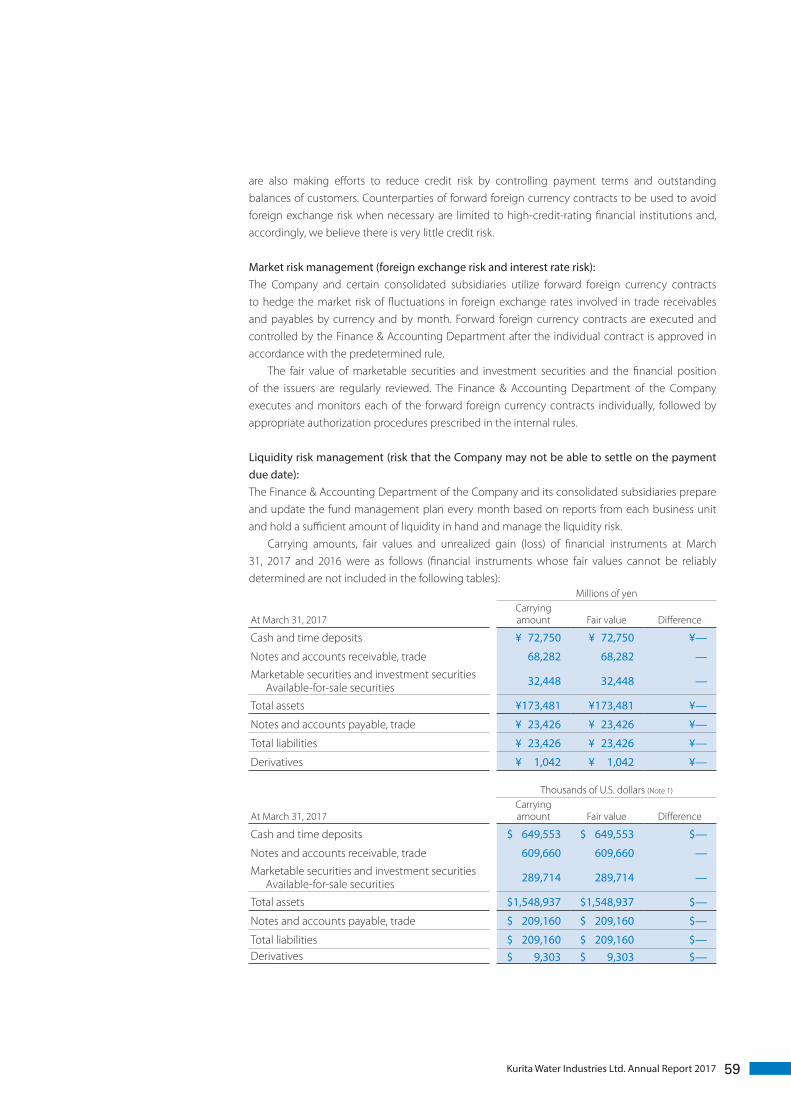
Liquidity risk management (risk that the Company may not be able to settle on the payment due date):The Finance & Accounting Department of the Company and its consolidated subsidiaries prepare and update the fund management plan every month based on reports from each business unit and hold a sufficient amount of liquidity in hand and manage the liquidity risk. Carrying amounts, fair values and unrealized gain (loss) of financial instruments at March 31, 2017 and 2016 were as follows (financial instruments whose fair values cannot be reliably determined are not included in the following tables):
Millions of yen
At March 31, 2017Carrying amount Fair value Difference
Cash and time deposits ¥ 72,750 ¥ 72,750 ¥—
Notes and accounts receivable, trade 68,282 68,282 —Marketable securities and investment securities
Available-for-sale securities 32,448 32,448 —
Total assets ¥173,481 ¥173,481 ¥—
Notes and accounts payable, trade ¥ 23,426 ¥ 23,426 ¥—
Total liabilities ¥ 23,426 ¥ 23,426 ¥—
Derivatives ¥ 1,042 ¥ 1,042 ¥—
Thousands of U.S. dollars (Note 1)
At March 31, 2017Carrying amount Fair value Difference
Cash and time deposits $ 649,553 $ 649,553 $—
Notes and accounts receivable, trade 609,660 609,660 —Marketable securities and investment securities
Available-for-sale securities 289,714 289,714 —
Total assets $1,548,937 $1,548,937 $—
Notes and accounts payable, trade $ 209,160 $ 209,160 $—
Total liabilities $ 209,160 $ 209,160 $—Derivatives $ 9,303 $ 9,303 $—
59Kurita Water Industries Ltd. Annual Report 2017

Millions of yen
At March 31, 2016Carrying amount Fair value Difference
Cash and time deposits ¥ 58,374 ¥ 58,374 ¥—
Notes and accounts receivable, trade 71,016 71,016 —
Marketable securities and investment securities Available-for-sale securities 41,800 41,800 —
Total assets ¥171,190 ¥171,190 ¥—
Notes and accounts payable, trade ¥ 22,780 ¥ 22,780 ¥—
Total liabilities ¥ 22,780 ¥ 22,780 ¥—
Derivatives ¥ 757 ¥ 757 ¥—
Notes:a. Computation method of fair values Cash and time deposits and notes and accounts receivable, trade: Fair values approximate carrying amounts because of their short maturities. Marketable securities and investment securities: Fair values approximate carrying amounts because of their short maturities since marketable securities
consist of certificates of deposits and money trusts. Fair values of investment securities are determined based on the quoted market price of the stock exchange.
Notes and accounts payable, trade: Fair values approximate carrying amounts because of short maturities. Derivatives: Details and information are discussed in Note 6.b. Financial instruments whose fair values cannot be reliably determined are as follows:
Millions of yen
Thousands of U.S. dollars
(Note 1)
2017 2016 2017
Unlisted equity securities (Unlisted shares) ¥ 321 ¥ 90 $ 2,785
Investments in capital 585 410 5,223
Shares of unconsolidated subsidiaries and affiliates 2,687 2,739 23,991
These securities are not included in “Marketable securities and investment securities” above since their fair values cannot be reliably determined.
c. Maturities of monetary receivables and securities after the balance sheet date Millions of yen
At March 31, 2017Due in one year or less
Due after one year through
five years
Due after five years through
ten yearsDue after ten
years
Deposits ¥ 72,719 ¥— ¥— ¥—
Notes and accounts receivable, trade 68,282 — — —Marketable securities and investment securities
Available-for-sale securities with maturities (Certificates of deposits)
— — — —
Marketable securities and investment securities Available-for-sale securities with maturities (Money trusts)
603 — — —
Total ¥141,605 ¥— ¥— ¥—
60 Kurita Water Industries Ltd. Annual Report 2017
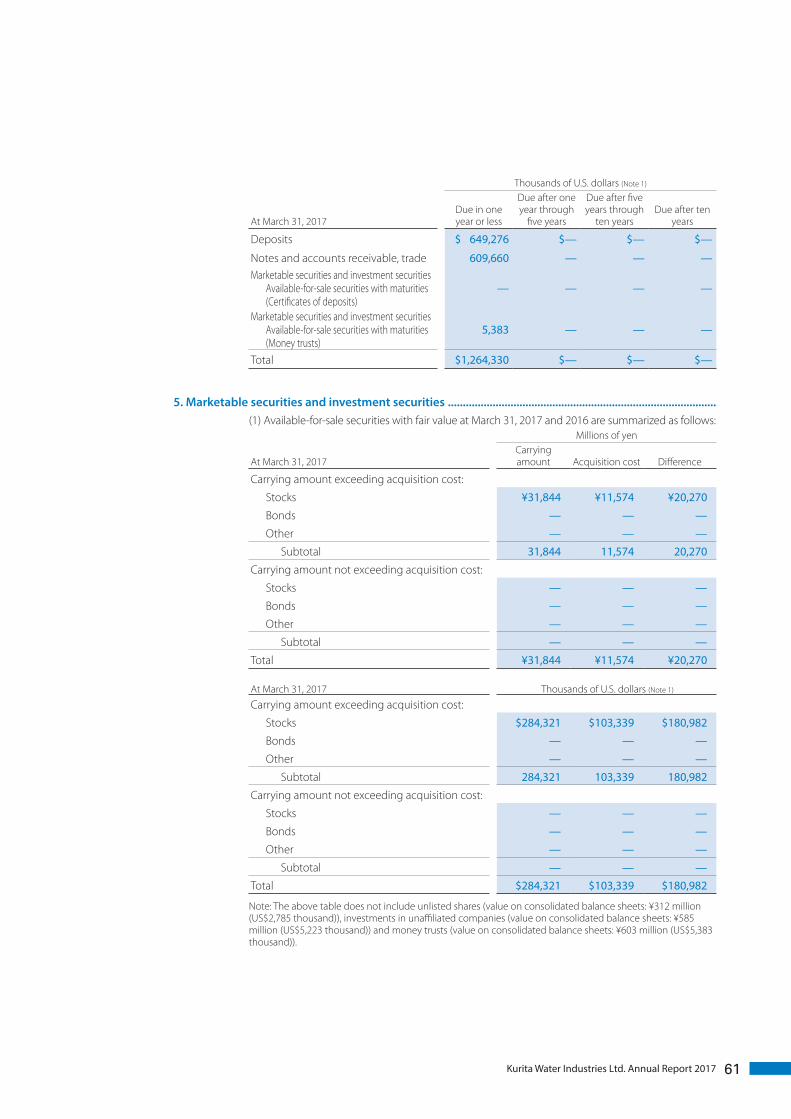
Thousands of U.S. dollars (Note 1)
At March 31, 2017Due in one year or less
Due after one year through
five years
Due after five years through
ten yearsDue after ten
years
Deposits $ 649,276 $— $— $—
Notes and accounts receivable, trade 609,660 — — —Marketable securities and investment securities
Available-for-sale securities with maturities (Certificates of deposits)
— — — —
Marketable securities and investment securities Available-for-sale securities with maturities (Money trusts)
5,383 — — —
Total $1,264,330 $— $— $—
5. Marketable securities and investment securities ..........................................................................................(1) Available-for-sale securities with fair value at March 31, 2017 and 2016 are summarized as follows:
Millions of yen
At March 31, 2017Carrying amount Acquisition cost Difference
Carrying amount exceeding acquisition cost:
Stocks ¥31,844 ¥11,574 ¥20,270
Bonds — — —
Other — — —
Subtotal 31,844 11,574 20,270
Carrying amount not exceeding acquisition cost:
Stocks — — —
Bonds — — —
Other — — —
Subtotal — — —
Total ¥31,844 ¥11,574 ¥20,270
At March 31, 2017 Thousands of U.S. dollars (Note 1)
Carrying amount exceeding acquisition cost:
Stocks $284,321 $103,339 $180,982
Bonds — — —
Other — — —
Subtotal 284,321 103,339 180,982
Carrying amount not exceeding acquisition cost:
Stocks — — —
Bonds — — —
Other — — —
Subtotal — — —
Total $284,321 $103,339 $180,982
Note: The above table does not include unlisted shares (value on consolidated balance sheets: ¥312 million (US$2,785 thousand)), investments in unaffiliated companies (value on consolidated balance sheets: ¥585 million (US$5,223 thousand)) and money trusts (value on consolidated balance sheets: ¥603 million (US$5,383 thousand)).
61Kurita Water Industries Ltd. Annual Report 2017
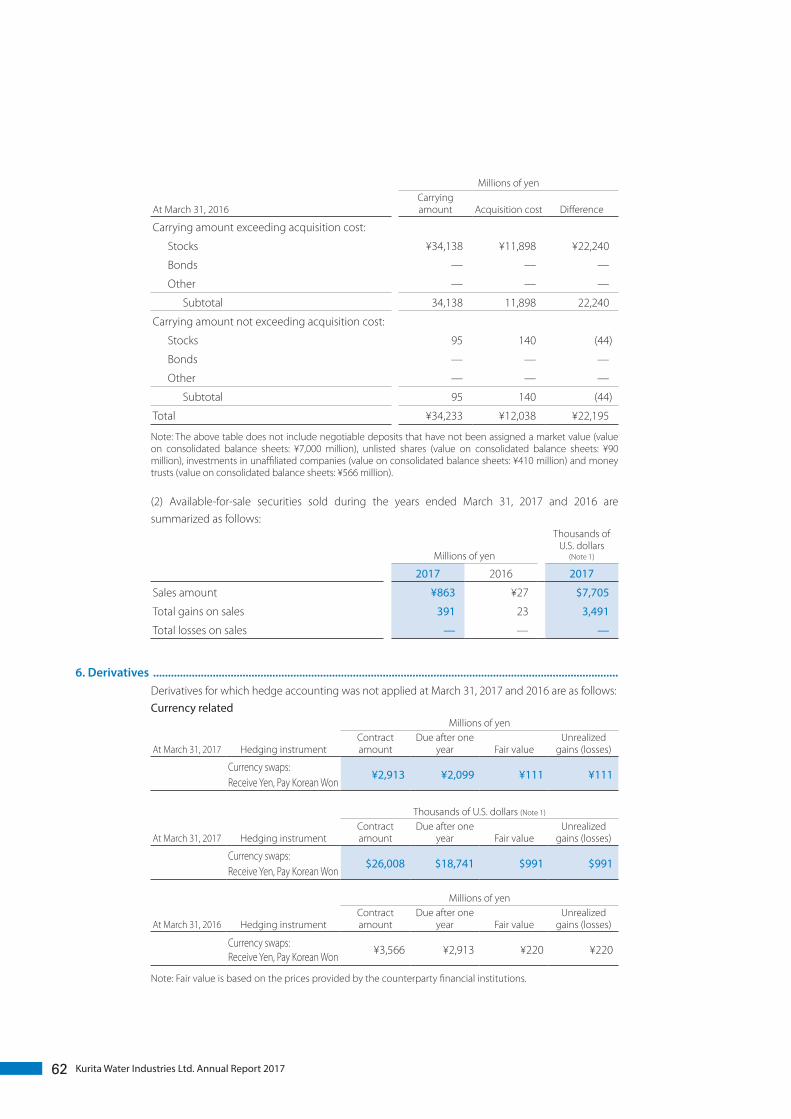
At March 31, 2016
Millions of yenCarrying amount Acquisition cost Difference
Carrying amount exceeding acquisition cost:
Stocks ¥34,138 ¥11,898 ¥22,240
Bonds — — —
Other — — —
Subtotal 34,138 11,898 22,240
Carrying amount not exceeding acquisition cost:
Stocks 95 140 (44)
Bonds — — —
Other — — —
Subtotal 95 140 (44)
Total ¥34,233 ¥12,038 ¥22,195
Note: The above table does not include negotiable deposits that have not been assigned a market value (value on consolidated balance sheets: ¥7,000 million), unlisted shares (value on consolidated balance sheets: ¥90 million), investments in unaffiliated companies (value on consolidated balance sheets: ¥410 million) and money trusts (value on consolidated balance sheets: ¥566 million).
(2) Available-for-sale securities sold during the years ended March 31, 2017 and 2016 are summarized as follows:
Millions of yen
Thousands of U.S. dollars
(Note 1)
2017 2016 2017
Sales amount ¥863 ¥27 $7,705
Total gains on sales 391 23 3,491
Total losses on sales — — —
6. Derivatives ............................................................................................................................................................Derivatives for which hedge accounting was not applied at March 31, 2017 and 2016 are as follows:Currency related
At March 31, 2017
Millions of yen
Hedging instrumentContract amount
Due after one year Fair value
Unrealized gains (losses)
Currency swaps:Receive Yen, Pay Korean Won
¥2,913 ¥2,099 ¥111 ¥111
At March 31, 2017
Thousands of U.S. dollars (Note 1)
Hedging instrumentContract amount
Due after one year Fair value
Unrealized gains (losses)
Currency swaps:Receive Yen, Pay Korean Won
$26,008 $18,741 $991 $991
At March 31, 2016
Millions of yen
Hedging instrumentContract amount
Due after one year Fair value
Unrealized gains (losses)
Currency swaps:Receive Yen, Pay Korean Won
¥3,566 ¥2,913 ¥220 ¥220
Note: Fair value is based on the prices provided by the counterparty financial institutions.
62 Kurita Water Industries Ltd. Annual Report 2017
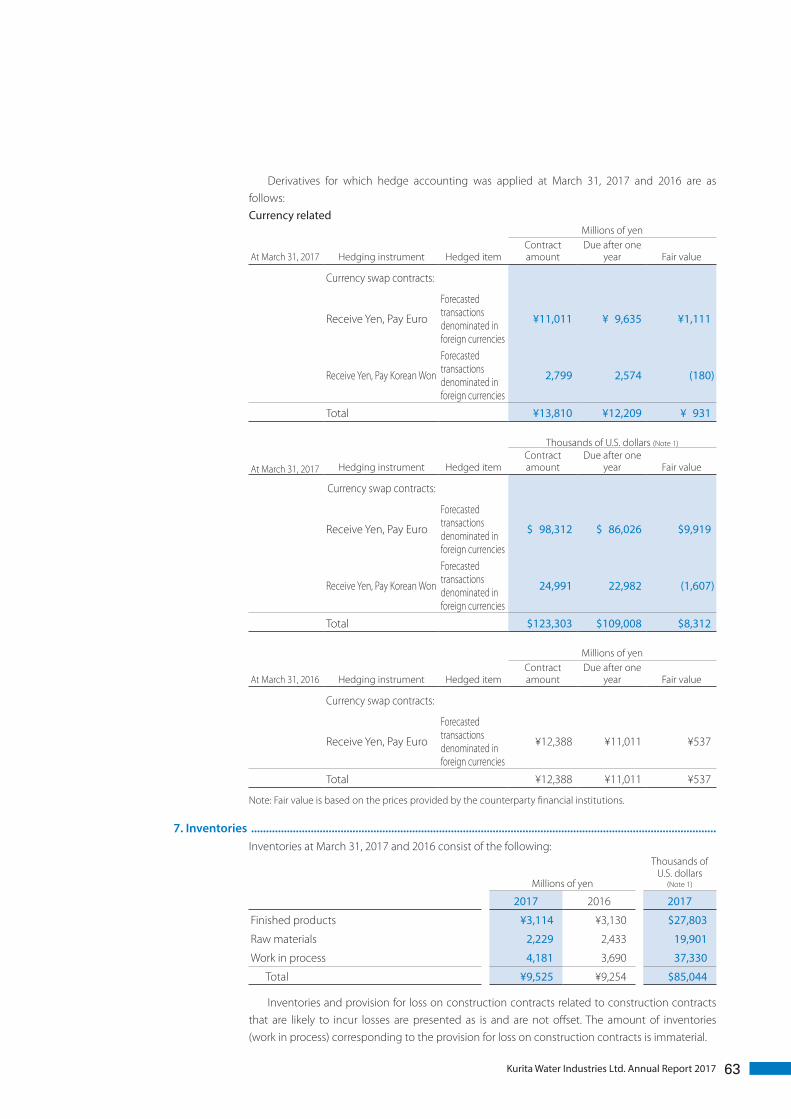
Derivatives for which hedge accounting was applied at March 31, 2017 and 2016 are as follows:Currency related
At March 31, 2017
Millions of yen
Hedging instrument Hedged itemContract amount
Due after one year Fair value
Currency swap contracts:
Receive Yen, Pay Euro
Forecasted transactions denominated in foreign currencies
¥11,011 ¥ 9,635 ¥1,111
Receive Yen, Pay Korean Won
Forecasted transactions denominated in foreign currencies
2,799 2,574 (180)
Total ¥13,810 ¥12,209 ¥ 931
At March 31, 2017
Thousands of U.S. dollars (Note 1)
Hedging instrument Hedged itemContract amount
Due after one year Fair value
Currency swap contracts:
Receive Yen, Pay Euro
Forecasted transactions denominated in foreign currencies
$ 98,312 $ 86,026 $9,919
Receive Yen, Pay Korean Won
Forecasted transactions denominated in foreign currencies
24,991 22,982 (1,607)
Total $123,303 $109,008 $8,312
At March 31, 2016
Millions of yen
Hedging instrument Hedged itemContract amount
Due after one year Fair value
Currency swap contracts:
Receive Yen, Pay Euro
Forecasted transactions denominated in foreign currencies
¥12,388 ¥11,011 ¥537
Total ¥12,388 ¥11,011 ¥537
Note: Fair value is based on the prices provided by the counterparty financial institutions.
7. Inventories ............................................................................................................................................................Inventories at March 31, 2017 and 2016 consist of the following:
Millions of yen
Thousands of U.S. dollars
(Note 1)
2017 2016 2017
Finished products ¥3,114 ¥3,130 $27,803
Raw materials 2,229 2,433 19,901
Work in process 4,181 3,690 37,330
Total ¥9,525 ¥9,254 $85,044
Inventories and provision for loss on construction contracts related to construction contracts that are likely to incur losses are presented as is and are not offset. The amount of inventories (work in process) corresponding to the provision for loss on construction contracts is immaterial.
63Kurita Water Industries Ltd. Annual Report 2017

8. Short-term borrowings and long-term debt ..................................................................................................(1) Short-term borrowings and current portion of long-term debtThe short-term borrowings and current portion of long-term debt at March 31, 2017 and 2016 consist of the following:
Millions of yen
Thousands of U.S. dollars
(Note 1)
2017 2016 2017
Short-term borrowings ¥ 650 ¥1,617 $ 5,803
Current portion of long-term borrowings 403 61 3,598
Current portion of lease obligations 592 621 5,285
Total ¥1,646 ¥2,300 $14,696
The weighted-average annual interest rate of short-term borrowings for the years ended March 31, 2017 and 2016 were 3.92% and 4.51%, respectively.
(2) Long-term debtLong-term debt at March 31, 2017 and 2016 is summarized as follows:
Millions of yen
Thousands of U.S. dollars
(Note 1)
2017 2016 2017
Long-term borrowings ¥3,279 ¥1,081 $29,276
Less current portion of long-term borrowings (403) (61) (3,598)
Long-term borrowings (Excluding current portion) ¥2,876 ¥1,019 $25,678
Lease obligations ¥4,931 ¥5,384 $44,026
Less current portion of lease obligations (592) (621) (5,285)
Lease obligations (Excluding current portion) ¥4,339 ¥4,763 $38,741
The weighted-average annual interest rate of long-term borrowings for the years ended March 31, 2017 and 2016 were 3.24% and 0.98%, respectively.
Annual maturities of long-term borrowings at March 31, 2017 are as follows:
Years ending March 31 Millions of yen
Thousands of U.S. dollars
(Note 1)
2018 ¥403 $3,598
2019 300 2,678
2020 462 4,125
2021 462 4,125
2022 428 3,821
Annual maturities of lease obligations at March 31, 2017 are as follows:
Years ending March 31 Millions of yen
Thousands of U.S. dollars
(Note 1)
2018 ¥592 $5,285
2019 542 4,839
2020 510 4,553
2021 434 3,875
2022 389 3,473
64 Kurita Water Industries Ltd. Annual Report 2017

(3) Other long-term liabilitiesOther than the short-term borrowings, long-term borrowings and lease obligations described above, ¥701 million (US$6,258 thousand) and ¥682 million of interest-bearing long-term deposits received were included in other long-term liabilities as of March 31, 2017 and 2016, respectively. The weighted-average annual interest rates for such deposits received for the years ended March 31, 2017 and 2016 were 0.36%.
9. Income taxes ........................................................................................................................................................Significant components of the deferred tax assets and liabilities as of March 31, 2017 and 2016 are as follows:
Millions of yen
Thousands of U.S. dollars
(Note 1)
2017 2016 2017Deferred tax assets: Excess depreciation of property, plant and equipment ¥ 5,914 ¥ 5,778 $ 52,803 Net defined benefit liability 4,697 4,431 41,937 Loss on revaluation of investment securities 834 1,008 7,446 Excess provision for accrued bonuses to employees 724 693 6,464 Tax loss carry-forward of consolidated subsidiaries 145 316 1,294 Accrued enterprise taxes not deductible 191 286 1,705 Impairment loss 247 233 2,205 Unrealized gains on sales of property,
plant and equipment 250 264 2,232
Excess provision of allowance for product warranty 230 211 2,053 Other 1,647 1,836 14,705 Subtotal 14,885 15,060 132,901 Valuation allowance (1,218) (1,244) (10,875) Total deferred tax assets 13,667 13,816 122,026Deferred tax liabilities:
Unrealized losses on available-for-sale securities (5,471) (6,113) (48,848) Tangible and intangible assets identified due
to business combinations (631) (1,096) (5,633)
Estimated income taxes pertaining to retained earnings of foreign consolidated subsidiaries (777) (712) (6,937)
Capital gains on properties deferred for tax purposes (538) (539) (4,803) Other (433) (166) (3,866) Total deferred tax liabilities (7,851) (8,628) (70,098) Deferred tax assets, net ¥ 5,816 ¥ 5,187 $ 51,928
65Kurita Water Industries Ltd. Annual Report 2017

A reconciliation between the normal effective statutory tax rate and the effective tax rate as a percentage of income before income taxes for the years ended March 31, 2017 and 2016 was as follows:
2017 2016
Normal effective statutory tax rate 30.9% 33.1% Non-deductible loss on valuation of marketable securities (0.2) (0.7) Expenses not deductible for income tax purposes 0.3 0.3 Withholding tax withheld from foreign subsidiaries’ dividends 0.2 0.4 R&D expense tax credit (1.5) (1.5) Reversal of deferred tax liabilities on retained earnings of
foreign consolidated subsidiaries (0.1) 0.1
Dividend income not taxable for income tax purposes (0.3) 0.1 Difference in statutory tax rates of foreign subsidiaries (0.8) (0.7) Reduction of deferred tax assets due to tax rate change — 3.5 Per capita inhabitant taxes 0.5 0.5 Other (0.6) 2.4Effective tax rate 28.4% 37.5%
10. Retirement benefits and pension plans ........................................................................................................Defined benefit plansThe Company and certain consolidated subsidiaries provide lump-sum retirement benefit plans for defined benefit plans. Also, the Company and certain consolidated subsidiaries provide defined contribution pension plans. Certain consolidated subsidiaries use the simplified method for computing retirement benefit obligations.
(1) Movement in retirement benefit obligations, except plans applying the simplified method
Millions of yen
Thousands of U.S. dollars
(Note 1)
2017 2016 2017
Balance at beginning of year ¥13,931 ¥12,364 $124,383
Service cost 798 695 7,125
Interest cost 65 132 580
Actuarial differences incurred 283 1,125 2,526
Benefits paid (501) (365) (4,473)
Other (72) (20) (642)
Balance at end of year ¥14,503 ¥13,931 $129,491
(2) Movement in net defined benefit liability for plans applying the simplified method
Millions of yen
Thousands of U.S. dollars
(Note 1)
2017 2016 2017
Balance at beginning of year ¥1,536 ¥1,385 $13,714
Net periodic benefit costs 200 214 1,785
Benefits paid (186) (161) (1,660)
Increase due to newly consolidated subsidiaries — 98 —
Balance at end of year ¥1,550 ¥1,536 $13,839
66 Kurita Water Industries Ltd. Annual Report 2017

(3) Reconciliation between retirement benefit obligations and net defined benefit liability
Millions of yen
Thousands of U.S. dollars
(Note 1)
2017 2016 2017
Retirement benefit obligations ¥16,054 ¥15,467 $143,339
Net liability on the consolidated balance sheet ¥16,054 ¥15,467 $143,339
Net defined benefit liability ¥16,054 ¥15,467 $143,339
Net liability on the consolidated balance sheet ¥16,054 ¥15,467 $143,339
(4) Net periodic benefit costs
Millions of yen
Thousands of U.S. dollars
(Note 1)
2017 2016 2017
Service cost ¥ 798 ¥ 695 $ 7,125
Interest cost 65 132 580
Amortization of actuarial differences 424 966 3,785
Net periodic benefit costs computed by simplified method 200 214 1,785
Other 18 17 160
Net periodic benefit costs ¥1,507 ¥2,026 $13,455
(5) Remeasurements of defined benefit plans, before income tax effect in other comprehensive income
Millions of yen
Thousands of U.S. dollars
(Note 1)
2017 2016 2017
Actuarial differences ¥140 ¥(158) $1,250
Total ¥140 ¥(158) $1,250
(6) Remeasurements of defined benefit plans, before income tax effect in accumulated other comprehensive income
Millions of yen
Thousands of U.S. dollars
(Note 1)
2017 2016 2017
Unrecognized actuarial differences ¥(5) ¥(146) $(44)
Total ¥(5) ¥(146) $(44)
(7) Assumptions for actuarial calculationThe Company uses multiple weighted-average discount rates determined by reflecting the estimated periods of retirement benefit payments.
Defined contribution pension plansThe amount to be contributed to the defined contribution pension plans by the Company and its consolidated subsidiaries was ¥851 million (US$7,598 thousand) and ¥852 million for the years ended March 31, 2017 and 2016, respectively.
67Kurita Water Industries Ltd. Annual Report 2017

11. Shareholders’ equity .........................................................................................................................................Japanese companies are subject to the Companies Act. A summary of the sections of the Companies Act that affect financial statements and accounting matters is as follows:
(1) Distribution of dividends to shareholdersUnder the Companies Act, if companies meet certain criteria, dividends can be paid at any time during the fiscal year in addition to the year-end dividend upon resolution at the shareholders’ meeting. Semiannual interim dividends may also be paid once a year upon resolution by the Board of Directors’ meeting if the articles of incorporation of the company so stipulate. The Companies Act provides certain limitations on the amounts available for dividends and/or the purchase of treasury stock. The limitation is defined as the amount available for distribution to the shareholders, and it is calculated mainly based on capital surplus other than paid-in capital, retained earnings and treasury stock, but the amount of net assets after dividends must be maintained at no less than ¥3 million.
(2) Increases/decreases; transfer of common stock, reserve and surplusThe Companies Act requires that an amount equal to 10% of dividends must be appropriated as a legal reserve (a component of retained earnings) or as additional paid-in capital (a component of capital surplus) depending on the equity account charged upon the payment of such dividends. However, such appropriation may not be made if the aggregate amount of legal reserve and additional paid-in capital exceeds 25% of the common stock. Under the Companies Act, this legal reserve and additional paid-in capital may be reversed without limitation. The Companies Act also provides that common stock, legal reserve, additional paid-in capital, other capital surplus and retained earnings can be transferred among the accounts under certain conditions upon resolution of the shareholders.
(3) Treasury stockThe Companies Act provides that companies may purchase, hold or dispose of such treasury stock by resolution of the Board of Directors’ meeting. The amount of treasury stock purchased cannot exceed the amount available for distribution to the shareholders which is determined by a specific formula. The number of treasury stock at March 31, 2017 includes treasury stock of 339 thousand shares (entrusted for the performance-linked stock compensation for directors) held by the trust account of Japan Trustee Services Bank, Ltd.
12. Revaluation reserve for land ...........................................................................................................................The Company implemented a revaluation of land for business use in accordance with the Land Revaluation Law (enacted on March 31, 1998). The revaluation difference, net of taxes is stated as “Revaluation reserve for land” in accumulated other comprehensive income in net assets. The tax equivalent is stated as deferred tax assets or liabilities in long-term liabilities. When any revaluated land is sold, the related unrealized gain or loss on revaluation of land is transferred to retained earnings. Revaluation method: The revaluation of land was computed in accordance with Article Two, Item One of the Land Revaluation Law Enforcement Order. Revaluation date: March 31, 2002
68 Kurita Water Industries Ltd. Annual Report 2017
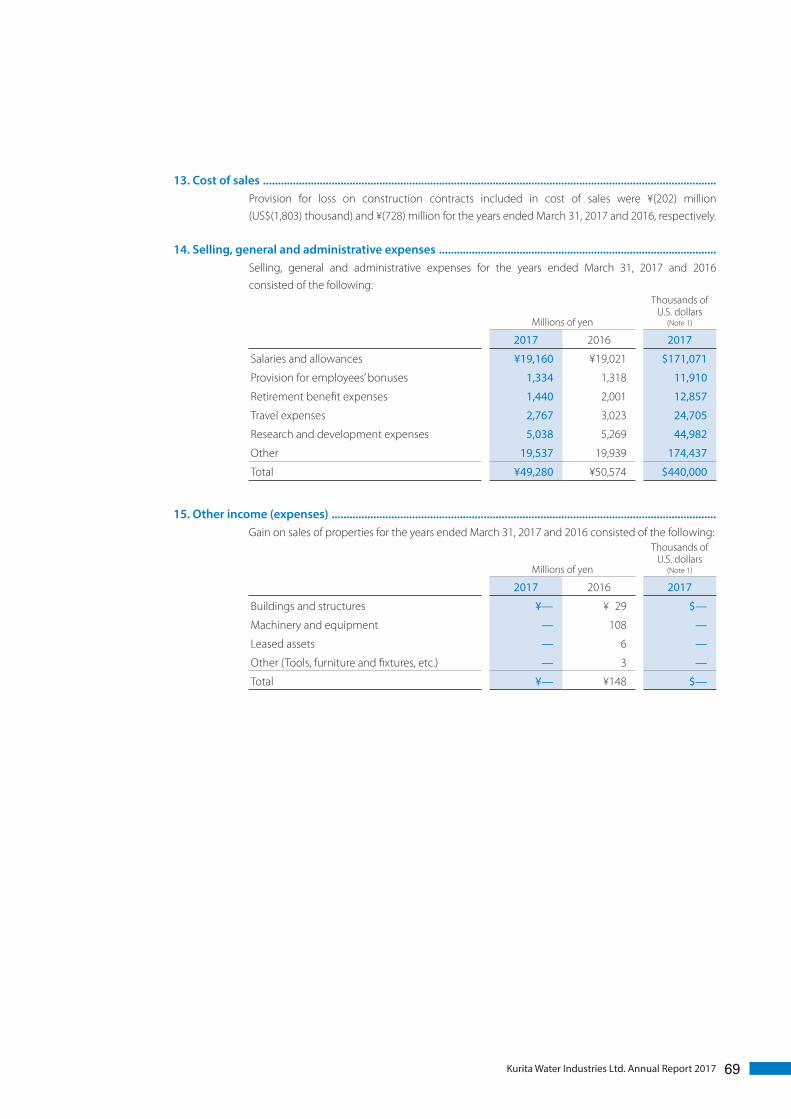
13. Cost of sales ........................................................................................................................................................Provision for loss on construction contracts included in cost of sales were ¥(202) million (US$(1,803) thousand) and ¥(728) million for the years ended March 31, 2017 and 2016, respectively.
14. Selling, general and administrative expenses .............................................................................................Selling, general and administrative expenses for the years ended March 31, 2017 and 2016 consisted of the following:
Millions of yen
Thousands of U.S. dollars
(Note 1)
2017 2016 2017
Salaries and allowances ¥19,160 ¥19,021 $171,071
Provision for employees’ bonuses 1,334 1,318 11,910
Retirement benefit expenses 1,440 2,001 12,857
Travel expenses 2,767 3,023 24,705
Research and development expenses 5,038 5,269 44,982
Other 19,537 19,939 174,437
Total ¥49,280 ¥50,574 $440,000
15. Other income (expenses) .................................................................................................................................Gain on sales of properties for the years ended March 31, 2017 and 2016 consisted of the following:
Millions of yen
Thousands of U.S. dollars
(Note 1)
2017 2016 2017
Buildings and structures ¥— ¥ 29 $—
Machinery and equipment — 108 —
Leased assets — 6 —
Other (Tools, furniture and fixtures, etc.) — 3 —
Total ¥— ¥148 $—
69Kurita Water Industries Ltd. Annual Report 2017

16. Comprehensive income ...................................................................................................................................The components of other comprehensive income for the years ended March 31, 2017 and 2016 are as follows:
Millions of yen
Thousands of U.S. dollars
(Note 1)
2017 2016 2017Unrealized gains or losses on available-for-sale
securities: Amount arising during the year ¥(1,512) ¥1,852 $(13,500)
Reclassification adjustments to profit or loss (391) 38 (3,491)
Amount before income tax effect (1,903) 1,891 (16,991)
Income tax effect 639 (597) 5,705
Subtotal (1,263) 1,293 (11,276)
Deferred gains or losses on hedges:
Amount arising during the year 390 465 3,482
Reclassification adjustments to profit or loss — — —
Amount before income tax effect 390 465 3,482
Income tax effect (119) (132) (1,062)
Subtotal 271 332 2,419
Revaluation reserve for land:
Income tax effect — 62 —
Foreign currency translation adjustments:
Amount arising during the year (2,897) (2,113) (25,866)
Remeasurments of defined benefit plans:
Amount arising during the year (5) (146) (44)
Reclassification adjustments to profit or loss 146 (12) 1,303
Amount before income tax effect 140 (158) 1,250
Income tax effect (42) 48 (375)
Subtotal 97 (109) 866
Share of other comprehensive income of entities for accounted using equity method: Amount arising during the year (83) (86) (741)
Reclassification adjustments to profit or loss 0 0 0
Subtotal (83) (86) (741)
Total ¥(3,876) ¥ (621) $(34,607)
70 Kurita Water Industries Ltd. Annual Report 2017

17. Business combinations ....................................................................................................................................Business combination through acquisition1. Overview of business combination(1) Name and description of the business of the acquired companies Name: Fremont Industries, LLC (“Fremont”) Description of the business: Business related to the manufacturing and sales of
water treatment chemicals(2) Main reasons for the business combination Fremont is a water treatment chemicals manufacturing and sales company that provides
various types of water treatment chemicals in a broad range of areas including hospitals and office building air-conditioning, mainly in markets with growth potential such as biofuels and the food industry. Fremont has built local area-centric operating bases and systems in the Midwest Region of the U.S.A. Kurita expects to expand sales of products and technologies of the Kurita Group and to develop new markets by taking advantage of the customer base and sales network of Fremont.
(3) Date of the business combination January 3, 2017
(4) Legal form of the business combination Acquisition of business with cash as consideration
(5) Company name after the business combination Fremont Industries, LLC
(6) Ratio of voting rights acquired 100%
(7) Main grounds to determine the acquirer The Group acquired the business with cash as consideration
2. The period of business results of the acquired companies included in the consolidated financial statements
Only the balance sheet as of January 4, 2017 was considered for the year ended March 31, 2017.
3. Acquisition cost of the business acquired
Millions of yen
Thousands of U.S. dollars
(Note 1)
Consideration for acquisition Cash ¥4,760 $42,500
Acquisition cost ¥4,760 $42,500
4. Major acquisition-related cost
Millions of yen
Thousands of U.S. dollars
(Note 1)
Advisory fees, etc. ¥123 $1,098
71Kurita Water Industries Ltd. Annual Report 2017

5. Amount, cause, amortization method and amortization period of goodwill recognized(1) Amount ¥2,096 million (US$18,714 thousand)
(2) Cause Due to an excess earnings capability expected in the future
(3) Amortization method and amortization period Straight-line method over 15 years
6. Major components of assets acquired and liabilities assumed on the business combination date
Millions of yen
Thousands of U.S. dollars
(Note 1)
Current assets ¥ 880 $ 7,857
Non-current assets 2,133 19,044
Total assets ¥3,013 $26,901
Current liabilities ¥ 350 $ 3,125
Non-current liabilities — —
Total liabilities ¥ 350 $ 3,125
7. Estimated amount and method of calculation of the impact of the acquisition of business on the consolidated statement of income for the year ended March 31, 2017 on the assumption that the acquisition of business had been completed on April 1, 2016
Not stated as it is difficult to calculate the estimated amount.
18. Segment information .......................................................................................................................................(1) Overview of reportable segmentsThe Company’s reportable segments are components of the Group about which separate financial information is available. These segments are subject to periodic examinations to enable the Company’s Board of Directors to decide how to allocate resources and assess performance. The Company’s business divisions are based on product and service categories. Each of the divisions conducts business based on comprehensive strategies formulated for the products and services that they handle in Japan and overseas. The Company’s consolidated subsidiaries conduct business under the supervision of the relevant business divisions. The Group’s operations are therefore classified into two reportable segments, the Water Treatment Chemicals segment and the Water Treatment Facilities segment, based on the products and services handled by each of the divisions. The Water Treatment Chemicals segment manufactures and sells water treatment chemicals and equipment and provides maintenance services. The Water Treatment Facilities segment manufactures and sells water treatment equipment and facilities, provides ultrapure water, chemical cleaning, tool cleaning, soil and groundwater remediation services, and provides maintenance services that encompass operation, maintenance and management of water treatment facilities.
72 Kurita Water Industries Ltd. Annual Report 2017

(2) Methods for calculating sales, income and loss, assets and liabilities, and other amounts by reportable segment
Accounting methods applied in the reportable segments are consistent with the methods applied in preparation of the accompanied consolidated financial statements. Segment income represents operating income. Intersegment sales and transfers between the Group reflect values based on market price. Intersegment sales and transfers between the Company’s divisions are based primarily on book values.
(3) Sales, income and loss, assets and liabilities, and other amounts by reportable segmentMillions of yen
Year ended March 31, 2017
Water Treatment Chemicals
Water Treatment Facilities Total Adjustments Consolidated
Sales1) Sales to outside customers ¥81,883 ¥132,304 ¥214,187 ¥ — ¥214,1872) Intersegment sales 242 191 434 (434) — Total ¥82,126 ¥132,495 ¥214,621 ¥ (434) ¥214,187Segment income ¥ 7,231 ¥ 12,220 ¥ 19,451 ¥ 0 ¥ 19,452Segment assets 80,120 134,623 214,744 84,504 299,249Segment liabilities 24,759 45,786 70,545 (54) 70,490Other items Depreciation and
amortization 2,926 11,950 14,877 — 14,877
Impairment loss — — — — — Increase in property,
plant and equipment and intangible assets
2,175 7,911 10,087 — 10,087
Thousands of U.S. dollars (Note 1)
Year ended March 31, 2017
Water Treatment Chemicals
Water Treatment Facilities Total Adjustments Consolidated
Sales1) Sales to outside customers $731,098 $1,181,285 $1,912,383 $ — $1,912,3832) Intersegment sales 2,160 1,705 3,875 (3,875) — Total $733,267 $1,182,991 $1,916,258 $ (3,875) $1,912,383Segment income $ 64,562 $ 109,107 $ 173,669 $ 0 $ 173,678Segment assets 715,357 1,201,991 1,917,357 754,500 2,671,866Segment liabilities 221,062 408,803 629,866 (482) 629,375Other items Depreciation and
amortization 26,125 106,696 132,830 — 132,830
Impairment loss — — — — — Increase in property,
plant and equipment and intangible assets
19,419 70,633 90,062 — 90,062
73Kurita Water Industries Ltd. Annual Report 2017
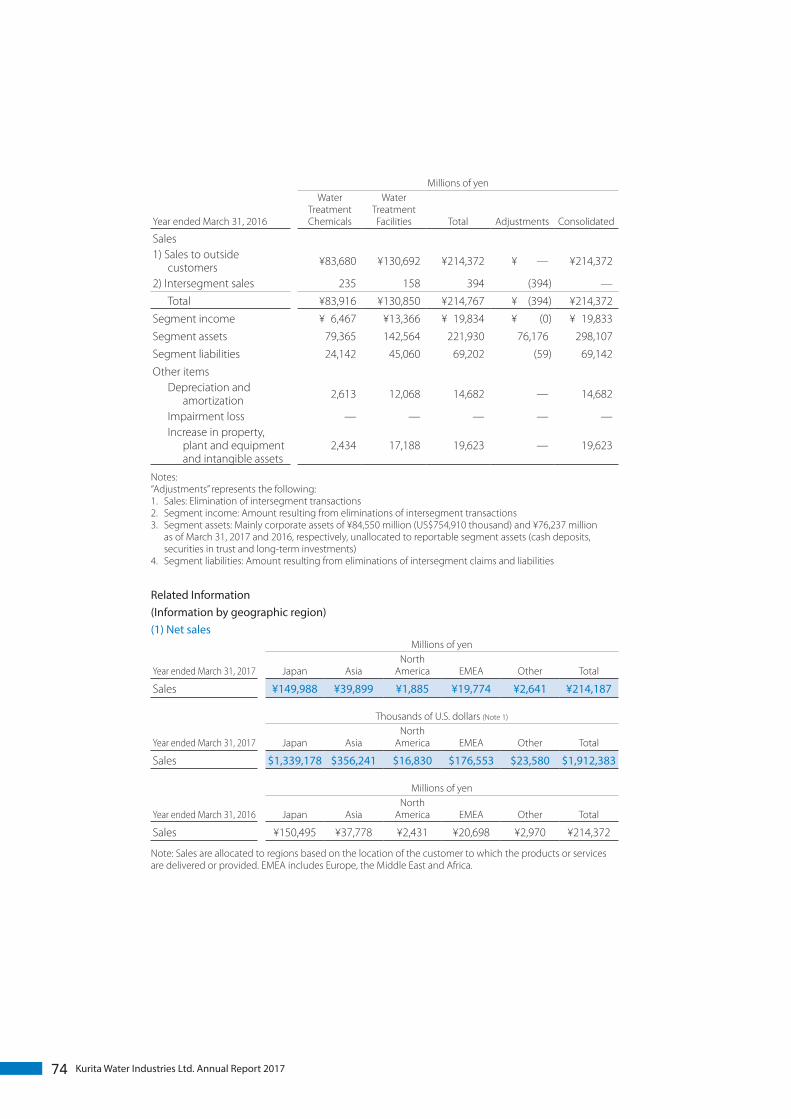
Millions of yen
Year ended March 31, 2016
Water Treatment Chemicals
Water Treatment Facilities Total Adjustments Consolidated
Sales1) Sales to outside
customers ¥83,680 ¥130,692 ¥214,372 ¥ — ¥214,372
2) Intersegment sales 235 158 394 (394) — Total ¥83,916 ¥130,850 ¥214,767 ¥ (394) ¥214,372Segment income ¥ 6,467 ¥13,366 ¥ 19,834 ¥ (0) ¥ 19,833Segment assets 79,365 142,564 221,930 76,176 298,107Segment liabilities 24,142 45,060 69,202 (59) 69,142Other items Depreciation and
amortization 2,613 12,068 14,682 — 14,682
Impairment loss — — — — — Increase in property,
plant and equipment and intangible assets
2,434 17,188 19,623 — 19,623
Notes:“Adjustments” represents the following:1. Sales: Elimination of intersegment transactions2. Segment income: Amount resulting from eliminations of intersegment transactions3. Segment assets: Mainly corporate assets of ¥84,550 million (US$754,910 thousand) and ¥76,237 million
as of March 31, 2017 and 2016, respectively, unallocated to reportable segment assets (cash deposits, securities in trust and long-term investments)
4. Segment liabilities: Amount resulting from eliminations of intersegment claims and liabilities
Related Information(Information by geographic region)(1) Net sales
Millions of yen
Year ended March 31, 2017 Japan AsiaNorth
America EMEA Other Total
Sales ¥149,988 ¥39,899 ¥1,885 ¥19,774 ¥2,641 ¥214,187
Thousands of U.S. dollars (Note 1)
Year ended March 31, 2017 Japan AsiaNorth
America EMEA Other Total
Sales $1,339,178 $356,241 $16,830 $176,553 $23,580 $1,912,383
Millions of yen
Year ended March 31, 2016 Japan AsiaNorth
America EMEA Other Total
Sales ¥150,495 ¥37,778 ¥2,431 ¥20,698 ¥2,970 ¥214,372
Note: Sales are allocated to regions based on the location of the customer to which the products or services are delivered or provided. EMEA includes Europe, the Middle East and Africa.
74 Kurita Water Industries Ltd. Annual Report 2017

(2) Property, plant and equipmentMillions of yen
Year ended March 31, 2017 Japan AsiaNorth
America EMEA Other Total
Sales ¥62,387 ¥8,881 ¥147 ¥1,939 ¥682 ¥74,036
Thousands of U.S. dollars (Note 1)
Year ended March 31, 2017 Japan AsiaNorth
America EMEA Other Total
Sales $557,026 $79,294 $1,312 $17,312 $6,089 $661,035
Millions of yen
Year ended March 31, 2016 Japan AsiaNorth
America EMEA Other Total
Sales ¥68,993 ¥6,790 ¥21 ¥2,038 ¥544 ¥78,388
(Information by major customer)
Year ended March 31, 2016 Millions of yen Reportable segment
Sales to:
Sharp Corporation ¥23,097 Water Treatment Facilities
For the year ended March 31, 2017, information by major customer is omitted because there are no outside customers individually accounting for 10% or more of net sales reported on the consolidated statement of income.
Information about amortization and unamortized balance of goodwillMillions of yen
Year ended March 31, 2017
Water Treatment Chemicals
Water Treatment Facilities Total
Corporate/Elimination Total
Amortization ¥ 980 ¥— ¥ 980 ¥— ¥ 980
Unamortized balance 15,049 — 15,049 — 15,049
Thousands of U.S. dollars (Note 1)
Year ended March 31, 2017
Water Treatment Chemicals
Water Treatment Facilities Total
Corporate/ Elimination Total
Amortization $ 8,750 $— $ 8,750 $— $ 8,750
Unamortized balance 134,366 — 134,366 — 134,366
Millions of yen
Year ended March 31, 2016
Water Treatment Chemicals
Water Treatment Facilities Total
Corporate/ Elimination Total
Amortization ¥ 1,066 ¥— ¥ 1,066 ¥— ¥ 1,066
Unamortized balance 15,114 — 15,114 — 15,114
75Kurita Water Industries Ltd. Annual Report 2017

19. Subsequent events ...........................................................................................................................................Appropriation of retained earningsThe following appropriation of retained earnings for the year ended March 31, 2017 was approved at the ordinary general meeting of shareholders of the Company held on June 29, 2017.
Millions of yen
Thousands of U.S. dollars
(Note 1)
Cash dividends (year-end dividends) ¥2,865 $25,580
Note: The total amount of dividend approved at the ordinary general meeting of shareholders of the Company held on June 29, 2017 includes dividends of ¥8 million ($71 thousand) to treasury stock of 339 thousand shares (for performance-linked stock compensation trust for directors) held by the trust account of Japan Trustee Services Bank, Ltd.
Cancellation of treasury stockThe Company acquired 2,963,900 shares of treasury stock by resolution of the Board of Directors’ meeting held on January 30, 2015. The resolution also determined that disposal of treasury stock would not be decided for the time being in preparation for using as consideration of future M&A and the final decision would be made by March 31, 2017. The Board of Directors’ meeting held on March 30, 2017 resolved that the Company will cancel the treasury stock.
1. Type of shares to be cancelled Common stock of the Company
2. Book value ¥8,525 million (US$76,116 thousand)
3. Number of shares to be cancelled 2,963,900 shares
4. Date of cancellation April 6, 2017
76 Kurita Water Industries Ltd. Annual Report 2017
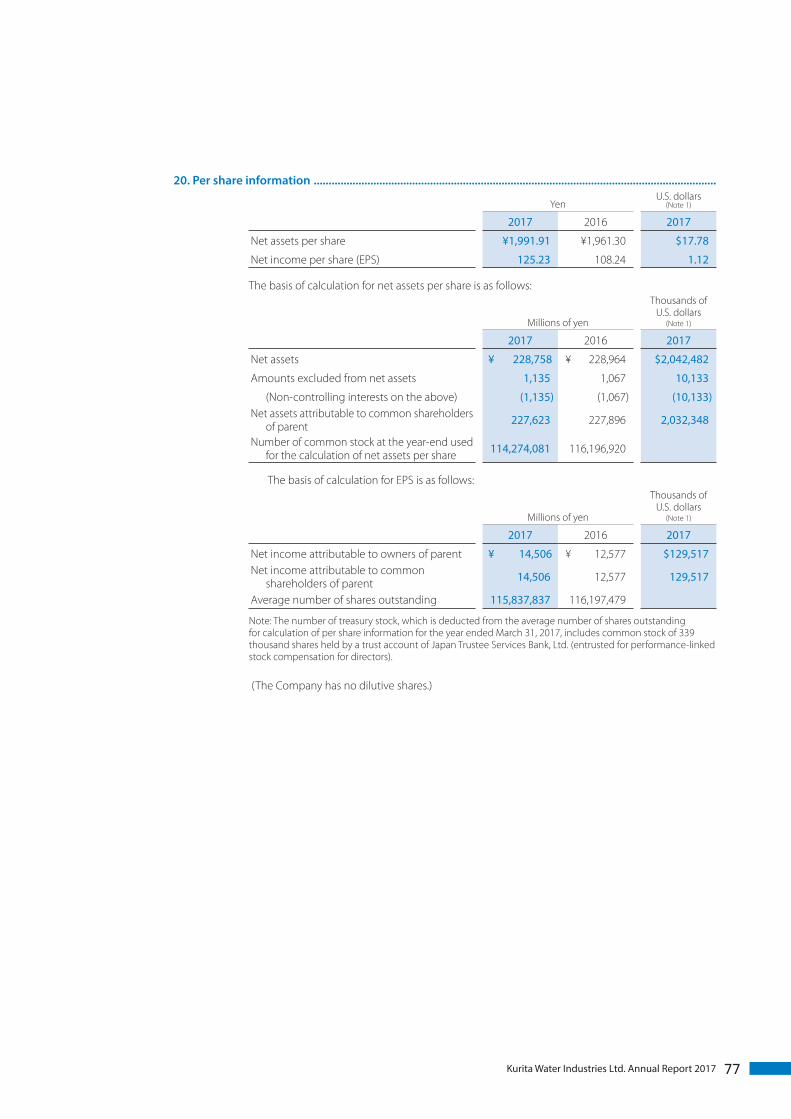
20. Per share information .......................................................................................................................................
YenU.S. dollars
(Note 1)
2017 2016 2017
Net assets per share ¥1,991.91 ¥1,961.30 $17.78
Net income per share (EPS) 125.23 108.24 1.12
The basis of calculation for net assets per share is as follows:
Millions of yen
Thousands of U.S. dollars
(Note 1)
2017 2016 2017
Net assets ¥ 228,758 ¥ 228,964 $2,042,482
Amounts excluded from net assets 1,135 1,067 10,133
(Non-controlling interests on the above) (1,135) (1,067) (10,133)Net assets attributable to common shareholders
of parent 227,623 227,896 2,032,348
Number of common stock at the year-end used for the calculation of net assets per share 114,274,081 116,196,920
The basis of calculation for EPS is as follows:
Millions of yen
Thousands of U.S. dollars
(Note 1)
2017 2016 2017
Net income attributable to owners of parent ¥ 14,506 ¥ 12,577 $129,517Net income attributable to common
shareholders of parent 14,506 12,577 129,517
Average number of shares outstanding 115,837,837 116,197,479
Note: The number of treasury stock, which is deducted from the average number of shares outstanding for calculation of per share information for the year ended March 31, 2017, includes common stock of 339 thousand shares held by a trust account of Japan Trustee Services Bank, Ltd. (entrusted for performance-linked stock compensation for directors).
(The Company has no dilutive shares.)
77Kurita Water Industries Ltd. Annual Report 2017

78 Kurita Water Industries Ltd. Annual Report 2017
Report of Independent Certified Public Accountants