Embed Size (px)
Citation preview


China Financial Stability R
eport 2018
Financial Stability Analysis Group of PBC
Chairs: FAN Yifei ZHU Hexin
Members: JI Zhihong LU Shuchun
RUAN Jianhong SHAO Fujun
SUN Guofeng WEN Xinxiang
XU Zhong ZHOU Xuedong
ZHU Jun
Steering Group
FAN Yifei ZHU Hexin
WANG Zhaoxing CHEN Wenhui
LI Chao LIU Wei
China Financial Stability R
eport 2018
Contributors to This Report
Chief Editors: ZHOU Xuedong KUANG Xiaohong
HUANG Xiaolong TAO Ling YANG Liu
Editors: YANG Liu ZHANG Tiantian
Authors:
Chapter I: SUN Yinhao LIU Tong WANG Yifei
MA Zhiyang WANG Lei LIU Ke
Special Topic 1: SUN Yinhao JIANG Ningxin
Special Topic 2: GUO Minhui
Special Topic 3: JI Baolin LI Hongjin
Special Topic 4: MIAO Mengmeng LI Zhichang CHEN Yong
Special Topic 5: LIU Tong JI Baolin GU Shiping
Chapter II: LOU Dan CHEN Min MO Yiyi
Special Topic 6: ZHOU Yuan
Special Topic 7: GUO Minhui
Special Topic 8: LI Minbo MO Yiyi
Special Topic 9: XU Yue MO Yiyi
Special Topic 10: WANG Shaoqun LIU Liu
Special Topic 11: CHENG Shigang SUN Yinhao
Special Topic 12: CHEN Pan
Special Topic 13: MIAO Mengmeng
Chapter III: LIU Tong ZHOU Yibin SUN Yi
Special Topic 14: LIU Qin MIAO Mengmeng CHEN Pan
CHEN Wei
Special Topic 15: DING Hongtao
Special Topic 16: XIE Dan LIU Jie LI Yan
WU Wenguang DUAN Xiaoyu
Special Topic 17: CHEN Min LI Kaining
Special Topic 18: XIE Dan ZHU Qiang ZHU Hanning DU Meng
Special Topic 19: LIU Tong
China Financial Stability R
eport 2018
Special Topic 20: LIU Qin
Special Topic 21: FENG Zexu
Special Topic 22: OUYANG Changmin SUN Bin DING Jing
Special Topic 23: ZHANG Xinning
Appendix: JI Baolin LIU Tong YANG Qing
LIU Liu MO Yiyi
Other Contributors:
DONG Jin DONG Yingchao GAO Xia
HU Yongbo JI Jun LEI Zhaoming
LI Qing LIU Shiying LU Yichen
TONG Yuenan WANG Dabo WANG Jing
WANG Wenjing WANG Zunzhou XIA Weiliang
XIE Rong YAO Feng YIN Shi
YU Haixu YU Mingxing YU Yong
ZHAN Tianshu ZHAO Min ZHAO Wen
Contributors to English Edition①
Chief Editors: ZHOU Xuedong WANG Jingwu YANG LiuEditor: ZHANG TiantianTranslators: Executive Summary: CAO Zhihong Chapter I: MA Hui Special Topic 1: LU Leilei Special Topic 2: QI Zhe Special Topic 3: LU Leilei Special Topic 4: MIAO Mengmeng Special Topic 5: SUN Yinhao Chapter II: MA Hui Special Topic 6: ZHAO Bingzhe Special Topic 7: CHEN Song Special Topic 8: SUN Yinhao Special Topic 9: SUN Yinhao Special Topic 10: FENG Lei Special Topic 11: CHEN Song Special Topic 12: CHEN Wei Special Topic 13: MIAO Mengmeng Chapter III: LIU Tong Special Topic 14: LIU Qin Special Topic 15: LU Leilei Special Topic 16: FENG Lei Special Topic 17: CHEN Song Special Topic 18: LIU Hongcheng Special Topic 19: LIU Tong Special Topic 20: CHEN Wei Special Topic 21: ZHAO Bingzhe Special Topic 22: CHEN Wei Special Topic 23: ZHANG Tiantian Appendix: LI ZiyanOther Contributors: CHEN Min CHEN Pan HU Ping LIU Jie SHEN Changye WANG Yihan XU Yue
① This English edition is an unofficial translation of the China Financial Stability Report 2018, which was published in November 2018. In case of any discrepancies, the Chinese version shall govern.
China Financial Stability R
eport 2018

Executive Summary
The world political and economic landscapes have gone through profound adjustments since 2017 and in particular since the beginning of 2018. Growing uncertainties have increased the complexities of external environment for the Chinese economy and financial system. Nevertheless, among the major economies, China has maintained a fairly high growth rate. With the unfolding of the critical battles in forestalling and defusing major risks, rolling out targeted measures of poverty alleviation, and addressing pollution, the quality of economic growth has improved continuously. And the supply-side structural reforms have made good progress in the complex and changing environment. The financial system has become more resilient and has been generally stable. In 2017, China’s GDP growth was 6.9 percent year on year, 3.1 percentage points higher than the global growth rate as measured by the IMF and that of many emerging market economies; the employment kept stable, with over 11 million new jobs created in 2017. The overall inflation was moderate, with CPI up 1.6 percent year on year, decelerating 0.4 percentage point year on year. The BOP position was balanced in general as current account surplus posted USD 172 billion and the gain of reserve assets reached USD 91.5 billion. In the first half of 2018, GDP grew by 6.8 percent, CPI was up 2.0 percent year on year, and the surveyed urban unemployment rate was consistently around 5 percent. In general, the macroeconomic and financial market statistics in 2017 and in the first half of 2018 was in line with market expectations.
The economic and financial development and reform and the defusing and tackling of major risks during the past one year have not only reduced financial risks, improved stability of the financial system, laid the foundation for the economic transformation and development in the next five years or an even longer period, but also contributed to growth and sustained recovery of the global economy.
Nevertheless, we are also quite aware of the increasing risk factors threatening global financial stability at the moment and in the near future, in particular the
rising trade protectionism globally, economic and trade frictions started by the US, and the ensuing negative impact on macro economy and financial markets in China and beyond. Meanwhile, monetary policy adjustment in the US and other developed economies may trigger tightening of the global liquidity and have spillover effects for emerging market economies. On the domestic front, the cyclical and institutional problems and risks accumulated over the years in the economic and financial system are coming to the fore, and the structural problems are still serious. Adjustment of structure and institutional arrangements will take time and cost will be incurred in the process of defusing potential risks. The process will be difficult and the task remains arduous. We are of the view that the financial market and macro economy may feel the “pinch” or even “pain” in the process of promoting the supply-side structural reforms and defusing major risks. As financial regulation is strengthened, cyclical risk incidents will gradually emerge. Such a scenario is not beyond expectation and we can accept it.
It is gratifying that the guiding principles, major policies and top-level institutional design for promoting financial reform and development and maintaining financial stability in the coming period have been established as a result of the 2017 National Financial Work Conference. The State Council Financial Stability and Development Committee was established in 2017 and was further improved and strengthened after the annual sessions of National People’s Congress and the Chinese People’s Political Consultative Conference in 2018. The financial regulatory structure was also adjusted. With the adjustment, financial regulatory coordination mechanism has been reinforced, and the mechanism for coordinating monetary policy, fiscal policy, regulatory policy and industrial policy has become more effective. The macroprudential philosophy and framework with the central bank at the core have been gradually put into place. The systemic risk prevention mechanism has been further enhanced. At the same time, the prudential regulatory regime has been gradually improved. The new rules on wealth management business were rolled out with an aim to regulate shadow banking, and the Guidelines on Tightening Regulation on Non-financial Enterprises’ Investment in Financial Institutions was released to curb the savage growth of financial
holding companies. The simulated supervision of financial holding companies has started, and efforts have been made to accelerate the formulation of financial holding company regulation rules. All these measures aimed to tackle the regulatory gap. The special task on rectification of Internet finance has continued. A risk response mechanism for external shocks to the financial market was established to keep the stock market, foreign exchange market, bond market and real estate market generally stable. The RMB exchange rate was basically stable at an adaptive and equilibrium level. The financial sector reform and opening up were accelerated. Moreover, the monitoring and assessment of systemic risks were strengthened. The central bank has put in place a rating system for financial institutions. The macroprudential policies on cross-border financing and capital flows have also been improved. A series of measures adopted since 2017 have produced notable results as the excessive growth of macro leverage ratio was checked, the financial risks were broadly contained, and the breaches of regulatory policies by local and informal financial institutions were reigned in. The wealth management business has gradually returned to its fundamental role of managing wealth on behalf of clients. The expectation and practice of implicit guarantee in the bond market have been gradually removed. Market discipline has strengthened; compliance awareness of financial institutions and the risk awareness of investors have increased notably. Generally speaking, the economic and financial risks are under control and systemic risks will not emerge.
We also note that when promoting the various risk prevention and mitigation policies, financial regulatory authorities have managed the pace and intensity of policy measures and strengthened expectation guidance. Since the beginning of 2018, facing new developments and changes in the real economy and financial system, in particular the growing uncertainties in China-US trade tensions, financial regulatory authorities have stepped up preemptive adjustment and fine-tuning, implemented a sound and neutral monetary policy, kept the liquidity at reasonable and adequate levels, adjusted the macroprudential assessment parameters, supported the banks incorporating off-balance sheet financing into the balance sheet, and maintained the reasonable growth of total social financing.

Looking forward to 2019, the global economy and financial market will continue to face fairly large uncertainties. The Chinese economy is going through the transformation of high-speed growth to high-quality growth and structural adjustment, thus some financial risks of a grey rhinoceros nature may still come up. However, the fundamentals of the Chinese economy featured by the large volume, huge market and strong resilience have remained unchanged. The basic policy orientation of reform and opening up has remained and will not change. In view of the marginal changes in economic performance, we will endeavor to keep the employment and the financial market stable, maintain the steady pace of trade, foreign investment and investment, and keep expectations stable. The policies will be implemented in real earnest to strike a balance among maintaining stable growth, adjusting the structure and preventing risks. We expect that in 2019, China's macroeconomic and financial policies will be more forward-looking, flexible, coordinated and thus more effective. The financial reform will be more extensive and profound, and the pace of opening-up will only accelerate. As the three tough battles, in particular the battle of forestalling and defusing major risks, are underway under the principles of maintaining overall stability, proceeding in a coordinated matter, adopting differentiated policies, and defusing risks in a targeted and calibrated way, the institutional risks will be gradually managed and mitigated in an orderly manner. The stability and soundness of China's macro economy and financial system will be enhanced, and the basis for financial stability will become more solid. Moreover, the risk resilience and capacity of the financial system in serving the real economy will be strengthened.
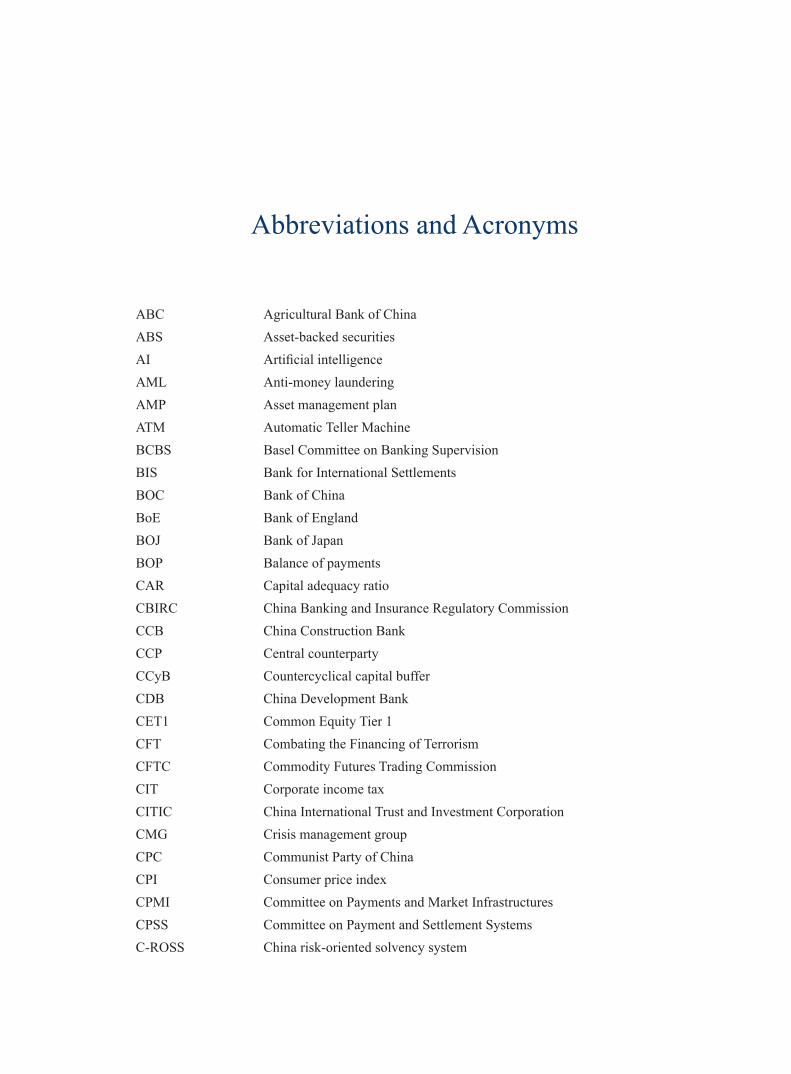
Abbreviations and Acronyms
ABC Agricultural Bank of ChinaABS Asset-backed securitiesAI Artificial intelligenceAML Anti-money launderingAMP Asset management planATM Automatic Teller MachineBCBS Basel Committee on Banking SupervisionBIS Bank for International SettlementsBOC Bank of ChinaBoE Bank of EnglandBOJ Bank of JapanBOP Balance of paymentsCAR Capital adequacy ratioCBIRC China Banking and Insurance Regulatory CommissionCCB China Construction BankCCP Central counterpartyCCyB Countercyclical capital buffer CDB China Development BankCET1 Common Equity Tier 1CFT Combating the Financing of TerrorismCFTC Commodity Futures Trading Commission CIT Corporate income taxCITIC China International Trust and Investment CorporationCMG Crisis management groupCPC Communist Party of ChinaCPI Consumer price indexCPMI Committee on Payments and Market InfrastructuresCPSS Committee on Payment and Settlement SystemsC-ROSS China risk-oriented solvency system
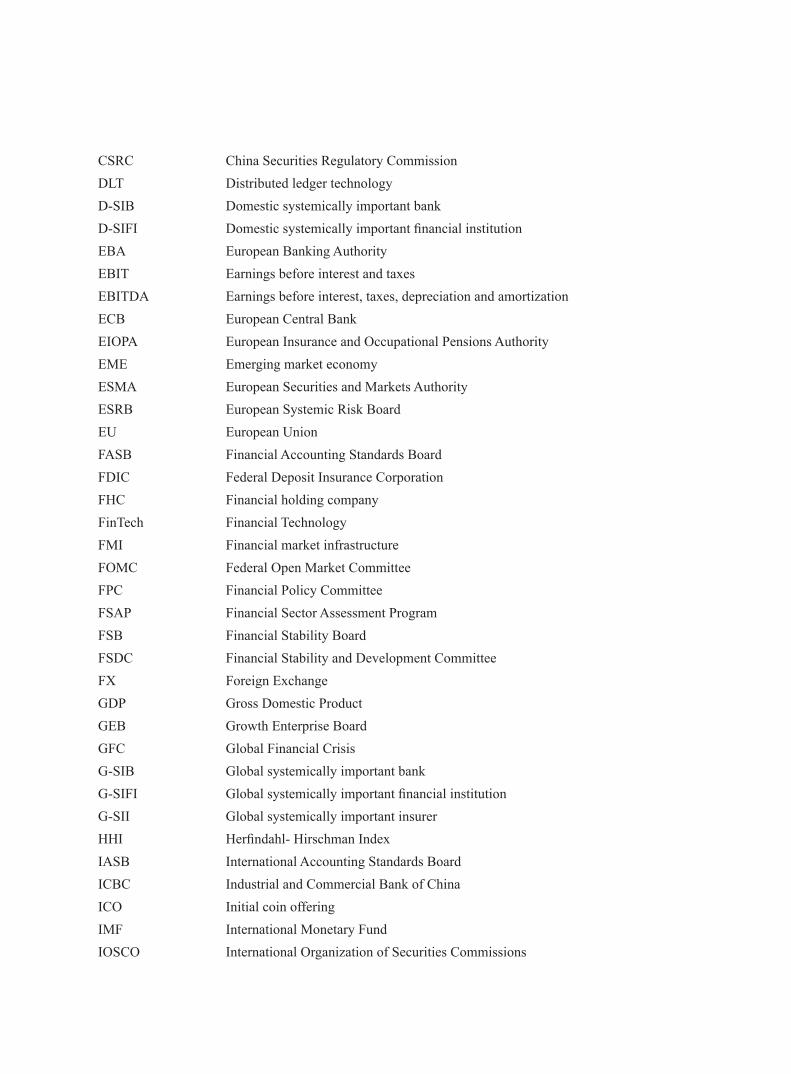
CSRC China Securities Regulatory Commission DLT Distributed ledger technology D-SIB Domestic systemically important bankD-SIFI Domestic systemically important financial institutionEBA European Banking AuthorityEBIT Earnings before interest and taxesEBITDA Earnings before interest, taxes, depreciation and amortizationECB European Central BankEIOPA European Insurance and Occupational Pensions AuthorityEME Emerging market economyESMA European Securities and Markets AuthorityESRB European Systemic Risk Board EU European UnionFASB Financial Accounting Standards BoardFDIC Federal Deposit Insurance CorporationFHC Financial holding companyFinTech Financial TechnologyFMI Financial market infrastructureFOMC Federal Open Market CommitteeFPC Financial Policy Committee FSAP Financial Sector Assessment ProgramFSB Financial Stability BoardFSDC Financial Stability and Development Committee FX Foreign ExchangeGDP Gross Domestic ProductGEB Growth Enterprise BoardGFC Global Financial CrisisG-SIB Global systemically important bankG-SIFI Global systemically important financial institutionG-SII Global systemically important insurerHHI Herfindahl- Hirschman Index IASB International Accounting Standards BoardICBC Industrial and Commercial Bank of ChinaICO Initial coin offering IMF International Monetary FundIOSCO International Organization of Securities Commissions

IPO Initial public offeringJCT Joint Committee on TaxationLCR Liquidity Coverage RatioLEI Legal Entity IdentifierLTV Loan-to-valueM&A Mergers and acquisitions MBS Mortgage-backed securitiesMCC Micro credit companyMLF Medium-term Lending FacilityMMF Money market fundMNC Multi-national corporationMOF Ministry of FinanceMPA Macroprudential Assessment MREL Minimum Requirement for Own Funds and Eligible LiabilitiesNAFTA North American Free Trade AgreementNBS National Bureau of StatisticsNCD Negotiable certificate of depositNPA Non-performing assetNPC National People's CongressNPL Non-performing loanNSCA Non-standard credit assetNSFR Net Stable Funding RatioOCC Comptroller of the Currency OTC Over the counterPBC People’s Bank of ChinaPPP Public-private partnershipPRC People’s Republic of ChinaQE Quantitative easingR&D Research and developmentRMB RenminbiROA Return on assets ROE Return on equityROI Return on investmentRRP Recovery and resolution planRWA Risk-weighted assetSAFE State Administration of Foreign Exchange
SEC Securities and Exchange Commission SIFI Systemically important financial institutionSLF Standing Lending FacilitySME Small- and medium-sized enterpriseSOE State-owned enterpriseSPV Special purpose vehicleTLAC Total Loss-absorbing CapacityTPP Trans-Pacific PartnershipTR Trade repositoryU.S. United StatesUSD U.S. DollarUSTR U.S. Trade RepresentativeWMP Wealth Management ProductWTO World Trade Organizationy-o-y Year-on-year
1
CO
NT
EN
TS
Chapter I Macroeconomic Performance …………………………………… 1
I. International Macroeconomic and Financial Environment ……………………………… 3
II. China’s Economic and Financial Performance ……………………………………… 10
III. Outlook ……………………………………………………………………………… 17
Special Topic 1 Overview of Major Adjustments in Global Economic and
Financial Policies ……………………………………………………… 21
I. Monetary Policy Normalization in Major Developed Economies and Spillover Effects 21
II. U.S. Tax Reform and Spillover Effects ……………………………………………… 23
III. Trend and Risk Analysis of Global Trade Protectionism …………………………… 25
Special Topic 2 High-leverage in the Non-financial Corporate Sector and
Efforts to Deleverage ………………………………………………… 30
I. Basic Facts about Debt of the Non-financial Corporate Sector in China ……………… 30
II. Efforts to Tackle the Leverage Issue and Progress Made …………………………… 31
III. Difficulties Ahead and Steps Forward ……………………………………………… 32
IV. Key Work for Next Stage …………………………………………………………… 34
Special Topic 3 Analysis of the Local Government Implicit Debts ………………… 36
I. Efforts to Clear up Risks Associated with Local Government Explicit Debts and
Enhance Regulation …………………………………………………………………… 36
II. Risks Associated with Local Government Implicit Debts …………………………… 37
III. Policy Recommendations …………………………………………………………… 39
Special Topic 4 Household Debt in China …………………………………………… 41
I. Household Debt: Level and Structure ………………………………………………… 41
II. Risk Analysis of Household Debt …………………………………………………… 45
III. Policy Recommendations …………………………………………………………… 49
2
CO
NT
EN
TS
Special Topic 5 Developments and Risks in the Real Estate Market of China …… 51
I. Overview of the Domestic Real Estate Market in 2017 ……………………………… 51
II. Potential Risks That Warrant Attention in the Housing Finance Sector ……………… 55
III. Policy Recommendations …………………………………………………………… 56
Chapter II Soundness Assessment of the Financial Sector ………… 57
I. Soundness Assessment of the Banking Sector ………………………………………… 59
II. Soundness Assessment of the Insurance Sector ……………………………………… 63
III. Soundness Assessment of the Securities Sector ……………………………………… 68
IV. Soundness Assessment of the Financial Market ……………………………………… 72
Special Topic 6 The Banking Sector Stress Testing ………………………………… 77
I. General Description of the Stress Testing ……………………………………………… 77
II. Overall Results of the Stress Tests …………………………………………………… 80
Special Topic 7 The Expected Loss Model in the New Accounting Standard IFRS 9
and its Impact on Commercial Banks ……………………………… 84
I. The Two Concurrent Systems of Loan Loss Provision: Accounting System and
Regulatory System …………………………………………………………………… 84
II. The IFRS 9 based on the Expected Loss Model ……………………………………… 85
III. Impact of the Impairment Requirement in the New Accounting Standard on
Chinese Commercial Banks ………………………………………………………… 86
IV. Ensuring the Smooth Transition Between the Old and New Standards …………… 87
Special Topic 8 Containing Liquidity Risks of Money Market Funds ……………… 89
I. Liquidity Risks of the MMFs ………………………………………………………… 89
II. Mitigating Liquidity Risks of the MMFs …………………………………………… 91
Special Topic 9 Risk Analysis and Policy Measures of Locally-regulated
Financial Institutions and Platforms ………………………………… 93
I. Essential Risks of Locally-regulated Financial Institutions and Platforms …………… 93
II. Challenges for the Supervision of Local Financial Institutions and Platforms ……… 94
III. Policy Recommendations …………………………………………………………… 95
Special Topic 10 Supervision of Capital and Equities of Insurance Companies … 97
3
CO
NT
EN
TS
I. Issues Regarding the Capital and Equity Management of Insurance Companies …… 97
II. The Supervision and Administration of Capital and Equities of
Insurance Companies before 2017 …………………………………………………… 97
III. Measures to Strengthen Supervision and Administration of Capital and
Equities since 2017 ………………………………………………………………… 99
IV. Further Enhancing the Supervision and Administration of Capital of
the Insurance Industry ……………………………………………………………… 100
Special Topic 11 Establishment of the Online Payment and Clearing Platform for
Non-bank Payment Institutions …………………………………… 102
I. Centralised Clearing and Its Advantages ……………………………………………… 102
II. Potential Risks of Clearing through Correspondent Banks by Connecting NPIs Directly
to Banks ……………………………………………………………………………… 103
III. Overview of the NetsUnion Clearing Platform ……………………………………… 103
IV. The Significance of Establishing the NetsUion Clearing Platform ………………… 104
Special Topic 12 Risks Related to Crypto-assets …………………………………… 106
I. Overview of the Crypto-asset Markets ………………………………………………… 106
II. Issues and Challenges Arising from the Crypto-assets ……………………………… 108
III. Regulatory Developments in Crypto-asset Related Areas …………………………… 109
IV. Policy Recommendations …………………………………………………………… 111
Special Topic 13 China FSAP Update: Main Conclusions and Recommendations … 112
I .The Assessment Conclusions ………………………………………………………… 112
II .Main Recommendations ……………………………………………………………… 115
Chapter III Macroprudential Regulation ………………………………… 119
I. International Developments on Macroprudential Regulation ………………………… 121
II. Major Jurisdictions’ Progress in Macroprudential Policies…………………………… 124
III. China’s Practice in Macroprudential Regulation …………………………………… 127
Special Topic 14 The Prudential Regulatory Regime ………………………………… 132
I. Definition of Prudential Regulation …………………………………………………… 132
II. International Practices ………………………………………………………………… 133
4
CO
NT
EN
TS
III. Enhancing the Macroprudential Policy Framework in China ……………………… 137
Special Topic 15 Macroprudential Regulation and Rating of Financial Institutions
by the Central Bank ………………………………………………… 140
I. Attempts at Building the Macroprudential Assessment Framework ………………… 140
II. Improving the Macroprudential Framework Based on Central Bank’s Rating of
Financial Institutions ………………………………………………………………… 141
III. The Central Bank’s Framework of Rating Financial Institutions ……………………… 142
IV. The First Rating Results of Financial Institutions by the Central Bank …………… 143
V. The Application of Rating Results for Financial Institutions by the Central Bank …… 143
Special Topic 16 Unifying Regulatory Standards for Wealth Management
Business ……………………………………………………………… 145
I. Rapid Growth of Wealth Management Business Bears Acute Risks ………………… 145
II. General Idea and Major Content of the Guidelines …………………………………… 147
III. Outlook of the Wealth Management Market ………………………………………… 154
Special Topic 17 Overview of the Investment in Financial Institutions by
Non-Financial Enterprises and Relevant Regulatory Issues …… 158
I. Overview of the Investment in Financial Institutions by Non-financial Enterprises
in China and the Accompanying Chanlleges ………………………………………… 158
II. Basic Principles for Regulation Tightening …………………………………………… 160
III. Strengthening Regulation in Key Aspects in A Problem-oriented Approach ……… 161
Special Topic 18 Establishing the Regulatory System for Financial Holding Companies
to Avoid Their Savage Growth ……………………………………… 164
I. Global Practice for FHCs ……………………………………………………………… 164
II. Global Regulatory Practice for FHCs ………………………………………………… 165
III. Development and Risks of FHCs in China ………………………………………… 168
IV. Establishing the Regulatory System for FHCs in China …………………………… 170
Special Topic 19 Establishing the Regulatory Framework of Systemically Important
Financial Institutions ………………………………………………… 173
I. The Necessity of Enhancing Regulation on SIFIs …………………………………… 173
II. The International Experience of Regulation on SIFIs ………………………………… 174
5
CO
NT
EN
TS
III. The Main Considerations of Improving the Regulation on SIFIs in China ………… 179
Special Topic 20 International Standards on Resolution of Financial Institutions … 182
I. Lessons Learned from the 2008 GFC ………………………………………………… 182
II. Key Attributes and Its Implementation Progress ……………………………………… 183
III. Improving the Resolvability of G-SIFIs …………………………………………… 185
Special Topic 21 The TLAC Requirement for Global Systemically Important Banks 188
I. Summary of the TLAC Requirement ………………………………………………… 188
II. Implementation of the TLAC Requirement ………………………………………… 189
III. Implementation of the TLAC Framework in China ………………………………… 191
Special Topic 22 Resolution Approaches by Deposit Insurers in Dealing with
Financial Failures …………………………………………………… 194
I. Purchase and Assumption ……………………………………………………………… 194
II. Bridge Bank …………………………………………………………………………… 195
III. Open Bank Assistance ……………………………………………………………… 196
IV. Deposit Reimbursement ……………………………………………………………… 198
V. Conclusion …………………………………………………………………………… 198
Special Topic 23 Resolvability Assessments of the Four Global Systemically
Important Banks in China …………………………………………… 200
I. The Resolvability Assessment Framework …………………………………………… 200
II. Progress of Resolvability Assessments of the Four G-SIBs Incorporated in China … 201
III. Analysis on Results of Resolvability Assessments ………………………………… 202
IV. Existing Problems in the Resolution Regimes in China ……………………………… 202
V. Measures to Improve Resolvability …………………………………………………… 203
Appendix Statistics …………………………………………………………… 205


3Chapter I Macroeconomic Performance
In 2017, the global economy recovered in a synchronized manner. The Chinese economy
performed well amidst stabilization, with various economic indicators continuously i m p r o v i n g . H o w e v e r , t h e e c o n o m i c and financial conditions have remained complex and grave both a t home and abroad. Internationally, spillover effects of the economic and financial policies in the advanced economies, de-globalization, protectionism and other potential risks deserve attention. Domestically, structural problems in the Chinese economy remain prominent, and it is an arduous task to mitigate financial risks. Going forward, efforts need to be made to stick to the general principle of seeking progress amidst stability, win the victory of the three critical battles that are important for decisively bringing to completion the building of a moderately prosperous society in all aspects, deepen supply-side structural reforms, strengthen macroprudential regulation, stimulate vitality of various market players, and break new grounds in reform and opening-up, so as to promote sustained and healthy development of the economy and society.
I. International Macroeconomic and Financial Environment
1. Economic Developments in Major Economies
The global economy experienced synchronized
recovery f rom the s ta r t o f 2017 . The recovery momentum remained strong in the U.S., economic conditions in the Euro area continued to improve, and the recovery picked up in Japan. The emerging market economies as a whole grew relatively rapidly, although some continued to face economic restructuring and transformation pressures.
The U.S. saw solid gains in its economic
recovery and was close to full employment.
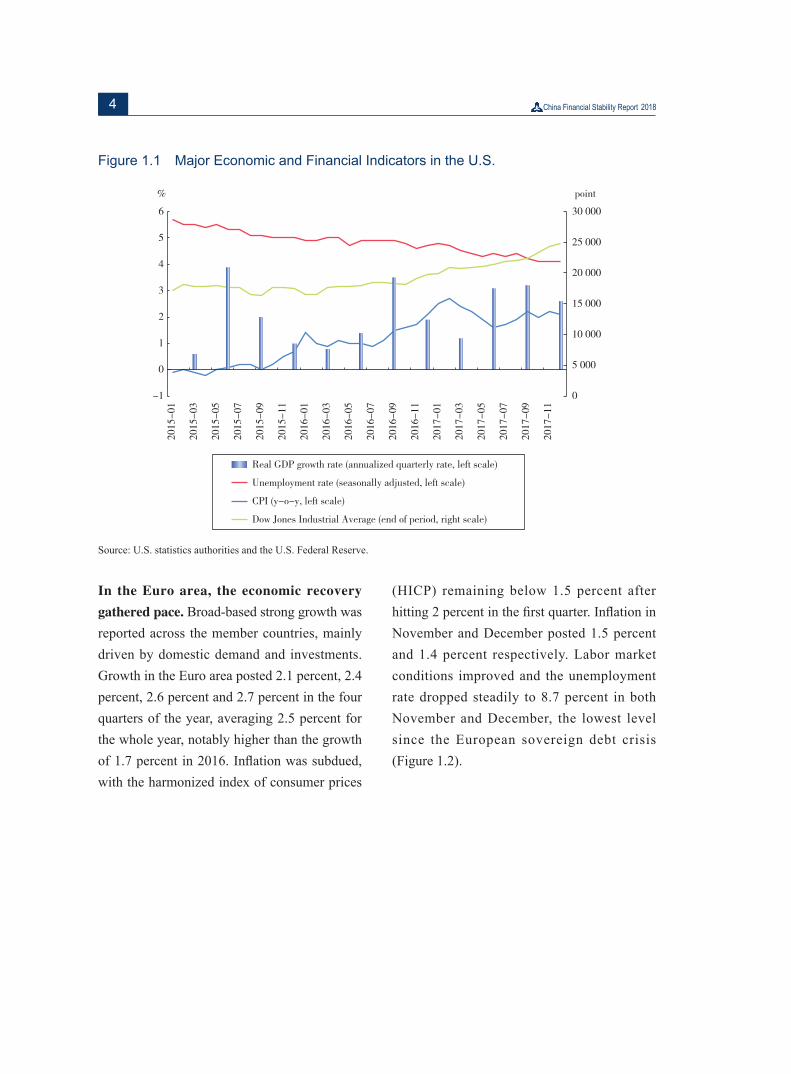
The GDP grew by 1.2 percent in the first quarter of 2017, and rebounded to 3.1 percent and 3.2 percent respectively in the second and third quarter, hitting a two-year high for two consecutive quarters. Growth in the fourth quarter posted 2.9 percent, resulting in an annual growth of 2.3 percent. The consumer price index (CPI) and core CPI declined from 2.0 percent recorded in the beginning of 2017. Only the CPI went up moderately at end-2017, posting 2.2 percent and 2.1 percent in November and December respectively, whereas the core CPI grew by 1.7 percent and 1.8 percent y-o-y in the last two months of the year, below the 2 percent target for nine consecutive months. The labor market continued to improve, as the unemployment rate dropped to 4.1 percent in October 2017, the lowest level since 2001. New jobs in the non-agricultural sector remained stable despite moderate fluctuations, and the labor participation rate was lower than the historical average (Figure 1.1).
4
Figure 1.1 Major Economic and Financial Indicators in the U.S.
Source: U.S. statistics authorities and the U.S. Federal Reserve.
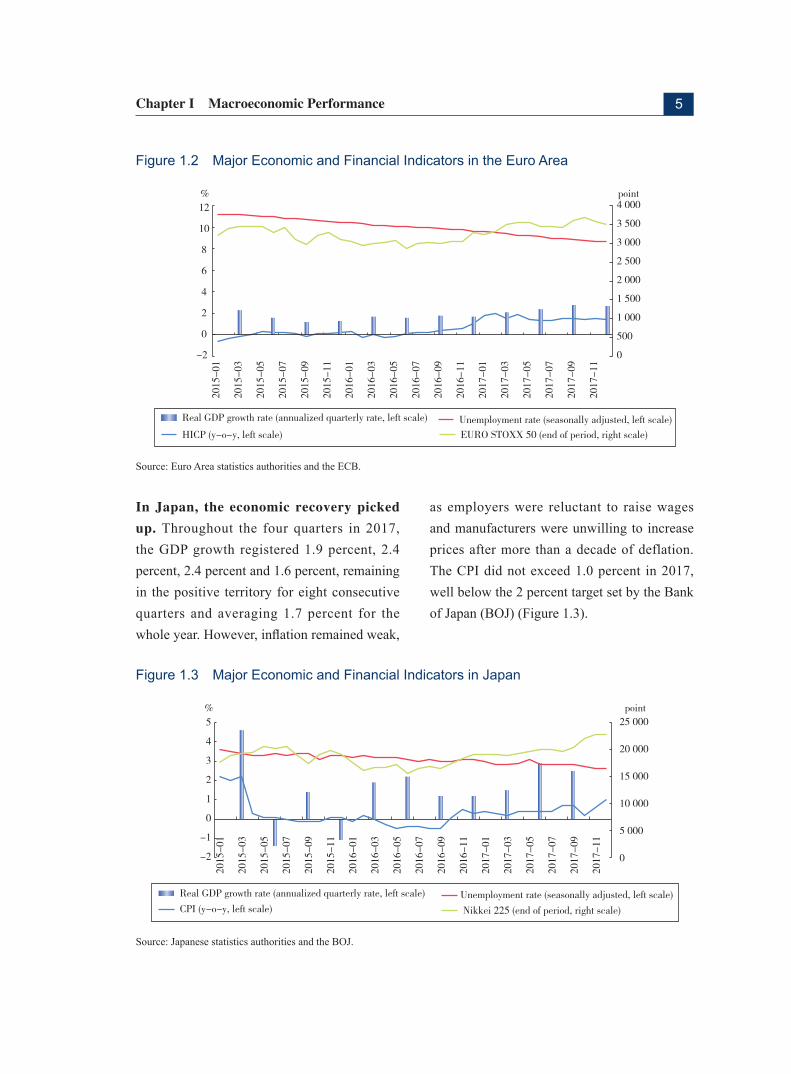
In the Euro area, the economic recovery
gathered pace. Broad-based strong growth was reported across the member countries, mainly driven by domestic demand and investments. Growth in the Euro area posted 2.1 percent, 2.4 percent, 2.6 percent and 2.7 percent in the four quarters of the year, averaging 2.5 percent for the whole year, notably higher than the growth of 1.7 percent in 2016. Inflation was subdued, with the harmonized index of consumer prices
(HICP) remaining below 1.5 percent after hitting 2 percent in the first quarter. Inflation in November and December posted 1.5 percent and 1.4 percent respectively. Labor market conditions improved and the unemployment rate dropped steadily to 8.7 percent in both November and December, the lowest level since the European sovereign debt crisis (Figure 1.2).
5Chapter I Macroeconomic Performance
Figure 1.2 Major Economic and Financial Indicators in the Euro Area
Source: Euro Area statistics authorities and the ECB.
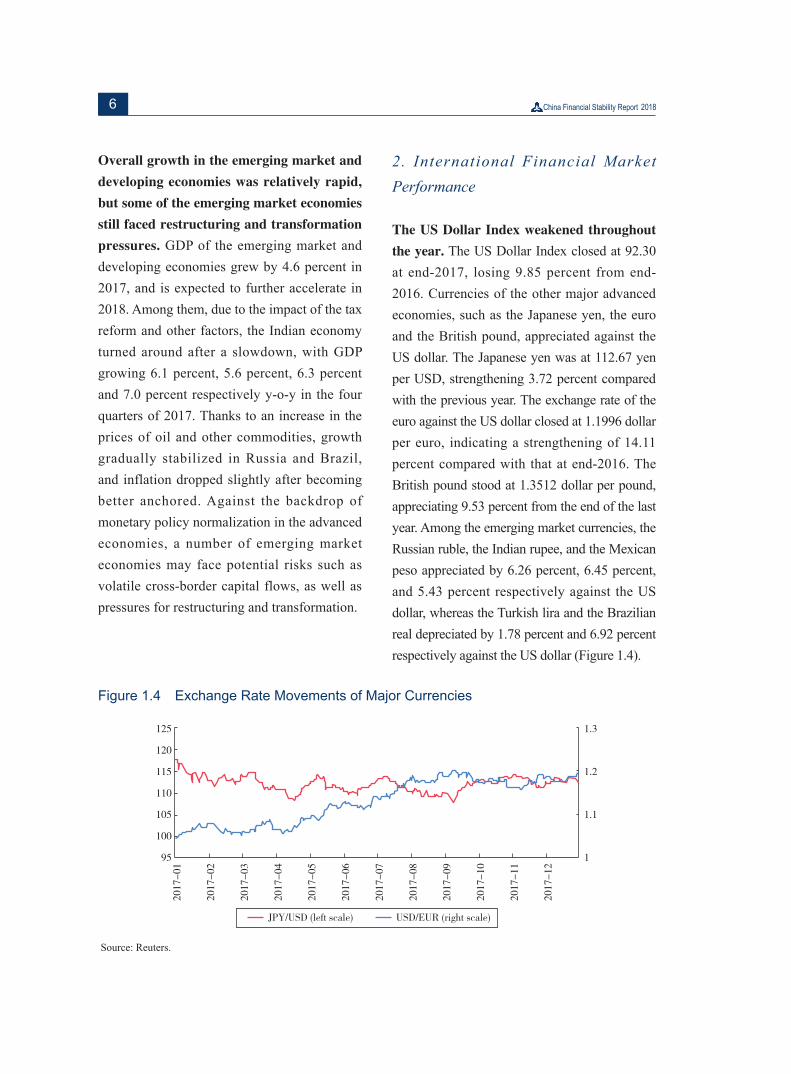
In Japan, the economic recovery picked
up. Throughout the four quarters in 2017, the GDP growth registered 1.9 percent, 2.4 percent, 2.4 percent and 1.6 percent, remaining in the positive territory for eight consecutive quarters and averaging 1.7 percent for the whole year. However, inflation remained weak,
as employers were reluctant to raise wages and manufacturers were unwilling to increase prices after more than a decade of deflation. The CPI did not exceed 1.0 percent in 2017, well below the 2 percent target set by the Bank of Japan (BOJ) (Figure 1.3).
Figure 1.3 Major Economic and Financial Indicators in Japan
Source: Japanese statistics authorities and the BOJ.
6
Overall growth in the emerging market and
developing economies was relatively rapid,
but some of the emerging market economies
still faced restructuring and transformation
pressures. GDP of the emerging market and developing economies grew by 4.6 percent in 2017, and is expected to further accelerate in 2018. Among them, due to the impact of the tax reform and other factors, the Indian economy turned around after a slowdown, with GDP growing 6.1 percent, 5.6 percent, 6.3 percent and 7.0 percent respectively y-o-y in the four quarters of 2017. Thanks to an increase in the prices of oil and other commodities, growth gradually stabilized in Russia and Brazil, and inflation dropped slightly after becoming better anchored. Against the backdrop of monetary policy normalization in the advanced economies, a number of emerging market economies may face potential risks such as volatile cross-border capital flows, as well as pressures for restructuring and transformation.
2. International Financial Market Performance
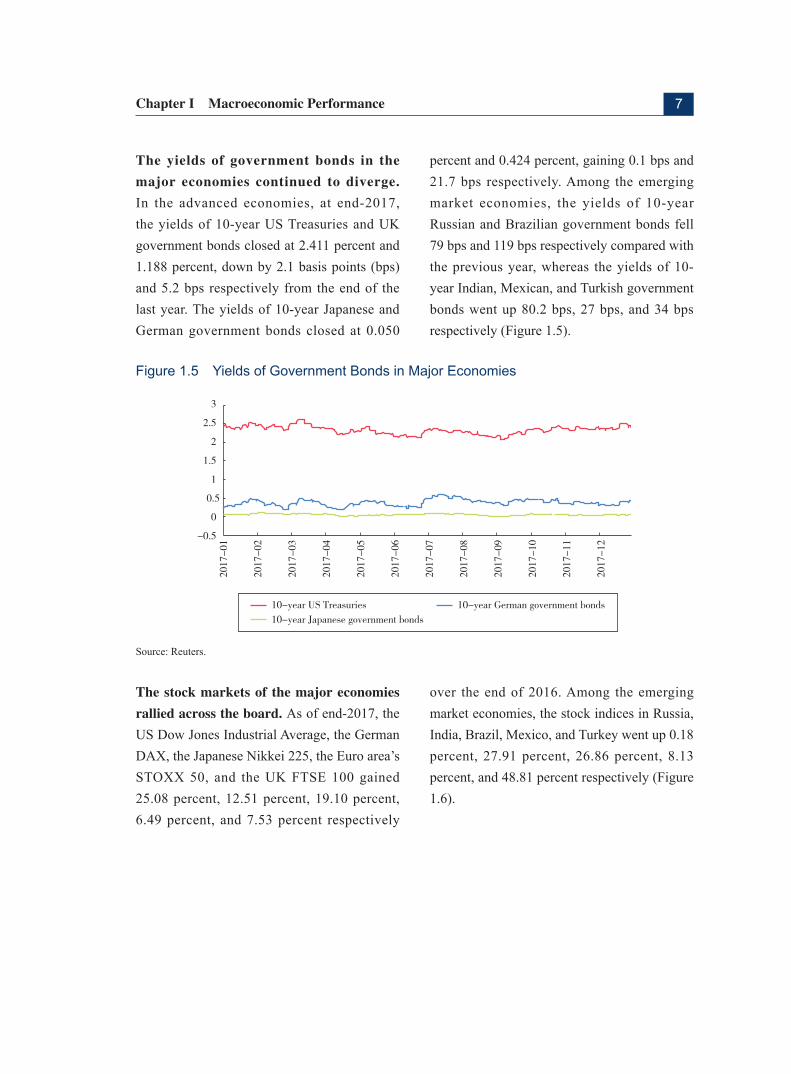
The US Dollar Index weakened throughout
the year. The US Dollar Index closed at 92.30 at end-2017, losing 9.85 percent from end-2016. Currencies of the other major advanced economies, such as the Japanese yen, the euro and the British pound, appreciated against the US dollar. The Japanese yen was at 112.67 yen per USD, strengthening 3.72 percent compared with the previous year. The exchange rate of the euro against the US dollar closed at 1.1996 dollar per euro, indicating a strengthening of 14.11 percent compared with that at end-2016. The British pound stood at 1.3512 dollar per pound, appreciating 9.53 percent from the end of the last year. Among the emerging market currencies, the Russian ruble, the Indian rupee, and the Mexican peso appreciated by 6.26 percent, 6.45 percent, and 5.43 percent respectively against the US dollar, whereas the Turkish lira and the Brazilian real depreciated by 1.78 percent and 6.92 percent respectively against the US dollar (Figure 1.4).
Figure 1.4 Exchange Rate Movements of Major Currencies
Source: Reuters.
7Chapter I Macroeconomic Performance
The yields of government bonds in the
major economies continued to diverge. In the advanced economies, at end-2017, the yields of 10-year US Treasuries and UK government bonds closed at 2.411 percent and 1.188 percent, down by 2.1 basis points (bps) and 5.2 bps respectively from the end of the last year. The yields of 10-year Japanese and German government bonds closed at 0.050
percent and 0.424 percent, gaining 0.1 bps and 21.7 bps respectively. Among the emerging market economies, the yields of 10-year Russian and Brazilian government bonds fell 79 bps and 119 bps respectively compared with the previous year, whereas the yields of 10-year Indian, Mexican, and Turkish government bonds went up 80.2 bps, 27 bps, and 34 bps respectively (Figure 1.5).
Figure 1.5 Yields of Government Bonds in Major Economies
Source: Reuters.
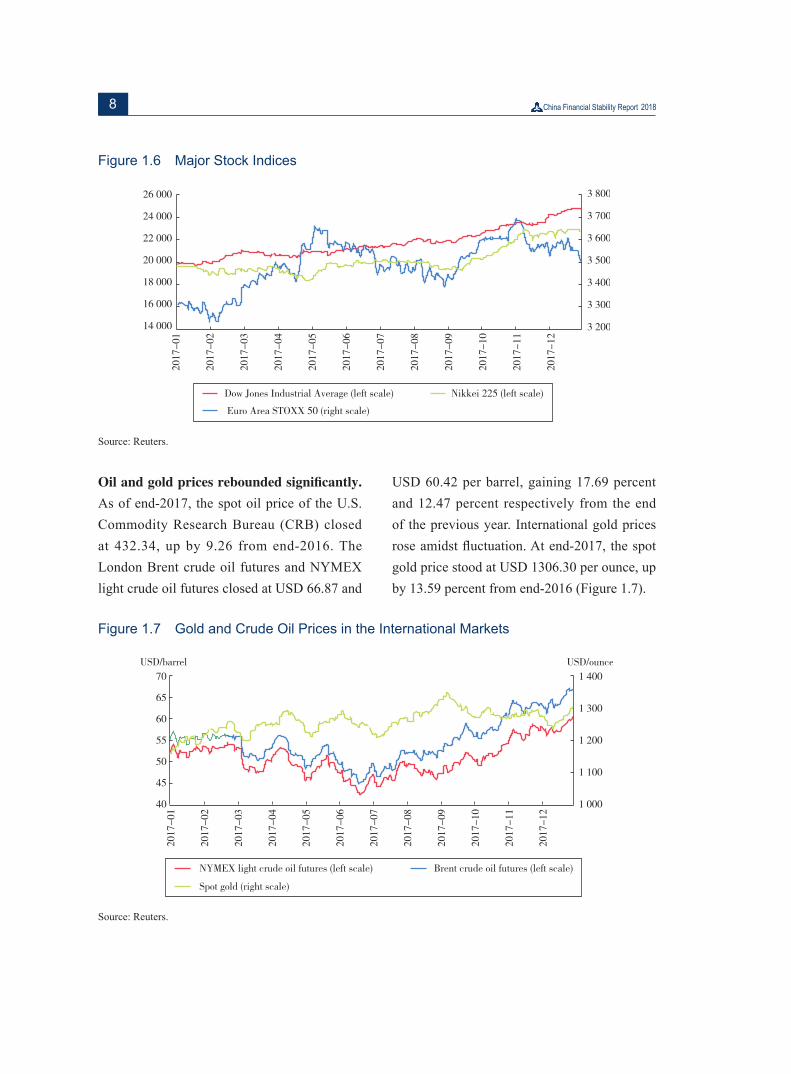
The stock markets of the major economies
rallied across the board. As of end-2017, the US Dow Jones Industrial Average, the German DAX, the Japanese Nikkei 225, the Euro area’s STOXX 50, and the UK FTSE 100 gained 25.08 percent, 12.51 percent, 19.10 percent, 6.49 percent, and 7.53 percent respectively
over the end of 2016. Among the emerging market economies, the stock indices in Russia, India, Brazil, Mexico, and Turkey went up 0.18 percent, 27.91 percent, 26.86 percent, 8.13 percent, and 48.81 percent respectively (Figure 1.6).
8
Figure 1.6 Major Stock Indices
Source: Reuters.
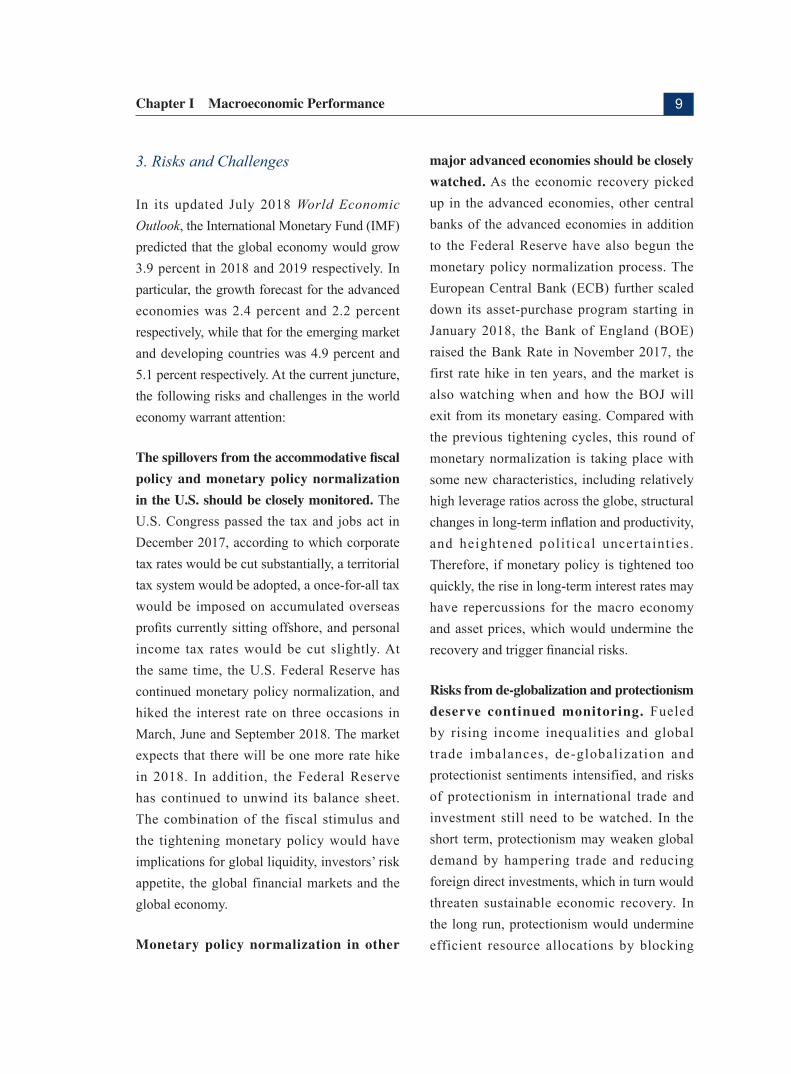
Oil and gold prices rebounded significantly. As of end-2017, the spot oil price of the U.S. Commodity Research Bureau (CRB) closed at 432.34, up by 9.26 from end-2016. The London Brent crude oil futures and NYMEX light crude oil futures closed at USD 66.87 and
USD 60.42 per barrel, gaining 17.69 percent and 12.47 percent respectively from the end of the previous year. International gold prices rose amidst fluctuation. At end-2017, the spot gold price stood at USD 1306.30 per ounce, up by 13.59 percent from end-2016 (Figure 1.7).
Figure 1.7 Gold and Crude Oil Prices in the International Markets
Source: Reuters.
9Chapter I Macroeconomic Performance
3. Risks and Challenges
In its updated July 2018 World Economic Outlook, the International Monetary Fund (IMF) predicted that the global economy would grow 3.9 percent in 2018 and 2019 respectively. In particular, the growth forecast for the advanced economies was 2.4 percent and 2.2 percent respectively, while that for the emerging market and developing countries was 4.9 percent and 5.1 percent respectively. At the current juncture, the following risks and challenges in the world economy warrant attention:
The spillovers from the accommodative fiscal
policy and monetary policy normalization
in the U.S. should be closely monitored. The U.S. Congress passed the tax and jobs act in December 2017, according to which corporate tax rates would be cut substantially, a territorial tax system would be adopted, a once-for-all tax would be imposed on accumulated overseas profits currently sitting offshore, and personal income tax rates would be cut slightly. At the same time, the U.S. Federal Reserve has continued monetary policy normalization, and hiked the interest rate on three occasions in March, June and September 2018. The market expects that there will be one more rate hike in 2018. In addition, the Federal Reserve has continued to unwind its balance sheet. The combination of the fiscal stimulus and the tightening monetary policy would have implications for global liquidity, investors’ risk appetite, the global financial markets and the global economy.
Monetary policy normalization in other
major advanced economies should be closely
watched. As the economic recovery picked up in the advanced economies, other central banks of the advanced economies in addition to the Federal Reserve have also begun the monetary policy normalization process. The European Central Bank (ECB) further scaled down its asset-purchase program starting in January 2018, the Bank of England (BOE) raised the Bank Rate in November 2017, the first rate hike in ten years, and the market is also watching when and how the BOJ will exit from its monetary easing. Compared with the previous tightening cycles, this round of monetary normalization is taking place with some new characteristics, including relatively high leverage ratios across the globe, structural changes in long-term inflation and productivity, and heightened polit ical uncertainties. Therefore, if monetary policy is tightened too quickly, the rise in long-term interest rates may have repercussions for the macro economy and asset prices, which would undermine the recovery and trigger financial risks.
Risks from de-globalization and protectionism
deserve continued monitoring. Fueled by rising income inequalities and global trade imbalances, de-globalization and protectionist sentiments intensified, and risks of protectionism in international trade and investment still need to be watched. In the short term, protectionism may weaken global demand by hampering trade and reducing foreign direct investments, which in turn would threaten sustainable economic recovery. In the long run, protectionism would undermine efficient resource allocations by blocking
10
free flows of labor and capital, constrain competition among participants in the global value chain, and weigh on global productivity gains and economic growth.
The inflation outlook remains unclear. The global inflation remains tepid, with inflation in some advanced economies continuing to undershoot the targets. The inflation conundrum, which refers to the divergence between inflation and economic recovery, might indicate a less stable economic recovery, and has attracted a lot of attention. Currently, no consensus has been reached on whether the low inflation is more of a transitory phenomenon or a permanent one. Some argue that the low inflation may become a trend, due to low productivity, development of the global value chain and artificial intelligence, and excess global capacity. If inflation remains at low levels for an extended period of time, it may lower inflation expectations, which would make monetary policy making more difficult.
High leverage ratios and heavy debt
burdens may weigh on consumption and
investments. At the global level, the leverage ratios of the non-financial sector in major economies have been rising in general. Against the backdrop of high leverage ratios in the household sector, slow wage growth, and growing wealth disparities, the role of consumption in driving economic recovery may be weakened. Given the consistently anemic productivity growth, rising political uncertainties, slower population growth, and high corporate debt, global investments may also face uncertainties. The rise in interest
payments on U.S. dollar-denominated debt by the corporate sector in some emerging market economies may further dampen investment growth.
In addition, geopolitical tensions have occurred in different places, and risk factors and uncertainties have been accumulating at a rapid pace, exerting a greater impact on the global economy and financial markets. Moreover, emerging risks from new technologies such as Fintech should not be neglected, as they may pose new challenges to global financial regulation.
I I . Ch ina ’s Economic and Financial Performance
1. Economic growth turned for good while stabilizing, and industrial structure continued to improve
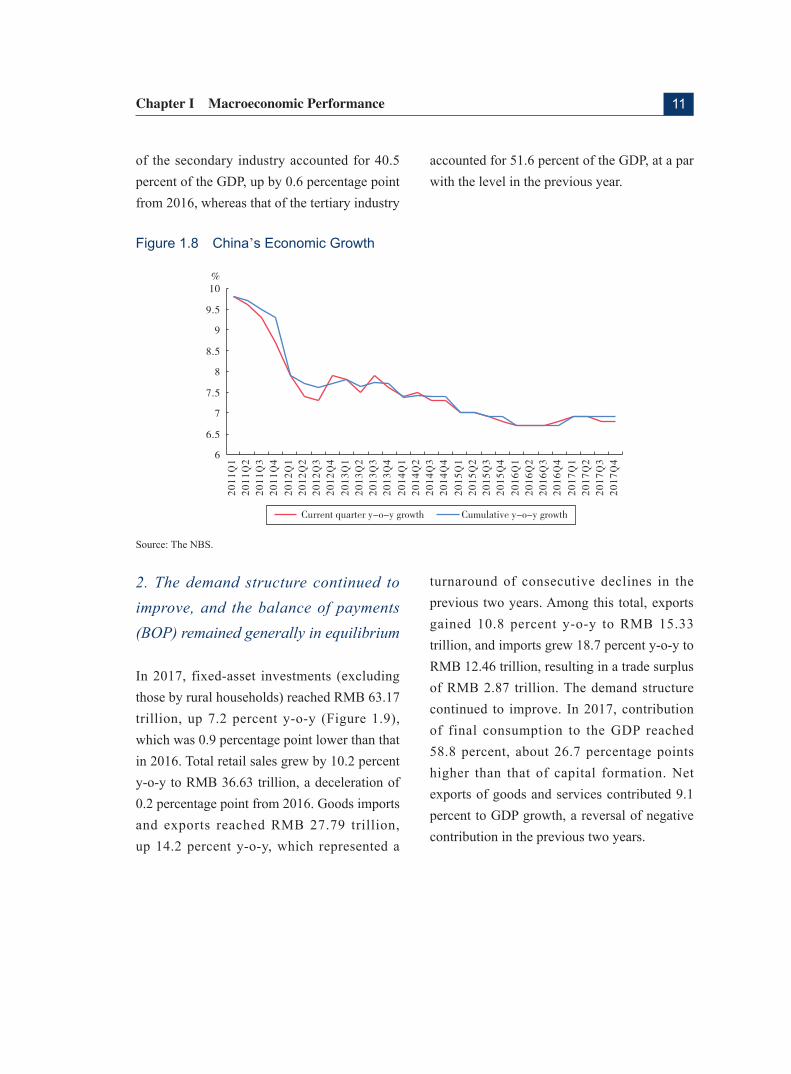
According to preliminary statistics of the National Bureau of Statistics (NBS), GDP registered RMB 82.71 trillion in 2017, up 6.9 percent y-o-y in comparable terms. Quarterly GDP growth was 6.9 percent, 6.9 percent, 6.8 percent, and 6.8 percent y-o-y respectively (Figure 1.8). Broken down by industry, the added value of the primary, the secondary and the tertiary industries posted RMB 6.55 trillion, RMB 33.46 trillion, and RMB 42.70 trillion respectively, up by 3.9 percent, 6.1 percent, and 8.0 percent y-o-y respectively. The added value of the primary industry as a share of the GDP fell by 0.6 percentage point from the previous year to 7.9 percent. The added value
11Chapter I Macroeconomic Performance
of the secondary industry accounted for 40.5 percent of the GDP, up by 0.6 percentage point from 2016, whereas that of the tertiary industry
accounted for 51.6 percent of the GDP, at a par with the level in the previous year.
Figure 1.8 China’s Economic Growth
Source: The NBS.
2. The demand structure continued to improve, and the balance of payments (BOP) remained generally in equilibrium
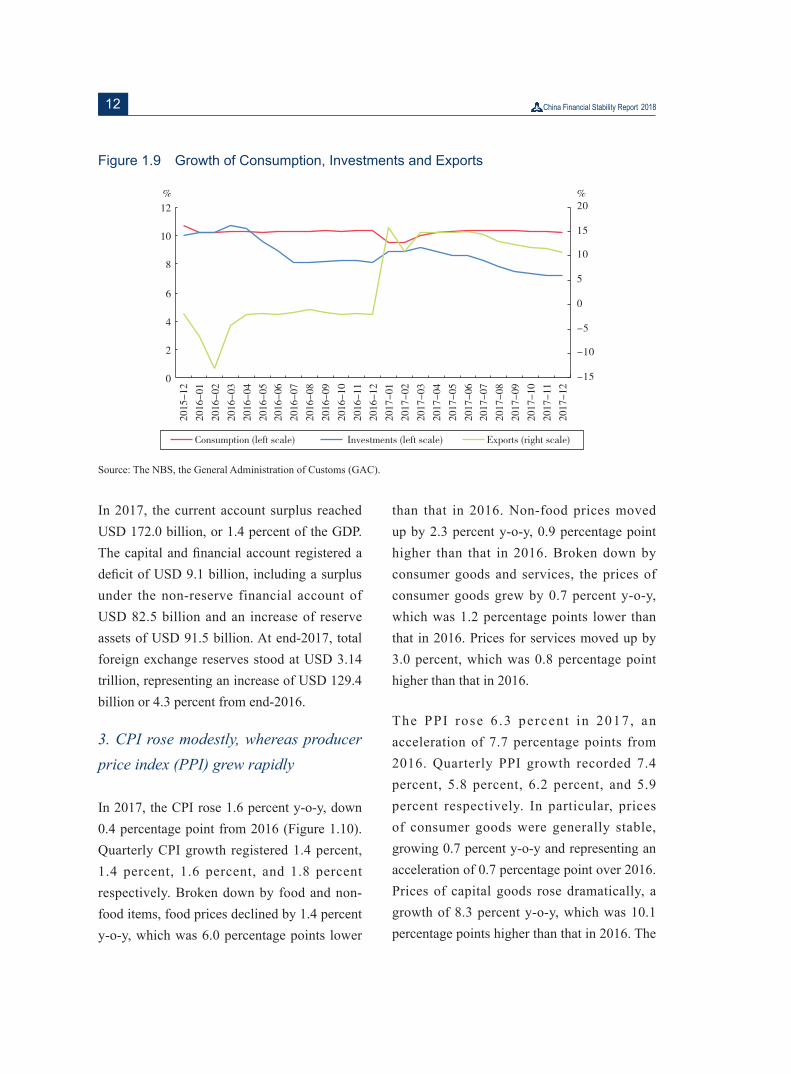
In 2017, fixed-asset investments (excluding those by rural households) reached RMB 63.17 trillion, up 7.2 percent y-o-y (Figure 1.9), which was 0.9 percentage point lower than that in 2016. Total retail sales grew by 10.2 percent y-o-y to RMB 36.63 trillion, a deceleration of 0.2 percentage point from 2016. Goods imports and exports reached RMB 27.79 trillion, up 14.2 percent y-o-y, which represented a
turnaround of consecutive declines in the previous two years. Among this total, exports gained 10.8 percent y-o-y to RMB 15.33 trillion, and imports grew 18.7 percent y-o-y to RMB 12.46 trillion, resulting in a trade surplus of RMB 2.87 trillion. The demand structure continued to improve. In 2017, contribution of final consumption to the GDP reached 58.8 percent, about 26.7 percentage points higher than that of capital formation. Net exports of goods and services contributed 9.1 percent to GDP growth, a reversal of negative contribution in the previous two years.
12
Figure 1.9 Growth of Consumption, Investments and Exports
Source: The NBS, the General Administration of Customs (GAC).
In 2017, the current account surplus reached USD 172.0 billion, or 1.4 percent of the GDP. The capital and financial account registered a deficit of USD 9.1 billion, including a surplus under the non-reserve financial account of USD 82.5 billion and an increase of reserve assets of USD 91.5 billion. At end-2017, total foreign exchange reserves stood at USD 3.14 trillion, representing an increase of USD 129.4 billion or 4.3 percent from end-2016.
3. CPI rose modestly, whereas producer price index (PPI) grew rapidly
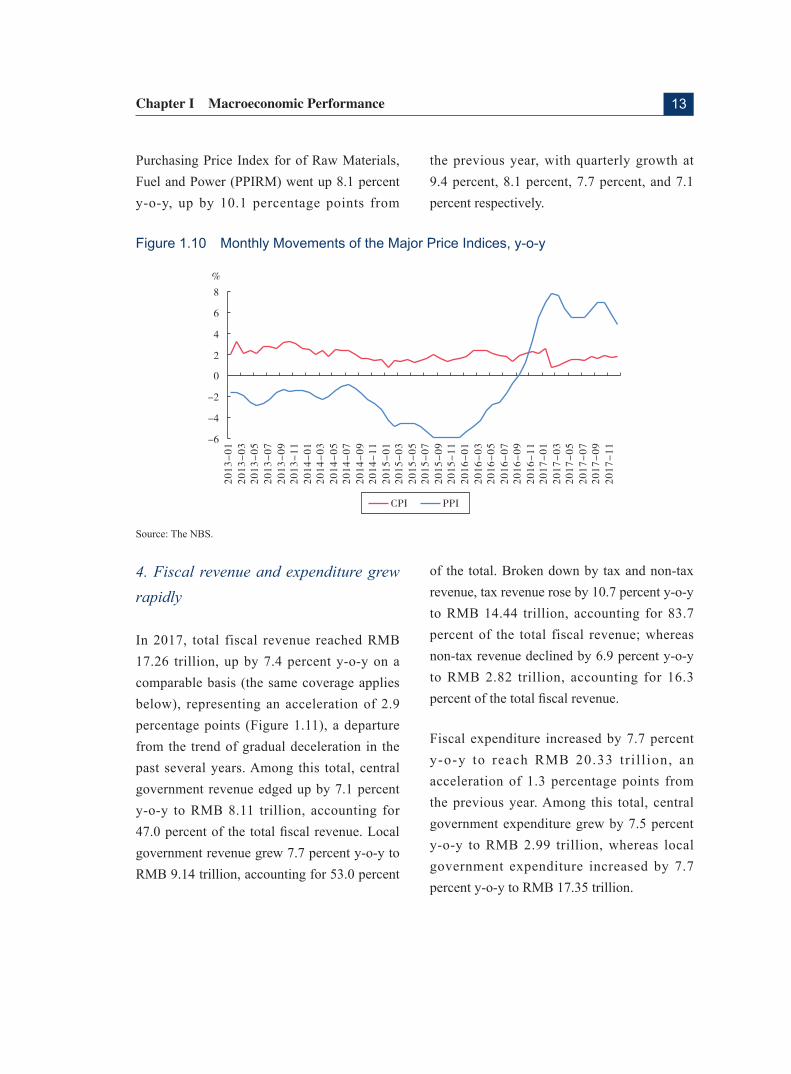
In 2017, the CPI rose 1.6 percent y-o-y, down 0.4 percentage point from 2016 (Figure 1.10). Quarterly CPI growth registered 1.4 percent, 1.4 percent, 1.6 percent, and 1.8 percent respectively. Broken down by food and non-food items, food prices declined by 1.4 percent y-o-y, which was 6.0 percentage points lower
than that in 2016. Non-food prices moved up by 2.3 percent y-o-y, 0.9 percentage point higher than that in 2016. Broken down by consumer goods and services, the prices of consumer goods grew by 0.7 percent y-o-y, which was 1.2 percentage points lower than that in 2016. Prices for services moved up by 3.0 percent, which was 0.8 percentage point higher than that in 2016.
The PPI rose 6 .3 percent in 2017, an acceleration of 7.7 percentage points from 2016. Quarterly PPI growth recorded 7.4 percent, 5.8 percent, 6.2 percent, and 5.9 percent respectively. In particular, prices of consumer goods were generally stable, growing 0.7 percent y-o-y and representing an acceleration of 0.7 percentage point over 2016. Prices of capital goods rose dramatically, a growth of 8.3 percent y-o-y, which was 10.1 percentage points higher than that in 2016. The
13Chapter I Macroeconomic Performance
Purchasing Price Index for of Raw Materials, Fuel and Power (PPIRM) went up 8.1 percent y-o-y, up by 10.1 percentage points from
the previous year, with quarterly growth at 9.4 percent, 8.1 percent, 7.7 percent, and 7.1 percent respectively.
Figure 1.10 Monthly Movements of the Major Price Indices, y-o-y
Source: The NBS.
4. Fiscal revenue and expenditure grew rapidly
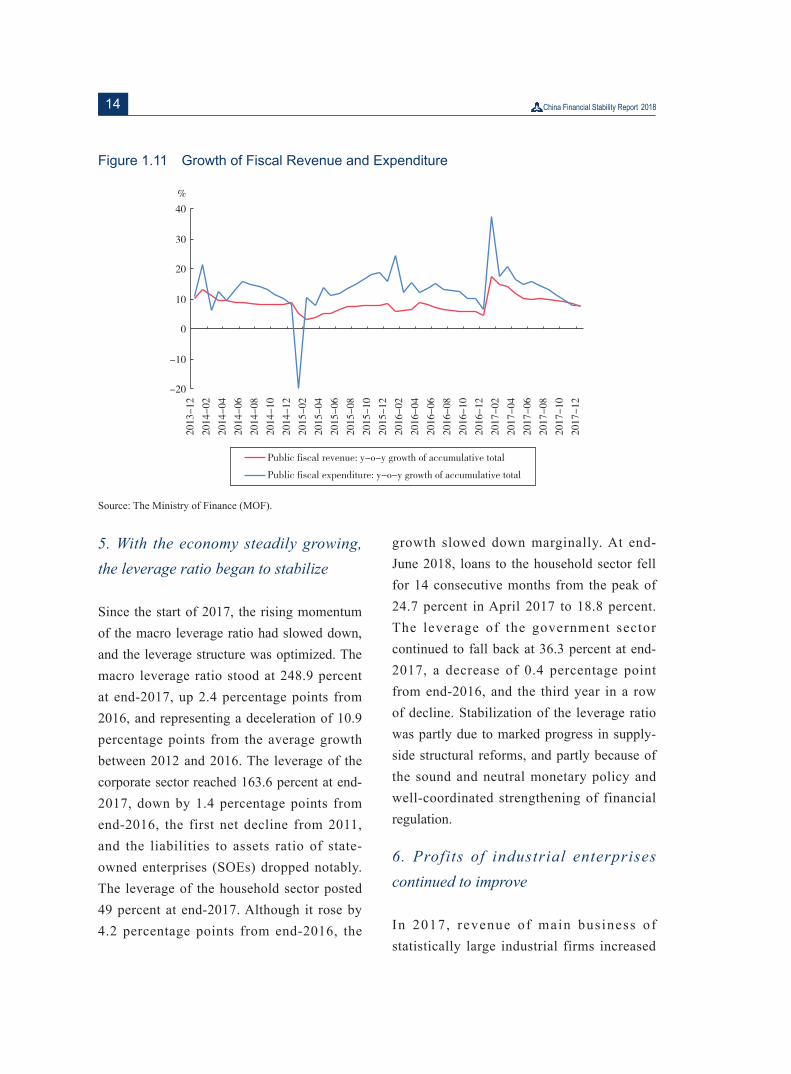
In 2017, total fiscal revenue reached RMB 17.26 trillion, up by 7.4 percent y-o-y on a comparable basis (the same coverage applies below), representing an acceleration of 2.9 percentage points (Figure 1.11), a departure from the trend of gradual deceleration in the past several years. Among this total, central government revenue edged up by 7.1 percent y-o-y to RMB 8.11 trillion, accounting for 47.0 percent of the total fiscal revenue. Local government revenue grew 7.7 percent y-o-y to RMB 9.14 trillion, accounting for 53.0 percent
of the total. Broken down by tax and non-tax revenue, tax revenue rose by 10.7 percent y-o-y to RMB 14.44 trillion, accounting for 83.7 percent of the total fiscal revenue; whereas non-tax revenue declined by 6.9 percent y-o-y to RMB 2.82 trillion, accounting for 16.3 percent of the total fiscal revenue.
Fiscal expenditure increased by 7.7 percent y-o-y to reach RMB 20.33 tr i l l ion, an acceleration of 1.3 percentage points from the previous year. Among this total, central government expenditure grew by 7.5 percent y-o-y to RMB 2.99 trillion, whereas local government expenditure increased by 7.7 percent y-o-y to RMB 17.35 trillion.
14
Figure 1.11 Growth of Fiscal Revenue and Expenditure
Source: The Ministry of Finance (MOF).
5. With the economy steadily growing, the leverage ratio began to stabilize
Since the start of 2017, the rising momentum of the macro leverage ratio had slowed down, and the leverage structure was optimized. The macro leverage ratio stood at 248.9 percent at end-2017, up 2.4 percentage points from 2016, and representing a deceleration of 10.9 percentage points from the average growth between 2012 and 2016. The leverage of the corporate sector reached 163.6 percent at end-2017, down by 1.4 percentage points from end-2016, the first net decline from 2011, and the liabilities to assets ratio of state-owned enterprises (SOEs) dropped notably. The leverage of the household sector posted 49 percent at end-2017. Although it rose by 4.2 percentage points from end-2016, the
growth slowed down marginally. At end-June 2018, loans to the household sector fell for 14 consecutive months from the peak of 24.7 percent in April 2017 to 18.8 percent. The leverage of the government sector continued to fall back at 36.3 percent at end-2017, a decrease of 0.4 percentage point from end-2016, and the third year in a row of decline. Stabilization of the leverage ratio was partly due to marked progress in supply-side structural reforms, and partly because of the sound and neutral monetary policy and well-coordinated strengthening of financial regulation.
6. Profits of industrial enterprises continued to improve
In 2017, revenue of main business of statistically large industrial firms increased
15Chapter I Macroeconomic Performance
a Due to adjustment of sample enterprises, updating of financial data and other reasons, data for end-2016 in this report are newly published and adjusted, and there may be some differences between these data and those used in the previous annual report.
by 11.1 percent y-o-y to RMB 116.5 trillion. Cost of their main business grew by 10.8 percent y-o-y to RMB 98.9 trillion. Realized profits totaled RMB 7.52 trillion, up by 21 percent y-o-y, representing an acceleration of 12.5 percentage points. The profit margin of the main business posted 6.46 percent, an improvement of 0.54 percentage point y-o-y. Among the 41 industrial categories, 37 earned more profits than in the previous year, one industry remained unchanged, and 11 witnessed declines in gross profits.
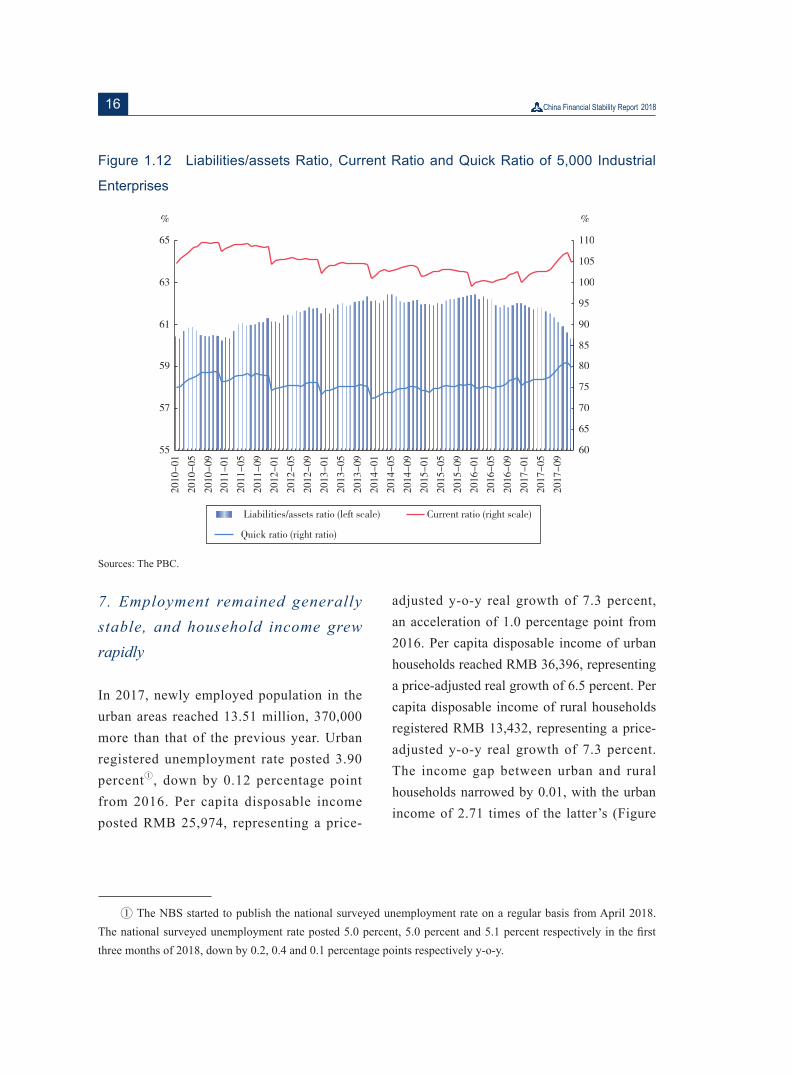
According to the PBC Survey of 5,000 Industrial Enterprises, business operations continued to improve. Revenue of the main business and profits of the sampled enterprises increased. Revenue of the main business of the sampled enterprises improved by 13.7 percent in 2017, an acceleration of 12.5 percentage points from 2016a. Gross profits grew by 46.4 percent y-o-y, 19.1 percentage points larger compared to that in 2016. In
terms of asset turnover, in 2017, the inventory turnover ratio of the sampled enterprises improved slightly from the last year, whereas the total asset turnover ratio was on a par with that in the previous year. The operating cycle was shortened. In 2017, the inventory turnover ratio of 5,000 industrial enterprises posted 5.3 times, up by 0.3 times from 2016; whereas the total asset turnover ratio was 0.8 times, on a par with that in 2016. The operating cycle was 133 days, 8 days fewer than that of the previous year. The liabilities/assets ratio declined modestly, and the long-term repayment capability improved. At end-2017, the liabilities/assets ratio dropped by 1.7 percentage points from 2016 to 60.3 percent. The current ratio was 104.7 percent, an increase of 4.8 percentage points from end-2016. The quick ratio was 79.5 percent, gaining 4.2 percentage points y-o-y (Figure 1.12). The interest coverage multiplier was 5.6 times, up 1.9 times y-o-y.
16
Figure 1.12 Liabilities/assets Ratio, Current Ratio and Quick Ratio of 5,000 Industrial
Enterprises
Sources: The PBC.
7. Employment remained generally stable, and household income grew rapidly
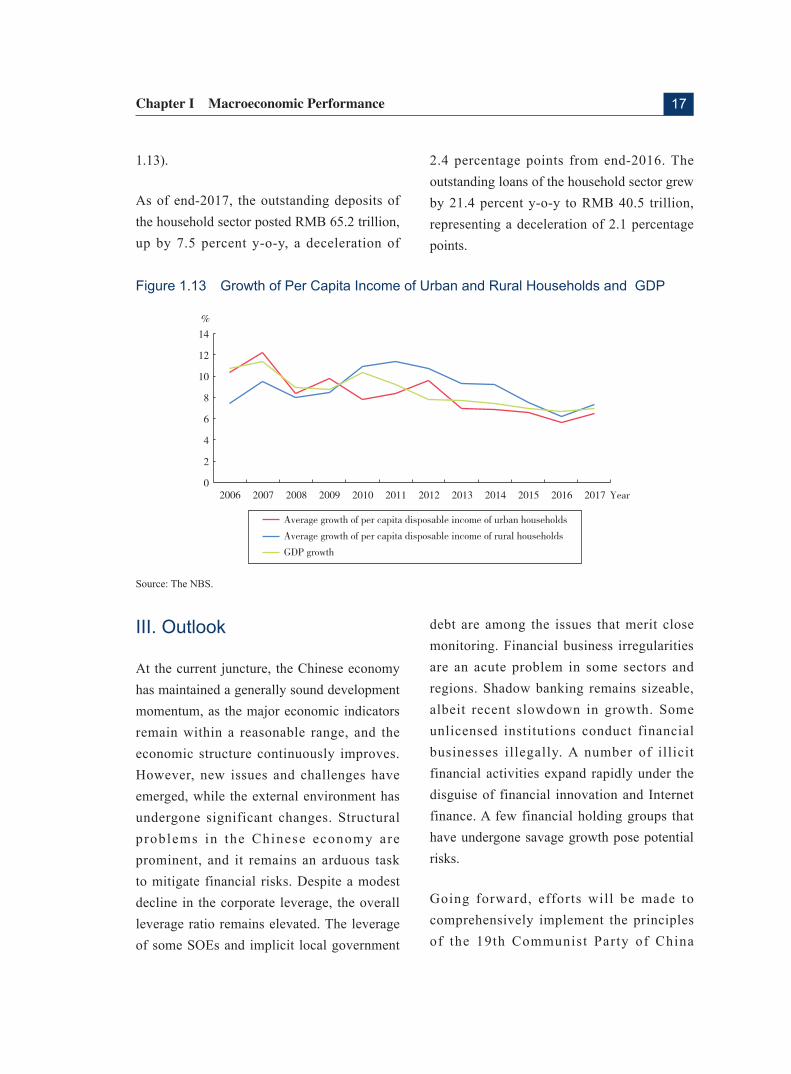
In 2017, newly employed population in the urban areas reached 13.51 million, 370,000 more than that of the previous year. Urban registered unemployment rate posted 3.90 percenta, down by 0.12 percentage point from 2016. Per capita disposable income posted RMB 25,974, representing a price-
adjusted y-o-y real growth of 7.3 percent, an acceleration of 1.0 percentage point from 2016. Per capita disposable income of urban households reached RMB 36,396, representing a price-adjusted real growth of 6.5 percent. Per capita disposable income of rural households registered RMB 13,432, representing a price-adjusted y-o-y real growth of 7.3 percent. The income gap between urban and rural households narrowed by 0.01, with the urban income of 2.71 times of the latter’s (Figure
a The NBS started to publish the national surveyed unemployment rate on a regular basis from April 2018. The national surveyed unemployment rate posted 5.0 percent, 5.0 percent and 5.1 percent respectively in the first three months of 2018, down by 0.2, 0.4 and 0.1 percentage points respectively y-o-y.
17Chapter I Macroeconomic Performance
1.13).
As of end-2017, the outstanding deposits of the household sector posted RMB 65.2 trillion, up by 7.5 percent y-o-y, a deceleration of
2.4 percentage points from end-2016. The outstanding loans of the household sector grew by 21.4 percent y-o-y to RMB 40.5 trillion, representing a deceleration of 2.1 percentage points.
Figure 1.13 Growth of Per Capita Income of Urban and Rural Households and GDP
Source: The NBS.
III. Outlook
At the current juncture, the Chinese economy has maintained a generally sound development momentum, as the major economic indicators remain within a reasonable range, and the economic structure continuously improves. However, new issues and challenges have emerged, while the external environment has undergone significant changes. Structural problems in the Chinese economy are prominent, and it remains an arduous task to mitigate financial risks. Despite a modest decline in the corporate leverage, the overall leverage ratio remains elevated. The leverage of some SOEs and implicit local government
debt are among the issues that merit close monitoring. Financial business irregularities are an acute problem in some sectors and regions. Shadow banking remains sizeable, albeit recent slowdown in growth. Some unlicensed institutions conduct financial businesses illegally. A number of illicit financial activities expand rapidly under the disguise of financial innovation and Internet finance. A few financial holding groups that have undergone savage growth pose potential risks.
Going forward, efforts will be made to comprehensively implement the principles of the 19th Communist Party of China
18
(CPC) National Congress, strengthen the leadership of the CPC Central Committee on economic affairs under the guidance of the Xi Jinping thought on socialism with Chinese characteristics for a new era, stick to the overall requirement of seeking progress amidst stability as well as the new development philosophy, promote coordinated implementation of the five-sphere integrated plan and the four-pronged comprehensive strategy in light of the changes in the major contradiction in the Chinese society and the requirements of high-quality development, stick to the main theme of supply-side structural reforms, coordinate the work in stabilizing growth, promoting reforms, adjusting the structure, improving people’s welfare and mitigating risks, forcefully advance reform and opening-up, innovate and improve macro control, promote changes to quality, efficiency and the driving force of growth, make solid progress in the critical battles of forestalling and defusing major risks, well-targeted poverty alleviation and addressing pollution, guide and stabilize expectations, strengthen and improve people’s living standards, so as to promote healthy and sustained development of the economy and society.
Sticking to the general requirement of
seeking progress amidst stability. Various policies should be coordinated to strengthen synergy. The fiscal policy stance will remain proactive. Fiscal support to priority areas and projects needs to be ensured, and local government debt management will be earnestly strengthened. The sound and neutral monetary policy will continue. The money supply will
be properly managed to keep the growth of money, credit, and total financing within a reasonable range. The RMB exchange rate will be kept basically stable at a reasonable and equilibrium level. Measures will be taken to promote healthy development of a multi-layered capital market to better serve the real economy. Structural policies will play a bigger role in strengthening attractiveness and competitiveness of the real economy, optimizing allocation of stock resources, making growth more innovation-driven, putting into full play the fundamental role of consumption, and promoting growth of efficient investments in particular that of private investments.
Forestalling and defusing major risks. A bottom-line thinking is needed in targeting the main conflicts, as efforts are made to seek progress amidst stability. The Financial Stability and Development Committee (FSDC) of the State Council will play a leading role by strengthening inter-agency coordination, clarifying the timetable and the roadmap, identifying priorities and focusing on issues that might have implications for social and economic stability or trigger systemic risks. Urgent efforts are needed to address regulatory gaps, effectively contain macro leverage and credit risks in the key areas, proactively dissolve risks emanating from shadow banking, prudently handle risks associated with various financial institutions, comprehensively rectify the regulation of the financial sector, stick to the bottom line of preventing systemic risks, and win the victory of the critical battle of mitigating major risks.
19Chapter I Macroeconomic Performance
Deepening supply-side structural reforms. The purpose is to change “Made in China” to “Created in China”, shift high growth speed to high growth quality, and upgrade China from a manufacturer of quantity to that of quality. Importance will be attached to improving the quality and efficiency of the supply system by deepening the reform of market-based allocation of production factors, reducing ineffective supply, disposing of zombie companies, and reducing overcapacity. New growth engines need to be forcefully cultivated by strengthening technological innovation, promoting optimization and upgrading of traditional industries, and developing a batch of innovative pacesetting companies. Cost of the real economy needs to be reduced significantly by cutting transaction cost caused by the current institutional arrangements.
Unleashing vitality of various market
players. Efforts should be made to strengthen, expand and increase returns on state-owned capital. To this end, the reform plans of SOEs and state-owned assets should be improved, with the focus laid upon administration of state-owned capital, accelerating the transformation of the functions of the supervision and administration agency of state-owned assets, and reforming the system of delegating the operating power of state-owned assets. Party leadership and party governance need to be strengthened at SOEs. Efforts will be made to improve the modern enterprise system of SOEs, and the corporate governance structure. Development of private enterprises will be supported by implementing the policy of property right protection, and lawfully
addressing cases involving disputes over property rights that have stirred up massive social opinions. The negative list for market entry will be comprehensively carried out and continuously improved by eliminating discriminative restrictions and various implicit obstacles and accelerating the forming of a new type of cordial and clean relationship between government and business.
Continuing to deepen reforms and further
opening up to the outside world. Efforts will be made to further advance the market-based interest rate and exchange rate reforms, improve the allocation efficiency of financial resources, and streamline financial regulation and management. The share of direct financing will be increased by promoting healthy development of a multi-layered capital market and strengthening institutions of the bond market. Macroprudential regulation will be strengthened. Measures will be taken to coordinate regulation of financial holding companies and systemically important financial institutions, strengthen coordinated regulation and interconnection of financial infrastructure, and promote comprehensive statistics of the financial sector and sharing of regulatory information. Corporate governance reform of financial institutions will be advanced, making them earnestly take responsibilities of risk management and contain occurrence of major criminal cases. A mutually beneficial opening-up strategy will be steadfastly carried out by attaching equal importance to bringing in and going global, with a view to making new ground in opening China further through links running eastward and westward,

20
across land and over sea. Market access will be significantly eased. In addition to implementing the already announced measures to relax the limits on foreign shareholding in the banking, securities and insurance sectors, the opening-up of the insurance sector will
be sped up, restrictions over incorporation of foreign-invested financial institutions will be relaxed, business scope of foreign-invested financial institutions will be broadened, and the areas for bilateral financial market cooperation will be expanded.
21Chapter I Macroeconomic Performance
Special Topic 1 Overview of Major Adjustments in Global Economic and Financial Policies
Despite the trend of synchronized global economic recovery in 2017, instabilities and uncertainties lingered amid notable spillover of the economic and financial policy adjustments across major developed economies. On the whole, key adjustments worth noting included the normalization of monetary policy across major developed economies, tax reform in the U.S. and corresponding spillover effects, as well as emerging trends of global trade protectionism and resultant risks.
I. Monetary Policy Normalization in Major Developed Economies and Spillover Effects
After the 2008 financial crisis, central banks across major developed economies successively carried out unconventional monetary policy featured by balance sheet expansion, in a bid to increase liquidity supply and support economic growth. In recent years, however, as the global real economy continues to recover and the adverse effects of the unconventional monetary policy proliferate, relevant economies have gradually stepped into monetary policy normalization.
1 . The Pa th o f Mone tary Po l i cy Normalization
Monetary policy normalization is a reversed
process of the unconventional monetary easing practices adopted post the crisis, and can be divided into two dimensions - interest rate policy and balance sheet policy. Key measures include:
Exit from quantitative easing (QE): The central bank scales down asset purchases gradually until the size of new purchase is reduced to zero; while at the same time, keeps reinvesting the principal of maturing securities, so the balance sheet of the central bank is relatively stable at this step.
Interest rate hikes: The central bank gradually increases the short-term target interest rate.
Balance sheet shrinking: The central bank ceases reinvesting the principal of some or all maturing securities so that the balance sheet will gradually shrink.
The tightening effects of the three measures above increase progressively. The exit of QE marks the end of unconventional monetary policy, and at this point, the policy environment remains accommodative and liquidity continues to increase, but the degree of easing is decreasing. Rate hikes and balance sheet reduction indicate the beginning of monetary policy tightening, accompanied by dwindling liquidity.
22
2. The Monetary Policy Normalization Process of Major Developed Economies
Due to varied economic recovery conditions across jurisdictions, the U.S., Japan and Euro area are currently at different stages of monetary policy normalization.
The U.S. Federal Reserve (U.S. Fed) runs at the forefront, with the QE tapering decision officially announced on December 18, 2013 and thoroughly completed by October 29, 2014. Since then, the Fed has started to phase in interest rate hikes in a prudent approach, and after repeatedly signaling the market, the Fed raised the federal funds target rate for the first time on December 17, 2015, followed by multiple hikes down the road. Entering 2018, the Fed raised the federal funds target rate to 2-2.25 percent via three interest rate hikes on March 22, June 14 and September 27, respectively. Market participants widely anticipate that the Fed will raise the interest rate one more time by the end of this year. In terms of balance sheet shrinking, the Fed announced detailed unwinding plans in September 2017, starting with initial monthly reduction caps of USD 6 billion in U.S. Treasury securities (USTs) and USD 4 billion in mortgage-backed securities (MBS). The caps will be raised in equal steps each quarter until they reach USD 30 billion in USTs and USD 20 billion in MBS per month, and will remain so until the Federal Open Market Committee (FOMC) judges that the Fed is holding no more securities than necessary to implement monetary policy effectively.
The policy normalization process of the European Central Bank (ECB) is slower than that of the U.S. Fed. During the June meeting, the ECB decided to keep the three major interest rates unchanged, maintain monthly bond purchases of EUR 30 billion till September, and cut bond-buying by EUR 15 billion every month form October to December before eventually exiting from QE by the end of 2018. The ECB plans to maintain current interest rates unchanged until at least the summer of 2019.
The normalization progress of the Bank of
Japan (BoJ) is relatively slow. Although the BoJ has not announced its intention on ending QE, evidence can be found at the operational level that the government bond purchases are slowing down. According to the BoJ, the size of bond-buying is subject to the need of fine-tuning the target bond yield, and may go up and down. It trimmed bond purchases because the 10-year bond yield has basically stabilized at a target level slightly above 0, not because it is starting to exit from accommodative monetary policy.
3. Implications and Potential Risks
Theoretically, interest rate policy targets on short-term interest rates, and passes through to the medium and long-term interest rates, which, in turn, will affect financing costs, inflation and exchange rates. Balance sheet policy has the most immediate impact through asset supply and demand channels. With continuous declines in the amount of bond purchases and the gradually ceasing
23Chapter I Macroeconomic Performance
of principal reinvestments, newly issued bonds may face a decline in market demand, therefore will drive up bond yield and maturity premium. Meanwhile, balance sheet policy could also affect the economy through liquidity channels. Ceasing principal reinvestment of maturing securities will drain excess reserve in the banking system, and cause liquidity shrinkage in the financial system. Under the current backdrop, potential risks resulting from excessively fast monetary tightening across developed economies warrant vigilance.
Global financial markets may be shifted. Excessive global liquidity and generally higher investor risk appetite since the 2008 financial crisis lead to elevated financial asset prices and simmering risks of bubbles. Monetary policy normalization of major central banks could directly push up short-term interest rates, resulting in an increase in long-term interest rates. The tightening of the financial environment may trigger a global financial market adjustment. Additionally, if policy communication was insufficient during the normalization process, that would distort investor expectations and further exacerbate financial market volatility.
The pace of global economic recovery could
be impacted. An increase in interest rates resulting from monetary policy normalization will heighten the debt repayment pressure of the household sector and raise the financing costs of the real economy, which may weigh on consumer spending and corporate willingness to invest. Pushing the normalization process too fast could disrupt the pace of global
economic recovery.
Prominent negative spillover effects may be
seen on emerging market (EM) economies. EM economies are more vulnerable to global liquidity changes.Some EM countries already suffered local currency depreciation and falling asset prices when the U.S. announced its withdrawal from QE in 2013. As major developed economies push ahead with monetary policy normalization, the interest spreads between developed and emerging markets may widen, causing funds to flow back to developed economies and imposing negative spillover effects on EM economies. Emerging economies with large external debt and greater economic vulnerability are more vulnerable to shocks.
II. U.S. Tax Reform and Spillover Effects
The Trump administration launched tax reform plans effective in January 2018 to reduce tax burdens, repatriate overseas profits, boost the manufacturing sector and improve the U.S. international competitiveness.
1. Tax Reform Bill Overview and Impact
Individual income taxes. 1) Retaining seven tax brackets and reducing the top rate from 39.6 percent to 37 percent; 2) Retaining the estate tax but doubling the exemption from USD 5.49 million to USD 10.98 million; 3) Setting a ceiling of USD 10,000 tax credits for federal and local itemized deductions; 4) Setting a USD 750,000 deduction cap for
24
mortgage interest payments; 5) Retaining the personal alternative minimum tax and raising the exemption amount; 6) Abolishing the Obamacare’s individual mandate to reduce the fiscal deficit by USD 338 billion over the coming decade. In addition, the tax reform bill nearly doubled the personal standard deduction, abolished the personal exemption of USD 4,050 and significantly raised the child tax credit. As the Senate is constrained by budget rules, the above measures are not permanently effective and will last till 2025.
Corporate taxes. 1) Cutting the corporate income tax (CIT) rate from 35 percent to 21 percent; 2) Capping the deductible corporate interest expenses to 30 percent of earnings before interest, taxes, depreciation and amortization (EBITDA) in the first four years of the tax bill, and 30 percent of earnings before interest and taxes (EBIT) thereafter; except for regulated utilities and real estate sectors with great reliance on debt financing; 3) Allowing full expensing of incremental capital investments for five years, and phasing out the preferential policy thereafter; 4) Retaining the tax rate unchanged for pass-through entities (i.e. sole proprietorships or partnerships taxed at the shareholder’s personal income tax rate) and allowing a 20 percent deduction for eligible pass-through income.
Foreign earnings. 1) Introducing a territorial tax system, under which the portion of dividends and undistributed profits repatriated by overseas subsidiaries to form U.S. assets will be tax-free; 2) Applying a one-off rate on aggregate foreign earnings, whether repatriated
or not, at a 15.5 percent rate for cash and cash equivalents and 8 percent for non-current assets; 3) Enacting the “global intangible low-taxed income (GILTI)” regime to dissuade multi-national corporations (MNCs) from shifting production and investments to tax havens; and 4) Creating an anti-base erosion provision via a base erosion anti-abuse tax (BEAT) to restrict MNCs from taking advantage of tax loopholes and avoiding paying taxes.
Impact of the tax reform on the U.S.
economy. The Trump administration’s tax reform is primarily aimed at stimulating economic growth. As a large-scale fiscal stimulus, tax cuts will have a stimulating effect on the U.S. economy in the short term. According to the Trump administration, the reform could help spur growth and broaden the tax base without expanding fiscal deficit. However, some argues that large-scale fiscal stimulus, instead of significantly boosting total output, may push up inflation and prompt the U.S. Fed to accelerate rate hikes, given that the U.S. economy is very close to full employment. The effect of the tax reform in broadening the tax base is not that obvious either, and therefore will substantially raise government debt levels. In the medium to long term, rising government debt and interest rates will have a crowding-out effect on private sector investment and consumption, and affecting the sustainability of U.S. economic growth. According to the Joint Committee on Taxation (JCT) of the U.S. Congress, the tax reform would increase U.S. GDP by only about 0.7 percent over the 10-year budge window,
25Chapter I Macroeconomic Performance
but net tax reduction of USD 1.5 trillion during the same period would expand U.S. deficit by USD 1 trillion even if the broadened tax base is priced in. The JCT also stressed that the tax reform would mainly benefit high-income groups who enjoy greater tax cuts than the low-/middle-income class. This could widen the gap between the rich and the poor.
2. Spillover Effects of U.S. Tax Reform
A double-edged sword for the U.S. dollar
exchange rate. In the short term, the tax reform will strengthen fiscal stimulus to the U.S. economy, while the U.S. Fed is currently in the midst of a rate hike. The dollar will be well supported by rising interest rates under the policy combination of fiscal easing and monetary tightening. In the medium to long term, however, a potential increase in U.S. fiscal and trade deficits could put downside pressure on the greenback if the tax cuts fail to boost economic growth or broaden the tax base significantly.
Moderate impact on capital flows. Shifting from the worldwide corporate tax system to a territorial tax system could discourage U.S. companies from retaining profits overseas to avoid U.S. taxation. To some extent, this could increase repatriation of funds by MNCs into the U.S. However, the tax exemption only applies to the portion of dividends and undistributed profits repatriated by overseas subsidies to form U.S. assets. Whether it will attract large-scale repatriation of overseas profits remains to be seen, and the likelihood of large-scale fund inflows into the U.S. stays low. Additionally,
most of the offshore cash and cash equivalents of U.S. companies are held in the form of U.S. dollars or USD-denominated securities. Even if the profits are repatriated to the U.S., they would mainly affect the circulation of offshore U.S. dollars rather than the exchange rate to other currencies.
III. Trend and Risk Analysis of Global Trade Protectionism
After the 2008 financial crisis, there is a rising trend of anti-globalization manifested by growing populist influence politically and trade protectionism economically. In particular, the global trade frictions started by the U.S. with other countries including China and Canada have disrupted the economic and financial rehabilitation plans across countries, bringing material adverse impacts on and uncertainties to the global economy and finance. This will not only disrupt the world’s major commodities supply chain, but also weaken market confidence, distort investor expectations, and intensify global financial market volatility. Consequently, it increases the likelihood that China’s financial markets and systems may fluctuate drastically as a result of external shocks.
1. Latest Trends of Trade Protectionism
The U.S. exiting or renegotiating multilateral trade agreements. As part of his “100-day plan” after inauguration, U.S. President Trump proposed to withdraw from the Trans-Pacific Partnership (TPP) and officially did so in January 2017. The U.S. formally kicked
26
off the renegotiation of the North American Free Trade Agreement (NAFTA) with Canada and Mexico in 2017 without reaching any agreement despite multiple rounds of talks about a revision of the NAFTA. The tariff levies by the U.S. on Canadian steel, aluminum and other products announced in June 2018 have inflamed the trade friction between the U.S. and Canada.
Trade frictions between the U.S. and the EU. On March 22, 2018, the U.S. announced that it would impose tariffs of 25 percent and 10 percent on imported steel and aluminum, respectively, and was criticized by the EU and related member countries. On March 26, the European Commission announced safeguard measures concerning imported steel, a move seen as a counter-measure against the U.S. prior policy. On June 6, the EU and Canada filed a complaint with the World Trade Organization (WTO) regarding U.S. steel and aluminum tariffs. On July 25, U.S. President Trump and President Juncker of the European Commission issued a joint statement, pledging to push forward zero tariffs and abolish trade barriers. However, there are some difficulties in fulfilling relevant commitments, and no substantive progress has been made so far.
T h e U . S . c o n d u c t e d S e c t i o n 3 0 1
investigation against China and proposed trade protection measures. The Office of the U.S. Trade Representative (USTR) launched the Section 301 Investigationa against China in August 2017 and issued findings in March 2018 that the Chinese government had “unreasonable” or “discriminatory” policies and measures in the protection of intellectual property rights, causing at least USD 50 billion in annual losses to the U.S. economy. Therefore, in April, the U.S. proposed to impose an additional 25 percent tariff on specific goods imported from China. Based on the investigation results, the U.S. proposed protectionist measures against China in March 2018, including levying large-scale tariffs on goods imported from China; the USTR Office suing China for violating the WTO technology licensing rules; the U.S. Treasury Department taking the lead in introducing programs to restrict Chinese companies from investing in important U.S. industries and technologies. China and the U.S. have had multiple rounds of trade consultations since March 2018 in a bid to resolve disputes and achieve win-win outcomes. On May 19, the U.S. and China trade consultation delegations issued a joint statement announcing a consensus on taking effective measures to substantially reduce the U.S. trade deficit with China. However, the U.S. disregarded the consensus by declaring
a
a The Section 301 Investigation was born during the Cold War last century and was derived from Section 301 of the U.S. Trade Act of 1974, which provides that the U.S. could initiate any measures (usually including a suspension of the trade agreement, import restrictions such as tariffs, cancellation of tax exemption and forced signing of agreements) when the USTR Office confirms that a trading partner’s policy violates a trade agreement or is unilaterally determined by the United States to be unfair, unjust or unreasonable.
27Chapter I Macroeconomic Performance
a 25 percent tariff on USD 50 billion worth of Chinese goods on June 15, with the first tranche (25 percent tariffs on USD 34 billion Chinese goods) effective on July 6. On August 7, the U.S. government announced the second tranche (25 percent tariffs on USD 16 billion Chinese goods) , which would be effective on August 23. Although a majority of more than 300 stakeholders testified against tariffs during the USTR’s public hearings in late August regarding 25 percent tariffs on another USD 200 billion Chinese goods, the U.S. government went on to announce the USD 200 billion list on September 18 with a decision to impose 10 percent tariffs starting from September 24, and then increase to 25 percent from January 1, 2019. China has taken necessary countermeasures against the U.S. dogmatic trade protectionism while keeping an open mind, hoping to resolve the issue through dialogues and consultations on the basis of equality and integrity.
2. Cause Analysis of Trade Protectionism
In recent years, there are growing trade protectionism sentiments around the world due to persistent global trade imbalances, the cause of which is complicated and should not be simply blamed on “free trade” per se. Take the U.S. trade deficit with China for example.
Trade imbalances are structural issues.
China is at the tail end of the product value-added chain. In other words, Mainland China imports semi-finished products from Japan, South Korea and Taiwan, and then exports to the U.S. Statistically, Mainland China records
trade surpluse with the U.S. while trade deficits with Japan, South Korea and Taiwan. China’s trade surplus reflects the surplus of the entire East Asian with the U.S. Therefore, we need to look at the issue of China-U.S. trade imbalances from a multilateral perspective.
Trade imbalances are a reflection of
m a c r o e c o n o m i c i s s u e s . A c o u n t r y ' s macroeconomic accounts include current accounts, as well as government balance, investments, and private savings etc. As the U.S. government's fiscal deficits expand, current account deficits will inevitably expand in tandem to maintain the balance of the macroeconomic accounts. In addition, declining U.S. private savings rates will equally create difficulties to reduce the current account deficit.
The global trade landscape reflects the
comparative advantages of different
countries. Developing countries are apt to develop labor-intensive export industries given their cost advantages in resources and labor, while developed countries are better equipped to develop services trade due to their capital and technological strength. For example, the U.S. has a greater advantage in services trade, and is well positioned to sharpen its edge going forward with the opening-up of the services industry, which could help improve the current trade imbalances.
MNCs need to be cons idered when
measuring trade imbalances. The U.S. trade deficit with China has not taken into account the sales and profits earned by U.S. MNCs
28
in China. If this portion were included, the trade imbalances would have been greatly ameliorated.
In addition, current China-U.S. trade friction is peculiar in that the U.S. launched the attack against China on the ground of “compulsory technology transfers”, despite trade imbalances being the inherent cause. However, the U.S. 301 investigations fail to present any evidence of Chinese stipulation that foreign companies have to transfer technology to Chinese partners. In fact, China’s progress in intellectual property rights is not driven by the so-called “compulsory technology transfers”, but the result of heightened focus on innovation and increased R&D investments. The technology transfers to China by some American corporations are common business activities based on mutual selections and voluntary decisions between and by enterprises. China has thoroughly fulfilled its commitments since joining the WTO by consistently lowering the entry barrier for foreign investors and strengthening protection of intellectual property rights. Therefore, the U.S. accusation does not stand.
3. Risk Analysis
Disruption to the established landscape
of trade and labor division. The global trade landscape is the result of free market choices based on the factor endowment and comparative advantages of different countries. Government intervention will result in resource mismatch and inefficiency. In addition, an abrupt disruption to the established
trade and labor division pattern will lead to high transformation and adjustment costs, and create shocks to the labor market.
A no-win situation. For the target country, its exports will be adversely affected by the trade protection policy. For the protectionist country, it is actually protecting the export sector by sacrificing the interests of the import sector, as trade protection policy may push up the prices of imported goods and result in domestic inflation. Moreover, the target country may initiate countermeasures, which could cause a trade war and other chain reactions and eventually lead to a no-win situation.
Adverse consequences on the global
economy. History has proven that trade protection policies could have material negative impacts on the global economy. One of the causes of the Great Depression during 1929-1933 was the widespread adoption of beggar-thy-neighbor policy and tariff increases. Protectionist measures will affect global resource allocation, increase import costs and weigh on the real economy, especially at a time when the global economy recovery is at dawn. According to the World Bank, a broad-based increase of tariffs up to the legally allowed bound rates could result in a 9 percent decline in global trade, similar to the drop seen during the 2008-2009 financial crisis. Trade protectionism may also increase global investment barriers and impact the foreign exchange, equities and commodities markets.
Impact on investor sentiment worth-noting
despite limited direct consequences on the

29Chapter I Macroeconomic Performance
Chinese economy. According to estimates by some international investment banks and research institutions, the 25 percent tariff on USD 200 billion of Chinese exports on top of the USD 50 billion list could drag China’s GDP growth by a moderate 0.2-0.5 percent.
However, the impact of the China-U.S. trade frictions on investor sentiment is hard to quantify, and potential risks associated with irrational fluctuations of domestic financial markets due to the proliferation of investor pessimism deserve attention.
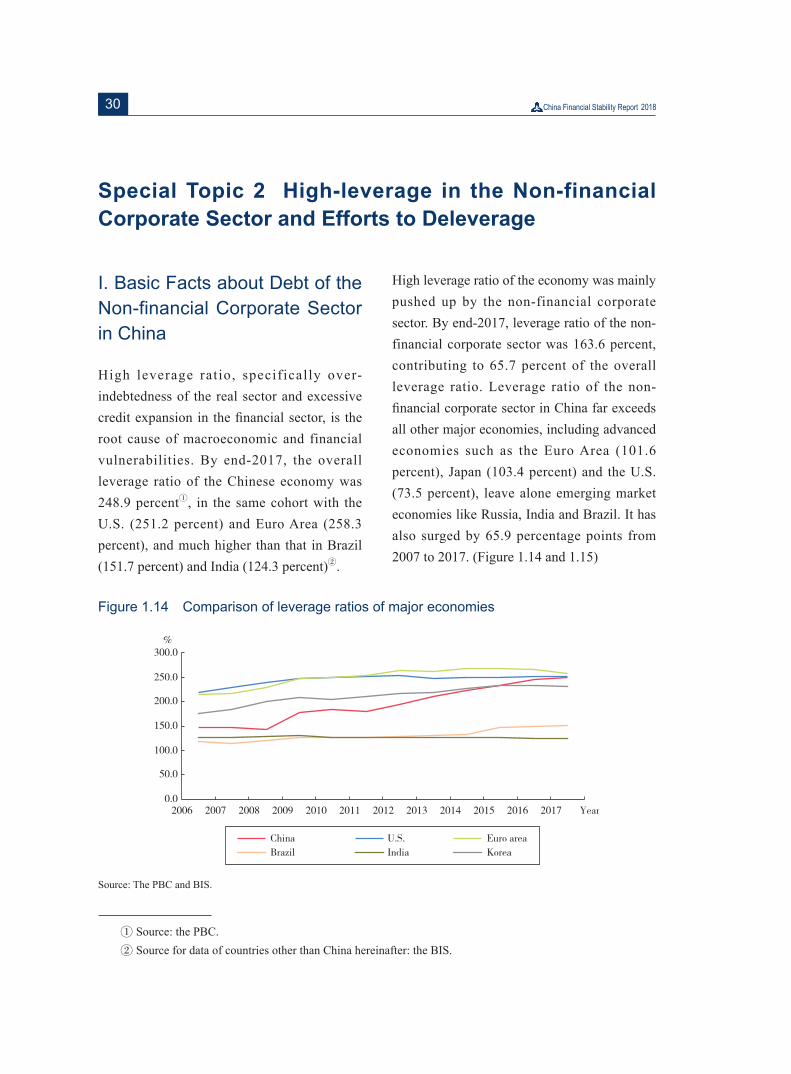
30
Special Topic 2 High-leverage in the Non-financial Corporate Sector and Efforts to Deleverage
I. Basic Facts about Debt of the Non-financial Corporate Sector in China
High leverage ratio, specifically over-indebtedness of the real sector and excessive credit expansion in the financial sector, is the root cause of macroeconomic and financial vulnerabilities. By end-2017, the overall leverage ratio of the Chinese economy was 248.9 percenta, in the same cohort with the U.S. (251.2 percent) and Euro Area (258.3 percent), and much higher than that in Brazil (151.7 percent) and India (124.3 percent)b.
High leverage ratio of the economy was mainly pushed up by the non-financial corporate sector. By end-2017, leverage ratio of the non-financial corporate sector was 163.6 percent, contributing to 65.7 percent of the overall leverage ratio. Leverage ratio of the non-financial corporate sector in China far exceeds all other major economies, including advanced economies such as the Euro Area (101.6 percent), Japan (103.4 percent) and the U.S. (73.5 percent), leave alone emerging market economies like Russia, India and Brazil. It has also surged by 65.9 percentage points from 2007 to 2017. (Figure 1.14 and 1.15)
Figure 1.14 Comparison of leverage ratios of major economies
Source: The PBC and BIS.
a Source: the PBC.b Source for data of countries other than China hereinafter: the BIS.
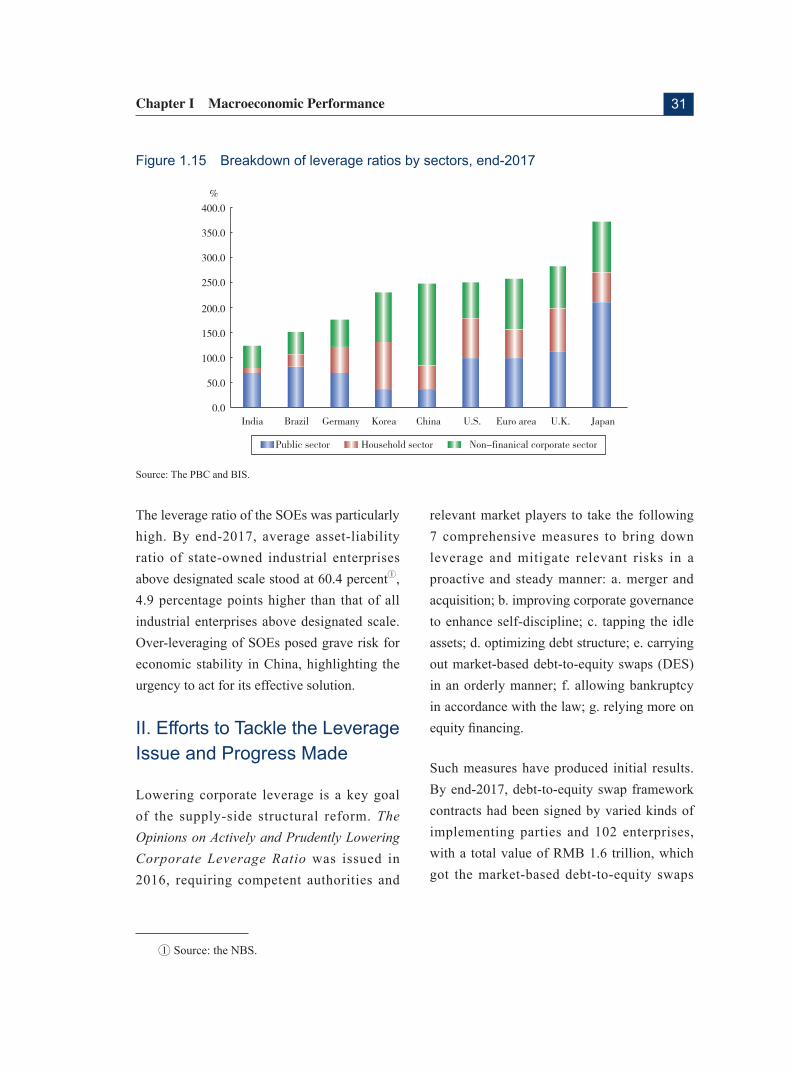
31Chapter I Macroeconomic Performance
Figure 1.15 Breakdown of leverage ratios by sectors, end-2017
Source: The PBC and BIS.
The leverage ratio of the SOEs was particularly high. By end-2017, average asset-liability ratio of state-owned industrial enterprises above designated scale stood at 60.4 percenta, 4.9 percentage points higher than that of all industrial enterprises above designated scale. Over-leveraging of SOEs posed grave risk for economic stability in China, highlighting the urgency to act for its effective solution.
II. Efforts to Tackle the Leverage Issue and Progress Made
Lowering corporate leverage is a key goal of the supply-side structural reform. The Opinions on Actively and Prudently Lowering Corporate Leverage Ratio was issued in 2016, requiring competent authorities and
relevant market players to take the following 7 comprehensive measures to bring down leverage and mitigate relevant risks in a proactive and steady manner: a. merger and acquisition; b. improving corporate governance to enhance self-discipline; c. tapping the idle assets; d. optimizing debt structure; e. carrying out market-based debt-to-equity swaps (DES) in an orderly manner; f. allowing bankruptcy in accordance with the law; g. relying more on equity financing.
Such measures have produced initial results. By end-2017, debt-to-equity swap framework contracts had been signed by varied kinds of implementing parties and 102 enterprises, with a total value of RMB 1.6 trillion, which got the market-based debt-to-equity swaps
a
a Source: the NBS.
32
(DES) to a good start. Further efforts to promote bankruptcy in accordance with the law have been made, which have facilitated market clearing, especially the clearing of the zombie enterprises. In 2017, 6257 bankruptcy cases were closed, much more than that in the past years. Further progress was made in improving modern corporate governance. The overarching “1+N” policy documents on deepening SOE reform were issued and put into operation. Ten reform pilots were carried out, including the approval of reform plans for 50 pilot enterprises of 3 batches to adopt mixed ownership. A system for overseeing and managing debt ratio of central government-led enterprises was set up. The size and share of equity financing expanded further. Outstanding value of equity financing of non-financial corporate sector registered RMB 6.85 trillion by end-2017, accounting for 3.8 percent of stock Total Social Financing, which was 0.1 percentage point higher year on year.
Such measures had put the leverage ratio of China’s non-financial corporate sector on a stable path skewing downward, and risks arising from indebtedness also trended down. Generally speaking, by end-2017, leverage ratio of non-financial corporate sector posted 163.6 percent, which was 1.4 percentage point lower than that in 2016, declining for the first time since 2011. The implementation of DES helped the target enterprises to mitigate insolvency risks, lower financial burden as well as enhance market confidence. The adoption of mixed ownership reform of SOEs introduced more diversified equity investment, lowered asset liability ratio and facilitated
better corporate governance.
III. Difficulties Ahead and Steps Forward
Despite of initial progress made, the situation of overleveraging of Chinese corporate sector is yet to be reversed fundamentally. Leverage ratio of non-financial corporate sector in China still stands higher than other major economies. And some enterprises are stressed by heavy financial burden and heightened risks arising from debt. Devoted efforts should be made to press ahead with deleveraging, especially to tackle problems and difficulties exposed in the process of implementation of debt-to-equity swaps.
1. Lack of adequate incentives for SOEs to deleverage
At present, SOEs’ liability to asset ratio remains prominently higher and declines slower than non-state owned enterprises, which could be a t t r ibuted to mult iple institutional factors. The SOEs are not adequately incentivized to deleverage due to imperfection of the capital replenishment mechanism, unsoundness of self-discipline and external restraints on assets and liabilities, and inadequate internal motivation to deleverage. Meanwhile, commercial banks have quite a strong preference over scale, the phenomenon of “piling up” of large customers prevailed, and their credit extension overconcentrated in large state-owned enterprises.
Therefore, efforts should be made to further
33Chapter I Macroeconomic Performance
enhance the institutional arrangements to facilitate deleveraging of SOEs. It is crucial that SOEs themselves should take the initiative in deleveraging. Specifically, the restraint mechanism on assets and liabilities should be improved, and adequate incentive and punishment measures should be put in place, in order to curb the impulse of excessive investments funded by lending of the SOEs. Such improvements would force SOEs to deleverage via various measures, and would also contribute to the overall SOE reform.
2.Approaches to conduct debt-to-equity swaps require further exploration
Looking at the experiences at home and abroad, as a way for restructuring, conducting DES encompasses multiple segments including restructuring of assets, businesses, finance and corporate governance framework. It is investment banking business in nature for financial institutions. Currently in China, performance of recipient enterprises in conducting DES and their needs were greatly nuanced and diversified. Swap solutions should be tailored to such needs in a market-oriented manner. There was no one-model-fits-all solution.
Market orientation is key to the success of DES. It should be up to the creditor banks, implementing institutions and the troubled companies to decide how to deal, as long as it was done in a market-oriented and lawful manner. Their exploration and creativity may be beneficial and should be respected. Institutions conducting DES should be allowed
flexibility in choosing the specific model for delivery, and be encouraged to explore various kinds of business models, with the precondition of effective risk prevention. Such models include but not limited to models such as returning equity after debt recovery, issuing stocks to pay off debt, repurchasing stocks as compensation for debt, etc. Only in this way could relevant stakeholders be adequately incentivized and could DES be delivered in a market-oriented manner for the long term.
3 . Mismatch be tween asse t s and liabilities of creditor banks involved in DES
Many creditor banks involved in DES financed equity investment on the assets side with wealth management products on the liability side, which may result in mismatches between assets and liabilities. In order to pay off wealth management investors at promised yields in agreed fixed term, institutions conducting DES always demanded troubled enterprises to commit buybacks of debt equities or made some similar requirements, so as to achieve the fixed returns in fixed term. They were actually still lending, rather than making equity investment, and therefore did not count as real shareholders. Such institutions did not have adequate incentive to participate in corporate governance, leave alone enhancing governance and profitability of troubled enterprises. The very goal of DES could not be achieved in this way.
Again, market orientation should be honored in the financing of DES. Private investment
34
should be mobilized and the role of private funding should be put into full play when introducing equity investment. In this case, qualified investors would be there to take the risks and enjoy the returns of DES, stripping relevant assets off banks’ balance sheets in real sense, and restraining behavior of troubled enterprises more effectively. China has a high savings rate and therefore an abundant pool of funds. To find better sources for market-based DES and lower its cost with the aim to lower corporate leverage, the key was to improve the long-term mechanism for converting savings into equity investment, promote the shift of the source of funding, and facilitate the accumulation of social capital. When the liability side was transformed to equity investment funds, investors would participate in corporate governance as shareholders. They would take risks and enjoy earnings without demanding fixed returns. That would be a solution to lower financing cost, make it unnecessary for equity investors to demand fixed returns, tackle the problem of 'de jure equity investment, de facto loans', and also facilitate equity exit.
4. Inadequate corporate governance
Inadequate corporate governance not only undermines healthy development of enterprises but also weakens the incentive for troubled enterprises to deleverage and for private investment to participate in DES. From the perspective of enterprises, operational and financial problems of SOEs in China could mainly be attributed to the fact that shareholders lost the controlling power of
enterprises. Discipline and constraints for board of directors and the management were absent, and some central SOEs excessively pursued ever larger market share via high leverage. They deemed deleveraging unnecessary, leave alone letting go of management power. From the perspectives of investors, since they were unable to play a role in corporate governance, it is evitable that they could only ask for fixed returns and set the date for exit, which made them degraded from equity investors to creditors in nature.
Sharing of controlling power underpins market-oriented DES. Shareholders must have the power to govern the enterprises; otherwise they would inevitably turn into creditors. Only when equity investors could play their due role in corporate governance and share the returns of their long-term development could success of DES be truly achieved. To deepen the development of market-oriented DES, the role of private equity (PE) funds in introducing equity investment could be put into full play. Institutions conducting DES should be supported in setting up PE funds, so as to facilitate long-term healthy development of market-based DES via tailoring business models to reality, designing sound framework and products, improving risk management and participating earnestly in corporate governance.
IV. Key Work for Next Stage
Setting up the modern corporate system by
improving corporate governance. Efforts should be made to replenish enterprises’ capital via expansion of capital and stocks,
35Chapter I Macroeconomic Performance
and introducing strategic investors, and to press ahead with mixed ownership reform. Market-oriented DES should be combined appropriately with setting up the modern corporate system and mixed ownership reform of SOEs. Policy measures should be taken to protect rights and interests of equity investors in DES, and make sure that institutions conducting DES could actively participate in governance of troubled enterprises.
Widening the channels for turning private
funding into equity investment. Equity investment institutions of various kinds would be supported in participating in market-oriented DES. Measures on raising low-cost, medium and long-term equity investment should be formulated. Policies on set-up of PE in the aim of market-based DES should be introduced. Studies on conducting DES transactions through the multi-tiered capital market would be carried out.
Enhancing capacity building of institutions
conducting DES. Financial institutions
would be guided to conduct DES via current institutional arrangements and state-owned capital investment and operation firms. Qualified banks and insurance firms would be supported to set up new implementing institutions, and asset management companies would be encouraged to strengthen their capital.
Improving the policy mechanism for debt
restructuring and bankruptcy. Creditor committees of financial institutions would be established and improved, so as to make concerted efforts in tackling debt distress of troubled enterprises. Efforts would be made to tackle the difficulties in filing bankruptcy cases, set up the bankruptcy system of related enterprises, study how to provide for bankruptcy expenses of “zombie enterprises”, and seek to es tabl ish a mechanism of speedy trial procedure for bankruptcy cases. Reasonable loss-sharing arrangements among the government, the corporate sector and the banks would be set up.
36
Special Topic 3 Analysis of the Local Government Implicit Debts
The Opinions of the State Counci l on Strengthening the Administration of Local Government Debts released in 2014 and the Budget Law promulgated in 2015 explicitly state that local government debts shall be subject to quota management, and that the issue size of local government debts shall be submitted by the State Council to the National People's Congress (NPC) or its Standing Committee for approval. Thereafter, local governments have accelerated the establishment of a well-regulated debt f inancing mechanism, with the aim of supporting economic and social growth through sound debt financing means, and facilitating the prevention and mitigation of fiscal and financial risks. These efforts have achieved initial results with the size of local government debts under effective control. However, there are still cases where local governments borrow in violation of relevant laws and regulations. Meanwhile, the emergence of new implicit debts for which local governments are liable warrants attention. Further efforts are needed to regulate the debt financing activities of local governments, and to prevent and mitigate risks associated with local government debts.
I. Efforts to Clear up Risks Associated with Local Government Explicit Debts and Enhance Regulation
As of end 2017, outstanding debts by local governments across China stood at RMB 16.47 trillion. Broken down by usage, general debts registered RMB 10.33 trillion, and special debts RMB 6.14 trillion. Broken down by debt financing methods, government bonds registered RMB 14.74 trillion, and other types of debts RMB 1.73 trillion. Throughout 2017, the issuance of local government bonds totaled RMB 4.36 trillion, out of which newly issued bonds account for RMB 1.59 trillion, and replacement bonds RMB 2.77 trillion. By usage, general bonds registered RMB 2.36 trillion, and special bonds RMB 2.0 trillion. Under requirement that outstanding stock of local government debts has to be aligned with the balance amount of end 2014, the size of debt stock for replacement has declined with the implementation of the debt swap scheme and local governments' efforts to clear up outstanding debts. In 2017, bonds issued by local governments to replace outstanding
37Chapter I Macroeconomic Performance
debts decreased by RMB 2.11 trillion year on year, whereas new bond issuance within quota increased by RMB 420 billion. By the end of 2017, local governments have issued RMB 10.9 trillion replacement bonds in total. The debt stock that has not been replaced stands at RMB 1.73 trillion.
From 2015 to 2017, the central government has launched a sizable debt replacement program for local governments , while strengthening regulation and conducting clear-up of illegitimate debt financing activities. The regulation on and control over debts have worked well, and risks generally remain under control. According to statistics by the Bank for International Settlements (BIS), as of end 2017, the leverage ratio of the government sector in China was 47 percent, far lower than the average 100.9 percent in advanced economies and even lower than the average 49 percent in emerging market economies.
II. Risks Associated with Local Government Implicit Debts
In 2015 the new Budget Law came into force, which stipulates that all local government debts should be included in the budgetary management. The only legit imate debt financing method is to issue local government bonds, which will be subject to a cap under the quota control. In this context, some local governments have strong impulse to engage in illegitimate financing activities. Meanwhile, financial institutions are proactive to lend to local governments through shadow banks. As a result, implicit debts for which local
governments are liable have risen rapidly in previous years, posing significant risks. In particular, the risks associated with local government implicit debts are as follows:
1. Both Supply- and Demand-side Factors Contribute to Difficulties in Scaling Down Local Government Debts
On the one hand, local governments have a strong demand to borrow. In order to bolster economic growth through investments in infrastructure and to ensure various expenditures on people’s well-being, they have to resort to increased leverage with the absence of adequate fiscal resources. On the other hand, financial institutions tend to lend to projects with government backgrounds. For one, there is widespread “government creditworthiness illusion” among financial institutions that government projects are fiscally backed and are therefore high in asset quality. For another, government-related loans are large in volume, which represents lower marketing and administrative costs than loans to medium, small and micro-sized enterprises.
According to a survey by the People’s Bank of China (PBC) on province X, due to declining private investments in Province X, government investments have become the main driver of economic growth, resulting in a widening fiscal deficit. Among counties and cities in this province, more than three fifths have a reliance of over 70 percent on subsidies from governments of higher hierarchies, which created a strong impulse for these local governments to borrow, and a concentration
38
of credit resources to government-backed projects. Despite significant de-leveraging campaign across the country, new loans to government-backed projects by over half of the banking institutions in Province X increased rather than decreased in 2017.
2. Implicit Debts Are Difficult to Look through, Rapid in Growth and Large in Size
At present, local government implicit debts lack uniform identification and statistical standards. Implicit debts are financed through a range of channels including platform companies, service purchases, public-private partnership (PPP), various development funds and guide funds. Funding sources include traditional loans on the balance sheet, off-balance-sheet lending such as factoring and bank bill guarantees, and off-balance-sheet credit financing like asset management plans. Among these, some involve illegitimate financing methods such as debt in the name of equity, secret “drawer agreement” guarantees and promised repurchases. As a result, implicit debts have grown rapidly.
Taking Province X for example, at the end of 2017, its outstanding government implicit debts was 80 percent higher than that of explicit debts. In terms of debt composition, explicit and implicit debts to banks accounted for over 35 percent of total debts of the province. In addition, there were also government debts in the form of enterprise bonds, medium-term notes, short-term financing bills and other debt instruments issued by platform companies.
F inancing f rom non-bank ins t i tu t ions like trusts, borrowings from companies and individuals, and accounts payable to suppliers also constituted government debts. In particular, implicit debts in Province X provided by banks through government-backed projects accounted for over 55 percent of banks’ credit to the government from the beginning of 2015 to the end of 2017. This type of debt financing is subject to clear-up and rectification as it violates governing laws and regulations, and poses huge potential risks.
3. Significant Maturity Mismatch Risks and Potential Risks with Guarantee Chain Exist
Government debts are mainly used to invest in medium and long-term infrastructure projects featuring long investment cycle and slow return. In some cases, as foreseeable returns are hard to guarantee, projects that rely on short-term funds will have to resort to rollover to prevent discontinuity of operations, and thus face huge pressure to repay old debt by borrowing new debt. Platform companies seek credit enhancement for government-backed projects by being interconnected and providing guarantee for each other, which will create a guarantee loop. The liquidity crisis of one single company may transmit along the guarantee chain and turn into widespread debt default.
Taking Province X for example, by the end of 2017, about 65 percent of implicit debts to banks were invested in infrastructure construction, nearly 20 percent in rebuilding
39Chapter I Macroeconomic Performance
shanty areas and relocating the poor, nearly 10 percent in constructing industrial park, and nearly 5 percent in the daily operation of platforms. Among these, about 15 percent of debts do not have adequate collaterals nor enough cash flows to cover principal and interest payment. To maintain the operation of projects, the government borrows new debt to repay old ones.
4. Risks of Implicit Government Debt at City and County-level Are More Prominent
In terms of debt distribution, local government implicit debts mainly concentrate on city and county levels. The real liability ratios of some cities and counties are quite high. Taking Province X for example, among total implicit debts to banks, debts to districts and counties account for over 45 percent, cities account for over 40 percent, and the provincial government only account for about 15 percent, which is far below that of city and county-level governments. Some individual districts and counties have large debts with overlapping maturity dates. Without adequate sources of repayment, these districts and counties face huge repayment pressure, and their implicit debt risk is much higher than that of the provincial government.
5. Fiscal Risk Might Turn into Financial Risk
The clear-up of local implicit debts might increase exposures to financial institutions, and lead to possible migration of risks from the
fiscal department to the financial sector. For example, during clear-up of local government financing guarantees, various guarantee letters and commitment letters were withdrawn by some local governments. Without adequate credit enhancement, financial institutions, based on risk measurement, stopped extending credi t to government-backed projects . Consequently, platforms could not meet the financing need of some projects under construction, which were then suspended. This created disputes between local governments and banks.
III. Policy Recommendations
In order to prevent risks associated with local government implicit debts, the Ministry of Finance has issued the Notice on Further Regulating Debt Financing Activities of Local Governments and the Notice on Resolutely Curbing the Illegal Financing of Local Governments in the Name of Government Procurement of Services, as part of its efforts to further rein in the debt financing behaviours of local governments. In 2018, more documents on preventing and mitigating local government implicit debt risks have been released.
Next, as the Chinese economy moves from high-speed growth to high-quality growth, risk dynamics have changed considerably. The old approach that bolstered economic growth through debt expansion and then diluted debt stock should not or cannot be used to prevent and mitigate local government debt risks any more. Instead, a new approach that is forward-looking and addresses both
40
symptoms and root causes should be adopted. First, conduct overall monitoring of local government implicit debts to firmly control the growth of new debts and to properly address stocks. Measures should be taken to open the front gate for local governments to borrow legally, specify the responsibilities of city and county-level governments, straighten out the division of fiscal, taxation and administrative responsibilities between central and local governments, match the expenditures of local governments with their revenues, carry on with institutional reforms, and improve long-term mechanism. Meanwhile, efforts should made to stimulate the flow of private capitals into infrastructure and public service sector, and streamline the price management system, so as to allow enterprises to get proper returns. Second, strengthen financial regulations, enhance the financial regulation
regime, improve the division of financial regulatory responsibilities between central and local governments, and avoid undue intervention of local governments in financial regulations. Work should be done to encourage financial institutions to strengthen credit risk management and strictly implement regulatory requirements. Meanwhile, efforts should be made to reinforce regulations on shadow banking, unify regulatory standards, address regulation gaps, and block the channel through which illegal funds flow into local government implicit debts. Third, enhance auditing and accountability, impose rigid constraints on local government budgets, deemphasize the GDP-oriented performance review system and develop a correct attitude toward political performance.
41Chapter I Macroeconomic Performance
Special Topic 4 Household Debt in China
Rigid increase of household debt in China has been seen in recent years, out of which, household residential mortgages maintained a rapid growth, short-term consumption loans surged in 2017, and the Internet finance experienced rocket growth as a supplement to the household funding. Compared with peer countries, China’s household debt risk is less prominent, and the housing credit policies are more prudent. However, attention should be paid to the relatively high growth rate of household debt. For next step, consistent efforts should be made to monitor the dynamics of household debt from a macroprudential perspective, and a range of measures can be taken to contain excessive growth of household debt.
I. Household Debt: Level and Structure
By the end of 2017, outstanding debt of China’s household sectora stood at RMB 40.5 trillion, representing a y-o-y increase of 21.4 percent, and a 7.1 times increase than that of 2008. Household loans extended by depository institutions accounted for 32.3 percent of the total, or 14.4 percentage points higher than that of 2008. Household debt can be categorized into consumption loans and business loans, which take up 77.8 percent and 22.2 percent of the outstanding amount respectively by the end of 2017, up 25.8 and 8.1 percent y-o-y (Table 1.1, Figure 1.16). The structure of household debt features the following characteristics:
Table 1.1 Outstanding Amount and Growth of Household Debt in 2017
Type Outstanding volume(RMB 100 million) Y-o-y growth (%)
Consumption loans 315 296 25.8
Of which: Short-term consumption loans 68 123 37.9
Medium- and long-term consumption loans 247 173 22.9
Of which: Residential mortgages 218 605 22.2
Business loans 89 854 8.1
Of which: Short-term business loans 45 854 -0.8
Medium- and long-term business loans 43 999 19.1
Total 405 150 21.4
Source: The PBC.
a According to the statistics of IMF and BIS, household debt equals to the household loans in the sheets of the Sources and Uses of Credit Funds of depository institutions.
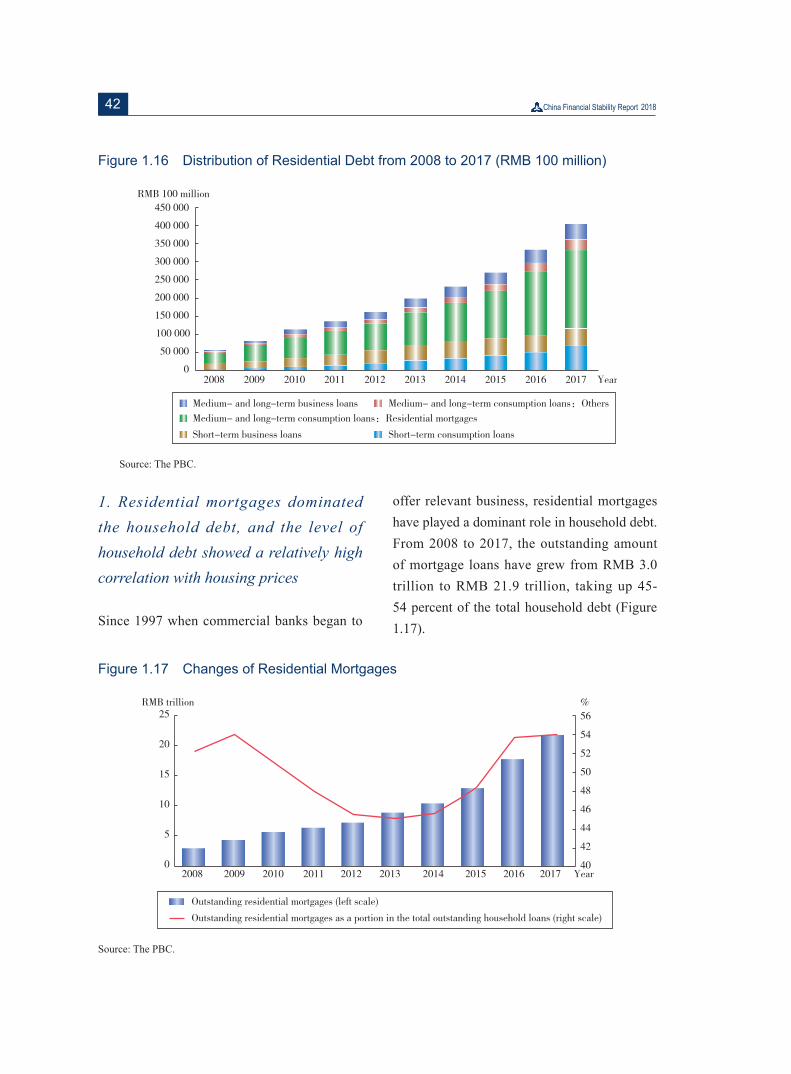
42
Figure 1.16 Distribution of Residential Debt from 2008 to 2017 (RMB 100 million)
Source: The PBC.
1. Residential mortgages dominated the household debt, and the level of household debt showed a relatively high correlation with housing prices
Since 1997 when commercial banks began to
offer relevant business, residential mortgages have played a dominant role in household debt. From 2008 to 2017, the outstanding amount of mortgage loans have grew from RMB 3.0 trillion to RMB 21.9 trillion, taking up 45-54 percent of the total household debt (Figure 1.17).
Figure 1.17 Changes of Residential Mortgages
Source: The PBC.
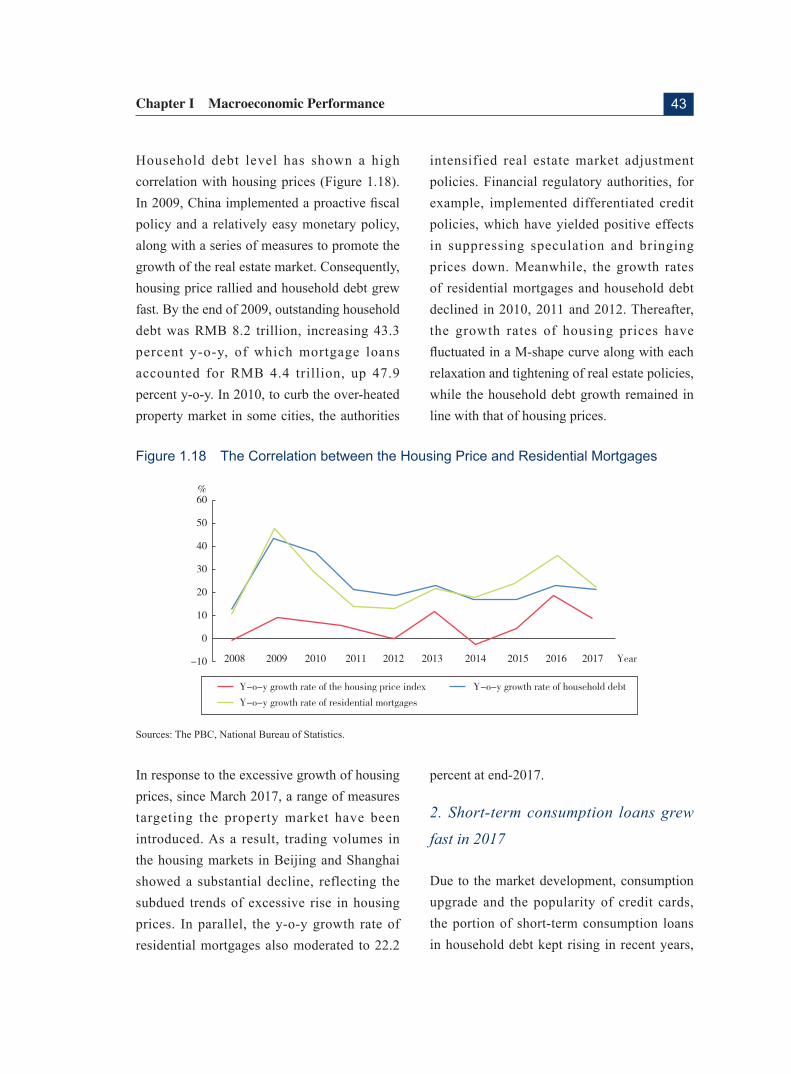
43Chapter I Macroeconomic Performance
Household debt level has shown a high correlation with housing prices (Figure 1.18). In 2009, China implemented a proactive fiscal policy and a relatively easy monetary policy, along with a series of measures to promote the growth of the real estate market. Consequently, housing price rallied and household debt grew fast. By the end of 2009, outstanding household debt was RMB 8.2 trillion, increasing 43.3 percent y-o-y, of which mortgage loans accounted for RMB 4.4 trillion, up 47.9 percent y-o-y. In 2010, to curb the over-heated property market in some cities, the authorities
intensified real estate market adjustment policies. Financial regulatory authorities, for example, implemented differentiated credit policies, which have yielded positive effects in suppressing speculation and bringing prices down. Meanwhile, the growth rates of residential mortgages and household debt declined in 2010, 2011 and 2012. Thereafter, the growth rates of housing prices have fluctuated in a M-shape curve along with each relaxation and tightening of real estate policies, while the household debt growth remained in line with that of housing prices.
Figure 1.18 The Correlation between the Housing Price and Residential Mortgages
Sources: The PBC, National Bureau of Statistics.
In response to the excessive growth of housing prices, since March 2017, a range of measures targeting the property market have been introduced. As a result, trading volumes in the housing markets in Beijing and Shanghai showed a substantial decline, reflecting the subdued trends of excessive rise in housing prices. In parallel, the y-o-y growth rate of residential mortgages also moderated to 22.2
percent at end-2017.
2. Short-term consumption loans grew
fast in 2017
Due to the market development, consumption upgrade and the popularity of credit cards, the portion of short-term consumption loans in household debt kept rising in recent years,
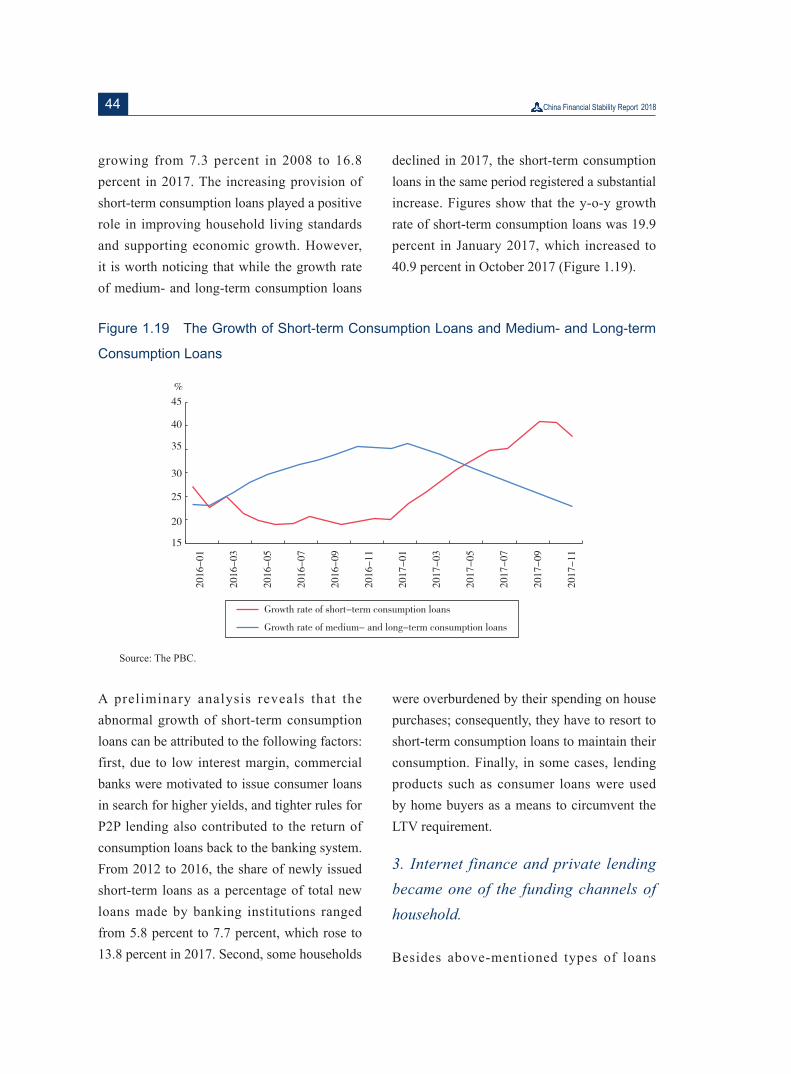
44
growing from 7.3 percent in 2008 to 16.8 percent in 2017. The increasing provision of short-term consumption loans played a positive role in improving household living standards and supporting economic growth. However, it is worth noticing that while the growth rate of medium- and long-term consumption loans
declined in 2017, the short-term consumption loans in the same period registered a substantial increase. Figures show that the y-o-y growth rate of short-term consumption loans was 19.9 percent in January 2017, which increased to 40.9 percent in October 2017 (Figure 1.19).
Figure 1.19 The Growth of Short-term Consumption Loans and Medium- and Long-term
Consumption Loans
Source: The PBC.
A preliminary analysis reveals that the abnormal growth of short-term consumption loans can be attributed to the following factors: first, due to low interest margin, commercial banks were motivated to issue consumer loans in search for higher yields, and tighter rules for P2P lending also contributed to the return of consumption loans back to the banking system. From 2012 to 2016, the share of newly issued short-term loans as a percentage of total new loans made by banking institutions ranged from 5.8 percent to 7.7 percent, which rose to 13.8 percent in 2017. Second, some households
were overburdened by their spending on house purchases; consequently, they have to resort to short-term consumption loans to maintain their consumption. Finally, in some cases, lending products such as consumer loans were used by home buyers as a means to circumvent the LTV requirement.
3. Internet finance and private lending became one of the funding channels of household.
Besides above-mentioned types of loans
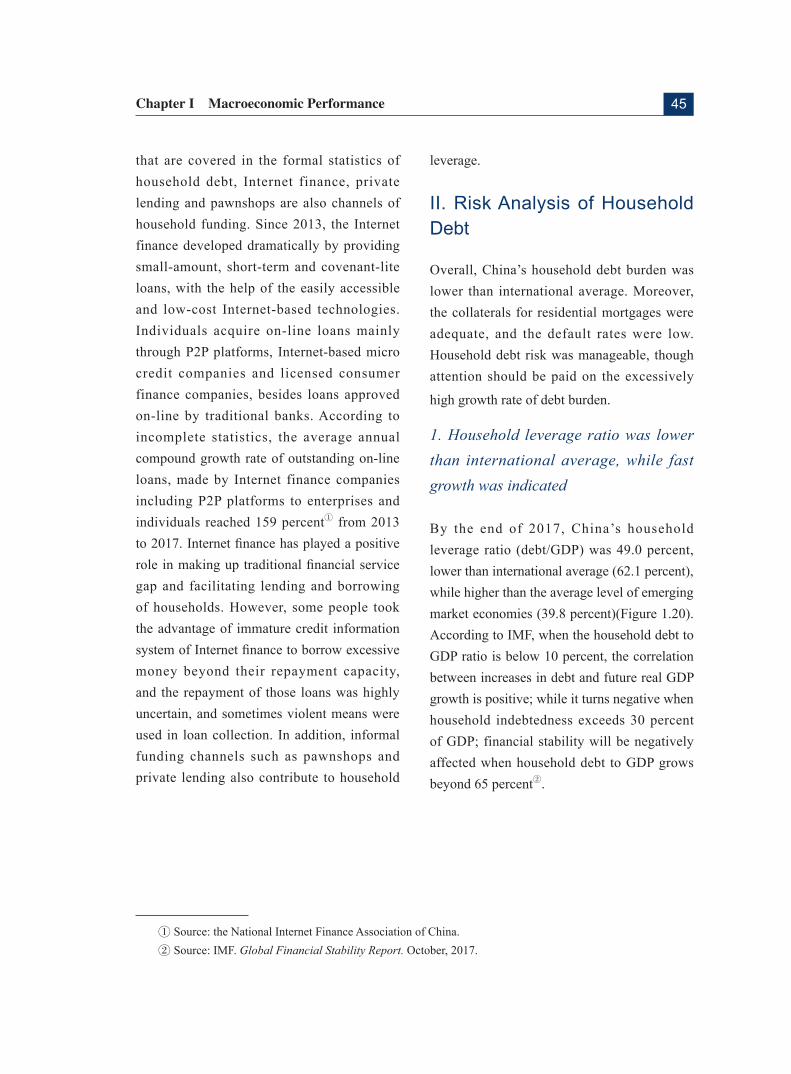
45Chapter I Macroeconomic Performance
that are covered in the formal statistics of household debt, Internet finance, private lending and pawnshops are also channels of household funding. Since 2013, the Internet finance developed dramatically by providing small-amount, short-term and covenant-lite loans, with the help of the easily accessible and low-cost Internet-based technologies. Individuals acquire on-line loans mainly through P2P platforms, Internet-based micro credit companies and licensed consumer finance companies, besides loans approved on-line by traditional banks. According to incomplete statistics, the average annual compound growth rate of outstanding on-line loans, made by Internet finance companies including P2P platforms to enterprises and individuals reached 159 percenta from 2013 to 2017. Internet finance has played a positive role in making up traditional financial service gap and facilitating lending and borrowing of households. However, some people took the advantage of immature credit information system of Internet finance to borrow excessive money beyond their repayment capacity, and the repayment of those loans was highly uncertain, and sometimes violent means were used in loan collection. In addition, informal funding channels such as pawnshops and private lending also contribute to household
leverage.
II. Risk Analysis of Household Debt
Overall, China’s household debt burden was lower than international average. Moreover, the collaterals for residential mortgages were adequate, and the default rates were low. Household debt risk was manageable, though attention should be paid on the excessively
high growth rate of debt burden.
1. Household leverage ratio was lower than international average, while fast growth was indicated
By the end of 2017, China’s household leverage ratio (debt/GDP) was 49.0 percent, lower than international average (62.1 percent), while higher than the average level of emerging market economies (39.8 percent)(Figure 1.20). According to IMF, when the household debt to GDP ratio is below 10 percent, the correlation between increases in debt and future real GDP growth is positive; while it turns negative when household indebtedness exceeds 30 percent of GDP; financial stability will be negatively affected when household debt to GDP grows beyond 65 percentb.
a Source: the National Internet Finance Association of China. b Source: IMF. Global Financial Stability Report. October, 2017.
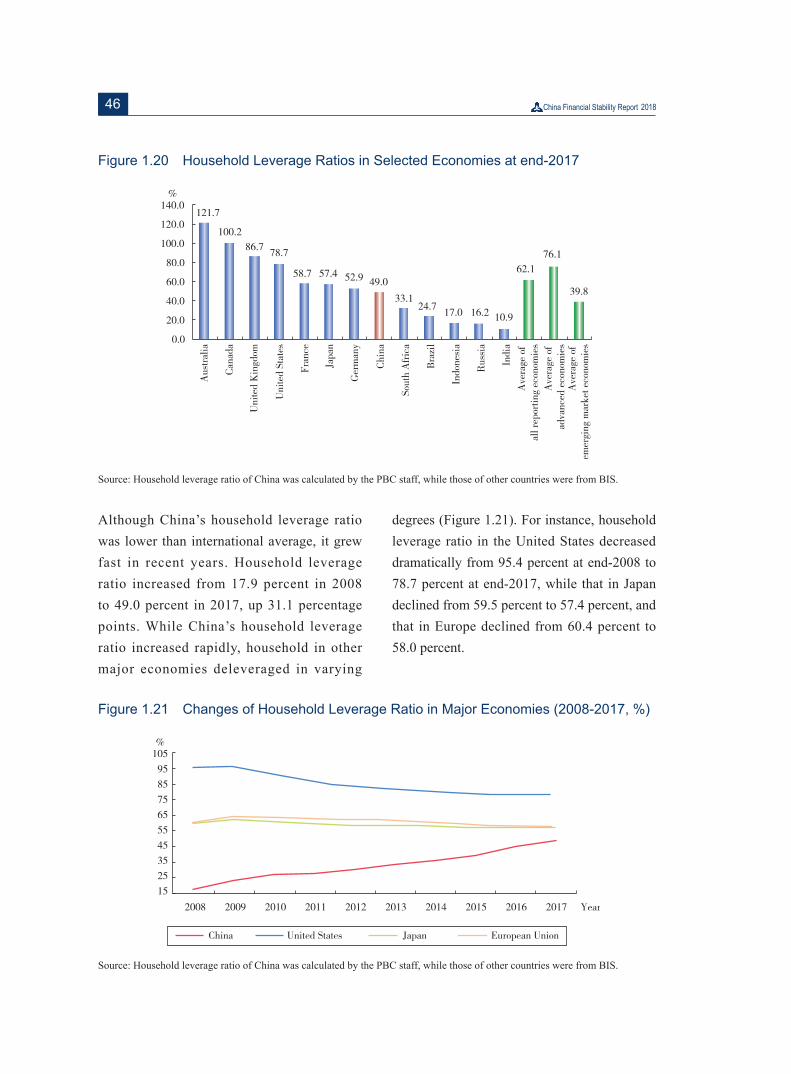
46
Figure 1.20 Household Leverage Ratios in Selected Economies at end-2017
Source: Household leverage ratio of China was calculated by the PBC staff, while those of other countries were from BIS.
Although China’s household leverage ratio was lower than international average, it grew fast in recent years. Household leverage ratio increased from 17.9 percent in 2008 to 49.0 percent in 2017, up 31.1 percentage points. While China’s household leverage ratio increased rapidly, household in other major economies deleveraged in varying
degrees (Figure 1.21). For instance, household leverage ratio in the United States decreased dramatically from 95.4 percent at end-2008 to 78.7 percent at end-2017, while that in Japan declined from 59.5 percent to 57.4 percent, and that in Europe declined from 60.4 percent to 58.0 percent.
Figure 1.21 Changes of Household Leverage Ratio in Major Economies (2008-2017, %)
Source: Household leverage ratio of China was calculated by the PBC staff, while those of other countries were from BIS.
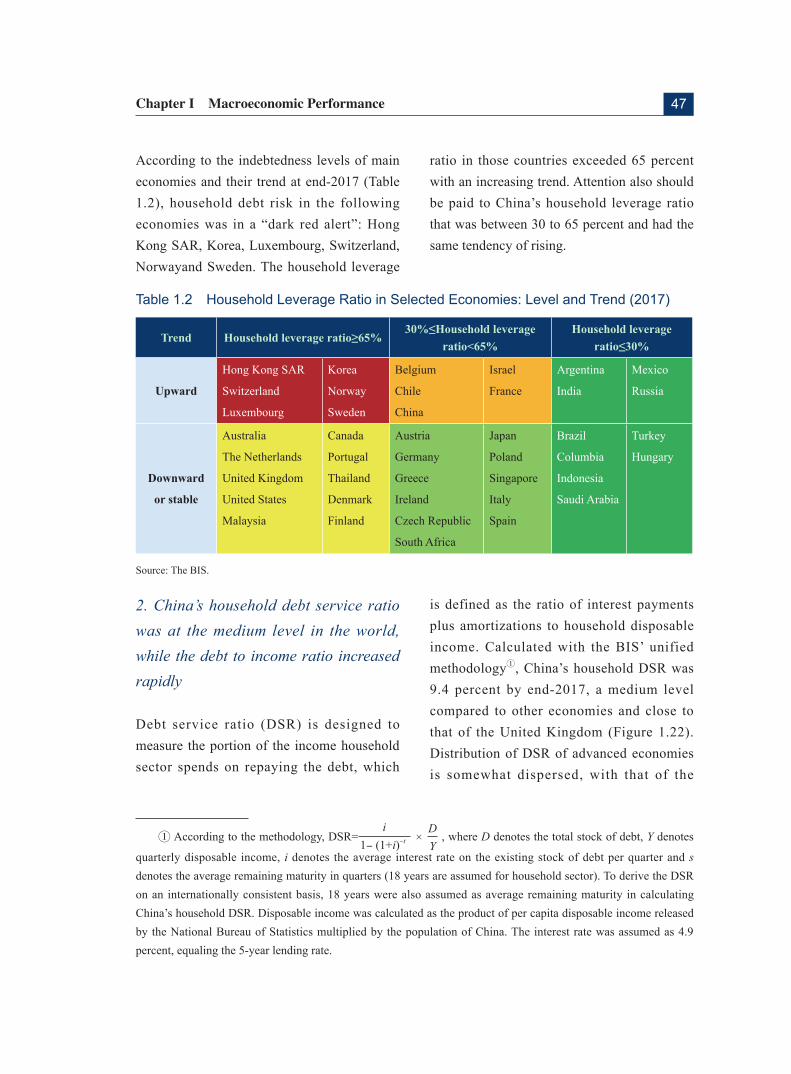
47Chapter I Macroeconomic Performance
According to the indebtedness levels of main economies and their trend at end-2017 (Table 1.2), household debt risk in the following economies was in a “dark red alert”: Hong Kong SAR, Korea, Luxembourg, Switzerland, Norwayand Sweden. The household leverage
ratio in those countries exceeded 65 percent with an increasing trend. Attention also should be paid to China’s household leverage ratio that was between 30 to 65 percent and had the same tendency of rising.
Table 1.2 Household Leverage Ratio in Selected Economies: Level and Trend (2017)
Trend Household leverage ratio≥65%30%≤Household leverage
ratio<65%Household leverage
ratio≤30%
Upward
Hong Kong SAR
Switzerland
Luxembourg
Korea
Norway
Sweden
Belgium
Chile
China
Israel
France
Argentina
India
Mexico
Russia
Downward
or stable
Australia
The Netherlands
United Kingdom
United States
Malaysia
Canada
Portugal
Thailand
Denmark
Finland
Austria
Germany
Greece
Ireland
Czech Republic
South Africa
Japan
Poland
Singapore
Italy
Spain
Brazil
Columbia
Indonesia
Saudi Arabia
Turkey
Hungary
Source: The BIS.
2. China’s household debt service ratio was at the medium level in the world, while the debt to income ratio increased rapidly
Debt service ratio (DSR) is designed to measure the portion of the income household sector spends on repaying the debt, which
is defined as the ratio of interest payments plus amortizations to household disposable income. Calculated with the BIS’ unified methodologya, China’s household DSR was 9.4 percent by end-2017, a medium level compared to other economies and close to that of the United Kingdom (Figure 1.22). Distribution of DSR of advanced economies is somewhat dispersed, with that of the
a According to the methodology, DSR=i D
1- (1+i)-t Y× , where D denotes the total stock of debt, Y denotes
quarterly disposable income, i denotes the average interest rate on the existing stock of debt per quarter and s denotes the average remaining maturity in quarters (18 years are assumed for household sector). To derive the DSR on an internationally consistent basis, 18 years were also assumed as average remaining maturity in calculating China’s household DSR. Disposable income was calculated as the product of per capita disposable income released by the National Bureau of Statistics multiplied by the population of China. The interest rate was assumed as 4.9 percent, equaling the 5-year lending rate.
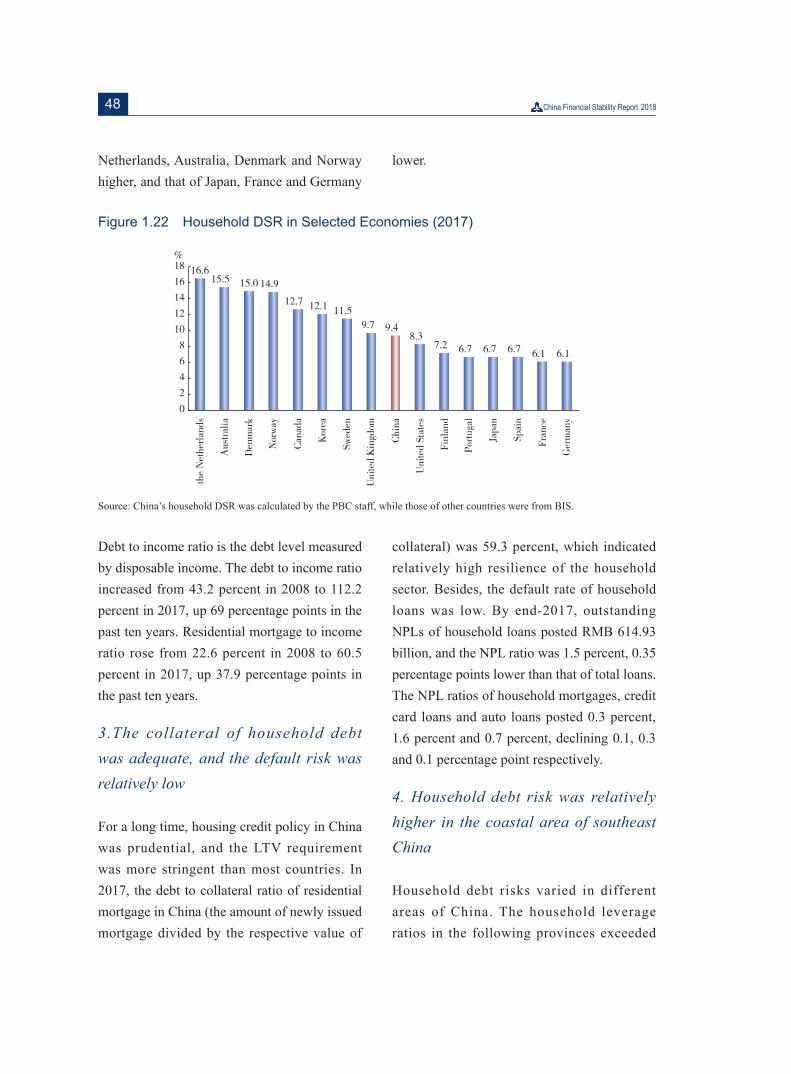
48
Netherlands, Australia, Denmark and Norway higher, and that of Japan, France and Germany
lower.
Figure 1.22 Household DSR in Selected Economies (2017)
Source: China’s household DSR was calculated by the PBC staff, while those of other countries were from BIS.
Debt to income ratio is the debt level measured by disposable income. The debt to income ratio increased from 43.2 percent in 2008 to 112.2 percent in 2017, up 69 percentage points in the past ten years. Residential mortgage to income ratio rose from 22.6 percent in 2008 to 60.5 percent in 2017, up 37.9 percentage points in the past ten years.
3.The collateral of household debt was adequate, and the default risk was relatively low
For a long time, housing credit policy in China was prudential, and the LTV requirement was more stringent than most countries. In 2017, the debt to collateral ratio of residential mortgage in China (the amount of newly issued mortgage divided by the respective value of
collateral) was 59.3 percent, which indicated relatively high resilience of the household sector. Besides, the default rate of household loans was low. By end-2017, outstanding NPLs of household loans posted RMB 614.93 billion, and the NPL ratio was 1.5 percent, 0.35 percentage points lower than that of total loans. The NPL ratios of household mortgages, credit card loans and auto loans posted 0.3 percent, 1.6 percent and 0.7 percent, declining 0.1, 0.3 and 0.1 percentage point respectively.
4. Household debt risk was relatively higher in the coastal area of southeast China
Household debt risks varied in different areas of China. The household leverage ratios in the following provinces exceeded
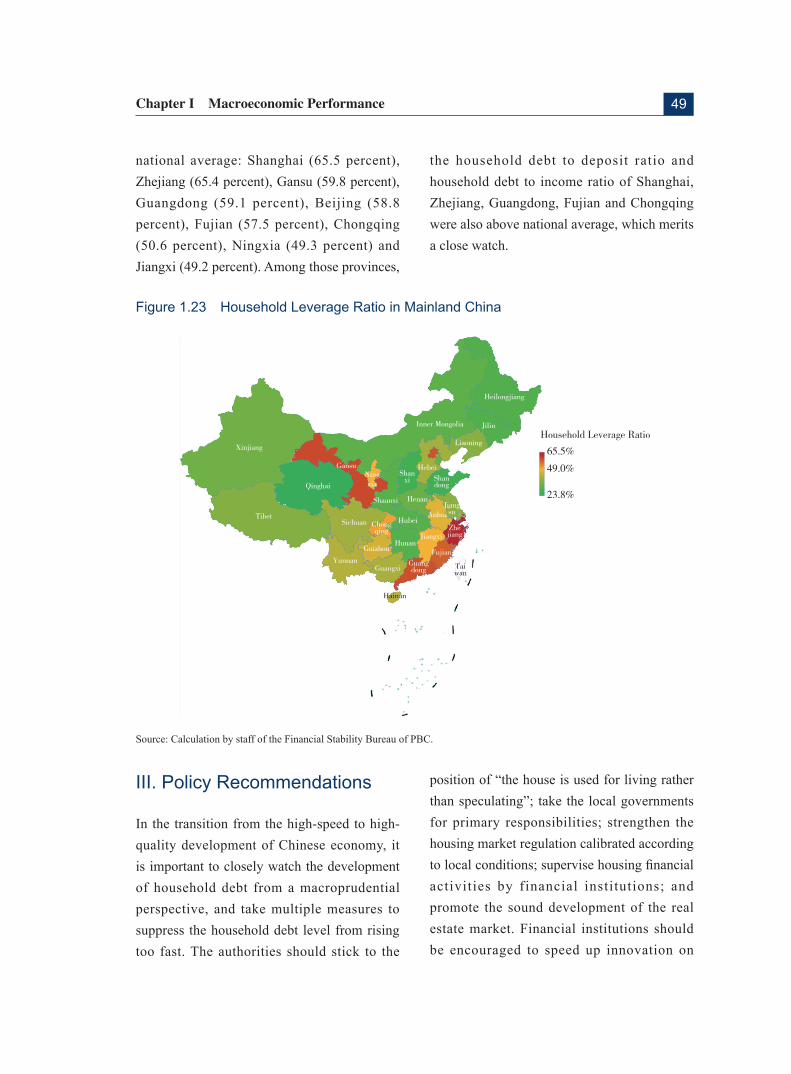
49Chapter I Macroeconomic Performance
national average: Shanghai (65.5 percent), Zhejiang (65.4 percent), Gansu (59.8 percent), Guangdong (59.1 percent), Beijing (58.8 percent), Fujian (57.5 percent), Chongqing (50.6 percent), Ningxia (49.3 percent) and Jiangxi (49.2 percent). Among those provinces,
the household debt to deposit ratio and household debt to income ratio of Shanghai, Zhejiang, Guangdong, Fujian and Chongqing were also above national average, which merits a close watch.
Figure 1.23 Household Leverage Ratio in Mainland China
Source: Calculation by staff of the Financial Stability Bureau of PBC.
III. Policy Recommendations
In the transition from the high-speed to high-quality development of Chinese economy, it is important to closely watch the development of household debt from a macroprudential perspective, and take multiple measures to suppress the household debt level from rising too fast. The authorities should stick to the
position of “the house is used for living rather than speculating”; take the local governments for primary responsibilities; strengthen the housing market regulation calibrated according to local conditions; supervise housing financial activities by financial institutions; and promote the sound development of the real estate market. Financial institutions should be encouraged to speed up innovation on
50
consumer credit management and relevant products and strengthen risk management to crack down on unauthorized use of consumption loans and illegal overdrawing of credit cards. Construction of the credit information system should be accelerated to cover the whole society with an active
use of big data. Meanwhile, efforts should be made on promoting the education on financial consumers and conducting risk warning continually, and enhancing financial literacy of the consumers, in order to build up a reasonable understanding of wealth management and avoid excessive indebtedness.
51Chapter I Macroeconomic Performance
Special Topic 5 Developments and Risks in the Real Estate Market of China
In 2017, nationwide commercial housing sales hit record high in both floor space and revenue terms, which is combined with rapid increase in land sales, newly started real estate projects and real estate investments. Thanks to a set of policies that regulate the real estate market on a city-by-city basis, the soaring housing prices in a number of cities have been largely curbed, evidenced by slowing credit growth. The real estate market has a range of prudential regulatory policies in place, a with relatively high asset quality , and its associated risks are broadly under control. Nevertheless, attention should be paid to potential risks from disproportionate share of real estate credit in the total credit amount, activities of households to bypass the regulations and use excessively leveraged funding to buy homes, and the high debt ratio by some real estate developers.
I. Overview of the Domestic Real Estate Market in 2017
Multiple cities released policies to implement the regulatory guidance of “Houses are for people to live in, not to speculate in” in 2017. According to preliminary statistics, to regulate local real estate markets, targeted policies have been put in place in 50 some cities in 2017; Criteria that identifying a second home buying based on both property registration
records and mortgage loan application records were adopted in 15 cities; and policies that restrict housing sales, purchase and loan application of individuals who fail to meet a certain requirements were implemented in 48 cities. Meanwhile, policy emphasis has also been given to stepping up housing supply, and steering homebuyers towards the rental market. As a result, excessive growth of housing prices in a number of cities has been moderately restrained.
Housing sales hit record high in both floor
space and revenue terms, with slower
growth rates though. In 2017, the total floor space sold of commercial housing reached 1.69 billion square meters, representing a 7.7 percent growth y-o-y and a growth rate lower than that of last year by 14.8 percentage points. Total revenue of commercial housing sold was RMB 13.4 trillion, a 13.7 percent growth y-o-y and a growth rate lower than last year by 21.1 percentage points (Figure 1.24). To address the soaring prices of the housing markets, local governments have adopted a range of regulatory policies targeted at the real estate market starting from March 2017; total floor space of residential housing sold declined significantly on a y-o-y basis in Beijing and Shanghai, with a 47.8 percent and 37.5 percent decline respectively.
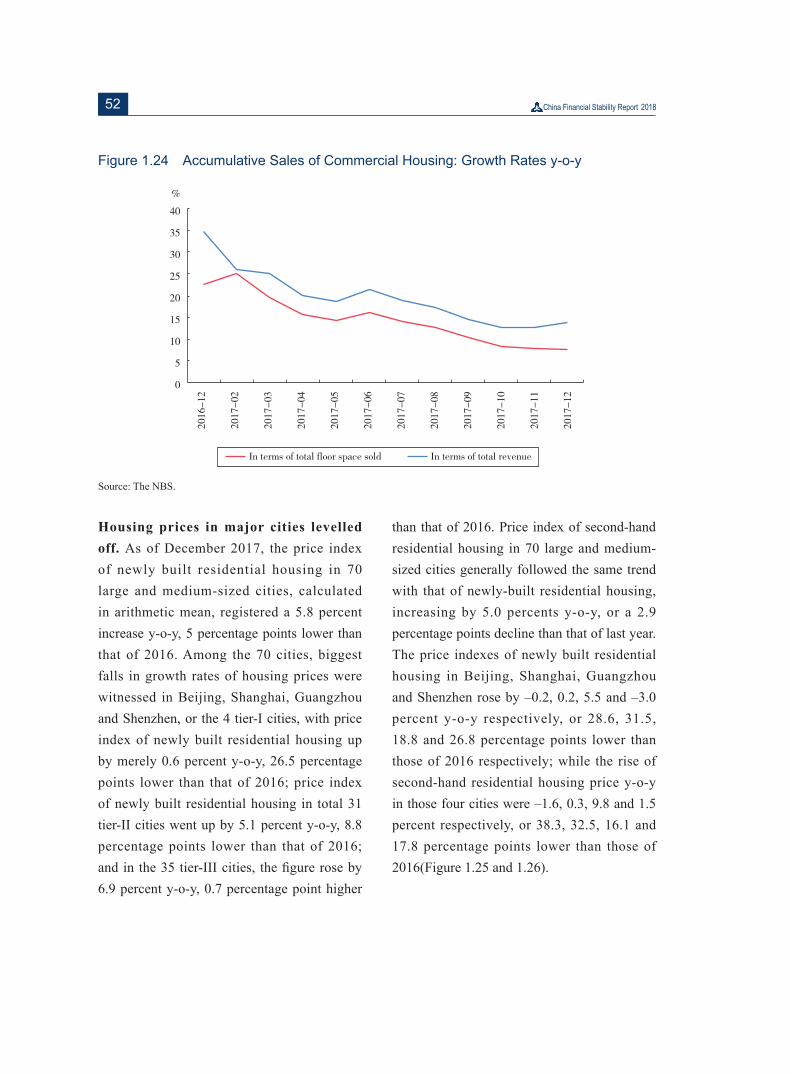
52
Figure 1.24 Accumulative Sales of Commercial Housing: Growth Rates y-o-y
Source: The NBS.
Housing prices in major cities levelled off. As of December 2017, the price index of newly built residential housing in 70 large and medium-sized cities, calculated in arithmetic mean, registered a 5.8 percent increase y-o-y, 5 percentage points lower than that of 2016. Among the 70 cities, biggest falls in growth rates of housing prices were witnessed in Beijing, Shanghai, Guangzhou and Shenzhen, or the 4 tier-I cities, with price index of newly built residential housing up by merely 0.6 percent y-o-y, 26.5 percentage points lower than that of 2016; price index of newly built residential housing in total 31 tier-II cities went up by 5.1 percent y-o-y, 8.8 percentage points lower than that of 2016; and in the 35 tier-III cities, the figure rose by 6.9 percent y-o-y, 0.7 percentage point higher
than that of 2016. Price index of second-hand residential housing in 70 large and medium-sized cities generally followed the same trend with that of newly-built residential housing, increasing by 5.0 percents y-o-y, or a 2.9 percentage points decline than that of last year. The price indexes of newly built residential housing in Beijing, Shanghai, Guangzhou and Shenzhen rose by –0.2, 0.2, 5.5 and –3.0 percent y-o-y respectively, or 28.6, 31.5, 18.8 and 26.8 percentage points lower than those of 2016 respectively; while the rise of second-hand residential housing price y-o-y in those four cities were –1.6, 0.3, 9.8 and 1.5 percent respectively, or 38.3, 32.5, 16.1 and 17.8 percentage points lower than those of 2016(Figure 1.25 and 1.26).
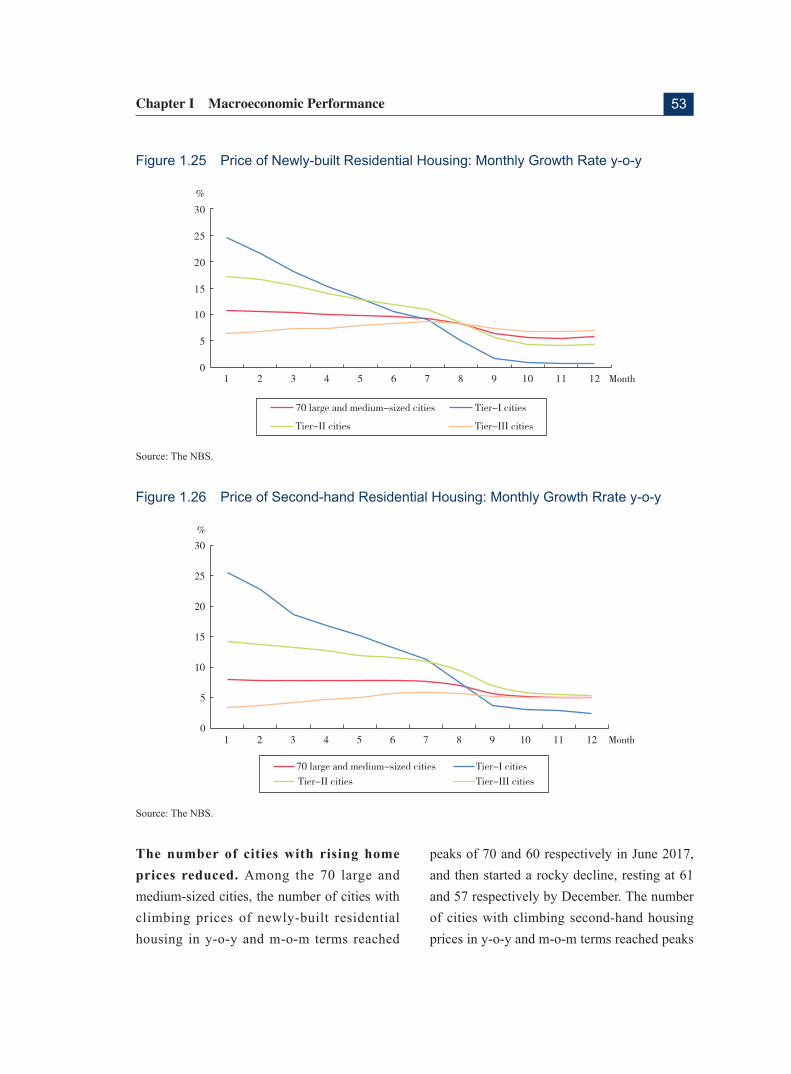
53Chapter I Macroeconomic Performance
Figure 1.25 Price of Newly-built Residential Housing: Monthly Growth Rate y-o-y
Source: The NBS.
Figure 1.26 Price of Second-hand Residential Housing: Monthly Growth Rrate y-o-y
Source: The NBS.
The number of cities with rising home prices reduced. Among the 70 large and medium-sized cities, the number of cities with climbing prices of newly-built residential housing in y-o-y and m-o-m terms reached
peaks of 70 and 60 respectively in June 2017, and then started a rocky decline, resting at 61 and 57 respectively by December. The number of cities with climbing second-hand housing prices in y-o-y and m-o-m terms reached peaks
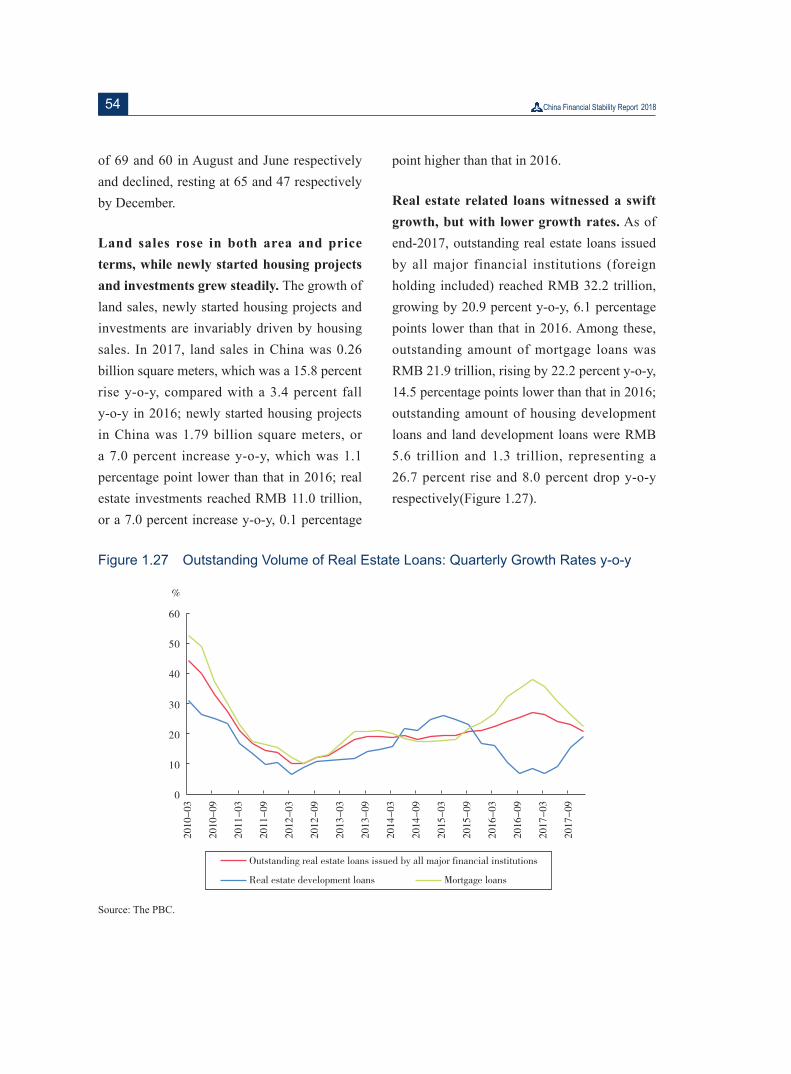
54
of 69 and 60 in August and June respectively and declined, resting at 65 and 47 respectively by December.
Land sales rose in both area and price terms, while newly started housing projects and investments grew steadily. The growth of land sales, newly started housing projects and investments are invariably driven by housing sales. In 2017, land sales in China was 0.26 billion square meters, which was a 15.8 percent rise y-o-y, compared with a 3.4 percent fall y-o-y in 2016; newly started housing projects in China was 1.79 billion square meters, or a 7.0 percent increase y-o-y, which was 1.1 percentage point lower than that in 2016; real estate investments reached RMB 11.0 trillion, or a 7.0 percent increase y-o-y, 0.1 percentage
point higher than that in 2016.
Real estate related loans witnessed a swift growth, but with lower growth rates. As of end-2017, outstanding real estate loans issued by all major financial institutions (foreign holding included) reached RMB 32.2 trillion, growing by 20.9 percent y-o-y, 6.1 percentage points lower than that in 2016. Among these, outstanding amount of mortgage loans was RMB 21.9 trillion, rising by 22.2 percent y-o-y, 14.5 percentage points lower than that in 2016; outstanding amount of housing development loans and land development loans were RMB 5.6 trillion and 1.3 trillion, representing a 26.7 percent rise and 8.0 percent drop y-o-y respectively(Figure 1.27).
Figure 1.27 Outstanding Volume of Real Estate Loans: Quarterly Growth Rates y-o-y
Source: The PBC.

55Chapter I Macroeconomic Performance
II. Potential Risks That Warrant Attention in the Housing Finance Sector
Policies on real estate credit have long been prudent in China; the average down payment ratio is above 34 percent; NPL ratio of real estate related loans is significantly below average in the banking sector; real estate credit is in good quality; and the financial risks in the real estate market are generally contained. Yet it cannot be overlooked that risks associated with the real estate sector have been on the rise as a result of a combination of a highly-leveraged growth model of real estate developers and excessive rise of housing prices. Potential risks may spread over to the financial system through multiple channels, which should be carefully monitored.
Real estate developers are characterised
with a high debt rat io and complex
financing structure. In 2017, the average debt to asset ratio was 79.1 percent for 136 listed real estate companies, 1.9 percentage point higher than that in 2016; 26 out of which had a debt to asset ratio higher than 85 percent. Some real estate companies relied on borrowings to pay the earnest money for land auction, resulting in a leverage ratio up to 7 or 8 times, which constitutes a serious violation to the rule that only self-owned money can be used to purchase land. The high debt to asset ratio enlarged the procyclicality of their business operation, and weakened the resilience of the industry to shocks. Furthermore, some real estate companies
relied on financing channels featuring complex structure, multiple reinvestment and debt in the guise of equity, which makes it difficult for the regulatory authorities to look through the actual money flow, and diminishes the regulatory effectiveness.
Some households bypassed the regulations
and used excessive leverage funding to buy
houses. In 2017, short-term consumption loans grew abnormally fast. The y-o-y growth rate of short-term consumption loans was 19.9 percent in January, and rose to 40.9 percent in October. This may be partially due to the fact that the tightening on the provision of mortgage loans by banks since the second half of 2016 has droved some households to use short-term consumption loans as part of their leveraged funding for home purchases, which was a cirvcumvention of the minimal requirement for the down payment and may result in the influx of short-term consumption loans into the real estate market. This practice fueleds speculation in the marketplace and excessive growth of the housing prices.
Real estate risks may spread over to the
financial system through multiple channels.
The direct channels include: first, banks have intensive exposure to the real estate sector. At end-2017, outstanding amount of real estate related loans accounted for 26.8 percent of all banking credit, indicating banks will be directly exposed to credit risks once the real estate market experiences serious disruptions; second, some real estate companies also raised money through trusts, wealth management products and other non-bank financing
56
channels, which feature complex financing structure and multiple reinvestment, and risks may spread over to the financial industry through these non-bank channels; third, as a large share of the credit was collateralized by real estates, shocks can spill over to the financial industry through changes in the valuation of collaterals. Indirectly, as the real estate sector involves a range of upstream and downstream industries, the development of the real estate industry may exert an influence over their profitability and solvency conditions, and further over the risk profile of the financial system and the economic growth as a whole.
III. Policy Recommendations
Ensuringe policy continuity and stability of the real estate finance. Measures should be taken to further implement the differentiated regulatory policies on real estate credit on a city-by-city basis; steer banks towards rational management of the growth of mortgage loans and prudential management of mortgage loans; support the rigid demand for residential housing while restraining speculation in the real estate market; tighten regulation of consumption loans with the aim of preventing the use of consumption and business loans in leveraged funding for home purchases; and control the excessive growth of leverage ratio in the household sector.
Guarding against illegitimate and excessive
financing activities in the real estate sector. Efforts should be made to address the concentration of funds in the real estate sector; set financing restrictions on companies that have a high debt to asset ratio, purchase land in large quantity, hoard up land or properties, or force up land prices to record high; clear up and rectify financing activities of some real estate developers to use debt tools in the disguise of equity; increase transparency of the sector; strictly implement the rule that only self-owned money can be used to purchase land; intensify vetting of the funding sources for land purchase; and control leveraged financing in land transactions.
Establishing the long-effective mechanism to promote the healthy growth of the real estate market. Efforts should be continued to eliminate institutional obstacles to the stability of the real estate market using a combination of land supply, finance, tax and legislation measures; speed up the supply-side reform in the real estate sector by increasing residential land and housing supply in large and medium-sized cities that have large population inflow, and effectively guide market expectations. At the same time, a diversified housing market should be established by developing both the purchase and rental markets, ensuring equal rights between tenants and home buyers and adjusting the long-term supply and demand balance.

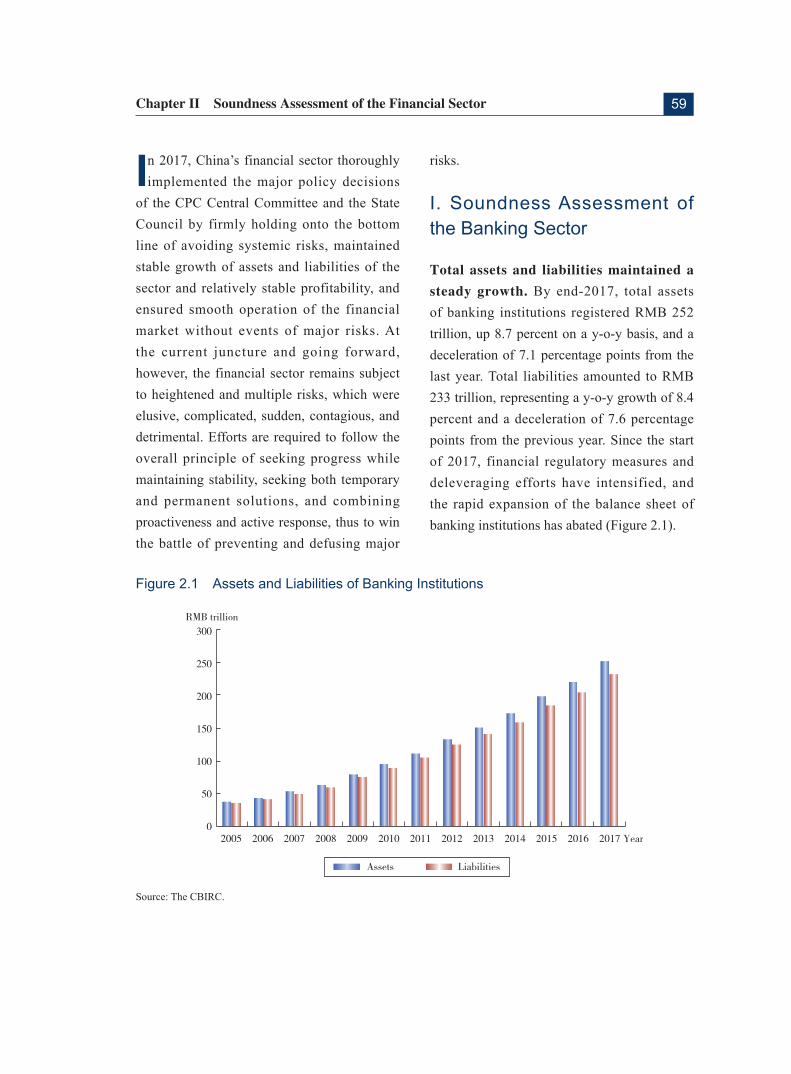
59Chapter II Soundness Assessment of the Financial Sector
In 2017, China’s financial sector thoroughly implemented the major policy decisions
of the CPC Central Committee and the State Council by firmly holding onto the bottom line of avoiding systemic risks, maintained stable growth of assets and liabilities of the sector and relatively stable profitability, and ensured smooth operation of the financial market without events of major risks. At the current juncture and going forward, however, the financial sector remains subject to heightened and multiple risks, which were elusive, complicated, sudden, contagious, and detrimental. Efforts are required to follow the overall principle of seeking progress while maintaining stability, seeking both temporary and permanent solutions, and combining proactiveness and active response, thus to win the battle of preventing and defusing major
risks.
I. Soundness Assessment of the Banking Sector
Total assets and liabilities maintained a
steady growth. By end-2017, total assets of banking institutions registered RMB 252 trillion, up 8.7 percent on a y-o-y basis, and a deceleration of 7.1 percentage points from the last year. Total liabilities amounted to RMB 233 trillion, representing a y-o-y growth of 8.4 percent and a deceleration of 7.6 percentage points from the previous year. Since the start of 2017, financial regulatory measures and deleveraging efforts have intensified, and the rapid expansion of the balance sheet of banking institutions has abated (Figure 2.1).
Figure 2.1 Assets and Liabilities of Banking Institutions
Source: The CBIRC.
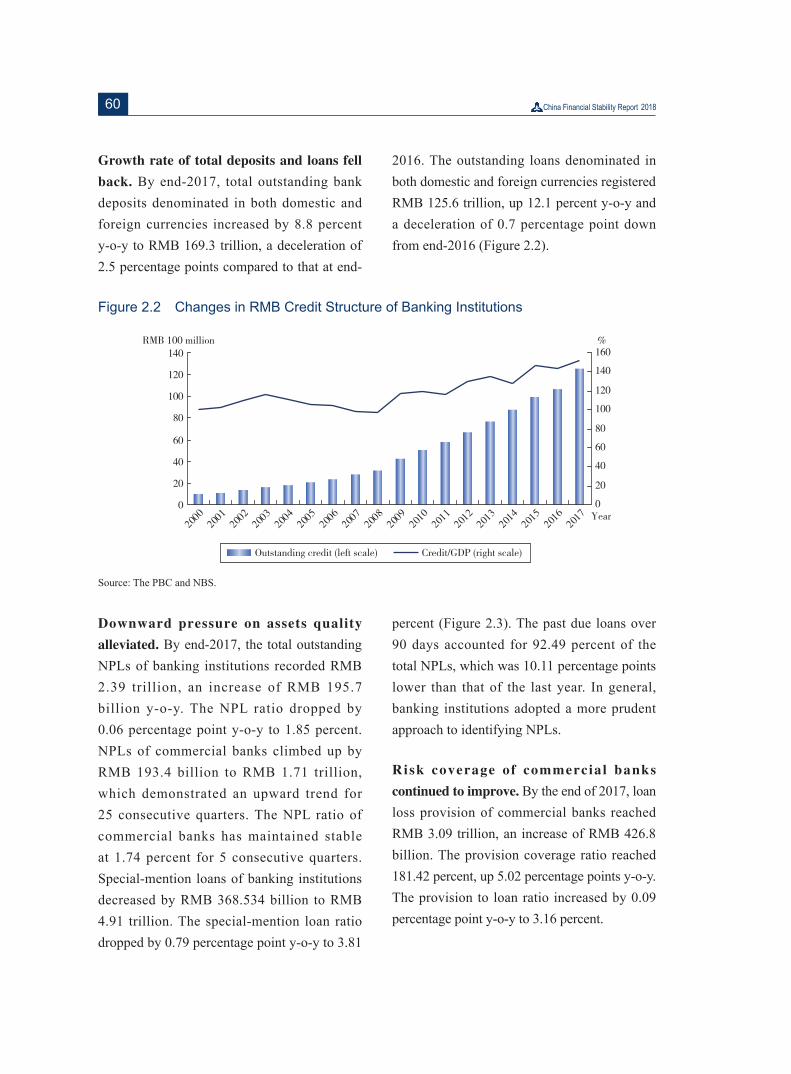
60
Growth rate of total deposits and loans fell
back. By end-2017, total outstanding bank deposits denominated in both domestic and foreign currencies increased by 8.8 percent y-o-y to RMB 169.3 trillion, a deceleration of 2.5 percentage points compared to that at end-
2016. The outstanding loans denominated in both domestic and foreign currencies registered RMB 125.6 trillion, up 12.1 percent y-o-y and a deceleration of 0.7 percentage point down from end-2016 (Figure 2.2).
Figure 2.2 Changes in RMB Credit Structure of Banking Institutions
Source: The PBC and NBS.
Downward pressure on assets quality
alleviated. By end-2017, the total outstanding NPLs of banking institutions recorded RMB 2.39 trillion, an increase of RMB 195.7 billion y-o-y. The NPL ratio dropped by 0.06 percentage point y-o-y to 1.85 percent. NPLs of commercial banks climbed up by RMB 193.4 billion to RMB 1.71 trillion, which demonstrated an upward trend for 25 consecutive quarters. The NPL ratio of commercial banks has maintained stable at 1.74 percent for 5 consecutive quarters. Special-mention loans of banking institutions decreased by RMB 368.534 billion to RMB 4.91 trillion. The special-mention loan ratio dropped by 0.79 percentage point y-o-y to 3.81
percent (Figure 2.3). The past due loans over 90 days accounted for 92.49 percent of the total NPLs, which was 10.11 percentage points lower than that of the last year. In general, banking institutions adopted a more prudent approach to identifying NPLs.
Risk coverage of commercial banks
continued to improve. By the end of 2017, loan loss provision of commercial banks reached RMB 3.09 trillion, an increase of RMB 426.8 billion. The provision coverage ratio reached 181.42 percent, up 5.02 percentage points y-o-y. The provision to loan ratio increased by 0.09 percentage point y-o-y to 3.16 percent.
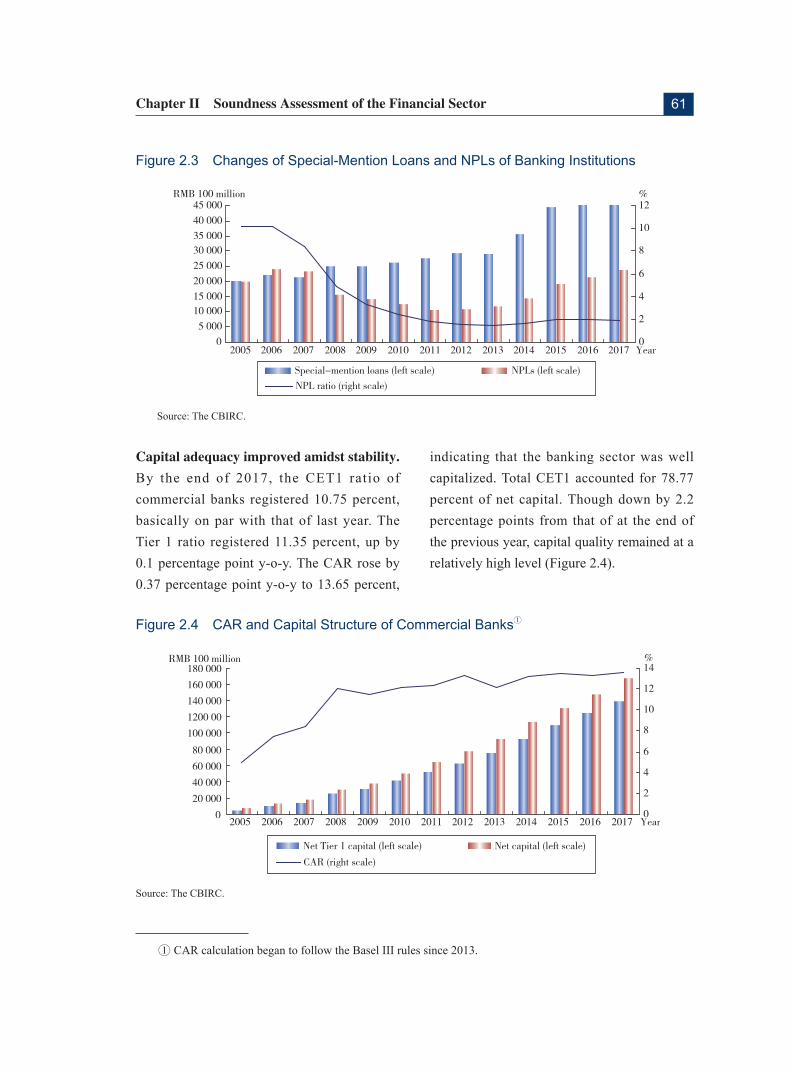
61Chapter II Soundness Assessment of the Financial Sector
Figure 2.3 Changes of Special-Mention Loans and NPLs of Banking Institutions
Source: The CBIRC.
Capital adequacy improved amidst stability.
By the end of 2017, the CET1 ratio of commercial banks registered 10.75 percent, basically on par with that of last year. The Tier 1 ratio registered 11.35 percent, up by 0.1 percentage point y-o-y. The CAR rose by 0.37 percentage point y-o-y to 13.65 percent,
indicating that the banking sector was well capitalized. Total CET1 accounted for 78.77 percent of net capital. Though down by 2.2 percentage points from that of at the end of the previous year, capital quality remained at a relatively high level (Figure 2.4).
Figure 2.4 CAR and Capital Structure of Commercial Banksa
Source: The CBIRC.
a CAR calculation began to follow the Basel III rules since 2013.

62
Overall profit registered steady growth
but profitability declined. In 2017, banking institutions achieved a net profit of RMB 2.2 trillion, representing a y-o-y growth of 6.15 percent and an acceleration of 2.5 percentage points. At end-2017, the ROA dropped 0.05 percentage point y-o-y to 0.91 percent, whereas the ROE fell 0.7 percentage point y-o-y to 11.91 percent. The overall profitability of banking institutions declined compared
with the previous year. The net interest margin narrowed notably with advancement of the marketization of interest rates. By end-2017, the net interest margin of banking institutions dropped by 0.09 percentage point y-o-y to 2.01 percent. The proportion of non-interest income to the net income was 24.23 percent, 2.38 percentage points lower than that in the previous year (Figure 2.5).
Figure 2.5 Profitability and Proportion of Non-Interest Income of Banking Institutions
Source: The CBIRC.
Liquidity remained generally stable. By the end of 2017, the liquidity ratio, excess RMB reserve ratio and the loan to deposit ratio of commercial banks posted 50.03 percent, 2.02 percent, and 70.55 percent respectively. The liquidity coverage ratio of commercial banks with assets over RMB 200 billion was 123.26 percent. All of these indicated that the liquidity in the banking system was reasonable and adequate.
Off-balance-sheet business continued
expansion, while the embedded risks
remained. At end-2017, the outstanding balance of the off-balance sheet of banking institutions (including entrusted loans and entrusted investments) registered RMB 302.11 trillion, up 19.17 percent y-o-y. The outstanding balance accounted for 119.69 percent of the total assets on the balance sheet, up by 10.54 percentage points from the previous year. Among all the off-balance sheet items, guarantee business registered RMB 18.34 trillion, commitment operations
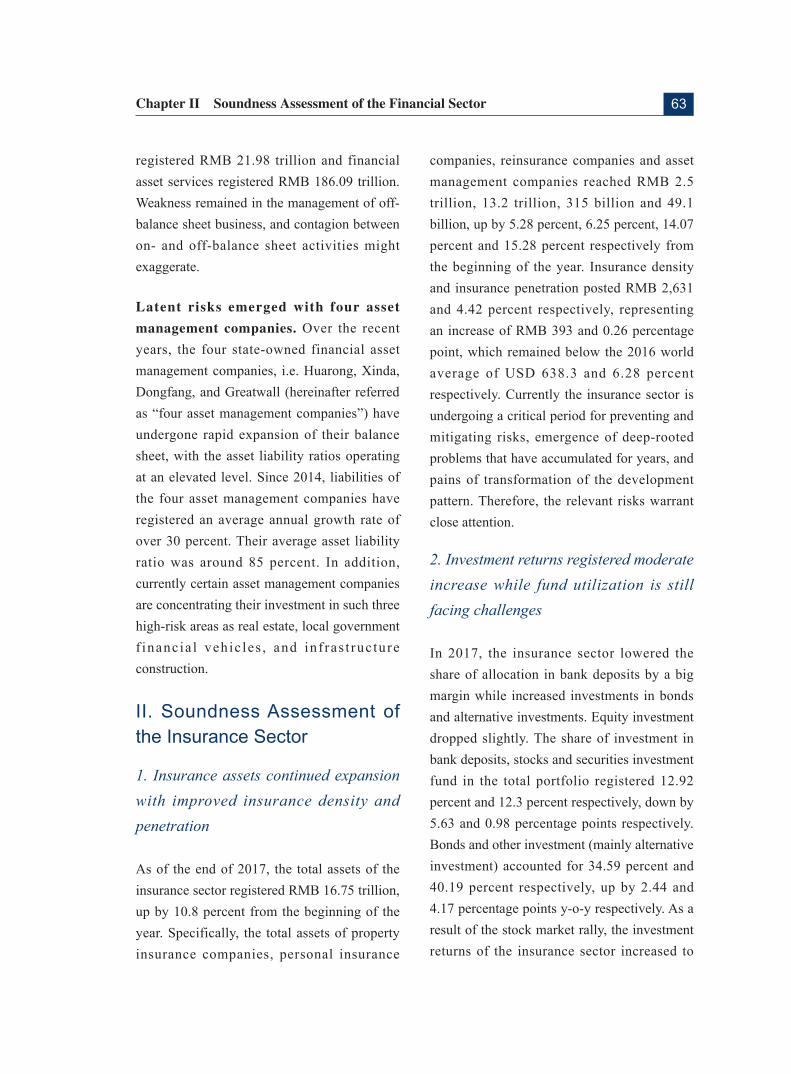
63Chapter II Soundness Assessment of the Financial Sector
registered RMB 21.98 trillion and financial asset services registered RMB 186.09 trillion. Weakness remained in the management of off-balance sheet business, and contagion between on- and off-balance sheet activities might exaggerate.
Latent risks emerged with four asset
management companies. Over the recent years, the four state-owned financial asset management companies, i.e. Huarong, Xinda, Dongfang, and Greatwall (hereinafter referred as “four asset management companies”) have undergone rapid expansion of their balance sheet, with the asset liability ratios operating at an elevated level. Since 2014, liabilities of the four asset management companies have registered an average annual growth rate of over 30 percent. Their average asset liability ratio was around 85 percent. In addition, currently certain asset management companies are concentrating their investment in such three high-risk areas as real estate, local government f inancia l vehic les , and inf ras t ruc ture construction.
II. Soundness Assessment of the Insurance Sector
1. Insurance assets continued expansion with improved insurance density and penetration
As of the end of 2017, the total assets of the insurance sector registered RMB 16.75 trillion, up by 10.8 percent from the beginning of the year. Specifically, the total assets of property insurance companies, personal insurance
companies, reinsurance companies and asset management companies reached RMB 2.5 trillion, 13.2 trillion, 315 billion and 49.1 billion, up by 5.28 percent, 6.25 percent, 14.07 percent and 15.28 percent respectively from the beginning of the year. Insurance density and insurance penetration posted RMB 2,631 and 4.42 percent respectively, representing an increase of RMB 393 and 0.26 percentage point, which remained below the 2016 world average of USD 638.3 and 6.28 percent respectively. Currently the insurance sector is undergoing a critical period for preventing and mitigating risks, emergence of deep-rooted problems that have accumulated for years, and pains of transformation of the development pattern. Therefore, the relevant risks warrant close attention.
2. Investment returns registered moderate increase while fund utilization is still facing challenges
In 2017, the insurance sector lowered the share of allocation in bank deposits by a big margin while increased investments in bonds and alternative investments. Equity investment dropped slightly. The share of investment in bank deposits, stocks and securities investment fund in the total portfolio registered 12.92 percent and 12.3 percent respectively, down by 5.63 and 0.98 percentage points respectively. Bonds and other investment (mainly alternative investment) accounted for 34.59 percent and 40.19 percent respectively, up by 2.44 and 4.17 percentage points y-o-y respectively. As a result of the stock market rally, the investment returns of the insurance sector increased to
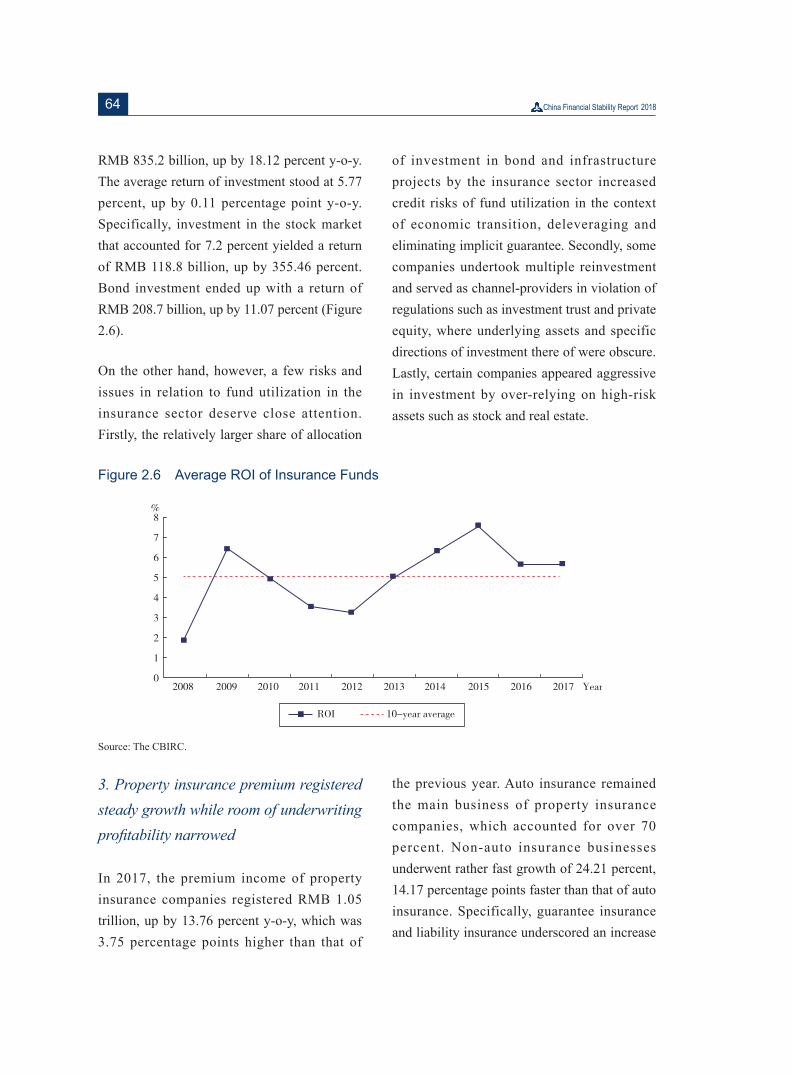
64
RMB 835.2 billion, up by 18.12 percent y-o-y. The average return of investment stood at 5.77 percent, up by 0.11 percentage point y-o-y. Specifically, investment in the stock market that accounted for 7.2 percent yielded a return of RMB 118.8 billion, up by 355.46 percent. Bond investment ended up with a return of RMB 208.7 billion, up by 11.07 percent (Figure 2.6).
On the other hand, however, a few risks and issues in relation to fund utilization in the insurance sector deserve close attention. Firstly, the relatively larger share of allocation
of investment in bond and infrastructure projects by the insurance sector increased credit risks of fund utilization in the context of economic transition, deleveraging and eliminating implicit guarantee. Secondly, some companies undertook multiple reinvestment and served as channel-providers in violation of regulations such as investment trust and private equity, where underlying assets and specific directions of investment there of were obscure. Lastly, certain companies appeared aggressive in investment by over-relying on high-risk assets such as stock and real estate.
Figure 2.6 Average ROI of Insurance Funds
Source: The CBIRC.
3. Property insurance premium registered steady growth while room of underwriting profitability narrowed
In 2017, the premium income of property insurance companies registered RMB 1.05 trillion, up by 13.76 percent y-o-y, which was 3.75 percentage points higher than that of
the previous year. Auto insurance remained the main business of property insurance companies, which accounted for over 70 percent. Non-auto insurance businesses underwent rather fast growth of 24.21 percent, 14.17 percentage points faster than that of auto insurance. Specifically, guarantee insurance and liability insurance underscored an increase
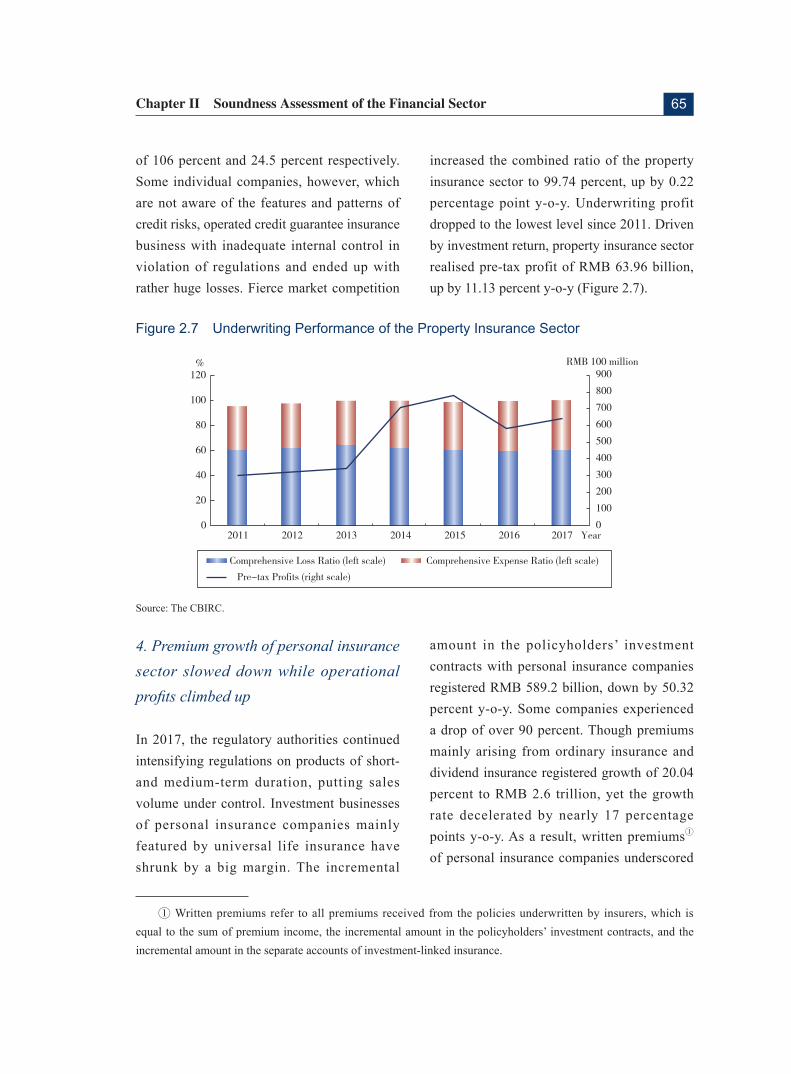
65Chapter II Soundness Assessment of the Financial Sector
of 106 percent and 24.5 percent respectively. Some individual companies, however, which are not aware of the features and patterns of credit risks, operated credit guarantee insurance business with inadequate internal control in violation of regulations and ended up with rather huge losses. Fierce market competition
increased the combined ratio of the property insurance sector to 99.74 percent, up by 0.22 percentage point y-o-y. Underwriting profit dropped to the lowest level since 2011. Driven by investment return, property insurance sector realised pre-tax profit of RMB 63.96 billion, up by 11.13 percent y-o-y (Figure 2.7).
Figure 2.7 Underwriting Performance of the Property Insurance Sector
Source: The CBIRC.
4. Premium growth of personal insurance sector slowed down while operational profits climbed up
In 2017, the regulatory authorities continued intensifying regulations on products of short- and medium-term duration, putting sales volume under control. Investment businesses of personal insurance companies mainly featured by universal life insurance have shrunk by a big margin. The incremental
amount in the policyholders’ investment contracts with personal insurance companies registered RMB 589.2 billion, down by 50.32 percent y-o-y. Some companies experienced a drop of over 90 percent. Though premiums mainly arising from ordinary insurance and dividend insurance registered growth of 20.04 percent to RMB 2.6 trillion, yet the growth rate decelerated by nearly 17 percentage points y-o-y. As a result, written premiumsa of personal insurance companies underscored
a Written premiums refer to all premiums received from the policies underwritten by insurers, which is equal to the sum of premium income, the incremental amount in the policyholders’ investment contracts, and the incremental amount in the separate accounts of investment-linked insurance.
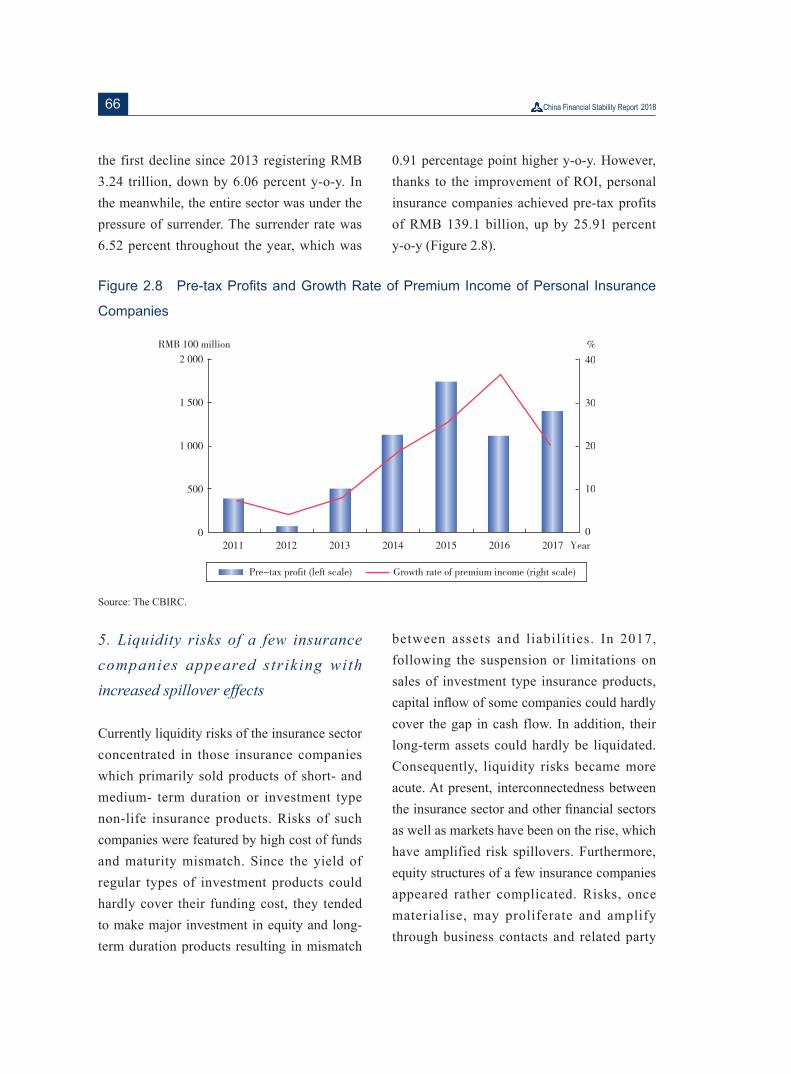
66
the first decline since 2013 registering RMB 3.24 trillion, down by 6.06 percent y-o-y. In the meanwhile, the entire sector was under the pressure of surrender. The surrender rate was 6.52 percent throughout the year, which was
0.91 percentage point higher y-o-y. However, thanks to the improvement of ROI, personal insurance companies achieved pre-tax profits of RMB 139.1 billion, up by 25.91 percent y-o-y (Figure 2.8).
Figure 2.8 Pre-tax Profits and Growth Rate of Premium Income of Personal Insurance
Companies
Source: The CBIRC.
5. Liquidity risks of a few insurance companies appeared striking with increased spillover effects
Currently liquidity risks of the insurance sector concentrated in those insurance companies which primarily sold products of short- and medium- term duration or investment type non-life insurance products. Risks of such companies were featured by high cost of funds and maturity mismatch. Since the yield of regular types of investment products could hardly cover their funding cost, they tended to make major investment in equity and long-term duration products resulting in mismatch
between assets and liabilities. In 2017, following the suspension or limitations on sales of investment type insurance products, capital inflow of some companies could hardly cover the gap in cash flow. In addition, their long-term assets could hardly be liquidated. Consequently, liquidity risks became more acute. At present, interconnectedness between the insurance sector and other financial sectors as well as markets have been on the rise, which have amplified risk spillovers. Furthermore, equity structures of a few insurance companies appeared rather complicated. Risks, once materialise, may proliferate and amplify through business contacts and related party
67Chapter II Soundness Assessment of the Financial Sector
transactions.
6. Capital of a few insurance companies was falsely reported, and corporate governance called for improvement
Shareholders of a few insurance companies with bad intentions, held excessive proportion of shares through irregular methods such as holding shares through related parties, thus becoming the de facto major shareholders. Equity structures of some insurance companies appeared complicated and obscure with lack of balance and check mechanism, where de facto controllers of the companies overrode corporate governance and internal control, and turned the insurance companies to financing platforms to carry out irregular investment, improper related party transactions and tunneling activities, thus infringing on legitimate interests of medium and small shareholders and accumulating high risks. Some shareholders carried out capital injection with debt fund such as banking wealth management products, so equity was actually debts and the role of capital was not played. As a result, the capability of insurance companies to prevent risks was weakened. Few shareholders even diverted and embezzled insurance funds through complicated financial products and asset management plans to inject capital to themselves, conduct repeated injections of capital or make false capital contributions.
7. Overall solvency of the insurance sector remained adequate while a few companies were under heavy burden.
By the end of 2017, the comprehensive solvency adequacy ratio and core solvency adequacy ratio were 251 percent and 240 percent respectively, far above the regulatory standards of 100 percent and 50 percent. Comprehensive solvency adequacy ratio of 16 companies ranged from 100 to 150 percent, while two companies had failed to comply for a long time with the comprehensive solvency adequacy ratio requirement of over 100 percent. A few companies were short of profit making ability but rather mainly relied on capital injection from shareholders, financial reinsurance, and appreciation of real estate investment to maintain solvency.
8. The market became more concentrated and operations of insurance companies diverged
In 2017, the market share of the five largest property insurance companies in terms of premium income was 73.45 percent, a minor decrease of 0.25 percentage point compared with that in the previous year. The Herfindahl- Hirschman Index (HHI)a for the property insurance sector was 0.171, a slight increase of 0.001. As for the personal
a HHI is the sum of squares of every institution’s market share in the sector. The higher the HHI goes, the more concentrated the market is.
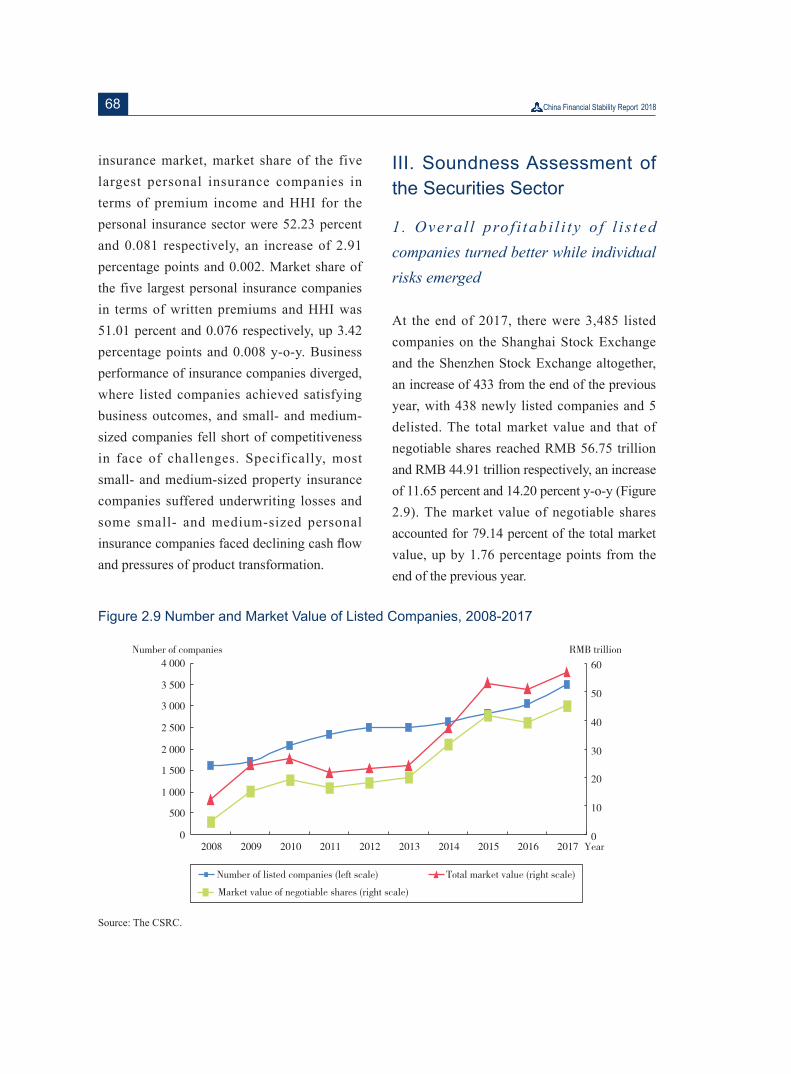
68
insurance market, market share of the five largest personal insurance companies in terms of premium income and HHI for the personal insurance sector were 52.23 percent and 0.081 respectively, an increase of 2.91 percentage points and 0.002. Market share of the five largest personal insurance companies in terms of written premiums and HHI was 51.01 percent and 0.076 respectively, up 3.42 percentage points and 0.008 y-o-y. Business performance of insurance companies diverged, where listed companies achieved satisfying business outcomes, and small- and medium-sized companies fell short of competitiveness in face of challenges. Specifically, most small- and medium-sized property insurance companies suffered underwriting losses and some small- and medium-sized personal insurance companies faced declining cash flow and pressures of product transformation.
III. Soundness Assessment of the Securities Sector
1 . Overa l l pro f i tab i l i t y o f l i s ted companies turned better while individual risks emerged
At the end of 2017, there were 3,485 listed companies on the Shanghai Stock Exchange and the Shenzhen Stock Exchange altogether, an increase of 433 from the end of the previous year, with 438 newly listed companies and 5 delisted. The total market value and that of negotiable shares reached RMB 56.75 trillion and RMB 44.91 trillion respectively, an increase of 11.65 percent and 14.20 percent y-o-y (Figure 2.9). The market value of negotiable shares accounted for 79.14 percent of the total market value, up by 1.76 percentage points from the end of the previous year.
Figure 2.9 Number and Market Value of Listed Companies, 2008-2017
Source: The CSRC.
69Chapter II Soundness Assessment of the Financial Sector
In 2017, the performance of listed companies con t inued to improve wi th enhanced profitability. By the end of April 2018, 3,522 listed companies published their 2017 annual reports. Specifically, 3,300 companies registered profit (93.7 percent of total), 222 companies registered loss (6.3 percent of total), out of which 181 reported loss for the first time, and 41 companies disclosed consecutive loss. Companies that registered loss were mainly concentrated in the sectors of “computer, communication and other electronic equipment manufacturing”, “electric machinery and equipment manufacturing”, and “software and information technology services”, etc. Sectors of steel and coal underscored apparent turnaround from loss to profit making. Total revenue accomplished by all the listed companies in 2017 reached RMB 39.25 trillion, up by 18.80 percent and an acceleration of 10.12 percentage points y-o-y; net profit thereof reached RMB 3.36 trillion, up by 19.1 percent and an acceleration of 11.65 percentage points y-o-y.
Risks of a few listed companies were revealed. Few listed companies swindled financing through hyping up concepts, or blindly expanded business with high leverage using huge funds from rounds of stock pledge, thus triggering operational and financial difficulties. In addition, major shareholders and related parties of certain listed companies cashed from the companies through tricks like related party transactions, in violation of the principles of openness, fairness and justice of the financial market, thus damaging legitimate rights and interests of investors.
2. Securities companies generally operated well while regulations on shareholders and capital remained to be strengthened
At the end of 2017, there were totally 131 securit ies companies, an increase of 2 companies over the past year end. Among them, 29 were listed securities companies, an increase of 3. Total assets of securities companies reached RMB 6.14 trillion, up by 6.02 percent y-o-y. Total net assets and total net capital posted RMB 1.85 trillion and RMB 1.58 trillion respectively, up 12.36 percent and 7.48 percent y-o-y respectively, continuing the deceleration trend (Figure 2.10).
As a result of decreasing trading volume on the stock market amongst other factors, overall profitability of securities companies underwent moderate decline. The sector generated RMB 311.328 billion of operating revenue in 2017, down by 5.26 percent y-o-y. Among this total, net income of the agency business (including seat leases) ended up with RMB 82.092 billion, down by 22.04 percent y-o-y; net income of the underwriting and sponsorship business reached RMB 38.424 billion, down by 26.11 percent y-o-y; net income of financial consultancy reached RMB 12.537 billion, down by 23.63 percent y-o-y; net income from investment consultancy posted RMB 3.396 billion, down by 28.44 percent y-o-y; net income of asset management posted RMB 31.021 billion, up by 3.44 percent y-o-y; net income of securities investment (including fair value variation) posted RMB 101.761 billion,
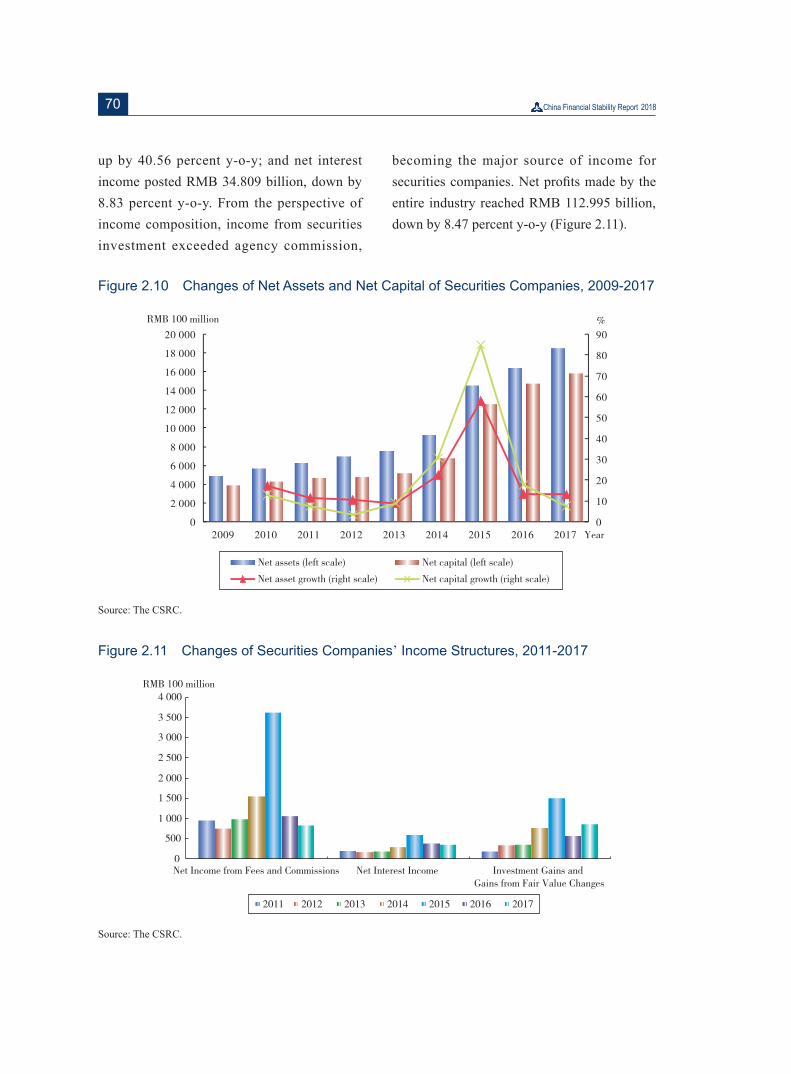
70
up by 40.56 percent y-o-y; and net interest income posted RMB 34.809 billion, down by 8.83 percent y-o-y. From the perspective of income composition, income from securities investment exceeded agency commission,
becoming the major source of income for securities companies. Net profits made by the entire industry reached RMB 112.995 billion, down by 8.47 percent y-o-y (Figure 2.11).
Figure 2.10 Changes of Net Assets and Net Capital of Securities Companies, 2009-2017
Source: The CSRC.
Figure 2.11 Changes of Securities Companies’ Income Structures, 2011-2017
Source: The CSRC.
71Chapter II Soundness Assessment of the Financial Sector
By and la rge , r i sk con t ro l ind ices o f securities companies conformed to regulatory requirements, yet regulations on shareholders and cap i ta l remain inadequa te . Some companies demonstrated non-compliance issues in relation to actual fund contribution and authenticity of shareholders. Specifically, few companies carried out such non-compliant or illegal activities as false fund contribution by shareholders, inadequate capital injection with the capital circularly used to embellish, capital injection with borrowed funds, fund withdrawal following capital injection, etc. Some of them hided related shareholders through private equity, trust plans or asset management plans. Actual controller of few securities companies manipulated related parties or agents to misrepresent the actual equity structures for the purposes of evading regulations, internal control, interest transfer or extracting assets, which distorted market disciplines and endangered the market stability. In addition, violations of regulatory requirements on shareholders and capital were subjected to only minor penalties, which fell far below the illegal gains.
3. Net value of assets managed by the mutual fund industry continued to grow while potential risks of money market funds deserved attention
At end of 2017 , there were 113 fund
management companies, with 5 more than that at the end of the previous year. The total value of the assets managed by the fund management companies and 15 asset management institutions which are licensed to manage publicly offered funds posted RMB 11.6 trillion, up by 26.64 percent y-o-y. Specifically, equity funds accounted for 6.55 percent, down by 1.16 percentage points y-o-y; hybrid funds accounted for 16.71 percent, down by 5.22 percentage points y-o-y; fixed income funds accounted for 12.63 percent, down by 2.93 percentage points y-o-y; money market funds accounted for 58.07 percent, up by 11.3 percentage points y-o-y. 22,446 registered private equity fund managers were managing 66,418 private equity funds in total. And RMB 11.5 trillion of private equity funds were subscribed, up by 39.45 percent y-o-y.
In recent years, the size of money market funds grew rather fast from RMB 300 billion as of the beginning of 2012 up to RMB 6.74 trillion as of end-2017, which accounted for over 50 percent in the entire publicly offered funds (Figure 2.12). Yet, issues remained such as high concentration of institutional investors and potentially high liquidity risks. In addition, few money market funds had become systemically important in terms of the number of customers and their business connections with financial institutions, hence individual risks may easily spread out to the financial system.

72
Figure 2.12 Proportion of Net Asset Value of Money Market Funds to Publicly Offered
Funds, 2010-2017
Source: The CSRC.
CSRC promulgated in September 2017 the Regulations on Liquidity Risks of Open-Ended Publicly Offered Securities Investment Funds, to further strengthen the control and management of liquidity risks of publicly offered funds. In the document, specific provisions were set out on money market funds, requiring for improved investment restrictions, categorized regulation, establishment of scale-constraining mechanism and resilience improvement. The liquidity risk management of publicly offered funds registered certain level of improvement through shoring up the weaknesses of regulatory requirements.
IV. Soundness Assessment of the Financial Market
I n 2 0 1 7 , C h i n a ’ s f i n a n c i a l m a r k e t
maintained stable performance. Stress level of the money market and the bond market
increased compared with the previous year. Stock market performed generally well with modest fluctuation of market stress. Foreign exchange market experienced a decline in market stress. The financial market stress index remained at a moderate level (Figure 2.13).
Interest rates of the money market rose in
general, with increasing market stress. In 2017, the aggregate liquidity in the money market was reasonable and adequate with booming demand for liquidity. Interest rates of the money market as a whole demonstrated an upward trend. As of December 29, 2017, the overnight pledged repo interest rate and the weighted average interest rate of 7-day pledged repos were 3.59 percent and 5.42 percent respectively, up by 143 and 265 basis points from the beginning of the year. Shibor of all maturities edged up, where overnight Shibor rose by 63 basis points to 2.84 percent,
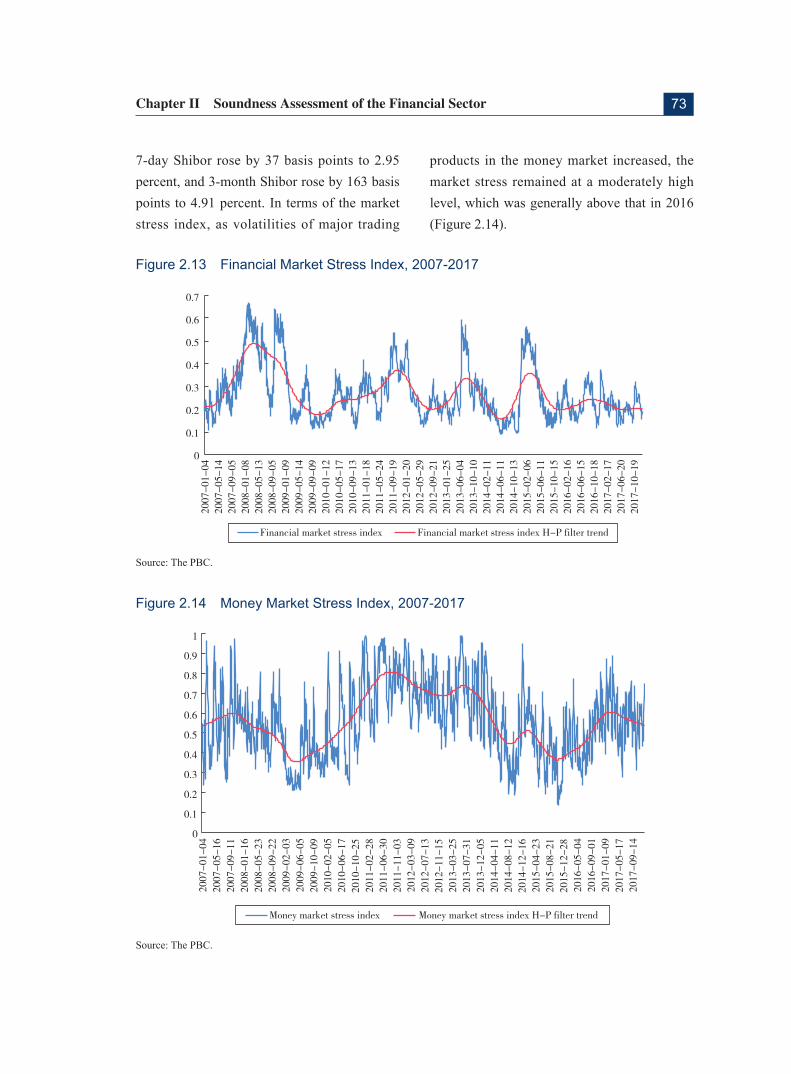
73Chapter II Soundness Assessment of the Financial Sector
7-day Shibor rose by 37 basis points to 2.95 percent, and 3-month Shibor rose by 163 basis points to 4.91 percent. In terms of the market stress index, as volatilities of major trading
products in the money market increased, the market stress remained at a moderately high level, which was generally above that in 2016 (Figure 2.14).
Figure 2.13 Financial Market Stress Index, 2007-2017
Source: The PBC.
Figure 2.14 Money Market Stress Index, 2007-2017
Source: The PBC.
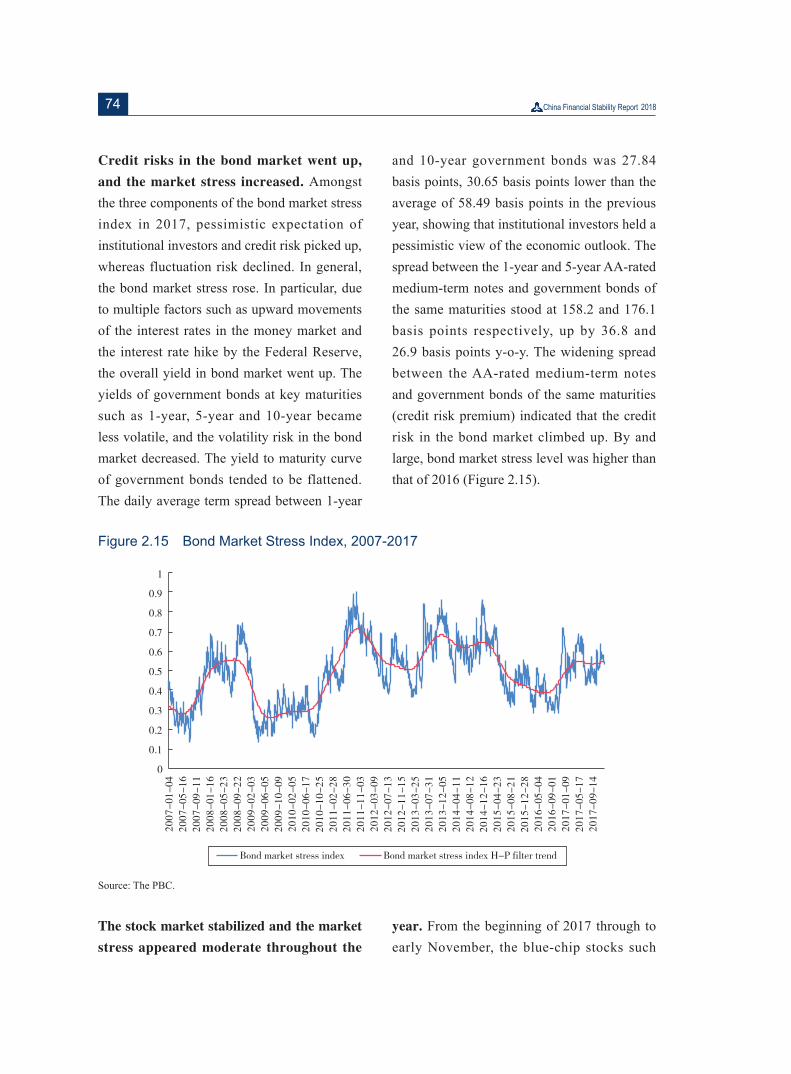
74
Credit risks in the bond market went up,
and the market stress increased. Amongst the three components of the bond market stress index in 2017, pessimistic expectation of institutional investors and credit risk picked up, whereas fluctuation risk declined. In general, the bond market stress rose. In particular, due to multiple factors such as upward movements of the interest rates in the money market and the interest rate hike by the Federal Reserve, the overall yield in bond market went up. The yields of government bonds at key maturities such as 1-year, 5-year and 10-year became less volatile, and the volatility risk in the bond market decreased. The yield to maturity curve of government bonds tended to be flattened. The daily average term spread between 1-year
and 10-year government bonds was 27.84 basis points, 30.65 basis points lower than the average of 58.49 basis points in the previous year, showing that institutional investors held a pessimistic view of the economic outlook. The spread between the 1-year and 5-year AA-rated medium-term notes and government bonds of the same maturities stood at 158.2 and 176.1 basis points respectively, up by 36.8 and 26.9 basis points y-o-y. The widening spread between the AA-rated medium-term notes and government bonds of the same maturities (credit risk premium) indicated that the credit risk in the bond market climbed up. By and large, bond market stress level was higher than that of 2016 (Figure 2.15).
Figure 2.15 Bond Market Stress Index, 2007-2017
Source: The PBC.
The stock market stabilized and the market
stress appeared moderate throughout the
year. From the beginning of 2017 through to early November, the blue-chip stocks such
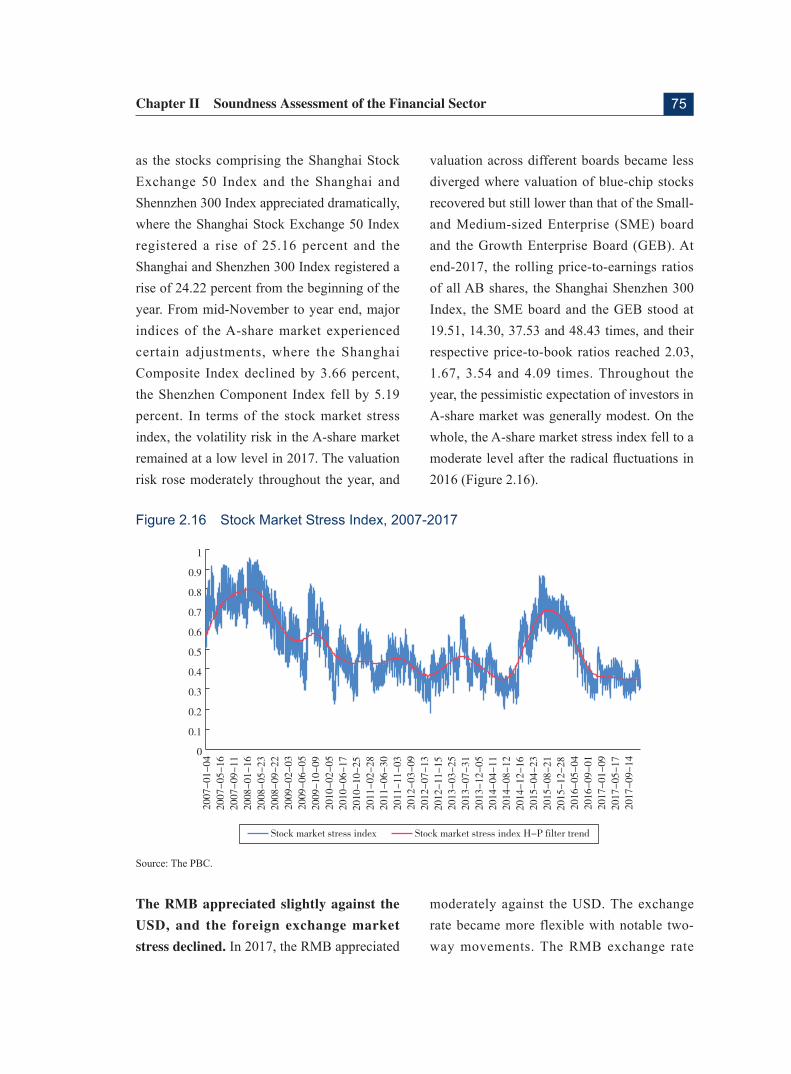
75Chapter II Soundness Assessment of the Financial Sector
as the stocks comprising the Shanghai Stock Exchange 50 Index and the Shanghai and Shennzhen 300 Index appreciated dramatically, where the Shanghai Stock Exchange 50 Index registered a rise of 25.16 percent and the Shanghai and Shenzhen 300 Index registered a rise of 24.22 percent from the beginning of the year. From mid-November to year end, major indices of the A-share market experienced certain adjustments, where the Shanghai Composite Index declined by 3.66 percent, the Shenzhen Component Index fell by 5.19 percent. In terms of the stock market stress index, the volatility risk in the A-share market remained at a low level in 2017. The valuation risk rose moderately throughout the year, and
valuation across different boards became less diverged where valuation of blue-chip stocks recovered but still lower than that of the Small- and Medium-sized Enterprise (SME) board and the Growth Enterprise Board (GEB). At end-2017, the rolling price-to-earnings ratios of all AB shares, the Shanghai Shenzhen 300 Index, the SME board and the GEB stood at 19.51, 14.30, 37.53 and 48.43 times, and their respective price-to-book ratios reached 2.03, 1.67, 3.54 and 4.09 times. Throughout the year, the pessimistic expectation of investors in A-share market was generally modest. On the whole, the A-share market stress index fell to a moderate level after the radical fluctuations in 2016 (Figure 2.16).
Figure 2.16 Stock Market Stress Index, 2007-2017
Source: The PBC.
The RMB appreciated slightly against the
USD, and the foreign exchange market
stress declined. In 2017, the RMB appreciated
moderately against the USD. The exchange rate became more flexible with notable two-way movements. The RMB exchange rate
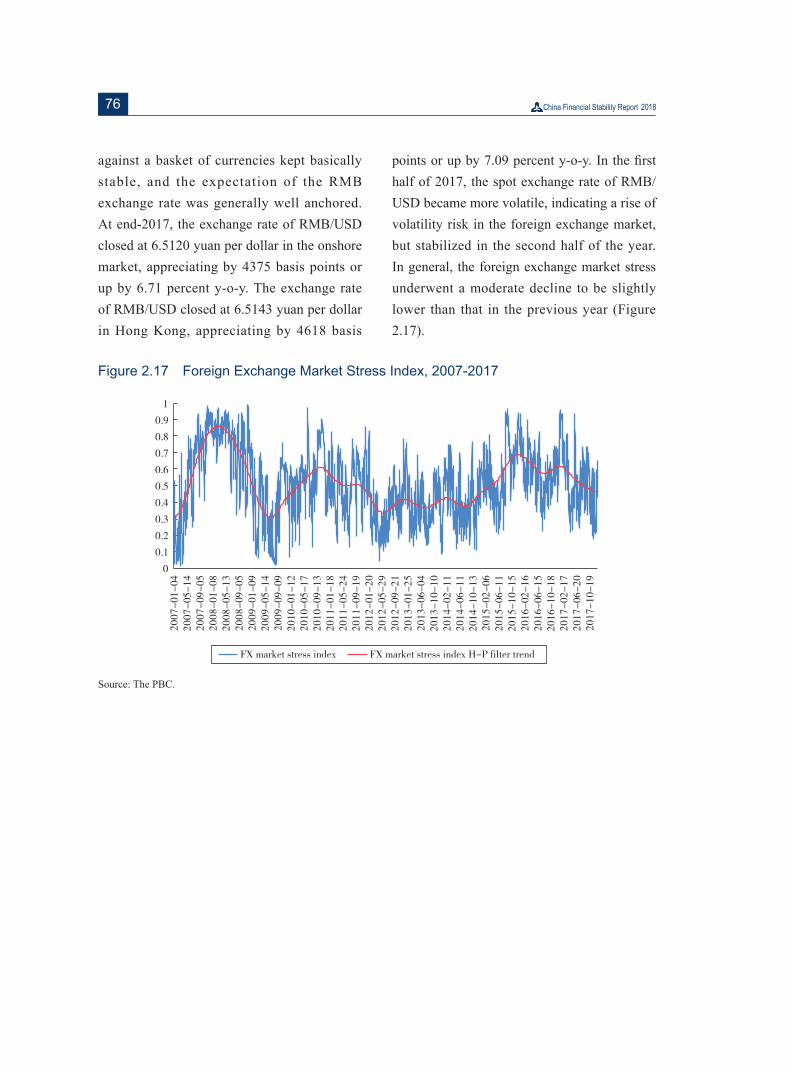
76
against a basket of currencies kept basically stable, and the expectation of the RMB exchange rate was generally well anchored. At end-2017, the exchange rate of RMB/USD closed at 6.5120 yuan per dollar in the onshore market, appreciating by 4375 basis points or up by 6.71 percent y-o-y. The exchange rate of RMB/USD closed at 6.5143 yuan per dollar in Hong Kong, appreciating by 4618 basis
points or up by 7.09 percent y-o-y. In the first half of 2017, the spot exchange rate of RMB/USD became more volatile, indicating a rise of volatility risk in the foreign exchange market, but stabilized in the second half of the year. In general, the foreign exchange market stress underwent a moderate decline to be slightly lower than that in the previous year (Figure 2.17).
Figure 2.17 Foreign Exchange Market Stress Index, 2007-2017
Source: The PBC.
77Chapter II Soundness Assessment of the Financial Sector
Special Topic 6 The Banking Sector Stress Testing
I. General Description of the Stress Testing
In order to improve the monitoring and early warning system for systemic financial risks, and promote a more forward-looking and scientific framework for assessing financial stability, the PBC carried out the banking sector stress testing in the first half of 2018. The tests covered a selection of 20 large- and medium-sized commercial banks with assets over RMB 500 billion by the end of 2017a. Based on end-2017 supervisory data, the tests examined the resilience of the banking system to adverse shocks, using solvency tests based on macroeconomic scenarios, solvency tests based on sensitivity analysis and liquidity stress tests.
Test Approaches. Solvency tests based on macroeconomic scenarios covered credit risk and market risk, and assessed the impact of economic downturn on banks’ profitability and capital adequacy. Solvency tests based on sensitivity analysis assessed the capital strength of banks to individual shocks. Liquidity tests examined the capacity of banks to withstand
large withdrawals of funding.
Pass-fail Criteria. For the solvency tests based on macroeconomic scenarios, a bank with an after-shock CET1 ratio below 7.5 percent, or Tier1 ratio below 8.5 percent, or total CAR below 10.5 percent (the 2.5 percent capital conservation buffer included) would fail the test. For the solvency tests based on sensitivity analysis, a bank has failed the test if its CAR is below 10.5 percent after the shock. For the liquidity tests, banks can counterbalance negative funding gaps (where cash outflows exceed cash inflows) by liquidating their high quality liquid assets or by using them as collateral to obtain liquidity assistance from the PBC. Only when a bank has no eligible high quality liquid assets and there are still negative funding gaps, it would fail the test.
Stress Scenariosb. The solvency tests based on macroeconomic scenarios examined the resilience of banks under an adverse macroeconomic scenario and a severely adverse scenario. The scenarios include the simulation of the following indicators: GDP
a Including Bank of Communications, Postal Savings Bank of China, Industrial Bank, Shanghai Pudong Development Bank, China Mingsheng Bank, China Everbright Bank, Hengfeng Bank, Bohai Bank, Bank of Jiangsu, Bank of Nanjing, Bank of Ningbo, Shengjing Bank, Bank of Tianjin, Huishang Bank, Bank of Hangzhou, Chengdu Rural Commercial Bank, Chongqing Rural Commercial Bank, Beijing Rural Commercial Bank, Shanghai Rural Commercial Bank and Guangzhou Rural Commercial Bank.b The stress scenarios were based on projections of macro econometric model, and should not be interpreted
as the PBC’s judgments on the macro economy.
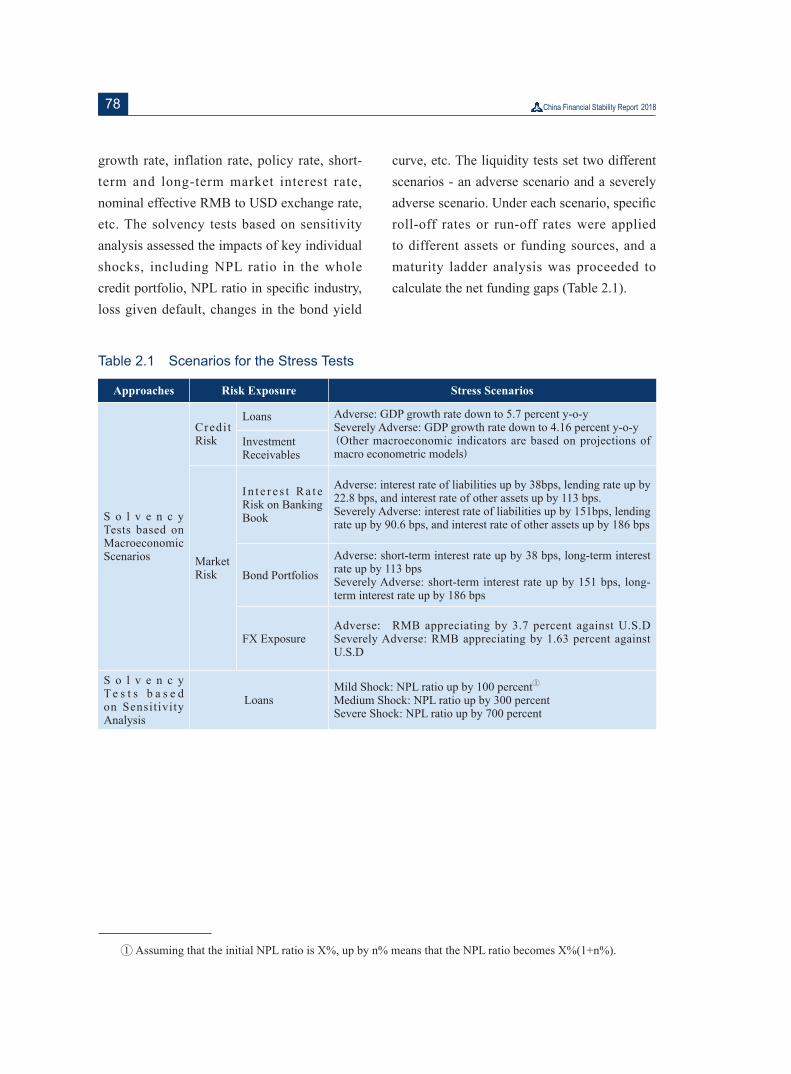
78
growth rate, inflation rate, policy rate, short-term and long-term market interest rate, nominal effective RMB to USD exchange rate, etc. The solvency tests based on sensitivity analysis assessed the impacts of key individual shocks, including NPL ratio in the whole credit portfolio, NPL ratio in specific industry, loss given default, changes in the bond yield
curve, etc. The liquidity tests set two different scenarios - an adverse scenario and a severely adverse scenario. Under each scenario, specific roll-off rates or run-off rates were applied to different assets or funding sources, and a maturity ladder analysis was proceeded to calculate the net funding gaps (Table 2.1).
Table 2.1 Scenarios for the Stress Tests
Approaches Risk Exposure Stress Scenarios
S o l v e n c y Tests based on Macroeconomic Scenarios
Credi t Risk
Loans Adverse: GDP growth rate down to 5.7 percent y-o-ySeverely Adverse: GDP growth rate down to 4.16 percent y-o-y(Other macroeconomic indicators are based on projections of macro econometric models)
InvestmentReceivables
MarketRisk
I n t e r e s t R a t e Risk on Banking Book
Adverse: interest rate of liabilities up by 38bps, lending rate up by 22.8 bps, and interest rate of other assets up by 113 bps. Severely Adverse: interest rate of liabilities up by 151bps, lending rate up by 90.6 bps, and interest rate of other assets up by 186 bps
Bond Portfolios
Adverse: short-term interest rate up by 38 bps, long-term interest rate up by 113 bpsSeverely Adverse: short-term interest rate up by 151 bps, long-term interest rate up by 186 bps
FX ExposureAdverse: RMB appreciating by 3.7 percent against U.S.D Severely Adverse: RMB appreciating by 1.63 percent against U.S.D
S o l v e n c y T e s t s b a s e d on Sensitivity Analysis
LoansMild Shock: NPL ratio up by 100 percentaMedium Shock: NPL ratio up by 300 percentSevere Shock: NPL ratio up by 700 percent
a Assuming that the initial NPL ratio is X%, up by n% means that the NPL ratio becomes X%(1+n%).
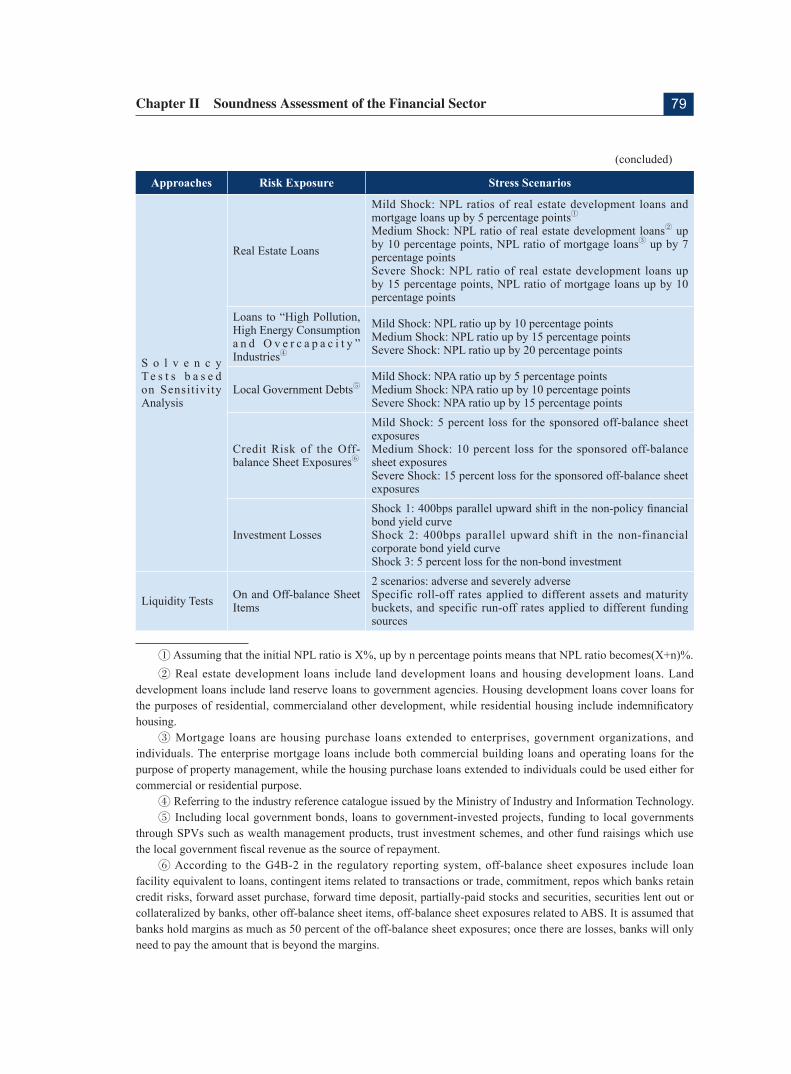
79Chapter II Soundness Assessment of the Financial Sector
Approaches Risk Exposure Stress Scenarios
S o l v e n c y T e s t s b a s e d on Sensitivity Analysis
Real Estate Loans
Mild Shock: NPL ratios of real estate development loans and mortgage loans up by 5 percentage pointsaMedium Shock: NPL ratio of real estate development loansb up by 10 percentage points, NPL ratio of mortgage loansc up by 7 percentage points Severe Shock: NPL ratio of real estate development loans up by 15 percentage points, NPL ratio of mortgage loans up by 10 percentage points
Loans to “High Pollution, High Energy Consumption a n d O v e r c a p a c i t y ” Industriesd
Mild Shock: NPL ratio up by 10 percentage pointsMedium Shock: NPL ratio up by 15 percentage pointsSevere Shock: NPL ratio up by 20 percentage points
Local Government DebtseMild Shock: NPA ratio up by 5 percentage pointsMedium Shock: NPA ratio up by 10 percentage pointsSevere Shock: NPA ratio up by 15 percentage points
Credit Risk of the Off-balance Sheet Exposuresf
Mild Shock: 5 percent loss for the sponsored off-balance sheet exposuresMedium Shock: 10 percent loss for the sponsored off-balance sheet exposuresSevere Shock: 15 percent loss for the sponsored off-balance sheet exposures
Investment Losses
Shock 1: 400bps parallel upward shift in the non-policy financial bond yield curve Shock 2: 400bps parallel upward shift in the non-financial corporate bond yield curveShock 3: 5 percent loss for the non-bond investment
Liquidity Tests On and Off-balance Sheet Items
2 scenarios: adverse and severely adverse Specific roll-off rates applied to different assets and maturity buckets, and specific run-off rates applied to different funding sources
(concluded)
a Assuming that the initial NPL ratio is X%, up by n percentage points means that NPL ratio becomes(X+n)%.b Real estate development loans include land development loans and housing development loans. Land
development loans include land reserve loans to government agencies. Housing development loans cover loans for the purposes of residential, commercialand other development, while residential housing include indemnificatory housing. c Mortgage loans are housing purchase loans extended to enterprises, government organizations, and
individuals. The enterprise mortgage loans include both commercial building loans and operating loans for the purpose of property management, while the housing purchase loans extended to individuals could be used either for commercial or residential purpose.d Referring to the industry reference catalogue issued by the Ministry of Industry and Information Technology.e Including local government bonds, loans to government-invested projects, funding to local governments
through SPVs such as wealth management products, trust investment schemes, and other fund raisings which use the local government fiscal revenue as the source of repayment. f According to the G4B-2 in the regulatory reporting system, off-balance sheet exposures include loan
facility equivalent to loans, contingent items related to transactions or trade, commitment, repos which banks retain credit risks, forward asset purchase, forward time deposit, partially-paid stocks and securities, securities lent out or collateralized by banks, other off-balance sheet items, off-balance sheet exposures related to ABS. It is assumed that banks hold margins as much as 50 percent of the off-balance sheet exposures; once there are losses, banks will only need to pay the amount that is beyond the margins.
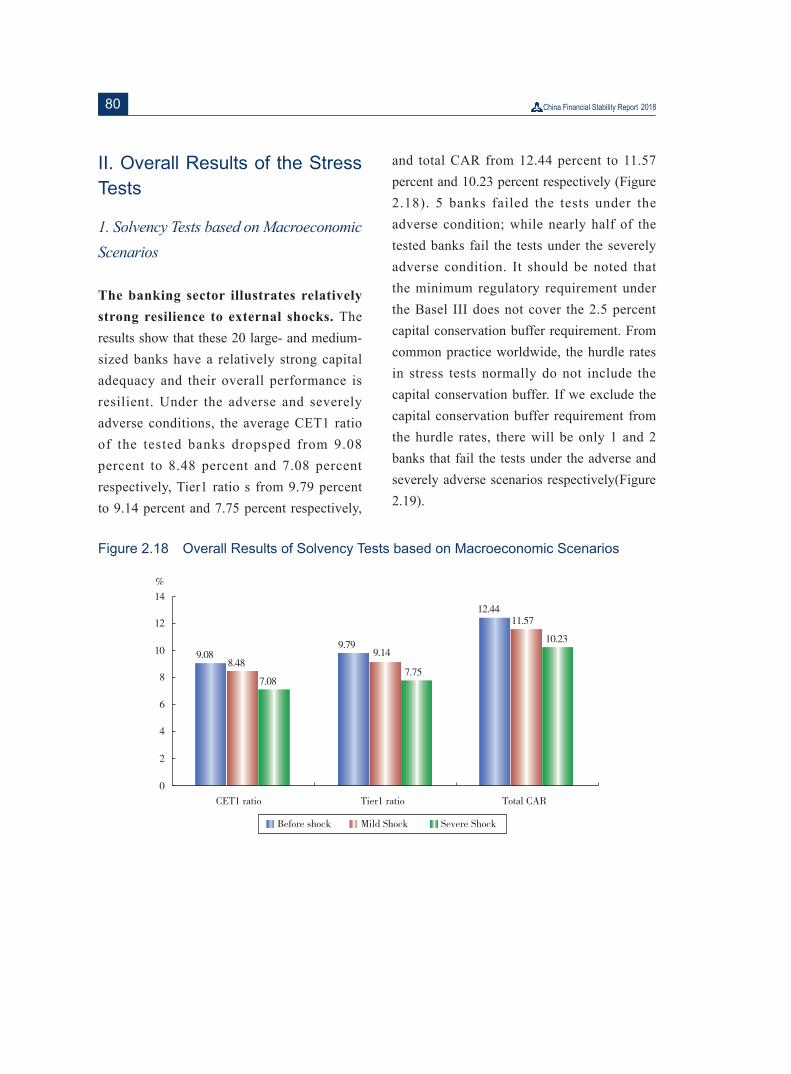
80
II. Overall Results of the Stress Tests
1. Solvency Tests based on Macroeconomic Scenarios
The banking sector illustrates relatively strong resilience to external shocks. The results show that these 20 large- and medium-sized banks have a relatively strong capital adequacy and their overall performance is resilient. Under the adverse and severely adverse conditions, the average CET1 ratio of the tested banks dropsped from 9.08 percent to 8.48 percent and 7.08 percent respectively, Tier1 ratio s from 9.79 percent to 9.14 percent and 7.75 percent respectively,
and total CAR from 12.44 percent to 11.57 percent and 10.23 percent respectively (Figure 2.18). 5 banks failed the tests under the adverse condition; while nearly half of the tested banks fail the tests under the severely adverse condition. It should be noted that the minimum regulatory requirement under the Basel III does not cover the 2.5 percent capital conservation buffer requirement. From common practice worldwide, the hurdle rates in stress tests normally do not include the capital conservation buffer. If we exclude the capital conservation buffer requirement from the hurdle rates, there will be only 1 and 2 banks that fail the tests under the adverse and severely adverse scenarios respectively(Figure 2.19).
Figure 2.18 Overall Results of Solvency Tests based on Macroeconomic Scenarios
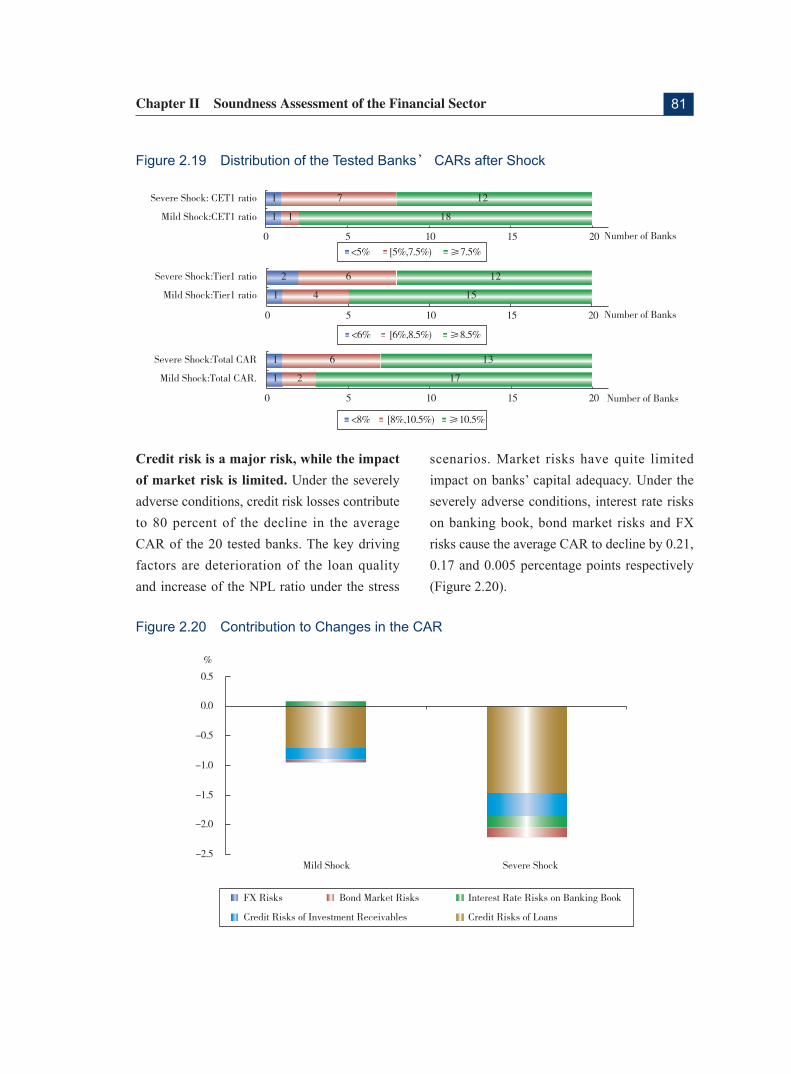
81Chapter II Soundness Assessment of the Financial Sector
Figure 2.19 Distribution of the Tested Banks’ CARs after Shock
Credit risk is a major risk, while the impact of market risk is limited. Under the severely adverse conditions, credit risk losses contribute to 80 percent of the decline in the average CAR of the 20 tested banks. The key driving factors are deterioration of the loan quality and increase of the NPL ratio under the stress
scenarios. Market risks have quite limited impact on banks’ capital adequacy. Under the severely adverse conditions, interest rate risks on banking book, bond market risks and FX risks cause the average CAR to decline by 0.21, 0.17 and 0.005 percentage points respectively (Figure 2.20).
Figure 2.20 Contribution to Changes in the CAR
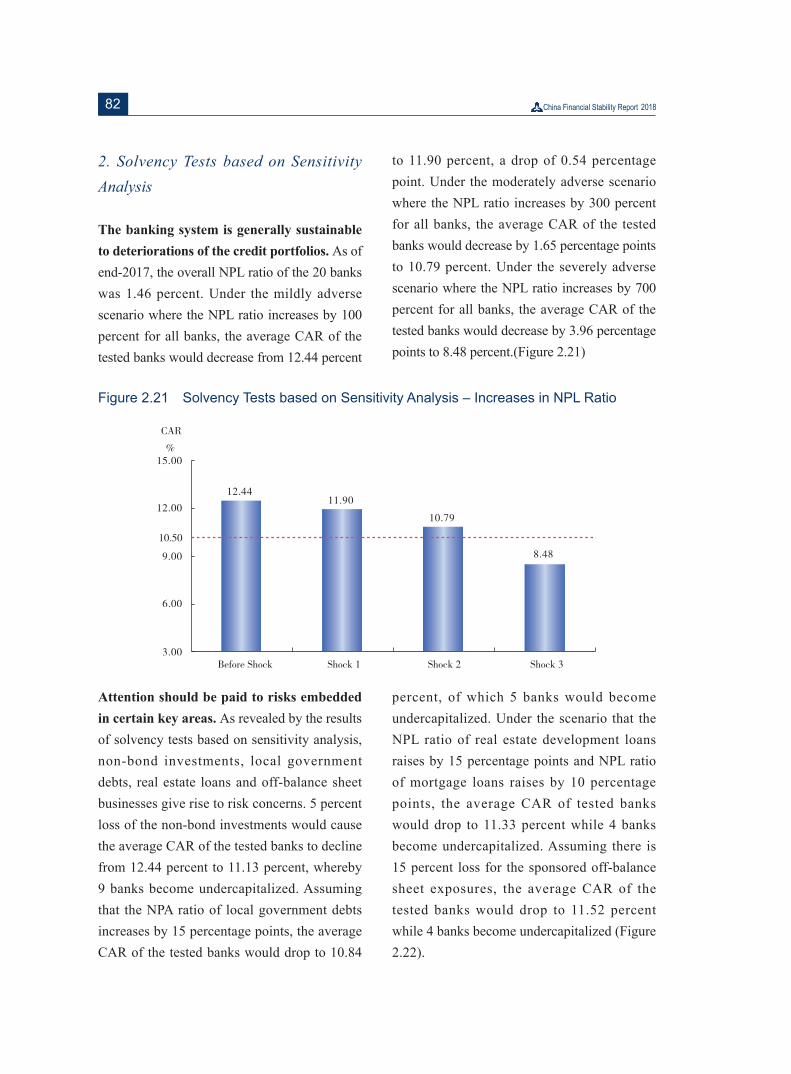
82
2. Solvency Tests based on Sensitivity Analysis
The banking system is generally sustainable to deteriorations of the credit portfolios. As of end-2017, the overall NPL ratio of the 20 banks was 1.46 percent. Under the mildly adverse scenario where the NPL ratio increases by 100 percent for all banks, the average CAR of the tested banks would decrease from 12.44 percent
to 11.90 percent, a drop of 0.54 percentage point. Under the moderately adverse scenario where the NPL ratio increases by 300 percent for all banks, the average CAR of the tested banks would decrease by 1.65 percentage points to 10.79 percent. Under the severely adverse scenario where the NPL ratio increases by 700 percent for all banks, the average CAR of the tested banks would decrease by 3.96 percentage points to 8.48 percent.(Figure 2.21)
Figure 2.21 Solvency Tests based on Sensitivity Analysis – Increases in NPL Ratio
Attention should be paid to risks embedded in certain key areas. As revealed by the results of solvency tests based on sensitivity analysis, non-bond investments, local government debts, real estate loans and off-balance sheet businesses give rise to risk concerns. 5 percent loss of the non-bond investments would cause the average CAR of the tested banks to decline from 12.44 percent to 11.13 percent, whereby 9 banks become undercapitalized. Assuming that the NPA ratio of local government debts increases by 15 percentage points, the average CAR of the tested banks would drop to 10.84
percent, of which 5 banks would become undercapitalized. Under the scenario that the NPL ratio of real estate development loans raises by 15 percentage points and NPL ratio of mortgage loans raises by 10 percentage points, the average CAR of tested banks would drop to 11.33 percent while 4 banks become undercapitalized. Assuming there is 15 percent loss for the sponsored off-balance sheet exposures, the average CAR of the tested banks would drop to 11.52 percent while 4 banks become undercapitalized (Figure 2.22).

83Chapter II Soundness Assessment of the Financial Sector
Figure 2.22 Distribution of the Tested Banks’ after-shock CARs in Key Areas(Severely
Adverse Shocks)
3. Liquidity Stress Tests
The liquidity stress tests adopted a very comprehensive set of risk indicators. Tests were undertaken to assess the capacity of banks to withstand funding pressures within a 7-day, a 30-day and a 90-day period respectively. Under the adverse scenario, all of the 20 tested banks passed the tests, of which 17 banks used eligible high quality liquid assets to cover the liquidity shortfall. Under the severely adverse scenario, 13 banks passed the test while 7 banks still faced liquidity shortfalls after all eligible high quality liquid assets were depleted. Among the 7 failing banks, 4 banks failed the tests within a 30-day horizon, and 3 banks failed the tests within a 90-day horizon.
The liquidity stress tests are a simulation designed to determine the risk performance
of a given bank under extreme circumstances, and should not be interpreted as the PBC’s projection on the liquidity profile of the bank. Under the severely adverse scenario, the assigned run-off rates for the banks’ liabilities were far more conservative compared to that in the LCR framework, especially for the contingent funding obligations; and the run-off rates applied to some obligations were over 10 times of the run-off rates under the LCR framework. Moreover, according to Measures for the Liquidity Risk Management of Commercial Banks, the LCR standard is still in the transitional period. As the LCR indicator moves to the minimum standard, the eligible high quality liquid assets of the banks will further accumulate, in which caseand the liquidity performances of the tested banks are expected to improve under the same stress scenarios.
84
Special Topic 7 The Expected Loss Model in the New Accounting Standard IFRS 9 and its Impact on Commercial Banks
During the 2008 global financial crisis, the internationally applied accounting standard was the International Accounting Standards 39: Financial Instruments: Recognition and Measurement (IAS 39). The model in IAS 39, namely the incurred loss model, could only recognise credit losses when losses materialise. This model, with flaws of time lag and procyclicality, cannot fully recognise losses. As a result, it was widely criticised during the global financial crisis. After the crisis, the G20 and the Financial Stability Board (FSB) called for a global high-quality accounting standard to strengthen the accounting measurement of loan impairment and improve impairment accounting standards by fully taking into account credit information, as well as a faster global convergence. To this end, the International Accounting Standards Board (IASB) issued the International Financial Reporting Standards (IFRS) 9 Financial Instruments to replace IAS 39, which improved the recognition of impairment by replacing the incurred loss model with the expected loss model. China has accordingly revised domestic accounting standards. The implementation of the expected loss model is to have a far-reaching impact on bank capital, financial operation and risk management, etc.
I. The Two Concurrent Systems o f L o a n L o s s P r o v i s i o n : A c c o u n t i n g S y s t e m a n d Regulatory System
In the theory of banking regulation, the role of bank capital lies in that it can make up for the unexpected losses, while the loan loss provision is for covering expected losses. Capital and provision are closely related. If the risk provision is inadequate, capital will be written down. Therefore, the capital adequacy ratio (CAR) will not be reliable unless it is calculated after accurate loss provisioning. For countries adopting the IFRS, bank loan loss provision is subject to two systems: the accounting system, which is the IAS, and the regulatory system, which is the Basel framework.
The IAS 39 is based on the incurred loss model. It only recognises impairment when there is objective evidence. Under the previous domestic accounting system, commercial banks were required to establish allowance for impairment losses of financial assets based on incurred losses and include it in current profits and losses. In the meantime, banks were also asked to maintain a general reserve within equity of at least 1.5 percent of the outstanding risk assets from net profits to cover future losses.
85Chapter II Soundness Assessment of the Financial Sector
The Basel framework takes into account the expected losses. Under the Basel regulatory framework, loan loss provision is divided into specific provisions and general provisions for banks using standardised approach when calculating credit risk-weighted assets (CRWA). Specific provisions cover identified credit losses, while general provisions cover unidentified but expected losses. The general provisions are calculated as a percentage of total loans, and the proportion above the minimum requirement can be partly included in Tier 2 capital (no more than 1.25 percent of CRWA). For banks using internal ratings-based (IRB) approach when calculating CRWA, expected losses are calculated based on Probability of Default (PD) and Loss Given Default (LGD). If actual provisions are smaller than expected losses, CET 1 capital shall be deducted; otherwise, extra provisions can be partly included in Tier 2 capital (no more than 0.6 percent of CRWA). Under current domestic regulatory system, bank loan loss provisions should meet the following three requirements simultaneously: first, specific provisions are calculated based on the five-tier classification of loans, with the ratio of special-mention loans, substandard loans, doubtful loans, and losses being 2 percent, 25 percent, 50 percent and 100 percent respectively. The general provision ratio is 1 percent of the outstanding loans. Second, the regulatory requirement for provision coverage ratio (the ratio of loan loss provision to outstanding non-performing loans) is from 120 percent to 150 percent. Third, the regulatory requirement for loan provision ratio (the ratio of loan loss provision to outstanding loans) is 1.5 percent to 2.5 percent.
The IAS 39 was developed for financial reporting purpose. As a result, the recognition of asset impairment was to ensure that the balance sheet and income statement can be presented in an objective manner within the reporting period. However, under the Basel framework, loan loss provision is designed for banks to have sufficient provisions to buffer risks. Therefore, expected losses need to be taken into account, while economic and financial conditions and the solvency of borrowers should be fully assessed. The difference between these two systems may result in regulatory requirements higher than accounting requirements. Addressing two different provision requirements is a common issue facing all countries that adopt IFRS. In China, banks have to meet the higher regulatory requirements, while many European economies don’t require banks to set aside general provisions, as they use the requirement under the accounting system as final regulatory requirement.
II. The IFRS 9 based on the Expected Loss Model
Following the 2008 global financial crisis, as a response to the call of G20, the IASB issued, after rounds of public consultation and revisions, the IFRS 9 in July 2014 to replace the incurred loss model with the expected loss model, requiring recognition of full lifetime expected losses and calculation of provisions accordingly. According to the IASB, the IFRS 9 shall come into force on January 1, 2018, though with varying implementation date from country to country. The EU, Australia
86
and Hong Kong SAR, China have already adopted the IFRS 9, while the U.S. will use the expected credit loss model developed by the Financial Accounting Standards Board (FASB) and implement it in 2020. Some countries will not adopt the expected loss model.
The IFRS 9 adopts an expected credit loss model for impairment provision calculation, under which enterprises are required to assess expected loss in a forward-looking manner and timely recognise the changes in expected loss during the full lifetime of financial assets. The expected loss impairment model applies to all financial assets except those measured at fair value through profit or loss. Impairment of financial assets is recognised in 3 stages. In stage 1, as soon as a financial instrument is originated, 12-month expected credit losses are recognised. In stage 2, if the credit risk increases significantly and is no longer considered low, full lifetime expected credit losses are recognised. In both stage 1 and 2, the interest revenue is calculated as the gross carrying amount multiplied by the real interest rate. In stage 3, when there is objective evidence of credit impairment, financial assets should be assessed individually and full lifetime expected credit losses are recognised on these financial assets. Stage 3 differs from stage 1 and 2 in that interest revenue is
calculated based on the amortised cost, i.e. the gross carrying amount less the loss allowance.
III. Impact of the Impairment R e q u i r e m e n t i n t h e N e w A c c o u n t i n g S t a n d a r d o n Chinese Commercial Banks
After the IFRS 9 was published, the Ministry of Finance issued the Notice on Issuing the Revised Account ing Standards for Business Enterprises No. 22: Recognition and Measurement of Financial Instruments, introducing the concept of expected losses and expanding the scope of asset impairment recognition from on-balance sheet items to off-balance sheet credit assets, such as loan commitments and financial guarantees. Enterprises listed both on and off shore and listed only offshore are required to implement the new standard from early 2018, enterprises listed only onshore from early 2019, and non-listed enterprises from early 2021. As of January 1, 2018, 23 listed commercial banks have implemented the new standard, including 9 banks listed both on A-share and H-share markets, and 14 banks listed only on H-share marketa. The new accounting standard is expected to have the following impacts on Chinese commercial banks:
a Banks listed on both A-share and H-share markets include the Industrial and Commercial Bank of China, the China Construction Bank, the Agricultural Bank of China, the Bank of China, the Bank of Communications, the China Merchants Bank, the China CITIC Bank, the China Minsheng Bank and the China Everbright Bank; banks listed on H-share market include the Postal Savings Bank of China, the Chongqing Rural Commercial Bank, the Bank of Chongqing, the Huishang Bank, the Harbin Bank, the Shengjing Bank, the Bank of Qingdao, the Bank of Jinzhou, the Bank of Zhengzhou, the Bank of Tianjin, the Zheshang Bank, the Jiutai Rural Commercial Bank, the Guangzhou Rural Commercial Bank and the Zhongyuan Bank.
87Chapter II Soundness Assessment of the Financial Sector
Increase of loss allowance . Currently, regulations like provision coverage ratio and loan provision ratio apply to on-balance sheet loan loss provision of commercial banks, which is considered adequate. However, the provision for losses off-balance sheet is very small. The new accounting standard has shifted the recognition approach of asset impairment from the incurred loss model to the expected loss model, and expanded the recognition scope from on-balance sheet assets to off-balance sheet assets, in which case the overall loss allowance is expected to increase. Nevertheless, the intensity of real impacts would depend on the level of provision that banks have already accumulated.
Changes to banks’ size of capital. Banks’ CET 1 capital consists of common shares, capital reserves, surplus reserves and retained earnings, while Tier 2 capital consists of excess loan loss provisions, Tier 2 capital instruments and their share premium. With the implementation of the new accounting s tandard, the excess asset impairment provisions will write down retained earnings, which will directly decrease the CET 1 capital. The change in Tier 2 capital depends on the recognition of excess loan loss provisions and rules on how to include it in Tier 2 capital.
Involvement of subjective judgement
in provisioning. Subjective judgment is frequently needed when banks build the expected loss model, such as judgment on whether credit risk has increased significantly. Banks a lso have fu l l d iscre t ion when determining PD, as they can either rely on
IRB approach of the creidt risk, or develop new models based on migration rate, history of losses and expert judgment. Even if banks invariably make forward-looking adjustments to models based on IRB approach, the senior management will also need to make judgment on scenario design, macro variables and other parameters. It can be expected that asset impairment provision will be influenced by the different risk management strategies that is either prudent or loose.
Challenges to banks’ operat ion and
management. Implementation of the new accounting standard requires development of the expected loss model and massive system renovation to match with. Each system from front office (such as credit, bills, and credit cards) to middle office (risk management) and to back office (provisioning) will need to be adjusted, posing huge challenges to banks' human, financial and material resources. In addition, compared with the incurred loss model, the expected loss model is more risk sensitive with broader coverage and lower stability. Banks need to make adjustments in virtually all aspects, such as risk management strategy, pricing of off-balance sheet products, budget assessment, financial management and regulatory data reporting, which involves a huge workload.
I V. E n s u r i n g t h e S m o o t h Transition Between the Old and New Standards
Commercial banks should set up cross-department teams to enhance researches
88
and to provide analysis-based estimates and predictions in a ccoordinated manner; develop contingency plans for special events; and try to avoid any major impacts of the new standard on banks' operation. Further improve risk-based management, adopt a prudent risk management strategy and facilitate the compatibility of the new accounting standards with banks' risk management.
Relevant authorities should enhance guidance to banks' modeling practice by issuing
guidelines; review and improve the disclosure requirement; specify capital measurement rules applicable to the new accounting standard as soon as possible; intensify inspections and verification of banks' expected loss model and provisioning; urge them to incorporate the risk management principles under the regulatory framework into the measurement of expected losses; promote the compatibility of asset impairment provisioning rules with credit risk management system; and ensure that banks have adequate provisions.
89Chapter II Soundness Assessment of the Financial Sector
Special Topic 8 Containing Liquidity Risks of Money Market Funds
A rapid growth of the Money Market Funds (MMFs) has been seen in recent years in China. By the end of 2017, the total value of MMFs’ assets in China reached RMB 6.74 trillion and accounted for about 58 percent of that of all publicly offered funds. Along with the fast growth of MMFs, some flaws and risks were looming. For instance, MMFs experienced large redemption pressure at the end of 2016, which unwatered the liquidity in the money market and bond market. Moreover, the potential liquidity risks of the MMFs with on-line real-time purchasable and redeemable trading mechanism that supports intraday tradinge and payment have emerged. Therefore, we suggest further elevating the regulatory requirements on liquidity buffer and liquidity risk management for MMFs, guiding the MMF industry back to its basic function of liquidity management and providing low-risk investment products, and enhancing the supervision of MMFs which are systemically important.
I. Liquidity Risks of the MMFs
MMFs have an inherent susceptibility to
“Fund runs”. MMFs as a whole, which can evade the interest rate ceiling, are a substitution of demand deposits in their origination and development. In most of the jurisdictions (for example, China, United States, European
Union, etc.), MMFs use amortized cost method to measure the value, to reflect the stableness of profitability. Thus the par value of every share of MMFs is constantly equal to 1, while all the gains and losses are converted to changes to the total amount of fund shares regularly. While in fact, MMFs still face the liquidity risk, interest rate risk and credit risk. Especially in extreme market circumstances, the reporting value of MMFs may be largely deviated from the real value. In that case, the investors have great incentives to redeem at the same time, which will trigger a “Fund run”, largely resembling the “Bank run”. To cope with runs, MMF managers are always forced to sell their deposits, bonds and other assets, which will cause a vicious spiral of selling assets, suffering losses and selling more. In November 2016, MMFs in China experienced large redemption pressure caused by the rising of short-term interest rates on the money market, when the yield of 1-month negotiable certificates of deposit (NCDs) climed up over 200 basis points, and the China Bond Index slid by more than 2 percent. The total value of MMFs’ assets dropped sharply from RMB 4.34 trillion in mid November to RMB 3.77 trillion on December 13, a decrease of 13 percent.
The high concentration of institutional
investors will amplify the liquidity risk.
90
In general, fund managers rely on the law of great numbers to predict the volume of redemption and soundly manage the liquidity risk as long as the majority of the investors are small- or median-sized ones. However, when the investors are mainly composed of banks, insurance companies and other institutional investors, who usually hold a big lump sum of shares and possess information and other professional advantages, the huge amount of redemptions of MMFs may occur simultaneously when market shows adverse changes. Thus there will be an acceleration effect that amplifies the liquidity short fall. By the end of 2017, 45 percent of the fund buying MMFs in China came from banks and other financial institutions. Moreover, some fund management companies designed tailor-made MMFs products to satisfy the investment outsourcing needs of banks, insurance companies and other institutional investors, which further increased investor concentrationio, as well as market resonance and vulnerability.
MMFs’ r isk may spi l l over to other
markets. MMFs are the main participants of the money market and bond market in China, who allocate large portion of their assets for agreement deposits, NCDs, bonds, etc. When facing “Fund run” pressure, the fire sale of MMFs will compress the assets’ valuation and cause a spillover of liquidity risk to other financial markets, and eventually make banks and other financial institutions more fragile. In December 2016, the MMFs of China continuously encountered huge amount of daily redemptions, which is more than
RMB 50 billion. This is a significant number compared to the average daily trading volume of RMB 100 billion in the NCD markets and RMB 500 billion in the bonds market. On some trading days, the concentrated selling of NCDs by the MMFs resulted in a surge of the return rate on NCDs, and caused panic amongst investors.
The potential liquidity risks of some big-
sized MMFs are more prominent. The on-line traded MMFs are growing rapidly in resent years. The business model of those MMFs, which support intraday trading and payment and have the similar function as the demand deposits without any reserve requirement or capital constrain, have attracted individual depositors, collecting their money together, and saving the money back to banks. Since the MMFs play the role as a wholesale depositor, they have higher bargaining power than individuals and thus require higher rate from the banks, which drives the rapid expansion of their scale. At the same time, the actual clearance and settlement period of those “T+0” redeemable MMFs with banks is “T+1”. Thus once market liquidity changes dramatically, these MMFs are susceptible to runs and their risks may spill over to banks and other financial institutions. Moreover, a few big-sized “T+0” redeemable MMFs with large amount of clients and shigh interconnectedness with other financial institutions already have systemic importance. The liquidity problem of those systemically important MMFs can easily cause a risk contagion to the whole financial system, and even harm the social stability.
91Chapter II Soundness Assessment of the Financial Sector
II. Mitigating Liquidity Risks of the MMFs
A series of reform measures have been launched by the FSB, IOSCO and other international standard setting bodies, as well as authorities in the United States, European Union and other jurisdictions, to cope with the liquidity risks of MMFs revealed in the 2008 global financial crisis. China, as well, has treleased some specific rules to enhance the liquidity risk management of MMFs, including implementing the new Administrative Measures on Money Market Fund Supervision and Regulation from 1th February 2016, and promulgating the Administrative Rules on Liquidity Risks of Publicly Offered Open-Ended Securities Investment Funds, which came into force on 1th October 2017. Those two documents promoted the convergence of Chinese and international regulations on MMFs in terms of both fundamental framework and specific supervision requirements.
In June 2018, CSRC and PBC jointly issued the Guidelines on Further Regulating On-line Vendition and Redemption Services of Money Market Funds, which set the guidance on the vendition of MMFs and put some quota limits on the total amount of daily T+0 redemption, in order to correct the liquidity hallucination on MMFs among investors and ease the pressure of liquidity management of MMFs.
Other measures can be taken in future to further improve the liquidity management framework of MMFs, which include:
Enhancing the regulatory requirements on
liquidity management. Measures could be taken to increase the bottom line requirement for liquid asset portion in total fund assets, gradually lower the ceiling of the average remaining maturity requirement of fund assets, and strengthen the control on MMFs’ investment in corporate bonds. The trigger point of the redemption damping policy could be properly lowered to better match the liquidity regulatory requirements. A blocking mechanism for runs should also be established to respond to extreme market situations.
Establishing the assessment and regulatory
framework on systemically important
MMFs. Higher requirements on systemically important MMFs should be set up, including risk provisions, l iquidity management, diversification of investment etc. Other options may include taking systemically important MMFs into MPA and conducting regular assessments on them.
Enhancing investor protection while
correcting the unrealistic expectation for
promised principal and interests. Measures should be taken to clarify the role and objective of the MMFs by guiding the industry back to its basic function of managing liquidity and providing low-risk investment products. MMF supervision and investor protection should be enhanced by strengthening disclosure requi rements and inves tor educa t ion , requiringe sales agencies of MMFs to make full disclosure of relevant risks by announcing material issues such as T+0 redemption amount restrictions, service suspension and termination

92
clauses, and investment gains. To correct the investors’ unrealistic expectation for high returns with low risks upon MMFs, relevant operations should be strictly prohibited, such as exaggerating some fuctions of fund accounts
including cash withdrawal and payment, comparing the expected return of MMFs with demand or time deposits, and making promises for principal and interests, etc.
93Chapter II Soundness Assessment of the Financial Sector
Special Topic 9 Risk Analysis and Policy Measures of Locally-regulated Financial Institutions and Platforms
According to the division of regulatory responsibilit ies, local governments are m a n d a t e d w i t h t h e s u p e r v i s i o n a n d resolution of a range of financial institutions and platforms based on the principle of territoriality, which include micro credit companies (MCCs), financing guarantee firms, regional equity markets, pawnshops, financial leasing companies, commercial factoring companies, local asset management companies, local investment companies, special farmers' cooperatives for mutual credit help, crowd funding institutions, and a variety of local transaction platforms. In recent years, there have been cases where local financial regulatory authorities highlight growth at the expense of supervision or relax their regulatory requirements, and as a result of which a few locally-regulated financial institutions and platforms experienced very aggressive growth, and involved themselves in prohibited business activities. In response, relevant authorities launched a campaign to clean up and rectify illegitimate activities of local financial institutions and platforms, which has yielded positive results so far as risks associated with these institutions and platforms have been mitigated in an orderly fashion and regional financial risks have been diminishing. However, there remain problems that need to be addressed. In order to actively resolve the risks of local financial institutions
and platforms, protect the legitimate rights of investors and foster a sound environment for local financial development, efforts should be made to further specify local governments' responsibil i t ies in the supervision and resolution of institutions and platforms within their regulatory parameter, and proactively guard against and mitigate relevant risks of these entities.
I. Essential Risks of Locally-regulated Financial Institutions and Platforms
A number of MCCs operate with weak
risk management, highly-leveraged funds,
and in violation of regulations. First, some MCCs operate across regions in violation of relevant regulations. The licenses of some MCCs are issued by municipal or county-level governments, whose authority are delegated by the provincial governments, and in practice these MCCs operate their businesses nationwide through the Internet platform and mobile phone applications, which is a violation of the regulations that MCCs, whose licenses should be issued by provincial governments, are not allowed to operate beyond provincial boundaries. Second, some MCCs facilitate loan issuance with high leverage ratio in a disguised form. Some MCCs promise guarantees to financial institutions that are

94
funding sources of them, and issue loans with high interest rates, so as to facilitate loan issuance in a disguised form using funds from those financial institutions. Third, some MCCs lack adequate credit risk management and risk control measures. Some MCCs do not have loan approval process and heavily rely on external credit ratings for risk control purpose. At the same time, as their funds partly come from financial institutions including banks and trust companies, credit risks of MCCs may spread to other financial institutions in the form of reputational risk and liquidity risk. In addition, MCCs also feature potential risks including unreasonably high borrowing costs, suspicion of usury, violent dunning-related crimes or mass participation events.
Financial asset markets are yet another
source of potential risks. For some time, local governments have approved in large quantity the set-up of local financial asset markets by the name of “financial asset exchange” or “financial asset trading center”. As of end 2017, there are altogether 70 such local financial asset markets nationwide, where huge potential risks may arise. First, some financial asset markets have become de-facto unsupervised, full-license financial institutions for trading all kinds of revenue-generating assets except for insurance products, credit and gold, and served as shadow banking. However, most of these markets do not have enough capital strength for possible redemption risk, in which case associated risks may spread to shareholders and other financial institutions. Second, some markets split income receiving right into small tradable units, so as to break
the upper limit of 200 investors for private placement products. High risks are transferred in this way to ordinary investors who don't have adequate abilities to identify and bear risks. Third, due to the lack of effective supervision and regulation, some markets are used as “cash machine” for controlling shareholders.
Some institutions and platforms are found
to offer asset management products,
which makes the risks spread among large
number of people. Some locally-regulated financial institutions and platforms partner with financial institutions to establish business lines to offer asset management products. They usually promise guarantee on principal and interest to investors, creating a perception of full repayment; Potential risks may also arise as issuers of those asset management products are plagued with highly-leveraged funding, unauthorized issuance and insolvency problems.
I I . C h a l l e n g e s f o r t h e Supervision of Local Financial Institutions and Platforms
Local governments tend to place an over-
emphasis on financial development at the
expense of supervision. Supervisory resources are insufficient among most local governments. Some local financial supervisory authorities are mandated with conflicting objectives of growth and supervision, and tend to interfere with financial institutions’ independent operation to serve economic growth. In particular,
95Chapter II Soundness Assessment of the Financial Sector
there are issues of “tight licensing and weak supervision” and “emphasis of financial development over risk controls”. Against this background, locally-regulated financial institutions and platforms have experienced aggressive growth, bringing disruptions to market discipline.
L o c a l g o v e r n m e n t s f a i l t o a d d r e s s
i l l e g i t i m a t e a c t i v i t i e s b y f i n a n c i a l
institutions and platforms once and for all.
Till now, most local governments have already launched campaigns to clean up and rectify illegitimate activities by financial institutions and platforms within their supervision. But there are still governments who fail to properly perform their responsibilities of supervision and risk resolution, with illegitimate operations by some local financial institutions and platforms left unaddressed. Even worse, some local governments continue to approve new institutions and platforms without completing clean-up and rectification of existing ones and regardless of possible risks. For example, local financial asset markets are included in the list for clean-up and rectification as ordered by the State Council. But still, the number of such markets increased from 66 at end 2016 to 70 at end 2017 rather than decrease, despite the follow-up inspection on the progress of rectification initiated by local governments in early 2017. There were even 5 or 6 local financial asset markets existing in one province.
T h e r e e x i s t s u p e r v i s o r y g a p s . T h e development of new technologies, including information technology, has created new
business models like the Internet finance; the use of the Internet technology in their transactions, however, by locally-regulated institutions and platforms has facilitated their illegitimate operations to become further untraceable, and increased the speed of risk contagion and the number of investors involved. In this regard, a relatively loose regulatory environment and ambiguities of responsibility in cross-regional risk prevention and supervision have resulted in a lagging-behind policy response and inadequate risk control measures.
III. Policy Recommendations
The prevention and mitigation of regional financial risks remain the top priority for local financial authorities for the time being and some time to come. Local governments must fully understand the key spirits of the fifth National Financial Work Conference, take full responsibilities in supervision and risk resolution, actively contain and mitigate risks associated with local financial institutions and platforms.
Fully implement licensed operation of
financial institutions and businesses. It is a prerequisite to be granted license before doing financial businesses. Illegitimate activities or unlicensed institutions will be banned altogether, and relevant authorities should crack down on businesses that operate beyond licensed scope.
Translate into action local governments'
responsibilities in supervision and risk
96
resolution, and increase accountability. While the authority of financial regulation remains with the central government, local governments, in accordance with the unified rules by the central government, should reinforce their sense of responsibilities in supervision and risk resolution in the principle of territoriality. The newly-established F inanc ia l S tab i l i ty and Deve lopment Committee of the State Council, mandated with the role of guiding financial reforms, growth and supervision at the local level, is responsible for the surveillance and accountability of local governments' performance of duty.
Enhance regulatory coordination between
the central and local financial authorities.
Establish and improve the coordination between the central and local financial authorities on financial supervision, risk resolution, information sharing and customer protection, so as to address regulatory gaps and arbitrage.
S t r e n g t h e n t h e r u l e - m a k i n g o f
s u p p l e m e n t a r y r e g u l a t i o n s a n d
administrative rules, and improve investor
e d u c a t i o n a n d p r o t e c t i o n . D e v e l o p and improve rules on the regulation and supervision of local institutions and platforms, particularly rules on the supervision of MCCs, finance guarantee corporations, pawnshops, financial leasing companies, etc. Establish a sound credit system, apply tougher punishment on illegal activities, so that a higher price will be paid for violations. Enhance investor protection, and attach greater emphasis on investor appropriateness management and investor education.
Further push forward financial reforms.
The aim is to show the right way for doing financial businesses and block the crooked ways. Enhance financial reforms to create a sound institutional base on which a long-effective risk prevention regime can be established, and to ultimately wipe out the soil for various illegitimate financial activities.
97Chapter II Soundness Assessment of the Financial Sector
Special Topic 10 Supervision of Capital and Equities of Insurance Companies
In recent years, misconduct such as false report of capital and tunneling behavior by controlling shareholders has been increasingly observed in the insurance sector, highlighting the urgent need to address regulatory gaps through institutional enhancement and the promotion of a more scientific, targeted and effective regulation of capital and equity of insurance companies.
I. Issues Regarding the Capital and Equity Management of Insurance Companies
Some shareholders use non-proprietary
money to fund the company or make false
capital contributions. Instead of using proprietary money, some shareholders purchase shares of insurance companies with borrowed money f rom loans , asse t management plans, trust schemes, etc. Worse still, a few companies are found to use insurance funds to inject capital to themselves, or involve in repeated injections of capital and false capital contribution.
Some major shareholders engage in
tunneling via insurance companies. In companies with complex equity structure and low transparency, major shareholders managed to hold huge amount of shares via hidden means and gained control over the insurance
company, which they use as a financing vehicle to obtain insurance funds though affiliated transactions and to transfer benefits to other enterprises within their group.
Some insurance companies operate highly
risky business. The current regulations on solvency are inadequate and capital requirements for risky assets and high-cost liabilities need further improvement. With the relaxation of regulatory limits on products tarriffs and proportion of investment, some insurance companies started aggressive operation by selling huge amount of universal insurance products of mid- and short-term duration. As a result, insurance products are turned into short-term wealth management products and a large proportion of these insurance funds are invested in equity assets and the property market, leading to maturity mismatches.
I I . T h e S u p e r v i s i o n a n d Admin i s t ra t i on o f Cap i ta l and Equi t ies of Insurance Companies before 2017
Requirements on registered capital . According to the Insurance Law, registered capital of an insurance company should be no lower than RMB 200 million. The Administrative Measures for Equities of
98
Insurance Companies issued in 2010 further stipulated that shareholders of an insurance company should invest in the company with proprietary money of legitimate sources and non-proprietary money from bank loans or other sources are forbidden.
Requirements on capital adequacy. In 2003, the insurance regulatory authority released the Provisions for the Administration of Solvency Margins and Regulatory Index of Insurance Companies which established a regulatory system for solvency of insurance sector on a preliminary basis (hereinafter referred to as “Solvency I”). In 2008, the Provisions for the Solvency Administration of Insurance Companies was released, which specifies that the solvency adequacy ratio, or capital adequacy ratio, is the ratio of available capital to minimum capital. Insurance companies should have capital proportionate with their risk levels and sizes of their business operations, and ensure that their solvency adequacy ratio stays no lower than 100 percent. For companies with thesolvency adequacy ratio lower than 100 percent (insolvent), they will be subject to remediation measures such as capital replenishment, limitations on dividend payout, new business suspensions or takeovers as required by the regulator.
In January 2016, the insurance regulatory authority launched the China Risk-oriented Solvency System (hereinafter referred to as “C-ROSS”) and established the “three-pillar” framework. The first pillar, or the “quantitative regulatory requirements”, includes criteria on capital classification, evaluation of assets
and liabilities, minimum capital calculation, and stress testing, etc. In the calculation of minimum capital requirement, the size-oriented model adopted by the previous regime is replaced with the risk-oriented model, where risk scenarios and risk factors are identified based on the probability distribution of all types of business risks to calculate the minimum capital requirements for quantifiable risks such as insurance risk, market risk and credit risk. The second pillar, the “qualitative regulatory requirements”, includes the integrated risk rating, the risk management assessment and the liquidity risk regulatory regimes targeting operational risks, strategic risk, reputational risk and liquidity risks that are difficult to quantify, so as to make comprehensive evaluation of solvency of insurance companies and link risk management capabilities with capital requirements. The third pillar, the “market discipline mechanism”, allows market stakeholders to play a minitoring role by means of information disclosure, credit rating of insurance companies, etc.
Requirements on equities management. According to the Administrative Measures for Equities of Insurance Companies released in 2010, major shareholders of an insurance company (defined as those holding 15 percent or more shares) should meet such requirements as keeping profitable record for the latest three consecutive accounting years, having net assets no lower than RMB 200 million, etc. In terms of limitations on shareholding proportions of single shareholders, the Administrative Measures stipulated that the capital contributed or shares held by a single
99Chapter II Soundness Assessment of the Financial Sector
shareholder (including affiliates) should not exceed 20 percent of the company’s registered capital. In accordance with the principles of maintaining strategic investment and optimizing management structure, the shareholding proportion may exceed 20 percent upon approval. In April 2013, the insurance regulatory authority released the Notice on Issues Relating to Article Four of the Administrative Measures for Equities of Insurance Companies, which specified that the ceiling for shareholding proportion of single shareholders should be no higher than 51 percent.
III. Measures to Strengthen Supervision and Administration of Capital and Equities since 2017
Since 2017, the insurance regulatory authority has adopted, on top of existing regulatory rules, multiple measures to address vulnerabilities in the institutional arrangement of insurance regulations, particularly vulnerabilities in the capital and equities management of insurance companies.
Release the “1+4” package, in an effort to
tighten the supervision and administration
of capital and equities. A series of regulatory documents has been released in April 2017, including the Notice on Further Enhancing Insurance Regulation and Maintaining the Punishing Stable and Healthy Development of the Insurance Industry, the Notice on Further Strengthening the Risk Prevention and Control
of the Insurance Industry, the Notice on Enhancing Insurance Regulation, Cracking down on Violations of Laws and Regulations and Addressing Market Irregularities, the Notice on Fixing Weakness in Regulation and Developing A Rigorous and Effective Insurance Regulatory System and the Guiding Opinions on the Support of the Insurance Industry forto the Development of the Real Economy, alternatively referred to as the “1+4” package. In terms of the supervision and administration of capital and equities, intensive efforts have been made to address issues such as the use of insurance funds by shareholders to inject capital into the very company, capital contribution with non-proprietary money, incomplete provision of allegedly contributed capital or illegally withdrawal of capital. Behaviors such as entrusted shareholding and illegal connected shareholding are strictly prohibited. For shareholders who fail to report the real source of contributed capital or any affiliation relationships, measures will be taken to revoke administrative approval, restrict his/her exercise of voting rights as shareholders, and subject his/her shares in the company to transfer or auction, etc. Since 2017, a number of penalties have been issued by the insurance regulator to insurers and responsible persons for violations such as illegitimate shareholding and false capital contributions.
Launch the second-phase project of the
C-ROSS. The insurance regulatory authority released in September 2017 the plan for the second-phase project of the C-ROSS, which points to the three tasks of enhancing regulatory rules, optimizing operational
100
arrangements and strengthening regulatory cooperation, and made clear the plan to complete the upgrading of the C-ROSS over a three-year period. The Provisions on the Administration of the Solvency of Insurance Companies (for consultation) was also published, in an effort to address potential solvency risks, false reporting of solvency data, weak accountability of the insurer as the responsible entity by establishing the off-site examination and on-site inspection regimes of solvency data, and categorizing companies in terms of their , solvency adequacy ratios, available capital and integrated risk ratings, so that regulatory measures can be taken based on causes and severity of risks.
Revise the Administrative Measures for
Equities of Insurance Companies to enhance
regulation on the authenticity of equities
and capital . The insurance regulatory authority published in March 2018 the revised Administrative Measures for Equities of Insurance Companies, lowering the ceiling of shareholding proportions of a single shareholder from 51 percent to one third. The document further specifies that investment in shares of an insurance company should be funded by proprietary money from legitimate sources and that the funding sources will be traced backwards. The document aims to implement penetrating supervision of equity structures and penetrating examination of the investors' background, qualifications and affiliation relationships in order to eliminate hidden affiliation relationships, invisible shareholders and illegal entrusted shareholding. The document also tighthens punishment
of noncompliances by applying a range of corrective measures including regulatory rectification, limitations on shareholder rights, transfer of shares held as ordered by the regulator, and revocation of administrative approval, etc.
IV. Fur ther Enhancing the Supervision and Administration of Capital of the Insurance Industry
Firmly adhere to the basic principle
that “Insurance is first and foremost the
guarantee of safeguards and financial
supervision the exercise of regulatory
authority”. The foundation of the insurance sector is to provide safeguards against risks. The ultimate goal of the regulatory authority is to protect public interests, ensure market equity and maintain stability of the insurance sector. It is important to adhere to the principle that “Insurance is first and foremost the guarantee of safeguards and financial supervision the exercise of regulatory authority”, particularly to give a guiding role to the supervision and administration of capital and equities, in order to facilitate the pivot to insurance businesses of the insurance sector and serve as a means of long-term and robust risk management and safeguards.
Review the solvency rules and strengthen
capital requirements. It is important to improve regulatory rules on risk capital requirements, calibrate existing standards comprehensively and promote a more scientific risk measurement regime and a more efficient
101Chapter II Soundness Assessment of the Financial Sector
risk management regime. Measures should be taken to improve the integrated risk rating system, and regulatory requirements and evaluation for solvency risk management to make it more reliable. Restrict the operation of highly risky businesses of insurance companies though higher capital requirements.
Strenghen law enforcement and resolve
and mitigate risks in a timely manner. It is important to strengthen supervision of the key businesses of key companies, and verify sources of contributed capital provided by shareholders to ensure that it is
proprietary money obtained legitimately and authentically. For violations such as false capital contributions or capital injection with insurance funds, the responsible institutions and persons will be held accountable as part of the efforts to maintain market discipline. For serious criminal violations, the case will be transfered and subject to judicial process. For insolvent companies, targeted measures such as suspension of approval for the set-up of new institutions or new business shall be taken; and for those severely insolvent companies, market exit will be implemented as necessary.
102
Special Topic 11 Establishment of the Online Payment and Clearing Platform for Non-bank Payment Institutions
In line with the overall arrangement of the special campaign on addressing Internet finance risks, the PBC embarked on establishing the online payment and clearing platform for non-bank payment institutions (hereinafter referred to as the NetsUnion clearing platform) in October 2016 and put it into trial operation at the end of March 2017. The NetsUnion clearing platform, a major integral part of China’s financial infrastructures, mainly processes bank account-related payment activities initiated by non-bank payment institutions (NPIs). The establishment of the NetsUnion clearing platform will contribute to a sound payment market by optimising resource allocation in payment and clearing market, cracking down on payment market
irregularities, and preventing financial risks.
I. Centralised Clearing and Its Advantages
Payment activities are typically categorised into intrabank and interbank payments depending on whether the payer and the payee open bank accounts in the same bank, with interbank payments requiring interbank fund clearing. Clearing is an important link in payment process, which involves the confirmation, transfer, and check of payment orders between different banks with which
the payer and the payee open bank accounts. Then debts and claims to be settled will be calculated and settlement positions will be generated. Prior to the emergence of central banks, interbank clearing was usually accomplished through correspondent banks, i.e. calculating funds receivable and payable of interbank payments by opening bank accounts in each other, which was a multi-step, costly, and inefficient approach. With the central clearing platform developed by central banks, banks can complete interbank payments simply by opening one account in the central bank and no longer need to open multiple accounts and deposit funds in advance. Practices have shown that the bigger the payment volume, the more evident the advantages in saving resources and improving efficiency.
The 2008 global financial crisis highlighted the above advantages of central clearing and its important role in preventing risks. During the global financial crisis, that a large number of derivatives trading were not centrally cleared through central counterparties (CCPs) resulted in global wide risk contagion caused by the fund shortage of some market participants. Given that central banks usually have to act as the lender of last resort during risk events, the international community reiterated in the wake of global financial crisis that central
103Chapter II Soundness Assessment of the Financial Sector
banks should enhance the macroprudential regulation of financial market infrastructures (FMIs) and stressed the importance of central clearing in more effectively managing risks of FMIs. Compared with clearing through correspondent banks, which was a long and complicated process with difficulty in monitoring individual liquidity and credit risk, central clearing makes it possible to clearly assess individual risk exposures and interconnectedness, to effectively forecast risks, to lower counterparties’ credit risk through multilateral netting and risk allocation, and to prevent the contagion of individual risk through segregation when necessary.
II. Potential Risks of Clearing through Correspondent Banks by Connecting NPIs Directly to Banks
In 2010, the PBC issued the Administrative Measures on Payment Services of Non-financial Institutions, allowing non-financial institutions to provide payment services. Since then, non-bank payments, online payments in particular, have grown by leaps and bounds. Clearing through correspondent banks was a typical clearing mode among China’s NPIs prior to the establishment of the NetsUnion clearing platform. Each of the 115 payment institutions providing online payment services was connected to the systems of over a hundred
banks, which has a number of potential risks.
Firstly, opening multiple accounts leads to higher maintenance costs and a severe waste of
resources. Secondly, payment information is highly fragmented and unregulated due to the lack of unified interface standards and security procedures, which may give rise to higher potential risks. Particularly in recent years, some payment institutions have provided fund settlements for local equity exchanges and even unlicensed financial trading venues and engaged in large-value wholesale payment services, which may easily trigger systemic risks due to the lack of central clearing. Lastly, clients’ reserves are scattered, which is susceptible to risk of embezzlement and frauds. Unfair competition such as low-price dumping and cross-subsidy runs rampant among some payment institutions that take advantage of interest accrued on clients’ reserves, while some large payment institutions have a bigger bargaining power by using high levels of reserves as a lure and increase funding costs, which has made it more difficult and costly to finance. Their behaviours have disrupted the market disciplines and eroded healthy market development.
III. Overview of the NetsUnion Clearing Platform
To effectively address potential risks from NPIs and promote healthy payment market development, the Payment and Clearing Association of China spearheaded the effort to establish the NetsUnion Clearing Corporation (NUCC) based on market principles. The NUCC, with NPIs being the shareholders, is responsible for operating the NetsUnion clearing platform.
104
Being the national unified clearing system, the NetsUnion clearing platform mainly handles bank account-related payment activities initiated by NPIs. Commercial banks and NPIs are connected through the NetsUnion clearing platform, which can provide public, safe, efficient and economical transaction data transfers and fund clearing services. The NetsUnion clearing platform is responsible for the development and implementation of unified standards and regulations for the platform and online payment market, coordinating and arbitrating business disputes, and providing professional support and supplementary services like risk control. In line with the principle of co-building, co-ownership and sharing, the NetsUnion clearing platform adopts a distributed organizational structure.
In August 2017, the PBC issued the Notice on Switching Online Payment Activities by Non-bank Payment Institutions from Direct Connection to the Internet Platform, requiring online payment activit ies by payment institutions to be cleared through the NetsUnion clearing platform. As of end-2017, 248 banks and 65 payment institutions have connected to the NetsUnion clearing platform.
I V. T h e S i g n i f i c a n c e o f Establ ish ing the NetsUion Clearing Platform
Optimiz ing resource a l locat ion and improving payment efficiency. The operation of the NetsUion clearing platform will provide unified and public fund clearing services, lower the connection cost, improve processing
efficiency and achieve the Pareto improvement of the whole market.
Promoting clearing transparency and
preventing systemic risks effectively in a
timely manner. The establishment of the NetsUion clearing platform will promote the transparency of clearing, make it easier for regulators to monitor flows of funds and related risks, and identify potential risks in a timely manner, so as to effectively prevent systemic risks.
Rectifying payment market irregularities
a n d s a f e g u a r d i n g s o u n d m a r k e t
development. The establishment of the NetsUion clearing platform will ensure the safety of clients’ funds as it supports the central depository of clients’ reserves. More importantly, it will help maintain a level playing field and guide more payment institutions to return to the original functions of focusing on business innovation and service improvement. This will help avoid market monopoly and promote sound and sustainable market development.
Ensuring e f fect ive monetary pol icy transmission. Many of the PBC’s monetary policy tools rely on the payment system, such as open market operations, SLF and MLF, etc. Through adjusting the intraday liquidity of participants in the payment system, the policy operations can indirectly affect the interbank offered rate and achieve central bank’s monetary policy adjustment objectives. After the establishment of the NetsUion clearing platform, funds of payment
105Chapter II Soundness Assessment of the Financial Sector
institutions and information will be processed in a centralised manner, with the flows of funds more transparent and easier to monitor, which will facilitate effective monetary policy transmission.
Facilitating the crackdown on financial crimes. As regulatory efforts are increased
regarding anti-money laundering (AML) and combating the financing of terrorism (CFT), the establishment of the NetsUion clearing platform will help further improve AML/CFT monitoring mechanism and effectively crack down upon illegal activities taking advantage of the Internet.
106
a b
a Blockchain functions as a distributed ledger database technology featuring decentralized control, which stores transaction records in blocks. For each block that is newly created, a transaction verification will be conducted through computational process before it is attached to existing blocks in a chain.b Crypto-assets, for the payment function it carries, is sometimes referred to as “crypto-currency”, or “virtual
currency”, “private digital currency”.
Special Topic 12 Risks Related to Crypto-assets
Along with the increasingly wider integration between the Internet and traditional industries, distributed ledger technology (DLT), typically “blockchaina”, has emerged rapidly. As one of the applications of blockchain technology, crypto-assetsb, as in the case of Bitcoin and Ether, have attracted wide attention. On top of this application, a large number of trading platforms for crypto-assets and new funding models, such as Initial Coin Offering (ICO), have been created. At the same time, however, the absence of appropriate regulation and supervision in the area has resulted in a huge margin for speculation; arising issues, such as speculative behaviours, vulnerability to criminal purposes and frequent violations of investors' rights, could potentially harm the real economy. In 2017, the PBC, together with other authorities, launched an overhaul of the Internet finance activities and ordered bans on ICOs and crypto-asset trading platforms providing exchange services. These regulatory moves help to bring risks associated with crypto-assets further under control and serve as a benchmark of global regulatory practices in this regard. Going forward, consistent efforts should be made in closely monitoring the latest
developments of crypto-assets while rigorously implementing rectification of related activities, enhancing investor protection and education, as well as improving international cooperation.
I. Overview of the Crypto-asset Markets
Crypto-assets are a type of private financial assets that depends primarily on cryptography and DLT as part of its perceived or inherent value. Since not issued by a monetary authority, crypto-assets lack key attributes of fiat money such as enforceability, and are not considered as currency in legal status. In the case of Bitcoin, it was first created as a reward mechanism for maintaining nodes on the blockchain. Similar applications such as Ether, Ripple and Litecoin have emerged as the blockchain technology develops. ICO got its name from its resemblance to Initial Public Offering (IPO), and is commonly used to describe the action of blockchain developers raising crypto-assets such as Bitcoins or Ethers through the issuance of self-defined digital tokens.

107Chapter II Soundness Assessment of the Financial Sector
Issuance of crypto-assets. Bitcoin was first launched in 2009, and its total number was limited to 21 million by the network consensus protocol. It is mainly acquired by providing computational power to the blockchain system, a process known as "mining". Since then, more crypto-assets have emerged using similar mechanism. According to statisticsa, while there were 66 varieties of crypto-assets in 2013, the number quickly rose to 644 in 2016 and 1335 as of end-2017. ICO first appeared in 2013 as a funding channel for blockchain technology-based businesses. As ICO began to show promise for profits and the prices for various crypto-assets spiked, a large crowd of opportunistic investors were drawn to ICO, pushing its numbers to rise drastically. As of July 18, 2017, the total number of completed ICOs in domestic market was 65, of which only 5 were launched before 2017. Together, these 65 domestic ICOs had registered 105,000 participants and an accumulative funding scale
of around RMB 2.616 billion, accounting for 20 percent of the global scale in the same periodb.
Crypto-assets transactions. The increased popularity of and trading needs for crypto-assets lead to the appearance of publicly-available online trading platforms that provide electronic order matching and centralized continuous bidding services for Bitcoin and tokens, which have attracted a mass of investors. In this process, the types and prices of crypto-assets and the number of relevant trading platforms have experienced a boom. Capitalization of crypto-assets over the years has skyrocketed from around USD 10 billion at end-2013 and USD 16.1 billion at end-2016 to USD 572.9 billion at end-2017, accompanied by price bubbles and excessive volatility (see Table 2.2). As of April 2018, the number of trading platforms for crypto-assets has exceeded 10,000c.
Table 2.2 Annualized Daily Return Volatility of Different Assets in 2017
Asset Type Volatility
S&P 500 6.66%
Gold (LME) 10.19%
Crude Oil (Brent) 23.85%
Bitcoin 97.18%
Ether 136.68%
Source: Wind, Bitfinex, and the PBC staff calculation. The returns of Gold, Crude oil, Bitcoin and Ether in US D.
a Source: www.coinmarketcap.comb National Committee of Experts on the Internet Financial Security Technology: Semi-annual Report on the
Development of ICOs in the Domestic Market, July 2017. c On-line source: www.coinmarketcap.com.
108
I I . Issues and Chal lenges Arising from the Crypto-assets
The boom in the crypto-asset related activities is a reflection of the popularity of emerging technologies such as blockchain. However, the fact that the market became highly speculative as it was developing with no market discipline has made it vulnerable to criminal activities including money laundering and terrorism financing, and gave rise to issues like fraud and banker control. These challenges and potential violations to investors' rights call for regulatory alarm.
Market indiscipline-induced speculation.
The highly volatile prices of crypto-assets and absence of effective supervision in the early stage have resulted in a chaotic crypto-asset market and facilitated speculative behaviours in the industry. In this process, risks have rapidly accumulated, bringing severe disruptions to the financial and economic operations and the social order at large. The disarranged marketplace has also given rise to adverse selection and distorted incentives, potentially driving entrepreneurs away from creative innovation to quick cash. In particular, bubbles in the market are making it hard for those blockchain start-ups working on real innovation to get properly financed, obstructing the sound growth of the industry in the long run. Furthermore, technological developments in the industry are less applied to the real economy, nor contributed to the growth of the real economy, accelerating the flow of funds to the fictitious economy instead of the real economy.
Lack of the protection of investors' rights.
In terms of issuance, the financing entities of ICO projects could be hugely varied in their qualifications. There is a general lack of investor eligibility control and information disclosure; some projects have no underlying assets and advertise with fake prospectus; and "copycating coins" or "air coins" are pervasive on the market. In severe cases, initiators of some ICOs have found to abscond with investors' money, and financing activities of other ICO projects involve unauthorized securities issuance, illegal fund-raising, fraud, pyramid selling and other crimes. Investors face multiple potential r isks including fraudulent issuance, false underlying assets and business failures. In terms of trading, crypto-asset trading platforms often offer speculative transactions to the public through electronic order matching and centralized bidding system. These transactions feature much higher price volatility than traditional financial products as well as elevated risks, as they are free of limitations on price fluctuation or trading hours. High concentration, lack of liquidity, the presence of speculative behaviours and banker control are yet another issues with the trading of crypto-assets.
Vulnerabi l i ty to cr imes . There have been cases where the name of “blockchain innova t ion” i s used as a g immick by institutions and individuals to involve ill-informed individual investors in de-facto illegal fund-raising, unauthorized securities trading and pyramid selling activities under the disguise of crypto-asset concept. Furthermore, the anonymity of crypto-assets transactions
109Chapter II Soundness Assessment of the Financial Sector
has made the sources and usages of large investments in crypto-assets untraceable, which facilitates money laundering, illegal dealings, financing for terrorism and circumvention of capital controls and international sanctions. These weaknesses undermine the effectiveness of law enforcement and cause negative consequences to the society. In May 2017, the hit of a ransomware called "WannaCry" affected at least 200,000 sets of equipment in more than 150 countries. In that case, "WannaCry" asked affected users to pay ransom in Bitcoins to get around investigation.
III. Regulatory Developments in Crypto-asset Related Areas
1. Domestic regulatory developments
Issuing warnings for Bitcoin risks. In December 2013, the PBC and four other authorities released the Notice on Bitcoin Risk Prevention, directing financial institutions and payment service providers not to conduct business related to Bitcoin. Regulators have utilized various channels to warning risks associated with Bitcoin and to clarify the difference between Bitcoin and currencies.
Conducting on-site reviews of crypto-
asset trading platforms. In January 2017, the PBC led several on-site inspections of Bitcoin and Litecoin trading platforms for any existence of out-of-scope business operations, market manipulations, violations of anti-money laundering rules and fund security risks. Regulators also urged relevant entities to conduct self-check and wind-down of
inappropriate businesses in accordance with laws and regulations.
Ordering bans on ICOs and trading
platforms. In September 2017, the PBC and 6 other authorities jointly released the Notice on the Prevention and Mitigation of ICO-related Risks, which specifies that ICOs are essentially unauthorized and illegal public offerings, and may involve illegal issuance of tokens and notes, unauthorized issuance of securities, illegal fund-raising, financial fraud, pyramid-selling and other crimes. The Notice also put a ban on ICOs and ordered a time-limited shutdown of trading platforms. Amidst this rectification, major domestic ICO platforms put up notices to no longer provide services for any new token issuing or financing, while some platforms announced fund-return plans for ongoing ICO projects. Investors of multiple projects have received returned funds and trading platforms have gradually wound down crypto-asset businesses before exiting the market.
2. International regulatory developments
In general, the regulatory attitudes of major economies on crypto-assets and related areas are varied and changing dynamically. Despite this, however, national authorities have invariably monitored and warned on potential risks of crypto-assets. As the size of crypto-assets grows, so do their implications and risks, which warrants a tighter policy stance from relevant regulators.
South Korea, India and Indonesia have
110
issued bans on specific crypto-asset business. Financial Services Commission (FSC) of Korea announced in September 2017 a notice that ICOs are against laws of the capital market and that tough punishment will be inflicted upon anyone who participates in such activities as the authorities tighten control and monitoring of crypto-trading activities. Later on, FSC further banned financial intermediaries from establishing positions on crypto-assets or making crypto-asset transactions through anonymous banking accounts. The Reserve Bank of India, in a public notice issued in September 2017, confirmed that Bitcoin and other crypto-assets are not legal means of payment. The Bank Indonesia also denied crypto-assets as legal means of payment in a notice in January 2018.
Japan, the US, Singapore, and HK SAR
have explored ways to bring crypto-
assets under the regulatory framework.
Japanese policy-makers tend to be open-minded toward crypto-assets. In March 2017, Financial Services Agency of Japan amended the Payment Services Act to acknowledge Bitcoin as a legal means of payment. The amendment also requires virtual currency exchanges to register with local authorities. As of April 2018, a total of 16 exchanges have received their licenses. The US regulators have explored ways to bring Bitcoin and ICO in line with existing regulatory framework. One is through licensed management. The National Conference of Commissions on Uniform State Laws approved the Uniform Regulation of Virtual Currency Businesses Act in July 2017, by which qualified service
providers must register and obtain a license to conduct virtual currency business activities. For another, regulators including the Securities and Exchange Commission (SEC) and the Commodity Futures Trading Commission (CFTC) have taken civil enforcement actions to combat fraud, market manipulation and confusion on the virtual currency market. Furthermore, legislation for crypto-assets have been advocated. For example, the SEC considers ICO as de-facto securities offering that warrants specific regulatory rules under the Securities and Exchange Act. Finally, relevant regulators have strengthened communication to the public and warned investors against potential r isks. Monetary Authority of Singapore published an announcement in August 2018 that the authorities would consider to bring digi tal tokens under regulation and supervision if they belong to regulated products under the Securities and Futures Act. Hong Kong Securities and Futures Commission (SFC) explained in a statement in September 2017 that certain ICO activities fall into the category of securities offering and may be subject to the securities laws of HK. In March 2018, SFC took a regulatory action to halt an ICO.
Russia, Switzerland, and Malaysia have
closely monitored and issued warnings on
crypto-assets where necessary. Regulatory authorities in the above jurisdictions all issued notices on the risks within crypto-assets that investors may be unknowingly involved in illicit activities due to the anonymous nature of transactions. They are also vigilantly monitoring the market and working out
111Chapter II Soundness Assessment of the Financial Sector
approaches to effectively regulating crypto-assets.
IV. Policy Recommendations
Positive progress has been made in rectifying the crypto-asset market, with potential risks effectively addressed and mitigated. However, those suppressed illicit activities may swiftly transfer and continue to plague the financial system in other forms. For instance, businesses disallowed by domestic regulators may bypass the rules by operating overseas, and new fraud schemes emerge through proxy investment or payment. One variant of ICO identified is that instead of financing through coin offering, initiators offer complimentary coins while keeping a portion of coins to themselves, and then bid up prices to make a profit. The rectification, therefore, has to be an on-going effort. The prevention and mitigation of
potential risks need to be carefully planned in a precautious manner, and mechanism should be put in place for early identification, early warning, and early resolution. First, maintaining a tough-handed stance on crypto-assets and intensify rectification. Various measures need to be adopted to crack down on emerging cases of violation, to safeguard the market order and encourage the flow of funds back to the real economy. Second, enhancing coordination among domestic regulators to make concerted efforts, and ensure the implementation of functional regulation in the spirit of substance over form. Third, continuing to improve investor protection and literacy, and communicate to the public explicitly on underlying risks with a focus on assumption of risks; and lastly, advancing cross-jurisdiction regulatory cooperation and coordination in jointly addressing challenges posed by crypto-assets.
112
a The World Bank focuses on the developing and emerging market economies only.
Special Topic 13 China FSAP Update: Main Conclusions and Recommendations
The Financial Sector Assessment Program (FSAP) is a joint assessment program led by the International Monetary Fund (IMF) and the World Bank on member economies periodicallya. It has become an internationally accepted framework for financial stability assessment, with authoritative influence. China undertook its first FSAP assessment from 2009 to 2011. In fulfilling commitments China has made in the G20 Summits, and the IMF requirements for systemically important economies to undertake FSAP updates every five years, China launched the FSAP update in October 2015, and concluded the assessment work at end-2017 with success.
On December 7, 2017, the main reports of China FSAP update were published on the websites of IMF and the World Bank, including China: Financial System Stability Assessment , China: F inanc ia l Sec tor Assessment, China FSAP update: Detailed on Assessment Observance of Basel Core Principles For Effective Banking Supervision/ IOSCO Objectives and Principles of Securities Regulation/ Insurance Core Principles. These reports fully recognized China’s achievements in recent economic and financial reforms, and highly appraised China’s adherence to relevant
international standards. Meanwhile, they objectively analyzed the potential risks and challenges Chinese financial system faced, the recommendations of which are generally to-the-point and relevant in the context of China’s deepening of financial reforms.
I .The Assessment Conclusions
1. Remarkable achievements have been made in financial reforms
It is noted in the FSAP reports that China’s impressive economic growth has continued since the first FSAP. The financial sector has given strong support to economic growth and poverty reduction; the financial industry, particularly the capital market, has been growing in depth, with improving financial access and quality and significantly greater financial inclusion. The financial regulatory agencies progressed the reforms smoothly and achieved significant results in the following areas:
The monetary and macroprudential policy
frameworks have been upgraded. Key progress has been made on the liberalization of interest rates and the implementation of

113Chapter II Soundness Assessment of the Financial Sector
the market-based interest rate reform, which is crucial for financial stability.This has been conducted in a measured way, giving a more decisive role to the market in allocating resources while minimizing volatility and instability. The PBC deregulation of the floor for the lending rates and the cap for deposit interest rates in July 2013 and October 2015, respectively, were key steps. Interagency cooperation has been enhanced in addressing macroprudential risks, including deflating a housing-market bubble in 2013, and the PBC and regulatory agencies are strengthening systemic risk monitoring.
A deposit insurance system was established. This enhances the financial safety net and is important in helping to tackle implicit guarantees. The system was off icial ly established with the implementation of the Deposit Insurance Regulations on May 1, 2015.
The Basel III regulatory framework has
been implemented. Since 2010, the banking regulator has issued a range of banking rules and regulations implementing the Basel III standards on capital, leverage ratio, and liquidity. It has also developed guidelines on banks’ corporate governance, compensation, comprehensive risk management, consolidated supervision, internal control, and audit. These support implementation of the enhanced requirements for banks’ corporate governance and r isk management pract ices in the international post-crisis reforms developed by the FSB and BCBS. More recently, in 2017, the regulator conducted examinations targeting
interbank finance, wealth management and off-balance-sheet activities to address regulatory arbitrage and misconduct, especially in the cross-sector businesses of banks.
Investor protection has been enhanced,
laying the bas is for further market
development. Several initiatives over the past five years or more aim at protecting China’s very large retail investor population. This includes strengthening the securities regulator’s suitability requirements for intermediaries, investors’ ability to exercise their rights, and its investor education program. The regulator has also expanded authorized activities for some categories of securities intermediaries with the objective of developing an investment banking culture to help the capital marketserve the real economy better. At the same time, the prudential and capital requirements applicable to some participants have been reviewed and strengthened. Following the market volatility of 2015, the regulator has taken a series of actions to curb excess leverage in the market, with some of these actions undertaken jointly with other public authorities.
A sound framework for growth of the
insurance industry is being put in place.
The regulator began in March 2012 to develop China Risk-Oriented Solvency System (C-ROSS). The insurance regulator has finished the 17 core regulatory rules under the C-ROSS framework and formally issued these rules in February 2015, triggering an industry-wide transitional period for the implementation of the new solvency standards. After one year of testing, C-ROSS officially entered into force
114
on January 1, 2016.
2. Potential risks in the f inancial system and responding measures by the authorities
It is indicated in the FSAP reports that Chinese financial system faces the following potential risks:
First, the credit needed to generate additional GDP growth has led to a substantial credit expansion, especially in shadow banking, resulting in high debt and low efficiency in resource allocation, which amplifies the risks in financial system.
Second, the increasingly interconnected, complex and opaque financial system bring large challenges to the regulatory agencies on assessing asset quality and preventing risks. For example, similar products issued by different financial firms are subject to different supervision and regulation, which has led to innovation based on regulatory arbitrage and multiple reinvestment with obscure underlying assets.
Third, widespread perception of implicit guarantees fosters moral hazard and distorts risk pricing, leading to a financial system prone to large periodic adjustments in certain circumstances.
In general, the authorities are aware of financial stability risks and continue to take measures to bring them under control in extremely challenging circumstances home and
abroad. Microprudential supervision has been improved, and the State Council Financial Stability and Development Committee was established to strengthen macroprudential regulation and prevent systemic risks.
3 . The Financ ia l regu la tory and supervisory framework complies with international standards.
China FSAP update conducted full assessment on Chinese banking/ securities/ insurance sector ’s observance of the Basel Core Principles For Effective Banking Supervision (BCP)/ IOSCO Objectives and Principles of Securities Regulation (IOSCO principles) / Insurance Core Principles (ICP) , and offered valuable recommendations. It is noted in the reports that China’s financial regulatory and supervisory framework complies with international standards. However, financial regulatory agencies are lack of independence in making decisions and regulatory resources are insufficient. Moreover, those agencies have the conflicting mandates of both financial development and stability. In the future, it is important to enhance the independence of regulatory agencies on making decisions, and strengthen regulatory coordination and cooperation.
Results of the assessments show that, out of the 29 banking principles, 16 principles were rated as Compliant, 11 as Largely Compliant and 2 as Materially Non-Compliant respectively. It is indicated in the report that the banking regulatory agency has risen to the demands of the international regulatory reform

115Chapter II Soundness Assessment of the Financial Sector
agenda, delivering timely revisions to its body of regulations and maturing its supervisory practices through investing in essential new skills, enhancing methodologies, and broadening its interactions with the industry. Meanwhile, the report points out that there are insufficient coordination and collaboration and ex-ante information sharing on the supervision of financial groups and institutions among financial regulatory agencies, which have contributed to a weaker awareness and understanding of risks and vulnerabilities that can arise from more complex groups and from cross sectoral activities than is desirable. Besides, some gaps in these areas still require attention: problem assets, concentration risk, related party exposure, corporate governance and the formal power to reject the external auditor of a bank. Moreover, efforts should be made to ensure a greater disclosure of aggregate statistics and risk indicators for the overall banking industry.
Of the 37 securities principles, there are 20, 11 and 6 principles rated as Fully Implemented, Broadly Implemented, and Partly Implemented respectively. It is concluded in the report that the authorities have implemented several initiatives aimed at protecting China’s very large retail investor population. The see-through system was implemented for clients’ accounts. The Capital Markets Statistics and Monitoring Center was established. The identifying and monitoring of systemic risks are enhanced largely. Meanwhile, the report indicates that the authorities should implement the existing agreements aimed at harmonizing the regulation of activities and
products currently subject to more than one regulatory regime and supervisory authority; the laws and regulations need to be perfected to strengthen the powers to impose appropriate sanctions; inter-agency information sharing is insufficient; risk monitoring mechanism needs to be improved; and the authorities should remain continuously alert to the need to make adjustments to regulation and supervisory practices in a timely fashion.
Of the 26 insurance principles, there are 8, 14 and 4 principles rated as Observed, Largely Observed and Partly Observed respectively. It is said in the report that the authorities have been undertaking far-reaching reforms and modernization since the 2011 FSAP, such as continually improving insurance regulation and supervision regime, enhancing the supervision on insurance groups, and making significant progress in reshaping the solvency standards into a modern approach. At the same time, the report points out that there is an urgent need to enhance the regulation and supervision and relevant coordination on insurance groups; more should be done on crisis management with larger groups and market conduct regulation; and the further development of C-ROSS needs to be planned.
II .Main Recommendations
The FSAP repor t s o ff e r a number o f recommendat ions on guarding against risks, deepening reforms and strengthening regu la t ion and superv i s ion . For nex t step, the authorities will draw on good recommendations of the FSAP reports and
116
adapt them to China’s financial specifics, and promote sound development of the financial sector in the long term.
It is important to de-emphasize high GDP
growth projections and reduce excessive
credit expansion and debt overhang. This is consistent with the shift to a more robust, sustainable and high-quality growth in the medium and long term. But the near-term prioritization of social stability appears to rely on credit expansion to continue financing firms, and on stabilizing asset markets to prevent losses for households. Microprudential regulation and supervision will struggle to mitigate risks and deliver financial sector stability if the macroeconomic context—notably, monetary, fiscal, and development policies—is not supportive.
I t i s n e c e s s a r y t o u p g r a d e t h e
macroprudential framework and enhance
systemic risk monitoring. A Financial Stability Sub-Committee (FSS-C), reporting to the new Financial Stability and Development Committee (FSDC), should be established and charged with the sole mandate of maintaining financial stability. Primary laws should be amended to strengthen operational and budgetary autonomy of the PBC and the regulatory agencies, and increase their resources. The authorities should increase inter-agency communication, coordination and information sharing, as well as cooperation with foreign regulatory agencies , and address data gaps that impede systemic risk monitoring and effective financial regulation and supervision. Financial groups should be
subject to stringent regulation and supervision, and forward-looking comprehensive risk analysis should be enhanced. Moreover, efforts should be made on improving the skills of stress testing teams, expanding the coverage of systemic risk assessment to nonbanks and their interconnections with banking institutions significantly developing and integrating stress testing of collective investment schemes, and using more granular supervisory data in stress tests.
The authorities should perfect the regulation
and supervision on banking, securities and
insurance sectors. In the banking sector, efforts should be made on enhancing the ability to supervise banks and wider financial groups as well as ownership structures, eliminating the use of collateral quality in loan classification, constraining banks’ ability to roll-over credit to non-small and medium enterprise corporate borrowers, classifying all loans overdue by more than 90 days as nonperforming. Look-through principles should be emphasized, and coverage of liquidity coverage ratio (LCR) should be increased for interbank products and for off-balance sheet Wealth Management Products (WMPs). Requirements on regulatory reporting should be enhanced, and forward-looking integrated risk analysis should be improved to facilitate ex-ante intervention. In the securities sector, functional overlay to supervision should be introduced to ensure that similar products issued by differing financial firms are supervised and regulated similarly. Disclosure of collective investment schemes (CIS) should be improved, and specifying expected returns should be prohibited in the
117Chapter II Soundness Assessment of the Financial Sector
prospectus of WMPs. The authorities should also tighten the eligibility and enhance haircut methodology for repo collateral; strengthen systemic risk monitoring mechanisms to ensure a holistic view of securities markets and their financial sector interconnectedness; emphasize corporate governance for listing companies and the securities market regulators’ power of investigation and enforcement; enhance on-site inspection on capital market goal keepers such as accounting firms and consider the establishment of a professional auditing regulator; and explore differentiated regulation of private funds. In the insurance sector, it is important to develop plans for risk-based supervision, bringing together all issues and actions of each insurer, including market conduct, and move valuation to a more market-consistent basis.
Efforts should be made on removing
implicit guarantee, perfecting cris is
management framework and supervision of
FMIs, and strengthening fintech regulation.
The authorities should ensure the bankruptcy remoteness of CIS, including WMPs, and promote the marketization of lending policies conditional on eliminating implicit guarantee. It is important to clearly define the triggers for activating government-led crisis response, develop a special resolution regime for banks and systemically important insurance companies, establish a formal framework for emergency liquidity assistance, and optimize the design of various protection funds to limit moral hazard. Moreover, the resilience of FMIs should be enhanced through full implementation of the CPSS-IOSCO Principles
and strengthening of the legal framework. The legal, regulatory and supervisory framework for fintech should be improved.
The sequence of the reforms should be
planned carefully to mitigate risks arising
from moral hazard and implicit guarantee. Certain f inancial management reforms should go hand-in-hand with strengthening the social safety net, in order to minimize hardships on population caused by bankruptcy of firms. Those reforms include improving data quality, increasing banking capital, tightening regulations for asset quality and financial holding companies, strengthening legal framework on bankruptcy and resolution, reducing reliance on short-term funding, and enhancing investors’ awareness of risks. Operational restructuring of distressed but viable firms, and ensuring a timely exit of non-viable ones, should become a focus of policies.
The development of financial inclusion
and the capital market should be further
promoted. The authorities should continually build a more inclusive financial sector; change the government’s role by focusing on creating the enabling environment for financial service providers; expand public credit registries; develop a comprehensive legal framework for data protection; do more research on enlarginge the coverage of financial services through fintech; and target promotional fiscal and monetary policies for financial inclusion. The role of development and policy financial institutions should be emphasized. The Capital market should be further developed by enhancing the use of reopening and buybacks

118
of government bonds, enhancing the primary dealer system and trading architecture of government bonds to build a liquid yield curve, improving the collateral quality of repo market and trading structure and perfecting the legal framework, emphasizing assessments on credit
risk and increasing the pricing efficiency, harmonizing the regulations for issuers and investors in the interbank market and exchange market; and cultivating a sophisticated institutional investor base.

121Chapter III Macroprudential Regulation
In 2017, the international community continuously improved the macroprudential
policy framework. Based on international experiences, China continued to enhance macroprudential policy, pushed forward the financial regulatory reforms, improved the financial regulatory coordination mechanism, strengthened the monitoring and assessment of systemic risks, enriched the macroprudential policy toolkit, and effectively guaranteed the bottom line of allowing no systemic risks to emerge.
I. International Developments on Macroprudential Regulation
1. Building more resilient financial institutions
Finalizing the Basel III policy framework. On December 7, 2017, the BCBS published Basel III: Finalising post-crisis reforms, which indicated that the core international regulatory framework of post-crisis banking regulation had largely established. Generally speaking, the Basel III is the latest international banking regulatory framework consisting of both microprudential and macroprudential essentials, with the capital and liquidity requirements as its core elements. The Basel III maintains the three-pillar regulatory mechanism of capital adequacy requirement, supervisory review and market discipline in Basel II, enhances the requirement on
capital quality, liquidity and macroprudential regulation, and incorporates broader financial sector reforms like TLAC requirement, etc.
Promoting the implementation of Basel III. According to the BCBS progress report published in October 2017, all of the 27 BCBS member jurisdictions have final risk-based capital rules, LCR regulations and capital conservation buffers in force. 26 member jurisdictions have issued final rules for the counter cyclical capital buffers, and have established or are developing domestic systemically important banks (D-SIBs) frameworks. With regard to the G-SIBs framework, all members that are home jurisdictions to G-SIBsa have final rules in force. Further efforts should be made on implementation of the framework on counterparty credit risk and bank exposures to CCPs for some member jurisdictions.
2. Strengthening the supervision on SIFIs
Updating the list of G-SIBs. In November 2017, the FSB updated the list of G-SIBs based on the end-2016 data. Thirty banks were designated as G-SIBs (Table 3.1) and the total number of G-SIBs remained the same as that in 2016. Royal Bank of Canada was added to and Groupe BPCE was removed from the list. Citigroup moved from bucket 4 to 3, BNP Paribas moved from bucket 3 to 2, and Credit Suisse moved from bucket 2 to 1. ICBC, ABC, a
a Currently, China, United States, France, Germany, Italy, Netherlands, Spain, United Kingdom, Japan, Switzerland and Sweden are the G-SIBs home jurisdictions.
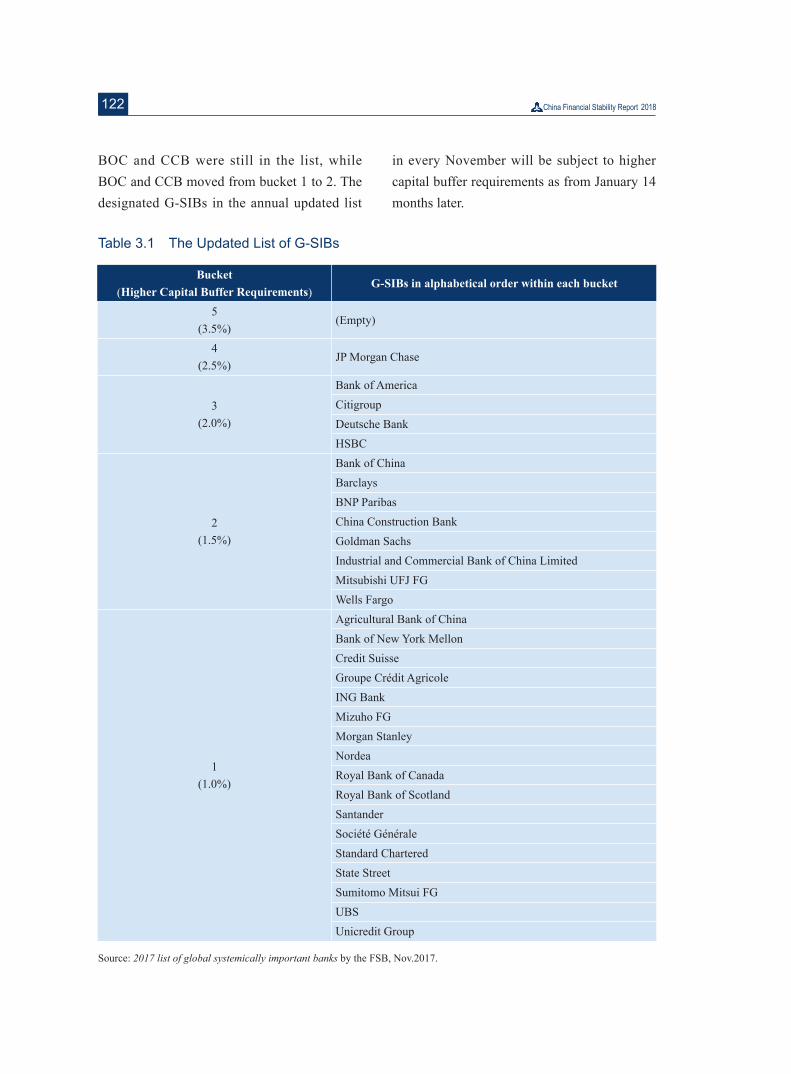
122
BOC and CCB were still in the list, while BOC and CCB moved from bucket 1 to 2. The designated G-SIBs in the annual updated list
in every November will be subject to higher capital buffer requirements as from January 14 months later.
Table 3.1 The Updated List of G-SIBs
Bucket(Higher Capital Buffer Requirements)
G-SIBs in alphabetical order within each bucket
5(3.5%)
(Empty)
4(2.5%)
JP Morgan Chase
3(2.0%)
Bank of AmericaCitigroupDeutsche BankHSBC
2(1.5%)
Bank of ChinaBarclaysBNP ParibasChina Construction BankGoldman SachsIndustrial and Commercial Bank of China LimitedMitsubishi UFJ FGWells Fargo
1(1.0%)
Agricultural Bank of ChinaBank of New York MellonCredit SuisseGroupe Crédit AgricoleING BankMizuho FGMorgan StanleyNordeaRoyal Bank of CanadaRoyal Bank of ScotlandSantanderSociété GénéraleStandard CharteredState StreetSumitomo Mitsui FGUBSUnicredit Group
Source: 2017 list of global systemically important banks by the FSB, Nov.2017.
123Chapter III Macroprudential Regulation
3.Promoting effective resolution regime
Improving the TLAC requirements steadily.
Since the publishing of TLAC requirements in 2015, the FSB has continued to improve the relative policy framework to ensure the orderly resolution of G-SIBs without the use of public resources. In July 2017, the FSB published the Guiding Principles on Internal Total Loss-absorbing Capacity of G-SIBs (‘Internal TLAC’), to require material sub-groups within the resolution entity to hold TLAC and establish an explicit allocation framework of the resolution entity’s TLAC among its material sub-groups. The FSB plans to review the implementation of TLAC framework in end-2019.
Promoting the implementation of the
Key Attributes . Implementation of the Key Attributes was uneven among FSB member jurisdictions. Only some members (mainly home jurisdictions of G-SIBs) have comprehensive resolution powers in place in line with the Key Attributes. The most commonly absent powers include bail-in, temporary stay on early termination and changing the structure of the institution to improve its resolvability, etc. In December 2017, the FSB published the Key Attributes Assessment Methodology for the Insurance Sector (Consultative Document) to establish an assessment framework of the implementation of the Key Attributes in the insurance sector.
4. Keeping on monitoring the shadow banking system
In March 2018, the FSB published the Global
Shadow Banking Monitoring Report 2017 based on the end-2016 data, covering 29 jurisdictions including Luxemburg for the first time, representing over 80 percent of the global GDP. Based on the broad measure, Monitoring Universe of Non-bank Financial Intermediation (MUNFI) grew to USD 160 trillion by the end of 2016, accounting for about 48 percent of total financial assets in participating jurisdictions. Based on the narrow measure, shadow banking amounted to USD 45.2 trillion, accounting for 13 percent of total financial assets in corresponding jurisdictions, among which the U.S. had the largest shadow banking system accounting for 31 percent of the total scale, followed by EU with 8 jurisdictions. China had the third largest shadow banking system of about USD 7 trillion, accounting for 16 percent of the total scale.
5. Promoting reforms of OTC derivatives markets
The OTC derivatives market reforms moved forward steadily in 2017. As to the end of June, among the 24 FSB member jurisdictions trade reporting and capital requirements for non-centrally cleared derivatives were best implemented. Almost all the jurisdictions have in force the relevant requirements, covering over 90 percent of transactions in their OTC derivatives markets. The work on removing legal barriers of reporting to TR and promoting the consistency of trade reporting was well underway. The framework of central clearing was less progressed with implementation in 17 jurisdictions. Margin requirements for non-centrally cleared derivatives made significant
124
progress with 14 jurisdictions in force, 11 more than that in end-2016. Implementation of the framework of platform trading was least progressed with only 12 jurisdictions in force.
6.Strenthening reforms of central counterparties
The IOSCO, CPMI and FSB have been cooperating on improving the resilience, recovery planning and resolvability of CCPs. In terms of improving the resilience and recovery planning, IOSCO and CPMI published the Resilience of Central Counterparties: Further Guidance on the PFMI and Recovery of Financial Market Infrastructures in July 2017, published the Framework for Supervisory Stress Testing of Central Counterparties in April 2018, and would continue to monitor the CCPs’ implementation of Principles for Financial Market Infrastructures (PFMI). In terms of improving the resolvability of CCPs, FSB published Guidance on Central Counterparty Resolution and Resolution Planning in July 2017, in order to ensure the consistency of resolution planning among member jurisdictions.
7. Reducing misconduct risks
The FSB continued to work on reducing misconduct risks and promoting market confidence in 2017. In terms of compensation g o v e r n a n c e , t h e F S B p u b l i s h e d t h e Supplementary Guidance to the FSB Principles and Standards on Sound Compensation Practices in March 2018, to link compensation governance to the mitigation of misconduct
risks. In terms of corporate governance, the FSB will finalise a supervisory toolkit to address misconduct risks through improving due diligence, enhancing management duties and cultivating favourable corporation cultures. Besides, the IOSCO has developed a supervisory toolkit for wholesale markets, and the BIS has published regulations on FX market behaviours, so as to further enhance the standards of conduct in fixed income, currency and commodities (FICC) markets.
8. Others
The FSB developed a framework of evaluating the effects of reforms as an important guidance for reform effect evaluation in the future. The framework aims at evaluating the effects of reforms that are well progressed, analysing whether the intended purposes of the reforms have been achieved, identifying any significant negative effect and addressing it. The FSB also enhanced the research and regulation on Fintech, with special attentions paid on the development of crypto-assets and its potential impact on financial stability. Besides, the global LEI system is well functioning. By the end of 2017, 27 jurisdictions had been authorized to issue LEIs and over 970 000 entities and individuals had received their LEIs.
II. Major Jurisdictions’ Progress in Macroprudential Policies
1. United States
Alleviating the compliance burden of small
125Chapter III Macroprudential Regulation
and medium-sized financial institutions. Since elected as the president of the United States, Donald Trump figured that the Dodd-Frank Wall Street Reform and Consumer Protection Act strengthened the regulation too much and harmed the economic growth, and proposed to relieve financial regulation. In December 2017, the Senate Banking, Housing and Urban Affairs Committee proposed the Economic Growth, Regulatory Relief, and Consumer Protection Act that focused on the regulatory relief of small and medium-sized financial institutions. President Trump signed and approved the Act on May 24, 2018. The Act revised the laws and regulations like Dodd-Frank Act released in 2010, which signalled a policy relief of the stringent regulations developed after the international financial crisis. The elements of this Act include: raising the threshold of banking holding companies subject to prudential regulations from assets of more than USD 50 billion to USD 250 billion, streamlining the regulations on small financial institutions, facilitating the development of capital markets and enhancing financial consumer protection, etc.
Monitoring and assessing systemic risks. The FSOC published its annual report in December 2017 to indicate that the global economy was recovering moderately while there were still potential risks in the U.S. financial system affected by factors including the Brexit, reforms on MMFs, rising asset prices and the up-shifting of the term structure of interest
rates. The potential risks included: Cyber security issues might impact the key functions of the financial system; asset management products may produce risks related to liquidity, leverage and redemption; large bank holding companies had procyclical risks; there were interconnectedness risks between CCPs and their clearing counterparties; the short-term wholesale financing market was less stable; market participants still relied overly on reference rates like LIBOR; the scope and quality of financial data could not meet the need of risk mitigation; the automatic transaction systems widely used domestically and abroad increased the complexity of the financial markets, etc.
CCyB requirements. After negotiation with the FDIC and OCC, the Federal Reserve announced in December 2017 to maintain the CCyB ratio at 0 based on the CCyB policy framework. If the Federal Reserve decides to change the CCyB ratio in the future, it should determine the application date one year in advance to give banks enough time to make adjustments.
Regulation on SIFIs. The Federal Reserve issued a rule in September 2017 to require G-SIBs headquartered in the United States and U.S. operations of foreign G-SIBs to revise their qualified financial contracts (QFCs)a, so as to temporarily forbid their counterparties to cancel or terminate the contracts if these G-SIBs enter bankruptcy or resolution. Thus
a Including short-term financing transactions like derivatives, securities financing and repo contracts.
126
the QFCs could provide a risk-defusing window to avoid disorderly resolution of G-SIBs. Given the large volume of QFCs to which systemically important banks are a party, the bankruptcy of one systemically important bank could cause widespread termination of QFCs and dramatic asset price decline, so that the risk could spread rapidly from one institution to the whole financial system. Thus the rule forbids the exercise of default rights to QFCs against the systemically important bank in a certain period if it goes bankrupt, so as to avoid the influence on other solvent institutions. This rule will come into force in early 2019, and different conformance periods have been set for different kinds of counterparties.
2. European Union
Monitoring and assessing systemic risks. The ESRB published its annual risk monitoring report to indicate that, influenced by the prolonged low interest rate environment and geopolitical uncertainties, Europe was faced with four potential financial risks, namely the probable repricing of risk premium in the global financial market, gloomy balance sheets of banks, insurers and pension funds, further deterioration of the debt sustainability of the government, corporate and household sectors, and the potential risk contagion from non-bank sector to the banking system.
Publishing the macroprudential bulletin. The ECB published its fourth macroprudential bulletin to introduce its use of a set of macroprudential policy tools, including the
introduction of MREL as a bail-in tool for banks, the assessment of bank valuation and debt recovery rates in both bail-out and bail-in scenarios, and the implementation of internationally agreed reforms on enhancing the resi l ience of banks, which consist of higher CAR, liquidity enhancement, introducing TLAC requirements, determining the compensation order of unsecured debt instruments, etc.
Monitoring the shadow banking system. The ESRB published its first shadow banking monitoring report in May 2017, indicating a deceleration of EU shadow banking growth in 2016. By the end of 2016, the EU shadow banking totalled EUR 40 trillion, accounting for 38 percent of the total EU financial assets and 272 percent of EU GDP. The consecutive growth of shadow banking increased the financial leverage and the interconnectedness risk within the financial system.
3. United Kingdom
Macroprudential policy development. Due to the impact of Brexit, there was still uncertainty on the financial stability and economic prospective in the United Kingdom, according to the FPC. There were emerging risks in the real estate market, huge deficit existed in the current account, the exchange rate of GBP stabilized at a low level after the Brexit referendum, household debt maintained at a relatively high level despite a moderate decrease, and the credit growth rate was still slightly above that of nominal GDP. Based on the above observation, the FPC increased
127Chapter III Macroprudential Regulation
the CCyB ratio from 0.5 percent to 1 percent, which would come into force on November 28, 2018. The banking sector of the United Kingdom must thus raise additional CCyB of GBP 11.4 billion.
The stress test on the banking sector. The Bank of England conducted its fourth stress test on the banking sector in March 2017, covering banks whose loans accounted for more than 80 percent of the total. The scenarios of the stress test were set more severe than the global financial crisis. In the severe scenario, the loss of the banking sector would total GBP 50 billion in the first two years, but could be fully covered by capital buffers. The CET 1 ratio of 7 banks decreased from 13.4 percent to 8.3 percent and the leverage ratio decreased from 5.4 percent to 4.3 percent. The stress test result indicated that major large banks’ capital level had been effectively enhanced and the banking sector held enough capital to deal with economic recession and asset price slump both in the United Kingdom and globally, while maintaining the credit support to the real economy at the same time. Besides, Barclays and Royal Bank of Scotland were once faced with capital and leverage gaps in the 2016 stress test, but they both met the standards in the 2017 stress test.
I I I . C h i n a ’ s P r a c t i c e i n Macroprudential Regulation
Risks might be more liable and frequent to materialise in China’s financial system during the current and upcoming periods. Influenced by both internal and external factors ,
vulnerabilities that have built up over years start to show and it is necessary to enhance the macroprudential regulation and establish a financial regulatory framework suitable for the evolution of modern financial markets. China thus continues to improve the macroprudential policy framework, push forward steadily reforms of the financial regulatory mechanism, improve the risk monitoring and identification f r a m e w o r k , a c t i v e l y t a k e v a r i o u s o f macroprudential measures and safeguard the bottom line of allowing no systemic risks to emerge.
1. Steadily pushing forward reforms of the financial regulatory mechanism
Establishing the Financial Stability and
Development Committee (FSDC) under
the State Council. With the approval of the CPC Central Committee and the State Council, the FSDC was established under the State Council in 2017. The FSDC will not replace the responsibilities and working procedures of relevant authorities. The administrative office of the FSDC is set in the PBC, and the Governor of the PBC is designated as the head of the office . As an agency focusing on deliberation and coordination of important issues on financial stability, development and reforms under the State Council, the mandates of the FSDC include implementing the decisions of the CPC Central Committee and the State Council on financial issues, approving important plans of financial reforms and development, coordinating financial reform, development and regulation, coordinating issues concerning
128
monetary policy and financial regulation, coordinating the making of financial policies and related fiscal and industrial policies, analysing international and domestic financial situations, addressing international financial risks, developing essential policies to mitigate systemic risks and safeguard financial stability, providing guidance on local financial reforms, development and regulation, and supervising the performance and being in charge of the accountability of financial management authorities and local governments, etc.
Consolidating the regulation on financial
institutions in the banking and insurance
sectors, and enhancing the macroprudential
regulation mandate of the PBC. The mandates of the former CBRC and CIRC are consolidated to set up the CBIRC, which would regulate the banking and insurance sectors together. The mandate of drafting important laws, rules and fundamental prudential regulations on the banking and insurance sectors, which was originally the responsibility of the former CBRC and CIRC, is now handed over to the PBC to enhance its duty on macroprudential regulation and systemic risk mitigation.
2. Enhancing the monitoring and assessment of systemic risks
Continuous efforts were made in promoting the on-site inspection and risk assessment of banking, securities, insurance financial institutions and non-financial institutions with financing functions. Financial stability stress tests were conducted for commercial banks
with more participating institutions. Risk monitoring and investigation in key areas and on severe problems were enhanced, and studies on local government financing platforms, financial holding companies, crypto-assets, risks of wealth management activities and enterprises’ investments in the financial sector were carried out. Analysis of macroeconomic situations, regional financial risks and development trends of specific industries were enhanced, and the risk monitoring of large problem enterprises was continued to resolve material risk events in a timely manner.
3 . C o n s t a n t l y i m p r o v i n g t h e macroprudential policies
Improving the assessment system of financial institutions. On the one hand, the Macroprudential Assessment (MPA) system was improved continuously. Off-balance sheet wealth management products were included in the scope of broad credit in the first quarter of 2017, green finance was included in the indicators of implementation status of credit policies in the third quarter of 2017, and interbank negotiable certificates of deposit was included in the calculation of ratio of interbank liabilities in 2018. On the other hand, the central bank rating mechanism of financial institutions was established. The PBC drafted the Administrative Measures on Rating of Financial Institutions by the Central Bank (Provisional), which came into force on January 1, 2018. The Central Bank Rating Committee was established, and has developed the central bank rating indicator system of financial institutions, which incorporated with
129Chapter III Macroprudential Regulation
the MPA system based on the experiences in deposit insurance rating and on-site soundness assessment. The first rating program has been finished.
Implementing the macroprudential policy on the ful l coverage of cross-border financing. The Notice of Macroprudential Regulation on the Full Coverage of Cross-Border Financing was published in January 2017 to improve the macroprudential policy framework of the full coverage of cross-border financing, better facilitate cross-border financing and lower the external financing costs of domestic institutions so as to support the growth of the real economy.
On August 6, the PBC increased the risk reserve for foreign-exchange forward sales from 0 to 20 percent. Such timely and straightforward measures have effectively stabilized market expectations.
Adjusting the macroprudential policies of cross-border capital flows dynamically. In September 2017, the PBC lowered the risk reserve requirement for FX forward sales from 20 percent to 0 and cancelled the penetrating provisions on the reserves of overseas financial institutions deposited at onshore agent institutions. In May 2018, the risk reserve requirement of RMB deposits placed in the PBC clearing accounts by clearing banks in Hong Kong and Macao was adjusted to 0 to facilitate the countercyclical policy measures to return neutral. This adjustment was intended to enhance the price finding functions of the FX market, increase market liquidity, better serve
the real economy and achieve a sustainable, h a r m o n i o u s a n d b a l a n c e d e c o n o m i c growth. The PBC decided to enhance its macroprudential regulation, on August 3, 2018, by increasing the risk reserve for FX forward sales from 0 to 20 percent since August 6, so as to mitigate macro financial risks and encourage the sound operation of financial institutions.
Unifying regulatory standards on wealth management businesses. The Guidelines on Regulating Wealth Management Businesses of Financial Institutions was published on April 27, 2018. The Guidelines, based on categories of wealth management products, sets up a uniform regulatory framework on products of the same kind and promotes a level playing field of market-admittance and regulatory mechanism, so as to address regulatory deficiency and improve regulatory efficiency. The Guidelines tries to minimize the room for regulatory arbitrage, while it also arranges an appropriate transitional period taking into full consideration the affordability of financial markets. The PBC published on July 20 the Notice on Further Clarification of Issues Concerning the Guidelines on Regulating Wealth Management Businesses of Financial Institutions, to clarify some operational issues within the transitional period, namely the investment scope of publicly offered wealth management products, the valuation methodology of relevant products, the macroprudential arrangements and the autonomous and orderly rectification of financial institutions.
Enhancing regulation on the investment
130
of non-financial enterprises in financial institutions. The Guidelines on Enhancing Regulation on the Investment of Non-financial Enterprises in Financial Institutions was published on April 27, 2018. The Guidelines clarifies policy orientations of the investment of non-financial enterprises in financial institutions, and enhances regulation on shareholder qualification, ownership structure, investment funds, corporate governance and related party transactions. Through the above approaches, the Guidelines could help to establish a risk firewall between the real sector and the financial sector, and prevent the cross-institution and cross-sector risk contagion. Meanwhile, financial innovations designed to serve the real economy are encouraged, and non-financial enterprises are allowed to invest in financial institutions in line with relative laws and regulations if they have well-focused core businesses, good financial performance, sound corporate governance and appropriate developing strategies.
Improving the regulation on SIFIs. SIFIs play an important role in the financial system and their operation and risk profile would impact directly the resilience of the domestic financial system and its capacity to serve the real economy. Thus, it is necessary to clarify the regulatory expectations and make an institutional arrangement of regulation on SIFIs, so as to make up the regulatory shortfall, mitigate risks of “too-big-to-fail” and systemic financial risks and ensure the sound performance of the financial system. To implement the decisions of the CPC Central Committee and the State Council, the PBC
is developing the assessment, regulation and resolution framework of D-SIFIs, together with other regulatory authorities, so as to clarify the definition and scope of D-SIFIs, develop the assessment methodology and procedure, introduce special regulatory requirements, implement prudential regulatory measures and establish a special resolution regime for D-SIFIs.
Enhancing the consolidated regulation and development planning of financial infrastructures. The PBC, together with other relevant authorities, is developing a working plan on the consolidated regulation of financial infrastructures, which focuses on drafting the administrative measures of financial infrastructures and unifying the requirements of market admittance, operation and regulation. Meanwhile, the development planning of financial infrastructures would be enhanced to improve governance and coordination, with the ultimate objective of developing a financial infrastructure system with appropriate structure, effective governance, safe and efficient operation and convincing regulation, so as to help to form an open, integrated and inclusive financial market with its resource allocation function brought to full play.
Pushing forward the work on comprehensive financial statistics from all aspects. It is necessary to urgently accelerate the development of comprehensive financial statistics, which is the key information foundation for effectively promoting and monitoring the efficiency of the financial sector in serving the real economy, and help
131Chapter III Macroprudential Regulation
to mitigate and resolve systemic financial risks and safeguard financial stability in a forward-looking manner. The Office of the State Council published the Opinions on Pushing Forward the Work on Comprehensive Financial Statistics from All Aspects in March 2018, which determined the guiding principle of enhancing the foundation, making up the shortfalls, expanding the coverage and promoting information sharing, aiming at establishing a comprehensive financial statistic system to serve the real economy, mitigate financial risks and deepen financial reforms. According to the above requirements, the
PBC together with other financial regulatory authorities has accelerated the relevant work. The objective, of the first phase from 2018 to 2019, is to promote the statistics of cross-sector financial products, SIFIs and financial holding companies, develop the balance sheet of the financial sector, enhance the thematic statistics of green finance and financial inclusion, establish and improve the statistics of financial markets including the bond market, money market and FX market, and establish a set of standards of comprehensive financial statistics.
132
Special Topic 14 The Prudential Regulatory Regime
I . Def in i t ion o f Prudent ia l Regulation
Because of the highly leveraged business models of financial institutions and massive negative spillovers arising from their failure, the financial industry has been heavily supervised by regulatory authorities around the world to ensure soundness of financial institutions and to protect the interests of financial consumers. Prudential regulation and behavioral regulation are different dimensions of financial regulation. Prudential regulation aims at increasing soundness of financial institutions’ operation, preventing idiosyncratic financial risk and systemic vulnerabilities and maintaining financial stability. Behavioral regulation aims at protecting the interests of financial consumers and promoting fair competition in the financial market. Following the global financial crisis in 2008, national authorities focus more on macroprudential regulatory policy framework to address systemic vulnerabilities and contribute much efforts to enhancing the prudential regulation framework. Currently, macroprudential regulatory policy and microprudential regulation comprise the basic framework of
prudential regulation.
1. Macroprudential Regulation
To prevent risk contagion arising from interconnectedness within the financial system
and to emphasize through-the-cycle soundness of the financial system, the macroprudential policy framework regards the financial system as a whole, thus regulating risks across the entire financial system effectively and ultimately safeguarding financial stability and supporting steady economic development.
Systemic risks are built up in two dimensions. In terms of time dimension, the accumulation of financial risks may increase vulnerability of the financial system. In terms of sectoral dimension, the interconnectedness between financial institutions and financial markets will increase vulnerability of the financial system. Accordingly, the macroprudential policy tools are designed for both dimensions. In the time dimension, regulators should require financial institutions to build up risk buffers during the time that systemic risks accumulate to counter against potential shocks from cyclical changes, including countercyclical capital buffer, capital surcharge, dynamic provisioning policy, leverage ratio, Loan-to-Value and Loan-to-Income ratio etc. In the sectoral dimension, more focus should be placed on the systemically important financial institutions (SIFIs) and the interconnectedness of the financial system, including assessment of SIFIs, recovery and resolution planning and clearing and settlement of OTC derivatives.
Curren t ly, there a re a number of key international standards covering the elements
133Chapter III Macroprudential Regulation
of macroprudential policy tools, including the Basel III, the Key Attributes of Effective Resolution Regimes for Financial Institutions and the Global Systemically Important Banks: Assessment Methodology and the Additional Loss Absorbency Requirement. The macroprudential regulatory policy framework and prevention of systemic risks have been highlighted by national authorities in the U.S., the U.K. and the EU, where central banks of these regions play a leading role.
2. Microprudential Regulation
Microprudential regulation targets sound operation of individual financial institutions, focusing on prevention of various risks confronted by financial institutions, specifying relevant regulatory standards and requiring financial institutions to meet such standards.
Viewed from the perspective of microprudential regulation, various risks arise from the operation of financial institutions, including credit risk, liquidity risk, market risk and operational risk. Meanwhile, a financial institution may fail due to a run by depositors even it is soundly managed and operated. Both theoretical and empirical researches indicate that regulators should set stringent prudential regulatory standards concerning the minimum capital requirement, liquidity management, risk management, asset classification and provisioning and internal control system. Also, regulators should ensure that financial institutions effectively comply with the above regulatory standards through exercising on-site and off-site examinations.
A set of key international standards have been established to guide national authorities’ microprudential supervision, including the Basel Core Principles for Effective Banking Supervision (BCPs) and the Basel III drafted by the BCBS and the Insurance Core Principles (ICPs) drafted by the IAIS.
II. International Practices
One of the major lessons learnt from the 2008 global financial crisis lies in that regulators, focusing solely on the risk profile of individual financial institutions, tend to lack a systemic view of the vulnerabilities of the financial system and become unable to maintain stability of the financial system. Following the crisis, it is agreed that authorities should place more emphasis on systemic risk prevention and strengthen both macroprudential and
microprudential regulation framework.
1. Development and improvement of relevant international financial standards
in prudential regulation
(1) BCBS
The BCBS further improved the BCPs,
introducing more regulatory requirements
from the macroprudential perspective.
The BCBS revised the BCPs in 2012 which lists 16 principles concerning prudential supervision and relevant requirements for regulatory authorities, including corporate governance, r isk management process, capital adequacy, credit risk, provisions and reserves, concentration risk, transactions
134
with related parties, market risk, liquidity management, internal control, financial reporting, disclosure, etc. The BCBS makes it clear that macroprudential and microprudential regula t ion a re two c lose ly connec ted elements and that the two aspects should be mutually complementary to build an effective banking supervision framework. Regulatory authorities are therefore required to provide financial stability bodies with dynamic data at the banking-industry-wide level, so that the latter can take preemptive measures against systemic risks based on system-wide information. Despite that there is no specific principle on macroprudential regulation, the macroprudential perspective has been introduced into many core principles and there are requirements on greater intensity and resources to deal effectively with systemically important banks, the importance of applying a system-wide and macro perspective to prudential supervision to assist in identifying, analyzing and taking preemptive actions to address systemic risks, and an increasing focus on effective crisis management, as well as recovery and resolution measures in reducing both the probability and impact of failure of individual financial institutions.
The Basel III framework has introduced
a couple of arrangements to help avoid
the build-up of systemic vulnerabilities,
adding macroprudential elements into the
existing framework: improving the quality of bank regulatory capital by placing a higher requirement on going-concern loss-absorbing capital in the form of Common Equity Tier 1 capital with more stringent definition;
introducing a framework to mitigate liquidity risk through the Liquidity Coverage Ratio and Net Stable Funding Ratio; specifying a minimum leverage ratio requirement to constrain excess leverage in the financial system; introducing capital buffers that are built up in good times and can be drawn down in times of stress to limit procyclicality; enhancing risk capture by revising areas of the risk-weighted capital framework to better calibrate the RWA, Tier 1 capital and large exposure; revising the core principles on corporate governance to align the risk profile with compensation. In addition, BCBS works with the FSB to promote regulatory reform on the assessment of the G-SIFIs, the derivatives market and shadow banking, putting forward the regulatory requirements on the Total Loss-Absorbing Capacity.
(2) IAIS
T h e I A I S f i r s t l y i n t r o d u c e d t h e macroprudential elements since it revised the ICPs in 2011. After the revision in 2015, through Principle 24 “Macro-prudential Surveillance and Insurance Supervision”, the ICPs required authorities to identify, monitor and analyze market and financial developments and other environmental factors that impact insurers and insurance markets and use this information in the supervision of individual insurance companies, such as risk analysis and assessment of the systemic importance of individual insurance companies. In addition, if insurance regulation within a jurisdiction falls into the responsibilities of more than one authority, for example, there are different agencies responsible for prudential
135Chapter III Macroprudential Regulation
regulation and market behavior regulation, macroprudent ia l and microprudent ia l regulation, license approval, daily supervision, etc., the mandates and responsibilities of each authority should be clearly articulated.
(3) Other international bodies
In 2016, the IMF, BIS and FSB jointly issued the Elements of Effective Macroprudential Po l i c ies : Lessons f rom In terna t iona l Experience. The report advises authorities to further enhance the institutional framework of macroprudential policy and to specify responsible authorities and relevant policy tools. The international practices show that central banks have a more important role to play in the macroprudential policy framework. The report also suggests that coordination and information-sharing among various authorities within one jurisdiction will help to ensure the effects of macroprudential policy, to better gauge the risks of the financial system and to improve the efficiency of response measures.
2. Developments in Macroprudential Policy Framework in Major Economies
(1) The European Union
With the es tab l i shment o f the S ing le Supervision Mechanism (SSM) in 2011, the macroprudential policy framework was further enhanced to prevent systemic risk build-up. Under the SSM, the ECB and regulatory authorities in member states are jointly responsible for prudential supervision of credit institutions (banks and insurance companies),
while the ECB supervises the systemically important financial institutions based on quantitative assessment results and the member states supervise the remaining ones. The ESRB is accountable for the monitoring and assessment of systemic risks in the European Union and puts forward advices on the use of macroprudential policy tools if necessary. The EBA is responsible for supervision coordination of member states to ensure uniform regulation.
The ECB can decide whether to use relevant macroprudent ia l pol icy tools , such as capital surcharge and countercyclical capital requirements, to contain potential systemic risks based on its assessment and estimation of risks of the financial system as a whole. Meanwhile, the supervisory board of the ECB is directly responsible for daily supervision of systemically important credit financial institutions, including setting prudential capital requirements, assessing the systemic importance, reviewing significant M&As and taking enforcement actions on SIFIs.
As a regulatory coordination body, the EBA is making a couple of guidance, opinions, technical standards and rules to implement the Capital Requirements Directive. Currently, considering the characteristics of the EU financial system, the EBA has issued the implementation rules in capital and liquidity regulation of credit institutions.
(2) The U.S.
The financial regulatory regime for banks
136
of the United States is characterized by multiple regulatory authorities, including the Federal Reserve, the Office of the Currency Comptroller of Treasury, the Federal Deposit Insurance Corporation, the National Credit Union Administration and state financial regulators. The SEC and the CFTC regulate security firms, fund companies, exchanges and rating agencies. The state governments supervise insurance companies that operate within the state, while the Federal Insurance Office is responsible for assessment of systemic risks in the insurance sector across the country. After the 2008 crisis, the FSOC was set up to serve the role of macroprudential authority, responsible for assessing the systemic vulnerabilities and strengthen cooperation and coordination in financial regulation. Those systemically important non-bank financial institutions and financial market infrastructures designated by the FSOC will be supervised directly by the Federal Reserve.
According to the Dodd-Frank Act enacted in 2010, financial regulators should set enhanced prudential standards for systemically important non-bank financial institutions and bank holding companies with consolidated total assets over USD 50 billion, including necessary standards and additional standards. T h e n e c e s s a r y s t a n d a r d s n e e d t o b e implemented on compulsory basis, covering risk-based capital requirements and leverage limits, liquidity requirements, overall risk management process, resolution planning and credit exposure reporting requirements and concentration limits. Additional requirements include the contingent capital requirement,
enhanced public disclosures, short-term debt limits and any other appropriate prudential requirements that the Federal Reserve deems necessary or as suggested by the FSOC.
(3) The U.K.
After the 2008 global financial crisis, the U.K. reformed the regulatory framework, authorizing the BOE mandates of both macroprudent ia l and microprudent ia l regulation. Within the BOE, the Financial Policy Committee (FPC) was set up to serve as the macroprudential policymaker to safeguard financial stability and to identify, assess and monitor systemic risks. The FPC can exercise the macroprudential policy tools directly and make recommendations for relevant authorities. Specifically, the FPC is authorized to review and utilize various tools, including countercyclical capital buffer (CcyB), sectoral capital requirements, Loan-to-Value ratio, Debt-to-Income ratio, etc. On the other hand, the FPC can make recommendations for the Prudential Regulation Authority (PRA), which is set under the BOE and is responsible for daily micro-supervision of financial institutions, as well as the Ministry of Finance to take necessary regulatory actions to address the vulnerabilities of the financial system. Under the circumstance that the microprudential regulator disagrees with suggestions put forward by the FPC, a public and written explanation is required.
As the microprudential regulatory body operating under the BOE, the PRA operates with the goal of lifting the safety and soundness
137Chapter III Macroprudential Regulation
of the financial institutions it supervises. The PRA requires the financial institutions to meet various prudential standards set by the EBA, the ESMA, the EIOPA and other relevant international organizations. In addition, the PRA itself makes regulations and rules concerning the operation of financial institutions and issues policy statements to help financial industry understand various rules.
III. Enhancing the Macroprudential Policy Framework in China
Following the 2008 global financial crisis, the international financial regulatory reform has been placing more importance on the systemic risk prevention, including exploring setting up the macroprudential regulation framework and strengthening microprudential regulation, with the key international financial standards and practices in major economies further improved. Currently, with the rapid growth the financial system in China and increasing complexity of the business model of financial institutions, both the interconnectedness within the financial system and the systemic vulnerabilities have been rising. Authorities should be keen to the latest international trend in financial regulation and pay more attention to enhancing the existing prudential regulatory regime, including macroprudential regulation policy framework and microprudential regulation arrangements, so as to prevent potential systemic risks and maintain financial stability more effectively.
Strengthening systemic risk monitoring
and assessment. More efforts should be
deployed to identify and send early warnings about systemic risks accurately to enhance macroprudential authorities’ capacity in utilizing policy tools in an effective and forward-looking way. Effective information collection and scientific analytical framework should be built up, including a consolidated statistical system covering all types of financial institutions, businesses and markets, a macro stress testing system, a financial stability assessment system, etc.
Assessing and supervising SIFIs. As shown in the 2008 global financial crisis, supervision of the SIFIs was flawed and the too-big-to-fail problem will induce serious moral hazard and threaten the stability of the entire financial system. Authorities should identify the SIFIs on a regular basis, enhance supervisory intensity and apply more stringent prudential standards to them, including consolidated supervision, capital surcharge and leverage limits, so as to limit the threat of failure of these financial institutions to the financial system.
Strengthening countercyclicality management. The countercyclical policies require financial institutions to build risk buffers when times are good so that they can respond to the shocks when times are bad. For example, authorities in many countries set countercyclical capital buffers, sectoral capital requirements and dynamic loan provisioning to tackle adverse impact of cyclical factors on financial stability.
Reducing interconnectedness within the
financial system. The rising interconnectedness
138
among different parts of the financial system will make financial risks spread more easily and harder to monitor, therefore increasing the probability of systemic financial crisis. Measures should be taken to address interconnectedness within the financial system, including enhancing financial holding company supervision, unifying the regulation for similar products across different markets such as wealth management businesses, strengthening FMI regulation and setting margin requirements for OTC derivatives transactions and large credit exposure limits to effectively contain risk contagion.
Strengthening capital/insolvency regulation.
Capital regulation is the key element of prudential regulation. Stringent capital regulation helps financial institutions prepare for and write down against various unexpected losses, ensure their capacity to repay all the liabilities, promote effective internal control and management process of financial institutions and reduce the probability of financial failure. Authorities should continue to implement the Basel III taking into consideration characteristics of the Chinese banking system, to improve the capital regulation framework and enhance resilience of the financial system.
Strengthening liquidity risk regulation. A sound liquidity risk management system should be established, which requires timely calculation of key indicators like LCR and NSFR, and helps banking institutions to better identify, measure, monitor and control liquidity risks, to ensure the reasonable liquidity
needs be met at a fair price, to reduce the risks of liquidity shortage and to prevent the aggregation of individual institutions’ liquidity risks from amplifying the risks of the entire financial market.
Strengthening corporate governance
requirements. Strict regulation on the internal management of financial institutions and improvement of key arrangements in corporate governance, internal control and overall risk management process will help to ensure the sound operation of financial institutions, implement extended supervision over shareholders and prevent the risks of major shareholder control and relevant illegal operations.
Establishing the effective financial institution
resolution regime. The resolution regime for financial institutions especially the systemically important ones should be established to ensure timely intervention by supervisors, facilitate use of effective resolution tools to tackle failure of financial institutions and ensure continuity of key businesses and financial services, so that the adverse impact of any individual financial institution’s failure to the whole financial system can be limited and contained. In order to eliminate reliance on public funding for resolution of financial institutions and prevent moral hazard, losses should be firstly born by the shareholders and unsecured creditors, and then the privately funded depositor and investor protection funds should play a role. Under certain circumstances, the central bank as the lender of last resort and the Ministry of Finance may consider the use of public

139Chapter III Macroprudential Regulation
funds in recapitalization of troubled financial institutions if maintaining stability of the
financial system is well grounded.
140
Special Topic 15 Macroprudential Regulation and Rating of Financial Institutions by the Central Bank
The main lesson from the 2008 financial crisis is that central banks and regulatory bodies did not pay enough attention to systemic risks, and there were not effective monitoring and evaluation of the interconnectedness between macro economy and financial system. In the wake of financial crisis, the international c o m m u n i t y p r o p o s e d t o s t r e n g t h e n macroprudential regulation. China has made active attempts at building the macroprudential assessment framework. In 2017, in order to fulfill the responsibilities of macroprudential regulation and systemic risk prevention, and evaluate the operation management and risk profiles of financial institutions in a scientific and reasonable manner, the PBC, on the basis of previous exploration and experience, consolidated resources effectively and started rating financial institutions.
I . Attempts at Bui lding the Macroprudential Assessment Framework
Conducting on-site soundness assessments.
Since 2010, the PBC has conducted on-site assessments in key areas such as wealth management by banks, performance review, loan quality, off-balance-sheet businesses, interbank businesses, liability businesses and asset management products nationwide, which covers almost 4000 financial institutions in
the banking sector, and provides important support for effectively identifying major risks in the financial system. For example, during the two on-site assessments of interbank businesses in 2014 and 2016, the PBC selected 221 banks, which involved 147, 700 interbank businesses with an amount of RMB 14.52 trillion, and identified outstanding problems such as severe fund idling in interbank businesses, maturity mismatch and avoidance of regulation, providing important reference for the formulation and release of the Notice on Regulating Interbank Businesses of Financial Institutions.
Rating risks associated with institutions
covered by deposit insurance. In order to identify risks of financial institutions, promote the fair play and robust operation of financial institutions through differentiated premium, risk monitoring, early correction and risk resolution, and reinforce market discipline, the PBC launched a rating system of financial institutions covered by deposit insurance that combined quantitative models with qualitative evaluations in the second half of 2015. In the past over two years, the PBC has started from scratch, and rated over 3800 financial institutions nationwide. The rating results have objectively demonstrated the performance and risk profiles of insured institutions, and provided important reference
141Chapter III Macroprudential Regulation
for differentiated fee review, risk monitoring and early correction. According to the rating results in 2017, a total of 426 financial institutions were rated highly risky with a risk level of 8 to 10. Throughout the year, the PBC imposed early correction measures on 194 insured institutions, among which 129 were to replenish capital, 40 were to restrain asset expansion, 21 were to control credits to large transactions, and 10 were to deleverage.
Building the Macroprudential Assessment
framework. In 2016, in order to improve the macro prudential policy framework, prevent systemic risks more effectively and tap the role of countercyclical adjustment, the PBC upgraded the dynamic adjustment of differentiated reserves and desirable lending management mechanism to MPA. From targeting loans of narrow definition, the PBC has transferred to macroprudential regulation over broad credits including loans, securities, investments, repos, etc., and built an indicator system that focuses on countercyclical adjustment and conducts differentiated management according to degree of importance. Since the adoption of MPA, the excessively rapid growth of money and credit by financial institutions in the banking sector has been contained tentatively.
II. Improving the Macroprudential Framework Based on Central Bank’s Rating of Financial Institutions
The PBC has implemented thoroughly the
strategic arrangement by the 19th CPC National Congress to improve the dual pillar framework of monetary policy and macroprudential policy, and has, with the support of previous work and experience, improved the macroprudential framework on the basis of rating financial institutions.
In December 2017, the PBC official ly started work related with rating financial institutions. The rating indicator system focuses on capital management, asset quality, liquidity, interconnectedness, cross-border businesses, robustness and other requirements of macroprudential regulation, and provides real and objective assessment about risk profiles of financial institutions, which will facilitate the implementation of various policy tools for macroprudential regulation. Rating financial institutions is an essential tool for the central bank in macroprudential regulation. The central bank can then use rating results in determining differentiated premium for deposit insurance, MPA, monetary policy instruments, window guidance and countercyclical capital requirements, and thus impose hard constraints on financial institutions.
In rating financial institutions, the PBC emphasizes the prevention of systemic financial risks. For example, the indicator system for rating large banks focuses particularly on size, complexity, interconnectedness and activity. In terms of size, there are indicators such as operation scale, broad credits, interbank liabilities and entrusted loans. In terms of businesscomplexity, an indicator to gauge risk management in innovative businesses
142
is introduced, emphasizing that financial institutions should match the development of innovative businesses with their own risk management capabilities, measure risks and make provisions on the real and penetrating principle. In addition, banks’ capability to manage branches and subsidiaries is also taken into account. In terms of interconnectedness, there are indicators such as management of related party transactions, credits to an individual related group client and credits to all related parties, requiring banks to disclose the state of related parties in a real, accurate, complete and timely manner, and fund flows associated with related party transactions should be clear, transparent and priced fairly. In terms of activity, indicators such as risk assessment and foreign exchange self-discipline mgt in cross-border finance and cross-border Renminbi businesses are used.
III. The Central Bank’s Framework of Rating Financial Institutions
The central bank’s rating covers banking institutions such as policy banks, development banks, commercial banks, rural cooperative banks, rural credit cooperatives and non-banking financial institutions such as finance companies of corporate groups, financial leasing companies, auto financing companies and consumer finance companies. In order to ensure comprehensive, objective and accurate rating results, the rating, excluding that of non-banking financial institutions, combines mathematical models with professional evaluations and obtains the final score by averaging scores from the two dimensions on a
weighted basis.
In terms of mathematical models, the rating uses the Logistic regression model that is widely used by international and domestic rating agencies. At present, the rating uses data from 3541 banks nationwide as the sample, collects data from 2010 to 2016, employs methods such as correlation analysis, single variable analysis and multi-variable regression analysis, and find indicators that can clearly identify risks out of over 140 indicators, which can provide objective assessment of the operation and risk profiles of financial institutions from the perspectives of capital strength, asset quality, the capacity to cover expected losses, profitability, operation efficiency and scale. Through backward and forward robustness check, the model can distinguish risk profiles of financial institutions pretty well. In future, the model can be adjusted dynamically according to the real situation.
Professional evaluations adopt score card model. The evaluation indicators include corporate governance, internal control, asset management, capital and its management, liquidity risk, market risk, profitability, information system, local financial ecosystem, risks specific to non-banking institutions and other modules. Besides mathematical models and professional evaluations, the final rating result also takes into full consideration of ‘live situations’ that are discovered in the off-site monitoring, stress tests and on-site investigations as well as the overall assessments of financial institutions by
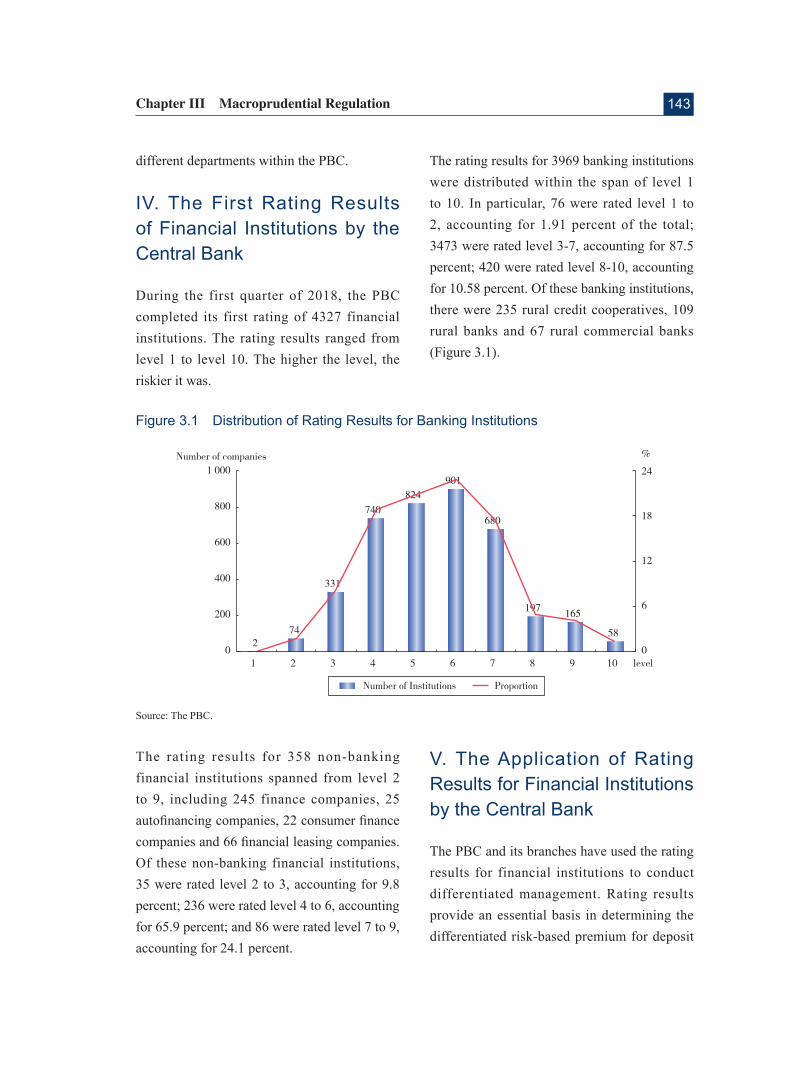
143Chapter III Macroprudential Regulation
different departments within the PBC.
IV. The First Rating Results of Financial Institutions by the Central Bank
During the first quarter of 2018, the PBC completed its first rating of 4327 financial institutions. The rating results ranged from level 1 to level 10. The higher the level, the riskier it was.
The rating results for 3969 banking institutions were distributed within the span of level 1 to 10. In particular, 76 were rated level 1 to 2, accounting for 1.91 percent of the total; 3473 were rated level 3-7, accounting for 87.5 percent; 420 were rated level 8-10, accounting for 10.58 percent. Of these banking institutions, there were 235 rural credit cooperatives, 109 rural banks and 67 rural commercial banks (Figure 3.1).
Figure 3.1 Distribution of Rating Results for Banking Institutions
Source: The PBC.
The rating results for 358 non-banking financial institutions spanned from level 2 to 9, including 245 finance companies, 25 autofinancing companies, 22 consumer finance companies and 66 financial leasing companies. Of these non-banking financial institutions, 35 were rated level 2 to 3, accounting for 9.8 percent; 236 were rated level 4 to 6, accounting for 65.9 percent; and 86 were rated level 7 to 9, accounting for 24.1 percent.
V. The Application of Rating Results for Financial Institutions by the Central Bank
The PBC and its branches have used the rating results for financial institutions to conduct differentiated management. Rating results provide an essential basis in determining the differentiated risk-based premium for deposit
144
insurance. Institutions with low ratings should be subject to high premium, and might be required to take early correction measures such as replenishing capital, restraining asset growth, controlling credits to major transactions and reducing leverage. The rating results also serve as the major reference to MPA. When institutions fail to meet MPA requirements, the PBC can use monetary policy instruments, dynamic differentiated reserve requirements, window guidance and
countercyclical capital requirements to urge them to operate prudently. Based on the rating results for financial institutions, the PBC and its branches can directly impose measures such as strengthening monitoring, risk warning, early correction and risk resolution. For financial institutions that are rated level 8 or above, the PBC can impose even strict restraints on financial policy support, business access, re-lending, etc.

145Chapter III Macroprudential Regulation
Special Topic 16 Unifying Regulatory Standards for Wealth Management Business
The report of the 19th CPC National Congress pointed out that we should “improve the financial regulatory system to forestall systemic financial risks” and puts preventing and defusing major financial risks as the top priority of the three tough battles to secure a decisive victory in building a moderately prosperous society in all respects. The Fifth National Financial Work Conference put forward three missions, namely serving real economy, preventing financial risks and deepening financial reform, and highlighted the importance of “making financial regulation more professional, unified and thorough”. Approved by the CPC Central Committee and the State Council, the PBC, together with the CBIRC, the CSRC and the SAFE, released on April 27, 2018 the Guidelines on Regulating Wealth Management Businesses of Financial Institutions (hereafter referred to as the Guidelines). The release of the Guidelines is a decisive measure to implement the principles put forward at the 19th CPC National Congress and the Fifth National Financial Work Conference. The Guidelines, as the first fundamental rule on prudential regulation released by the PBC after the reform of the CPC and State institutions, focuses on improving regulation, addressing market misconduct and preventing systemic risks, and is a milestone for the regulated development of the wealth management sector.
I . Rapid Growth of Wealth Management Business Bears Acute Risks
Over the past five years, wealth management business, a typical cross-sector and cross-market business, had expanded rapidly in China. Engaged by financial institutions from all sectors, the wealth management industry had reached a volume of over RMB 100 trillion with an average annual growth rate of over 40 percent, exclusive of cross-holding. By the end of 2017, the off-balance-sheet wealth management products (WMPs) of the banking sector reached a balance of RMB 22.2 trillion. The balance of entrusted funds of trust companies reached RMB 21.9 trillion . The size of publicly-offered funds, privately-offered funds, as well as asset management plans (AMPs) of securities companies, funds and their subsidiaries, and insurance management companies reached RMB 11.6 trillion, RMB 11.5 trillion, RMB 16.8 trillion, RMB 13.9 trillion and RMB 2.5 trillion respectively. In addition, non-financial institutions such as Internet companies and investment consultant firms also actively engaged in the wealth management sector. Wealth management business plays an active role in meeting people’s needs for wealth management, optimizing social financing structure and providing financial support to real
146
economy. However, because of the absence of unified regulatory standards, there emerged many problems during the rapid growth of the wealth management sector, which has made it difficult for the financial sector to serve real economy in an effective manner and has exacerbated the spread of risks across multiple sectors and markets.
Implicit guarantee leads to accumulation of
credit risks. In practice, implicit guarantee is quite common for WMPs. A large proportion of WMPs adopt a model based on expected returns. If the returns fluctuate, investors will bear the risks nominally. But if there is real financial loss, financial institutions usually will take various measures to ensure the principal and returns, in order to avoid damage to company reputation and save future business. For example, some companies set up capital pools to repay investors with funds from new investors, which transfers risks to the new investors; some companies repay investors with their own funds; and some turn to a third party to repay investors for them. Meanwhile, excessive returns over the expected returns, instead of paying to investors, are transformed by financial institutions to management fees or incorporated directly to income of intermediary business, which makes it hard to ask investors to bear excessive risks. The adoption of implicit guarantee not only leads to accumulation of credit risks in the financial system but also raises the risk-free rate of return, thus distorting price of fund and hindering the efficiency of allocation of financial and social resources. Implicit guarantee exacerbates moral hazards and
induces investors to ignore risks and blindly seek for high returns, compromising the fundamental rules of market. And financial institutions tend to neglect due diligence and risk control once they expect there will always be a third party as the last resort.
Investment in non-standard credit assets
leads to shadow banking risks. In recent years, some commercial banks turn to their off-balance-sheet WMPs and channels of trust plans, AMPs of securities companies and AMPs of fund subsidiaries to invest in non-standard credit assets (NSCAs) to evade regulations concerning limits on credit size and to mitigate regulatory pressure on capital consumption and provision, which has led to the rapid expansion of NSCAs. NSCAs have also become the primary source of financing for many enterprises. It is true that WMPs investing in NSCAs help to meet the financing demand of the real economy, but in practice WMPs have become replacement of credit loans and are used to evade macro-control policies and regulatory requirements such as capital restraints. Some WMPs are invested in restrictive areas such as real estate, local government financing vehicles and industries that are highly polluting, highly energy-consuming and with excessive capacity, with characteristics of severe maturity mismatch, low t ransparency and weak l iqu id i ty. Investment in NSCAs and implicit guarantee have led to accumulation of shadow banking risks, which has deviated from the purpose of promoting direct financing in the first place.
Multiple reinvestment exacerbates contagion
147Chapter III Macroprudential Regulation
of financial risks. Multiple reinvestment is the most prominent reflection of misconduct i n t he WMP marke t . Because wea l th management business provided by financial institutions in different sectors are bound by different regulations in terms of investment scope, limitation on liabilities, investor appropriateness and business statistics, cooperation among institutions and product embedding have become a common business model. This has resulted in increasingly complex product structure and difficulties in identifying the underlying assets, making it hard to decide whether the ultimate underlying asset is compliant with regulation and whether the investors can bear the risks correspondingly. Multiple reinvestment extends the product chain and if there is a risk event, all parties on the chain will be influenced quickly. If a product is tranched with leverage, risks accumulated to the inferior parties will increase by several-fold, causing abnormal market fluctuations and easily leading to legal disputes and relevant parties shirking responsibilities. In the process of reinvestment, fund keeps circulating within the financial system, pushing up financing costs, which will eventually be the burdens of the borrowers.
Capital pools intensify liquidity risks.
The “capital pools” of WMPs usually have such features as rolling issuance, collective operation and separated pricing. In such a model, financial institutions pool short-term fund together and invest it in long-term debts or equities. The WMPs are invested in several assets, and therefore it is difficult to identify which area one WMP is invested
into and which asset the returns come from, making risk firewalls practically disappear. Because of severe maturity mismatch, whether a product can be cashed at maturity depends on the continuous issuance of new products. Difficulties in raising follow-up funds usually lead to liquidity stress, which will spread to financial institutions along the product chain. At the same time, in an investment portfolio some assets, which the WMP is invested in, are quite complex in structure, usually with obscure projects, causing risk concentration and difficulties in risk identification.
Order of the WMP market is disturbed
by some non-financial institutions. The engagement of non-financial institutions in the WMP business has become a major risk because of absence of market entrance threshold and lack of regulation. Some institutions sell WMPs issued privately off-line to non-specific public through on-line means to avoid the limit on number of investors for privately-offered products. Moreover, some institutions make fraudulent promotion, lack adequate information disclosure and risk disclosure, promote products to investors with insufficient risk awareness, take no measures to ensure fund security such as fund custodian, and even embezzle or misappropr ia te investors’ fund for other usage, which usually deteriorates to illegal fund-raising, distorts market order and threats social stability.
I I . General Idea and Major Content of the Guidelines
Aimed at addressing real problems, the
148
Guidelines, starting with improving regulation, enhancing regulatory effectiveness and preventing systemic risks, covers the entire wealth management sector and follows the idea of integration of macroprudential regulation and microprudential regulation as well as the integration of institutional regulation and functional regulation. The Guidelines puts forward unified regulatory standards based on type of products rather than type of institutions, advocates fair market access and tries to eliminate possibility of arbitrage, to create a sound institutional environment for regulated development of the wealth management sector.
Classifying WMPs from two perspectives. Classifying WMPs and identifying the same type of products are the basis for the development of unified regulatory rules. Overall, WMPs are mostly funded by non-specific public or qualified investors, and are invested to credit assets or equity assets. Therefore, following the principle of “right products for right investors”, the Guidelines, on one hand, classifies WMPs into publicly-offered and privately-offered products based on how fund is raised (i.e. from the perspective of source of funds), and on the other hand, classifies WMPs into four categories based on which areas they are invested in (i.e. from the perspective of use of funds), namely fixed-income, equity, commodities and financial derivatives, and hybrid products. Publicly-offered products, because of their stronger spillover effect, are bound by tighter rules in terms of investment scope, information disclosure and debt ceilings. Privately-offered products are aimed at qualified investors
with stronger risk acceptance capacity, and are therefore faced with rules that are less strict. According to the principle of stronger restrictions of graded leverage for products with higher investment risks, the Guidelines sets different limits on grading proportions, and the four types of products also have different focuses in terms of information disclosure.
Strengthening due diligence of financial
institutions. To prevent financial institutions from taking advantage of their dominant position to violate investors’ rights and interests, the Guidelines emphasizes that financial institutions should fulfill their duties of honesty, integrity and due diligence from the standpoint of the investors. In terms of management mechanism, financial institutions should build mechanisms of risk control, internal control, personnel qualification certification and accountability that are compatible with the development of wealth management business. Business staff should be qualified professionally and abide by work ethics. In terms of information disclosure, financial institutions should provide investors with real, accurate and complete information of products in a proactive and timely manner and should disclose net value of close-ended publicly-offered products at least once a week and net value of privately-offered products at least once a quarter. Information disclosure of fixed income products should highlight the market risks regarding interest rate of the invested bonds and foreign exchange rate as well as the NSCA’s borrowers, remaining maturity, allocation of yield on maturity, trading structure and risks. Information

149Chapter III Macroprudential Regulation
disclosure of equity products should focus on risks of stock investment and fluctuations of stock prices. Information disclosure of commodity and financial derivatives products should emphasize the underlying assets, holding risks, control measures and changes of fair value of derivatives. Information disclosure of hybrid products should highlight details of the investment portfolios. In terms of transactions with related parties, financial institutions should not use funds of WMPs to engage in illegal transactions or tunneling with related parties, and should establish an internal examination and evaluation mechanism for major related transactions and fully disclose information to investors.
Abolishing implicit guarantee. To address the ubiquitous practice of implicit guarantee, the Guidelines puts forward rules covering various aspects . Firs t , in terms of the definition of wealth management business, it is emphasized that investors should bear risks and get returns all by themselves and that financial institutions can charge nothing more than management fees. Performance remuneration is incorporated into management fees and is mapped to corresponding products. Financial institutions cannot make promise about principal or returns, nor can they repay investors with fund not coming from the WMPs when there is repayment crisis. Second, it is important to guide financial institutions to change the model based on expected returns and to strengthen the management of WMPs’ net value which should be recognized based on the enterprise accounting principles and should be audited by the custodian institution
and verified by auditing institutions. It is encouraged that the financial assets in which the WMPs are invested be recognized at fair value. If the financial assets are recognized at amortized costs, the practice should be in line with the enterprise accounting principles as well as the conditions and deviation requirements set by the Guidelines. Third, the Guidelines defines what can be regarded as implicit guarantee, including cases where the net value principle is violated coupled with guaranteed principal and returns, where the WMP is issued on a rolling basis coupled with guaranteed principal and returns and where the financial institution repays investors with its own fund or commissions other institutions to pay for them. Fourth, different punishments are applied to different types of institutions. For deposit-taking financial institutions that provide implicit guarantee, they are regulated by the CBIRC and the PBC in accordance with rules on deposit business. Such institutions will be asked to pay the deposit reserve and deposit insurance fee in full and will receive administrative penalties. For non-deposit-taking but licensed financial institutions that provide implicit guarantee, the relevant financial regulators and the PBC will correct their practice and give penalties in accordance with law.
Enhancing management of investor
appropriateness. To prevent financial institutions from breaking the limits on investors by product embedding or splitting and selling highly risky products to inappropriate investors, the Guidelines provides a uniform standard to define qualified investors. For a

150
natural person, he/she has to have at least two years of investment experience and meets at least one of the conditions below: a) the household has net financial assets valued no smaller than RMB 3 million; b) the household has financial assets valued no smaller than RMB 5 million; or c) his/her average annual income over the latest three years is no smaller than RMB 400,000. For a legal person to be a qualified investor, it should have net assets of at least RMB 10 million at the end of the latest year. Meanwhile, according to the investment nature and risk degree of a product, the Guidelines stipulates the minimum investment a qualified investor should make in a single product, namely the minimum investment in a single fixed income product, hybrid product, commodity and financial derivatives product, and equity product should be RMB 300,000, RMB 400,000, RMB 1 million and RMB 1 million respectively. It is emphasized in the Guidelines that financial institutions should not deceive or mislead investors into purchasing WMPs that are incompatible with their risk tolerance capacity.
Strengthening management of NSCA
investment. To mitigate risks of shadow banking, the Guidelines sets rules on NSCA investment. First, the Guidelines defines the core elements of “standard credit assets”, including equal divisibility, tradability, full information disclosure, centralized registration, independent custody, priced at fair value, complete liquidity mechanism and being traded at exchanges approved by the State Council. Credit assets other than standard credit assets are defined as NSCAs. Second, it is stipulated
that WMPs investing in NSCAs should abide by the principle of maturity matching, namely the termination date of the NSCAs should be no later than the maturity date of the close-end WMPs or the latest open date of the open-end WMPs. Third, investment of WMPs in NSCAs should follow the regulatory standards regarding quota and liquidity management. Fourth, WMPs are prohibited from investing directly in credit assets of commercial banks. The Guidelines also leaves room for WMPs to invest in the beneficial right of commercial banks ’ c r ed i t a s se t s . L imi t s on such investments will be formulated by financial regulators separately.
Regulating management of capital pools
and asset portfolios. To address the low transparency of capital pool operation, the Guidelines prohibits financial institutions from engaging in capital pool business and emphasizes that the fund of each WMP should be managed separately and that each WMP should have its account set up and kept separately. It is required that financial institutions should enhance management of liquidity risks and product duration in the case of maturity mismatch, and that close-end WMPs should have terms not shorter than 90 days. Maturity mismatch is not allowed for WMPs investing in NSCAs or unlisted shares of enterprises. For a single financial institution that invests in one asset via issuance of several products, the total investment amount cannot exceed RMB 30 billion. To address the complexity of portfolios, the Guidelines requires that the assets invested in by every WMP should be clear in structure with risks
151Chapter III Macroprudential Regulation
identifiable and that risk concentration should be properly controlled. Based on this, the Guidelines also stipulates the proportion of a single WMP or all publicly-offered WMPs issued by a financial institution that can be invested in a single security or a single securities investment fund, and the proportion of the entire WMPs and entire open-end publicly-offered WMPs issued by a financial institution that can be invested in a single stock. Meanwhile, it is stipulated in the Guidelines that financial institutions should enhance risk firewalls between proprietary fund and WMP fund and between different WMPs through independent third-party custody.
Clar i fy ing requirements on capi ta l
constraints and reserve provisioning. WMPs are off-balance-sheet to financial institutions, and therefore the risks should be borne by investors. However, in order to respond to operational risks and other unexpected risks, it is still necessary for financial institutions to set up certain risk compensation mechanism and draw corresponding r isk reserves. Currently, there are different requirements for WMPs issued by different types of financial institutions in terms of risk reserve provision and capital measurement. Banks reserve a certain proportion of wealth management income as operational risk capital according to relevant capital regulation. Publicly-offered funds and AMPs of securities companies, fund subsidiaries and insurance asset management companies reserve part of their income from management fees, but the proportions differ from one another. Trust companies put 5% of after-tax profit into trust compensation
reserves. Based on existing requirements, the Guidelines stipulates that financial institutions should put 10 percent of WMP management fees into risk reserves or reserve operational risk capital or corresponding risk capital. No more risk reserve is required if the balance of risk reserves reaches 1 percent of the balance of WMPs for a financial institution. Risk reserves are primarily used to make up for losses to invested assets or to investors as a result of financial institution’s breach of regulations or WMP agreements, operational m i s c o n d u c t a n d t e c h n i c a l p r o b l e m s . Meanwhile, financial institutions should report the use of risk reserves to financial authorities on a regular basis.
Unifying standards for different types of
leverage. There are two types of leverage that are employed by WMPs. The first is liability-based leverage, namely the financial institution, during the process of investment after issuance of product, pledges the invested assets or takes other measures to borrow from “outside of the product”. The second type is tranche-based leverage where the financial institution divides the WMP into tranches based on priority and the inferior tranche borrows from the superior tranche “within the product”. To promote sound operation of the financial market and to prevent excessive fluctuation of asset prices, the Guidelines sets limits on leverage that WMPs can employ. In terms of liability-based leverage, the liability ratio (total assets/net assets) of open-end publicly-offered funds, close-end publicly-offered funds, tranched privately-offered funds and other privately-offered funds should
152
not be higher than 140 percent, 200 percent, 140 percent and 200 percent respectively. Moreover, financial institutions cannot pledge shares of products entrusted to them. In terms of tranche-based leverage, it is prohibited to divide publicly-offered products and open-end privately-offered products into tranches. With regard to close-end privately-offered products, the tranche ratio (superior tranches/inferior tranches) of fixed income products, hybrid products, commodity and financial derivatives products and equity products should not exceed 3:1, 2:1, 2:1 and 1:1 respectively. Financial institutions should take the responsibility of managing tranched products and cannot entrust the products to inferior investors.
Containing multiple reinvestment and
channelling business. To contain incentives to embedding products from the source, it is required in the Guidelines that financial regulators should allow all types of financial institutions to have equal access to wealth management business and that all WMPs should be treated equally in terms of account initiation, ownership registration and legal matters. Meanwhile, the number of layers of embedding is limited to one. One WMP can invest in another WMP, but the WMP being invested in cannot invest in any product other than publicly-offered securities investment funds. Financial institutions are prohibited from providing channelling services to help other financial institutions to shirk away from WMP-related regulatory requirements such as investment scope and leverage limits. Considering the reality, the Guidelines allows financial institutions with incapacity in
investment to entrust other institutions to invest for them, but it by no way means the trustee does not have to take its due responsibilities. Publicly-offered WMPs can be entrusted only to financial institutions and privately-offered WMPs can be entrusted to managers of privately-offered funds. The entrusted institutions cannot re-entrust the WMPs to another institution.
Establishing the comprehensive statistics
system. To provide solid data foundation for functional regulation and thorough regulation, the Guidelines puts forward clearly the idea of building a unified reporting system for WMPs. The PBC takes the lead in the work of product identifiers and comprehensive statistics and works with financial regulators to develop statistics mechanism, build product information system, regulate and unify product standards, information classification, coding and data format, and collect information of every single product regarding basic elements, issuance, assets and liabilities and termination. It is stipulated that financial institutions should report to the PBC and financial regulators simultaneously and should report information of products involving debt investments to the financial credit information database. Before the official operation of the comprehensive statistics system, all financial regulators should report data to the PBC in accordance with a uniform reporting template designed for the interim period and should exchange cross-sector and cross-market risk information and incidents in a timely manner. The PBC is responsible for supervision and examination of the statistics reporting of WMPs offered by
153Chapter III Macroprudential Regulation
financial institutions.
Regulating robo-advisors in a visionary
manner. The development of FinTech is changing how financial sector provides services. In the area of wealth management, the emergence of robo-advisors is a typical example. In recent years, robo-advisors rose rapidly in the United States, and in China a dozen of institutions have provided such services. AI technologies are applied in businesses such as investment advisory and wealth management whose targets are mostly long-tail clients with low tolerance to risks. If there is not adequate management of investor appropriateness or risk alert, incidents might occur, leading to market instability. In addition, issues such as homogenization of algorithms, technological limitation and cyber security cannot be ignored. As a result, the Guidelines puts forward requirements on application of AI technologies from a visionary perspective. On one hand, one has to earn relevant qualifications to use AI technologies in providing investment advisory services, and non-financial institutions should not extend service scope to wealth management or engage in wealth management business in the name of providing robo-advisory. On the other hand, financial institutions are prohibited from exaggerated promotional language when applying AI technologies in the provision of wealth management services. Rather, they should disclose major parameters of the model and primary logic for asset allocation, clarify on trading process and enhance trace management. In the case of herd behavior caused by flaws in algorithms or abnormities
of information systems, financial institutions should take manual intervention in a timely manner to correct or terminate AI services.
Preventing non-financial institutions from
engaging in wealth management business.
To safeguard market order and financial stability and to protect the legitimate rights and interests of investors, the Guidelines considers the engagement of non-financing institutions in the wealth management sector. It is specified that wealth management business, as part of financial services, should be covered by financial regulation. Non-financial institutions are prohibited from issuing or selling WMPs, otherwise prescribed by other regulations of the country. Non-financial institutions or individuals, without approval from financial regulators, cannot sell WMPs on others’ behalf. Such behavior of non-financial institutions will be overhauled where they use online platforms to publicly promote WMPs, where they split and sell products with certain investment thresholds, where they put excessive highlight on credit enhancement measures to hide risks of the products and where they set up a secondary market to trade products. Non-financial institutions will be held legally accountable if their actions involve illegal fund-raising, illegally taking public deposits or illegal issuance of securities. Heavier penalties will be applied to non-financial institutions that not only engage in wealth management business illegally but also promise or provide implicit guarantee. For privately-offered investment funds, its special laws and regulations are applied preferentially, and for matters not specified in such laws and
154
regulations, the Guidelines will apply.
Setting the interim period prudently. The Guidelines, on one hand, aims at addressing real problems and makes targeted policies to guide the wealth management sector to fulfill its original mission, while on the other hand, tries to keep balance between preventing risks and safeguarding market stability based on full evaluation of policy impact on the financial market and financing of real economy. As a result, the Guidelines sets up an interim period that begins from the date of release and ends at the end of 2020. During the interim period, financial institutions should follow the requirements set by the Guidelines when issuing new WMPs. For the undue assets invested by existing products, the Guidelines allows financial institutions to issue products operated under the old regulatory rules to invest in order to maintain necessary liquidity and market stability. However, the overall size of existing products cannot grow and should shrink gradually. Most of the existing NSCAs will come to maturity during the interim period. Financial institutions may deal with these NSCAs by means of asset securitization, transformation to standard assets, early termination with consent from clients and moving back to balance sheet, and thus financial institutions will not face too much pressure on supplementing capital for moving these NSCAs back to balance sheet in general. Financial authorities will also guide banks to supplement capital in a phased and gradual manner and will roll out supporting measures.
Keeping appropriate strength and pace
of policy implementation. To effectively implement the Guidelines and to promote its sound implementation, the PBC released on 20th of July the Notice on Further Clarification of Issues Concerning the Guidelines on RegulatingWealth Management Businesses of Financial Institutions, which specifies some operational issues during the interim period. The Notice further specifies the investment scope of publicly-offered WMPs, valuation methods for relevant products during the interim period, details of the macroprudential policies and the independent and orderly rectification for financial institutions during the interim period.
I I I . Out look o f the Weal th Management Market
As a regulatory document covering the entire wealth management sector, the Guidelines is a first step of the critical battle to prevent and defuse major risks. It will reinvent the wealth management sector and guide it towards regulated and mature development. The release of the Guidelines may result in the shrink of the wealth management sector in the short term but in the long run it will be conducive to better market order and prevention of systemic risks, facilitate active management of financial institutions and cultivation of rational investors, contribute to innovation of financial regulation and promotion of modern financial governance system and capacity, and facilitate optimization of the financial structure and stronger support to economic restructuring and upgrading.
155Chapter III Macroprudential Regulation
The wealth management sector is still faced
with grand development prospect after
returning to serving its original mission.
With the implementation of the Guidelines, the wealth management sector will go back to its mission in the first place, namely “entrusted by others to manage their wealth on their behalf”. With orderly abolition of implicit guarantee, it will become a solid rule in the market that investors should bear risks by themselves. Financial institutions will be honest, diligent, responsible and professional. Products will have clearer structures and more transparent operation with risks under control. The market will be effectively regulated with multiple levels of products and services and brimming with innovation and vitality. In the future, the increasing demands from households and enterprises for diversified asset allocation, together with the growing social security fund, pension fund and insurance fund, will provide continuous impetus for the development of wealth management business. Against the backdrop of interest rate liberalization and FinTech development, wealth management business will also become an important strategic option for financial institutions because is helps to adjust business structure, reduce capital occupation and cultivate new source of competitiveness. The wealth management sector in China enjoys great development prospect in that it has not only strong external driving force but also internal impetus coming from financial institutions for better development and transformation. For sound and mature financial institutions that engage in compliant operation, they will be embraced by more opportunities than
challenges.
Net-value products will become mainstream
and institutions will have stronger active
management capability. In terms of product model, products based on expected returns will gradually be transformed to be based on net-value. Changes of value of the underlying assets will be reflected by fluctuations of net value in a comprehensive and genuine way, which will, on one hand, promote financial institutions to enhance investment research and risk control, and on the other hand, make investors identify risks and be more aware of the fact that they should bear risks by themselves. In terms of underlying assets, investment in NSCAs will gradually be transformed to investment in standard assets that are better in information disclosure, fair pricing and liquidity, which will extend and deepen relevant market. Restrictions on multiple reinvestment and channelling business will promote financial institutions to abandon the idea of “passive” management and regard themselves as institutional investors with mid-and-long-term horizon, which will promote them to exercise due diligence, take advantage of their resources and merits, break the pattern of competition of homogenized products and optimize asset allocation, so as to form a chain of wealth management with professional trustees, balanced division of responsibilities and complementary advantages. Financial institutions with stronger capacity in asset management, asset al location and r isk management will stand out and make use of their best resources in manpower, research and capital to guide the entire sector to become
156
more professional.
Investment behavior will be more rational
and protection of investors’ rights will
be enhanced. Classification of WMPs and uniform standards for qualified investors will make products match investors more effectively. With knowledge of a product including the direction of investment, leverage level, allocation of returns and investment risks, investors can choose appropriate products based on their financial strength, degree of risk tolerance and investment experience. Investors with low risk tolerance may choose products of lower risks such as publicly-offered funds and fixed income products while those with higher r isk tolerance may choose, based on their needs, such privately-offered products as equity, commodity and financial derivatives and hybrid products. As investor appropriateness and investor education are gradually enhanced, investors will be more tolerant to fluctuations in net value of products and will be able to bear risks by themselves and safeguard the market order while identifying risks and enjoying returns. Benefit tunneling of financial institutions via WMPs will be cracked down on, which will effectively protect rights and interests of investors.
Structure of the financial market will
be optimized and new fund will orderly
enter the market. The Guidelines regulates investment in NSCAs and restrains financial institutions from lending in the disguise of WMPs, which will make regulatory measures on capital and provisions more effective, make
price of money more genuine and optimize resource allocation of the financial market. Restraining investment in NSCAs will make WMPs be more preferable to standard assets such as bonds and stocks. Rules regarding tranched products and limits on concentration of stock holding will mitigate fluctuations of the stock market. Moreover, by allowing publicly-offered WMPs to make compliant investments in stocks, the Guidelines will guide the fund of products that are compatible with investors’ risk tolerance capacity to enter the stock market, which will bring sustainable and stable new source of fund to the stock market.
Regulatory coordination will be strengthened
and the competition environment will
be fairer and more orderly. Misconduct in the wealth management market reflects the incompatibility between separation of regulation and integration of financial businesses. Under the unified rules, China’s wealth management sector will have a clearer regulatory framework and more specified regulatory responsibilities, which is conducive to coordination and efficiency. The establishment of the WMP uniform reporting system and information system will make underlying assets and ultimate investors more identifiable. Financial authorities can have real-time and thorough regulation over the issuance, investment and repayment of WMPs and monitor business development and risks more accurately, allowing them to have a clear picture of the market and prevent cross-sector and cross-market risks in a timely manner. Financial regulators will improve, within the

157Chapter III Macroprudential Regulation
framework of the Guidelines, the supporting rules about wealth management business for financial institutions in different sectors, allow
equal market access and eliminate obstacles, which will safeguard the market order featuring fair competition.
158
Special Topic 17 Overview of the Investment in Financial Institutions by Non-Financial Enterprises and Relevant Regulatory Issues
In recent years, as China continues to further reform and open up its financial sector, a large number of non-financial enterprises have invest in financial institutions through incorporation, merger and acquisition, and shareholding. This helps expand the funding sources for financial institutions, replenish their capital as necessary, improve their equity structure, and reinforce the mutual understanding between the financial sector and the real economy. In the meantime, however, undesirable issues have arised, including excessive investment in the financial sector, aggressive expansion, false capital contributions or repeated capital injections, unduly intervention in the operation of financial institutions, and tunneling behaviors through connected transactions, which accelerated the flow of funds away from the real economy and resulted in risk contagion between the industries and the financial sector. It is urgent that clear policy guidance be provided and regulation tightened.
I. Overview of the Investment in Financial Inst i tut ions by Non-financial Enterprises in China and the Accompanying Chanlleges
The financial sector and the real economy
live and thrive together. It is common practice worldwide that non-financial enterprises would invest in financial institutions as they grow to a certain stage. It can meet the need for capital replenishment of the latter and for diversified resource allocation of the former. In recent years, an increasing number of non-financial enterprises have invested in financial institutions in China, including central state-owned enterprises (SOEs), local SOEs, private enterprises, especially the large-sized Internet- and technology-based firms. These non-financial enterprises control several hundred financial institutions, whose combined size of assets taking up a growing share of the total assets of the financial industry.
Though most of the investment is financial investment, there are cases where multiple enterprises across more than one financial sub-sector are control led by the same conglomerates, exerting huge social influence. In some cases, non-financial enterprises with strong business performance, high credibility and high level of conformity to laws and regulations have optimized their capital allocation by investing in financial institutions. Through taking advantage of the synergy effect in coordinating different types of financial institutions controlled by them, such as finance companies, banks, trusts, and
159Chapter III Macroprudential Regulation
insurance firms, they have gained easier access to financial services. In this process, not only the own businesses of the conglomerates are facilitated, but the financial institutions they invest in have fostered a diversified equity structure, replenished capital, and improved their corporate governance. However, as the investment in financial institutions gains speed, challenges and risks are accentuated.
Excessive investments in the financial sector
instead of the real economy. Some non-financial enterprises ignore the growth of main business and excessively crave for high returns without a scientific and strategic plan by betting against bets and seeking profits from speculation. As financial licenses are regarded as a rare resource and equity transfer has a high premium, some other non-financial enterprises would apply for financial licenses and soon transfer their equities so as to reap huge profits. This, to some extent, has undermined the growth of the real sector.
Aggressive and sprawling growth models. Practice has shown that some non-financial enterprises march into the financial sector through leveraged financing, repeated capital injection and false capital injection, resulting in conglomerates or financial groups that are across sectors, industries, regions, and even borders, which are often referred to as cliques. Being colossal with complicated business activities and unconventional expansion of asset size, these cliques siphon out large sums of funds from financial institutions via connected transactions and transfer of benefits, posing a potential threat.
Investment with borrowed funds and the
resulting increase of corporate leverage
ratio. Lacking in an overall capital constraint, some enterprises invest in financial institutions with non-proprietary funds, such as bank loans, funds raised through bond issuance, entrusted funds, and “actual debts in disguise of equity”. There are cases of false capital injection or repeated capital injection. This type of investment contributes to no increase of risk-resilient capital, and pushes up the leverage ratio of these non-financial firms, sowing the seed for debt risks.
Complex organizational structure and
opaque under ly ing r i sk condi t ions . Some non-financial enterprises invest in several financial institutions, with cross-ownership, multiple layers of ownership, and a host of connected enterprises. This has complicated the organizational structure and weakened corporate governance. The controlling or beneficial relations are covered up intentionally through complex equity arrangement, connected relations, special purpose vehicles, and equity holding through an agency relationship, which enables the final controlling persons and beneficiaries to manipulate the enterprises and their controlled financial institutions behind the scenes. This has resulted in risk contagion and a severe lack of transparency of risk conditions.
Undue intervention in the operation of
financial institutions and lack of risk
segregation. Most non-financial enterprises are engaged in other operations and commercial activities. In the absence of an adequate
160
firewall between enterprises and financial institutions, there are possibilities of cross risk contagion between enterprises and financial institutions, as well as among different financial institutions. In particular, some enterprises intervene in the daily operation of financial institutions in their capacity as the actual controlling entity. They use financial institutions as a financing platform for their own good, transfering benefits through insider and connected transactions, and facilitating the rapid expansion of groups, which has severely undermined the interest of financial institutions and financial consumers.
Lack of professional qualifications in
operating financial businesses and the
re su l t ing rampant specu la t ion and
arbitrage. The real sector and financial sector differ in risk characteristics and management patterns. Some non-financial enterprises lack the capability for financial management and risk control, and the concept of compliance. They crave for short-term high returns, fail to operate in a compliant manner, and get heavily engaged in speculation and arbitrage.
In recent years, the risk of investment in financial institutions by non-financial enterprises has been exposed intensively and market irregularities have been growing. Regulators have taken measures in response to investments of non-financial enterprises in their regulated sectors. However, due to inconsistent regulatory standards, lack of see-through regulation on shareholders, loose requirements for equity structure and inadequate scrutinization of sources of funds,
as well as ineffective regulation of corporate governance and connected transactions, it is difficult to effectively isolate the risks of the real sector from that of the financial sector.
I I . B a s i c P r i n c i p l e s f o r Regulation Tightening
Currently, the Chinese economy has shifted from a high-speed growth to high-quality development. Efforts are being made to continuously deepen the supply-side structural reform and steadily promote the two-way financial open-up. Given the problems and market irregularities arising from the investment by non-financial enterprises in financial institutions, it is high time that a clear policy guidance be provided, regulation be enhanced, growth models be corrected, capital constraints be strengthened, and enterprises with high leverage ratios be refrained from investing in financial institutions. Efforts should also be made to improve the strength and competitiveness of both non-financial enterprises and financial institutions, straigten out the relations between the financial sector and the real economy and guard against systemic risks.
Drawing upon international experience and based on the developments of the real economy and the financial sector in China, we need to adopt the following principles when improving regulation of investment in financial institutions by non-financial enterprises. First, non-financial enterprises should focus on its own main business and invest in financial institutions in a more scientific way to better serve the real economy

161Chapter III Macroprudential Regulation
and avoid excessive pursuit of financial profits. Second, tighten capital constraints, and set limit on leverage ratios to ensure investment in financial institutions is commensurate with the investors’ capital size and management capacity. Third, enforce stricter market access and strengthen eligibility requirements for shareholders of financial institutions, specify transparency requirements for equity structure, and intensify supervision and administration on the authenticity and compliance of funding sources and capitals. Fourth, risks of the real sector should be isolated from that of financial sector by tightening corporate governance and regulation on connected transactions, strictly avoiding unduly intervention in daily operation of financial institutions, and eliminating the embezzlement and crowding-out of funds of financial institutions. Fifth, in line with see-through regulation and the principle of substance over form, authorities should strengthen supervision and law enforcement, enhance inter-agency regulatory coordination and information sharing. Sixth, equal attention should be given to regulating market order and activating market vitality. On the one hand, non-financial enterprise should be required to invest in a compliant manner. On the other hand, financial institutions should be allowed to seek shareholder diversification, expand channels for capital replenishment, and promote mutually beneficial development.
III. Strengthening Regulation in Key Aspects in A Problem-oriented Approach
In April 2018, the PBC, CBIRC, and CSRC
jointly issued the Guidelines on Tightening Regulation on Non-financial Enterprises’ I n v e s t m e n t i n F i n a n c i a l I n s t i t u t i o n s (hereinafter referred to as the Guidelines), in an effort to regulate the investment of non-financial enterprises, require them to focus on own main business, and help introduce qualified shareholders for financial institutions. In the meantime, the Interim Measures for the Equity Management of Commercial Banks, Measures for the Equity Management of Insurance Companies, and Regulations on the Equity Management of Securities Firms (Draft for Comment) have also been released, as an enhancement to the regulation of various types of financial institutions. Through tightening regulation, intensifying market disciplines, and putting in place positive incentives, we aim to effectively separate risks of the real sector from that of the financial sector, promote mutually beneficial development of both non-financial enterprises and financial institutions, assist in the campaign to prevent and mitigate major risks, and safeguard the bottom line of no outbreak of systemic financial risks, so as to create a favorable financial environment for the real economy.
Specify qualifications for shareholders
and simplify equity structure. Strong and credible shareholders are preconditions for the sound operation of financial institutions. The Guidelines proposes differentiated regulation over different categories of shareholders depending on their importance, with the focus on those non-financial enterprises that are the major shareholders or controlling shareholders of financial institutions. Fewer restrictions
162
are imposed on general financial investment. Major shareholders, controlling shareholders in particular, are required to have well-focused core businesses, abundant capital, good corporate governance, a clear-cut equity structure, up-to-the-standard management capabilities, sound financial conditions, adequate assets to liabilities ratio and leverage ratio, and a reasonable and clear business plan for investing in the financial sector. To address the problems arising from actual investment, such as complex equity structure, cross-shareholding, multi-layered shareholding, insufficient information disclosure, and implicit final beneficiaries, the Guidelines further emphasizes that investment by non-financial enterprises in financial institutions should be based on a clear-cut equity structure, simplified investment scheme, and more transparent organizational structure. In addition, the Guidelines also strengthens the administration of equity pledge, transfer, and auction to avoid illegal and hostile pledge and transfer of equities held at financial institutions.
Limit sources of funding and tighten
regulation and administration of capital. In view of increased leverage due to investment with non-proprietary funds, and problems arising from false capital injection and repeated capital injection, the 2017 National Financial Work Conference noted that non-financial enterprises must use their own funds when investing in financial institutions. The Guidelines stress that funds invested in financial institutions should be legitimate and real, and should not be non-proprietary funds, such as entrusted funds, borrowed funds, and
“actual debts in disguise of equity”. Sources, nature and use of funds should be scrutinized to avoid false capital injection, repeated capital injection, and illegal withdrawal of capital. See-through regulation should be adopted to identify real controlling persons and final beneficiaries to avoid entrusted shareholding and illegal connected shareholding. The Guidelines also require major shareholders or controlling shareholders to have sound financial conditions and capital replenishment capabilities with adequate overall assets to liabilities ratios and leverage ratios as well as reasonable levels of debts and term structure.
Imrpove corporate governance and enhance
risk isolation. To effectively isolate financial risks from the real sector risks, the Guidelines stipulates that non-financial enterprises who have controlling shares in financial institutions should put in place a firewall in terms of legal entity, funds, and financial conditions to institutionally separate the businesses in the real sector from those in the financial sector, and set effective rules for business dealings and information sharing between non-financial enterprises and financial institutions. Financial institutions should set up effective check-and-balance mechanisms in decision-making, execution and oversight, further empower the board with decision-making, and avoid abuse of powers by large shareholders or controlling persons. Cross-shareholding between non-financial enterprises and financial institutions should be forbidden. Senior management of the investing group should not assume posts simultaneously at its invested or controlled financial institutions.
163Chapter III Macroprudential Regulation
Rein in connected transactions and prevent
tunneling of benefits. Strictly regulating and supervising connected transactions is the core task in strengthening the regulation of investment in financial institutions by non-financial enterprises. To tackle the transfer of benefits and illicit acquisition of funds from financial institutions through connected transactions, the Guidelines require that general connected trading should be reported regularly, while major connected transactions should be reported on a case-by-case basis. When becoming major or controlling shareholders of financial institutions, non-financial enterprises should submit a commitment letter that they have no connections with shareholders other than related parties and will not engage in illicit connected transactions. Financial institutions should comply with see-through requirements and put in place effective administrative rules for connected transactions. Any attempts to circumvent regulation by covering up connected transactions and actual use of funds should be prohibited. Enterprises should not transfer benefits or risks through connected transactions. They should not abuse the powers as controlling persons to intervene in the independent operation of financial institutions or siphon out funds from financial institutions illegally.
Strengthen macroprudential regulation
and regulatory coordination. To further
promote the institutional reform of the financial regulatory regime and address regulatory gaps, the Guidelines point out that based on the see-through and substance over form principles, financial regulators should focus on regulating shareholder qualifications, sources of capital, governance structure, and connected transactions of financial institutions, and set up a mechanism for reporting on the equity structure of financial institutions. In the meantime, coordination and information sharing between financial regulators and other agencies, including the development and reform department, the finance department, and the department for the administration of state-owned assets, should be enhanced.
To facilitate orderly implementation and ensure the effective mitigation of risks while avoiding unintended market turbulences, the Guidelines note that the “Different treatment for cases prior to and after the promulgation date” should apply. For newly-made investments in financial institutions, the investments shall be subject to the provisions in the Guidelines. For investments made prior to the issuance of the Guidelines, investments with non-proprietary funds or through connected transactions should be regulated strictly; in cases where regulations are not met and market exit is necessary, proper market-based exit should be implemented in line with laws and regulations.
164
Special Topic 18 Establishing the Regulatory System for Financial Holding Companies to Avoid Their Savage Growth
Since 1990s, with the progress of financial globalization and innovation, the business model of the financial sector has shifted from sectoral operation to consolidated operation. Major advanced economies have relaxed the restrictions for sectoral operations and, therefore, many large financial institutions have transformed into financial holding companies (FHCs). Indeed, the emergence of FHCs is the combined result of market competition, financial innovation and the consolidated operation of the financial sector. In other words, such transformation is inevitable as financial sectors integrate. In recent years, China’s financial industry has become increasingly market-oriented. Many non-financial enterprises have transformed into FHC-featured entities through incoporation, acquisition and shareholding of various financial institutions across different types of businesses. Some FHCs have witnessed a savage growth, resulting in a large size, wide-ranging business portfolio, and high level of affiliated risk. Without adequate regulation and supervision, this may pose threats to the economic and social stability. There is an urgent need to establish the regulatory regime for FHCs to promote their sound development.
I. Global Practice for FHCs
In the U.S., FHCs are transformed from
eligible bank holding companies and there is still no legal definition for it. Bank holding companies refer to companies that exert control on banks or bank holding companies. To qualify for consolidated operation in the financial sector, bank holding companies must convert themselves to FHCs. In Japan, FHCs represent entities that control financial institutions engaging in no less than two types of businesses, or that control a subsidiary conducting a business different from its own. In South Korea, FHC is a company that controls more than one financial institution, boost assets of more than KRW 100 billion and receives approval from the Financial Services Commission. In the Taiwan region of the PRC, it means a company that controls a banking, insurance company or securities company through shareholding. European countries generally adopt the concept of “conglomerate”. The EU Directive on Supervision of Financial Conglomerates defines financial group as a group of companies under the mutual control of a parent company, the major businesses of which include no less than 2 different financial services (banking, insurance and securities service). The Joint Forum, established by Basel Committee on Banking Supervision, International Organization of Securities Commissions and International Association of Insurance Supervisor, defined financial group in the Financial Groups Supervision Principles
165Chapter III Macroprudential Regulation
as “a group with primary business in the financial sector and controls no less than 2 types of financial institutions among banking, insurance and securities sectors.”
From global practice, the fundamental feature of FHCs is its de-facto control two or more financial institutions of different types of business. There are two types of FHCs, namely the pure FHCs (management-oriented), represented by FHCs in the US, Japan and the Taiwan region of the PRC, and the business-oriented FHCs, represented by the ones in the UK and the European Continent. Pure FHCs only conduct shareholding management and formulate group strategies, while all financial businesses are run by its subsidiaries. Business-oriented FHCs emerge as financial institutions investing in other types of financial institutions. Apart from shareholding management, such FHCs directly engage in financial services in the banking, insurance and securities sectors.
Consolidated operation in the form of FHCs enjoys explicit competitive advantages. Firstly, FHCs can integrate clients and resources from various types of financial institutions. This enables the provision of comprehensive financial services to meet clients’ demand and the improvement of business efficiency. Secondly, entities within FHCs share group-wide infrastructures, which helps avoid redundant organizational units. The cross-sale of products through various financial entities brings economies of scale and scope. These features help FHCs reduce the costs of back-stage operation, management and financing. Thirdly, the diversified financing channels
through controlling companies or subsidiaries enhance FHCs’ financing capability. Capital can be transferred from low return department to high return ones in order to optimize capital allocation.
II. Global Regulatory Practice for FHCs
1. Legislation
Major countries and regions have invariably established specific legislations to regulate FHCs. In the U.S., there is the Bank Holding Company Act enacted in 1956. It has gone with three amendments in 1970, in 1999 after the introduction of the Financial Services Modernization Act and in 2011 with the release of the Dodd–Frank Wall Street Reform and Consumer Protection Act. In Japan, the Act for Partial Amendment of the AMA-related Laws and Special Law for the Establishment of Bank Holding Companies were promulgated in 1997, providing the legal basis for FHCs. South Korea enacted the Financial Holding Companies Act in 2000 to officially facilitate the creation of FHCs for comprehensive operation. In 2001, the Taiwan region of PRC enacted the Financial Holding Company Act, which clearly provided for the definition, establishment, competent authority, rights and obligations, and supervision of FHCs. The EU adopted the Financial Conglomerates Supervision Directive in 2002 and revised it in 2011.
2. Regulatory framework
The U.S. has established an umbrella-shaped
166
regulatory regime, combining lead regulation and functional regulation. The Federal Reserve serves as the lead regulator. The Office of Comptroller of Currency, the Securities and Exchange Commission and state insurance regulators conduct functional regulation over the subsidiaries of FHCs. Japan’s Financial Services Agency is the sole regulator mandated with market access and business regulation. In South Korea, the regulatory authority for FHCs is placed under the Financial Services Commission and its executive agency, the Financial Supervisory Service. In the Taiwan region of the PRC, the Financial Supervisory Commission is responsible for the approval of market access and on-going supervision.
3. Regulatory priorities
Capital adequacy. The U.S. focuses on the group-level capital adequacy on a consolidated basis. The Federal Reserve has developed a rating system for FHCs, or the RFI, in which R stands for risk management on a consolidated basis, F for financial condition on a consolidated basis, and I for impact on FHCs by the non-banking subsidiaries. In Japan, both FHCs and their subsidiaries need to comply with the capital adequacy requirements. At the group level, the consolidated capital of the FHC must exceed the aggregate regulatory capital of its subsidiaries under consolidation. Meanwhile, the net capital of the subsidiaries (excluding deductibles between subsidiaries) shall meet the capital requirement formulated by their respective regulatory bodies, on the basis of functional regulation. The Taiwan region of the PRC examines FHCs’ financial
and business soundness and capital adequacy with the Risk-based Aggregation Method raised by the Joint Forum.
Shareholding structure and shareholder
qualif ication. In Japan, bank holding companies are not allowed to hold FHCs and non-financial companies. The South Korea has stringent rule for shareholding of non-financial companies and affiliated companies by FHCs, shareholding of FHCs by financial institutions, and shareholding of bank holding companies by single shareholder or non-financial companies. Reverse holding and cross holding are strictly prohibited. The Taiwan region of the PRC released rules on shareholder qualification and cross holding of FHCs, and reverse holding is also prohibited.
Affiliated transactions and “firewall”. The U.S. specifies FHCs’ transaction principles, identification of affiliated parties, and risk prevention of affiliated transactions. Japan stipulates that banks shall not conduct transactions or activities to the detriment of the holding company with specific relevant parties or their clients. It is also restricted that the same director sits on the boards of both FHC and subsidiaries or between different subsidiaries. The South Korea regulates credit extension and operations between FHCs, their subsidiaries and shareholders. Credit extension to large shareholders is strictly controlled and improper intervention in the affiliated financial entities is prohibited. The Taiwan region of the PRC regulates transactions and joint business promotion between FHCs and subsidiaries, and between different subsidiaries. It forbids
167Chapter III Macroprudential Regulation
FHCs’ banking and insurance subsidiaries from providing unsecured loans to affiliated parties and engaging in activities that jeopardize the clients’ interests.
4. Regulatory measures and approaches
Market access permission. Major countries and regions have established approval-based access for FHCs. The U.S. allows FHCs to engage in banking, securities and insurance businesses, but over 25% of shareholding in banks by any individual or group will be subject to approval of the Federal Reserve. In Japan, the Financial Services Agency grants permission to the set-up of bank holding companies and insurance holding companies. A registration system is applied for initiating securities holding companies. In South Korea, the establishment and adjustments of FHCs need permissions from the Financial Services Commission. Taiwan region of the PRC stipulates that the establishment, adjustments and the scope of investment need to be approved or ratified by the Financial Supervisory Commission.
Information reporting and disclosure. The Federal Reserve is entitled to claim reports from FHCs and their subsidiaries. FHCs in Japan need to release consolidated financial reports within three months of the end of a fiscal year, and FHCs and their subsidiaries must submit reports at the demand of the Financial Services Agency. The South Korea requires FHCs to submit to the Financial Supervisory Service (under the Financial Services Commission) quarterly business
reports on their business performance and financial conditions. And as per regulation, FHCs need to disclose the financial statements, the profit and loss statements of the accounting period and consolidated statements as required. The Financial Supervisory Commission of the Taiwan region of the PRC is entitled to require FHCs and their subsidiaries to submit financial statements, transaction information and other data before certain deadline.
On-site inspection. The Federal Reserve is entitled to directly inspect any FHC and its subsidiaries (including depository subsidiaries and subsidiaries under functional regulation). The Financial Services Agency of Japan is authorized to take on-site inspections regarding compliance and risk control of FHCs and their subsidiaries. The South Korea Financial Supervisory Service can implement on-site inspections at FHCs and their subsidiaries, and specifically concerning business and financial conditions of large shareholders, and require relevant reports and materials from FHCs and their subsidiaries. The Financial Supervisory Commission of the Taiwan region of the PRC can designate experts to inspect FHCs and produce reports.
Regulatory penalties. In Japan, for FHCs violating laws and regulations or refusing to comply with regulatory penalties, the Financial Services Agency is authorized to take measures including dismissal of directors of the board, management and supervisors. The Agency can also revoke the FHC’s licenses or shut down part or whole of the business. In South Korea, the Financial Services Commission is
168
entitled to issue warnings, order remediations and disposition of shares, suspend part of the business, and revoke licenses. In the Taiwan region of the PRC, the Financial Supervisory Commission can require FHCs violating laws and regulations or prudent operation principles to rectify and correct within a certain timeframe. For more serious problems, the Commission can suspend FHCs’ business, dismiss the senior management and impose administrative penalty.
III. Development and Risks of FHCs in China
1. Recent development
Along with the decisions of the pilot programs for consolidated financial operations in a “steady” manner (in the Eleventh Five-Year Plan) and “active yet prudent” manner (in the Twelfth Five-Year Plan), consolidated operations in the financial sector have seen solid progress. Growth of cross-sector investment in the financial industry has accelerated and the number of non-financial entities investing in financial sector has increased. Such trends give rise to two types of FHCs.
For the first type, some financial institutions, while operating in its core business area, invest in or establish financial institutions in other sectors and become a consolidated financial group. In these cases, the group generally hold financial institutions in two or more sectors, and the parent company operates as the holding company and other institutions
within the group as subsidiaries. Large banks such as the Industrial and Commercial Bank of China, Agricultural Bank of China, Bank of China, China Construction Bank and Bank of Communications have invested in subsidiaries including funds, financial leasing companies and insurers. Ping An Insurance Group, China Life Insurance Group and People's Insurance Company of China have also invested in banks, funds and trusts.
For the second type, some non-financial companies have acquired majority share-holding in two or more types of financial institutions, becoming de-facto FHCs. There are five categories:
a) The State Council-approved corporate groups for the purpose of supporting economic development and open-up. Such corporate groups hold financial institutions in various sectors. For instance, CITIC Group and China Everbright Group, fully state-owned and state-administered, control institutions in the banking, securities, funds, insurance and futures sectors and in the real economy as well.
b ) T h e l o c a l g o v e r n m e n t - a p p r o v e d consolidated asset investment and operation companies, who invest in banks, securities, insurers and other local financial institutions as shareholder or major shareholder. Such companies include the TEDA Group, Shanghai International Group, and Beijing Financial Holdings Group.
c) Asset operation companies established by the parent company of the centrally-owned
169Chapter III Macroprudential Regulation
enterprises to manage group-wide financial businesses. China Merchants Group, The State Grid Corporation of China, China Huaneng Group have established China Merchants Finance Holdings, Yingda International Holdings Group and Huaneng Capital Services Corporation respectively. They are responsible for the management of financial institutions owned by the parent companies.
d) Private enterprises- and listed companies-controlled financial institutions across multiple sectors through investment, merger and acquisition. For example, Tomorrow Group, HNA Group, Fosun Group and Evergrande Group.
e) Integrated financial platforms built by some dominant Internet companies. They leverage the advantages in e-commerce and expand into the financial sector, acquiring multiple financial licenses. Examples include the Alibaba Group Holding, Tencent Holdings, Suning Commerce Group and JD.com. Among them, Alibaba Group has consolidated its financial assets and established the Ant Financial Services Group, which have been granted licenses in third-party payment, small credit, insurance, funds and banks.
2. Risks
Currently, risks in China's FHCs mainly come from holding companies established by non-financial enterprises through investment in multiple financial institutions. This type of investment could serve to increase capital strength of the financial institution and
optimize capital allocation of non-financial enterprises. It is also conducive to the growth of the tertiary industry and better understanding between the financial industry and the real economy. However, some ill-motivated enterprises resort to false capital contribution, leveraged funding and affiliated transactions to expand rapidly in the financial sector. They control various types of financial institutions operating as FHCs across sectors, industries, regions and borders. Risks have been formented and exposed in this process.
Irrational expansion into the financial
sector. Some non-financial enterprises have little knowledge of financial operation, while their shareholders, de-facto controlling persons and executives lack financial management skills, or risk control capabilities or awareness of compliance. However, they hold licenses in the banking, insurance, funds and payment businesses, and therefore gained access to a pool of funds. Part of the funds is transformed into capital, boosting up the capital adequacy ratio, and the rest is used for its business expansion overseas or the demands of subsidiaries through affiliated transactions.
False capital contribution. Some enterprises invest in financial institutions through multi-layered shareholding and cross-holdings, or with borrowed money, which drives up the overall leverage ratio. Due to regulatory gaps under the sectoral regulation, some other enterprises would make repeated capital injection in the disguise of a shell company or utilize external financing, resulting in hundredfold increases in total assets over a few
170
years. In the case of false capital contribution, the capital needed to withstand risks is lacking, and the capital constraint is severly undermined.
Group operation. Some enterprises operate as a group to expand the business scope of its subsidiaries. With barely comprehensible ownership structure and a series of resource integration, they are able to take advantage of regulatory inconsistencies for arbitrage. Some practices constitute violations to the laws and regulations.
Implicit structures. Some non-financial enterprises, particularly those held by private capital, take advantage of the complex shareholding arrangements,affiliated relations, special purpose vehicles and entrusted shareholdings to cover up the beneficial rights and shareholding relationship. In such cases, false capital injection and affiliated transactions become hard to identify for regulatory purpose.
Circumvention of regulatory rules. Some private enterprise groups claim to have full licenses overseas, and its opaque shareholding structures make it hard for domestic regulators to verify. Their sophisticated operation of fund flows, combined with evasion of domestic regulatory rules at the FHC level, give rise to arbitrage.
Affiliated transactions. Some non-financial enterprises obtain credit funds, manipulate profits, and transfer or hide assets through loans and guarantees from financial institutions they own. The financial institutions they hold
are used as cash machines to extract massive amount of funds, which is transferred to the de-facto controlling persons or the ultimate beneficiaries. These practices seriously jeopardize the interest of financial institutions and investors.
Excessive expansion. Through the above-mentioned means, some enterprise groups have expanded to an astonishing scale at equally astonishing speed. Some enterprises even try to accelerate the expansion through venture capital investment and listing. To cover up illegitimate business activities, some enterprises choose to expand and transfer assets overseas. The sources of foreign exchange involve, first, selling domestic assets for overseas purchasing; second, monetizing and transferring funds through domestic listing and M&A; and third, taking advantage of the ownership of banking financial institutions for offshore financing with domestic guarantees.
IV. Establishing the Regulatory System for FHCs in China
The savage growth of FHCs through the above-mentioned means must be treated as an acute disease, otherwise systemic risks may emerge. Under the sector-based regulation, the governing authorities for FHCs are not clearly defined, resulting in regulatory blind spots. As risks of FHCs accumulate and materialize more rapidly, it is critical to define the regulatory body and promulgate regulations to put FHCs under regulation. The Fifthth National Financial Work Conference has required “to strictly regulate the practice of consolidated
171Chapter III Macroprudential Regulation
financial operations and the industry-finance integration”. In the Fifth Plenary Session of the 18th CPC Central Committee and the 40th Politburo collective study session, President Xi Jinping reiterated the need to coordinate regulations on FHCs and eliminate regulatory gaps. The 19th CPC National Congress also listed the prevention and mitigation of major risks as the first and foremost task of the three priorities.
To meet these requirements on controlling risks arising from rapidly growing FHCs and preventing systemic risks, we need to establish the regulatory framework on FHCs in a timely manner, ensure their healthy development and bridge regulatory gaps. The combination of macro-prudential and micro-prudential approaches, based on the principle of substance over form, can be considered for the regulation of FHCs on a consolidated basis, to ensure a holistic, on-going and look-through supervision of FHCs. The mechanism for regulatory coordination and the empowerment of regulatory authorities with effective regulatory tools also need to be considered.
Approval -based market access . The provision of financial services requires special licensing. Those established companies with characteristics of FHCs, i.e. controlling two or more types of financial institutions, should be brought under supervision. Companies without licenses are not allowed to operate in the name of FHCs or bear names of “financial holding” and its short forms.
Strict regulation on capital adequacy ratio
(CAR). To forestall repeated calculation of capi ta l , which window-dresses the CAR of subsidiaries but the group remains insufficiently capitalized, group-wide CAR regulation should be stressed. It should be measured in three dimensions, namely the financial holding group, the financial holding company and the financial institutions they hold. In addition, FHCs are required to replenish capital for its subsidiaries when the latter encounter deteriorating financial cond i t ions and fa i l to mee t the CAR requirements. This not only protects the financial institutions and creditors, but serves as an ex ante binding requirement.
Limits on asset-to-liability ratio. To prevent debt risks and high leverage investment, FHCs’ debt ratio must be controlled within an appropr ia te range. Meanwhile , the capital should come from reliable sources. Shareholding in FHCs through non-proprietory funds such as borrowed funds or WMP funds is disallowed. Fraudulent and repeated capital injection as well as capital withdrawal from financial subsidiaries should be strictly prohibited.
Explicit shareholding structure. The FHCs should have a clear share-holding and organizational structure with transparent arrangement of shareholders and beneficiaries. They should establish solid management framework, put in place effective r isk management and internal control measures and maintain sound financial conditions. Prohibit ive policies are also required. Companies with poor credit records, serious

172
debt evasion and incompliance with regulation are disqualified as major shareholders of the FHCs.
Good corporate governance. FHCs’ corporate governance should be clearly regulated to avoid abuse of powers as de-facto controller by the FHCs, interference in the operation of financial institutions and tunneling. Specifically, the FHCs should manage the governance of affiliated financial institutions in compliance with rules and regulation. They should not abuse the de-facto controlling power or interfere in the independent operation of financial institutions. The FHCs should simplify the shareholding hierarchy to ensure clarity and transparency. Cross holding and reverse holding should be strictly prohibited.
Enhanced group- leve l r i sk contro l .
FHCs should establish a comprehensive r isk management system based on the organizational structure, scale and complexity of financial holding groups. A consistent set of risk tolerance and limits for various risks should be defined. Risk concentration and large exposure risk should be managed on
a consolidated basis and credit extension should be coordinated at the group level. In addition, FHCs should improve the “firewall” mechanism against risks, and develop risk isolation measures between FHCs and their subsidiaries, and between financial and non-financial institutions. Activities such as cross appointment and the sharing of information, facilities, buildings and operating systems within the groups should be regulated.
Tighter regulation on affiliated transaction.
Affiliated transactions within the groups should follow market principles without breaking rules of fair competition and anti-trust rules. The following practices should be strictly prohibited, including concealing affiliated transactions and actual flow of fund; tunneling through affiliated transactions to the detriment of investors or consumers; evading or violating regulations; reverse financing such as credit extension to FHCs from affiliated financial institutions; and providing unsecured loans to the FHCs’ shareholders or other affiliated parties.
173Chapter III Macroprudential Regulation
Special Topic 19 Establishing the Regulatory Framework of Systemically Important Financial Institutions
The most severe g lobal f inancia l and economic crisis in history burst in 2008, which was the materialization of financial risks accumulated during a long-term financial deregulation and liberalization. A number of large financial institutions like Bear Stearns, Lehman Brothers, AIG and Citigroup fell in stress or even entered bankruptcy in the crisis and caused huge damages to the global financial system. The failure of large financial institutions amplified the shock and made some of the European jurisdictions suffer from sovereign debt crisis due to huge bail-out costs. The flaws of the pre-crisis financial regulatory system were unmasked by the crisis, including lack of effective measures to address systemic risks, insufficient regulation on large and complex financial institutions, rising risks concerning the problem of “too-big-to-fail”big gaps in consumer and investor protection, and a huge scale of OTC derivatives and shadow banking businesses staying outside the regulatory perimeter. The lack of regulation on large and complex financial institutions with systemic importance was one of the biggest problems, and the corresponding policies need to be urgently developed.
I. The Necessity of Enhancing Regulation on SIFIs
The failure of SIFIs could lead to the
rapid contagion of crisis and cause huge
damages. SIFIs play an important role in the financial system and perform key functions, so would cause significant disruption to the financial system and economic activities if faced with material risks. On the one hand, the counterparties of the SIFIs would face huge losses directly due to credit risks; on the other hand, SIFIs generally act as the brokerage agencies of many institutions. Thus these institutions may hardly continue their normal business if SIFIs fail. What’s more, it may lead to broad asset repricing if SIFIs are forced to sell their assets to repay debts, which may cause the vicious spiral of “stopping losses, fire sales, stopping losses again, fire sales again” and induce systemic risks through amplifying the financial market volatility.
SIFIs are hard to resolve because of their
huge scale and complicated structure. For example, the creditors of Lehman Brothers claimed over USD 1.2 trillion globally, and the corresponding financial derivatives contracts involved 6,000 counterparties and 0.9 million contracts need to be resolved. After its bankruptcy, counterparties may choose to advance or postpone the termination of contracts, and need to deal with the collaterals (mainly securities assets) related to the contracts simultaneously. All of the above issues caused dramatic stress to the financial
174
markets and an accelerated contagion of risks in the financial system. Because of the lack of daily liquidity support from the parent company, Lehman Brother’s 209 subsidiaries in 21 countries had no choice but to file for bankruptcy at local courts in host countries.
The high costs to bail out SIFIs will increase
the fiscal burden. Given the significant negative externalities of the failure of SIFIs, governments usually have to spend a lot to bail them out in order to avoid a more severe shock to the financial system and real economy. In the 2008 crisis, the Federal Reserve and US Treasury provided USD 180 billion to AIG to prevent it from bankruptcy. The European Commission passed the bai l-out plans proposed by 10 member jurisdictions including the United Kingdom, France, German, Spain, Netherlands and Austria, with capital of over EUR 1.5 trillion. The huge costs to bail SIFIs out not only harmed the interests of taxpayers, but also increased the fiscal burden, as a result of which the sovereign debt crisis in part of the European countries exacerbated.
There is significant “too-big-to-fail” moral
hazard of SIFIs. Due to their significant impact on financial stability, SIFIs usually expect that the government would not let them to fall into bankruptcy. Thus, there is dramatic moral hazard risk from SIFIs that may adopt more aggressive business models, including using excessive leverage, carrying out a lot of high risk businesses like financial derivatives transactions, paying overhigh compensation to senior management, etc.
II. The International Experience of Regulation on SIFIs
1. The assessment of SIFIs
G-SIBs. The BCBS published in 2011 the assessment methodology of G-SIBs for the first time and revised it in 2013. According to the methodology, the 75 largest banks in terms of total assets globally, plus banks designated as G-SIBs in the previous year, would be included into the assessment sample, while member jurisdictions could also add banks under their regulation to the assessment sample by supervisory judgement. The methodology is based on a combined approach of quantitative indicators and qualitative judegement to assess systemic importance, and the quantitative indicators include cross-jurisdictional activity, size, interconnectedness, substitutability and complexity. Member regulatory agencies could adjust banks’ systemic importance to finalize the G-SIB list based on other quantitative and qualitative information. The final list should be approved by the FSB, and the assessment is carried out to update the G-SIB list annually. Currently 30 banks have been designed as G-SIBs.
G-SIIs. The IAIS published in 2013 the assessment methodology and policy measures of G-SIIs and revised the methodology in 2016. An insurer should be included into the assessment sample if at least one of the following criteria is met: total assets of more than USD 60 billion and a ratio of premiums from jurisdictions outside the home jurisdiction to total premiums of 5 percent or more; or
175Chapter III Macroprudential Regulation
total assets of more than USD 200 billion and a ratio of premiums from jurisdictions outside the home jurisdiction to total premiums greater than 0. The IAIS and its member jurisdictions could also add other insurers into the sample by supervisory judgement. Similar to that of G-SIBs, the assessment methodology of G-SIIs is also a combined approach of quantitative indicators and quali tat ive review. The quantitative indicators include global activity, size, interconnectedness, asset liquidation and substitutability. After calculating the systemic importance and determining the quantitative threshold, the IAIS will comprehensively consider other quantitative and qualitative information and further analyze insurers with scores over the threshold. After negotiation with relevant regulatory agencies and upon the approval of the FSB, the G-SII list will be finalized. The G-SII assessment is carried out annually and 9 insurers are designated as G-SIIs currently.
United States. SIFIs in the United States include bank holding companies (BHC), foreign banking Organizations, financial market utilities (FMU) and non-bank financial companies (NFC) with systemic importance. The former two kinds of SIFIs are designated by the Federal Reserve, while the latter two are designated by the Financial Stability Oversight Council. The assessment methodology is also a combination of quantitative indicators and qualitative analysis.
EU. In October 2013, EU established the Single Supervisory Mechanism (SSM) to enhance supervisory cooperation and avoid
regulatory arbitrage. The SSM is managed by ECB with member regulatory agencies involved . SSM assesses the f inancia l institutions’ systemic importance based on three dimensions, namely size, importance to economies of EU or member jurisdictions, and cross-jurisdictional activity. A credit institution will be in principle regarded with high systemic importance in EU if it meets at least one of the following criteria: total assets of more than EUR 30 billion; a ratio of total assets to GDP of home jurisdictions greater than 20 percent (except for those with total assets of less than EUR 5 billion); under the support of European Stability Mechanism; or total assets of more than EUR 5 billion and a ratio of cross-jurisdictional assets/liabilities from multiple jurisdictions outside the home jurisdiction to total assets/liabilities greater than 20 percent. Besides, the SSM could directly designate systemically important banks based on qualitative information at its discretion.
United Kingdom. The United Kingdom e s t a b l i s h e d a t w o - s t e p a p p r o a c h t o designate SIFIs. First, calculating systemic importance scores based on 4 indicators, namely size, importance, complexity and interconnectedness. Institutions with scores over 350 will be designated as SIFIs. Second, categorizing the remaining institutions into 6 categories and setting detailed standards to calculate their scores respectively. Institutions with scores over 100 will be designated as SIFIs. Prudential Regulation Authority (PRA) could designate institutions with scores below 100 as SIFIs at its discretion.
176
2. Additional regulatory requirements on SIFIs
G-SIBs. G-SIBs are allocated into 5 buckets with varying levels of capital and leverage surcharge, namely 1 percent, 1.5 percent, 2 percent, 2.5 percent and 3.5 percent for capital and 0.5 percent, 0.75 percent, 1 percent, 1.25 percent and 1.75 percent for leverage. Besides, G-SIBs shall also comply with the TLAC requirements (consisting of capital and eligible debt instruments) of at least 16 percent of RWA and 6 percent of the Basel III leverage ratio denominator (namely on- and off- balance sheet exposures) from January 1, 2019, and then comply with the standard of at least 18 percent of RWA and 6.75 percent of the Basel III leverage ratio denominator from January 1, 2022. G-SIBs headquartered in an EME could postpone the implementation of TLAC requirements for 6 years. If the aggregate amount of the EME’s corporate debt securities exceeds 55 percent of the EME’s GDP, the TLAC requirements shall be implemented within 3 years.
G-SIIs. IAIS proposed a three-step capital requirement for G-SIIs. The first step is to develop the basic capital requirements (BCR) for G-SIIs on all businesses, and the relevant standards have been implemented since 2015. The second step is to develop higher loss absorbency (HLA) requirements for G-SIIs with a focus on their non-traditional and non-insurance (NTNI) business, and the regulatory requirement for G-SIIs will be no lower than the sum of BCR and HLA by that time. The third step is to develop the insurance
capital standard (ICS) for internationally active insurance groups (IAIGs) based on the assessment of risks at the group level. Besides, IAIS requires G-SIIs to better address liquidity risks and develop and implement the Systemic Risk Management Plan, based on which the NTNI business with systemic importance should be separated from traditional insurance business.
United States. The Dodd-Frank Wall Street Reform and Consumer Protection Act enhances the Federal Reserve’s regulation on SIFIs. The Large Institution Supervision Coordination Committee was established within the Federal Reserve to supervise SIFIs. In terms of systemically important banks, the Federal Reserve has applied more stringent prudential s tandards including capital surcharge, supplementary leverage ratio, resolution planning and credit exposure reporting, etc. Meanwhile, stress tests, Comprehensive C a p i t a l A n a l y s i s a n d R e v i e w a n d Comprehensive Liquidity Analysis and Review are carried out regularly to assess whether institutions hold sufficient capital and could effectively mange their liquidity in extreme scenarios. Besides, G-SIBs headquartered in the U.S. shall comply with a more stringent TLAC requirement to ensure sufficient loss-absorbing capacity and bail-in resources, and to enhance the cross-border resolution and depositor protection.
EU. Under the framework of the SSM, ECB designates and directly regulates financial institutions with systemic importance in EU. The supervisory power includes inspection,
177Chapter III Macroprudential Regulation
licensing the cross-border subsidiaries, qua l i fy ing sen ior management , c r i s i s resolution, enforcement and sanction, etc. Meanwhile, the Minimum Requirement for Own Funds and Eligible Liabilities (MREL) requires member jurisdictions to determine the minimum MREL ratio for financial institutions based on their resolvability, overall risk profile and systemic importance. Besides, the EBA has developed the Guidelines on the criteria for the assessment of O-SIIs, according to which member jurisdictions could designate their domestic Other Systemically Important Institutions (O-SIIs) with a capital surcharge of at most 2 percent.
United Kingdom. In terms of Countercyclical capital requirement and SIFI capital surcharge, the United Kingdom follows the EU rule. In terms of resolution planning, the United Kingdom operationalizes the EU rule. Besides, the Bank of England carries out stress tests on large financial institutions annually to check their resilience to external shocks.
3. The resolution regimes of SIFIs.
International standards. The FSB first published the Key Attributes of Effective Resolution Regimes for Financial Institutions (hereafter referred to as the Key Attributes) in 2011 and revised it in 2014. The Key Attributes is a core international document for establishing effective resolution regimes for SIFIs. The document sets out principles in 12 aspects of effective resolution regimes, namely scope, resolution authority, resolution powers, set off, netting, collateralization, segregation
of client assets, safeguards, funding of firms in resolution, legal framework conditions for cross-border cooperation, CMGs, institution-specific cross-border cooperation agreements, resolvability assessments, recovery and resolution planning, and access to information and information sharing. To better facilitate the implementation of the Key Attributes by member jurisdictions, the FSB published over 10 guiding documents, including the Guidance on Developing Effective Resolution Strategies, Funding Strategy Elements of an Implemental Resolution Plan and Guidance on Arrangements to Support Operational Continuity in Resolution, etc. In practice, the FSB requires G-SIFIs to establ ish CMGs, develop RRPs, conduct resolvability assessments and enhance cross-border cooperation.
United States. The FDIC is the primary resolution authority. The scope of resolution covers banks and non-bank f inanc ia l institutions with systemic importance. SIFIs should submit resolution plans to the FDIC and Federal Reserve regularly, and the FDIC and Federal Reserve could jointly apply more stringent regulation on SIFIs or restrict their business expansion if the resolution plans submitted are unqualified. The orderly resolution procedure should be started jointly by the US Treasury, Federal Reserve and FDIC, and the FDIC could then take over or liquidate the SIFI in stress, or set up one or several bridge institutions to take over its business, assets and liabilities. In terms of loss allocation, public resources could be temporarily used to resolve SIFIs. If public
178
resources suffer from losses, it must be the case that shareholders and unsecured creditors should bear losses, and relevant fees could be charged from banks over a specific size if necessary.
EU. In 2013 and 2014, EU published a series of regulations including the SSM Framework Regulation, Bank Recovery and Resolution Directive, SSM Regulation, and revised the Deposit Guarantee Scheme Directive, to make an institutional arrangement of effective resolution regimes for EU members. The main elements include: primarily establishing resolution regimes covering credit institutions, financial groups, non-bank mortgage or business loan institutions and branches of non-EU institutions operating in EU; equipping the resolution authorities with broader powers; enhancing cross-border cooperation with relevant authorities; deciding to establish the Single Resolution Board at EU level to resolve all banks under the supervision of ECB and all global banks incorporated in EU Banking Union member jurisdictions; establishing the Single Resolution Fund, by raising money from all Banking Union members to reach a scale of 1 percent of total outstanding insured deposits, to support the work of the Single Resolution Board; appointing the Single Resolution Board as the resolution authority of a bank that should not be resolved by it originally, if the resolution of the bank need the support of the Single Resolution Fund; requiring financial institutions and the resolution authorities to develop RRPs and resolution authorities to conduct RAPs together with supervisors; enriching the resolution measures and tools
including transferring all or part of assets of the institution in resolution, setting up bridge entities to temporarily continue the business of the institution in resolution, excising toxic assets so that the resolution authorities could deal with them; introducing the bail-in mechanism to convert part of the debt of the institution in resolution to equity and at the same time developing feasible restructuring plans.
United Kingdom. The United Kingdom published the Banking Act 2009 to establish a special resolution regime for banking institutions. The Financial Services Act, which came into force in April 2013, expanded the scope of the special resolution regime to cover investment firms and financial market infrastructures. The current special resolution regime in the United Kingdom consists of the following elements: the objectives of the special resolution regime include safeguarding financial stability, ensuring the continuity of key functions, maintaining public confidence and farthest reducing the dependence on public funds. The Bank of England is appointed as the resolution authority, and the work division and coordination mechanism with other supervisors and the Treasury is established. The Bank of England is authorized with comprehensive resolution powers, including write-down or conversion of debt to equity, selling all or part of the business of the problem institution without the consent of shareholders and creditors, setting up bridge entities to maintain the continuity of operation, nationalization if necessary, etc. The mechanism of creditor protection in resolution
179Chapter III Macroprudential Regulation
is clarified, according to which the profits from bridge entities or nationalization should be given back to creditors. The compensation order of creditors should not be different from that in the ordinary liquidation procedure, and no creditors should be worse off than in the ordinary liquidation procedure. Depositors are further protected by rising the compensation limit of deposit insurance to GBP 85,000.
III. The Main Considerations of Improving the Regulation on SIFIs in China
The financial system in China has kept developing these years. Some financial institutions have been designated as G-SIFIs because of their big size. The ICBC, ABC, BOC and CCB have been designated as G-SIBs and their scores and rankings keep rising in the assessment, while Ping An Insurance Group has been designated as one of the 9 G-SIIs. Meanwhile, the interconnectedness within our financial system has kept rising, with interbank liabilities and off-balance sheet business growing speedily, and the complexity of the whole financial system has also risen fast. Some large and complex financial institutions stay at the core of the financial system because of their close interconnectedness with other financial institutions. The operation and risk profile of these financial institutions may have significant impact on the resilience of the whole financial system. It is thus very important to improve our regulation framework on SIFIs to mitigate systemic risks and enhance macroprudential regulation.
Against this background, the CPC Central Committee and the State Council have decided to establish a comprehensive framework of regulating SIFIs. Based on the international experience, taking into full consideration of the development of China’s financial system and the existing regulatory framework, the PBC will make an institutional arrangement on the assessment, designation, special regulatory requirements and resolution regimes of SIFIs, together with relevant financial supervisors.
1. Clarifying the assessment methodology and procedure for SIFIs
The assessment procedure includes several steps, namely determining the assessment scope, developing assessment indicators and data templates, collecting data, calculating scores, making supervisory judgement, f inalizing and publishing the l ist . The quantitative indicator system will be the basis of the assessment and thus the systemic importance scores of sample institutions could be calculated. The indicators consist of several categories like size, interconnectedness, complexi ty, subst i tu tabi l i ty and asse t liquidation, etc., to make the assessment outcomes more precise. The flaws of the quantitative indicator system, like insufficient flexibility and limited scope of indicators, could be addressed by the supplementary supervisory judgement based on qualitative analysis. The final list of SIFIs should be in line with the reality. On the one hand, financial institutions that may cause huge impact on financial stability should not be missed. On the other hand, the list should not include too many

180
institutions, in order not to produce excessive compliance burden to financial institutions. The assessment methodology and procedure should be reviewed regularly to better fit for the rapid development and evolvement of the financial sector.
2. Developing special regulatory requirements on SIFIs.
I n t r o d u c i n g a d d i t i o n a l r e g u l a t o r y
requirements. Given the important role SIFIs play in the financial system, they should comply with additional capital requirements to increase their resilience. To better capture the systemic importance of SIFIs, capital surcharge should be calculated following a consecutive approach, i.e. first selecting the institution with the highest systemic importance score as the benchmark and determining its capital surcharge, and then determining the capital surcharge for other SIFIs based on the ratio of their scores to that of the benchmark. Besides, other measures like leverage ratio requirements could be introduced to improve the regulation on SIFIs.
Improving corporate governance. SIFIs should establish a transparent and effective governance structure that could capture all the risks based on the existing corporate governance requirements. SIFIs should further clarify the responsibilities of the board of directors, the board of supervisors and senior management, and establish a risk management committee under the board of directors to assume the goal of risk management and develop risk management measures. By doing
this, SIFIs should form a rational corporate culture of appropriate risk taking and avoiding blind expansion.
Enhancing continuous monitoring. SIFIs should comply with higher disclosure standards. Financial regulatory authorities should share data and information of SIFIs and conduct risk evaluations on their entire or specific businesses. Stress tests should be carried out regularly to assess institutions’ resilience in the stress scenarios and introduce additional regulatory requirements or take corresponding measures based on the test results if appropriate.
Enriching the macroprudential policy
toolkit. If a SIFI infracts rules of prudential operation or threatens financial stability, relevant authorities could give risk warnings directly to it, or even suggest changing its business structure, operational strategy and institutional structure to reduce its probability of inducing systemic risks if necessary.
3. Establishing the special resolution regimes of SIFIs
First, CMGs should be established for SIFIs, whose responsibilities include developing the special resolution regimes for SIFIs, pushing forward the drafting of RRPs and conducting resolvability assessments, to ensure the safe, rapid and effective resolution of SIFIs if they fail. Second, SIFIs should develop and revise annually their recovery plans. Recovery plans should be implemented with the approval of CMGs. Recovery plans aim to ensure that
181Chapter III Macroprudential Regulation
SIFIs could recover by certain measures in extreme stress scenarios. Third, resolution plans of SIFIs should be developed and updated annually. Resolution plans should also be implemented with the approval of CMGs. By developing ex ante resolution plans, SIFIs could be resolved rapidly and in an orderly
manner if they fall into material financial stress or cannot continue to operate. Fourth, CMGs should conduct resolvability assessments of SIFIs annually to assess the feasibility and reliability of their resolution regimes, and make recommendations on how to improve resolvability.
182
Special Topic 20 International Standards on Resolution of Financial Institutions
Because of information asymmetry widely seen in the operation of financial institutions and possible contagion risk and negative externality following the failure of an insti tution, designing a risk mitigation and resolution regime that is incentive-compatible would help to increase resilience of the financial system. One of the major lessons learned from the 2007 Global Financial Crisis is that there was a lack of effective resolution regimes for failing financial institutions and an over-reliance on support from public funding. In retrospect of the painful memories of the crisis, the Financial Stability Board (FSB) introduced the Key Attributes of Effective Resolution Regimes for Financial Institutions (hereinafter referred to as the “Key Attributes”) and called on member jurisdictions of G20 to proactively establish effective resolution regimes for financial institutions, in an effort to ensure prompt and orderly resolution of financial risks and prevent the failure of a particular institution from triggering systemic shocks. In 2014, the FSB reviewed and updated the Key Attributes, and asked member jurisdictions to establish resolution regimes covering all types of financial institutions.
I. Lessons Learned from the 2008 GFC
As shown by the experience of the 2008
GFC, the failure of financial institutions, particularly those of systemic importance, would put public authorities in dilemma. On one hand, bankruptcy of these institutions through ordinary judicial process would not help to mitigate shocks to the financial system. On the other hand, government bail-out would give rise to moral hazards. In review of the crisis, there has been consensus among relevant stakeholders that to prevent the failure of specific financial institutions from spreading systemic shocks through the financial system, an effective resolution regime is needed to ensure that when a financial institution fails, the authorities would be able to resolve associated risks in a prompt and orderly manner while ensuring continuity of critical financial services and functions, so as to protect depositors’ and investors’ interests, reduce over-reliance on public funds and maintain financial stability.
Reliance on “bail-in” rather than public
funds. Costs of the failure of financial inst i tut ions should be al located to the shareholders first, with other market-based resolution measures at disposal. When shareholders and market forces are not adequate to mitigate risks, timely entry of investor protection funds charged from the industry is to follow, with liquidity assistance from central banks and fiscal authorities as a
183Chapter III Macroprudential Regulation
last resort. In principle, public funds should not enter into resolution prior to private funds, and upon entry appropriate safeguard arrangement should be in place.
Preparation in advance. In consideration of contagion and negative externality arising from the failure of financial firms, sound preparation for risk resolution on an ex-ante basis is needed to avoid chaos and disorder in the resolution process. Preparation in advance refers to the recovery and resolution planning (“living will”) designating specific resolution tools and measures by the financial institution and governing authorities, under the assumption of failure, to restore the institution back to operations or to orderly exit the market.
Uninterrupted provision of critical services
and functions in resolution. To prevent disruptions to critical socioeconomic functions, including payment and settlement and credit lending services, provided by a financial institution in the event of failure, competent authorities should be empowered to take necessary measures to ensure the continuity of key services and functions during the resolution process.
Proactive use of market-based resolution
tools and methods. The resolution of financial institutions should not be constrained to capital injection and temporary nationalization. Rather, a greater variety of market-based resolution tools and methods can be developed, including transfer of assets and liabilities and bridge institutions, to emphasize the role of market forces and resources in resolving
financial risks.
Greater policy coordination in cross-
border resolutions. Financial institutions of globally systemic importance generally have huge amount of overseas business, and the resolution of them inevitably involve restructuring or liquidation of assets and liabilities across jurisdictions. For this purpose, national authorities should strengthen policy coordination in cross-border resolutions, including clear arrangements for home and host jurisdictions’ respective responsibilities in terms of liquidity support, depositor protection and cost sharing.
I I . Key A t t r i bu tes and I t s Implementation Progress
Drawing on lessons from the crisis, the FSB introduced the Key Attributes for the first time in 2011, and called on member economies to establish or improve their resolution regimes for financial institutions, and strengthen cross-border resolution cooperation on G-SIFIs. In 2014, the FSB undertook a new round of review and revision to the Key Attributes, with the purpose to push for full coverage of the resolution regime including financial institutions of all types and systemically important FMIs. Since then, the FSB has conducted two rounds of peer reviews to monitor member economies’ progress in implementing the Key Attributes. Conclusions from the peer reviews show that there has been continued progress in implementing the Key Attributes worldwide.
184
Scope. As set out in the Key Attributes, the resolution regime should fully cover financial institutions, FMIs and domestic branches of G-SIFIs. In practice, G20 jurisdictions already have a resolution regime for financial institutions in place, whereas progress of the resolution regime for FMIs lags a little behind as it is a late starter.
Resolution Authority. The Key Attributes requires that each jurisdiction should have a designated administrative authority or authorities responsible for exercising the resolution powers, make the pursuit of financial stability as the top priority and increase accountability of resolution powers. Based on the practices of G20 jurisdictions, such administrative authority or authorities can be either a newly-established authority dedicated to resolution, or central bank, regulatory authorities or deposit insurer. In 2014, the European Union adopted the Banking Union Act, which explicitly stipulates the establishment of the European Single Resolution Board with the responsibility of the resolution of systemically important financial institutions within the Union. The post-crisis Dodd-Frank Act of the United States provides that the Federal Reserve and the FDIC develop and maintain orderly liquidation plans for financial institutions, and that the latter is responsible for implementing the plan.
Trigger. Timely entry into resolut ion contributes to the effective resolution of the failing institution. The Key Attributes states that when a firm is no longer viable, timely and early entry into resolution before all equity
is wiped out and before risks spread out is much needed. Currently, conditions for entry into resolution among G20 jurisdictions can be categorized into the following three types: First, balance sheet of the financial institution has extremely deteriorated by liquidity or insolvency standards; second, resolution of the failing financial institution is in the interests of financial stability and the public good; and third, crisis of the financial institution cannot be resolved through market forces.
Resolution Powers. In order to al low resolution authorities to have a broad range of resolution tools at disposal, the Key Attributes sets out the following seven resolution powers, namely temporarily control and operate the firm through take-over and other means; transfer selected assets and liabilities without any ex-ante consent of interested shareholders or creditors; temporarily nationalize the firm; remove and replace the senior management; establish bridge institutions; ensure continuity of key services and functions; temporarily stay the exercise of early termination rights of financial contract counterpart; and carry out bail-in. Currently, G20 jurisdictions have most of the resolution powers at their disposal, though the execution of bail-in has slow progress due to inconsistency in cross-border legal issues.
Safeguards for all clients and creditors. According to the Key Attributes, the legal arrangement for set-off of creditor claims, additional collateral, and segregation of client assets from assets of financial institutions should not hamper the orderly implementation
185Chapter III Macroprudential Regulation
of resolution measures. Based on the practices of G20 jurisdictions, national authorities have made swift headway in meeting additional collateral. The other two arrangements, as are closely linked to the choice of resolution strategies, are expected to be put in place with progress of the latter.
Funding. Resolution funding arrangement should be subject to strict conditions that minimize the risk of moral hazard. The Key Attributes requires that losses of financial institutions should be recovered first and foremost from equity holders and senior unsecured creditors, or exercise “bail-in” as a first option. Secondly, funds charged from the industry, such as the deposit insurance fund, can be a funding source of bail-out. And as a last resort, public funds can be introduced for resolution, which may include the provision of guarantees or liquidity support from central banks or fiscal authorities, but subject to appropriate safeguards. In the case of the European Union, it is stipulated in the Banking Union Act that once a financial firm enters into resolution, the resolution authority should convert debt instruments into equity instruments to absorb losses in the following order: shareholders and unsecured creditors taking 8% of total liabilities; dedicated resolution funds taking no more than 5% of total liabilities; relevant creditors and the deposit insurance fund; and public funds.
Cross-border cooperation. The Key Attributes requires that resolution authorities in the home and host jurisdictions should strengthen information-sharing and policy coordination.
For instance, in cases involving bankruptcy proceedings, recognition or support of foreign judicial action or its effectiveness should be promoted.
Arrangements for G-SIFIs. For all G-SIFIs, the Key Attributes requirements include the development of recovery and resolution plans, regular assessment of resolvability and the establishment of Crisis Management Groups (CMG), so as to enhance cross-border policy coordination and prevent the risks of failure from spreading across borders. Up till now, the FSB has issued assessment methodologies for both global systemically important banks and insurers, with annually updated lists of G-SIBs and G-SIIs. The majority of national authorities have established CMGs for G-SIFIs, developed recovery and resolution plans and conducted resolvability assessment.
III. Improving the Resolvability of G-SIFIs
The operations of G-SIFIs usually span national borders. In guiding the implementation of the Key Attributes, the FSB has set out several resolution arrangements to improve the resolvability of G-SIFIs.
Determining a preferred strategy. The resolution strategies are broadly based on two approaches: single point of entry resolution (SPE) and multiple point of entry (MPE) resolution. SPE involves the application of resolution powers at the top parent or holding company level by a single resolution authority, which is probably in the jurisdiction
186
responsible for the global consolidated supervision of a group. A SPE strategy operates through absorption of losses by the group-level entity, and core subsidiaries and businesses should be able to continue unaffected. This strategy mainly applies to clean holding companies. MPE involves the application of resolution powers by two or more resolution authorities to different parts of the group such as the top parent company and subsidiaries in their respective jurisdictions, and is likely to result in a break-up of the group on a national or regional basis, or along business lines. A MPE strategy may be suitable for firms with a decentralized structure.
Fulfilling the Total Loss-absorbing Capacity
(TLAC) requirement. TLAC-el igible instrument refers to any capital instrument, debt instrument, liability or other item of a G-SIB that can be written down or converted into equity for loss absorption in resolution. The implementation of TLAC requirements is meaningful in ensuring the resolution of G-SIBs through bail-in as much as possible, and reducing the probability of a government bail-out and moral hazard risks. Currently, TLAC instruments available to national authorities that meet the FSB eligibility criteria include CET1 capital instrument, other tier 1 capital instrument, tier 2 instrument, senior non-preferred debt and senior unsecured debt.
Reforming the netting mechanism of
financial contracts. In response to possible disruption to the financial market arising from a cascade of default and termination events in financial contracts following the
failure of large and complex institutions, and in implementing the principles in the Key Attributes, the International Swaps and Derivatives Association (ISDA) announced the addition of the Resolution Stay Protocol to the ISDA Master Agreement for over-the-counter bilateral derivatives as part of its post-crisis reforms. The protocol would help to ensure that no early termination or additional margin and collateral in financial contracts will be triggered for reason of entry into resolution of a counterpart within a set timeframe, for example 1-3 days. Within the period of the stay, the resolution authorities are allowed to transfer as a whole derivative contracts with a particular counterpart to a bridge institution or sound financial institution, so that obligations of these contracts continue to be fulfilled with changed counterpart or be subject to normal close-out netting, thus avoiding occurrence of events such as disorderly margin calls or concentrated default incidents.
Developing recovery and resolution plans
(RRPs). The FSB requires that national authorities develop and maintain RRPs on a regular basis. RRPs should make no assumption that public funds can be relied on to resolve the firm. The responsibility for developing and maintaining the recovery plan lies with the firm’s senior management. In the recovery plan, risk control measures to reduce the probability of failure should be stated. The responsibility for developing and maintaining the resolution plan lies with the authorities. The resolution plan aims to make feasible resolution and orderly market exit of any firm without severe disruption to the financial
187Chapter III Macroprudential Regulation
system. The U.S. authorities require that systemically important financial institutions should develop and maintain their resolution plans and submit the plans to the Federal Reserve and the FDIC on a regular basis. In the plan, measures to resolve possible crisis in a swift and orderly manner without adverse effect to the financial system or the economy should be explained. Should the Federal
Reserve and the FDIC jointly determine the submitted plans as not credible or unable to facilitate an orderly resolution, the submitter will be asked to make immediate rectification. Firms that fail to do so will be subject to more rigorous prudential regulations, including stricter capital requirements, and restrictions on selected business operations or break-ups.
188
Special Topic 21 The TLAC Requirement for Global Systemically Important Banks
In November 2015, the FSB issued an international standard of “total loss-absorbing capacity” (TLAC) on G-SIBs. The new TLAC standard aims to provide the market with confidence that G-SIBs have sufficient capital and eligible debt instruments to absorb losses when in stress, and enable resolution authorities to implement a resolution strategy that avoids exposing taxpayers to loss and ensures the continuity of critical economic functions of problem banks. For China, the 4 G-SIBs, namely the ICBC, the ABC, the BOC and the CCB are subject to TLAC requirement.
I . S u m m a r y o f t h e T L A C Requirement
The TLAC consis ts of capi ta l or debt instruments that should be readily available for bail-in in case of resolution. Subject to the TLAC requirement, G-SIBs would have sufficient capacity to absorb losses by writing down capital and debt instruments or converting them into equity, so that the resolution strategy can be effectively implemented without threatening financial market stability.
The framework def ines a minimum
international TLAC requirement that
should be implemented by two-steps. For G-SIBs that are not headquartered in
emerging market economies, the minimum TLAC requirement will be 16 percent of the resolution group’s risk weighted assets and 6 percent of the Basel III leverage ratio denominator as from 1 January 2019, and 18 percent of the resolution group’s risk weighted assets and 6.75 percent of the Basel III leverage ratio denominator as from 1 January 2022. If including the 2.5 percent conservation buffer requirement and the 1-2.5 percent G-SIB surcharge under Basel III, the total requirement will be 19.5-21 percent of the resolution group’s risk weighted assets as from 2019 and 21.5-23 percent of the resolution group’s risk weighted assets as from 2022. G-SIBs headquartered in emerging market economies can comply with the TLAC requirement 6 years later, but the conformance period will be accelerated if the aggregate amount of the economy’s financial and non-financial corporate debt securities outstanding (excluding issuance by policy banks) exceeds 55% of its GDP, and the G-SIBs will have 3 years to meet the requirement after acceleration term being triggered.
Eligibility criteria for TLAC instruments.
TLAC instruments include capital instruments and eligible debt instruments. Firstly, eligible TLAC debt instruments should have a minimum remaining contractual maturity of at least one year, and they can be written
189Chapter III Macroprudential Regulation
down or converted into equity, and rank junior to general liabilities such as deposits in the relevant insolvency creditor hierarchy. The FSB recommends eligible debt instruments take up at least one third of all TLAC instruments. Eligible TLAC should not include liabilities that are preferred during insolvency, including insured deposits, sight deposits, tax liabilities, etc. Secondly, the resolution fund that meets certain criteria can be eligible TLAC instruments. Credible ex-ante commitment to recapitalize a G-SIB in resolution may count towards a firm’s minimum TLAC, so long as there is no limit in respect of the amount which may be contributed to resolution funding costs, and such commitments should be pre-funded by industry contributions. These commitments may account for an amount equivalent to 2.5 percent of risk weighted assets toward the resolution entity’s minimum TLAC when the TLAC requirement is 16 percent and for an amount equivalent to 3.5 percent of risk weighted assets when the TLAC requirement is 18 percent. Finally, to reduce the risk of contagion within the banking sector, banks must deduct holdings of non-regulatory-capital TLAC instruments that are beyond 5 percent of the banks’ common equity from their own Tier 2 capital.
Internal TLAC requirement. The FSB brings in internal TLAC requirement apart from external TLAC requirement. Internal TLAC refers to loss absorbing capacity that resolution entities have committed to material sub-groups. The primary objective of internal TLAC is to facilitate co-operation between home and host authorities and the implementation of effective
cross-border resolution strategies by ensuring the appropriate distribution of loss absorbing and recapitalization capacity within resolution groups outside of their resolution entity’s home jurisdiction. The distribution of internal TLAC should be determined according to the size and risk exposures of the material sub-groups.
II. Implementation of the TLAC Requirement
According to the FSB, by end-2017, except for Chinese G-SIBs which were given an extension to comply with TLAC requirements, only one G-SIB still had TLAC shortfall for the 2019 requirement (16 percent of RWA and 6 percent of the Basel III leverage ratio denominator). So far, the 4 Chinese G-SIBs and the Nordea Bank (the Swedish G-SIB) have not begun issuing compliant TLAC debt instruments. Nordea Bank already complies with the TLAC requirements on the basis of regulatory capital only. Generally, there are three options to fulfill the TLAC requirement for G-SIBs.
Statutory Subordination. It is written in laws and regulations that TLAC eligible instruments are junior in the statutory creditor hierarchy to other senior liabilities on the balance sheets of banks. Contractual provisions for subordination are not required. Germany has clarified that all senior unsecured bonds will be legally subordinated to other senior liabilities (such as deposits, derivatives liabilities, etc.). When a bank comes to the point of non-viability, the resolution authority has the power to write the TLAC instruments
190
down or convert them to equity. The statutory subordination approach is concise and clear, and it can make full use of the existing senior debts to fulfill the TLAC requirement. Besides, it can avoid legal uncertainty to the greatest extend. However, a one-size-fits-all de-ranking of all senior bonds would lift the funding cost of the wholesale banks, impairing the banks’ international competitiveness. The premise to adopt statutory approach is that there is a complete legal system for banking bankruptcy, and the creditor ranking and loss absorption arrangements of the TLAC instruments are legally binding.
Structural Subordination. Some bank holding companies are not operational, and it is their banking subsidiaries that are running the businesses. The senior debts issued by the holding company, as the shareholder of the bank subsidiary, rank junior to the senior debts issued by the operating subsidiary. Jurisdictions like the U.S., the U.K., Switzerland and Japan take the structural subordination approach. The senior debts issued by the holding companies of these G-SIBs are TLAC eligible. Structural subordination is easily implemented for G-SIBs with non-operational holding company structure; while for other G-SIBs, it would be quite expensive and complicated to establish a
new holding company.
Contractual + Statutory Subordination.
Unde r t h i s app roach , e l i g ib l e TLAC instruments are contractually subordinated to other senior debts, while at the same time, regulations are in place to ensure the loss absorption capabilities of the TLAC instruments. France and Spain adopt this approach by creating a new class of debts, ranking between senior debts and subordinated debts. For these TLAC eligible instruments such as senior non-preferred debts in France, there are specific contractual provisions in place to define the creditor hierarchy and the loss absorption mechanism, to ensure exposing TLAC instruments to loss legally enforceable. The contractual subordination approach is favorable to stabilize market anticipation and to reduce legal disputes. By taking this approach, resolution authorities can have extra time to improve the banking bankruptcy legislations. The major challenges in adopting this kind of approach are to design contractual provisions and to educate investors.
In accordance with the TLAC framework promulgated by the FSB, many member jurisdictions have developed domestic TLAC rules and regulations (Table 3.2).
Table 3.2 Regulatory initiatives on the TLAC in major jurisdictions
Jurisdiction TLAC Implementation
U.S.
In December 2016, the Federal Reserve adopted a final rule for the 8 U.S. G-SIBs to maintain clean holding company structures and for foreign G-SIBs with substantial US operations to establish intermediate holding companies. All these G-SIBs are required to maintain outstanding TLAC instruments to absorb losses in an orderly resolution. The 8 US-GIBs should hold TLAC not less than the higher of 18% of its risk weighted assets and 9.5% of its leverage exposure, with long-term debts in an amount not less than the higher of 6% of its risk weighted assets and 4.5% of its leverage exposure.
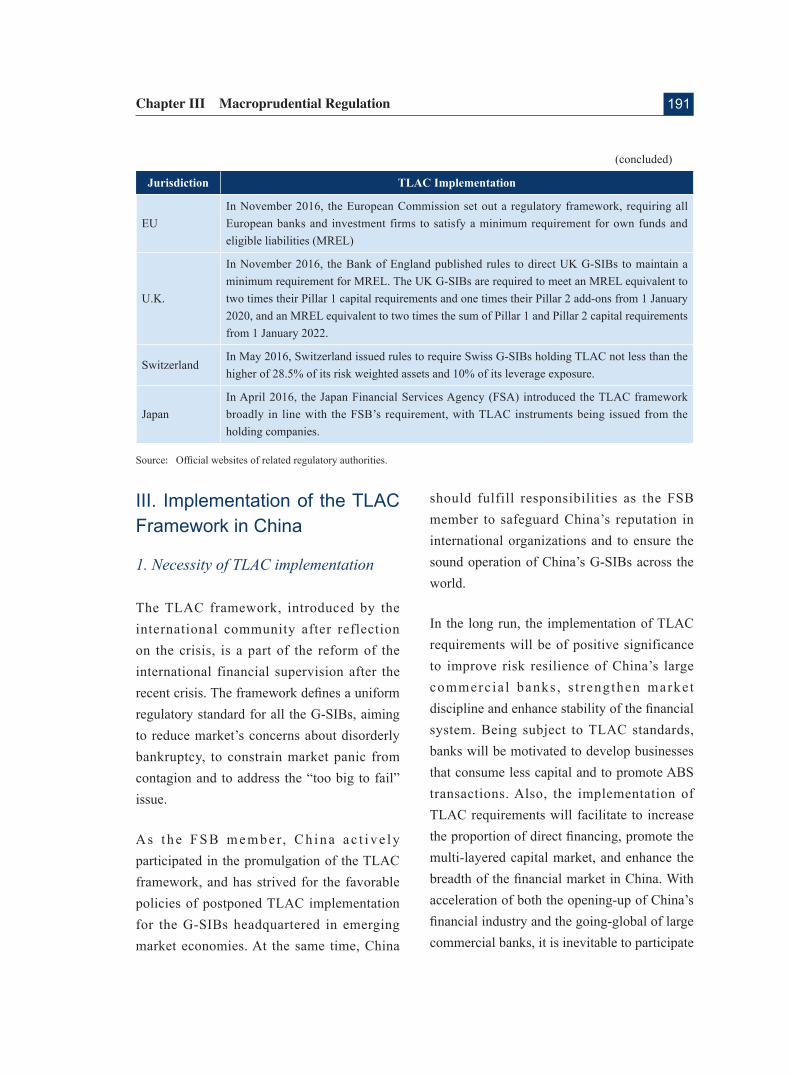
191Chapter III Macroprudential Regulation
Jurisdiction TLAC Implementation
EUIn November 2016, the European Commission set out a regulatory framework, requiring all European banks and investment firms to satisfy a minimum requirement for own funds and eligible liabilities (MREL)
U.K.
In November 2016, the Bank of England published rules to direct UK G-SIBs to maintain a minimum requirement for MREL. The UK G-SIBs are required to meet an MREL equivalent to two times their Pillar 1 capital requirements and one times their Pillar 2 add-ons from 1 January 2020, and an MREL equivalent to two times the sum of Pillar 1 and Pillar 2 capital requirements from 1 January 2022.
SwitzerlandIn May 2016, Switzerland issued rules to require Swiss G-SIBs holding TLAC not less than the higher of 28.5% of its risk weighted assets and 10% of its leverage exposure.
JapanIn April 2016, the Japan Financial Services Agency (FSA) introduced the TLAC framework broadly in line with the FSB’s requirement, with TLAC instruments being issued from the holding companies.
Source: Official websites of related regulatory authorities.
III. Implementation of the TLAC Framework in China
1. Necessity of TLAC implementation
The TLAC framework, introduced by the international community after reflection on the crisis, is a part of the reform of the international financial supervision after the recent crisis. The framework defines a uniform regulatory standard for all the G-SIBs, aiming to reduce market’s concerns about disorderly bankruptcy, to constrain market panic from contagion and to address the “too big to fail” issue.
A s t h e F S B m e m b e r, C h i n a a c t i v e l y participated in the promulgation of the TLAC framework, and has strived for the favorable policies of postponed TLAC implementation for the G-SIBs headquartered in emerging market economies. At the same time, China
should fulfill responsibilities as the FSB member to safeguard China’s reputation in international organizations and to ensure the sound operation of China’s G-SIBs across the world.
In the long run, the implementation of TLAC requirements will be of positive significance to improve risk resilience of China’s large commercia l banks , s t rengthen market discipline and enhance stability of the financial system. Being subject to TLAC standards, banks will be motivated to develop businesses that consume less capital and to promote ABS transactions. Also, the implementation of TLAC requirements will facilitate to increase the proportion of direct financing, promote the multi-layered capital market, and enhance the breadth of the financial market in China. With acceleration of both the opening-up of China’s financial industry and the going-global of large commercial banks, it is inevitable to participate
(concluded)
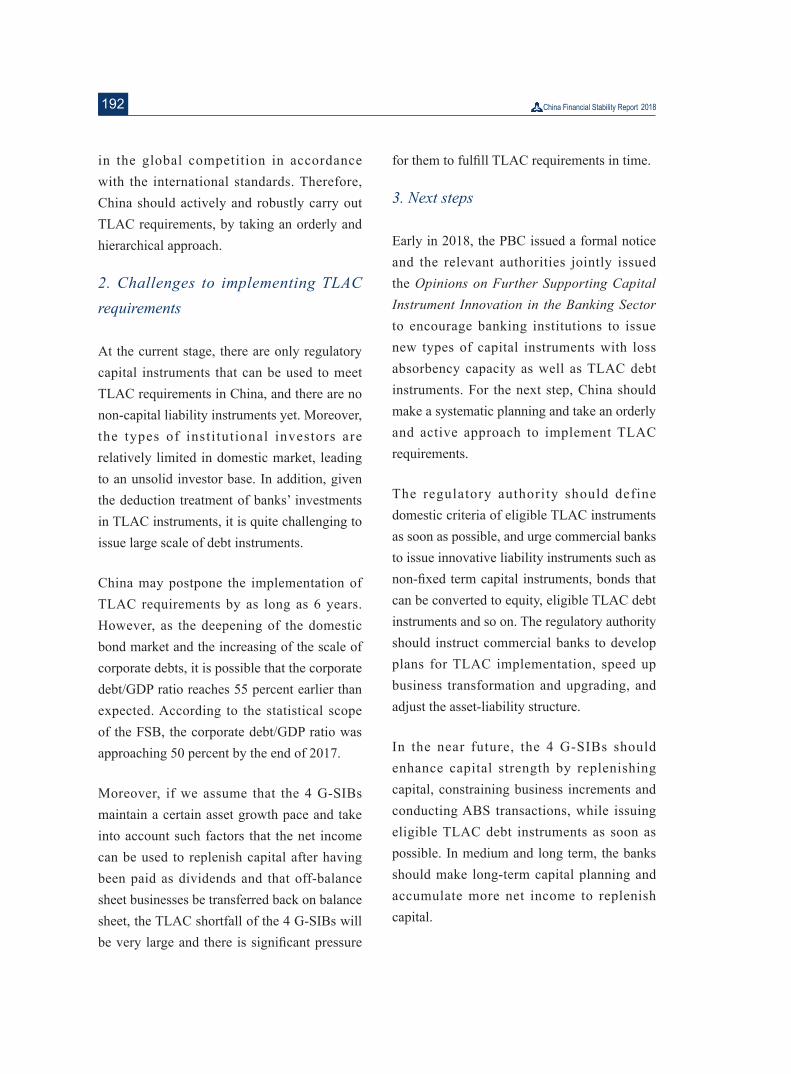
192
in the global competition in accordance with the international standards. Therefore, China should actively and robustly carry out TLAC requirements, by taking an orderly and hierarchical approach.
2. Challenges to implementing TLAC requirements
At the current stage, there are only regulatory capital instruments that can be used to meet TLAC requirements in China, and there are no non-capital liability instruments yet. Moreover, the types of insti tutional investors are relatively limited in domestic market, leading to an unsolid investor base. In addition, given the deduction treatment of banks’ investments in TLAC instruments, it is quite challenging to issue large scale of debt instruments.
China may postpone the implementation of TLAC requirements by as long as 6 years. However, as the deepening of the domestic bond market and the increasing of the scale of corporate debts, it is possible that the corporate debt/GDP ratio reaches 55 percent earlier than expected. According to the statistical scope of the FSB, the corporate debt/GDP ratio was approaching 50 percent by the end of 2017.
Moreover, if we assume that the 4 G-SIBs maintain a certain asset growth pace and take into account such factors that the net income can be used to replenish capital after having been paid as dividends and that off-balance sheet businesses be transferred back on balance sheet, the TLAC shortfall of the 4 G-SIBs will be very large and there is significant pressure
for them to fulfill TLAC requirements in time.
3. Next steps
Early in 2018, the PBC issued a formal notice and the relevant authorities jointly issued the Opinions on Further Supporting Capital Instrument Innovation in the Banking Sector to encourage banking institutions to issue new types of capital instruments with loss absorbency capacity as well as TLAC debt instruments. For the next step, China should make a systematic planning and take an orderly and active approach to implement TLAC requirements.
The regulatory authority should define domestic criteria of eligible TLAC instruments as soon as possible, and urge commercial banks to issue innovative liability instruments such as non-fixed term capital instruments, bonds that can be converted to equity, eligible TLAC debt instruments and so on. The regulatory authority should instruct commercial banks to develop plans for TLAC implementation, speed up business transformation and upgrading, and adjust the asset-liability structure.
In the near future, the 4 G-SIBs should enhance capital strength by replenishing capital, constraining business increments and conducting ABS transactions, while issuing eligible TLAC debt instruments as soon as possible. In medium and long term, the banks should make long-term capital planning and accumulate more net income to replenish capital.

193Chapter III Macroprudential Regulation
Moreover, we should make great efforts to develop a multi-layered capital market, foster qualified institutional investors in the bond market, support the 4 G-SIBs to issue TLAC debt instruments in offshore markets and
accelerate the opening-up of the financial industry, so as to create a favorable market condition for the G-SIBs to comply with TLAC requirements on time.

194
Special Topic 22 Resolution Approaches by Deposit Insurers in Dealing with Financial Failures
Accord ing to the Dec i s ions on Some Major Issues Concerning Comprehensively Deepening Reforms adopted at the third plenary session of the 18th CPC Central Committee, the deposit insurance system should be established to further enhance the market-oriented exit regime for financial institutions. In the past decades before establishment of the deposit insurance system, the resolution of vulnerable financial institutions in China had largely relied on administrative tools such as suspension, revocation of licenses and business closure, with purchase and assumption (P&A) and other market-based tools seldom applied. This old practice has been criticized for leading to moral hazard, as the resolution costs were mainly borne by the government, resulting in protecting depositors at the cost of the de-facto bail-out of stakeholders and owners of the failed institutions. As has been demonstrated by the latest global reforms and practice trends, the deposit insurance system has played an increasingly important role as the platform for crisis management and resolution, on which a set of market-based resolution methods, including P&A, bridge bank, opening bank assistance, deposit reimbursement and etc., have been utilized. These sophisticated approaches can be effective in preserving market discipline and facilitating an orderly market-exit of failed institutions, while safeguarding depositors’ rights and maintaining social and financial stability.
I. Purchase and Assumption
Purchase and Assumption, or P&A, refers to the process in which the deposit insurer designates the healthy banks through bidding, competitive negotiation and other mechanisms to purchase or undertake all or part of the assets, liabilities, and businesses of failed banks, at the least cost of the deposit insurance fund. This approach has the merit of ensuring business continuity of the problem bank in providing fundamental financial services during resolution, preserving its financial license and value of efficient assets to the maximum degree, and safeguarding the rights of depositors and creditors at fullest extent. In most cases, the party purchasing or undertaking the problem bank would assume the latter’s insured deposits in exchange for any interested assets, operations or business branches. The gap between acquired assets and liabilities, if negative, will be covered by the deposit insurer; otherwise, the acquiring party will need to pay the deposit insurance fund an equivalence of market price. To facilitate the transaction, the deposit insurer may offer to share with the acquirer losses in acquiring assets, or sell assets of different problem banks in packages.
Case A: The resolution of WaMu by the FDIC through P&A
In practice, the resolution of more than
195Chapter III Macroprudential Regulation
95 percent of failed banks in the US was conducted through P&A. The following provides a review of how FDIC structured the resolution of the Washington Mutual (WaMu) failure in an orderly way. WaMu was once the largest bank in terms of asset volume out of a total of over 500 closed banks in the US following the 2008 global financial crisis. Before its demise in July 2008, it ranked as the largest savings bank, the 4th largest residential mortgage loan provider and the 6th largest bank in the US, with the total assets of USD 307 billion, bank deposits of USD 134.7 billion and over 5400 branches. Amidst the buoyant housing market in 2011, WaMu started to extend increasingly large volumes of untraditional mortgages, making the share of which rise substantially as a percentage of total assets. With the burst of the housing bubble in 2007, WaMu’s nonperforming loans quickly accumulated and turned to bad loans on its book. Significant declines in WaMu’s share prices also prompted major rating agencies, including Moody’s and Standard & Poor’s, to downgrade its debt status to “junk bond”. Due to a severe lack of confidence on the market, a large-scale run on WaMu occurred. On September 25, 2008, the US office of Thrift Supervision (OTS) had to decide the closure of WaMu and designate the FDIC to take over as the receiver.
On the same day, the OTS closed WaMu, and FDIC made an announcement that the failed bank’s deposits, branches and other business lines would be sold to JP Morgan Chase at a price of USD 1.89 billion. During the resolution that followed, no more runs on the
bank happened, nor did FDIC’s insurance fund suffer any loss from the resolution.
II. Bridge Bank
Bridge Bank is one of the resolution methods created by the deposit insurer to facilitate P&A. In cases where the problem bank’s huge asset scale makes it difficult to find a suitable purchaser in a short time, or where one-off disposal of the bank’s asset may lead to depreciation before the tricky asset evaluation is completed, or where immediate liquidation may bring severe disruptions to the provision of financial services, the deposit insurer can, in compliance with the least-cost principle, establish a bridge bank to temporarily undertake part or all of the problem bank. The remaining assets, liabilities, or businesses that have not been transferred to the bridge bank will be retained for later disposal by the deposit insurer. The purpose of utilizing the bridge bank method in the resolution process is primarily to keep the bank’s provision of key services and functions uninterrupted before its final resolution is determined and structured.
As the bridge bank is operated by the deposit insurer, international standards on commercial banks, such as capital requirements, normally don’t apply to bridge banks. Once market confidence restores, the deposit insurer may choose to openly sell the bridge bank as a countercyclical resolution measure. From the global perspective, a bridge bank usually operates for two years, with an extension of three years if needed, and then would be sold either via P&A, merger, share sale or outright
196
purchase.
Case B: The resolution of IndyMac Bank by the FDIC through a bridge bank
The resolution of IndyMac Bank by the FDIC is a typical case illustrating how the deposit insurer uses the bridge bank method to handle bank failure. IndyMac Bank used to be the largest mortgage lender in the US, with a total of USD 32 billion in assets. It became the first large bank to fail amidst the 2008crisis. Formerly, the bank specialized in Alt-A single family residential mortgages that are not underwritten by the two government-backed home loan giants, Fannie Mae and Freddie Mac. Following the outbreak of the subprime mortgage crisis in 2007, IndyMac was heavily impacted by the declining home prices and a surge in foreclosure rates. Not only the institution suffered heavy losses, but severe cash withdrawals triggered by plummeting stock prices and mark-down of rating status to CCC level. By July 11, 2008, OTS had to close the bank and appoint FDIC as the conservator.
Given the considerable size of IndyMac and its deteriorating asset quality, the FDIC as conservator chose to establish a bridge bank to dispose of the bank in an orderly way. Two phases were involved: during the first phase, on the same day of OTS’ announcement to close IndyMac Bank, the FDIC established IndyMac Federal Reserve Bank as the bridge bank to assume substantially all assets and almost all insured deposits, with an exception of brokered deposits, from the former. The FDIC operated IndyMac Federal Reserve Bank to maintain
banking services in the communities formerly served by IndyMac and to take stock of the institution’s assets for a future sale; during the second phase, after an operation of half a year, the FDIC completed a sale of IndyMac Federal Reserve Bank to IMB HoldCo LLC for USD 13.9 billion. The sale plan included the formation of OneWest Bank by IMB to purchase most of the assets from IndyMac and a loss share agreement on designated assets, primarily mutually-agreed loan class assets, between the FDIC and IndyMac, under terms of which the FDIC would provide secured financing for assets transferred to OneWest from the bridge bank.
The FDIC’s resolution of IndyMac evidenced the flexibility and diversity of its resolution tools. With the absence of a satisfying potential purchaser, the bridge bank solution earned the smooth transition phase and bought time for locating a suitable purchaser. In particular, it helped to keep depositors’ rights well protected and maintain financial stability by preventing possible disruptions to the provision of financial services in case of failure. The final sale of IndyMac Federal Reserve Bank to the privately-controlled IMB has the benefit of achieving the timely resolution while keeping the costs at the least.
III. Open Bank Assistance
Open Bank Assistance (OBA) refers to the practice of using the deposit insurance fund or public fund to restore a failing bank to viability or prevent its risks from sprawling, usually via direct capital injection, credit provision,
197Chapter III Macroprudential Regulation
depositing, asset purchase, and assumption of liabilities, etc. OBA is a resolution method preferred by international authorities in situations where the systemic risk concern exists, or the failing institution is of systemic importance, or the problem bank involves such a huge amount of depositors and creditors that the abrupt closure would harm their lawful rights, or failure of the problem bank may potentially cause substantial losses to its interbank counterparts and severe disruptions to financial market stability.
International practice in this regard has shown that in order to avoid moral hazard, the OBA method usually requires the problem bank to have a resolution plan, setting the order of loss absorbency by shareholders and creditors. Shareholders are the first in line to absorb losses until equities are burnt out, and then creditors move up to take the rest of the losses. This arrangement serves to address implicit guarantee and strengthen market discipline. During the OBA process, any expansion in higher-risk businesses or leveraged activities would be restricted, to gradually bring leverage ratio down. As soon as the problem bank restores to normal operations, the deposit insurance fund or public fund can exit in an orderly fashion.
Case C: The resolution of Citigroup by the US government via OBA
The deposit insurer played a vital role in the resolution process of Citigroup led by the US government. Prior to the 2018 crisis, Citigroup had an asset total of USD 2.2 trillion, and
ranked as the 2nd largest commercial bank in the US. Heavy exposure to troubled assets in the form of credit default swap (CDS) and mortgaged-backed securities (MBS), compounded by shattering market confidence and plunging share prices, led Citigroup into bankruptcy as the crisis unfolded. On November 23, 2008, the US government announced a massive bailout package for Citigroup by essentially guaranteeing losses on its troubled assets and investing in preferred shares issued by the company, which generally follows the FDIC’s idea of OBA. Details of the package include that the FDIC and Treasury would provide a respective of USD 10 billion and USD 5 billion guarantee on the company’s troubled assets. In addition, the Federal Reserve would backstop residual risk in the asset pool through a non-resource loan that stands at 10 percent of total losses. As a fee for this arrangement, Citigroup would issue USD 7 billion of preferred shares, USD 4 billion to the Treasury and USD 3 billion to the FDIC, with an 8 percent dividend.
The US government bail-out of Citigroup has taken the best of the FDIC’s expertise and strength. Although the resolution of systemic risk is beyond the scope of deposit insurer, the FDIC’s resolution model was throughout the preparation and implementation of Citigroup’s resolution plan, which is a proof that a well-functioning deposit insurance regime can play a positive role in the mitigation of systemic risks. In order to rescue Citigroup from collapsing and mitigate potential risks, the US government provided various assistance, including loss sharing against troubled
198
assets and holding of preferred shares, to the company while keeping its business open. In 2010, the company returned to profitability, with a reported profit of USD 14.9 billion. The FDIC’s deep involvement in the resolution of Citigroup’s troubled assets via the deposit insurance fund helped to relieve financial strains on the fund and safeguard taxpayers’ interests.
IV. Deposit Reimbursement
Deposit Reimbursement refers to the direct payment to the failed institution’s depositors the amount of their insured deposits with the deposit insurance fund. Reimbursement is usually adopted when the above-mentioned resolution methods are not available or do not conform with the least-cost principle. In practice, a liquidation of the failing bank will be required before any depositors are reimbursed, which may lead to the loss of value of financial licenses, close of business outlets and disruptions to financial services, etc. For this reason, reimbursement has only been seldom used (for example, by less than 5 percent in the US).
There are direct and entrusted payments in the event of a depositor payoff. Direct reimbursement pays depositors the amount of their insured deposits in the form of cash, transfer of account and cheques within the insurance limit. Entrusted reimbursement appoints other eligible banks to pay off insured depositors on behalf of the failing bank. In the absence of an eligible entrustee bank (usually the case in less-developed or under-
developed regions), the deposit insurer may set up a reimbursement bank to handle transfer businesses of insured deposits for depositors. In exchange for the reimbursement for insured deposits, the deposit insurer is entitled to these depositors’ claims on the failing bank in the same liquidation order within the insurance limit, as well as the compensation from asset liquidation.
V. Conclusion
From common practices worldwide, purchase and assumption by the deposit insurer is the most frequently used method for resolution and market exit of financial institutions. In practice, for a bank that has failed or been ordered to be taken over or closed, the deposit insurance system is usually first used to support the purchase or assumption of its businesses, assets, and liabilities by a suitable financial institution, so that depositors’ deposits can be transferred to the acquirer and continue to be safeguarded. In the absence of a suitable acquirer, the bank shall file for bankruptcy and exit the market, and the deposit insurer steps in to reimburse all depositors for insured deposits by the maximum limit. In whatever approach, a market-oriented resolution regime highlights the responsibility of shareholders to absorb losses and the necessity to strengthen market discipline, to avoid moral hazard, protect the lawful interests of all parties, and preserve financial stability.
The 2008 global financial crisis was a test for the effectiveness of the deposit insurance system. Its existence, particularly the prompt
199Chapter III Macroprudential Regulation
corrective measures and risk resolution function, prevented risk contagion and spread in a larger scale, and maintained stability of the banking system. As of end-2017, the FDIC had successfully handled 533 cases of
bank resolution, and none had triggered runs on banks. Overall, public confidence and the banking sector itself have remained safe and sound.
Table 3.3 Percentage of different resolution methods employed by the FDIC
Resolution Method Number of failing institutions Percentage (%)
P&A 504 94.6
Bridge Bank 11 2.0
OBA 2 0.4
Deposit Reimbursement 16 3.0
The Deposit Insurance Regulations of China (hereinafter referred to as the Regulations), effective on May 1st, 2015, represents a further enhancement to the orderly resolution and market exit regime for the banking institutions in China. In order to identify potential risks at an early stage and reduce their occurrence, drawing on sound practices worldwide, the Regulations explicitly stipulate that the deposit insurer is mandated with the statutory responsibilities of taking prompt corrective actions and risk resolution measures. It is also articulated in the Implementation Plan of the Deposit Insurance System that the deposit insurance system cannot be simply viewed as the cashier or paybox, and that it also functions to take over or liquidate a problem bank, or revoke its license, in accordance with market-
based principles of equal rights and equal responsibilities, and incentive compatibility. To minimize losses to the insurance fund and keep in line with current laws and regulations, the Regulations also stipulate that the deposit insurer can exercise market-oriented resolution operations including P&A, and that it may facilitate restructuring or P&A of the failing institution via guarantees on losses, loss-sharing agreements or liquidity support, so as to fully protect depositors’ interests while keeping the resolution costs at the least. Ultimately, this arrangement serves to exercise financial risk resolution in a prompt and efficient manner, ensure the continuity of normal operations of the banking sector and maintain financial stability.
200
Special Topic 23 Resolvability Assessments of the Four Global Systemically Important Banks in China
In November 2011, the FSB published the Key Attributes of Effective Resolution Regimes for Financial Institutions (here after referred to as the Key Attributes), attaching much importance to the precautious and early intervention of resolution authorities and preventing the risk of moral hazard related to the problem of “too-big-to-fail”. The Key Attributes sets out requirements on member jurisdictions to establish orderly resolution regimes for G-SIFIs, to allow authorities to resolve problem financial institutions in an orderly manner without exposing taxpayers to loss, while maintaining continuity of their vital businesses and services. The Key Attributes requires G-SIFIs to have in place RRPs, and be subject to regular resolvability assessments.
I. The Resolvability Assessment Framework
Definition. A SIFI is “resolvable” if it is feasible for the resolution authorities to resolve it in a way that protects systemically important businesses and services without severe systemic disruption and without exposing taxpayers to loss. According to the FSB, resolution authorities of member jurisdictions should conduct resolvability assessments regularly, mainly on feasibility and credibility of resolution strategies, as
well as the consequences of resolution or bankruptcy of a G-SIFI for the financial system and the real economy. Based on that, actions necessary to improve resolvability should be identified.
Objectives. First, resolvability assessments should make authori t ies and f inancial institutions aware of the implications of resolution for systemic risks both nationally and globally. Second, factors affecting the effective implementation of resolution actions, both endogenous (like financial ins t i tu t ion s t ruc tures) and exogenous (like resolution regimes and cross-border cooperation framework), factors in relation to problem financial institutions, and the degree of contingency preparedness (like adequacy of RRPs) should be identified. Third, resolvability assessments should help determine the specific actions necessary to achieve greater resolvability without severe systemic disruption and without exposing taxpayers to losses, while protecting important businesses and services.
Process. The first stage is the feasibility assessment of resolution strategies, to identify the set of resolution strategies, which would be feasible, given the current resolution tools available, the RRP for the firm, and the authorities’ capacity to apply them rapidly. The
201Chapter III Macroprudential Regulation
second stage is to assess the systemic impact, to determine the credibility of all feasible resolution strategies by capturing the likely impact of the financial institution’s failure and resolution on global and national financial systems and real economies. The third stage is to identify actions to improve resolvability, to decide whether resolution is likely to be both feasible and credible and identify any improvement necessary to the RRPs. Timelines for completing the requisite improvement should be established, and the progress should also be monitored.
Essential elements of assessments: Continuity of vital financial services including payment, clearing and settlement; the nature and volume of intra-group exposures and their implications on the resolution; the capacity of the financial institution to provide detailed, accurate and timely information necessary for resolution; and effectiveness of cross-border coordination and information sharing.
Implementation requirements. Resolvability assessments should be conducted by CMGs of G-SIFIs. According to the FSB, all G-SIFIs should establish CMGs within one year since its designation as G-SIFIs, and CMGs should consist of the central banks, supervisory authorities, resolution authorities, finance ministries and other relevant public authorities of jurisdictions that are home or the main host jurisdictions to the G-SIFIs. After completing resolvability assessments, CMGs should report the results to the FSB.
II. Progress of Resolvability Assessments o f t he Four G-SIBs Incorporated in China
Currently, there are 4 G-SIBs incorporated in China. BOC, ICBC, ABC and CCB were designated as G-SIBs since 2011, 2013, 2014 and 2015, respectively. The FSB’s recommendations on effective resolution regimes have been actively implemented in China, with the first-round resolvability assessments of 4 G-SIBs completed.
Setting up CMGs. The 4 G-SIBs have set up CMGs as required by the FSB, with members including the PBC, former CBRC and the MoF. The 4 banks also invited regulatory authorities of certain host jurisdictions to join in their CMGs, based on their market influence and asset share in such jurisdictions. In particular, the Hong Kong Monetary Authority and Monetary Authority of Macao participated in CMGs of BOC and ICBC, and Hong Kong Monetary Authority also joined CMGs of ABC and CCB.
Developing RRPs. The 4 banks all developed RRPs within one year of their designation as G-SIBs, and have kept updating RRPs annually, taking into account resolvability assessment results, changes in international regulatory standards and their own business conditions. CMGs are responsible for the annual review of updated RRPs.
Resolvability assessments. The 4 banks have all completed the first round of resolvability
202
assessments, with ICBC and BOC completing in 2015, ABC in 2016 and CCB in 2017.
I I I . Analysis on Resul ts of Resolvability Assessments
Resolvability assessments of the 4 G-SIBs made a comprehens ive rev iew of the feasibility, credibility and systemic impact of RRPs, according to the FSB requirements in the Key Attributes and other operational rules. Resolvability assessments mainly examined nine aspects, namely resolution regimes and tools, resolution funding sources, cross-border resolution cooperation, corporate structure and identification of key definitions, internal interconnectedness, RRP adequacy, management information systems, membership in FMIs and systemic impact of resolution.
Consistent conclusions have been made by members of the 4 CMGs. RRPs of the 4 G-SIBs are basically compliant with the Key Attributes. The legal framework necessary for resolution regimes, resolution powers and funding sources are largely in place. Resolution funding arrangements could support the implementation of resolution strategies. Corporate structures of the 4 banks are clear with low intra-group interdependence, and fairness and complexity of intra-group trades could satisfy resolvability needs. Management information systems are capable of providing information both on a daily basis and in extreme cases. The 4 banks are able to access FMIs under contingent conditions and maintain business continuity. Cross-border cooperation mechanism works well in
communication and information sharing, with all CMG members having signed the cross-border cooperation agreements on recovery and resolution. In general, no impediments have been identified that could have substantial impact on resolvability, and RRPs of the 4 banks could fulfill the objective of maintaining continuity of vital businesses and services, so as to achieve effective resolution under extreme conditions without severe disruption to global and domestic financial markets and real economy.
IV. Existing Problems in the Resolution Regimes in China
The legal framework for banking resolution should be further improved. Legal provisions about resolution authorities and powers are quite scattered. The Law on the People’s Bank of China, Law on Banking Regulation, Law on Commercial Banks and the Deposit Insurance Regulations stipulate, respectively, that PBC shall take the lead in resolution of systemic risks, the banking regulatory authority should decide to take over failed banks, and the deposit insurer shall be appointed the party to take over failed banks and then implement resolution. But the conditions, time, procedure, manner or legal consequences of such takeover have not been specified. In addition, resolution tools remain to be explored and improved. There are currently no explicit legal foundations of regulations governing resolution powers and tools including establishing bridge banks and writing down or converting debt instruments into equity.

203Chapter III Macroprudential Regulation
Cross-border resolution cooperation mechanism should be enhanced. For reasons such as asynchronous reform progress, certain resolution powers and tools in one jurisdiction may not be recognised by another during the resolution process, and this would probably result in inconsistent actions of foreign and domestic resolution authorities. It is more difficult for such kind of coordination between home jurisdiction and host jurisdictions that are not members of the CMG. In that case, decisions by resolution authorities may not be implemented overseas. Once resolution triggered, spin-off of overseas entities and business units may be possible, and the effectiveness of the cross-border crisis management mechanism remains to be tested in practice.
TLAC implementation is a challenging task. To ensure that G-SIBs have adequate loss-absorbing and recapitalisation capacity, the FSB defined the TLAC requirement for G-SIBs consisting of necessary equity and debt instruments. At current stage, non-capital instruments that meet the eligibility criteria for TLAC do not exist in domestic bond market, and the investor base should also be strengthened, which indicates a great challenge to large issuance. Meanwhile, the 4 G-SIBs incorporated in China have not developed clear plans in satisfying TLAC shortfalls.
Membership in FMIs and its transferability have not been specif ied. The current resolution mechanism has not defined whether the successor entity could retain membership of FMIs or carry on centrally cleared contracts,
and whether payment operations could be transferred to a successor entity or third party institution. Therefore, there exist uncertainties with regard to the continuity of the essential payment operations of a successor entity and its access to FMIs, once a G-SIB enters into resolution.
Management information systems of G-SIBs should be enhanced. Currently, management information systems of the 4 G-SIBs have not covered all their businesses and entities domestically and overseas, which may impact implementation of RRPs. Moreover, the 4 banks’ capacity of data aggregation and key risk data provision under crisis conditions should be strengthened, and systems for intra-group transactions should also be improved.
V. M e a s u r e s t o I m p r o v e Resolvability
Accelerating the development of laws and regulations concerning resolution. The Law on Commercial Banks and the Enterprise Bankruptcy Law should be amended, and supporting arrangements and operational rules should be developed according to requirements in the Key Attributes, to clarify division of labor and resolution powers of financial management authorities in the resolution process. Resolution tools should be diversifies, and legal basis for resolution powers such as bridge banks, net t ing arrangements and segregation of client assets should be clearly defined. The regulatory coordination mechanism should also be enhanced.
204
I m p ro v i n g t h e c ro s s - b o r d e r c r i s i s management framework. Measures should be taken to enhance communication of CMG members in terms of implementation of the resolution plan, exercising of resolution powers and application of resolution tools. Institutional mechanism of cooperation and information sharing should be established with host jurisdictions that are not members of the CMGs.
Making ef forts to implement TLAC requirements. The eligibility criteria for debt instruments that qualify as TLAC in China should be identified in a timely manner.
Measures should be continued to cultivate the capital market, stimulate market expansion, and facilitate growth of the secondary market of asset transfer. G-SIBs headquartered in China should be encouraged to develop plans in satisfying TLAC shortfalls, and improving their own capital adequacy.
Moreover, arrangements concerning the successor entity’s membership in FMIs and its transferability during the process of resolution should be put in place. Management information systems of banks should be improved to facilitate timely aggregation of risk data.

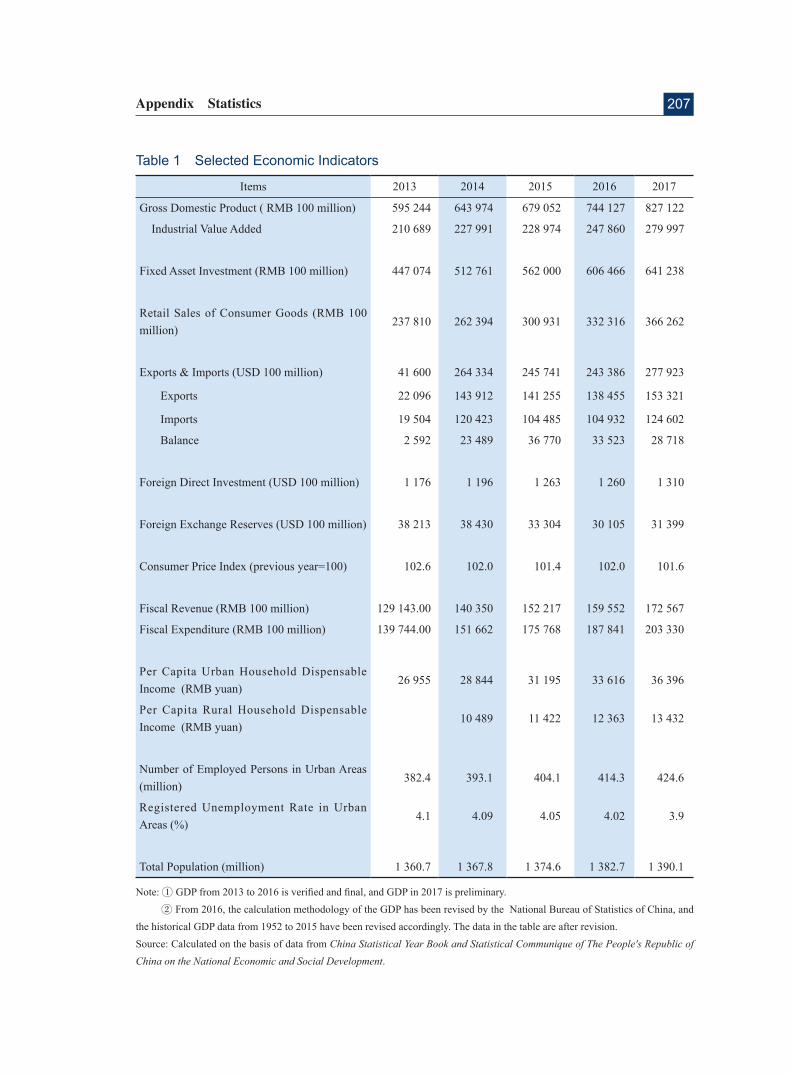
207Appendix Statistics
Table 1 Selected Economic Indicators
Items 2013 2014 2015 2016 2017
Gross Domestic Product ( RMB 100 million) 595 244 643 974 679 052 744 127 827 122
Industrial Value Added 210 689 227 991 228 974 247 860 279 997
Fixed Asset Investment (RMB 100 million) 447 074 512 761 562 000 606 466 641 238
Retail Sales of Consumer Goods (RMB 100 million)
237 810 262 394 300 931 332 316 366 262
Exports & Imports (USD 100 million) 41 600 264 334 245 741 243 386 277 923
Exports 22 096 143 912 141 255 138 455 153 321
Imports 19 504 120 423 104 485 104 932 124 602
Balance 2 592 23 489 36 770 33 523 28 718
Foreign Direct Investment (USD 100 million) 1 176 1 196 1 263 1 260 1 310
Foreign Exchange Reserves (USD 100 million) 38 213 38 430 33 304 30 105 31 399
Consumer Price Index (previous year=100) 102.6 102.0 101.4 102.0 101.6
Fiscal Revenue (RMB 100 million) 129 143.00 140 350 152 217 159 552 172 567
Fiscal Expenditure (RMB 100 million) 139 744.00 151 662 175 768 187 841 203 330
Per Capita Urban Household Dispensable Income (RMB yuan)
26 955 28 844 31 195 33 616 36 396
Per Capita Rural Household Dispensable Income (RMB yuan)
10 489 11 422 12 363 13 432
Number of Employed Persons in Urban Areas (million)
382.4 393.1 404.1 414.3 424.6
Registered Unemployment Rate in Urban Areas (%)
4.1 4.09 4.05 4.02 3.9
Total Population (million) 1 360.7 1 367.8 1 374.6 1 382.7 1 390.1
Note: a GDP from 2013 to 2016 is verified and final, and GDP in 2017 is preliminary. b From 2016, the calculation methodology of the GDP has been revised by the National Bureau of Statistics of China, and the historical GDP data from 1952 to 2015 have been revised accordingly. The data in the table are after revision.Source: Calculated on the basis of data from China Statistical Year Book and Statistical Communique of The People's Republic of China on the National Economic and Social Development.
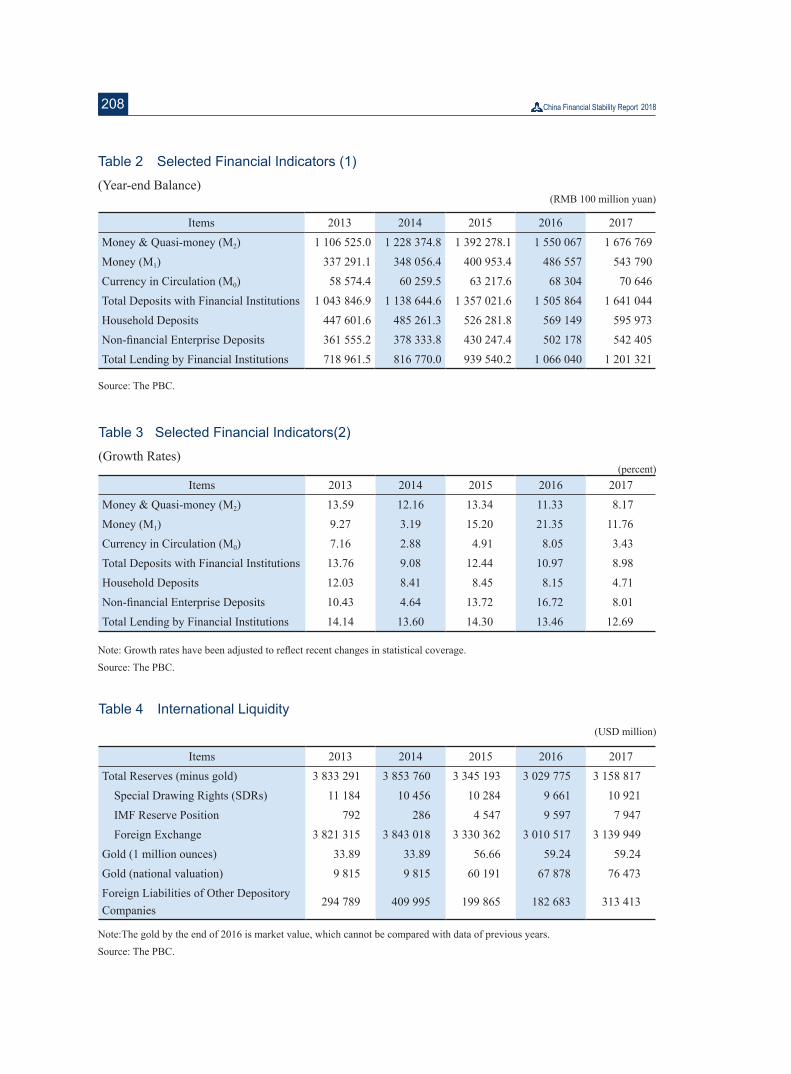
208
Items 2013 2014 2015 2016 2017Money & Quasi-money (M2) 1 106 525.0 1 228 374.8 1 392 278.1 1 550 067 1 676 769 Money (M1) 337 291.1 348 056.4 400 953.4 486 557 543 790 Currency in Circulation (M0) 58 574.4 60 259.5 63 217.6 68 304 70 646 Total Deposits with Financial Institutions 1 043 846.9 1 138 644.6 1 357 021.6 1 505 864 1 641 044 Household Deposits 447 601.6 485 261.3 526 281.8 569 149 595 973 Non-financial Enterprise Deposits 361 555.2 378 333.8 430 247.4 502 178 542 405 Total Lending by Financial Institutions 718 961.5 816 770.0 939 540.2 1 066 040 1 201 321
Items 2013 2014 2015 2016 2017Money & Quasi-money (M2) 13.59 12.16 13.34 11.33 8.17 Money (M1) 9.27 3.19 15.20 21.35 11.76 Currency in Circulation (M0) 7.16 2.88 4.91 8.05 3.43 Total Deposits with Financial Institutions 13.76 9.08 12.44 10.97 8.98 Household Deposits 12.03 8.41 8.45 8.15 4.71 Non-financial Enterprise Deposits 10.43 4.64 13.72 16.72 8.01 Total Lending by Financial Institutions 14.14 13.60 14.30 13.46 12.69
Items 2013 2014 2015 2016 2017Total Reserves (minus gold) 3 833 291 3 853 760 3 345 193 3 029 775 3 158 817 Special Drawing Rights (SDRs) 11 184 10 456 10 284 9 661 10 921 IMF Reserve Position 792 286 4 547 9 597 7 947 Foreign Exchange 3 821 315 3 843 018 3 330 362 3 010 517 3 139 949 Gold (1 million ounces) 33.89 33.89 56.66 59.24 59.24 Gold (national valuation) 9 815 9 815 60 191 67 878 76 473Foreign Liabilities of Other Depository Companies
294 789 409 995 199 865 182 683 313 413
Table 2 Selected Financial Indicators (1)
(Year-end Balance)(RMB 100 million yuan)
Source: The PBC.
Table 3 Selected Financial Indicators(2)
(Growth Rates) (percent)
Note: Growth rates have been adjusted to reflect recent changes in statistical coverage.Source: The PBC.
Note:The gold by the end of 2016 is market value, which cannot be compared with data of previous years.Source: The PBC.
Table 4 International Liquidity(USD million)
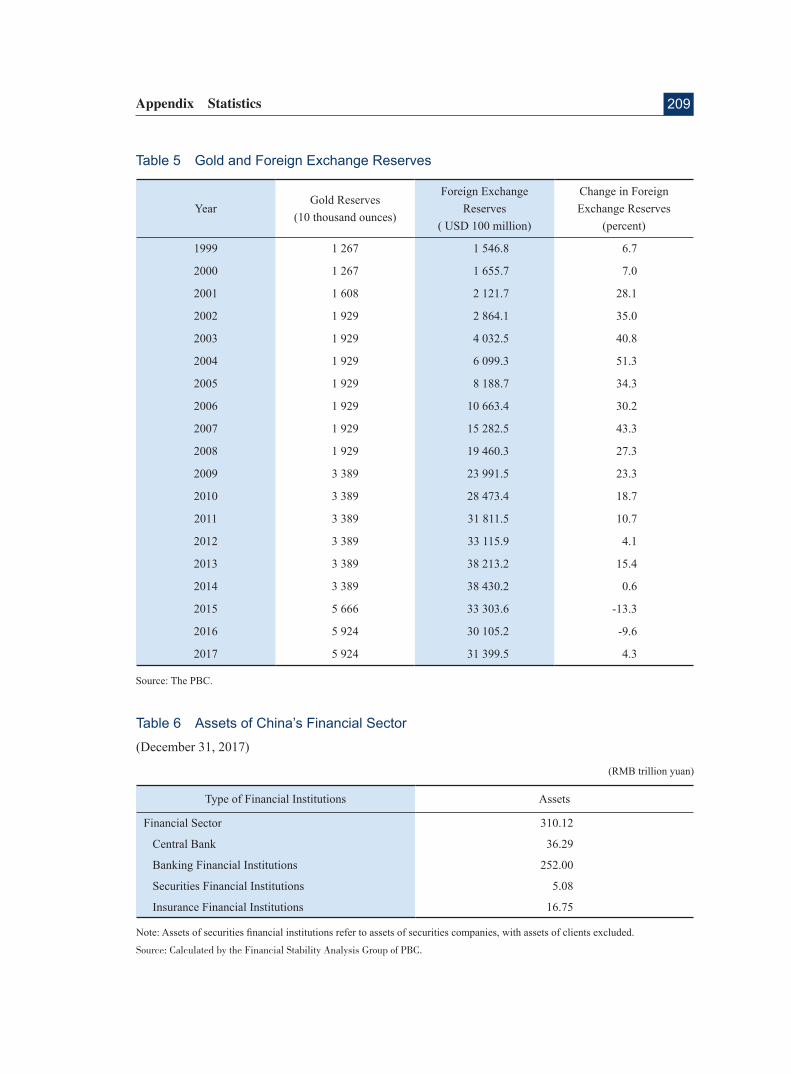
209Appendix Statistics
Table 5 Gold and Foreign Exchange Reserves
YearGold Reserves
(10 thousand ounces)
Foreign Exchange Reserves
( USD 100 million)
Change in Foreign Exchange Reserves
(percent)
1999 1 267 1 546.8 6.7
2000 1 267 1 655.7 7.0
2001 1 608 2 121.7 28.1
2002 1 929 2 864.1 35.0
2003 1 929 4 032.5 40.8
2004 1 929 6 099.3 51.3
2005 1 929 8 188.7 34.3
2006 1 929 10 663.4 30.2
2007 1 929 15 282.5 43.3
2008 1 929 19 460.3 27.3
2009 3 389 23 991.5 23.3
2010 3 389 28 473.4 18.7
2011 3 389 31 811.5 10.7
2012 3 389 33 115.9 4.1
2013 3 389 38 213.2 15.4
2014 3 389 38 430.2 0.6
2015 5 666 33 303.6 -13.3
2016 5 924 30 105.2 -9.6
2017 5 924 31 399.5 4.3
Source: The PBC.
Type of Financial Institutions Assets
Financial Sector 310.12
Central Bank 36.29
Banking Financial Institutions 252.00
Securities Financial Institutions 5.08
Insurance Financial Institutions 16.75
Table 6 Assets of China’s Financial Sector
(December 31, 2017)
(RMB trillion yuan)
Note: Assets of securities financial institutions refer to assets of securities companies, with assets of clients excluded.
Source: Calculated by the Financial Stability Analysis Group of PBC.
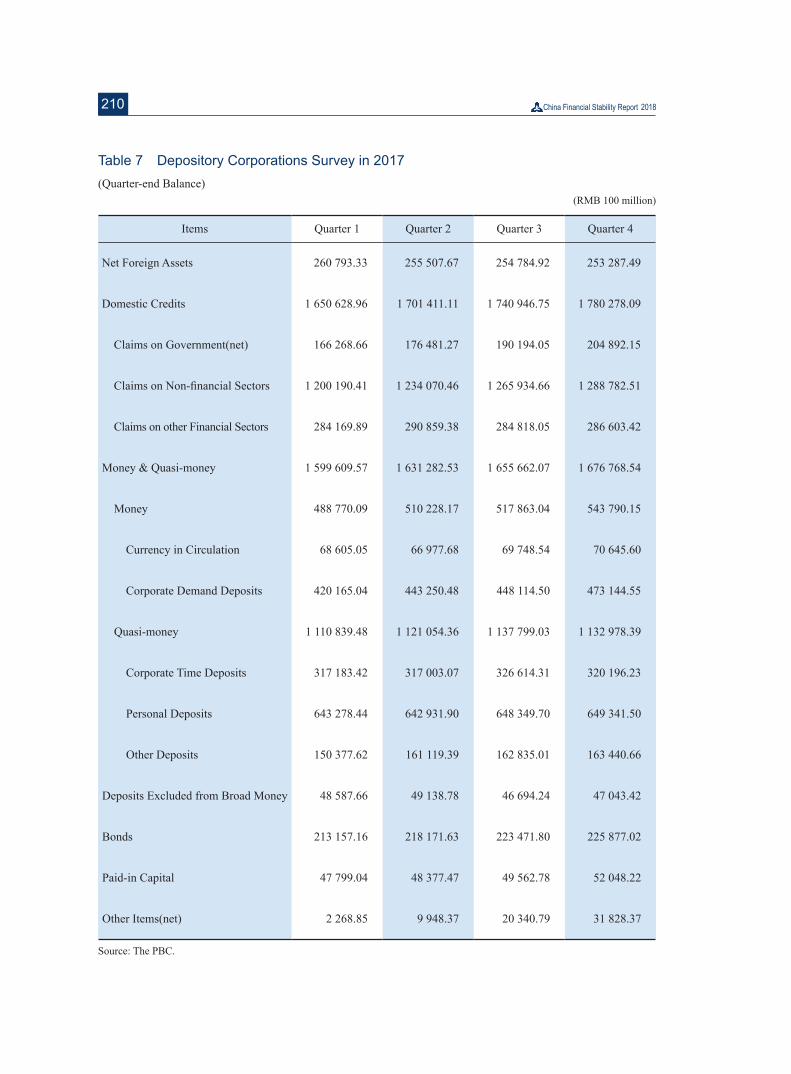
210
Items Quarter 1 Quarter 2 Quarter 3 Quarter 4
Net Foreign Assets 260 793.33 255 507.67 254 784.92 253 287.49
Domestic Credits 1 650 628.96 1 701 411.11 1 740 946.75 1 780 278.09
Claims on Government(net) 166 268.66 176 481.27 190 194.05 204 892.15
Claims on Non-financial Sectors 1 200 190.41 1 234 070.46 1 265 934.66 1 288 782.51
Claims on other Financial Sectors 284 169.89 290 859.38 284 818.05 286 603.42
Money & Quasi-money 1 599 609.57 1 631 282.53 1 655 662.07 1 676 768.54
Money 488 770.09 510 228.17 517 863.04 543 790.15
Currency in Circulation 68 605.05 66 977.68 69 748.54 70 645.60
Corporate Demand Deposits 420 165.04 443 250.48 448 114.50 473 144.55
Quasi-money 1 110 839.48 1 121 054.36 1 137 799.03 1 132 978.39
Corporate Time Deposits 317 183.42 317 003.07 326 614.31 320 196.23
Personal Deposits 643 278.44 642 931.90 648 349.70 649 341.50
Other Deposits 150 377.62 161 119.39 162 835.01 163 440.66
Deposits Excluded from Broad Money 48 587.66 49 138.78 46 694.24 47 043.42
Bonds 213 157.16 218 171.63 223 471.80 225 877.02
Paid-in Capital 47 799.04 48 377.47 49 562.78 52 048.22
Other Items(net) 2 268.85 9 948.37 20 340.79 31 828.37
Table 7 Depository Corporations Survey in 2017(Quarter-end Balance)
(RMB 100 million)
Source: The PBC.
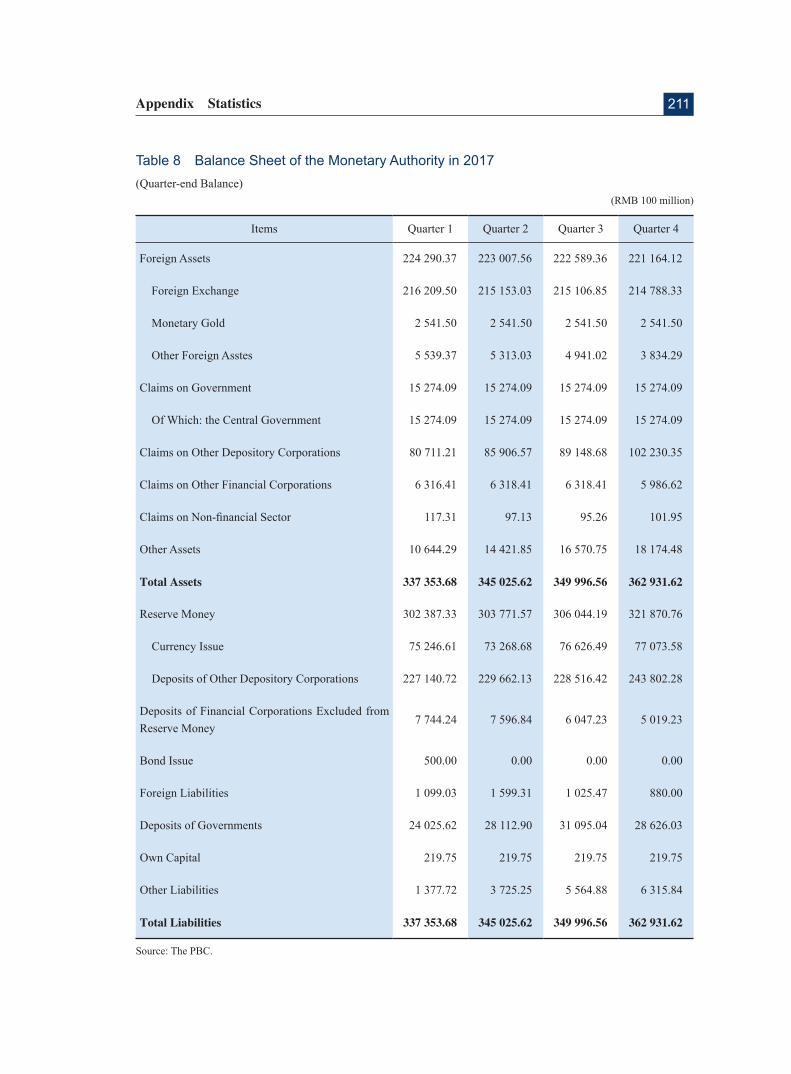
211Appendix Statistics
Source: The PBC.
Items Quarter 1 Quarter 2 Quarter 3 Quarter 4
Foreign Assets 224 290.37 223 007.56 222 589.36 221 164.12
Foreign Exchange 216 209.50 215 153.03 215 106.85 214 788.33
Monetary Gold 2 541.50 2 541.50 2 541.50 2 541.50
Other Foreign Asstes 5 539.37 5 313.03 4 941.02 3 834.29
Claims on Government 15 274.09 15 274.09 15 274.09 15 274.09
Of Which: the Central Government 15 274.09 15 274.09 15 274.09 15 274.09
Claims on Other Depository Corporations 80 711.21 85 906.57 89 148.68 102 230.35
Claims on Other Financial Corporations 6 316.41 6 318.41 6 318.41 5 986.62
Claims on Non-financial Sector 117.31 97.13 95.26 101.95
Other Assets 10 644.29 14 421.85 16 570.75 18 174.48
Total Assets 337 353.68 345 025.62 349 996.56 362 931.62
Reserve Money 302 387.33 303 771.57 306 044.19 321 870.76
Currency Issue 75 246.61 73 268.68 76 626.49 77 073.58
Deposits of Other Depository Corporations 227 140.72 229 662.13 228 516.42 243 802.28
Deposits of Financial Corporations Excluded from Reserve Money
7 744.24 7 596.84 6 047.23 5 019.23
Bond Issue 500.00 0.00 0.00 0.00
Foreign Liabilities 1 099.03 1 599.31 1 025.47 880.00
Deposits of Governments 24 025.62 28 112.90 31 095.04 28 626.03
Own Capital 219.75 219.75 219.75 219.75
Other Liabilities 1 377.72 3 725.25 5 564.88 6 315.84
Total Liabilities 337 353.68 345 025.62 349 996.56 362 931.62
Table 8 Balance Sheet of the Monetary Authority in 2017(Quarter-end Balance)
(RMB 100 million)
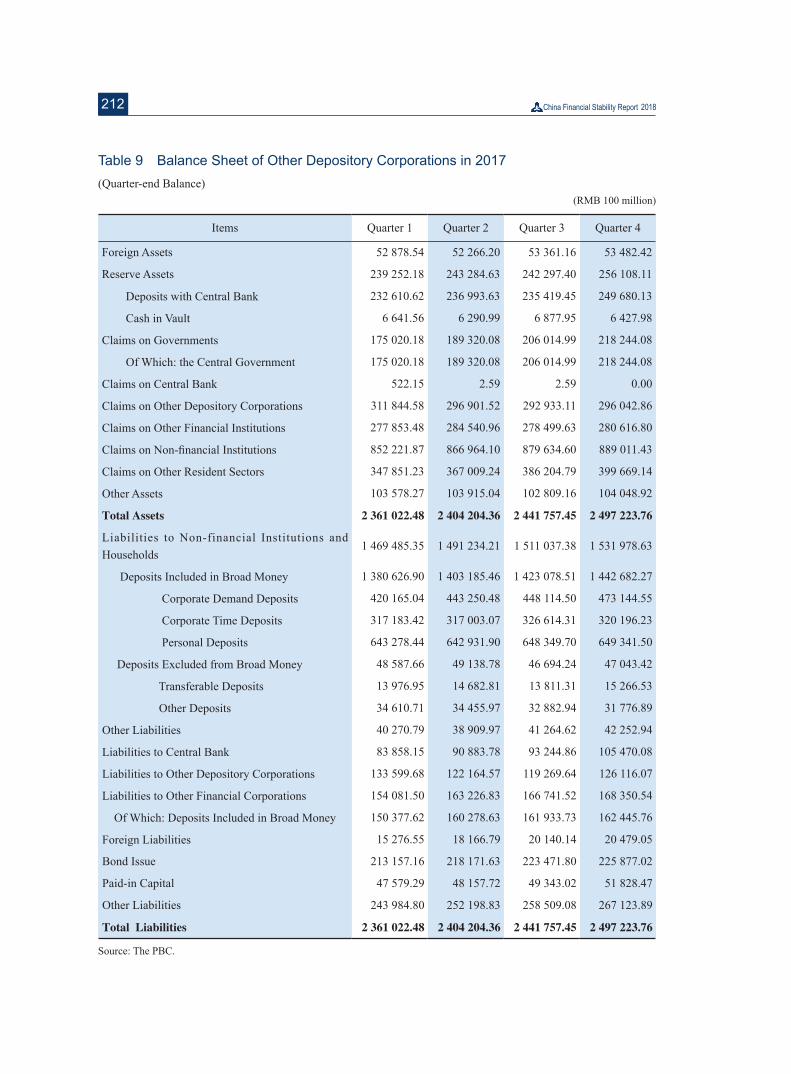
212
Table 9 Balance Sheet of Other Depository Corporations in 2017(Quarter-end Balance)
(RMB 100 million)
Items Quarter 1 Quarter 2 Quarter 3 Quarter 4
Foreign Assets 52 878.54 52 266.20 53 361.16 53 482.42
Reserve Assets 239 252.18 243 284.63 242 297.40 256 108.11
Deposits with Central Bank 232 610.62 236 993.63 235 419.45 249 680.13
Cash in Vault 6 641.56 6 290.99 6 877.95 6 427.98
Claims on Governments 175 020.18 189 320.08 206 014.99 218 244.08
Of Which: the Central Government 175 020.18 189 320.08 206 014.99 218 244.08
Claims on Central Bank 522.15 2.59 2.59 0.00
Claims on Other Depository Corporations 311 844.58 296 901.52 292 933.11 296 042.86
Claims on Other Financial Institutions 277 853.48 284 540.96 278 499.63 280 616.80
Claims on Non-financial Institutions 852 221.87 866 964.10 879 634.60 889 011.43
Claims on Other Resident Sectors 347 851.23 367 009.24 386 204.79 399 669.14
Other Assets 103 578.27 103 915.04 102 809.16 104 048.92
Total Assets 2 361 022.48 2 404 204.36 2 441 757.45 2 497 223.76
Liabilities to Non-financial Institutions and Households
1 469 485.35 1 491 234.21 1 511 037.38 1 531 978.63
Deposits Included in Broad Money 1 380 626.90 1 403 185.46 1 423 078.51 1 442 682.27
Corporate Demand Deposits 420 165.04 443 250.48 448 114.50 473 144.55
Corporate Time Deposits 317 183.42 317 003.07 326 614.31 320 196.23
Personal Deposits 643 278.44 642 931.90 648 349.70 649 341.50
Deposits Excluded from Broad Money 48 587.66 49 138.78 46 694.24 47 043.42
Transferable Deposits 13 976.95 14 682.81 13 811.31 15 266.53
Other Deposits 34 610.71 34 455.97 32 882.94 31 776.89
Other Liabilities 40 270.79 38 909.97 41 264.62 42 252.94
Liabilities to Central Bank 83 858.15 90 883.78 93 244.86 105 470.08
Liabilities to Other Depository Corporations 133 599.68 122 164.57 119 269.64 126 116.07
Liabilities to Other Financial Corporations 154 081.50 163 226.83 166 741.52 168 350.54
Of Which: Deposits Included in Broad Money 150 377.62 160 278.63 161 933.73 162 445.76
Foreign Liabilities 15 276.55 18 166.79 20 140.14 20 479.05
Bond Issue 213 157.16 218 171.63 223 471.80 225 877.02
Paid-in Capital 47 579.29 48 157.72 49 343.02 51 828.47
Other Liabilities 243 984.80 252 198.83 258 509.08 267 123.89
Total Liabilities 2 361 022.48 2 404 204.36 2 441 757.45 2 497 223.76
Source: The PBC.
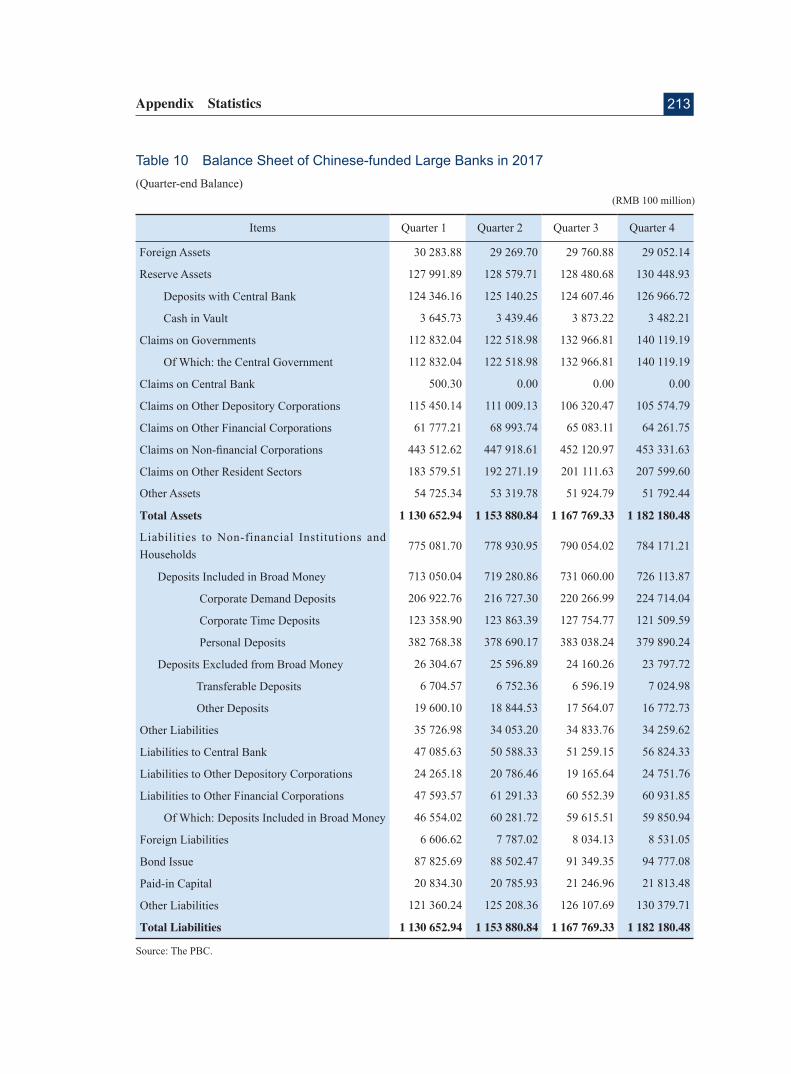
213Appendix Statistics
Source: The PBC.
Table 10 Balance Sheet of Chinese-funded Large Banks in 2017(Quarter-end Balance)
(RMB 100 million)
Items Quarter 1 Quarter 2 Quarter 3 Quarter 4
Foreign Assets 30 283.88 29 269.70 29 760.88 29 052.14
Reserve Assets 127 991.89 128 579.71 128 480.68 130 448.93
Deposits with Central Bank 124 346.16 125 140.25 124 607.46 126 966.72
Cash in Vault 3 645.73 3 439.46 3 873.22 3 482.21
Claims on Governments 112 832.04 122 518.98 132 966.81 140 119.19
Of Which: the Central Government 112 832.04 122 518.98 132 966.81 140 119.19
Claims on Central Bank 500.30 0.00 0.00 0.00
Claims on Other Depository Corporations 115 450.14 111 009.13 106 320.47 105 574.79
Claims on Other Financial Corporations 61 777.21 68 993.74 65 083.11 64 261.75
Claims on Non-financial Corporations 443 512.62 447 918.61 452 120.97 453 331.63
Claims on Other Resident Sectors 183 579.51 192 271.19 201 111.63 207 599.60
Other Assets 54 725.34 53 319.78 51 924.79 51 792.44
Total Assets 1 130 652.94 1 153 880.84 1 167 769.33 1 182 180.48
Liabilities to Non-financial Institutions and Households
775 081.70 778 930.95 790 054.02 784 171.21
Deposits Included in Broad Money 713 050.04 719 280.86 731 060.00 726 113.87
Corporate Demand Deposits 206 922.76 216 727.30 220 266.99 224 714.04
Corporate Time Deposits 123 358.90 123 863.39 127 754.77 121 509.59
Personal Deposits 382 768.38 378 690.17 383 038.24 379 890.24
Deposits Excluded from Broad Money 26 304.67 25 596.89 24 160.26 23 797.72
Transferable Deposits 6 704.57 6 752.36 6 596.19 7 024.98
Other Deposits 19 600.10 18 844.53 17 564.07 16 772.73
Other Liabilities 35 726.98 34 053.20 34 833.76 34 259.62
Liabilities to Central Bank 47 085.63 50 588.33 51 259.15 56 824.33
Liabilities to Other Depository Corporations 24 265.18 20 786.46 19 165.64 24 751.76
Liabilities to Other Financial Corporations 47 593.57 61 291.33 60 552.39 60 931.85
Of Which: Deposits Included in Broad Money 46 554.02 60 281.72 59 615.51 59 850.94
Foreign Liabilities 6 606.62 7 787.02 8 034.13 8 531.05
Bond Issue 87 825.69 88 502.47 91 349.35 94 777.08
Paid-in Capital 20 834.30 20 785.93 21 246.96 21 813.48
Other Liabilities 121 360.24 125 208.36 126 107.69 130 379.71
Total Liabilities 1 130 652.94 1 153 880.84 1 167 769.33 1 182 180.48
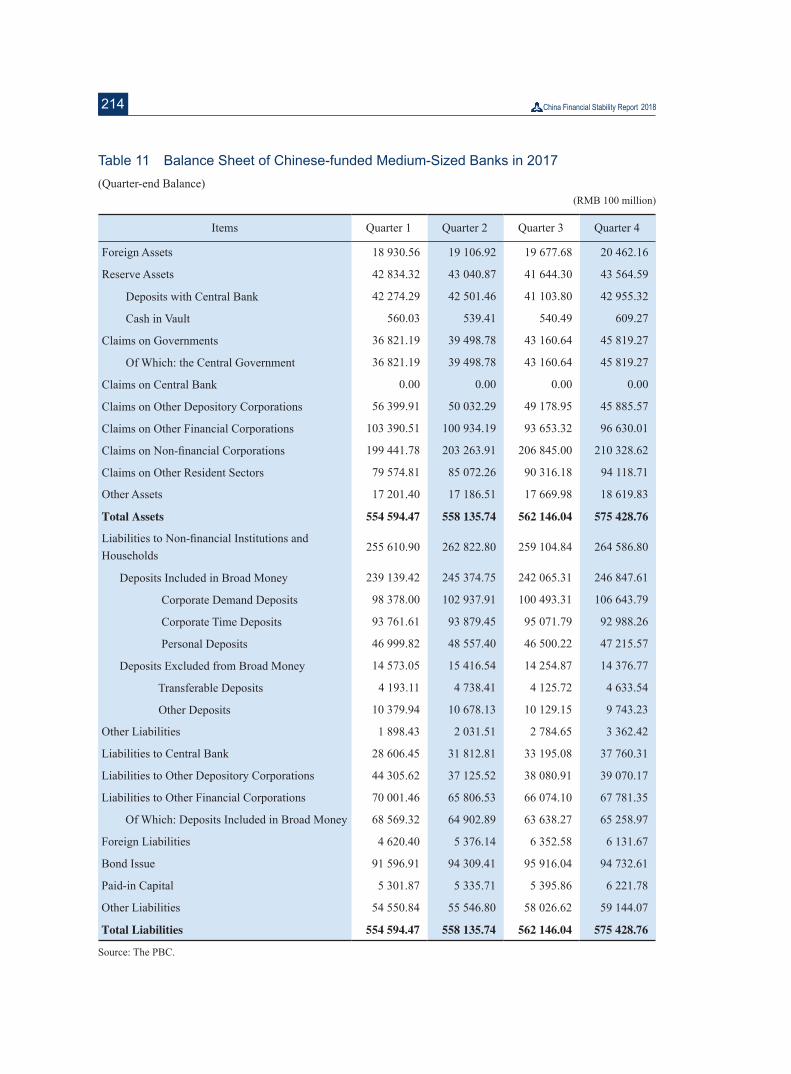
214
Table 11 Balance Sheet of Chinese-funded Medium-Sized Banks in 2017(Quarter-end Balance)
(RMB 100 million)
Items Quarter 1 Quarter 2 Quarter 3 Quarter 4
Foreign Assets 18 930.56 19 106.92 19 677.68 20 462.16
Reserve Assets 42 834.32 43 040.87 41 644.30 43 564.59
Deposits with Central Bank 42 274.29 42 501.46 41 103.80 42 955.32
Cash in Vault 560.03 539.41 540.49 609.27
Claims on Governments 36 821.19 39 498.78 43 160.64 45 819.27
Of Which: the Central Government 36 821.19 39 498.78 43 160.64 45 819.27
Claims on Central Bank 0.00 0.00 0.00 0.00
Claims on Other Depository Corporations 56 399.91 50 032.29 49 178.95 45 885.57
Claims on Other Financial Corporations 103 390.51 100 934.19 93 653.32 96 630.01
Claims on Non-financial Corporations 199 441.78 203 263.91 206 845.00 210 328.62
Claims on Other Resident Sectors 79 574.81 85 072.26 90 316.18 94 118.71
Other Assets 17 201.40 17 186.51 17 669.98 18 619.83
Total Assets 554 594.47 558 135.74 562 146.04 575 428.76
Liabilities to Non-financial Institutions and Households
255 610.90 262 822.80 259 104.84 264 586.80
Deposits Included in Broad Money 239 139.42 245 374.75 242 065.31 246 847.61
Corporate Demand Deposits 98 378.00 102 937.91 100 493.31 106 643.79
Corporate Time Deposits 93 761.61 93 879.45 95 071.79 92 988.26
Personal Deposits 46 999.82 48 557.40 46 500.22 47 215.57
Deposits Excluded from Broad Money 14 573.05 15 416.54 14 254.87 14 376.77
Transferable Deposits 4 193.11 4 738.41 4 125.72 4 633.54
Other Deposits 10 379.94 10 678.13 10 129.15 9 743.23
Other Liabilities 1 898.43 2 031.51 2 784.65 3 362.42
Liabilities to Central Bank 28 606.45 31 812.81 33 195.08 37 760.31
Liabilities to Other Depository Corporations 44 305.62 37 125.52 38 080.91 39 070.17
Liabilities to Other Financial Corporations 70 001.46 65 806.53 66 074.10 67 781.35
Of Which: Deposits Included in Broad Money 68 569.32 64 902.89 63 638.27 65 258.97
Foreign Liabilities 4 620.40 5 376.14 6 352.58 6 131.67
Bond Issue 91 596.91 94 309.41 95 916.04 94 732.61
Paid-in Capital 5 301.87 5 335.71 5 395.86 6 221.78
Other Liabilities 54 550.84 55 546.80 58 026.62 59 144.07
Total Liabilities 554 594.47 558 135.74 562 146.04 575 428.76
Source: The PBC.
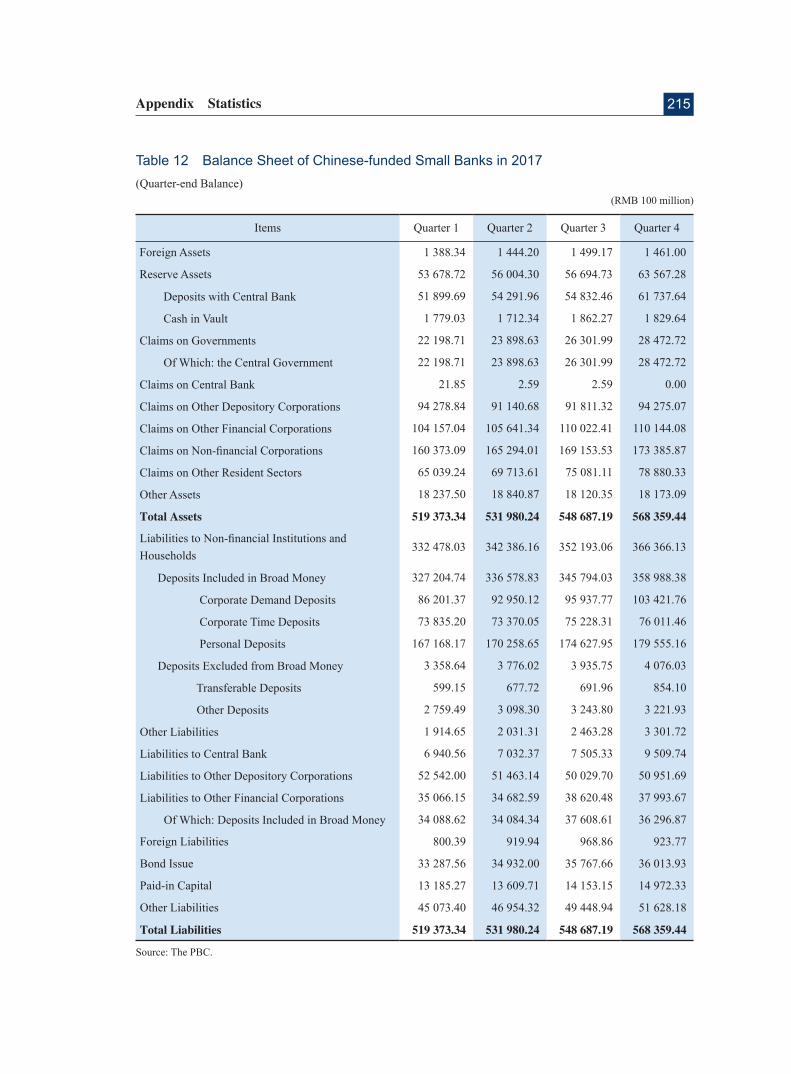
215Appendix Statistics
Source: The PBC.
Table 12 Balance Sheet of Chinese-funded Small Banks in 2017(Quarter-end Balance)
(RMB 100 million)
Items Quarter 1 Quarter 2 Quarter 3 Quarter 4
Foreign Assets 1 388.34 1 444.20 1 499.17 1 461.00
Reserve Assets 53 678.72 56 004.30 56 694.73 63 567.28
Deposits with Central Bank 51 899.69 54 291.96 54 832.46 61 737.64
Cash in Vault 1 779.03 1 712.34 1 862.27 1 829.64
Claims on Governments 22 198.71 23 898.63 26 301.99 28 472.72
Of Which: the Central Government 22 198.71 23 898.63 26 301.99 28 472.72
Claims on Central Bank 21.85 2.59 2.59 0.00
Claims on Other Depository Corporations 94 278.84 91 140.68 91 811.32 94 275.07
Claims on Other Financial Corporations 104 157.04 105 641.34 110 022.41 110 144.08
Claims on Non-financial Corporations 160 373.09 165 294.01 169 153.53 173 385.87
Claims on Other Resident Sectors 65 039.24 69 713.61 75 081.11 78 880.33
Other Assets 18 237.50 18 840.87 18 120.35 18 173.09
Total Assets 519 373.34 531 980.24 548 687.19 568 359.44
Liabilities to Non-financial Institutions andHouseholds
332 478.03 342 386.16 352 193.06 366 366.13
Deposits Included in Broad Money 327 204.74 336 578.83 345 794.03 358 988.38
Corporate Demand Deposits 86 201.37 92 950.12 95 937.77 103 421.76
Corporate Time Deposits 73 835.20 73 370.05 75 228.31 76 011.46
Personal Deposits 167 168.17 170 258.65 174 627.95 179 555.16
Deposits Excluded from Broad Money 3 358.64 3 776.02 3 935.75 4 076.03
Transferable Deposits 599.15 677.72 691.96 854.10
Other Deposits 2 759.49 3 098.30 3 243.80 3 221.93
Other Liabilities 1 914.65 2 031.31 2 463.28 3 301.72
Liabilities to Central Bank 6 940.56 7 032.37 7 505.33 9 509.74
Liabilities to Other Depository Corporations 52 542.00 51 463.14 50 029.70 50 951.69
Liabilities to Other Financial Corporations 35 066.15 34 682.59 38 620.48 37 993.67
Of Which: Deposits Included in Broad Money 34 088.62 34 084.34 37 608.61 36 296.87
Foreign Liabilities 800.39 919.94 968.86 923.77
Bond Issue 33 287.56 34 932.00 35 767.66 36 013.93
Paid-in Capital 13 185.27 13 609.71 14 153.15 14 972.33
Other Liabilities 45 073.40 46 954.32 49 448.94 51 628.18
Total Liabilities 519 373.34 531 980.24 548 687.19 568 359.44
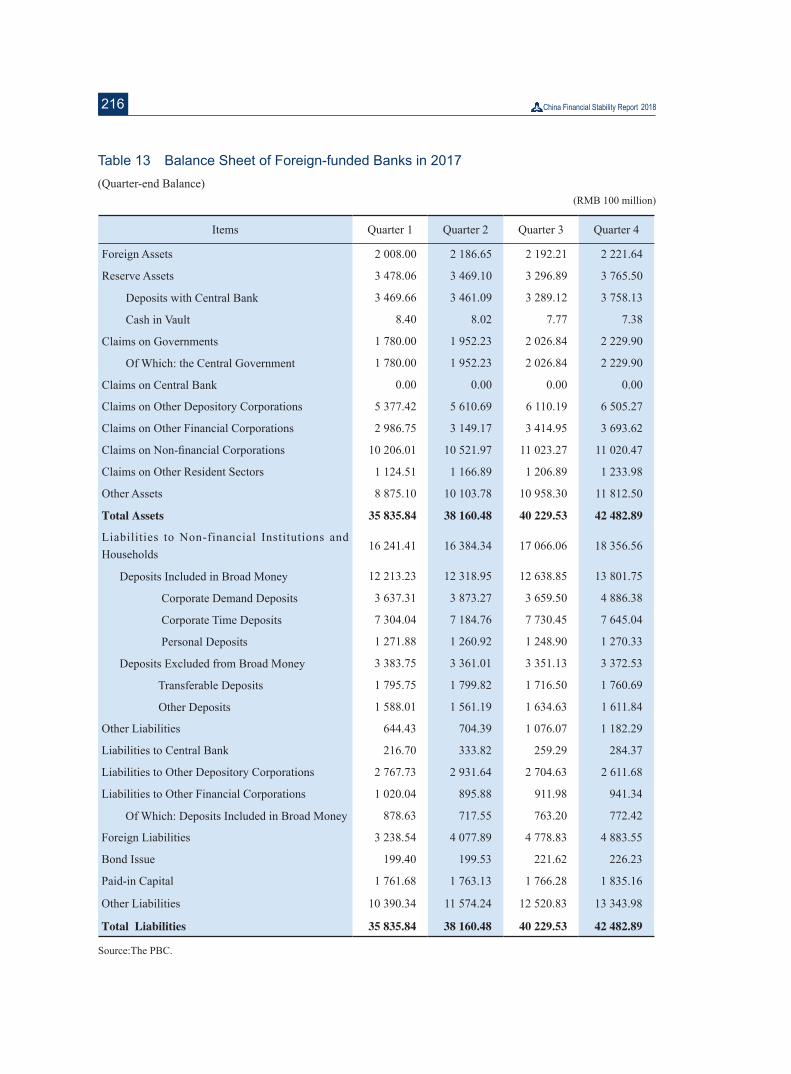
216
Table 13 Balance Sheet of Foreign-funded Banks in 2017(Quarter-end Balance)
(RMB 100 million)
Items Quarter 1 Quarter 2 Quarter 3 Quarter 4
Foreign Assets 2 008.00 2 186.65 2 192.21 2 221.64
Reserve Assets 3 478.06 3 469.10 3 296.89 3 765.50
Deposits with Central Bank 3 469.66 3 461.09 3 289.12 3 758.13
Cash in Vault 8.40 8.02 7.77 7.38
Claims on Governments 1 780.00 1 952.23 2 026.84 2 229.90
Of Which: the Central Government 1 780.00 1 952.23 2 026.84 2 229.90
Claims on Central Bank 0.00 0.00 0.00 0.00
Claims on Other Depository Corporations 5 377.42 5 610.69 6 110.19 6 505.27
Claims on Other Financial Corporations 2 986.75 3 149.17 3 414.95 3 693.62
Claims on Non-financial Corporations 10 206.01 10 521.97 11 023.27 11 020.47
Claims on Other Resident Sectors 1 124.51 1 166.89 1 206.89 1 233.98
Other Assets 8 875.10 10 103.78 10 958.30 11 812.50
Total Assets 35 835.84 38 160.48 40 229.53 42 482.89
Liabilities to Non-financial Institutions and Households
16 241.41 16 384.34 17 066.06 18 356.56
Deposits Included in Broad Money 12 213.23 12 318.95 12 638.85 13 801.75
Corporate Demand Deposits 3 637.31 3 873.27 3 659.50 4 886.38
Corporate Time Deposits 7 304.04 7 184.76 7 730.45 7 645.04
Personal Deposits 1 271.88 1 260.92 1 248.90 1 270.33
Deposits Excluded from Broad Money 3 383.75 3 361.01 3 351.13 3 372.53
Transferable Deposits 1 795.75 1 799.82 1 716.50 1 760.69
Other Deposits 1 588.01 1 561.19 1 634.63 1 611.84
Other Liabilities 644.43 704.39 1 076.07 1 182.29
Liabilities to Central Bank 216.70 333.82 259.29 284.37
Liabilities to Other Depository Corporations 2 767.73 2 931.64 2 704.63 2 611.68
Liabilities to Other Financial Corporations 1 020.04 895.88 911.98 941.34
Of Which: Deposits Included in Broad Money 878.63 717.55 763.20 772.42
Foreign Liabilities 3 238.54 4 077.89 4 778.83 4 883.55
Bond Issue 199.40 199.53 221.62 226.23
Paid-in Capital 1 761.68 1 763.13 1 766.28 1 835.16
Other Liabilities 10 390.34 11 574.24 12 520.83 13 343.98
Total Liabilities 35 835.84 38 160.48 40 229.53 42 482.89
Source:The PBC.
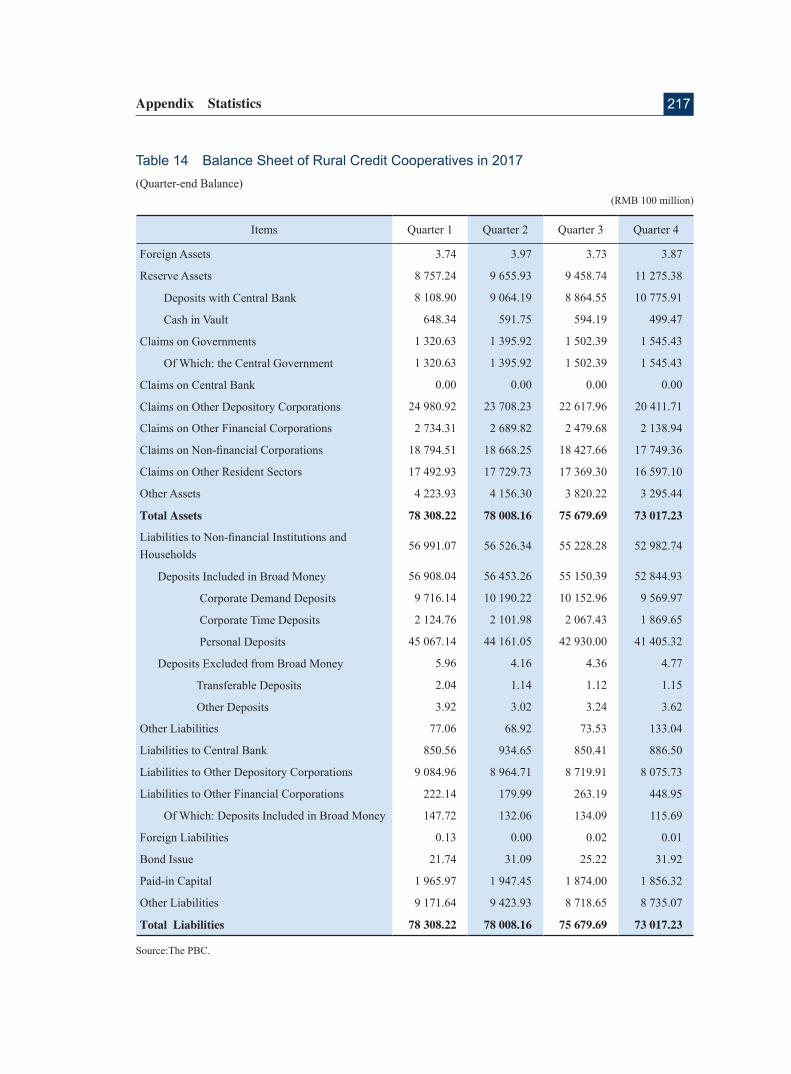
217Appendix Statistics
Source:The PBC.
Table 14 Balance Sheet of Rural Credit Cooperatives in 2017(Quarter-end Balance)
(RMB 100 million)
Items Quarter 1 Quarter 2 Quarter 3 Quarter 4
Foreign Assets 3.74 3.97 3.73 3.87
Reserve Assets 8 757.24 9 655.93 9 458.74 11 275.38
Deposits with Central Bank 8 108.90 9 064.19 8 864.55 10 775.91
Cash in Vault 648.34 591.75 594.19 499.47
Claims on Governments 1 320.63 1 395.92 1 502.39 1 545.43
Of Which: the Central Government 1 320.63 1 395.92 1 502.39 1 545.43
Claims on Central Bank 0.00 0.00 0.00 0.00
Claims on Other Depository Corporations 24 980.92 23 708.23 22 617.96 20 411.71
Claims on Other Financial Corporations 2 734.31 2 689.82 2 479.68 2 138.94
Claims on Non-financial Corporations 18 794.51 18 668.25 18 427.66 17 749.36
Claims on Other Resident Sectors 17 492.93 17 729.73 17 369.30 16 597.10
Other Assets 4 223.93 4 156.30 3 820.22 3 295.44
Total Assets 78 308.22 78 008.16 75 679.69 73 017.23
Liabilities to Non-financial Institutions andHouseholds
56 991.07 56 526.34 55 228.28 52 982.74
Deposits Included in Broad Money 56 908.04 56 453.26 55 150.39 52 844.93
Corporate Demand Deposits 9 716.14 10 190.22 10 152.96 9 569.97
Corporate Time Deposits 2 124.76 2 101.98 2 067.43 1 869.65
Personal Deposits 45 067.14 44 161.05 42 930.00 41 405.32
Deposits Excluded from Broad Money 5.96 4.16 4.36 4.77
Transferable Deposits 2.04 1.14 1.12 1.15
Other Deposits 3.92 3.02 3.24 3.62
Other Liabilities 77.06 68.92 73.53 133.04
Liabilities to Central Bank 850.56 934.65 850.41 886.50
Liabilities to Other Depository Corporations 9 084.96 8 964.71 8 719.91 8 075.73
Liabilities to Other Financial Corporations 222.14 179.99 263.19 448.95
Of Which: Deposits Included in Broad Money 147.72 132.06 134.09 115.69
Foreign Liabilities 0.13 0.00 0.02 0.01
Bond Issue 21.74 31.09 25.22 31.92
Paid-in Capital 1 965.97 1 947.45 1 874.00 1 856.32
Other Liabilities 9 171.64 9 423.93 8 718.65 8 735.07
Total Liabilities 78 308.22 78 008.16 75 679.69 73 017.23
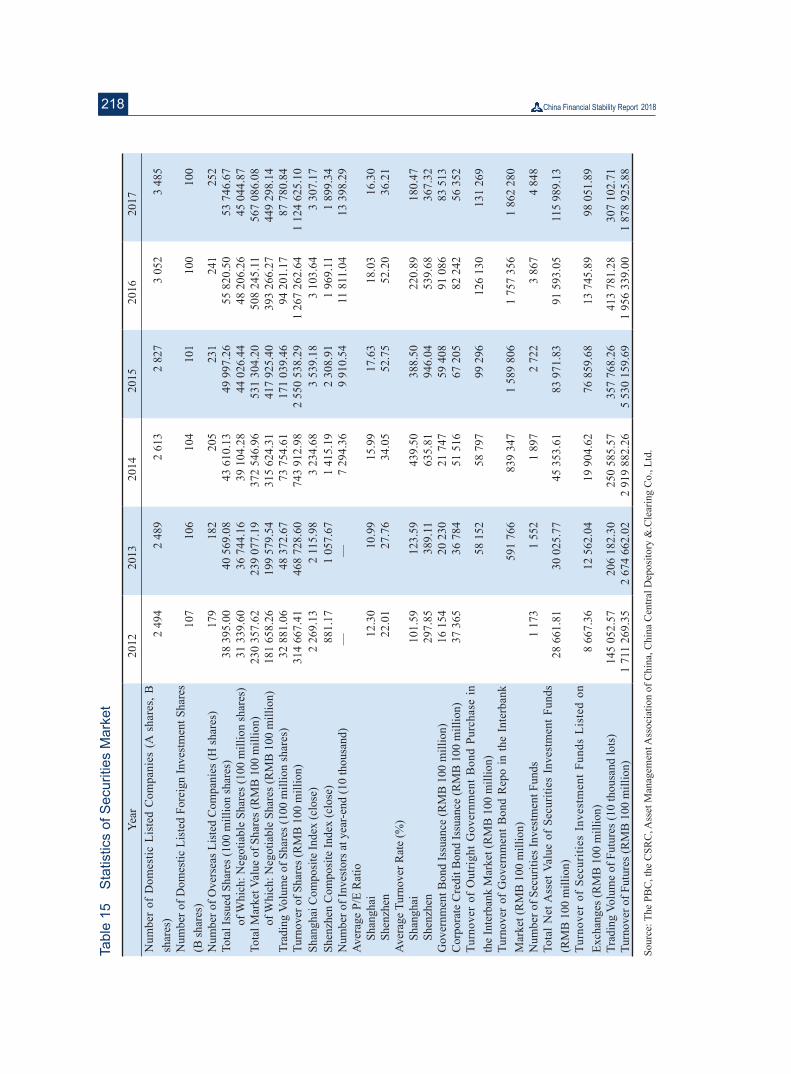
218Ta
ble
15
Sta
tistic
s of
Sec
uriti
es M
arke
t
Year
2012
2013
2014
2015
2016
2017
Num
ber
of D
omes
tic L
iste
d C
ompa
nies
(A
sha
res,
B
shar
es)
2 49
4 2
489
2 61
3 2
827
3 05
2 3
485
Num
ber o
f Dom
estic
Lis
ted
Fore
ign
Inve
stm
ent S
hare
s (B
shar
es)
107
106
104
101
100
100
Num
ber o
f Ove
rsea
s Lis
ted
Com
pani
es (H
shar
es)
179
182
205
231
241
252
Tota
l Iss
ued
Shar
es (1
00 m
illio
n sh
ares
)38
395
.00
40 5
69.0
8 43
610
.13
49 9
97.2
6 55
820
.50
53 7
46.6
7
of W
hich
: Neg
otia
ble
Shar
es (1
00 m
illio
n sh
ares
)31
339
.60
36 7
44.1
6 39
104
.28
44 0
26.4
4 48
206
.26
45 0
44.8
7 To
tal M
arke
t Val
ue o
f Sha
res (
RM
B 1
00 m
illio
n)23
0 35
7.62
23
9 07
7.19
37
2 54
6.96
53
1 30
4.20
50
8 24
5.11
56
7 08
6.08
of W
hich
: Neg
otia
ble
Shar
es (R
MB
100
mill
ion)
181
658.
26
199
579.
54
315
624.
31
417
925.
40
393
266.
27
449
298.
14
Trad
ing
Volu
me
of S
hare
s (10
0 m
illio
n sh
ares
)32
881
.06
48 3
72.6
7 73
754
.61
171
039.
46
94 2
01.1
7 87
780
.84
Turn
over
of S
hare
s (R
MB
100
mill
ion)
314
667.
41
468
728.
60
743
912.
98
2 55
0 53
8.29
1
267
262.
64
1 12
4 62
5.10
Sh
angh
ai C
ompo
site
Inde
x (c
lose
)2
269.
13
2 11
5.98
3
234.
68
3 53
9.18
3
103.
64
3 30
7.17
Sh
enzh
en C
ompo
site
Inde
x (c
lose
)88
1.17
1
057.
67
1 41
5.19
2
308.
91
1 96
9.11
1
899.
34
Num
ber o
f Inv
esto
rs a
t yea
r-end
(10
thou
sand
)—
—7
294.
36
9 91
0.54
11
811
.04
13 3
98.2
9 Av
erag
e P/
E R
atio
S
hang
hai
12.3
0 10
.99
15.9
9 17
.63
18.0
3 16
.30
S
henz
hen
22.0
1 27
.76
34.0
5 52
.75
52.2
0 36
.21
Aver
age
Turn
over
Rat
e (%
)
Sha
ngha
i10
1.59
12
3.59
43
9.50
38
8.50
22
0.89
18
0.47
She
nzhe
n29
7.85
38
9.11
63
5.81
94
6.04
53
9.68
36
7.32
G
over
nmen
t Bon
d Is
suan
ce (R
MB
100
mill
ion)
16 1
54
20 2
30
21 7
47
59 4
08
91 0
86
83 5
13
Cor
pora
te C
redi
t Bon
d Is
suan
ce (R
MB
100
mill
ion)
37 3
65
36 7
84
51 5
16
67 2
05
82 2
42
56 3
52
Turn
over
of
Out
right
Gov
ernm
ent B
ond
Purc
hase
in
the
Inte
rban
k M
arke
t (R
MB
100
mill
ion)
58 1
52
58 7
97
99 2
96
126
130
131
269
Turn
over
of
Gov
ernm
ent B
ond
Rep
o in
the
Inte
rban
k M
arke
t (R
MB
100
mill
ion)
591
766
839
347
1 58
9 80
6 1
757
356
1 86
2 28
0
Num
ber o
f Sec
uriti
es In
vest
men
t Fun
ds1
173
1 55
2 1
897
2 72
2 3
867
4 84
8 To
tal N
et A
sset
Val
ue o
f Se
curit
ies
Inve
stm
ent F
unds
(R
MB
100
mill
ion)
28 6
61.8
1 30
025
.77
45 3
53.6
1 83
971
.83
91 5
93.0
5 11
5 98
9.13
Turn
over
of
Secu
ritie
s In
vest
men
t Fu
nds
List
ed o
n Ex
chan
ges (
RM
B 1
00 m
illio
n)8
667.
36
12 5
62.0
4 19
904
.62
76 8
59.6
8 13
745
.89
98 0
51.8
9
Trad
ing
Volu
me
of F
utur
es (1
0 th
ousa
nd lo
ts)
145
052.
57
206
182.
30
250
585.
57
357
768.
26
413
781.
28
307
102.
71
Turn
over
of F
utur
es (R
MB
100
mill
ion)
1 71
1 26
9.35
2
674
662.
02
2 91
9 88
2.26
5
530
159.
69
1 95
6 33
9.00
1
878
925.
88
Sour
ce: T
he P
BC
, the
CSR
C, A
sset
Man
agem
ent A
ssoc
iatio
n of
Chi
na, C
hina
Cen
tral D
epos
itory
&.C
lear
ing
Co.
, Ltd
.
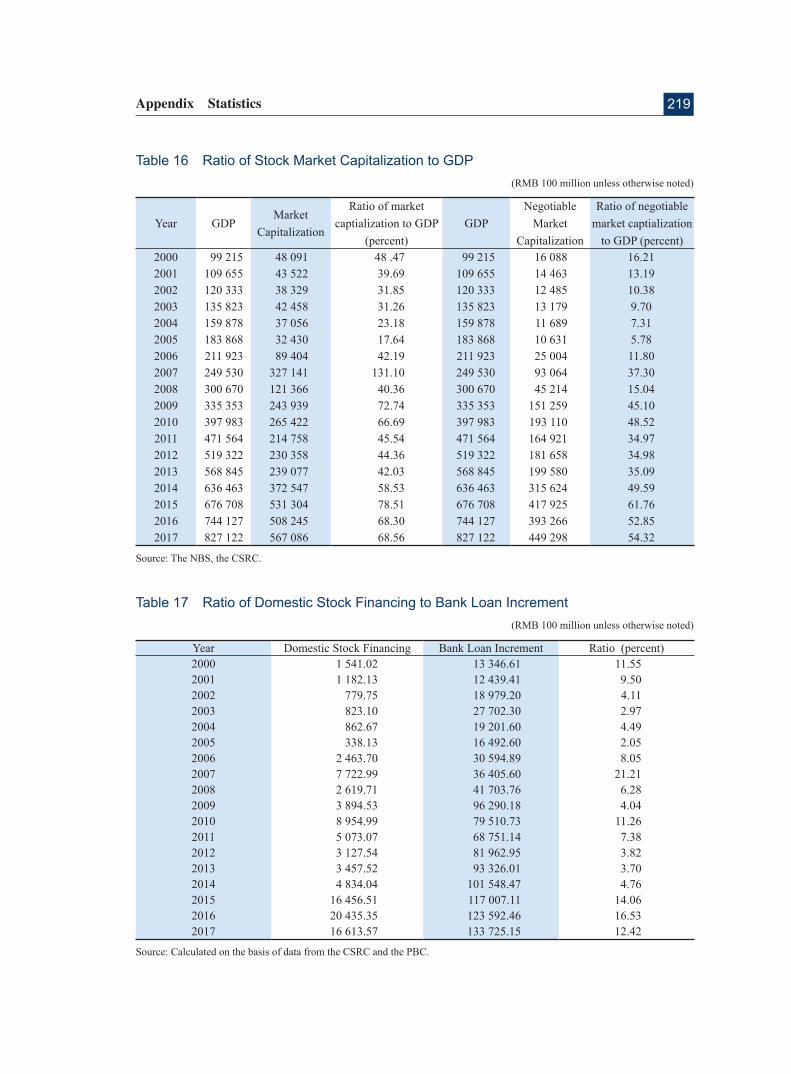
219Appendix Statistics
Year GDPMarket
Capitalization
Ratio of market captialization to GDP
(percent)GDP
Negotiable Market
Capitalization
Ratio of negotiable market captialization
to GDP (percent)2000 99 215 48 091 48 .47 99 215 16 088 16.21 2001 109 655 43 522 39.69 109 655 14 463 13.19 2002 120 333 38 329 31.85 120 333 12 485 10.38 2003 135 823 42 458 31.26 135 823 13 179 9.70 2004 159 878 37 056 23.18 159 878 11 689 7.31 2005 183 868 32 430 17.64 183 868 10 631 5.78 2006 211 923 89 404 42.19 211 923 25 004 11.80 2007 249 530 327 141 131.10 249 530 93 064 37.30 2008 300 670 121 366 40.36 300 670 45 214 15.04 2009 335 353 243 939 72.74 335 353 151 259 45.10 2010 397 983 265 422 66.69 397 983 193 110 48.52 2011 471 564 214 758 45.54 471 564 164 921 34.97 2012 519 322 230 358 44.36 519 322 181 658 34.98 2013 568 845 239 077 42.03 568 845 199 580 35.09 2014 636 463 372 547 58.53 636 463 315 624 49.59 2015 676 708 531 304 78.51 676 708 417 925 61.76 2016 744 127 508 245 68.30 744 127 393 266 52.85 2017 827 122 567 086 68.56 827 122 449 298 54.32
Table 16 Ratio of Stock Market Capitalization to GDP(RMB 100 million unless otherwise noted)
Source: The NBS, the CSRC.
Table 17 Ratio of Domestic Stock Financing to Bank Loan Increment(RMB 100 million unless otherwise noted)
Year Domestic Stock Financing Bank Loan Increment Ratio (percent) 2000 1 541.02 13 346.61 11.55 2001 1 182.13 12 439.41 9.50 2002 779.75 18 979.20 4.11 2003 823.10 27 702.30 2.97 2004 862.67 19 201.60 4.49 2005 338.13 16 492.60 2.05 2006 2 463.70 30 594.89 8.05 2007 7 722.99 36 405.60 21.21 2008 2 619.71 41 703.76 6.28 2009 3 894.53 96 290.18 4.04 2010 8 954.99 79 510.73 11.26 2011 5 073.07 68 751.14 7.38 2012 3 127.54 81 962.95 3.82 2013 3 457.52 93 326.01 3.70 2014 4 834.04 101 548.47 4.76 2015 16 456.51 117 007.11 14.06 2016 20 435.35 123 592.46 16.53 2017 16 613.57 133 725.15 12.42
Source: Calculated on the basis of data from the CSRC and the PBC.

220
Year
2011
2012
2013
2014
2015
2016
2017
Num
ber
of D
omes
tic L
iste
d C
ompa
nies
(A
sh
ares
, B sh
ares
)2
342
2 49
42
489
2 61
32
827
3 05
23
485
O
f Whi
ch: S
T C
ompa
nies
137
9657
4352
6669
Med
ium
/Sm
all-s
ized
Com
pani
es64
670
170
173
277
682
290
3
Gro
wth
Ent
erpr
ise
Boa
rd28
135
535
540
649
257
071
0
Num
ber o
f Dom
estic
Lis
ted
Fore
ign
Inve
stm
ent
Shar
es (B
shar
es)
108
107
106
104
101
100
100
O
f Whi
ch: S
T C
ompa
nies
124
04
2
Tota
l Iss
ued
Shar
es (1
00 m
illio
n sh
ares
)36
095
.52
38 3
95.0
0 40
569
.08
43 6
10.1
3 49
997
.26
55 8
20.5
0 53
746
.67
O
f Whi
ch:M
ediu
m/S
mal
l-siz
ed C
ompa
nies
1 94
3.50
2
410.
25
2 81
8.48
3
470.
59
4 85
3.94
4
465.
89
7 61
2.24
Gro
wth
Ent
erpr
ise
Boa
rd39
9.53
60
0.89
76
1.56
1
077.
26
1 84
0.45
2
630.
61
3 25
8.49
Tota
l Mar
ket C
apita
lizat
ion
of S
hare
s (R
MB
10
0 m
illio
n)21
4 75
8.10
230
357
.62
239
077.
19
372
546.
96
531
304.
20
508
245.
11
567
086.
08
O
f Whi
ch:M
ediu
m/S
mal
l-siz
ed C
ompa
nies
27 4
29.3
2 28
804
.03
37 1
63.7
4 51
058
.20
103
950.
47
98 1
13.9
7 10
3 99
2.02
Gro
wth
Ent
erpr
ise
Boa
rd7
433.
79
8 73
1.20
15
091
.98
21 8
50.9
5 55
916
.25
52 2
54.5
0 51
288
.82
Mar
ket
Cap
italiz
atio
n of
Neg
otia
ble
Shar
es
(RM
B 1
00 m
illio
n)16
4 92
1.30
181
658
.26
199
579.
54
315
624.
31
417
925.
40
393
266.
27
449
298.
14
O
f Whi
ch: M
ediu
m/ S
mal
l-siz
ed C
ompa
nies
14 3
43.5
2 16
244
.15
25 5
43.7
0 36
017
.99
69 7
37.0
4 64
088
.77
71 1
55.0
7
Gro
wth
Ent
erpr
ise
Boa
rd
2 50
4.08
3
335.
29
8 21
8.83
13
072
.90
32 0
78.6
8 30
536
.90
30 4
94.7
7
Volu
me
(100
mill
ion
shar
es)
Tota
l33
957
.55
32 8
81.0
6 48
372
.67
73 7
54.6
1 17
1 03
9.50
94
201
.17
87 7
80.8
4
Dai
ly A
vera
ge13
9.17
13
5.31
20
3.25
30
1.04
70
0.98
38
6.07
35
9.76
Med
ium
/Sm
all-s
ized
3 72
9.74
5
075.
85
8 24
5.92
11
313
.54
25 4
09.9
4 20
578
.14
17 4
09.0
0
Gro
wth
Ent
erpr
ise
Boa
rd76
1.69
1 47
8.14
3
035.
83
4 03
5.31
9
938.
88
9 50
9.90
8
830.
00
Tabl
e 18
S
tatis
tics
of S
tock
Mar
ket
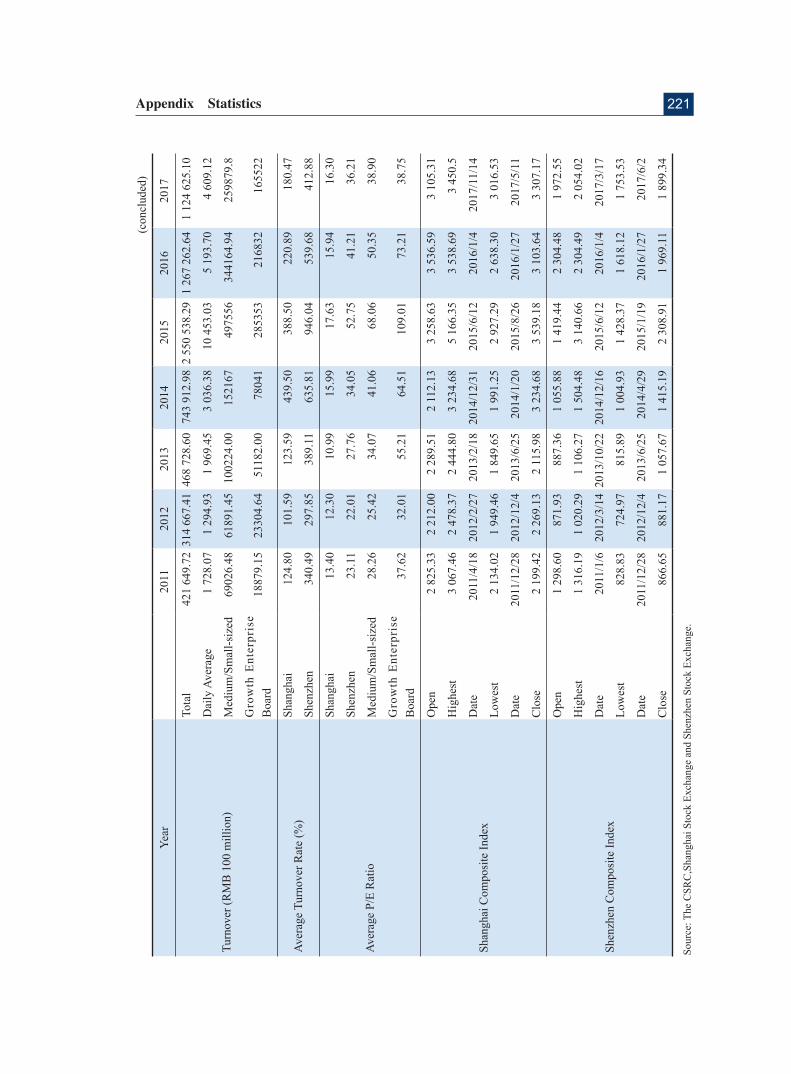
221Appendix Statistics
Year
2011
2012
2013
2014
2015
2016
2017
Turn
over
(RM
B 1
00 m
illio
n)
Tota
l42
1 64
9.72
314
667
.41
468
728.
60
743
912.
98 2
550
538
.29
1 26
7 26
2.64
1
124
625.
10
Dai
ly A
vera
ge1
728.
07
1 29
4.93
1
969.
45
3 03
6.38
10
453
.03
5 19
3.70
4
609.
12
Med
ium
/Sm
all-s
ized
6902
6.48
61
891.
45
1002
24.0
0 15
2167
49
7556
34
4164
.94
2598
79.8
Gro
wth
Ent
erpr
ise
Boa
rd18
879.
15
2330
4.64
51
182.
00
7804
1 28
5353
21
6832
16
5522
Aver
age
Turn
over
Rat
e (%
)Sh
angh
ai12
4.80
10
1.59
12
3.59
43
9.50
38
8.50
22
0.89
18
0.47
Shen
zhen
340.
49
297.
85
389.
11
635.
81
946.
04
539.
68
412.
88
Aver
age
P/E
Rat
io
Shan
ghai
13.4
0 12
.30
10.9
9 15
.99
17.6
3 15
.94
16.3
0
Shen
zhen
23.1
1 22
.01
27.7
6 34
.05
52.7
5 41
.21
36.2
1
Med
ium
/Sm
all-s
ized
28.2
6 25
.42
34.0
7 41
.06
68.0
6 50
.35
38.9
0
Gro
wth
Ent
erpr
ise
Boa
rd37
.62
32.0
1 55
.21
64.5
1 10
9.01
73
.21
38.7
5
Shan
ghai
Com
posi
te In
dex
Ope
n2
825.
33
2 21
2.00
2
289.
51
2 11
2.13
3
258.
63
3 53
6.59
3
105.
31
Hig
hest
3 06
7.46
2
478.
37
2 44
4.80
3
234.
68
5 16
6.35
3
538.
69
3 45
0.5
Dat
e20
11/4
/18
2012
/2/2
720
13/2
/18
2014
/12/
3120
15/6
/12
2016
/1/4
2017
/11/
14
Low
est
2 13
4.02
1
949.
46
1 84
9.65
1
991.
25
2 92
7.29
2
638.
30
3 01
6.53
Dat
e20
11/1
2/28
2012
/12/
420
13/6
/25
2014
/1/2
020
15/8
/26
2016
/1/2
720
17/5
/11
Clo
se2
199.
42
2 26
9.13
2
115.
98
3 23
4.68
3
539.
18
3 10
3.64
3
307.
17
Shen
zhen
Com
posi
te In
dex
Ope
n1
298.
60
871.
93
887.
36
1 05
5.88
1
419.
44
2 30
4.48
1
972.
55
Hig
hest
1 31
6.19
1
020.
29
1 10
6.27
1
504.
48
3 14
0.66
2
304.
49
2 05
4.02
Dat
e20
11/1
/620
12/3
/14
2013
/10/
2220
14/1
2/16
2015
/6/1
220
16/1
/420
17/3
/17
Low
est
828.
83
724.
97
815.
89
1 00
4.93
1
428.
37
1 61
8.12
1
753.
53
Dat
e20
11/1
2/28
2012
/12/
420
13/6
/25
2014
/4/2
920
15/1
/19
2016
/1/2
720
17/6
/2
Clo
se86
6.65
88
1.17
1
057.
67
1 41
5.19
2
308.
91
1 96
9.11
1
899.
34
(con
clud
ed)
Sour
ce: T
he C
SRC
,Sha
ngha
i Sto
ck E
xcha
nge
and
Shen
zhen
Sto
ck E
xcha
nge.
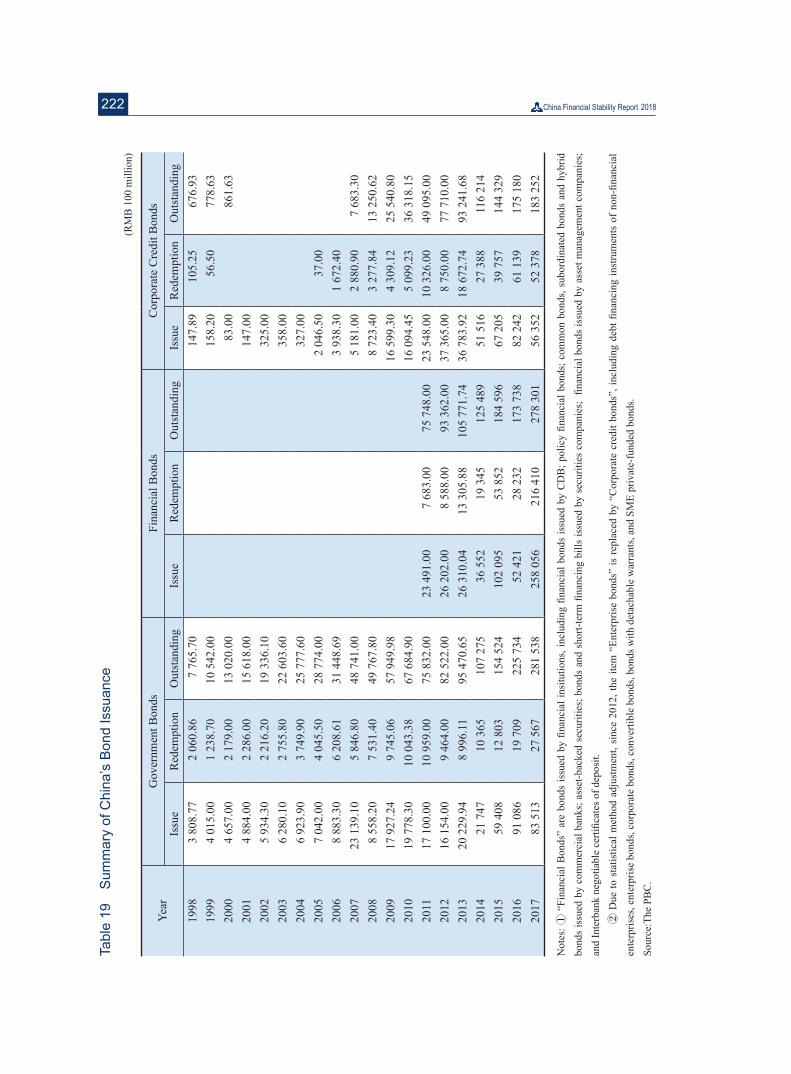
222
Year
Gov
ernm
ent B
onds
Fina
ncia
l Bon
dsC
orpo
rate
Cre
dit B
onds
Issu
eR
edem
ptio
nO
utst
andi
ngIs
sue
Red
empt
ion
Out
stan
ding
Issu
eR
edem
ptio
nO
utst
andi
ng19
983
808.
77
2 06
0.86
7
765.
70
147.
89
105.
25
676.
93
1999
4 01
5.00
1
238.
70
10 5
42.0
0 15
8.20
56
.50
778.
63
2000
4 65
7.00
2
179.
00
13 0
20.0
0 83
.00
861.
63
2001
4 88
4.00
2
286.
00
15 6
18.0
0 14
7.00
20
025
934.
30
2 21
6.20
19
336
.10
325.
00
2003
6 28
0.10
2
755.
80
22 6
03.6
0 35
8.00
20
046
923.
90
3 74
9.90
25
777
.60
327.
00
2005
7 04
2.00
4
045.
50
28 7
74.0
0 2
046.
50
37.0
0 20
068
883.
30
6 20
8.61
31
448
.69
3 93
8.30
1
672.
40
2007
23 1
39.1
0 5
846.
80
48 7
41.0
0 5
181.
00
2 88
0.90
7
683.
30
2008
8 55
8.20
7
531.
40
49 7
67.8
0 8
723.
40
3 27
7.84
13
250
.62
2009
17 9
27.2
4 9
745.
06
57 9
49.9
8 16
599
.30
4 30
9.12
25
540
.80
2010
19 7
78.3
0 10
043
.38
67 6
84.9
0 16
094
.45
5 09
9.23
36
318
.15
2011
17 1
00.0
0 10
959
.00
75 8
32.0
0 23
491
.00
7 68
3.00
75
748
.00
23 5
48.0
0 10
326
.00
49 0
95.0
0 20
1216
154
.00
9 46
4.00
82
522
.00
26 2
02.0
0 8
588.
00
93 3
62.0
0 37
365
.00
8 75
0.00
77
710
.00
2013
20 2
29.9
4 8
996.
11
95 4
70.6
5 26
310
.04
13 3
05.8
8 10
5 77
1.74
36
783
.92
18 6
72.7
4 93
241
.68
2014
21 7
47
10 3
65
107
275
36 5
52
19 3
45
125
489
51 5
16
27 3
88
116
214
2015
59 4
08
12 8
03
154
524
102
095
53 8
52
184
596
67 2
05
39 7
57
144
329
2016
91 0
86
19 7
09
225
734
52 4
21
28 2
32
173
738
82 2
42
61 1
39
175
180
2017
83 5
13
27 5
67
281
538
258
056
216
410
278
301
56 3
52
52 3
78
183
252
Tabl
e 19
S
umm
ary
of C
hina
’s B
ond
Issu
ance
(RM
B 1
00 m
illio
n)
Not
es: ①
“Fi
nanc
ial B
onds
” ar
e bo
nds
issu
ed b
y fin
anci
al in
situ
tions
, inc
ludi
ng fi
nanc
ial b
onds
issu
ed b
y C
DB
; pol
icy
finan
cial
bon
ds; c
omm
on b
onds
, sub
ordi
nate
d bo
nds
and
hybr
id
bond
s is
sued
by
com
mer
cial
ban
ks; a
sset
-bac
ked
secu
ritie
s; b
onds
and
sho
rt-te
rm fi
nanc
ing
bills
issu
ed b
y se
curit
ies
com
pani
es;
finan
cial
bon
ds is
sued
by
asse
t man
agem
ent c
ompa
nies
; an
d In
terb
ank
nego
tiabl
e ce
rtific
ates
of d
epos
it.
②
Due
to s
tatis
tical
met
hod
adju
stm
ent,
sinc
e 20
12, t
he it
em “
Ente
rpris
e bo
nds”
is r
epla
ced
by “
Cor
pora
te c
redi
t bon
ds”,
incl
udin
g de
bt fi
nanc
ing
inst
rum
ents
of
non-
finan
cial
en
terp
rises
, ent
erpr
ise
bond
s, co
rpor
ate
bond
s, co
nver
tible
bon
ds, b
onds
with
det
acha
ble
war
rant
s, an
d SM
E pr
ivat
e-fu
nded
bon
ds.
Sour
ce:T
he P
BC
.
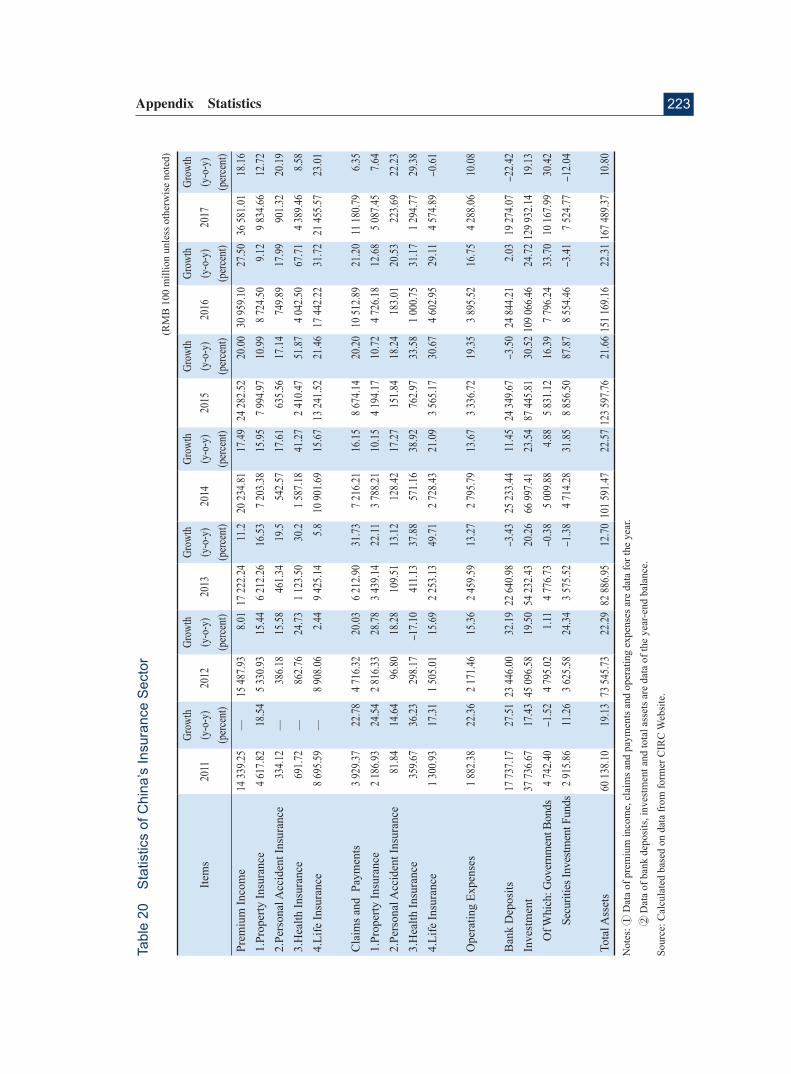
223Appendix Statistics
Tabl
e 20
S
tatis
tics
of C
hina
’s In
sura
nce
Sec
tor
(RM
B 1
00 m
illio
n un
less
oth
erw
ise
note
d)
Item
s20
11Gr
owth
(y
-o-y
) (p
erce
nt)
2012
Grow
th
(y-o
-y)
(per
cent
)20
13Gr
owth
(y
-o-y
) (p
erce
nt)
2014
Grow
th
(y-o
-y)
(per
cent
)20
15Gr
owth
(y
-o-y
) (p
erce
nt)
2016
Grow
th
(y-o
-y)
(per
cent
)20
17Gr
owth
(y
-o-y
) (p
erce
nt)
Prem
ium
Inco
me
14 33
9.25
—15
487.9
3 8.0
1 17
222.2
4 11
.220
234.8
1 17
.49
24 28
2.52
20.00
30
959.1
0 27
.50
36 58
1.01
18.16
1.
Prop
erty
Insu
ranc
e4 6
17.82
18
.54
5 330
.93
15.44
6 2
12.26
16
.53
7 203
.38
15.95
7 9
94.97
10
.99
8 724
.50
9.12
9 834
.66
12.72
2.
Pers
onal
Acc
iden
t Ins
uran
ce33
4.12
—38
6.18
15.58
46
1.34
19.5
542.5
7 17
.61
635.5
6 17
.14
749.8
9 17
.99
901.3
2 20
.19
3.H
ealth
Insu
ranc
e69
1.72
—86
2.76
24.73
1 1
23.50
30
.21 5
87.18
41
.27
2 410
.47
51.87
4 0
42.50
67
.71
4 389
.46
8.58
4.Li
fe In
sura
nce
8 695
.59
—8 9
08.06
2.4
4 9 4
25.14
5.8
10 90
1.69
15.67
13
241.5
2 21
.46
17 44
2.22
31.72
21
455.5
7 23
.01
Cla
ims a
nd P
aym
ents
3 929
.37
22.78
4 7
16.32
20
.03
6 212
.90
31.73
7 2
16.21
16
.15
8 674
.14
20.20
10
512.8
9 21
.20
11 18
0.79
6.35
1.Pr
oper
ty In
sura
nce
2 186
.93
24.54
2 8
16.33
28
.78
3 439
.14
22.11
3 7
88.21
10
.15
4 194
.17
10.72
4 7
26.18
12
.68
5 087
.45
7.64
2.Pe
rson
al A
ccid
ent I
nsur
ance
81.84
14
.64
96.80
18
.28
109.5
1 13
.12
128.4
2 17
.27
151.8
4 18
.24
183.0
1 20
.53
223.6
9 22
.23
3.H
ealth
Insu
ranc
e35
9.67
36.23
29
8.17
-17.1
0 41
1.13
37.88
57
1.16
38.92
76
2.97
33.58
1 0
00.75
31
.17
1 294
.77
29.38
4.
Life
Insu
ranc
e1 3
00.93
17
.31
1 505
.01
15.69
2 2
53.13
49
.71
2 728
.43
21.09
3 5
65.17
30
.67
4 602
.95
29.11
4 5
74.89
-0
.61
Ope
ratin
g Ex
pens
es1 8
82.38
22
.36
2 171
.46
15.36
2 4
59.59
13
.27
2 795
.79
13.67
3 3
36.72
19
.35
3 895
.52
16.75
4 2
88.06
10
.08
Ban
k D
epos
its17
737.1
7 27
.51 2
3 446
.00
32.19
22 6
40.98
-3
.43
25 23
3.44
11.45
24
349.6
7 -3
.50
24 84
4.21
2.03
19 27
4.07
-22.4
2 In
vest
men
t37
736.6
7 17
.43 4
5 096
.58
19.50
54 2
32.43
20
.26
66 99
7.41
23.54
87
445.8
1 30
.52 1
09 06
6.46
24.72
129
932.1
4 19
.13
O
f Whi
ch: G
over
nmen
t Bon
ds4 7
42.40
-1
.52
4 795
.02
1.11
4 776
.73
-0.38
5 0
09.88
4.8
8 5 8
31.12
16
.39
7 796
.24
33.70
10
167.9
9 30
.42
Se
curit
ies I
nves
tmen
t Fun
ds2 9
15.86
11
.26
3 625
.58
24.34
3 5
75.52
-1
.38
4 714
.28
31.85
8 8
56.50
87
.87
8 554
.46
-3.41
7 5
24.77
-1
2.04
Tota
l Ass
ets
60 13
8.10
19.13
73 5
45.73
22
.29 8
2 886
.95
12.70
101
591.4
7 22
.57 1
23 59
7.76
21.66
151
169.1
6 22
.31 1
67 48
9.37
10.80
Not
es: ①
Dat
a of
pre
miu
m in
com
e, c
laim
s and
pay
men
ts a
nd o
pera
ting
expe
nses
are
dat
a fo
r the
yea
r.
②
Dat
a of
ban
k de
posi
ts, i
nves
tmen
t and
tota
l ass
ets a
re d
ata
of th
e ye
ar-e
nd b
alan
ce.
Sour
ce: C
alcu
late
d ba
sed
on d
ata
from
form
er C
IRC
Web
site
.
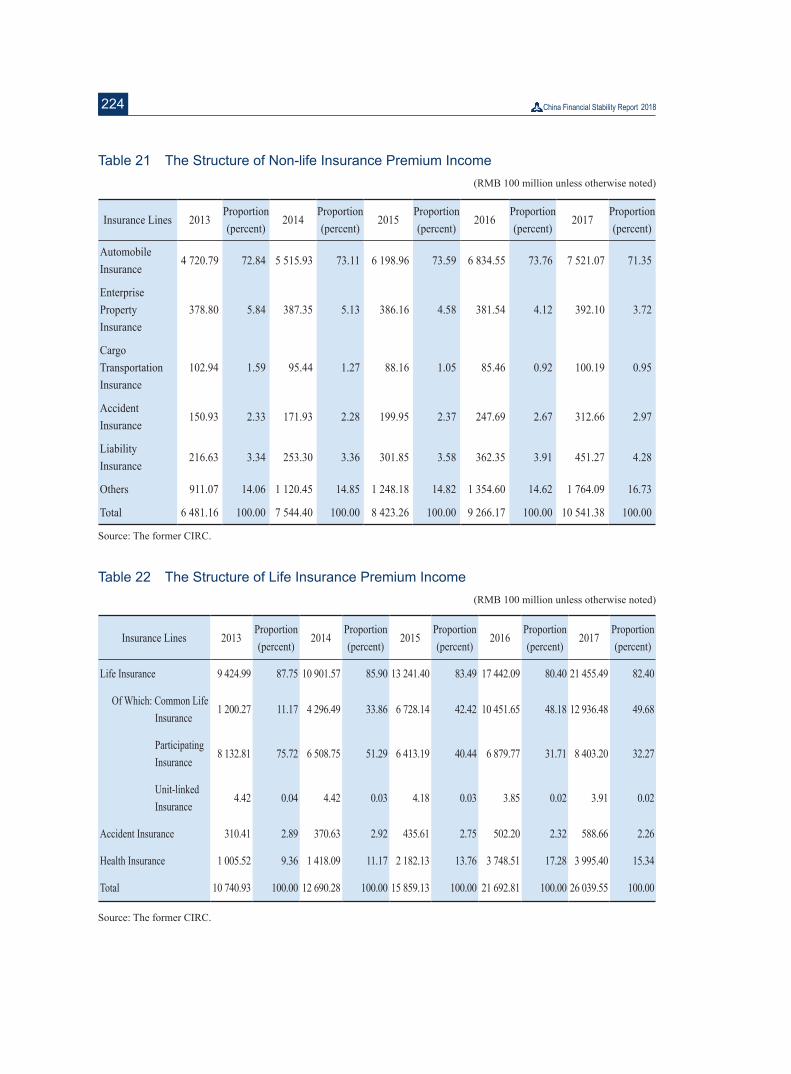
224
Table 21 The Structure of Non-life Insurance Premium Income(RMB 100 million unless otherwise noted)
Insurance Lines 2013Proportion (percent)
2014Proportion (percent)
2015Proportion (percent)
2016Proportion (percent)
2017Proportion (percent)
Automobile Insurance
4 720.79 72.84 5 515.93 73.11 6 198.96 73.59 6 834.55 73.76 7 521.07 71.35
Enterprise Property Insurance
378.80 5.84 387.35 5.13 386.16 4.58 381.54 4.12 392.10 3.72
Cargo Transportation Insurance
102.94 1.59 95.44 1.27 88.16 1.05 85.46 0.92 100.19 0.95
Accident Insurance
150.93 2.33 171.93 2.28 199.95 2.37 247.69 2.67 312.66 2.97
Liability Insurance
216.63 3.34 253.30 3.36 301.85 3.58 362.35 3.91 451.27 4.28
Others 911.07 14.06 1 120.45 14.85 1 248.18 14.82 1 354.60 14.62 1 764.09 16.73
Total 6 481.16 100.00 7 544.40 100.00 8 423.26 100.00 9 266.17 100.00 10 541.38 100.00
Source: The former CIRC.
Table 22 The Structure of Life Insurance Premium Income(RMB 100 million unless otherwise noted)
Insurance Lines 2013Proportion (percent)
2014Proportion (percent)
2015Proportion (percent)
2016Proportion (percent)
2017Proportion (percent)
Life Insurance 9 424.99 87.75 10 901.57 85.90 13 241.40 83.49 17 442.09 80.40 21 455.49 82.40
Of Which: Common Life Insurance
1 200.27 11.17 4 296.49 33.86 6 728.14 42.42 10 451.65 48.18 12 936.48 49.68
Participating Insurance
8 132.81 75.72 6 508.75 51.29 6 413.19 40.44 6 879.77 31.71 8 403.20 32.27
Unit-linked Insurance
4.42 0.04 4.42 0.03 4.18 0.03 3.85 0.02 3.91 0.02
Accident Insurance 310.41 2.89 370.63 2.92 435.61 2.75 502.20 2.32 588.66 2.26
Health Insurance 1 005.52 9.36 1 418.09 11.17 2 182.13 13.76 3 748.51 17.28 3 995.40 15.34
Total 10 740.93 100.00 12 690.28 100.00 15 859.13 100.00 21 692.81 100.00 26 039.55 100.00
Source: The former CIRC.
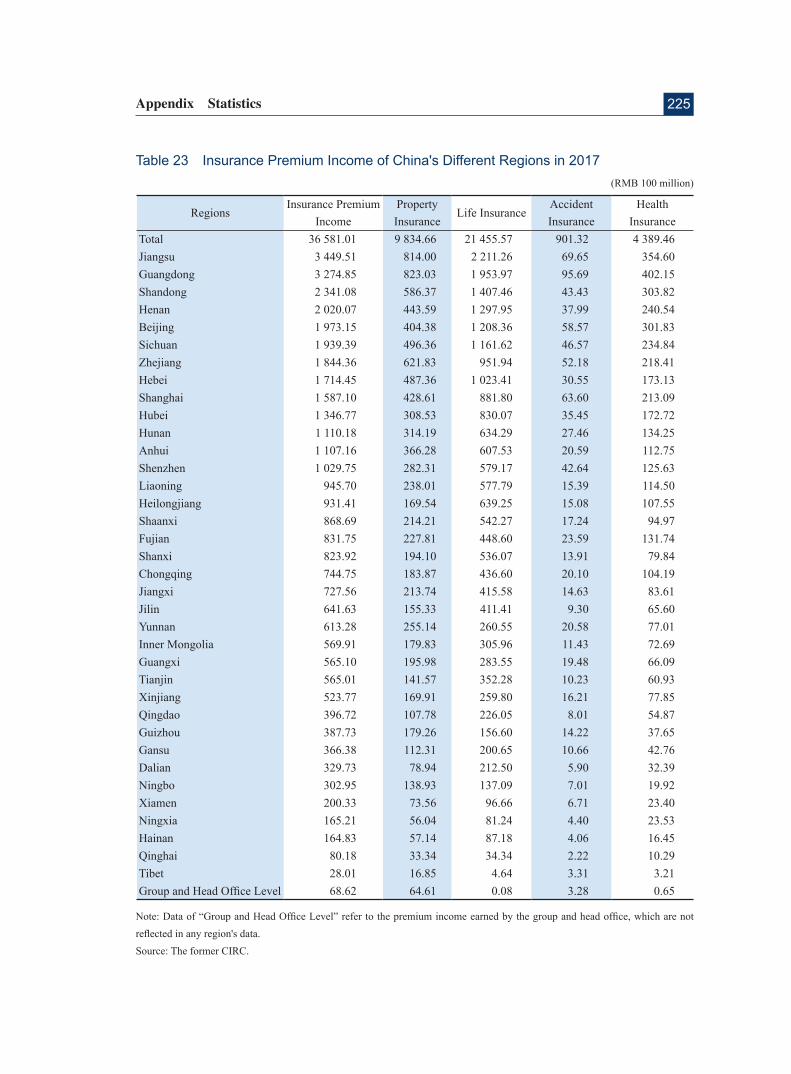
225Appendix Statistics
RegionsInsurance Premium
IncomeProperty Insurance
Life InsuranceAccident Insurance
Health Insurance
Total 36 581.01 9 834.66 21 455.57 901.32 4 389.46 Jiangsu 3 449.51 814.00 2 211.26 69.65 354.60 Guangdong 3 274.85 823.03 1 953.97 95.69 402.15 Shandong 2 341.08 586.37 1 407.46 43.43 303.82 Henan 2 020.07 443.59 1 297.95 37.99 240.54 Beijing 1 973.15 404.38 1 208.36 58.57 301.83 Sichuan 1 939.39 496.36 1 161.62 46.57 234.84 Zhejiang 1 844.36 621.83 951.94 52.18 218.41 Hebei 1 714.45 487.36 1 023.41 30.55 173.13 Shanghai 1 587.10 428.61 881.80 63.60 213.09 Hubei 1 346.77 308.53 830.07 35.45 172.72 Hunan 1 110.18 314.19 634.29 27.46 134.25 Anhui 1 107.16 366.28 607.53 20.59 112.75 Shenzhen 1 029.75 282.31 579.17 42.64 125.63 Liaoning 945.70 238.01 577.79 15.39 114.50 Heilongjiang 931.41 169.54 639.25 15.08 107.55 Shaanxi 868.69 214.21 542.27 17.24 94.97 Fujian 831.75 227.81 448.60 23.59 131.74 Shanxi 823.92 194.10 536.07 13.91 79.84 Chongqing 744.75 183.87 436.60 20.10 104.19 Jiangxi 727.56 213.74 415.58 14.63 83.61 Jilin 641.63 155.33 411.41 9.30 65.60 Yunnan 613.28 255.14 260.55 20.58 77.01 Inner Mongolia 569.91 179.83 305.96 11.43 72.69 Guangxi 565.10 195.98 283.55 19.48 66.09 Tianjin 565.01 141.57 352.28 10.23 60.93 Xinjiang 523.77 169.91 259.80 16.21 77.85 Qingdao 396.72 107.78 226.05 8.01 54.87 Guizhou 387.73 179.26 156.60 14.22 37.65 Gansu 366.38 112.31 200.65 10.66 42.76 Dalian 329.73 78.94 212.50 5.90 32.39 Ningbo 302.95 138.93 137.09 7.01 19.92 Xiamen 200.33 73.56 96.66 6.71 23.40 Ningxia 165.21 56.04 81.24 4.40 23.53 Hainan 164.83 57.14 87.18 4.06 16.45 Qinghai 80.18 33.34 34.34 2.22 10.29 Tibet 28.01 16.85 4.64 3.31 3.21 Group and Head Office Level 68.62 64.61 0.08 3.28 0.65
Table 23 Insurance Premium Income of China's Different Regions in 2017(RMB 100 million)
Note: Data of “Group and Head Office Level” refer to the premium income earned by the group and head office, which are not reflected in any region's data.Source: The former CIRC.
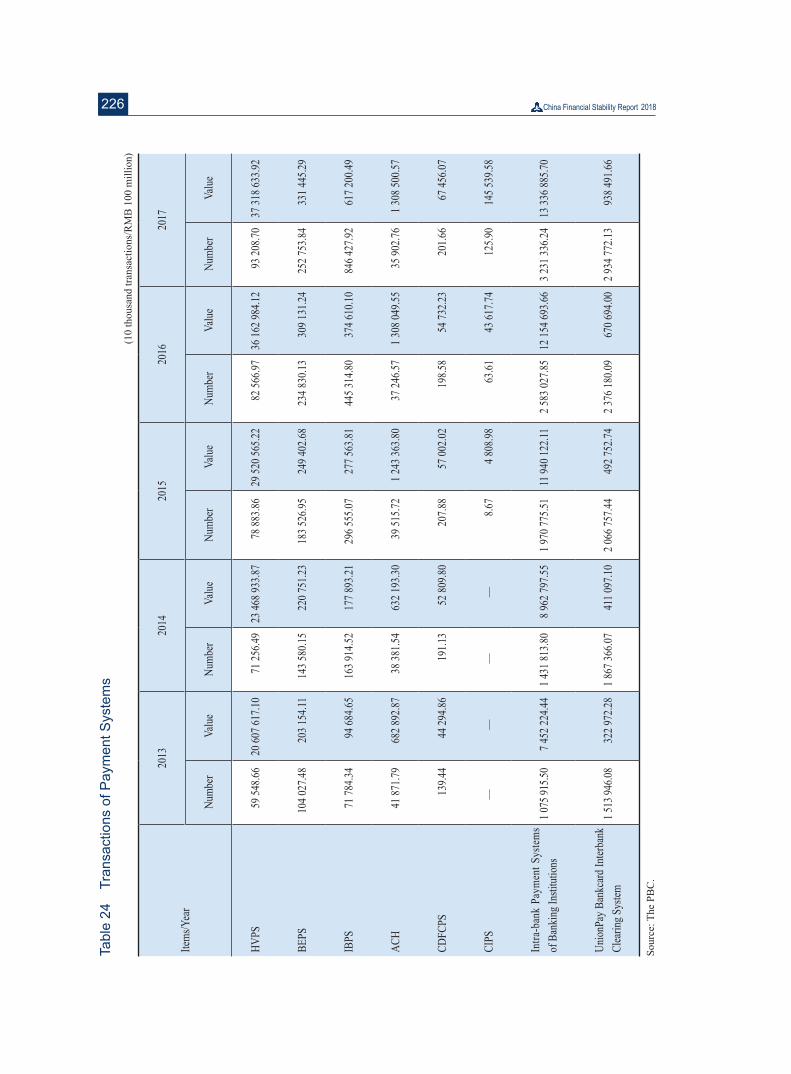
226
Item
s/Yea
r
2013
20
14
2015
20
16
2017
Num
ber
Valu
eNu
mbe
rVa
lue
Num
ber
Valu
eNu
mbe
rVa
lue
Num
ber
Valu
e
HVPS
59 54
8.66
20 60
7 617
.10
71 25
6.49
23 46
8 933
.87
78 88
3.86
29 52
0 565
.22
82 56
6.97
36 16
2 984
.12
93 20
8.70
37 31
8 633
.92
BEPS
104 0
27.48
20
3 154
.11
143 5
80.15
22
0 751
.23
183 5
26.95
24
9 402
.68
234 8
30.13
30
9 131
.24
252 7
53.84
33
1 445
.29
IBPS
71 78
4.34
94 68
4.65
163 9
14.52
17
7 893
.21
296 5
55.07
27
7 563
.81
445 3
14.80
37
4 610
.10
846 4
27.92
61
7 200
.49
ACH
41 87
1.79
682 8
92.87
38
381.5
4 63
2 193
.30
39 51
5.72
1 24
3 363
.80
37 24
6.57
1 30
8 049
.55
35 90
2.76
1 30
8 500
.57
CDFC
PS 13
9.44
44 29
4.86
191.1
3 52
809.8
0 20
7.88
57 00
2.02
198.5
8 54
732.2
3 20
1.66
67 45
6.07
CIPS
—
—
—
—
8.67
4
808.9
8 63
.61
43 61
7.74
125.9
0 14
5 539
.58
Intra
-ban
k Pa
ymen
t Sys
tems
of B
anki
ng In
stitu
tions
1 07
5 915
.50
7 45
2 224
.44
1 43
1 813
.80
8 96
2 797
.55
1 97
0 775
.51
11 94
0 122
.11
2 58
3 027
.85
12 15
4 693
.66
3 23
1 336
.24
13 33
6 885
.70
Unio
nPay
Ban
kcar
d In
terba
nk
Clea
ring S
ystem
1 51
3 946
.08
322 9
72.28
1
867 3
66.07
41
1 097
.10
2 06
6 757
.44
492 7
52.74
2
376 1
80.09
67
0 694
.00
2 93
4 772
.13
938 4
91.66
Tabl
e 24
Tr
ansa
ctio
ns o
f Pay
men
t Sys
tem
s(1
0 th
ousa
nd tr
ansa
ctio
ns/R
MB
100
mill
ion)
Sour
ce: T
he P
BC
.