Embed Size (px)
Citation preview

"Financiamiento en Salud y Protección Financiera en
América Latina”
"Financiamiento en Salud y Protección Financiera en
América Latina”
Ciudad de México15 al 18 de octubre, 2007
Ciudad de México15 al 18 de octubre, 2007
Plan de trabajo:El caso de México
Felicia Marie KnaulRebeca Wong
Hector ArreolaOscar Mendez
Christian Norton
Plan de trabajo:El caso de México
Felicia Marie KnaulRebeca Wong
Hector ArreolaOscar Mendez
Christian Norton

Líneas de investigación sobre México en el proyecto IDRC
Aociación entre aseguramiento en salud y el Seguro Popular con el empobrecimiento por gastos en salud: Un modelo de pareo por puntaje de propensión
3. Análisis del sistema de salud y su financiamiento
a. general y comparativosb. especificos a México - 2
5. Entrenamineto y materiales de los cursos
4. Policy briefs
c. Documento sobre serie de tiempo y panel Mexicob. Ajuste temporal de los datos a través de un estudio tipo panel
a. El sistema de salud en México de donde viene y hacia donde va: Evolución de la cobertura de los diferentes subsistemas de salud; enfocado en la equidad de la ampliación de la cobertura y los retos a futuro (próximos pasos en la reforma)
a.i. Medición y actualización de los diferentes indicadores; serie de tiempo
2. Los determinantes del gastoscatastrófico y empobrecedor
d. Documento resumen general de determinantes
1. Avances en la medición de losindicadores principales
d. Documento general sobre metodología y medición
Líneas de Investigación
e. Documento general sobre niveles de gasto catastrófico y empobrecedor
a.ii. Implicaciones del gasto en salud sobre la brecha de pobreza
a. general y comparativos
b. Remesas y gasto en saludc. Políticas públicas para disminuir los gastos catastróficos y empobrecedores en salud
a. Envejecimiento y gasto en salud, proyeccion
a. Serie de tiempo, ENIGH 1992- 2006
Estudios específicos

Outline
1. Mexico: Complex, overlapping transitionsThe Health System: financing and reform
2. Trends in insurance coverage and challenges and next steps for reform3. Data and methods4 Results
Catastrophic and impoverishing health spendingTrends: 1992-2006Determinants: 1992-2005, 2006
Future research

New challenges are associated with the rapid advance of profound demographic and epidemiologic transition
Over 50 years, Mexico will complete an aging process that took two centuries in most European countries.
In 2050, one-in-four Mexicans will be 65 or over – a four-fold increase.
Costly, chronic, non-communicable illnesses now dominate the burden
of disease.
Costly, chronic, non-communicable illnesses now dominate the burden
of disease.
1955 2005
72%
22%
6%
73%
17%10%
Communicable
Chronic, Non-communicable
Injuries
Source: Sepúlveda et al. ,2006

Outline
1. Mexico: Complex, overlapping transitionsThe Health System: financing and reform
2. Trends in insurance coverage and challenges and next steps for reform3. Data and methods4 Results
Catastrophic and impoverishing health spendingTrends: 1992-2006Determinants: 1992-2005, 2006
Future research

Mexico Pre-Reform: Insurance Coverage was highly fragmented, inequitable and regressive
Source: Authors´ estimates using data from the 2000 Census; ENIGH, 2000; and Salud: México 2002, Ssa (2003).
Distribution of federal funds:-2.4 times more for the insured
Insurance coverage by quintile
50%
100%
I II IV V TOTALIIIUninsured Insured
55-60% uninsured

Reliance on OOP in Mexico is high at 50%+; especially given GDP
FranceGermany
PanamaUruguay
ItalyColombia SpainBolivia Costa RicaArgentinaVenezuelaPeru
Brazil Korea
ThailandMalaysiaParaguay
Ethiopia El Salvador
Congo ChinaVietnam
India
20
40
60
80
Chile
MexicoLAC
OECD
GDP per capita vs. OOP as a % of health system finance
GDP per capita
% O
OP
fin
ance
d
Source: Authors own estimations based on data from WHO 2006

=1.5 million families per trimester=~?? 4 million per year ??
Insured: 2.2%Uninsured: 9.6%
Poorest quintile: 19.6%
Quintiles 2-5: 3.1%
Catastrophe (30%) and Impoverishmentfrom health spending, 2000
Source: authors own estimations based on data from the ENIGH 2000
Catastrophic, 30%: 3.4%Impoverishment ($US1): 3.8%
Catastrophic and/or impoverishment: 6.3%

THE VISION BEHIND THE 2003 REFORM:ELIMINATE SEGMENTATION IN ACCESS TO HEALTH INSURANCE BY GENERATING A SYSTEM FOR SOCIAL PROTECTION IN HEALTH THAT INCLUDES POPULAR HEALTH INSURANCE FOR FAMILIES EXCLUDED FROM SOCIAL SECURITY
Social Security
Public and private, Formal sector workers
and their families: ~50% of population
Ministry of Health with residual
funding
Poor, informal sector, non-salaried,
rural areas: ~ 50% of population
1943
2001/3: Pilot of PHI2003: LawJan. 1, 2004: SSPH 2010: Universal coverage with Seguro Popular
System for Social
Protection in
Health
SeguroPopular
Frenk et al., 2004.

Increase in health spending in Mexico as a % of GDP
7.06.5
5.1
0
1
2
3
4
5
6
7
2000 2001 2002 2003 2004 2005 2006 2010
% G
DP
Fuente: Secretaría de Salud. Salud: México 2001-2005. México, D.F.: Secretaría de Salud, 2006.

Outline
1. Mexico: Complex, overlapping transitionsThe Health System: financing and reform
2. Trends in insurance coverage and challenges and next steps for reform3. Data and methods4 Results
Catastrophic and impoverishing health spendingTrends: 1992-2006Determinants: 1992-2005, 2006
Future research

Householdsaffiliated toSeguro Popular:% of families w/o social securityand millions offamilies
Increase in Seguro Popular coverage andexpansion of package of services
# of coveredservices
2006Pilot, 2003 2004
~100%
2007* - 20102005
104 113146
249
2003 20062004
262
20072005
Source: Comision Nacional de Protección Social en Salud, 2007; and UNSANUT, 2006.* Data until the first trimester of 2007.
3%9%
28%19%
29%
0.6 1.5
3.5
mill
ion
5.1
mill
ion
5.2
mill
ion
~18.
3 m
illio
nhh
~

Evolución de la Cobertura en el Aseguramiento por Institución
Fuente: INSP, Encuesta Nacional de Salud, 2000; Encuesta Nacional de Salud y Nutrición, 2006.
2000
32%60%
NO ASEGURADOS
IMSS2005-2006
28%53%
11%SEGURO
POPULAR

% of population without coverage
Censo 2000
Conteo 2005
Covered
Health insurance coverage increased between 2000-2005 in allregions and in almost all States, due, to a large extent, to theadvances of Seguro Popular
66-82% 49-65%29-49%
0
15
45
75
Sout
h
Nor
th
Sout
heas
t
Cen
ter
D.FCenso 2000
Conteo 2005
Nat
iona
l
Source: Aouthrs own estimations based on data from INEGI 2000, 2005

Insurance coverage by institution and level ofmarginalization, 2000 & 2005
SEG.POP OTHERS PEMEXISSSTE IMSS
0
20
40
60
2000 2005 2000 2005 2000 2005 2000 2005 2000 2005 2000 2005
Very high High Medium Low Very low Total
%
Source: Authors own estimations based on data from INEGI 2000, 2005

0
20
60
100
IMSS ISSSTE
SEG.POP PRIVADOS
78%87%
97% 100% 100%
% OF MUNICIPALITIES WITH AT LEAST ONE FAMILY W/ IMSS AND/OR SEGURO POPULAR
%
Municipalities with insured population, by level of´poverty´ and institution, 2005
Source: Authors own estimations based on data from INEGI 2005.
Very high High Medium Low Very low Total
92%

Challenges and next steps in the reform
• Coverage: rural areas, migrants (cross-border)
• Ageing, chronic illness: expanding coverage and package
• Affiliation: higher-income groups• At the system level:
– Prestación plural: reforms in IMSS– Payment and contracting mechanisms

Outline
1. Mexico: Complex, overlapping transitionsThe Health System: financing and reform
2. Trends in insurance coverage and challenges and next steps for reform3. Data and methods4 Results
Catastrophic and impoverishing health spendingTrends: 1992-2006Determinants: 1992-2005, 2006
Future research

Data: Data: National Household Income and National Household Income and Expenditure Surveys, 1992 to 2005Expenditure Surveys, 1992 to 2005
Households in the sampleYear
10,95210,95210,10810,10817,16717,167
22,59522,595
10,50310,50312,81512,81514,04214,042
199819982000200020022002
20042004
1994199419921992
19961996
20052005
Economic Crisis
Pilot of Popular Insurance (PHI)
New health insurance law goes into effect 23,17423,174
20062006 20,87520,875

Indicators:
1.Impoverishment (absolute) from healthspending:
cross the $US 1 poverty linelive below the poverty line and becomefurther impoverished
2.Catastrophic spending (relative):spend a high % of disposible income(20%, 30%, 40%; net of food)
WHO, 2000.3.Deepening of poverty: gaps
(Van Doorslaer, Wagstaff, ODonnell)

Methodology:1. DESCRIPTIVE AND TIME SERIES ANALYSIS:
(we are updating the series)Trends 1992-2006Poverty gaps: consecutive years, time periods
2. REGRESsION ANALYSIS, POOLED CROSS-SECTION: Dependent variables:
If hh spends 20, 30 or 40% (logit)If hh is impoverished (logit)Health spending as a % of disposable income (tobit)
Independent variables:• HH: family composition (elders & children), remittances• State: % coverage Seguro Popular
Controls: social security coverage (family and state), educacionand gender, family wealth, time and state dummies

Methodology:3.Propensity Score Matching and IV
-(Remittances: pooled time series)
-What is the ´impact´ of health insurancecoverage on catastrophic and impoverishinghealth spending
-SP can only be identified in 2006
Note: SP can only be identified in2006 (and 2004)

Outline
1. Mexico: Complex, overlapping transitionsThe Health System: financing and reform
2. Data and methods3. Results
Catastrophic and impoverishing health spendingTrends: 1992-2005Determinants: 1992-2005
Future research4. Trends in insurance coverage and challenges and next steps for reform

Impoverishment
0
5
10
15 Impoverishment and/or cat´c 20%
Cat´c 40%
Cat´c 30%
Cat´c 20%
1992 1994 1996 1998 2000 2002 20042005
2006
% o
fhou
seho
lds
Trends in catastrophic and impoverishing health spending (1992-2006)
Fuente: Estimaciones propias basadas en información de la ENIGH 1992 a 2006
Trends in Catastrophic andImpoverishing Health Spending(1992 a 2006)
EmpobrecedorEmpobrecedor y/o catastrófico 30%
Catastrófico 30%
0
5
10
15
1992 1994 1996 1998 2000 2002 2004 2006
% d
e ho
gare
s
2005
MORE CATASTROPHICAS OF 2002

Catastrophic health expenditure in familieswith and without remittances, by quintile
With remittances Without remittances
Source: Authors own estimations based on data from the ENIGH 1992-2005
•5.6% of families receive income transfers;• these families account for about 9.7% of total
out-of-pocket health spending
Empobrecimiento absoluto
0
5
10
QUINTILE I QUINTILE V TOTAL QUINTILES II a V TOTAL0
5
10
QUINTILE I
Empobrecimiento relativo

Elderly >65 Children <5,elderly >65 Children > 5
Neither elderly nor children ALL
Catastrophic health expenditure by household composition, (1992-2005)
10
20
30Impoverishment
01992 1994 1996 1998 2000 2002 2004 2005
Catastrophic, 30%
0
5
10
15
1992 1994 1996 1998 2000 2002 2004 2005

Trends in Catastrophic and ImpoverishingHealth Spending by insurance status(1992 a 2006)
Catastrófico EmpobrecedorCatastrófico
y/o empobrecedor
Insured Seguro Popular anduninsurd
0
4
8
12
1992 1996 2000 2004 2006
0
4
8
12
1992 1996 2000 20042005
20062005
0%
2%
4%
6%
Catastrófico Empobrecedor Catastrófico y/oempobrecedor
Uninsured
Seguro PopularSocial Securityl
2006

Differences Post vs Pre1992……2005
Differences between years1992 - 19941994 - 19961996 - 19981998 - 20002000 - 20022002 – 20042004 – 20052000 - 20052002 - 2005
Differences between Periods(1998 - 2000) - (2000-2002)
(1998 - 2000) - (2002-2004)
(2000 - 2002) - (2002-2004)
(1992 - 1994) - (2002-2004)
(1992 - 1998) - (2002-2004)
(2000 - 2002) - (2002-2004)
(2000 - 2002) - (2004-2005)
Note: The values in bold represent significant differences with a 90% confidence level/1 Poverty line defined as one dollar (PPP) per day per capita
Poverty Gap before and after health expenditure (hasta 2005)/1
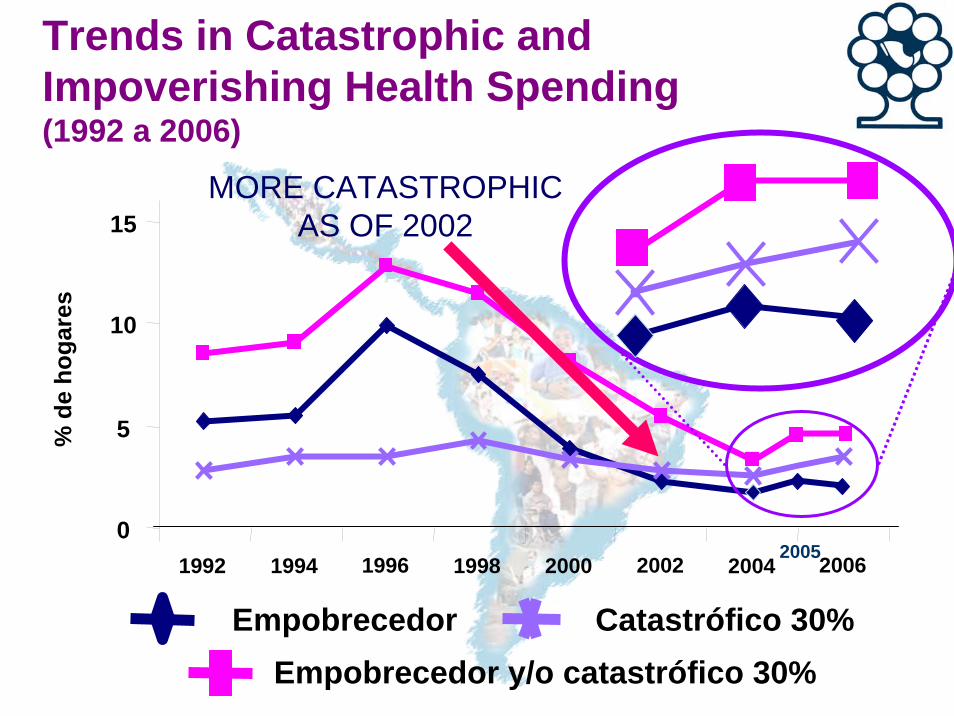
Regression analysis: probability that a household suffers catastrophic orimpoverishing expenditure (1992 - 2005)
Controles Adicionales: género y educación del jefe del hogar, año y variables dicotómicas de año y estado
OOP como % de ID
Impoverishing
20% 30% 40%Catastrophic
Independent:Household:
Composition:• >65• >65 and < 5 • < 5
RemittancesSocial Security
Residence:15,000 - 100,000 hab.2500 – 14,999 hab.
< 2500 hab. (rural)
State:
Seguro Popular-STATECoverage of IMSS
0.770.680.380.350.05
0.270.430.47
-0.570.58
0.940.820.460.33
-0.52
0.330.490.62
-0.610.39
1.070.870.460.37
-0.84
0.370.510.64
-1.100.58
0.311.230.88
-0.100.49
0.330.650.74
-0.660.05
0.030.040.020.03
-0.03
0.010.020.02
-0.02-0.01
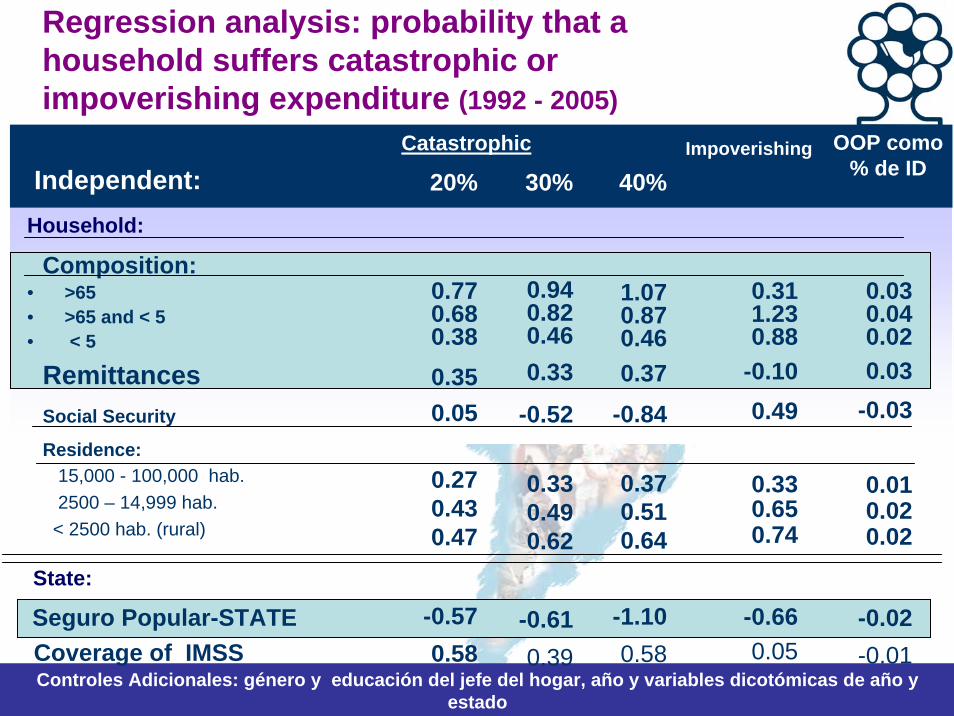
Predicted probilities (to 2005):
Social security:
rural:
Family composition:> 65 < 5 and > 65< 5
5%
4.5%
3.2%
3.5%
3.1%
2.2%
5.4%
4.8%
3.4%
Base 2.2% Observed % in 2005 3%Change in the probability of catastrophic (30%)
Projecteddemographicchange 2025
3.8%

Gasto catastrófico
Trends in ageing and catastrophicspending in Mexico (2002 a 2006)
2
3
% d
e ho
gare
s
4
2002 2004 2005 2006
Catastrophicwith without
ageing
2002 2006Annual
growth rate
TotalUninsuredw/ Seguro Popularw/ Seguridad Social
19%23%
12%
20%26%23%12%
8%9%
3%
% households with > 65

Resultados: Análisis sobre determinantescorriguiendo endogeneidad de Remesas
• Con variables instrumentales– Instrumento: Si hogar radica en un municipio expulsor– En los modelos logit de gasto catastrófico (20,30 y
40%, de gasto empobrecedor) y el tobit sobre contribución financiera del hogar los resultados son similares
• Variables estadísticamente significativas– Composición familiar (Viejos y niños) (+)– Remesas (+)– Familia cubierta por la seguridad social (-)– Lugar de residencia (Rural+)– Controles de estado (% de la seguridad social y avance en la
afiliación del SP) No significativas

Continuación
• Con PSM– Remesas es estadísticamente significativo en los
modelos logit de gasto catastrófico (20,30 y 40%), y el tobit sobre contribución financiera del hogar los resultados son similares.
– En el modelo de gasto empobrecedor es no significativa
– Variables estadísticamente significativas en los modelos
– Composición familiar (Viejos y niños) (+)– Remesas (+)– Familia cubierta por la seguridad social (-)– Lugar de residencia (Rural+)– Controles de estado (% de la seguridad social y avance en la
afiliación del SP) No significativas

Resultados: Análisis sobre sobre la asociación del incremento en la coberturadel SP sobre la protección financiera
Modelos con PSM• Estrategias:
1. Pareando libremente entre asegurados y no asegurados2. Pareando exclusivamente entre no asegurados3. Pareando haciendo control por tipo de hogar (Hogares que pueden
incluir miembros asegurados po la seguridad social y por el Seguro Popular)
• Resultados: – En los modelos 2 y 3 la prueba de diferencia de proporciones
de sufrir gastos catastróficos o empobrecedores son estadísticamente significativas a favor del grupo de tratamiento (cubiertos por el SP)
– Los modelos Logit de gastos catastróficos o empobrecedores en todos los casos no muestras un resultado estadísticamente significativo en estar asegurado por SP
– El modelo tobit sólo es estadísticamente significativo en la estrategia 2.

Continuación
• Otras variables significativas en el análisis
– Composición familiar (Viejos y niños) (+)– Remesas (+)– Familia cubierta por la seguridad social (-)– Lugar de residencia (Rural+)– Controles de estado (% de la seguridad social y avance
en la afiliación del SP) No significativas

"Financiamiento en Salud y Protección Financiera en
América Latina”
"Financiamiento en Salud y Protección Financiera en
América Latina”
Ciudad de México15 al 18 de octubre, 2007
Ciudad de México15 al 18 de octubre, 2007