Embed Size (px)
Citation preview
Annual Report 2017
(Incorporated with limited liability under the laws of Bermuda)
A Chinese version of this report is available at www.�rstpaci�c.com or from the Company on request.本報告之中文版可瀏覽 www.�rstpaci�c.com 或向本公司索取。
This report is printed on environmentally friendly paper.Concept and design: iOne Financial Press Limited
24/F, Two Exchange Square8 Connaught PlaceCentral, Hong Kong SARTelephone: +852 2842 4388Email: info@�rstpaci�c.comWebsite: www.�rstpaci�c.com
First Paci�c C
ompany Lim
ited Annual R
eport 2017
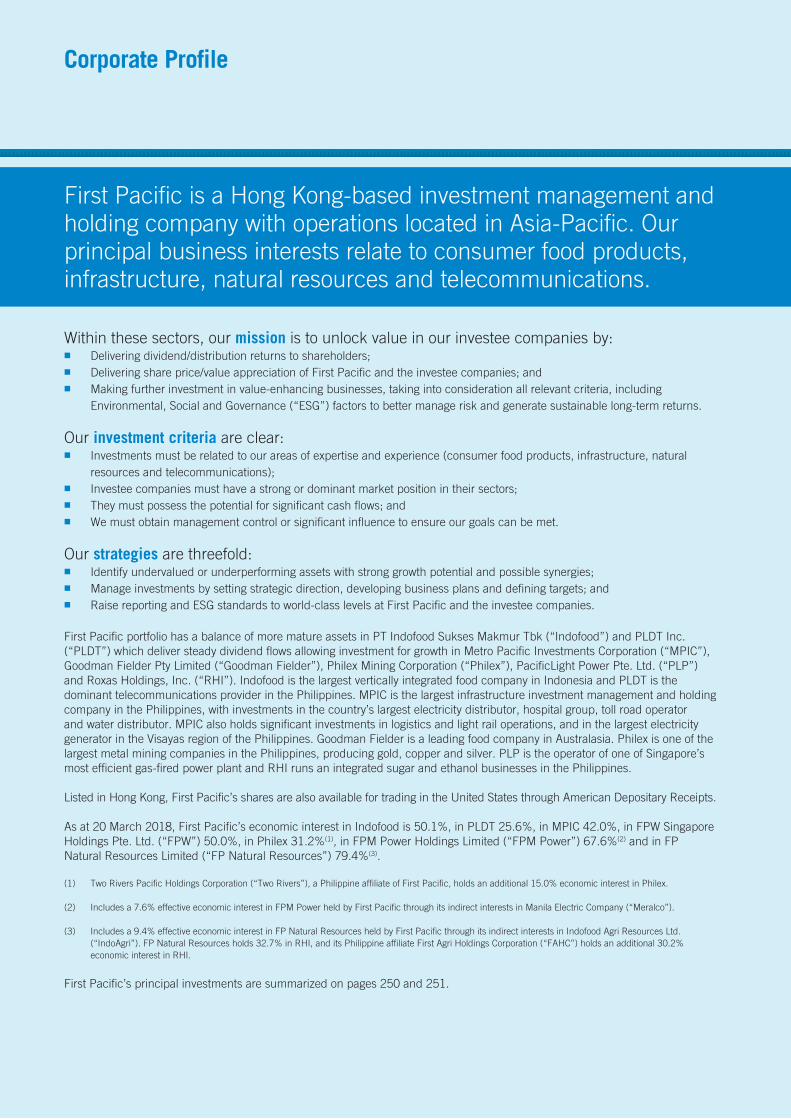
Corporate Profile
Within these sectors, our mission is to unlock value in our investee companies by:■ Delivering dividend/distribution returns to shareholders;■ Delivering share price/value appreciation of First Pacific and the investee companies; and■ Making further investment in value-enhancing businesses, taking into consideration all relevant criteria, including
Environmental, Social and Governance (“ESG”) factors to better manage risk and generate sustainable long-term returns.
Our investment criteria are clear:■ Investments must be related to our areas of expertise and experience (consumer food products, infrastructure, natural
resources and telecommunications);■ Investee companies must have a strong or dominant market position in their sectors;■ They must possess the potential for significant cash flows; and■ We must obtain management control or significant influence to ensure our goals can be met.
Our strategies are threefold:■ Identify undervalued or underperforming assets with strong growth potential and possible synergies;■ Manage investments by setting strategic direction, developing business plans and defining targets; and■ Raise reporting and ESG standards to world-class levels at First Pacific and the investee companies.
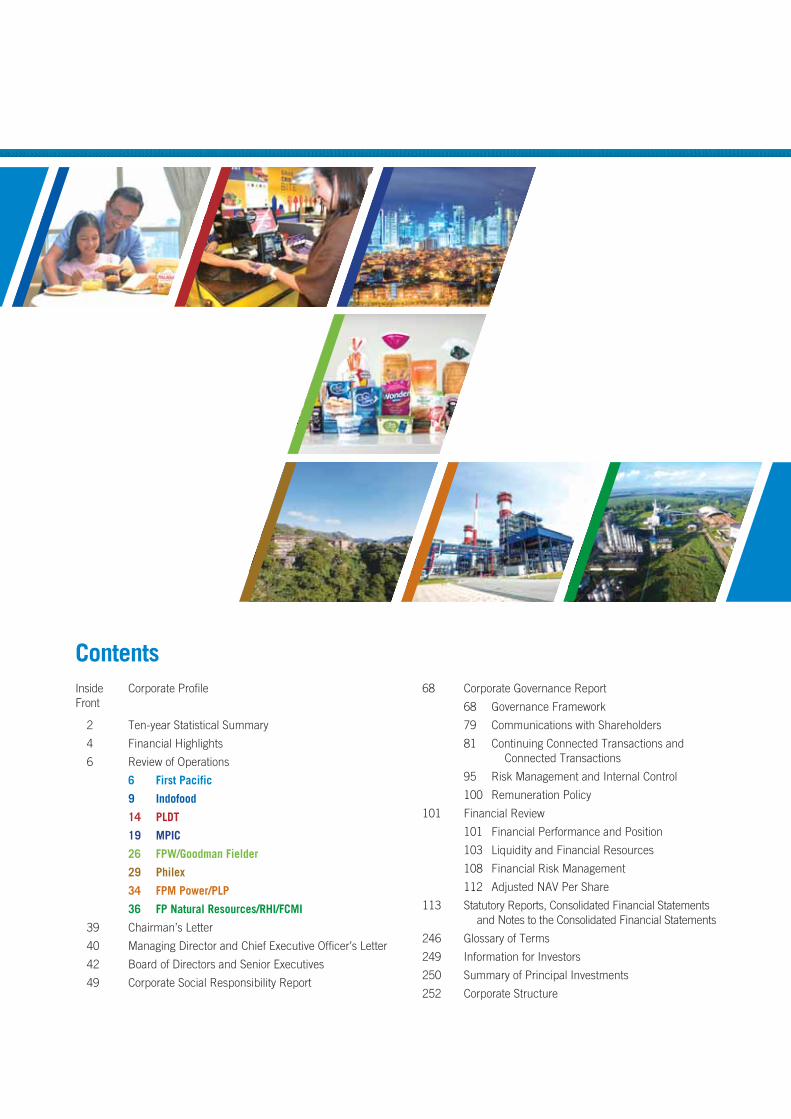
First Pacific portfolio has a balance of more mature assets in PT Indofood Sukses Makmur Tbk (“Indofood”) and PLDT Inc. (“PLDT”) which deliver steady dividend flows allowing investment for growth in Metro Pacific Investments Corporation (“MPIC”), Goodman Fielder Pty Limited (“Goodman Fielder”), Philex Mining Corporation (“Philex”), PacificLight Power Pte. Ltd. (“PLP”) and Roxas Holdings, Inc. (“RHI”). Indofood is the largest vertically integrated food company in Indonesia and PLDT is the dominant telecommunications provider in the Philippines. MPIC is the largest infrastructure investment management and holding company in the Philippines, with investments in the country’s largest electricity distributor, hospital group, toll road operator and water distributor. MPIC also holds significant investments in logistics and light rail operations, and in the largest electricity generator in the Visayas region of the Philippines. Goodman Fielder is a leading food company in Australasia. Philex is one of the largest metal mining companies in the Philippines, producing gold, copper and silver. PLP is the operator of one of Singapore’s most efficient gas-fired power plant and RHI runs an integrated sugar and ethanol businesses in the Philippines.
Listed in Hong Kong, First Pacific’s shares are also available for trading in the United States through American Depositary Receipts.
As at 20 March 2018, First Pacific’s economic interest in Indofood is 50.1%, in PLDT 25.6%, in MPIC 42.0%, in FPW Singapore Holdings Pte. Ltd. (“FPW”) 50.0%, in Philex 31.2%(1), in FPM Power Holdings Limited (“FPM Power”) 67.6%(2) and in FP Natural Resources Limited (“FP Natural Resources”) 79.4%(3).
(1) Two Rivers Pacific Holdings Corporation (“Two Rivers”), a Philippine affiliate of First Pacific, holds an additional 15.0% economic interest in Philex.
(2) Includes a 7.6% effective economic interest in FPM Power held by First Pacific through its indirect interests in Manila Electric Company (“Meralco”).
(3) Includes a 9.4% effective economic interest in FP Natural Resources held by First Pacific through its indirect interests in Indofood Agri Resources Ltd. (“IndoAgri”). FP Natural Resources holds 32.7% in RHI, and its Philippine affiliate First Agri Holdings Corporation (“FAHC”) holds an additional 30.2% economic interest in RHI.
First Pacific’s principal investments are summarized on pages 250 and 251.
First Pacific is a Hong Kong-based investment management and holding company with operations located in Asia-Pacific. Our principal business interests relate to consumer food products, infrastructure, natural resources and telecommunications.
Inside Front
Corporate Profile
2 Ten-year Statistical Summary
4 Financial Highlights
6 Review of Operations
6 First Pacific
9 Indofood
14 PLDT
19 MPIC
26 FPW/Goodman Fielder
29 Philex
34 FPM Power/PLP
36 FP Natural Resources/RHI/FCMI
39 Chairman’s Letter
40 Managing Director and Chief Executive Officer’s Letter
42 Board of Directors and Senior Executives
49 Corporate Social Responsibility Report
68 Corporate Governance Report
68 Governance Framework
79 Communications with Shareholders
81 Continuing Connected Transactions and Connected Transactions
95 Risk Management and Internal Control
100 Remuneration Policy
101 Financial Review
101 Financial Performance and Position
103 Liquidity and Financial Resources
108 Financial Risk Management
112 Adjusted NAV Per Share
113 Statutory Reports, Consolidated Financial Statements and Notes to the Consolidated Financial Statements
246 Glossary of Terms
249 Information for Investors
250 Summary of Principal Investments
252 Corporate Structure
Contents
2 First Pacific Annual Report 2017
Ten-year Statistical Summary
2017 2016 2015 2014 2013 2012 2011 2010 2009 2008
Results (US$ millions)
Turnover 7,296.8 6,779.0 6,437.0 6,841.3 6,005.8 5,990.8 5,684.1 4,640.2 3,925.6 4,105.3
Profit for the year 561.3 517.8 418.9 503.2 620.9 834.9 1,097.4 785.3 680.6 326.8
Profit attributable to owners of the parent 120.9 103.2 80.6 75.7 235.3 353.3 574.0 403.0 410.9 202.2
Contribution from operations 420.5 400.2 426.5 455.7 467.2 460.8 511.8 474.0 335.2 304.4
Recurring profit 300.0 264.9 287.5 316.9 327.1 358.0 423.0 402.1 286.6 239.2
Ordinary share distributions/dividends 75.1 74.5 74.2 115.7 116.1 103.8 109.8 99.4 56.1 37.0
Per Ordinary Share Data (U.S. cents)
Basic earnings 2.80 2.42 1.89 1.76 5.66 9.01 14.49 10.16 11.72 5.82
Basic recurring earnings 6.96 6.21 6.74 7.39 7.87 9.13 10.68 10.13 8.18 6.89
Distributions/dividends 1.74 1.74 1.74 2.70 2.70 2.70 2.85 2.55 1.54 1.15
Equity attributable to owners of the parent 74.32 72.68 71.93 78.08 81.44 84.65 78.50 65.99 49.64 35.17
Total assets 471.08 402.07 402.93 378.67 360.68 362.80 327.55 279.68 243.43 224.03
Net tangible assets 361.58 300.82 305.12 295.40 281.00 281.45 251.57 208.51 178.58 155.13
Net cash flows from operating activities 17.96 17.11 15.21 19.48 17.41 25.54 16.22 20.66 1.69 4.76
Financial Ratios
Gross margin (%) 29.50 29.57 27.86 27.59 29.31 31.08 31.21 35.50 30.20 24.41
Recurring return on average net assets (%) 9.47 9.23 9.24 10.13 10.18 11.83 15.01 16.11 15.20 18.88
Recurring return on average equity
attributable to owners of the parent (%) 9.47 8.57 8.96 9.24 9.69 11.43 15.11 17.91 18.82 21.16
Distribution/dividend payout ratio (%) 25.03 28.12 25.81 36.51 35.49 28.99 25.96 24.72 19.57 15.47
Distribution/dividend cover (times) 3.99 3.56 3.87 2.74 2.82 3.45 3.85 4.05 5.11 6.46
Distribution/dividend yield (%) 2.55 2.50 2.64 2.74 2.38 2.49 2.75 2.84 2.39 3.34
Interest cover (times) 4.31 4.18 3.87 4.29 4.77 6.29 7.18 5.02 3.67 4.76
Current ratio (times) 1.32 1.24 1.39 1.69 1.72 1.78 1.57 1.85 1.37 0.87
Gearing ratio (times)
– Consolidated 0.66 0.54 0.64 0.47 0.43 0.30 0.26 0.33 0.67 1.06
– Company 0.83 0.75 0.79 0.56 0.51 0.67 0.71 0.46 0.36 0.47
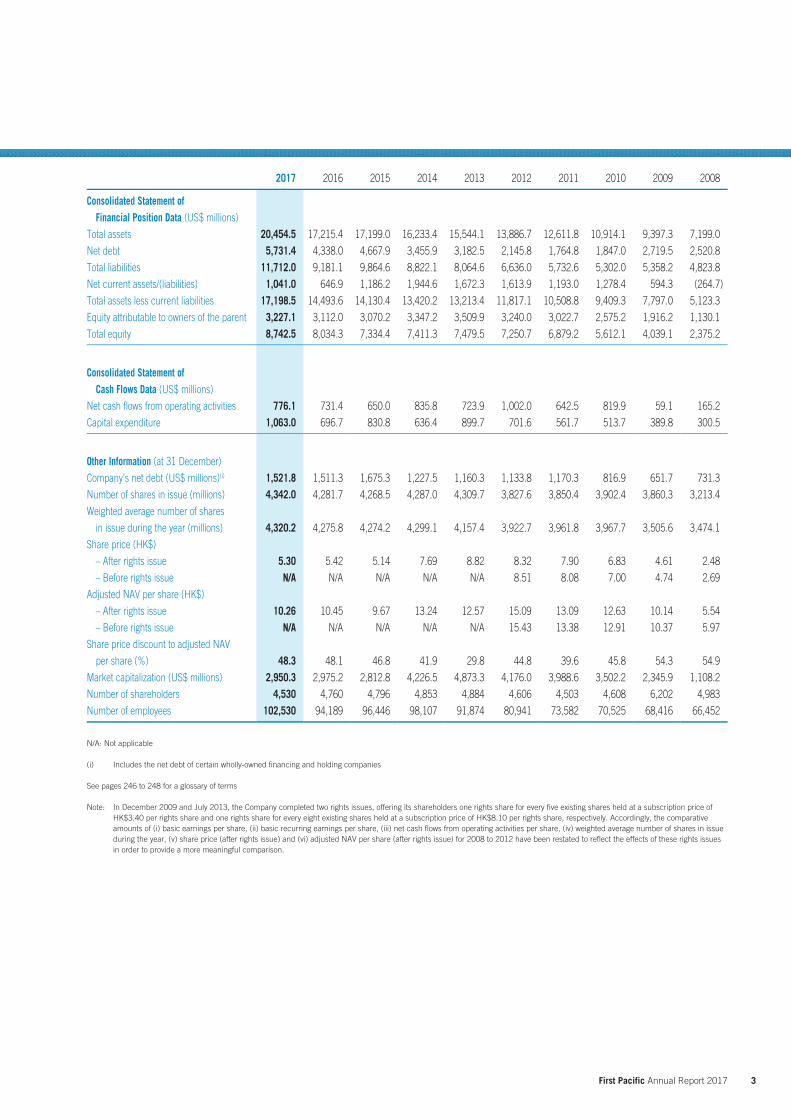
3 First Pacific Annual Report 2017
2017 2016 2015 2014 2013 2012 2011 2010 2009 2008
Consolidated Statement ofFinancial Position Data (US$ millions)
Total assets 20,454.5 17,215.4 17,199.0 16,233.4 15,544.1 13,886.7 12,611.8 10,914.1 9,397.3 7,199.0
Net debt 5,731.4 4,338.0 4,667.9 3,455.9 3,182.5 2,145.8 1,764.8 1,847.0 2,719.5 2,520.8
Total liabilities 11,712.0 9,181.1 9,864.6 8,822.1 8,064.6 6,636.0 5,732.6 5,302.0 5,358.2 4,823.8
Net current assets/(liabilities) 1,041.0 646.9 1,186.2 1,944.6 1,672.3 1,613.9 1,193.0 1,278.4 594.3 (264.7)
Total assets less current liabilities 17,198.5 14,493.6 14,130.4 13,420.2 13,213.4 11,817.1 10,508.8 9,409.3 7,797.0 5,123.3
Equity attributable to owners of the parent 3,227.1 3,112.0 3,070.2 3,347.2 3,509.9 3,240.0 3,022.7 2,575.2 1,916.2 1,130.1
Total equity 8,742.5 8,034.3 7,334.4 7,411.3 7,479.5 7,250.7 6,879.2 5,612.1 4,039.1 2,375.2
Consolidated Statement ofCash Flows Data (US$ millions)
Net cash flows from operating activities 776.1 731.4 650.0 835.8 723.9 1,002.0 642.5 819.9 59.1 165.2
Capital expenditure 1,063.0 696.7 830.8 636.4 899.7 701.6 561.7 513.7 389.8 300.5
Other Information (at 31 December)
Company’s net debt (US$ millions)(i) 1,521.8 1,511.3 1,675.3 1,227.5 1,160.3 1,133.8 1,170.3 816.9 651.7 731.3
Number of shares in issue (millions) 4,342.0 4,281.7 4,268.5 4,287.0 4,309.7 3,827.6 3,850.4 3,902.4 3,860.3 3,213.4
Weighted average number of shares
in issue during the year (millions) 4,320.2 4,275.8 4,274.2 4,299.1 4,157.4 3,922.7 3,961.8 3,967.7 3,505.6 3,474.1
Share price (HK$)
– After rights issue 5.30 5.42 5.14 7.69 8.82 8.32 7.90 6.83 4.61 2.48
– Before rights issue N/A N/A N/A N/A N/A 8.51 8.08 7.00 4.74 2.69
Adjusted NAV per share (HK$)
– After rights issue 10.26 10.45 9.67 13.24 12.57 15.09 13.09 12.63 10.14 5.54
– Before rights issue N/A N/A N/A N/A N/A 15.43 13.38 12.91 10.37 5.97
Share price discount to adjusted NAV
per share (%) 48.3 48.1 46.8 41.9 29.8 44.8 39.6 45.8 54.3 54.9
Market capitalization (US$ millions) 2,950.3 2,975.2 2,812.8 4,226.5 4,873.3 4,176.0 3,988.6 3,502.2 2,345.9 1,108.2
Number of shareholders 4,530 4,760 4,796 4,853 4,884 4,606 4,503 4,608 6,202 4,983
Number of employees 102,530 94,189 96,446 98,107 91,874 80,941 73,582 70,525 68,416 66,452
N/A: Not applicable
(i) Includes the net debt of certain wholly-owned financing and holding companies
See pages 246 to 248 for a glossary of terms
Note: In December 2009 and July 2013, the Company completed two rights issues, offering its shareholders one rights share for every five existing shares held at a subscription price of HK$3.40 per rights share and one rights share for every eight existing shares held at a subscription price of HK$8.10 per rights share, respectively. Accordingly, the comparative amounts of (i) basic earnings per share, (ii) basic recurring earnings per share, (iii) net cash flows from operating activities per share, (iv) weighted average number of shares in issue during the year, (v) share price (after rights issue) and (vi) adjusted NAV per share (after rights issue) for 2008 to 2012 have been restated to reflect the effects of these rights issues in order to provide a more meaningful comparison.
4 First Pacific Annual Report 2017
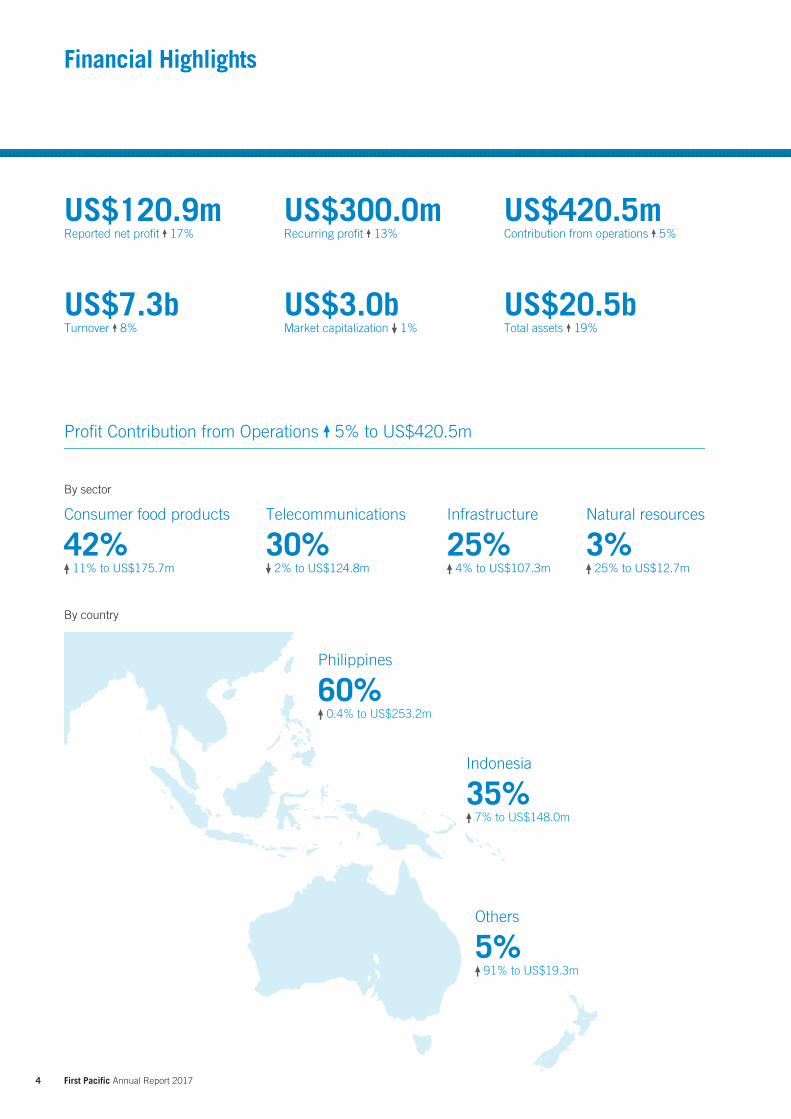
Financial Highlights
US$3.0bMarket capitalization 1%
US$20.5bTotal assets 19%
US$7.3bTurnover 8%
US$300.0mRecurring profit 13%
US$420.5mContribution from operations 5%
US$120.9mReported net profit 17%
By country
By sector
Consumer food products
42% 11% to US$175.7m
Telecommunications
30% 2% to US$124.8m
Infrastructure
25% 4% to US$107.3m
Natural resources
3% 25% to US$12.7m
Philippines
60% 0.4% to US$253.2m
Indonesia
35% 7% to US$148.0m
Others
5% 91% to US$19.3m
Profit Contribution from Operations 5% to US$420.5m
5 First Pacific Annual Report 2017
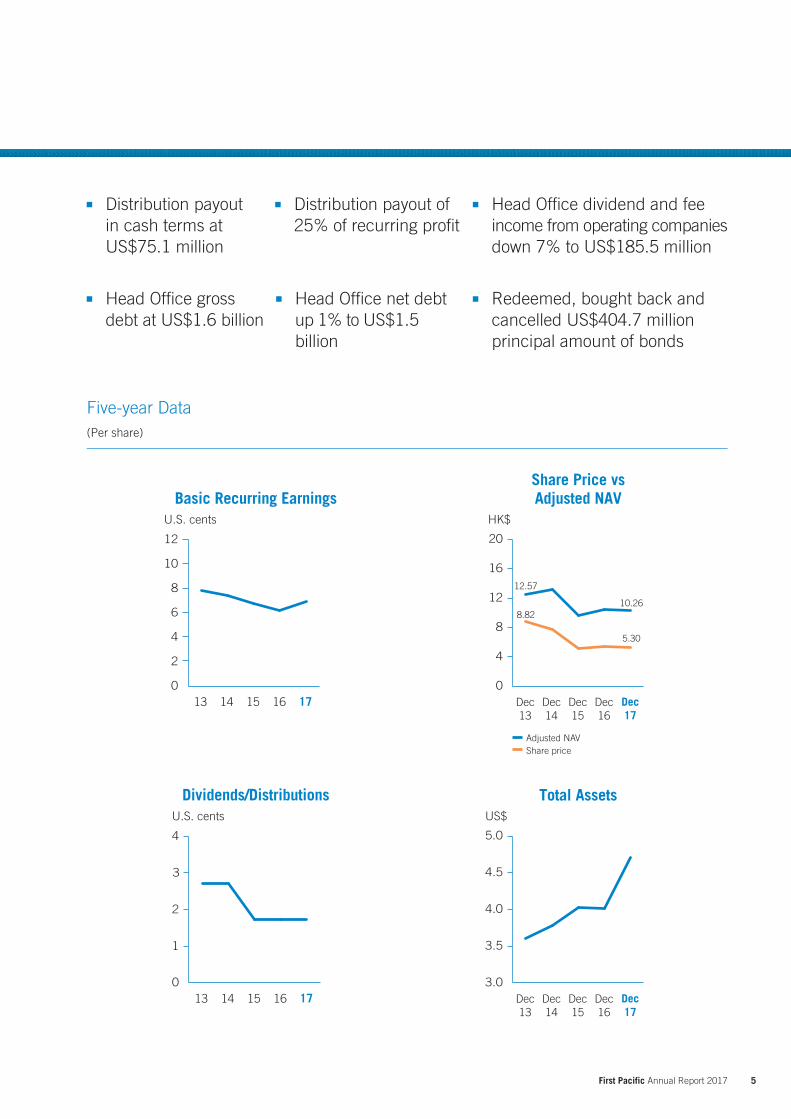
Head Office gross debt at US$1.6 billion
Head Office net debt up 1% to US$1.5 billion
Redeemed, bought back and cancelled US$404.7 million principal amount of bonds
Distribution payout in cash terms at US$75.1 million
Distribution payout of 25% of recurring profit
Head Office dividend and fee income from operating companies down 7% to US$185.5 million
Five-year Data(Per share)
Basic Recurring Earnings
Dividends/Distributions Total Assets
Share Price vsAdjusted NAV
13 14 15 16 170
2
4
6
8
12
10
U.S. cents
13 14 15 16 170
1
3
2
4
U.S. cents
HK$
Adjusted NAV
12.57
8.8210.26
5.30
Share price
0
4
8
12
16
20
Dec13
Dec14
Dec15
Dec16
Dec17
Dec13
Dec14
Dec15
Dec16
Dec17
3.0
3.5
4.0
4.5
5.0
US$
6 First Pacific Annual Report 2017
Review of Operations
Below is an analysis of results by individual company.
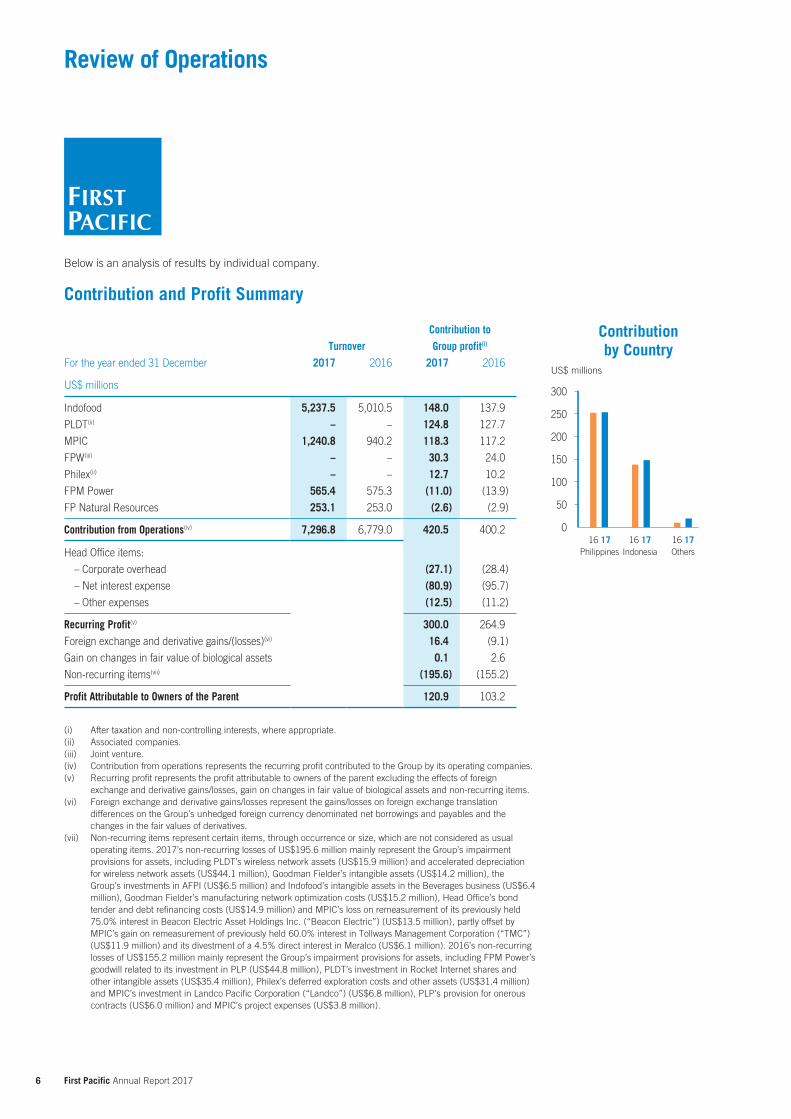
Contribution and Profit Summary
TurnoverContribution to Group profit(i)
For the year ended 31 December 2017 2016 2017 2016
US$ millions
Indofood 5,237.5 5,010.5 148.0 137.9
PLDT(ii) – – 124.8 127.7
MPIC 1,240.8 940.2 118.3 117.2
FPW(iii) – – 30.3 24.0
Philex(ii) – – 12.7 10.2
FPM Power 565.4 575.3 (11.0) (13.9)
FP Natural Resources 253.1 253.0 (2.6) (2.9)
Contribution from Operations(iv) 7,296.8 6,779.0 420.5 400.2
Head Office items:
– Corporate overhead (27.1) (28.4)
– Net interest expense (80.9) (95.7)
– Other expenses (12.5) (11.2)
Recurring Profit(v) 300.0 264.9
Foreign exchange and derivative gains/(losses)(vi) 16.4 (9.1)
Gain on changes in fair value of biological assets 0.1 2.6
Non-recurring items(vii) (195.6) (155.2)
Profit Attributable to Owners of the Parent 120.9 103.2
(i) After taxation and non-controlling interests, where appropriate.(ii) Associated companies.(iii) Joint venture.(iv) Contribution from operations represents the recurring profit contributed to the Group by its operating companies.(v) Recurring profit represents the profit attributable to owners of the parent excluding the effects of foreign
exchange and derivative gains/losses, gain on changes in fair value of biological assets and non-recurring items.(vi) Foreign exchange and derivative gains/losses represent the gains/losses on foreign exchange translation
differences on the Group’s unhedged foreign currency denominated net borrowings and payables and the changes in the fair values of derivatives.
(vii) Non-recurring items represent certain items, through occurrence or size, which are not considered as usual operating items. 2017’s non-recurring losses of US$195.6 million mainly represent the Group’s impairment provisions for assets, including PLDT’s wireless network assets (US$15.9 million) and accelerated depreciation for wireless network assets (US$44.1 million), Goodman Fielder’s intangible assets (US$14.2 million), the Group’s investments in AFPI (US$6.5 million) and Indofood’s intangible assets in the Beverages business (US$6.4 million), Goodman Fielder’s manufacturing network optimization costs (US$15.2 million), Head Office’s bond tender and debt refinancing costs (US$14.9 million) and MPIC’s loss on remeasurement of its previously held 75.0% interest in Beacon Electric Asset Holdings Inc. (“Beacon Electric”) (US$13.5 million), partly offset by MPIC’s gain on remeasurement of previously held 60.0% interest in Tollways Management Corporation (“TMC”) (US$11.9 million) and its divestment of a 4.5% direct interest in Meralco (US$6.1 million). 2016’s non-recurring losses of US$155.2 million mainly represent the Group’s impairment provisions for assets, including FPM Power’s goodwill related to its investment in PLP (US$44.8 million), PLDT’s investment in Rocket Internet shares and other intangible assets (US$35.4 million), Philex’s deferred exploration costs and other assets (US$31.4 million) and MPIC’s investment in Landco Pacific Corporation (“Landco”) (US$6.8 million), PLP’s provision for onerous contracts (US$6.0 million) and MPIC’s project expenses (US$3.8 million).
Contribution by Country
Philippines Indonesia Others
US$ millions
0
50
100
150
200
300
250
16 17 16 17 16 17
7 First Pacific Annual Report 2017
Firs
t Pac
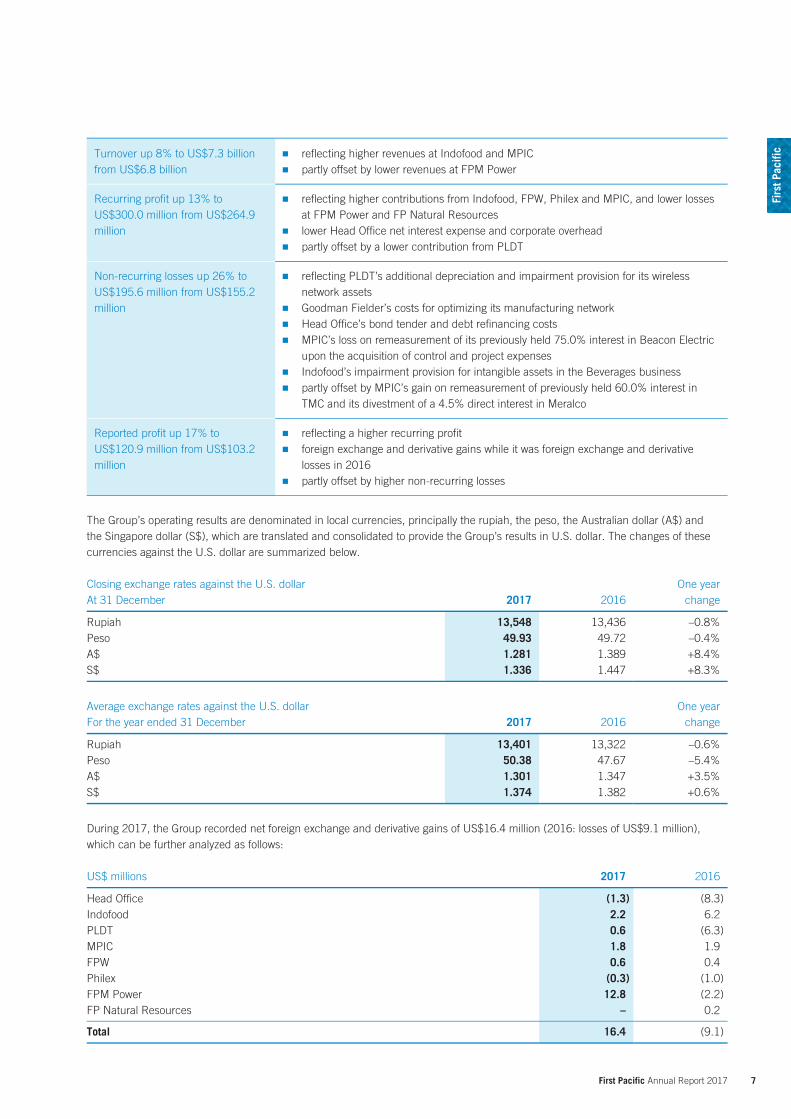
ificTurnover up 8% to US$7.3 billion
from US$6.8 billion reflecting higher revenues at Indofood and MPIC partly offset by lower revenues at FPM Power
Recurring profit up 13% to US$300.0 million from US$264.9 million
reflecting higher contributions from Indofood, FPW, Philex and MPIC, and lower losses at FPM Power and FP Natural Resources
lower Head Office net interest expense and corporate overhead partly offset by a lower contribution from PLDT
Non-recurring losses up 26% to US$195.6 million from US$155.2 million
reflecting PLDT’s additional depreciation and impairment provision for its wireless network assets
Goodman Fielder’s costs for optimizing its manufacturing network Head Office’s bond tender and debt refinancing costs MPIC’s loss on remeasurement of its previously held 75.0% interest in Beacon Electric
upon the acquisition of control and project expenses Indofood’s impairment provision for intangible assets in the Beverages business partly offset by MPIC’s gain on remeasurement of previously held 60.0% interest in
TMC and its divestment of a 4.5% direct interest in Meralco
Reported profit up 17% to US$120.9 million from US$103.2 million
reflecting a higher recurring profit foreign exchange and derivative gains while it was foreign exchange and derivative
losses in 2016 partly offset by higher non-recurring losses
The Group’s operating results are denominated in local currencies, principally the rupiah, the peso, the Australian dollar (A$) and the Singapore dollar (S$), which are translated and consolidated to provide the Group’s results in U.S. dollar. The changes of these currencies against the U.S. dollar are summarized below.
Closing exchange rates against the U.S. dollarAt 31 December 2017 2016
One year change
Rupiah 13,548 13,436 –0.8%Peso 49.93 49.72 –0.4%A$ 1.281 1.389 +8.4%S$ 1.336 1.447 +8.3%
Average exchange rates against the U.S. dollarFor the year ended 31 December 2017 2016
One year change
Rupiah 13,401 13,322 –0.6%Peso 50.38 47.67 –5.4%A$ 1.301 1.347 +3.5%S$ 1.374 1.382 +0.6%
During 2017, the Group recorded net foreign exchange and derivative gains of US$16.4 million (2016: losses of US$9.1 million), which can be further analyzed as follows:
US$ millions 2017 2016
Head Office (1.3) (8.3)Indofood 2.2 6.2PLDT 0.6 (6.3)MPIC 1.8 1.9FPW 0.6 0.4Philex (0.3) (1.0)FPM Power 12.8 (2.2)FP Natural Resources – 0.2 Total 16.4 (9.1)
8 First Pacific Annual Report 2017
Review of Operations
Capital ManagementDistributionFirst Pacific’s Board of Directors, taking into consideration cash flow trends and following
consistent prudent risk management practices, declared a final distribution of HK5.5 cents (U.S.
0.71 cent) per share which brings the total distributions for 2017 to HK13.5 cents (U.S. 1.74
cents), unchanged from a year earlier. The total distribution represent a 25% payout of the Group’s
2017 recurring profit attributable to shareholders, in line with a payout ratio commitment of 25%.
Debt ProfileIn January 2017, First Pacific, through bond tender offers for all of the outstanding bonds maturing
in 2017 and an aggregate principal amount of up to US$200 million for the bonds maturing in
2020, bought back and cancelled approximately US$152.2 million in aggregate principal amount
of bonds.
On 24 July 2017, First Pacific redeemed approximately US$218.5 million principal amount of
bonds on their maturity.
In addition, during 2017 First Pacific bought back and cancelled approximately US$34.0 million in
aggregate principal amount of bonds due 2019 and 2023.
The above-mentioned bond repurchases and redemptions were funded by internal cash resources
and bank borrowings.
At 31 December 2017, net debt at the Head Office stood at approximately US$1.5 billion while
gross debt stood at approximately US$1.6 billion with an average maturity of approximately 3.6
years. Approximately 36% of the Head Office borrowings were floating rate bank loans while fixed
rate bonds comprised the remainder. Unsecured debts accounted for approximately 81% of Head
Office borrowings. The blended interest rate declined to approximately 4.5% per annum.
As at 20 March 2018, the principal amount of the following bonds remains outstanding:
US$374.5 million at 6.0% coupon with maturity on 28 June 2019
US$312.2 million at 6.375% coupon with maturity on 28 September 2020
US$358.8 million at 4.5% coupon with maturity on 16 April 2023
There is no Head Office recourse for subsidiaries or affiliate companies’ borrowings.
Interest CoverFor 2017, Head Office recurring operating cash inflow before interest expense was US$159.0 million. Net cash interest expense
declined 21% to US$72.4 million reflecting a lower average debt balance arising from bond repurchases and redemption, and a lower
average interest rate. For the 12 months ended 31 December 2017, the cash interest cover was approximately 2.2 times.
Foreign Currency HedgingThe Company actively reviews the potential benefits of hedging based on forecast dividend income and enters into hedging
arrangements for managing its foreign currency exposures in respect of dividend income and payments in foreign currencies on a
transactional basis.
2018 OutlookThe improved financial and operating results seen in 2017 are helping to lay the groundwork for further improvement going forward.
Lower borrowings and interest costs are strengthening First Pacific’s balance sheet and cash flow going forward, even as Management
presses on with its ambition to streamline First Pacific’s portfolio of investments with a view to further improving returns and releasing
funds to direct towards further debt reduction and share repurchases to boost shareholder returns.
First Pacific Management is confident that continuing growth in the markets served by Indofood, MPIC and Goodman Fielder will help
lift earnings at these businesses even as they invest for growth. PLDT is beginning to reap the benefits of its five-year Pesos 260 billion
capital expenditure program and the quarter-on-quarter improvements we have seen in 2017 signal better prospects just ahead.
Dec13
Dec14
Dec15
Dec16
Dec17
0
3
6
9
12
US$ billions
Value of Assets
13 14 15 16 170
20
10
30
50
40
%
Dividend/DistributionPayout Ratio

9 First Pacific Annual Report 2017
PROFIT CONTRIBUTION
US$
148.0million
10 First Pacific Annual Report 2017
Review of Operations
Indofood’s contribution to the Group increased 7% to US$148.0 million (2016: US$137.9 million)
principally reflecting higher core net income.
Core net income up 8% to
Rupiah 4.3 trillion (US$320.7
million) from Rupiah 4.0 trillion
(US$299.4 million)
reflecting stronger performance of Consumer
Branded Products (“CBP”) group
partly offset by weaker performance of Bogasari
and Agribusiness groups and the absence of
contribution from China Minzhong Food Corporation
Limited (“CMZ”)
Net income to Rupiah 4.2 trillion
(US$311.1 million) from Rupiah
4.1 trillion (US$311.1 million)
reflecting the increase in core net income
partly offset by impairment provisions made for
beverage assets
Consolidated net sales up 5%
to Rupiah 70.2 trillion (US$5.2
billion) from Rupiah 66.8 trillion
(US$5.0 billion)
driven by higher sales of all business groups
sales contribution from CBP, Bogasari, Agribusiness
and Distribution groups amounted to 50%, 22%,
20% and 8% of the total, respectively
Gross profit margin to 28.3%
from 29.0%
reflecting higher cost of goods sold
Consolidated operating
expenses up 1% to Rupiah 11.1
trillion (US$828.3 million) from
Rupiah 11.1 trillion (US$826.1
million)
mainly due to higher salaries, wages and employee
benefits, and freight and handling expenses
partly offset by lower advertising and promotion
expenses as well as higher net other operating
income mainly due to a foreign exchange gain
recorded in 2017 while it was a foreign exchange
loss in 2016
EBIT margin to 12.5% from
12.4%
due to a growth in consolidated net sales
Net gearing at 0.23 times from
0.21 times
Debt ProfileAs at 31 December 2017, Indofood recorded gross debt of Rupiah 24.3 trillion (US$1.8 billion), up
8% from Rupiah 22.4 trillion (US$1.7 billion) as at 31 December 2016. Of this total, 52% matures
within one year and the remainder matures between 2019 and 2027, while 69% was denominated
in rupiah and the remaining 31% was denominated in foreign currencies.
Additional Investments and Asset DisposalIn February 2017, under an agreement with Marvellous Glory Holdings Limited (“Marvellous BVI”)
in relation to Indofood’s disposal of its 82.88% interest in CMZ to Marvellous BVI, Indofood fully
exchanged the mandatory exchangeable bonds for approximately 29.94% of CMZ. On 26 April
2017, Indofood disposed its 29.94% of CMZ to China Minzhong Holdings Limited (“CMZ BVI”) for
a consideration of S$235.5 million (US$169.9 million). Indofood received the first two installments
for a total of S$117.7 million (US$85.6 million) in 2017 and the remaining balance will be received
in two installments in 2018 with the last installment to take place in December 2018.
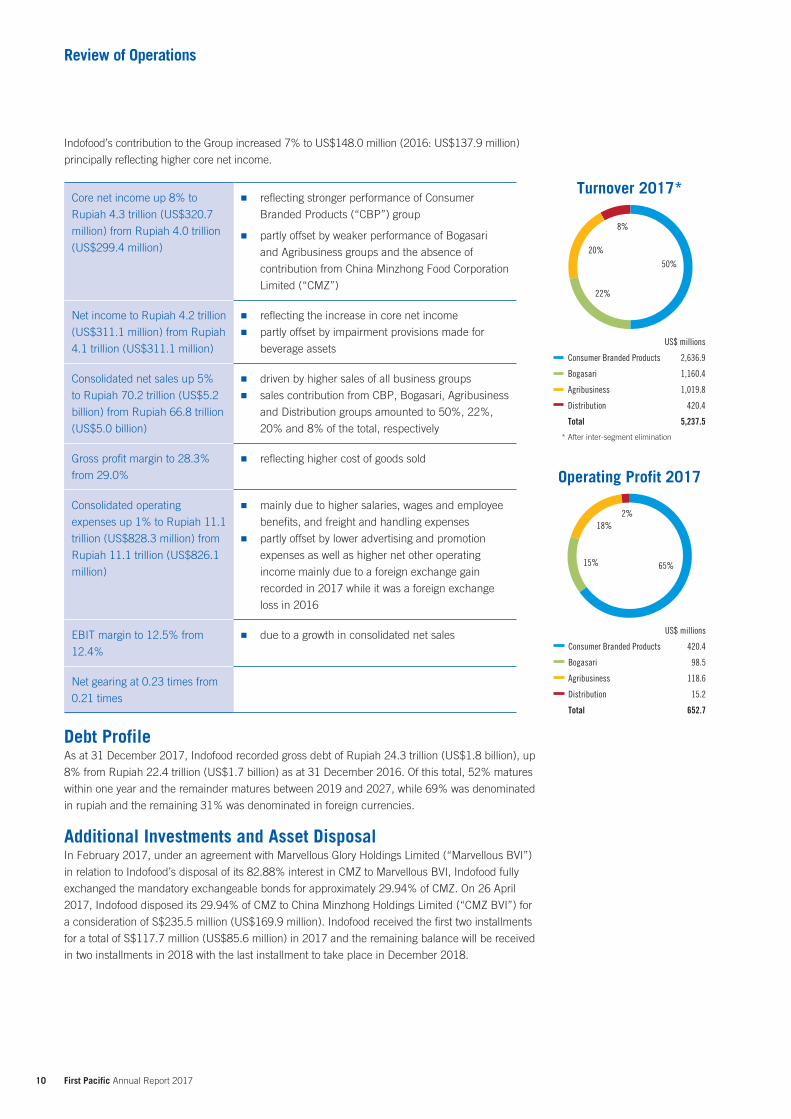
Turnover 2017*
US$ millions
Consumer Branded Products 2,636.9
Bogasari 1,160.4
Agribusiness 1,019.8
Distribution 420.4
Total 5,237.5
* After inter-segment elimination
20%
8%
50%
22%
Operating Profit 2017
US$ millions
Consumer Branded Products 420.4
Bogasari 98.5
Agribusiness 118.6
Distribution 15.2
Total 652.7
65%15%
18%2%
11 First Pacific Annual Report 2017
Indo
food
On 7 June 2017, Indofood’s subsidiary PT Aston Inti Makmur entered into two
conditional sale and purchase agreements with Mr. Anthoni Salim (the Chairman of the
Board and a substantial shareholder of First Pacific) and his wholly-owned company
PT Adithya Suramitra for the acquisition of six plots of land with a total area of 42,877
square meters where Indofood cooking oil and fats production facilities are located. The
total consideration is Rupiah 2.2 trillion (US$164.1 million) and the transactions were
completed in August 2017.
On 22 December 2017, Indofood’s subsidiary PT Indofood CBP Sukses Makmur Tbk
(“Indofood CBP”) entered into a conditional sale and purchase agreement with Asahi
Group Holdings, Ltd. (“Asahi”) to purchase from Asahi approximately 51% of PT Asahi
Indofood Beverage Makmur (“AIBM”) and approximately 49% of PT Indofood Asahi
Sukses Beverage (“IASB”) for a total consideration of approximately US$20.0 million.
The completion of the proposed transaction is conditional on the satisfaction of certain
conditions precedent as agreed in the agreement.
On 19 February 2018, IndoAgri announced its wholly-owned subsidiary IndoAgri Brazil
Participações Ltda. in Brazil partnered with JF Investimentos S.A. through an equally-
owned joint venture company to acquire Canápolis Holding S.A. and its subsidiaries
(“Canápolis Group”) for a total consideration of Brazilian Real 137.8 million (US$42.0
million). Canápolis Group’s Minas Gerais sugar mill in Brazil has an annual sugar cane
crushing capacity of 1.8 million tonnes and has 6,048 hectares of land. Operation of its
sugar mill is expected to commence in 2020.
CBPThe CBP group comprises the Noodles, Dairy, Snack Foods, Food Seasonings, Nutrition & Special Foods and Beverages divisions.
With over 50 plants located in key areas across Indonesia and around 40 leading product brands, CBP produces and markets a wide
range of food and beverage products across Indonesia and exports to over 60 countries around the world.
Indofood’s Noodles division is one of the world’s largest producers of instant noodles with annual production capacity of around 18
billion packs, offering a wide range of instant noodles in various formats, and egg noodles.
The Nutrition & Special Foods division has an annual production capacity of around 25,000 tonnes, producing cereals, biscuits, puddings and snacks for infants and children, cereal snacks for children, cereal drinks for children and family, as well as milk for expectant and lactating mothers.
The Beverages division’s product portfolio includes ready-to-drink teas, ready-to-drink coffees, packaged water, carbonated soft drinks, energy drinks, and fruit-flavored drinks with a combined annual production capacity of around 3 billion liters.
Its Dairy division has an annual production capacity of more than 600,000 tonnes and is one of the largest dairy products manufacturers in Indonesia, producing sweetened condensed milk, creamer, UHT milk, sterilized bottled milk, pasteurized liquid milk, lactic acid beverages, powdered milk, ice cream and butter.
The Snack Foods division has an annual production capacity of over 50,000 tonnes, producing western and contemporized traditional snacks made from potato, cassava, soybean, corn and sweet potato, as well as various extruded snacks and a wide range of biscuits.
The Food Seasonings division has an annual production capacity of around 135,000 tonnes, manufacturing a wide range of culinary products, including instant seasonings, soy sauces, chili sauces and tomato sauces, as well as cordial syrup, instant porridge and ready-to-eat products.
12 First Pacific Annual Report 2017
Review of Operations
Sales by the CBP group rose 4% to Rupiah 35.5 trillion (US$2.7 billion), with almost all divisions contributing to the increase. The
EBIT margin improved to 15.3% from 14.2%.
Amidst slower demand in the fast-moving consumer good and intensified competition,
CBP continued to strengthen its market position in most product categories. It continued
its strategy of product innovation and extending offers from its major product divisions,
launching around 70 new products including new categories of tortilla chips and rice puff
for babies as well as flavor extensions in 2017.
BogasariBogasari produces wheat flour and pasta for domestic and international markets. Its
sales rose 1% to Rupiah 19.1 trillion (US$1.4 billion) reflecting a 4% growth in sales
volume but at a lower average selling price. The EBIT margin decreased to 6.9% from
8.1% due to market competition.
The flour industry in Indonesia has been growing steadily in recent years with increasing
consumer appetite for more varieties of flour-based products, particularly among the
young. With this development per-capita flour consumption is expected to continue
rising in the medium term.
AgribusinessThe diversified and vertically integrated Agribusiness group is one of Indonesia’s largest palm oil producers with leading businesses in
branded edible oils and fats. It consists of two divisions: Plantations and Edible Oils & Fats (“EOF”), which operate through IndoAgri
and its main operating subsidiaries, PT Salim Ivomas Pratama Tbk (“SIMP”) and PT Perusahaan Perkebunan London Sumatra
Indonesia Tbk (“Lonsum”) in Indonesia. In Brazil, IndoAgri has equity investments in sugar and ethanol operations in Companhia
Mineira de Açúcar e Álcool Participacoes (“CMAA”). It also invested in Canápolis Group in
Brazil and in RHI in the Philippines.
In 2017, IndoAgri completed the expansion of milling facilities in South Sumatra and in
Kalimantan, increasing its milling capacity of fresh fruit bunches (“FFB”) by 70 tonnes per
hour. In anticipation of the eventual ban of unpackaged cooking oils from traditional markets
in Indonesia, IndoAgri has started to roll out affordably priced pillow-packed cooking oils under
the group’s secondary brand of Delima. Additionally it has partnered with Daitocacao Co., Ltd.
of Japan to produce and market chocolate products in Indonesia. The ground breaking at the
site of its first chocolate factory took place in November 2017 and commercial production is
scheduled for 2019.
Sales increased 8% to Rupiah 15.7 trillion (US$1.2 billion), reflecting higher average selling
prices of CPO, palm kernel and rubber, and higher sales volumes of CPO, palm kernel and oil
palm seeds. Sales volume of CPO, palm kernel related products and oil palm seeds rose 7%,
9% and 17% to approximately 880,000 tonnes, 211,000 tonnes and 11.3 million respectively,
while sugar and rubber sales volumes declined 24% and 4% to approximately 50,000 tonnes
and 12,400 tonnes, respectively. The EBIT margin fell to 10.1% from 11.9% due to higher
palm production costs and lower contribution from sugar, negative effects from foreign
currency fluctuations, changes in fair values of biological assets, and the absence of a Rupiah
107 billion (US$8.0 million) one-off claim from a contractor for a significant delay in the
completion of a project. This was partly offset by improved share of profits from a joint venture
in Brazil.
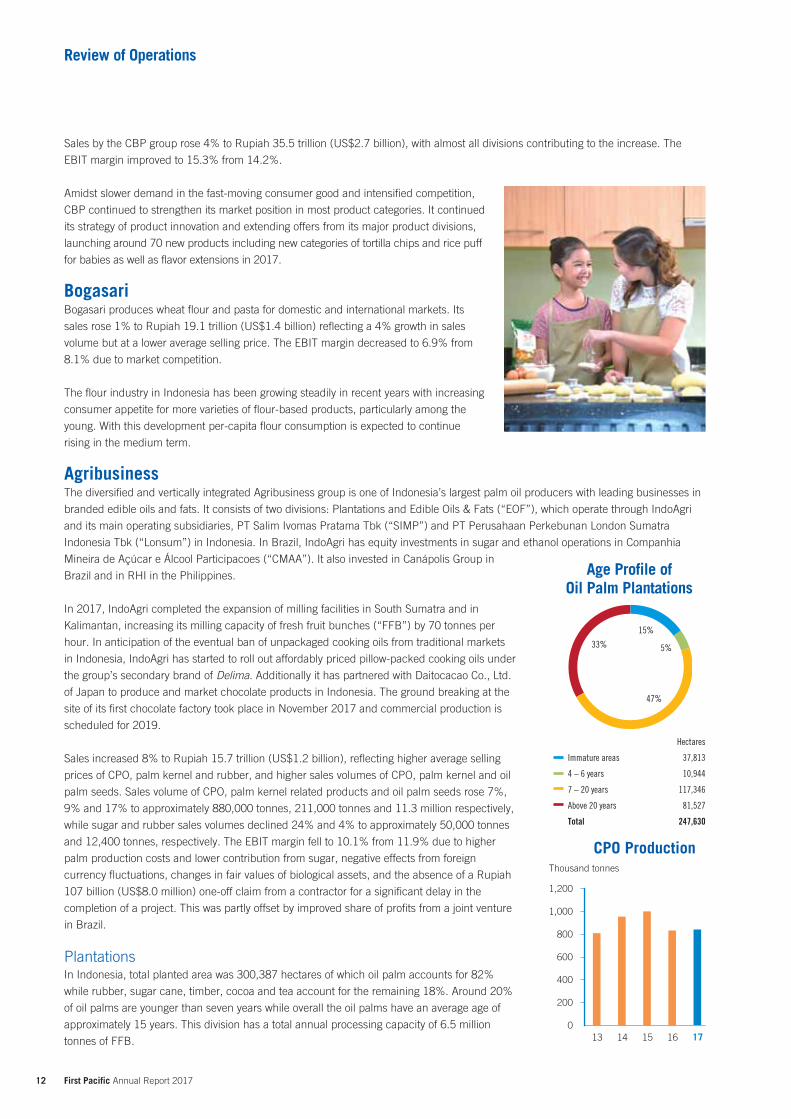
PlantationsIn Indonesia, total planted area was 300,387 hectares of which oil palm accounts for 82%
while rubber, sugar cane, timber, cocoa and tea account for the remaining 18%. Around 20%
of oil palms are younger than seven years while overall the oil palms have an average age of
approximately 15 years. This division has a total annual processing capacity of 6.5 million
tonnes of FFB.
Age Profile ofOil Palm Plantations
Hectares
Immature areas 37,813
4 – 6 years 10,944
7 – 20 years 117,346
Above 20 years 81,527
Total 247,630
47%
5%
15%
33%
CPO Production
13 14 15 16 170
200
800
400
1,000
1,200
600
Thousand tonnes
13 First Pacific Annual Report 2017
Indo
food
In 2017, FFB nucleus production rose 4% to 3,109,000 tonnes
with yield improved to 14.8 tonnes per hectare, while CPO
production increased 1% to 842,000 tonnes with yield of 3.2
tonnes per hectare, reflecting higher share of newly mature planted
area with higher oil palm production and recovery. As at 31
December 2017, the Roundtable on Sustainable Palm Oil (“RSPO”)
certified CPO production was approximately 447,000 tonnes or
53% of the total while Indonesia Sustainable Palm Oil (“ISPO”)
certified output was approximately 389,000 tonnes or 46% of
IndoAgri’s total CPO production.
In Indonesia, total planted area of rubber and sugar cane
decreased slightly from year-end 2016 to 19,869 hectares and
12,618 hectares in 2017, respectively, due to replanting in progress. Sugar production declined 16% to approximately 54,000 tonnes
due to lower yield resulting from heavy rainfall which affected the sucrose content and harvesting activities. In addition, the extended
harvest period in 2016 also affected the cane yield for the current season.
In Brazil, the planted area of sugar cane fell 9% from year-end 2016 to 49,204 hectares owing to replanting in progress. IndoAgri’s
50% share of CMAA contributed a profit of Rupiah 139 billion (US$10.3 million) as compared to a loss of Rupiah 33 billion (US$2.5
million) in 2016, reflecting CMAA’s turnaround to profitability as a result of higher selling prices, higher production and lower foreign
currency impacts. In 2017, CMAA crushed a record high 4.1 million tonnes of sugar cane.
EOFThis division manufactures cooking oils, margarines and shortenings with an annual
refinery capacity of 1.4 million tonnes of CPO. Approximately 64% of this division’s input
needs is sourced from the Plantations division’s CPO production.
In 2017, the EOF division recorded higher sales owing mainly to higher average selling
prices and sales volumes of edible oils and fats products.
The Agribusiness is prioritizing its capital expenditure on expanding palm milling and
refinery facilities, replanting older palms in North Sumatra and Riau, building the
chocolate factory and expanding sugar operations. It will continue to strengthen its
fundamentals, improve yields and margins, and implement cost controls to further
improve profitability.
DistributionThe Distribution group is a major component of Indofood’s Total
Food Solutions chain of operations as it has one of the most
extensive distribution networks in Indonesia.
Distribution’s sales rose 6% to Rupiah 5.6 trillion (US$420.4
million) mainly because of higher sales by the CBP group. The
EBIT margin rose to 3.6% from 3.3%.
The Distribution group continues to strengthen its distribution
network, serving over 600,000 registered retail outlets in Indonesia
to increase Indofood’s product penetration and high product
availability in retail outlets. It also offers product distribution for
external customers.
2018 OutlookIndonesia’s economic condition is expected to improve in 2018. Higher private consumption will be a key driver of economic growth.
Given the positive outlook, Indofood is gearing its operations towards delivering stronger performance across all business groups.
14 First Pacific Annual Report 2017
Review of Operations
PROFIT CONTRIBUTION
US$
124.8million
15 First Pacific Annual Report 2017
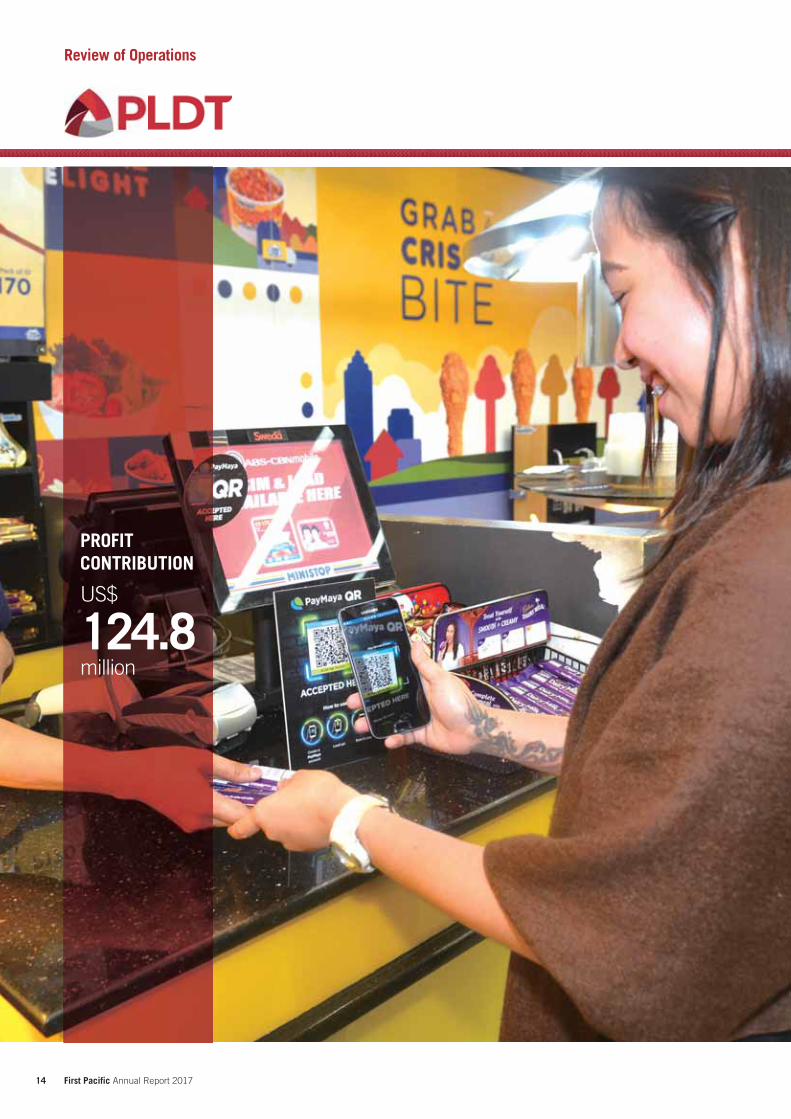
PLDT
PLDT’s contribution to the Group declined 2% to US$124.8 million (2016: US$127.7 million), reflecting the combined effect of the strong performance of the Home and Enterprise segments, lower service revenues from the Individual business segment partly due to the on-going shift to data and digital services among consumers and loss of subscribers, lower subsidies and provisions, higher depreciation expenses and manpower reduction costs, and the 5% depreciation of the average peso exchange rate against the U.S. dollar in 2017. 2017 earnings were also supplemented by gains from the sale of assets, including the remaining 25% stake in Beacon Electric and the 18.3% interest in SPi Global Holdings, Inc.
Consolidated core net income down
1% to Pesos 27.7 billion (US$549.2
million) from Pesos 27.9 billion
(US$584.4 million)
reflecting the increase in consolidated EBITDA offset by one-off expenses/adjustments
excluding gains from asset sales, additional depreciation and EBITDA adjustments
including Pesos 1.6 billion (US$31.8 million) of manpower reduction program (“MRP”)
expenses, recurring core income rose by 11% or Pesos 2.1 billion (US$41.7 million)
Reported net income down 33%
to Pesos 13.4 billion (US$265.4
million) from Pesos 20.0 billion
(US$419.7 million)
reflecting significant non-core expenditure in relation to transformation initiatives,
including additional depreciation due to shortened estimated useful life of network
assets, and non-current asset impairment of Smart and Digitel assets due to
technological obsolescence
includes a Pesos 540 million (US$10.7 million) impairment of the investment in Rocket
Internet
increase in fair value of Rocket Internet of Pesos 3.3 billion (US$66.1 million) in 2017
booked under Other Comprehensive Income
Consolidated service revenues down
4% to Pesos 151.2 billion (US$3.0
billion) from Pesos 157.2 billion
(US$3.3 billion)
reflecting lower revenues from cellular SMS and international and domestic voice
services
partly offset by higher revenues from data, broadband and digital platforms
the quarterly decline of wireless revenues moderated in the course of 2017 and service
revenues stabilized as the year progressed
growth of data, broadband and digital platform revenues continued, with combined
service revenues for this group up 11%, representing 47% of consolidated service
revenues
by business unit, Home, Enterprise, Voyager and Others service revenues rose 13%,
11% and 57%, respectively; Individual and International and Carrier services revenues
were down 11% and 21%, respectively
data and broadband remained the growth drivers, accounting for 63%, 63% and 40%
of the Home, Enterprise and Individual segments’ service revenues, respectively
combined revenues from Home and Enterprise contributed 47% to the consolidated
service revenues, while Individual revenues accounted for 41%
EBITDA up 8% to Pesos 66.2 billion
(US$1.3 billion) from Pesos 61.2
billion (US$1.3 billion)
reflecting lower subsidies and provisions
partly offset by lower service revenues and higher cash operating expenses which
includes Pesos 1.6 billion (US$31.8 million) in relation to the MRP
EBITDA for the fixed line business grew 9% to Pesos 29.5 billion (US$585.5 million);
while EBITDA for the wireless business rose 8% year-on-year to Pesos 35.2 billion
(US$698.7 million)
excluding the Pesos 1.6 billion (US$31.8 million) in MRP expenses, consolidated
EBITDA was 11% higher at Pesos 67.8 billion (US$1.3 billion), while fixed line EBITDA
was up 15% at Pesos 31.1 billion (US$617.3 million)
EBITDA margin to 44% from 39% mainly due to higher EBITDA
wireless EBITDA margin improved to 40% from 32%; while fixed line EBITDA margin
was stable at 39%
excluding the impact of the MRP, the consolidated EBITDA margin was 45%
16 First Pacific Annual Report 2017
Review of Operations
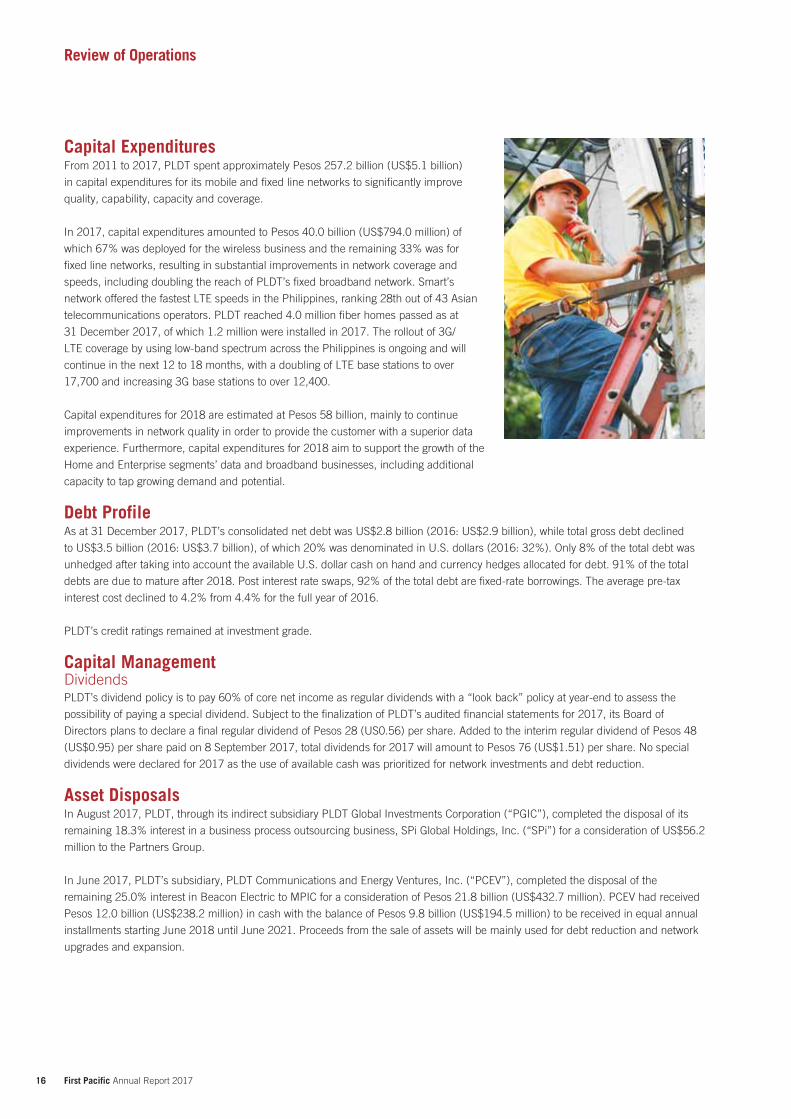
Capital ExpendituresFrom 2011 to 2017, PLDT spent approximately Pesos 257.2 billion (US$5.1 billion)
in capital expenditures for its mobile and fixed line networks to significantly improve
quality, capability, capacity and coverage.
In 2017, capital expenditures amounted to Pesos 40.0 billion (US$794.0 million) of
which 67% was deployed for the wireless business and the remaining 33% was for
fixed line networks, resulting in substantial improvements in network coverage and
speeds, including doubling the reach of PLDT’s fixed broadband network. Smart’s
network offered the fastest LTE speeds in the Philippines, ranking 28th out of 43 Asian
telecommunications operators. PLDT reached 4.0 million fiber homes passed as at
31 December 2017, of which 1.2 million were installed in 2017. The rollout of 3G/
LTE coverage by using low-band spectrum across the Philippines is ongoing and will
continue in the next 12 to 18 months, with a doubling of LTE base stations to over
17,700 and increasing 3G base stations to over 12,400.
Capital expenditures for 2018 are estimated at Pesos 58 billion, mainly to continue
improvements in network quality in order to provide the customer with a superior data
experience. Furthermore, capital expenditures for 2018 aim to support the growth of the
Home and Enterprise segments’ data and broadband businesses, including additional
capacity to tap growing demand and potential.
Debt ProfileAs at 31 December 2017, PLDT’s consolidated net debt was US$2.8 billion (2016: US$2.9 billion), while total gross debt declined
to US$3.5 billion (2016: US$3.7 billion), of which 20% was denominated in U.S. dollars (2016: 32%). Only 8% of the total debt was
unhedged after taking into account the available U.S. dollar cash on hand and currency hedges allocated for debt. 91% of the total
debts are due to mature after 2018. Post interest rate swaps, 92% of the total debt are fixed-rate borrowings. The average pre-tax
interest cost declined to 4.2% from 4.4% for the full year of 2016.
PLDT’s credit ratings remained at investment grade.
Capital ManagementDividendsPLDT’s dividend policy is to pay 60% of core net income as regular dividends with a “look back” policy at year-end to assess the
possibility of paying a special dividend. Subject to the finalization of PLDT’s audited financial statements for 2017, its Board of
Directors plans to declare a final regular dividend of Pesos 28 (US0.56) per share. Added to the interim regular dividend of Pesos 48
(US$0.95) per share paid on 8 September 2017, total dividends for 2017 will amount to Pesos 76 (US$1.51) per share. No special
dividends were declared for 2017 as the use of available cash was prioritized for network investments and debt reduction.
Asset DisposalsIn August 2017, PLDT, through its indirect subsidiary PLDT Global Investments Corporation (“PGIC”), completed the disposal of its
remaining 18.3% interest in a business process outsourcing business, SPi Global Holdings, Inc. (“SPi”) for a consideration of US$56.2
million to the Partners Group.
In June 2017, PLDT’s subsidiary, PLDT Communications and Energy Ventures, Inc. (“PCEV”), completed the disposal of the
remaining 25.0% interest in Beacon Electric to MPIC for a consideration of Pesos 21.8 billion (US$432.7 million). PCEV had received
Pesos 12.0 billion (US$238.2 million) in cash with the balance of Pesos 9.8 billion (US$194.5 million) to be received in equal annual
installments starting June 2018 until June 2021. Proceeds from the sale of assets will be mainly used for debt reduction and network
upgrades and expansion.
17 First Pacific Annual Report 2017
PLDT
Fixed LineFixed line service revenues (net of interconnection costs) rose 11% to Pesos 70.2 billion (US$1.4 billion). The higher revenues from
data and broadband services (Home broadband, Enterprise data and leased lines, data center and IT) and local exchange carrier were
partly offset by lower international long distance (“ILD”) and national long distance (“NLD”) revenues due to continuing decline in call
volumes.
Fixed line data and broadband service revenues rose 18% year-on-year to Pesos 44.3 billion (US$879.3 million) while local exchange
carrier and other revenues rose 6% to Pesos 20.7 billion (US$410.9 million), representing 63% and 29% of fixed line service
revenues, respectively. ILD and NLD revenues continued to decline registering a 12% reduction to Pesos 5.3 billion (US$105.2
million).
The number of PLDT fixed line subscribers increased 9% from 31 December 2016 to 2.7 million, while fixed broadband subscribers
rose to 1.7 million (2016: 1.5 million).
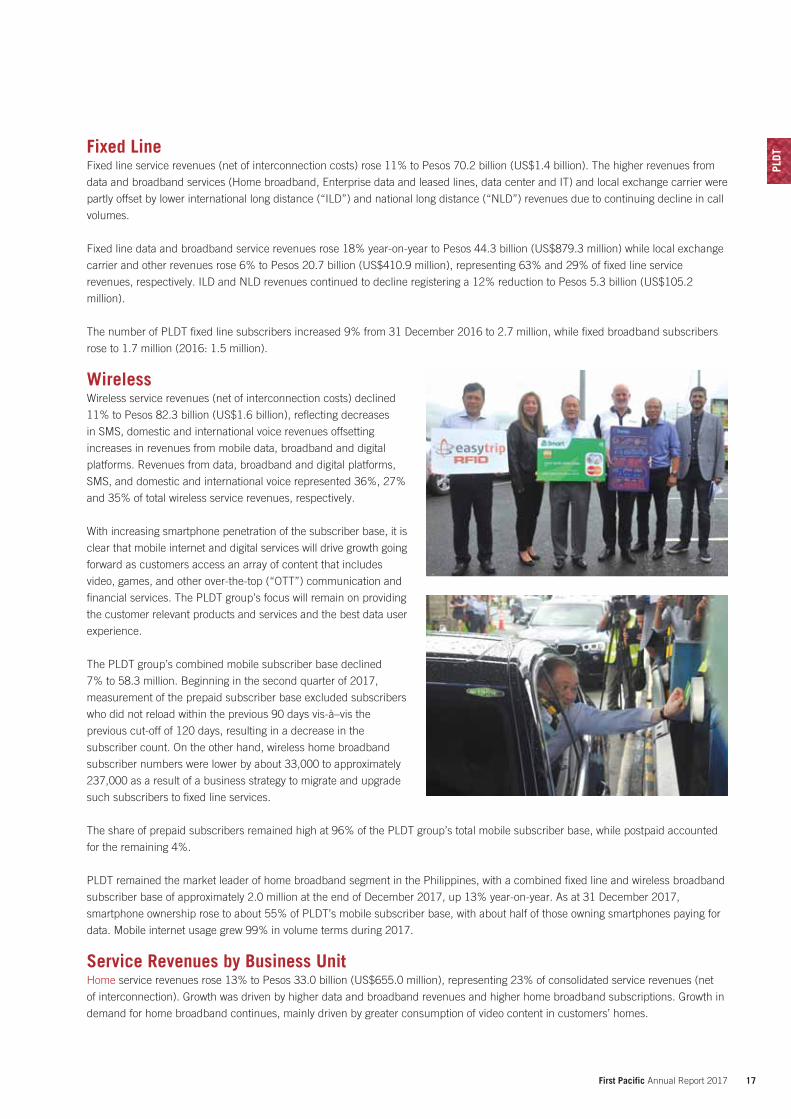
WirelessWireless service revenues (net of interconnection costs) declined
11% to Pesos 82.3 billion (US$1.6 billion), reflecting decreases
in SMS, domestic and international voice revenues offsetting
increases in revenues from mobile data, broadband and digital
platforms. Revenues from data, broadband and digital platforms,
SMS, and domestic and international voice represented 36%, 27%
and 35% of total wireless service revenues, respectively.
With increasing smartphone penetration of the subscriber base, it is
clear that mobile internet and digital services will drive growth going
forward as customers access an array of content that includes
video, games, and other over-the-top (“OTT”) communication and
financial services. The PLDT group’s focus will remain on providing
the customer relevant products and services and the best data user
experience.
The PLDT group’s combined mobile subscriber base declined
7% to 58.3 million. Beginning in the second quarter of 2017,
measurement of the prepaid subscriber base excluded subscribers
who did not reload within the previous 90 days vis-à–vis the
previous cut-off of 120 days, resulting in a decrease in the
subscriber count. On the other hand, wireless home broadband
subscriber numbers were lower by about 33,000 to approximately
237,000 as a result of a business strategy to migrate and upgrade
such subscribers to fixed line services.
The share of prepaid subscribers remained high at 96% of the PLDT group’s total mobile subscriber base, while postpaid accounted
for the remaining 4%.
PLDT remained the market leader of home broadband segment in the Philippines, with a combined fixed line and wireless broadband
subscriber base of approximately 2.0 million at the end of December 2017, up 13% year-on-year. As at 31 December 2017,
smartphone ownership rose to about 55% of PLDT’s mobile subscriber base, with about half of those owning smartphones paying for
data. Mobile internet usage grew 99% in volume terms during 2017.
Service Revenues by Business UnitHome service revenues rose 13% to Pesos 33.0 billion (US$655.0 million), representing 23% of consolidated service revenues (net
of interconnection). Growth was driven by higher data and broadband revenues and higher home broadband subscriptions. Growth in
demand for home broadband continues, mainly driven by greater consumption of video content in customers’ homes.
18 First Pacific Annual Report 2017
Review of Operations
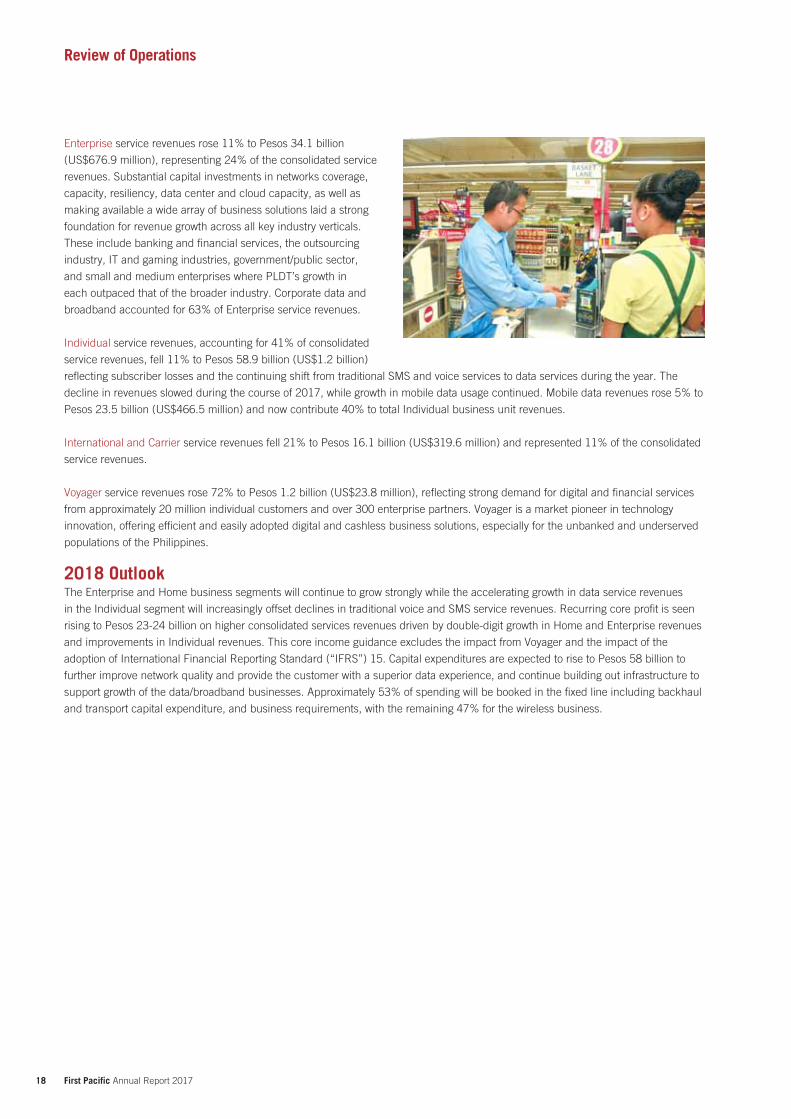
Enterprise service revenues rose 11% to Pesos 34.1 billion
(US$676.9 million), representing 24% of the consolidated service
revenues. Substantial capital investments in networks coverage,
capacity, resiliency, data center and cloud capacity, as well as
making available a wide array of business solutions laid a strong
foundation for revenue growth across all key industry verticals.
These include banking and financial services, the outsourcing
industry, IT and gaming industries, government/public sector,
and small and medium enterprises where PLDT’s growth in
each outpaced that of the broader industry. Corporate data and
broadband accounted for 63% of Enterprise service revenues.
Individual service revenues, accounting for 41% of consolidated
service revenues, fell 11% to Pesos 58.9 billion (US$1.2 billion)
reflecting subscriber losses and the continuing shift from traditional SMS and voice services to data services during the year. The
decline in revenues slowed during the course of 2017, while growth in mobile data usage continued. Mobile data revenues rose 5% to
Pesos 23.5 billion (US$466.5 million) and now contribute 40% to total Individual business unit revenues.
International and Carrier service revenues fell 21% to Pesos 16.1 billion (US$319.6 million) and represented 11% of the consolidated
service revenues.
Voyager service revenues rose 72% to Pesos 1.2 billion (US$23.8 million), reflecting strong demand for digital and financial services
from approximately 20 million individual customers and over 300 enterprise partners. Voyager is a market pioneer in technology
innovation, offering efficient and easily adopted digital and cashless business solutions, especially for the unbanked and underserved
populations of the Philippines.
2018 OutlookThe Enterprise and Home business segments will continue to grow strongly while the accelerating growth in data service revenues
in the Individual segment will increasingly offset declines in traditional voice and SMS service revenues. Recurring core profit is seen
rising to Pesos 23-24 billion on higher consolidated services revenues driven by double-digit growth in Home and Enterprise revenues
and improvements in Individual revenues. This core income guidance excludes the impact from Voyager and the impact of the
adoption of International Financial Reporting Standard (“IFRS”) 15. Capital expenditures are expected to rise to Pesos 58 billion to
further improve network quality and provide the customer with a superior data experience, and continue building out infrastructure to
support growth of the data/broadband businesses. Approximately 53% of spending will be booked in the fixed line including backhaul
and transport capital expenditure, and business requirements, with the remaining 47% for the wireless business.
19 First Pacific Annual Report 2017
PROFIT CONTRIBUTION
US$
118.3million
20 First Pacific Annual Report 2017
Review of Operations
MPIC’s infrastructure portfolio as at 20 March 2018 comprises the following assets offering a wide range of services:
Power distribution and generation 45.5% in Manila Electric Company (“Meralco”) through direct interest and its wholly-owned subsidiary Beacon Electric Asset
Holdings Inc. (“Beacon Electric”) 62.4% in Global Business Power Corporation (“GBPC”) through Beacon Electric and Meralco which in turn owns:
100.0% in Toledo Power Company (“TPC”) 100.0% in GBH Power Resource, Inc. (“GPRI”) 100.0% in Global Energy Supply Corporation (“GESC”) 89.3% in Panay Power Corporation (“PPC”) 89.3% in Panay Energy Development Corporation (“PEDC”) 52.2% in Cebu Energy Development Corporation (“CEDC”) 50.0% in Alsons Thermal Energy Corporation (“ATEC”)
Hospitals 60.1% interest in Metro Pacific Hospital Holdings, Inc. (“MPHHI”) which in turn owns:
100.0% in Colinas Verdes Hospital Managers Corporation, the operator of Cardinal Santos Medical Center (“CSMC”) 100.0% in East Manila Hospital Managers Corporation, the operator of Our Lady of Lourdes Hospital (“OLLH”) 100.0% in Metro Pacific Zamboanga Hospital Corporation, the operator of West Metro Medical Center (“WMMC”) 93.1% in Marikina Valley Medical Center Inc. (“MVMC”) 85.6% in Asian Hospital, Inc. (“AHI”), the owner of 100.0% of Asian Hospital and Medical Center 80.0% in St. Elizabeth Hospital, Inc. (“SEHI”) 78.0% in Riverside Medical Center, Inc. (“RMCI”) 65.0% in Delgado Clinic Inc. (“DCI”), the owner and operator of the Dr. Jesus C. Delgado Memorial Hospital (“JDMH”) 51.0% in Central Luzon Doctors’ Hospital Inc. (“CLDH”) 51.0% in De Los Santos Medical Center Inc. (“DLSMC”) 51.0% in Sacred Heart Hospital of Malolos Inc. (“SHHM”) 50.0% in Metro Sanitas Corporation, the owner of 51.0% of The Megaclinic, Inc. (“Megaclinic”) and 80.0% of TopHealth
Medical Clinics (“TopHealth”) 35.2% in Davao Doctors Hospital, Inc. (“DDH”) 32.8% in Medical Doctors, Inc. (“MDI”), the owner and operator of Makati Medical Center 20.0% in Manila Medical Services Inc. (“MMSI”), the owner and operator of Manila Doctors Hospital (“MDH”)
Rail 100.0% in Metro Pacific Light Rail Corporation which in turn owns 55.0% in Light Rail Manila Corporation (“LRMC”), the operator
of Light Rail Transit 1 (“LRT1”)
Logistics 100.0% in MetroPac Logistics Company, Inc. which owns 76.0% of MetroPac Movers, Inc. (“MMI”) which in turns owns 90.0% of
PremierLogistics, Inc. (“PLI”)
Toll roads 99.9% in MPTC which in turn owns:
75.3% in NLEX Corporation (formerly Manila North Tollways Corporation)
72.6% in Tollways Management Corporation (“TMC”) 66.0% in Easytrip Services Corporation (“ESC”) 100.0% in Cavitex Infrastructure Corporation (“CIC”) 100.0% in MPCALA Holdings, Inc. (“MPCALA”) 100.0% in Cebu Cordova Link Expressway Corporation
(“CCLEC”) 48.3% in PT Nusantara Infrastructure Tbk (“PT
Nusantara”) in Indonesia 44.9% in CII Bridges and Roads Investment Joint Stock
Co. (“CII B&R”) in Vietnam 29.5% in Don Muang Tollway Public Company Limited
(“DMT”) in Thailand
Water production, distribution and sewage management 52.8% in Maynilad Water Services, Inc. (“Maynilad”) 100.0% in MetroPac Water Investments Corporation (“MPW”) which in turn owns:
95.0% in Cagayan de Oro Bulk Water Inc. (“COBWI”) 80.0% of Metro Iloilo Bulk Water Supply Corporation (“MIBWSC”) 65.0% in Eco-System Technologies International, Inc. (“ESTII”) 49.0% in Watergy Business Solutions, Inc. (“WBSI”) 27.0% in Laguna Water District Aquatech Resources Corporation (“LARC”) 19.9% in Cebu Manila Water Development, Inc. (“CMWD”)
21 First Pacific Annual Report 2017
MPI
C
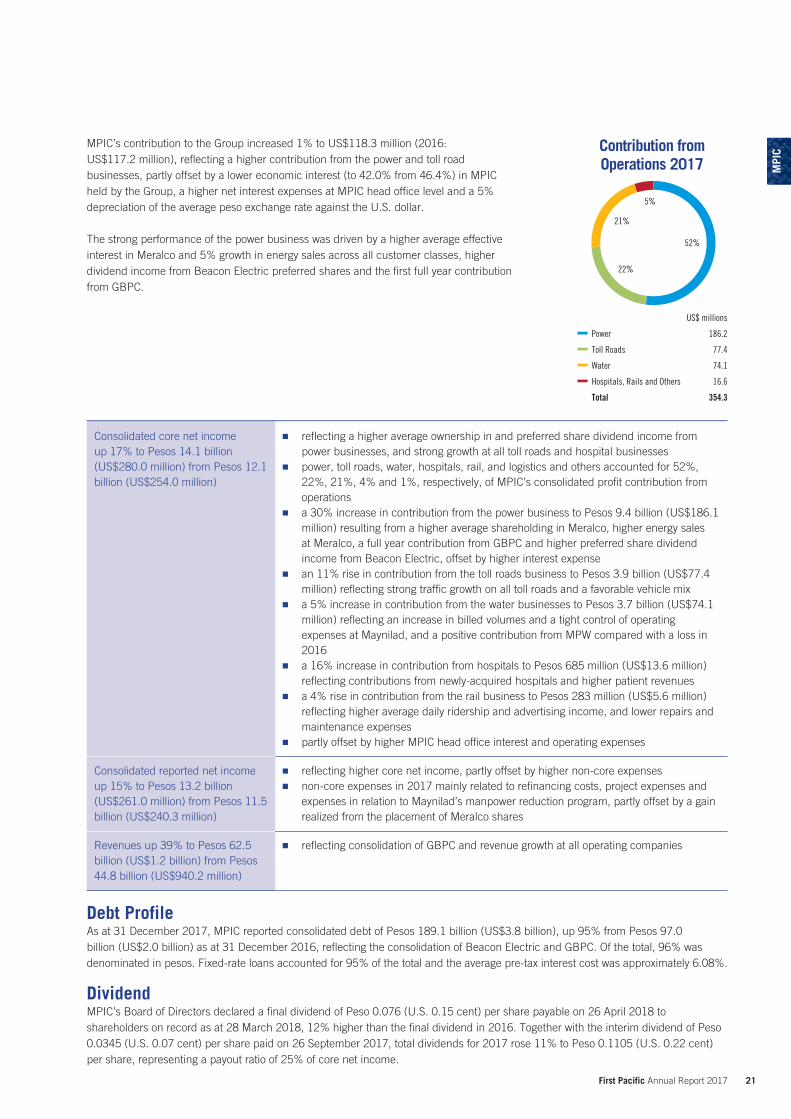
MPIC’s contribution to the Group increased 1% to US$118.3 million (2016: US$117.2 million), reflecting a higher contribution from the power and toll roadbusinesses, partly offset by a lower economic interest (to 42.0% from 46.4%) in MPIC held by the Group, a higher net interest expenses at MPIC head office level and a 5% depreciation of the average peso exchange rate against the U.S. dollar.
The strong performance of the power business was driven by a higher average effective interest in Meralco and 5% growth in energy sales across all customer classes, higher dividend income from Beacon Electric preferred shares and the first full year contribution from GBPC.
Consolidated core net income up 17% to Pesos 14.1 billion (US$280.0 million) from Pesos 12.1 billion (US$254.0 million)
reflecting a higher average ownership in and preferred share dividend income from power businesses, and strong growth at all toll roads and hospital businesses
power, toll roads, water, hospitals, rail, and logistics and others accounted for 52%, 22%, 21%, 4% and 1%, respectively, of MPIC’s consolidated profit contribution from operations
a 30% increase in contribution from the power business to Pesos 9.4 billion (US$186.1 million) resulting from a higher average shareholding in Meralco, higher energy sales at Meralco, a full year contribution from GBPC and higher preferred share dividend income from Beacon Electric, offset by higher interest expense
an 11% rise in contribution from the toll roads business to Pesos 3.9 billion (US$77.4 million) reflecting strong traffic growth on all toll roads and a favorable vehicle mix
a 5% increase in contribution from the water businesses to Pesos 3.7 billion (US$74.1 million) reflecting an increase in billed volumes and a tight control of operating expenses at Maynilad, and a positive contribution from MPW compared with a loss in 2016
a 16% increase in contribution from hospitals to Pesos 685 million (US$13.6 million) reflecting contributions from newly-acquired hospitals and higher patient revenues
a 4% rise in contribution from the rail business to Pesos 283 million (US$5.6 million) reflecting higher average daily ridership and advertising income, and lower repairs and maintenance expenses
partly offset by higher MPIC head office interest and operating expenses
Consolidated reported net income up 15% to Pesos 13.2 billion (US$261.0 million) from Pesos 11.5 billion (US$240.3 million)
reflecting higher core net income, partly offset by higher non-core expenses non-core expenses in 2017 mainly related to refinancing costs, project expenses and
expenses in relation to Maynilad’s manpower reduction program, partly offset by a gain realized from the placement of Meralco shares
Revenues up 39% to Pesos 62.5 billion (US$1.2 billion) from Pesos 44.8 billion (US$940.2 million)
reflecting consolidation of GBPC and revenue growth at all operating companies
Debt ProfileAs at 31 December 2017, MPIC reported consolidated debt of Pesos 189.1 billion (US$3.8 billion), up 95% from Pesos 97.0 billion (US$2.0 billion) as at 31 December 2016, reflecting the consolidation of Beacon Electric and GBPC. Of the total, 96% was denominated in pesos. Fixed-rate loans accounted for 95% of the total and the average pre-tax interest cost was approximately 6.08%.
DividendMPIC’s Board of Directors declared a final dividend of Peso 0.076 (U.S. 0.15 cent) per share payable on 26 April 2018 to shareholders on record as at 28 March 2018, 12% higher than the final dividend in 2016. Together with the interim dividend of Peso 0.0345 (U.S. 0.07 cent) per share paid on 26 September 2017, total dividends for 2017 rose 11% to Peso 0.1105 (U.S. 0.22 cent) per share, representing a payout ratio of 25% of core net income.
Contribution fromOperations 2017
US$ millions
Power 186.2
Toll Roads 77.4
Water 74.1
Hospitals, Rails and Others 16.6
Total 354.3
52%
22%
21%
5%
22 First Pacific Annual Report 2017
Review of Operations
Additional Investments and Asset PlacementOn 31 January 2017, MPHHI completed an agreement to invest approximately Pesos 134 million (US$2.7 million) of cash into DCI
through a subscription to preferred shares representing approximately 65% of the total expanded capital stock of DCI. DCI is the
owner and operator of the JDMH in Quezon City.
On 27 March 2017, a consortium consisting of MPIC, Covanta Energy, LLC and Macquarie Group, Ltd. was granted an Original
Proponent Status by the Quezon City Government for a 42-megawatt energy from waste project. MPIC is expected to invest
approximately Peso 4.0 billion (US$80.1 million) as its share in the project.
On 4 April 2017, MMI completed the acquisition of certain logistics-related assets and businesses of Ace Logistics, Inc. (“Ace”) for a
consideration of Pesos 280 million (US$5.6 million). Ace is involved in logistics, trucking, freight forwarding, customs brokerage and
domestic shipping businesses in the Philippines.
In April 2017, MPTC completed the acquisition of 7.0% interest in TMC from Egis Road Operation S.A. (“EROSA”) for a total
consideration of Peso 442.3 million (US$8.8 million) and 6.0% effective interest in TMC through Egis Investment Partners Philippines,
Inc.’s (“EIPPI”) acquisition of 13.0% ownership in TMC from EROSA for a total consideration of Peso 821.5 million (US$16.3 million).
EIPPI is 46.0% owned by MPTC.
On 13 June 2017, MPIC completed the placement of approximately 4.5% of Meralco shares to third-party investors at Pesos 250
(US$5.0) per share. The total consideration of the placing was Peso 12.7 billion (US$253.7 million) and the net proceeds were used
to partly fund the acquisition of the remaining 25.0% interest of Beacon Electric. Post the placement of Meralco shares, MPIC owns
directly approximately 10.5% in Meralco.
On 27 June 2017, MPIC completed the acquisition of the remaining 25.0% interest in Beacon Electric from PCEV which is a
subsidiary of PLDT Inc. The consideration was Pesos 21.8 billion (US$435.6 million). MPIC has paid Pesos 12.0 billion (US$239.8
million) in cash upfront to PCEV and the balance of Pesos 9.8 billion (US$196.3 million) is to be paid in equal annual installments
until June 2021. Following the transaction, Beacon Electric became a wholly-owned subsidiary of MPIC.
On 10 October 2017, MPTC completed the acquisition of additional 16.0% interest in ESC from Egis Easytrip Services SA for the total
consideration of Peso 84.8 million (US$1.7 million), bringing the total interest in ESC to 66.0%.
From October to December 2017, MPHHI completed the acquisitions of an aggregate 80.0% interest in SEHI for a total consideration
of Pesos 600.0 million (US$11.9 million). Founded in 1962, SEHI is a 248-bed tertiary level hospital at General Santos City in the
Philippines.
On 3 November 2017, MPTC completed the acquisition of approximately 42.25% interest in PT Nusantara with a consideration of
Pesos 6.9 billion (US$137.0 million). Together with MPTC’s earlier acquisitions, MPTC holds a total of approximately 48.3% interest
in PT Nusantara. PT Nusantara is an infrastructure holding company listed in Indonesia, with interests in toll roads, port operations,
energy and telecommunications businesses in Indonesia.
On 9 November 2017, MPW entered into an agreement to acquire 45% interest in BOO Phu Ninh Water Treatment Plant Joint Stock
Company (“BOO PNW”) for a consideration of Vietnamese Dong (“VND”) 272.4 billion (US$12.2 million). BOO PNW has a license
to serve clean water in the Chu Lai Open Economic Zone and adjacent areas in Quang Nam province in Vietnam. The transaction is
expected to be completed by March 2018.
On 27 November 2017, GBPC completed the acquisition of 50% interest in ATEC for a consideration of approximately Pesos 4.3
billion (US$85.4 million).
On 20 December 2017, MPW officially received from Metro Iloilo Water District (“MIWD”) the Notice of Award for the rehabilitation,
operation, maintenance and expansion of MIWD’s existing water distribution system and the provision of wastewater services.
Completion of conditions precedent to the signing of the joint venture agreement are ongoing with targeted completion by March
2018. MIWD’s service areas includes Iloilo city and seven municipalities having approximately 38,000 connections.
23 First Pacific Annual Report 2017
MPI
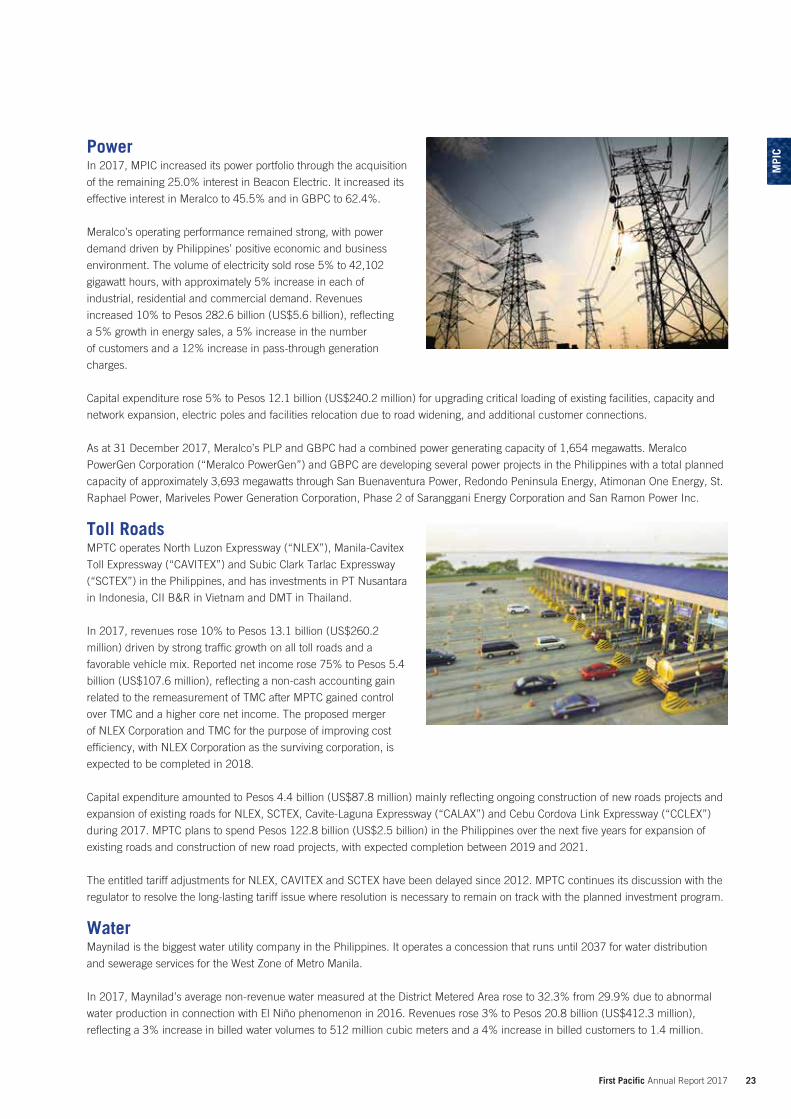
CPowerIn 2017, MPIC increased its power portfolio through the acquisition
of the remaining 25.0% interest in Beacon Electric. It increased its
effective interest in Meralco to 45.5% and in GBPC to 62.4%.
Meralco’s operating performance remained strong, with power
demand driven by Philippines’ positive economic and business
environment. The volume of electricity sold rose 5% to 42,102
gigawatt hours, with approximately 5% increase in each of
industrial, residential and commercial demand. Revenues
increased 10% to Pesos 282.6 billion (US$5.6 billion), reflecting
a 5% growth in energy sales, a 5% increase in the number
of customers and a 12% increase in pass-through generation
charges.
Capital expenditure rose 5% to Pesos 12.1 billion (US$240.2 million) for upgrading critical loading of existing facilities, capacity and
network expansion, electric poles and facilities relocation due to road widening, and additional customer connections.
As at 31 December 2017, Meralco’s PLP and GBPC had a combined power generating capacity of 1,654 megawatts. Meralco
PowerGen Corporation (“Meralco PowerGen”) and GBPC are developing several power projects in the Philippines with a total planned
capacity of approximately 3,693 megawatts through San Buenaventura Power, Redondo Peninsula Energy, Atimonan One Energy, St.
Raphael Power, Mariveles Power Generation Corporation, Phase 2 of Saranggani Energy Corporation and San Ramon Power Inc.
Toll RoadsMPTC operates North Luzon Expressway (“NLEX”), Manila-Cavitex
Toll Expressway (“CAVITEX”) and Subic Clark Tarlac Expressway
(“SCTEX”) in the Philippines, and has investments in PT Nusantara
in Indonesia, CII B&R in Vietnam and DMT in Thailand.
In 2017, revenues rose 10% to Pesos 13.1 billion (US$260.2
million) driven by strong traffic growth on all toll roads and a
favorable vehicle mix. Reported net income rose 75% to Pesos 5.4
billion (US$107.6 million), reflecting a non-cash accounting gain
related to the remeasurement of TMC after MPTC gained control
over TMC and a higher core net income. The proposed merger
of NLEX Corporation and TMC for the purpose of improving cost
efficiency, with NLEX Corporation as the surviving corporation, is
expected to be completed in 2018.
Capital expenditure amounted to Pesos 4.4 billion (US$87.8 million) mainly reflecting ongoing construction of new roads projects and
expansion of existing roads for NLEX, SCTEX, Cavite-Laguna Expressway (“CALAX”) and Cebu Cordova Link Expressway (“CCLEX”)
during 2017. MPTC plans to spend Pesos 122.8 billion (US$2.5 billion) in the Philippines over the next five years for expansion of
existing roads and construction of new road projects, with expected completion between 2019 and 2021.
The entitled tariff adjustments for NLEX, CAVITEX and SCTEX have been delayed since 2012. MPTC continues its discussion with the
regulator to resolve the long-lasting tariff issue where resolution is necessary to remain on track with the planned investment program.
WaterMaynilad is the biggest water utility company in the Philippines. It operates a concession that runs until 2037 for water distribution
and sewerage services for the West Zone of Metro Manila.
In 2017, Maynilad’s average non-revenue water measured at the District Metered Area rose to 32.3% from 29.9% due to abnormal
water production in connection with El Niño phenomenon in 2016. Revenues rose 3% to Pesos 20.8 billion (US$412.3 million),
reflecting a 3% increase in billed water volumes to 512 million cubic meters and a 4% increase in billed customers to 1.4 million.
24 First Pacific Annual Report 2017
Review of Operations
MPW provides bulk water supply services to water districts in Cebu
and Iloilo, and delivers treated water to residents in Laguna. The
capacity will increase to 390 million liters of water per day when
MPW’s existing water infrastructure projects are fully developed.
On 14 August 2017, MPW signed a joint venture agreement with
the Cagayan de Oro Water District (“COWD”) for the formation of
a joint venture company to undertake the supply of treated bulk
water to address the requirements of Cagayan de Oro City. The
project commenced operation on 31 December 2017. It has a
term of 30 years renewable for a further 20 years for the supply
of up to 100 million liters of treated bulk water per day. COWD
currently serves a population of more than 700,000 residents and
has approximately 85,000 service connections.
Maynilad’s Tariffs ArbitrationOn 29 December 2014, Maynilad’s water tariff under the rate rebasing for the period from 2013 to 2017 received a favorable award in
arbitration proceedings in the Philippines. However, the Metropolitan Waterworks and Sewerage System (“MWSS”) of the Philippines
has not yet acted on the arbitration award. Maynilad subsequently proceeded to arbitration in Singapore and the final hearing was
completed in December 2016. On 24 July 2017, the three-person Arbitral Tribunal (the “Tribunal”) unanimously upheld the validity of
Maynilad’s claim against the Undertaking Letter issued by the Republic of the Philippines (“the Republic”), through the Department of
Finance, to compensate Maynilad for the delayed implementation of its relevant tariffs for the above mentioned rebasing period.
The Tribunal ordered the Republic to reimburse Maynilad Pesos 3.4 billion (US$68.1 million) (subsequently adjusted to Peso 3.2
billion (US$64.1 million)) for losses from 11 March 2015 to 31 August 2016, without prejudice to any rights that Maynilad may have
to seek recourse against MWSS for losses incurred from 1 January 2013 to 10 March 2015. Further, the Tribunal ruled that Maynilad
is entitled to recover from the Republic its losses from 1 September 2016. On 9 February 2018, the Republic filed an application with
the High Court of Singapore to set aside the arbitration award issued on 24 July 2017 and seeks to have a sealed hearing rather than
an open court process.
This further delay in settling the entitled water tariffs has no direct impact on the current rate rebasing timeline.
Despite the delay in the tariff increase it is entitled to, Maynilad remains committed to enhancing its services to customers. In 2017, it
repaired 26,792 leaking pipes, installed 38 kilometers of water pipes and expanded its distribution line to 7,675 kilometers. Drinking
water supply and sewerage coverage were 93% and 15% of the concession area’s population, respectively. Capital expenditure rose
24% to Pesos 12.0 billion (US$238.3 million) for upgrading and constructing reservoirs and pumping stations, laying of new primary
pipes, and construction of wastewater treatment facilities. Maynilad is building six new sewage treatment facilities for serving over 1.3
million customers in its concession area.
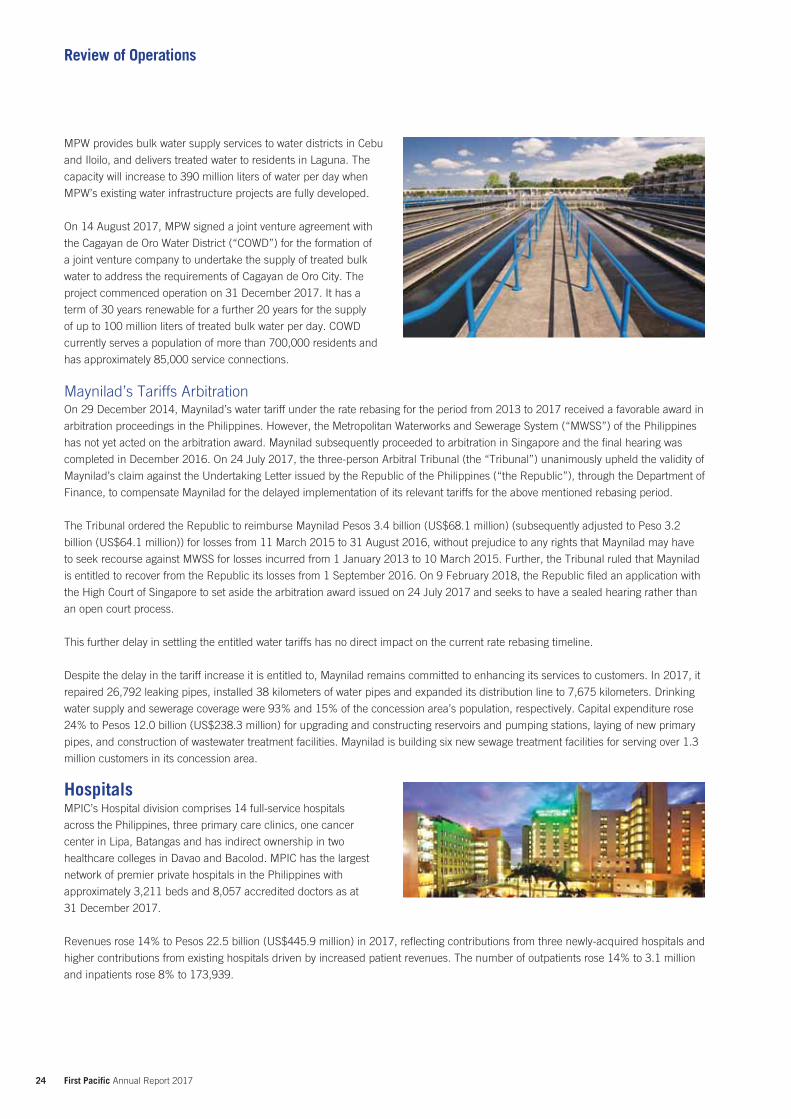
HospitalsMPIC’s Hospital division comprises 14 full-service hospitals
across the Philippines, three primary care clinics, one cancer
center in Lipa, Batangas and has indirect ownership in two
healthcare colleges in Davao and Bacolod. MPIC has the largest
network of premier private hospitals in the Philippines with
approximately 3,211 beds and 8,057 accredited doctors as at
31 December 2017.
Revenues rose 14% to Pesos 22.5 billion (US$445.9 million) in 2017, reflecting contributions from three newly-acquired hospitals and
higher contributions from existing hospitals driven by increased patient revenues. The number of outpatients rose 14% to 3.1 million
and inpatients rose 8% to 173,939.
25 First Pacific Annual Report 2017
MPI
C
MPHHI aims to expand its portfolio to 5,000 beds and contribute to the enhancement of healthcare services in the Philippines by
expanding the number, capacities and capabilities of its hospitals, upgrading facilities, expanding in non-hospital based primary care
clinics, establishing specialty healthcare facilities such as cancer centers, a central laboratory, greenfield specialist hospitals and
creating synergies across the network.
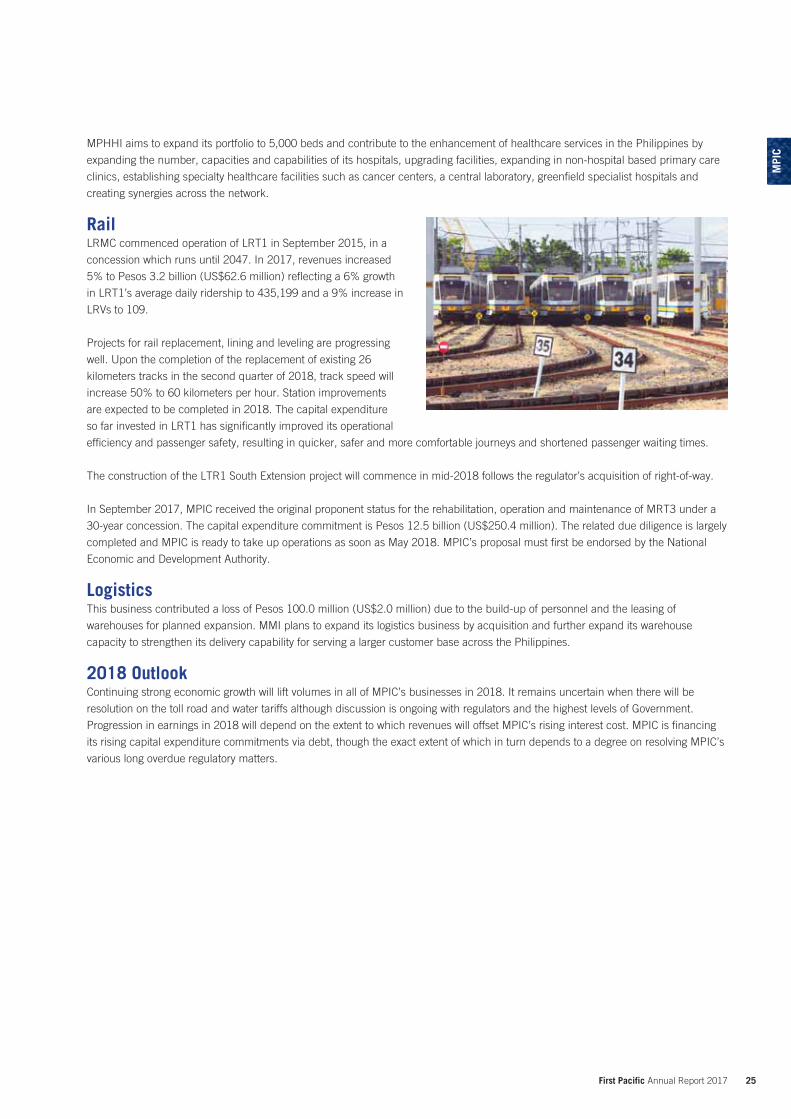
RailLRMC commenced operation of LRT1 in September 2015, in a
concession which runs until 2047. In 2017, revenues increased
5% to Pesos 3.2 billion (US$62.6 million) reflecting a 6% growth
in LRT1’s average daily ridership to 435,199 and a 9% increase in
LRVs to 109.
Projects for rail replacement, lining and leveling are progressing
well. Upon the completion of the replacement of existing 26
kilometers tracks in the second quarter of 2018, track speed will
increase 50% to 60 kilometers per hour. Station improvements
are expected to be completed in 2018. The capital expenditure
so far invested in LRT1 has significantly improved its operational
efficiency and passenger safety, resulting in quicker, safer and more comfortable journeys and shortened passenger waiting times.
The construction of the LTR1 South Extension project will commence in mid-2018 follows the regulator’s acquisition of right-of-way.
In September 2017, MPIC received the original proponent status for the rehabilitation, operation and maintenance of MRT3 under a
30-year concession. The capital expenditure commitment is Pesos 12.5 billion (US$250.4 million). The related due diligence is largely
completed and MPIC is ready to take up operations as soon as May 2018. MPIC’s proposal must first be endorsed by the National
Economic and Development Authority.
LogisticsThis business contributed a loss of Pesos 100.0 million (US$2.0 million) due to the build-up of personnel and the leasing of
warehouses for planned expansion. MMI plans to expand its logistics business by acquisition and further expand its warehouse
capacity to strengthen its delivery capability for serving a larger customer base across the Philippines.
2018 OutlookContinuing strong economic growth will lift volumes in all of MPIC’s businesses in 2018. It remains uncertain when there will be
resolution on the toll road and water tariffs although discussion is ongoing with regulators and the highest levels of Government.
Progression in earnings in 2018 will depend on the extent to which revenues will offset MPIC’s rising interest cost. MPIC is financing
its rising capital expenditure commitments via debt, though the exact extent of which in turn depends to a degree on resolving MPIC’s
various long overdue regulatory matters.
26 First Pacific Annual Report 2017
Review of Operations
PROFIT CONTRIBUTION
US$
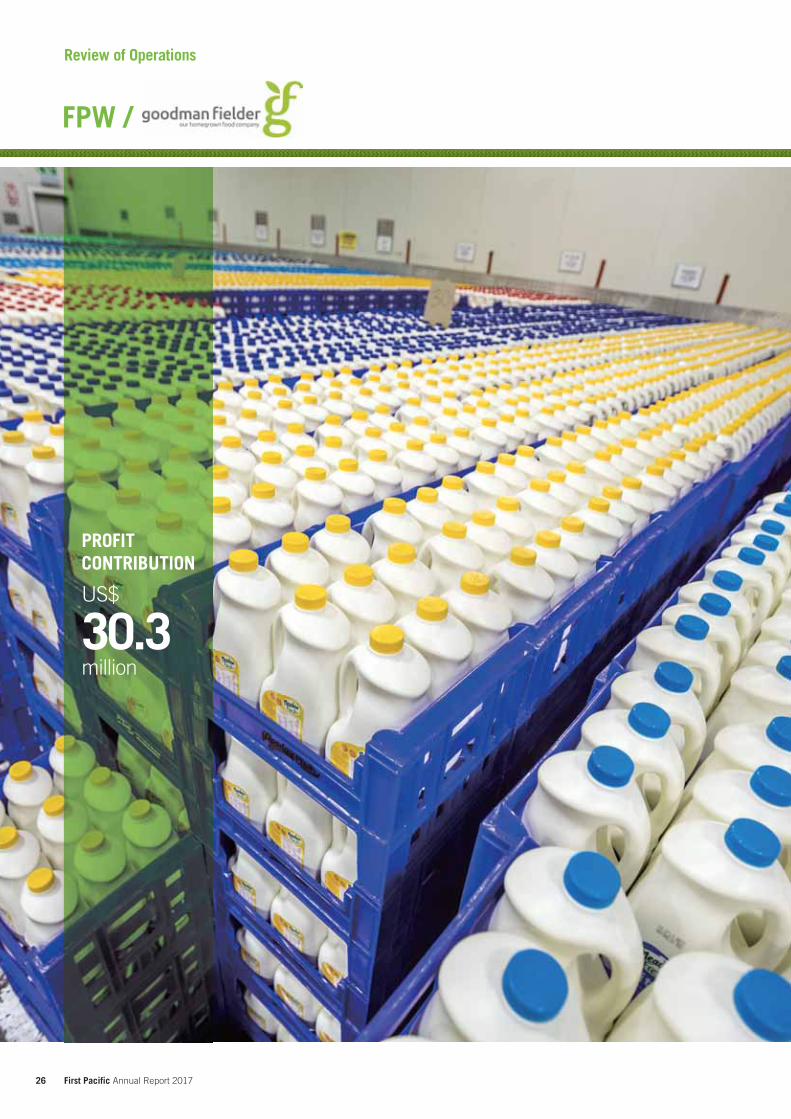
30.3million
27 First Pacific Annual Report 2017
FPW
/ Go
odm
an F
ield
er
FPW’s contribution to the Group increased 26% to US$30.3
million (2016: US$24.0 million) reflecting a higher core net
income at Goodman Fielder and a stronger average Australian
dollar exchange rate against the U.S. dollar.
In 2017, Goodman Fielder’s core net income rose 19% to A$80.1
million (US$61.1 million) driven by higher profit contributions
from businesses in Australia owing to efficiency gains, cost
saving initiatives, and facilities/network optimization, and growth
from the Fiji operations, partly offset by lower contributions from
Papua New Guinea and start-up losses from the new Ingredients
initiative. A non-recurring loss of A$117.1 million (US$90.5
million) at the Goodman Fielder level brought the reported profit
to a loss of A$35.5 million (US$27.3 million). The non-recurring
loss was due to site optimization costs in Australia and in New Zealand, business restructuring costs and a non-cash impairment of an
intangible asset. The site optimization and restructuring costs are expected to improve the underlying business performance in 2018
and onward.
Sales increased 5% to A$2.1 billion (US$1.6 billion) and normalized EBIT up 6% to A$143.7 million (US$110.5 million). Capital
expenditure rose 75% to A$142.1 million (US$109.2 million) to fund key projects for growth, automation, cost out as well as
maintenance initiatives.
International BusinessGoodman Fielder offers a wide range of high-quality consumer products to consumers in Fiji, Papua New Guinea, New Caledonia,
China, the Philippines, Indonesia, Vietnam and other emerging markets in Asia Pacific under popular brands including Praise, Olive
Grove, Meadow Fresh, Meadow Lea, Flame, Tuckers, Crest, White Wings and Pilot.
Sales from the International business rose 7% on healthy growth in key markets, partly offset by a weaker performance in Papua New
Guinea. Sales contributions from Fiji, China and New Caledonia rose 12%, 15% and 12%, respectively. The operations in Papua New
Guinea were on track for recovery and its sales recorded a slight decline on prior period.
In Fiji, growth driven was by increased volumes in all product categories, led by the poultry category.
In 2017, sales volume of Meadow Fresh UHT milk in China and Southeast Asia rose 16.7%.
In Papua New Guinea, operational issues stemming from the second half of 2016 were addressed with profit recovery. Management
has focused on regaining market share of the Flour business, improving mill efficiency and cost savings in procurement, logistics and
overheads. The site for a new flour mill has been acquired and preparation for construction of the plant is underway.
In addition to UHT milk, Goodman Fielder also increased exports of whipping cream, butter and cheese products to the Food Service
and Retail markets across China, Southeast Asia and Pacific Islands.
New Zealand BusinessGoodman Fielder has 13 manufacturing facilities in New
Zealand producing a wide range of high-quality dairy, baked and
grocery products. It also exports Meadow Fresh UHT milk to its
International markets.
In 2017, New Zealand sales rose 6% mainly reflecting higher
selling prices for milks, spreads and butter products, growth in the
dairy category (cheese, yoghurts and creams) and grocery (spreads
and convenience meals) businesses. The newly launched oils and
flavor enhancers were well received by consumers.
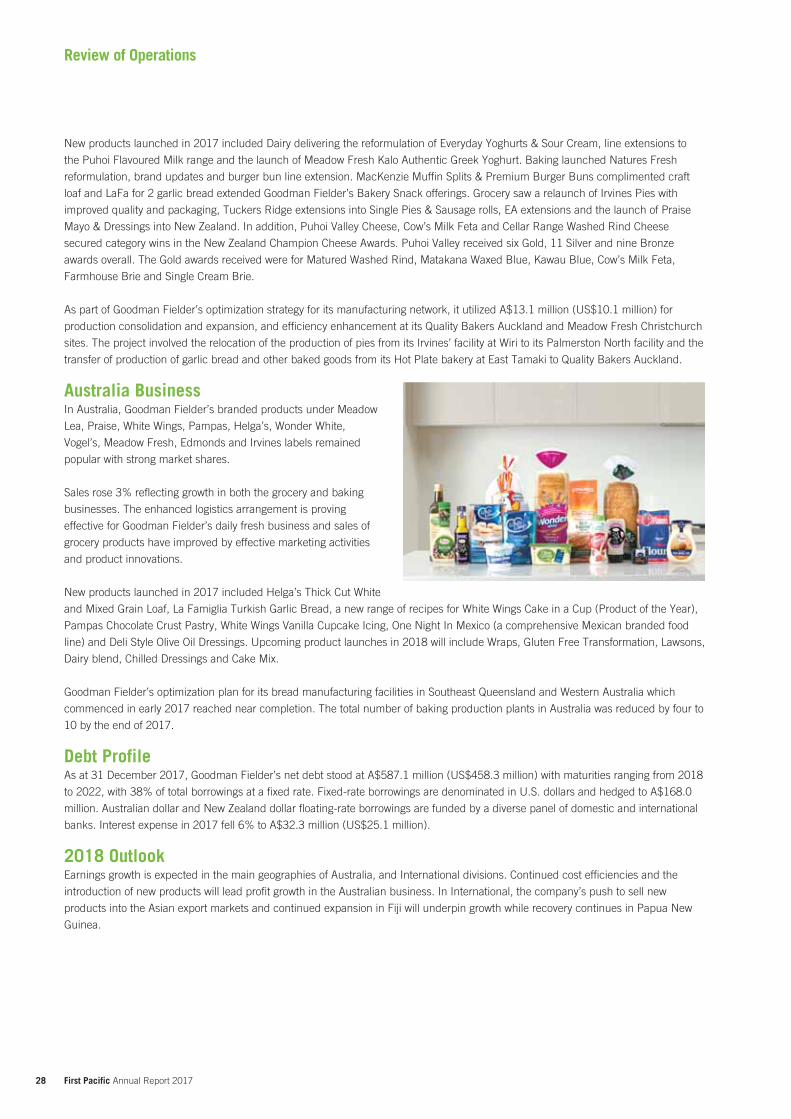
28 First Pacific Annual Report 2017
Review of Operations
New products launched in 2017 included Dairy delivering the reformulation of Everyday Yoghurts & Sour Cream, line extensions to
the Puhoi Flavoured Milk range and the launch of Meadow Fresh Kalo Authentic Greek Yoghurt. Baking launched Natures Fresh
reformulation, brand updates and burger bun line extension. MacKenzie Muffin Splits & Premium Burger Buns complimented craft
loaf and LaFa for 2 garlic bread extended Goodman Fielder’s Bakery Snack offerings. Grocery saw a relaunch of Irvines Pies with
improved quality and packaging, Tuckers Ridge extensions into Single Pies & Sausage rolls, EA extensions and the launch of Praise
Mayo & Dressings into New Zealand. In addition, Puhoi Valley Cheese, Cow’s Milk Feta and Cellar Range Washed Rind Cheese
secured category wins in the New Zealand Champion Cheese Awards. Puhoi Valley received six Gold, 11 Silver and nine Bronze
awards overall. The Gold awards received were for Matured Washed Rind, Matakana Waxed Blue, Kawau Blue, Cow’s Milk Feta,
Farmhouse Brie and Single Cream Brie.
As part of Goodman Fielder’s optimization strategy for its manufacturing network, it utilized A$13.1 million (US$10.1 million) for
production consolidation and expansion, and efficiency enhancement at its Quality Bakers Auckland and Meadow Fresh Christchurch
sites. The project involved the relocation of the production of pies from its Irvines’ facility at Wiri to its Palmerston North facility and the
transfer of production of garlic bread and other baked goods from its Hot Plate bakery at East Tamaki to Quality Bakers Auckland.
Australia BusinessIn Australia, Goodman Fielder’s branded products under Meadow
Lea, Praise, White Wings, Pampas, Helga’s, Wonder White,
Vogel’s, Meadow Fresh, Edmonds and Irvines labels remained
popular with strong market shares.
Sales rose 3% reflecting growth in both the grocery and baking
businesses. The enhanced logistics arrangement is proving
effective for Goodman Fielder’s daily fresh business and sales of
grocery products have improved by effective marketing activities
and product innovations.
New products launched in 2017 included Helga’s Thick Cut White
and Mixed Grain Loaf, La Famiglia Turkish Garlic Bread, a new range of recipes for White Wings Cake in a Cup (Product of the Year),
Pampas Chocolate Crust Pastry, White Wings Vanilla Cupcake Icing, One Night In Mexico (a comprehensive Mexican branded food
line) and Deli Style Olive Oil Dressings. Upcoming product launches in 2018 will include Wraps, Gluten Free Transformation, Lawsons,
Dairy blend, Chilled Dressings and Cake Mix.
Goodman Fielder’s optimization plan for its bread manufacturing facilities in Southeast Queensland and Western Australia which
commenced in early 2017 reached near completion. The total number of baking production plants in Australia was reduced by four to
10 by the end of 2017.
Debt ProfileAs at 31 December 2017, Goodman Fielder’s net debt stood at A$587.1 million (US$458.3 million) with maturities ranging from 2018
to 2022, with 38% of total borrowings at a fixed rate. Fixed-rate borrowings are denominated in U.S. dollars and hedged to A$168.0
million. Australian dollar and New Zealand dollar floating-rate borrowings are funded by a diverse panel of domestic and international
banks. Interest expense in 2017 fell 6% to A$32.3 million (US$25.1 million).
2018 OutlookEarnings growth is expected in the main geographies of Australia, and International divisions. Continued cost efficiencies and the
introduction of new products will lead profit growth in the Australian business. In International, the company’s push to sell new
products into the Asian export markets and continued expansion in Fiji will underpin growth while recovery continues in Papua New
Guinea.
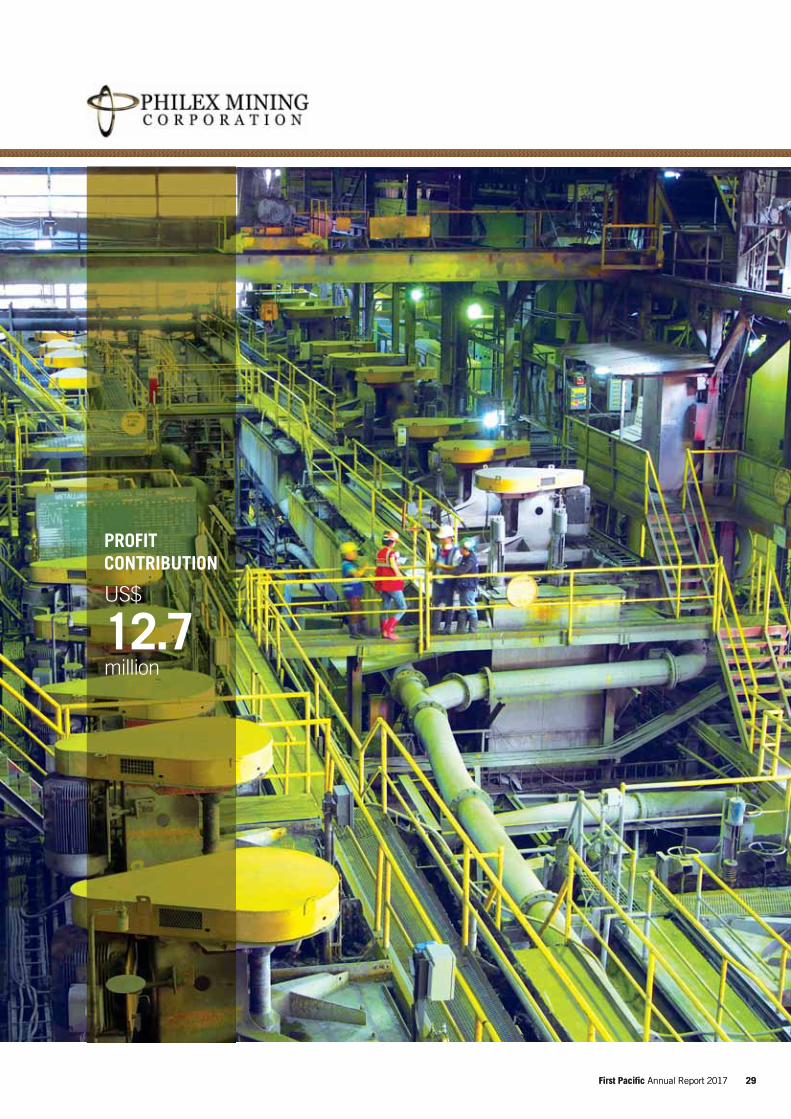
29 First Pacific Annual Report 2017
PROFIT CONTRIBUTION
US$
12.7million
29 First Pacific Annual Report 2017
30 First Pacific Annual Report 2017
Review of Operations
Philex’s natural resources portfolio as at 20 March 2018 comprises:
Philex for metal-related assets 100% in Padcal mine
100% in Silangan Mindanao Exploration Co., Inc. (“SMECI”)
100% in Silangan Mindanao Mining Co., Inc.
100% in Philex Gold Philippines, Inc.
99.0% in Lascogon Mining Corporation
5% in Kalayaan Copper Gold Resources, Inc.
PXP Energy Corporation (“PXP”)* for energy- and hydrocarbon-related assets 75.9% † in Forum Energy Limited (“Forum”) which owns 70.0% of Service Contract (“SC”) 72, and a 2.3% interest in the Galoc oil
field (SC 14C-1) which is in the production stage, both of these assets are located in the West Philippine Sea
53.4% in Pitkin Petroleum Limited which owns 25% of Peru Block Z-38, an oil and gas exploration asset located in offshore Peru
50.0% in SC 75 and 70.0% in SC 74, both located in Northwest Palawan
* 19.8% held by Philex, 25.0% held by First Pacific and 7.7% held by Two Rivers Pacific Holdings Corporation, a Philippine affiliate of First Pacific.† 72.2% held directly by PXP and 6.8% held by PXP’s 55.0%-owned subsidiary FEC Resources, Inc., for a total effective interest of 75.9% held by PXP.
Ore Milled
13 14 15 16 177
8
9
10
Million tonnes
Operating Cost PerTonne of Ore Milled
13 14 15 16 17750
800
850
900
Pesos
Operating Cost PerTonne of Ore Milled
Pesosper tonne
Materials & supplies 209
Power 142
Depreciation & amortization 179
Labor 103
Smelting charges 97
Excise tax and royalties 52
Others 55
Total 837
7%6% 25%
12%
12%
21%
17%
Average Gold PricePer Ounce
13 14 15 16 171,100
1,200
1,300
1,400
US$
Average Copper PricePer Pound
13 14 15 16 172.0
2.5
3.0
3.5
US$
31 First Pacific Annual Report 2017
Phile
x
In addition to working toward adopting ISO 26000: Guidance on Social Responsibility, Philex has spearheaded the Philippine Chamber
of Mine’s adoption of the Mining Association of Canada’s Towards Sustainable Mining (“TSM”) Initiative in December 2017, making
the TSM protocol mandatory for all Chamber members, and has begun to adopt the TSM in its company policies and programs. This
move will further strengthen the company’s adherence to internationally-recognized mining, environmental and safety standards
needed to address social responsibilities relevant to its operations and processes, stakeholders and environmental impact.
Philex’s contribution to the Group increased 25% to US$12.7 million (2016: US$10.2 million) reflecting higher realized metal prices.
The average realized price of copper and gold rose 26% to US$2.96 per pound and 2% to US$1,273 per ounce, respectively. This
positive factor, however, was partly offset by lower volumes of metal sold resulting from lower production volumes.
Total ore milled decreased 7% to 8.7 million tonnes, due primarily
to a higher-than-normal proportion of bouldery ore in newly
commissioned draw-points, which caused premature wear and
tear on equipment leading to equipment availability issues. During
2017, gold grade at Padcal averaged 0.377 grams per tonne (2016:
0.417 grams per tonne) while average copper grade was 0.192%
(2016: 0.206%). As a result of lower metal grades and tonnage
milled, gold production fell 18% to 84,638 ounces and copper
production decreased 14% to 30.1 million pounds.
During 2017, Philex repaid US$13 million of outstanding short-
term bank debts. As at 31 December 2017, it had Pesos 583
million (US$11.7 million) of cash and cash equivalents, and Pesos
9.4 billion (US$188.2 million) of borrowings, comprising bonds
payable and short-term bank loans. Short-term bank debt declined 21% to Pesos 2.4 billion (US$49.0 million).
Core net income up 2% to Pesos 1.7
billion (US$33.5 million) from Pesos
1.7 billion (US$34.8 million)
reflecting higher realized metal prices
lower cash cost and other charges
partly offset by lower tonnage and metal grades
Net income up 6% to Pesos 1.7
billion (US$32.9 million) from Pesos
1.6 billion (US$33.3 million)
reflecting higher core net income
lower foreign exchange losses
Revenue down 3% to Pesos 10.0
billion (US$198.2 million) from
Pesos 10.3 billion (US$216.1
million)
reflecting lower metal output due to lower tonnage and metal grades
partly offset by higher realized metal prices and favorable foreign exchange rates
revenues from gold, copper and silver contributed 54%, 45% and 1% of the total,
respectively
EBITDA up 3% to Pesos 4.0 billion
(US78.9 million) from Pesos 3.9
billion (US$81.8 million)
reflecting a lower cash production cost resulting from lower power consumption,
reduced cost of contracted work and other expenses
continued implementation of effective cost-management initiatives
Operating cost per tonne of
ore milled up 6% to Pesos 837
(US$16.6) from Pesos 793
(US$16.6)
arising from higher depreciation and amortization costs due to amortization of newly
commissioned draw-points, despite lower cash production cost
Capital expenditure (including
exploration costs) remained at
Pesos 2.4 billion (US$46.7 million)
from Pesos 2.4 billion (US$50.3
million)
reflecting lower capital expenditure for the Silangan project
partly offset by higher capital expenditures for Padcal mine and Philex head office, and
for other mineral exploration projects
The mine life of Philex’s major operating metal asset Padcal mine was extended to 2022 in October 2015 with additional reserves
declared.
32 First Pacific Annual Report 2017
Review of Operations
DividendsPhilex’s Board of Directors declared a final cash dividend of Peso
0.04 (U.S. 0.080 cent) per share payable on 26 March 2018
to shareholders on record as at 13 March 2018. Together with
the interim cash dividend of Peso 0.04 (U.S. 0.080 cent) per
share paid on 6 December 2017, total cash dividends for 2017
amounted to Peso 0.08 (U.S. 0.16 cent) (2016: Peso 0.07 (U.S.
0.143 cent)) per share, representing a payout ratio of 23% of core
net income against 21% in 2016.
Silangan ProjectThe gold and copper project is located in Surigao del Norte, Northeastern Mindanao in the Philippines. The project has secured
and currently maintains all major permits from the Department of Environment and Natural Resources (“DENR”) including
environmental compliance certification (“ECC”), a tree-cutting permit and approved Declaration of Mining Project Feasibility. Key
aspects of the studies to date are a starter mine to initially extract the near surface ore and improve the groundwater condition of
the ensuing underground mine, and an underground mine will be developed immediately to extract most of the ore for the planned
mine life. These studies are being advanced to include more details to support requirements for project financing. The project has
not yet commenced development. Meanwhile, community development and environment enhancement programs are continuing in
compliance with the ECC conditions and environmental, social and governance (“ESG”) commitments to the local communities.
The DENR Administrative Order (“DAO”) 2017-10 banning the use of open-pit mining in the Philippines remains to be in effect.
Under the Philippine Mining Act of 1995, surface mining such as open-pit mining is allowed in the Philippines.
PXPDuring 2017, petroleum revenues rose 3% to Pesos 104 million (US$2.1 million) as a result of higher crude oil prices, partly offset
by lower oil output in the Galoc oil field. Costs and expenses fell 7% to Pesos 158 million (US$3.1 million) reflecting lower crude oil
output and containment of overhead expenses.
SC 72The property covered by SC 72 is located in the Reed Bank (Recto Bank) which lies within the Philippines’ Exclusive Economic Zone
(“EEZ”). Its second sub-phase of exploration activities is currently suspended due to a force majeure imposed since 15 December
2014.
On 12 July 2016, the Permanent Court of Arbitration made a favorable decision confirming that PXP’s service contracts, particularly
SC 72, are within the Philippine’s EEZ. PXP, through Forum, will take guidance from the Philippine Government in respect of any
future activity in SC 72 and other areas covered by the court’s decision. Upon the lifting of the force majeure, Forum will have 20
months to drill two wells as required by its license for SC 72.
The Philippines and China held the second Bilateral Consultation Meeting (“BCM”) on West Philippine Sea (“WPS”) in Manila on
13 February 2018. The two countries have agreed to set up a special panel to work out how they can jointly explore oil and gas in
parts of the WPS that both sides claim without having to address the issue of sovereignty. In addition, they reaffirmed the importance
of maintaining and promoting peace and stability, freedom of navigation in and over flight above the WPS, freedom of international
commerce, and other peaceful uses of the sea. Finally, the two countries agreed to address territorial and jurisdictional disputes by
peaceful means, without resorting to the threat or use of force, through friendly consultations and negotiations by sovereign states
directly concerned, in accordance with universally recognized principles of international law, including the Charter of the United
Nations and the 1982 UN Convention on the Law of the Seas (“UNCLOS”).
The third meeting of the BCM will be held in China in the second half of 2018.
33 First Pacific Annual Report 2017
Phile
xSC 75The property covered by SC 75 is located in Northwest Palawan. It has been under force majeure since 27 December 2015. Upon the
lifting of the force majeure, PXP will have 18 months to obtain 1,000 square kilometers of 3D seismic data for sub-phase 2.
PXP will continue to coordinate with the Philippine Department of Energy (“DOE”) on the immediate lifting of force majeure for both
SC 72 and SC 75.
OthersIn 2017, SC 14C-1 Galoc Field produced a total of approximately 1.5 million barrels of oil. About 1.1 million barrels of oil are
scheduled for 2018 of which the first lifting of approximately 300,000 barrels oil was completed in January 2018. Production of oil will
continue to decline as a result of the field nearing the end of its life.
SC 74 Linapacan Block and SC 14C-2 West Linapacan are in different stages of data processing and interpretation.
Peru Block Z-38 in Peru has been under force majeure since 1 September 2013. Upon the lifting of the force majeure, Pitkin will have
22 months to complete the required works for the third exploration period. In January 2018, Pitkin’s partner for this project Karoon
Gas Australia Ltd. (“Karoon”) has agreed the financial participation of Tullow Oil Plc. (UK) (“Tullow”) for drilling the well – Marina-1
while Karoon remains the project’s operator.
2018 OutlookExpansion to new mine levels at Padcal mine will ensure steady volumes and better quality of ore for the current year and beyond.
Exploration of nearby sites continues, with guarded optimism for discovering economically viable ore bodies that will provide a pipeline
for sustained production at Padcal mine. To this end, engineering studies are underway to increase the volume of available storage
facilities to accommodate additional tailings as well as other mine waste management technologies and provide the basis for further
mine life extension after 2022.
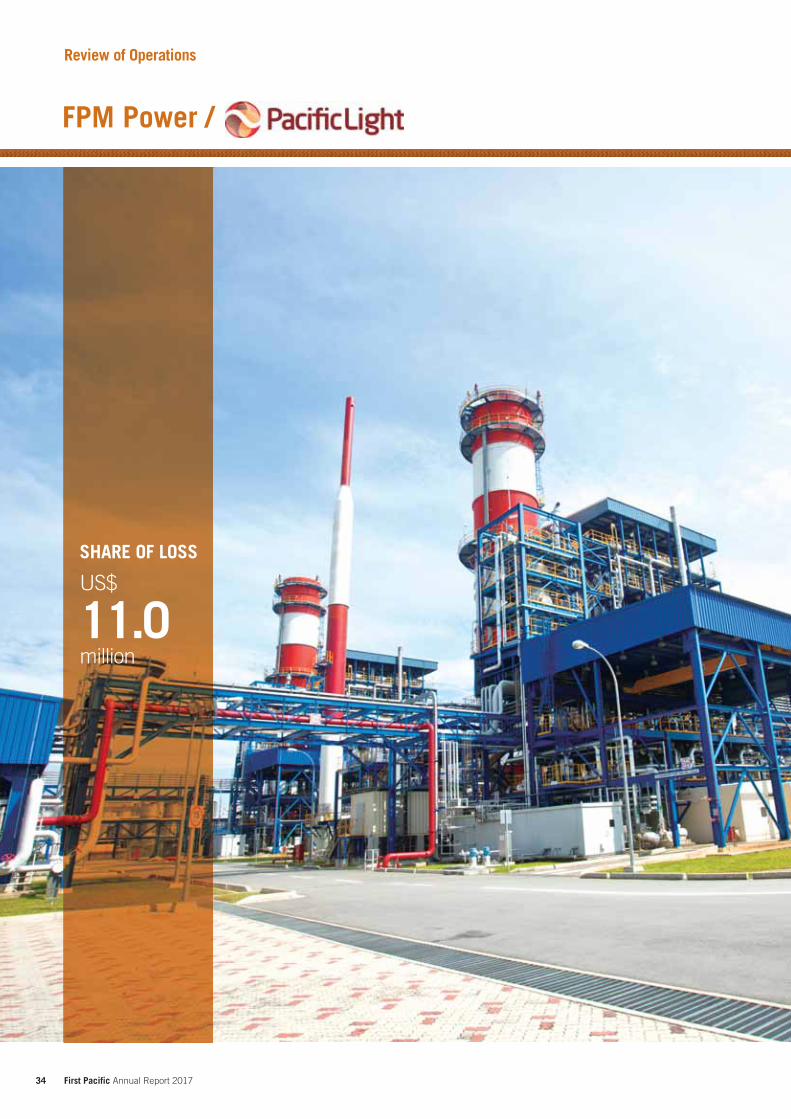
34 First Pacific Annual Report 2017
Review of Operations
SHARE OF LOSS
US$
11.0million
35 First Pacific Annual Report 2017
FPM
Pow
er /
PLP
First Pacific holds a 70% interest in PLP through a 60/40-owned entity with Meralco PowerGen. PLP is the first power plant in
Singapore fully fueled by liquefied natural gas and is equipped with some of the most modern and efficient facilities for power
generation. The plant’s fuel is provided by Shell Gas (formerly known as BG Group) under a long-term agreement through the SLNG
Terminal developed by the Singaporean Government.
First Pacific’s share of FPM Power’s loss narrowed 21% to US$11.0 million, reflecting a lower core loss at PLP.
In 2017, the plant’s system availability remained high at 95.3% and the heat rate exceeded its target level by 3.5%.
During 2017, the volume of electricity sold decreased 5% to 4,768 gigawatt hours, of which 90% was for retail, vesting contracts,
futures and contracts for differences sales, and the remaining 10% was for pool market sales. PLP’s generation market share for 2017
was approximately 9.3%.
Core net loss down 8% to S$80.9 million (US$58.9 million) from S$88.0 million (US$63.7 million)
reflecting a higher contribution from an improved margin for retail market sales
following a rebound in oil prices
a gain from improved heat rate gain from contracts for differences sales to other
generation companies
partly offset by a lower margin associated with pool market sales
Net loss down 29% to S$76.6 million (US$55.7 million) from S$108.6 million (US$78.6 million)
reflecting a lower core net loss
a lower provision for onerous contract
recorded foreign exchange gains on US$ denominated shareholders’ loans versus
losses in 2016
Revenues down 2% to S$776.8 million (US$565.4 million) from S$795.0 million (US$575.3 million)
reflecting a lower average selling price per unit of electricity sold to the retail market
partly offset by a higher average selling price per unit of electricity sold to the pool
market
Operating expenses down 7% to S$22.1 million (US$16.1 million) from S$23.7 million (US$17.1 million)
reflecting lower depreciation and insurance expenses
EBITDA up 171% to S$13.0 million (US$9.5 million) from S$4.8 million (US$3.5 million)
reflecting higher contribution from an improved margin for retail market sales
improvement of power plant availability
a gain from contracts for differences sales to other electricity generation companies
Debt ProfileAs at 31 December 2017, FPM Power’s net debt stood at US$509.1 million while gross debt stood at US$566.8 million with 16% of
debts maturing in 2018 and remaining borrowings maturing in the period 2019-2021. All of the borrowings were floating-rate bank
loans, with 46% effectively changed to fixed-rate borrowings through interest rate swap arrangements.
2018 OutlookOversupply in the electricity market continues, bringing the prospect of competition remaining robust through 2018. As in the past,
PLP will continue leveraging its efficiency advantage and operational flexibility to defend market share while keeping costs down.
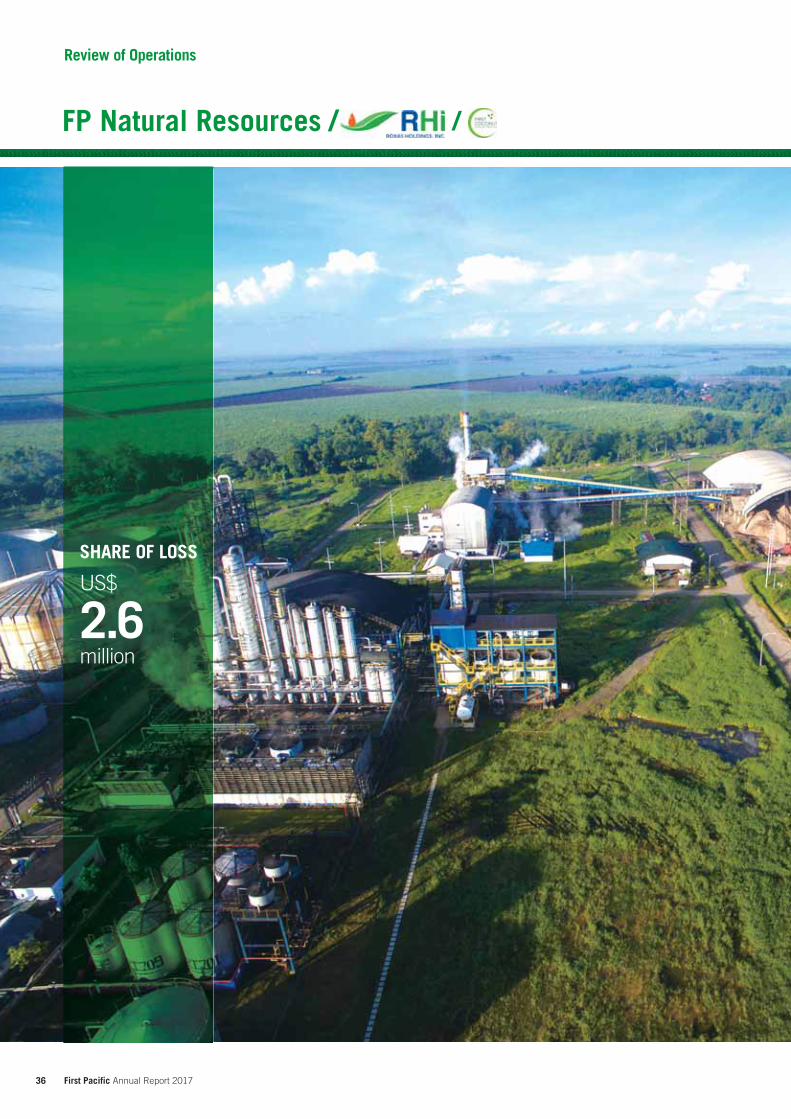
36 First Pacific Annual Report 2017
Review of Operations
SHARE OF LOSS
US$
2.6million
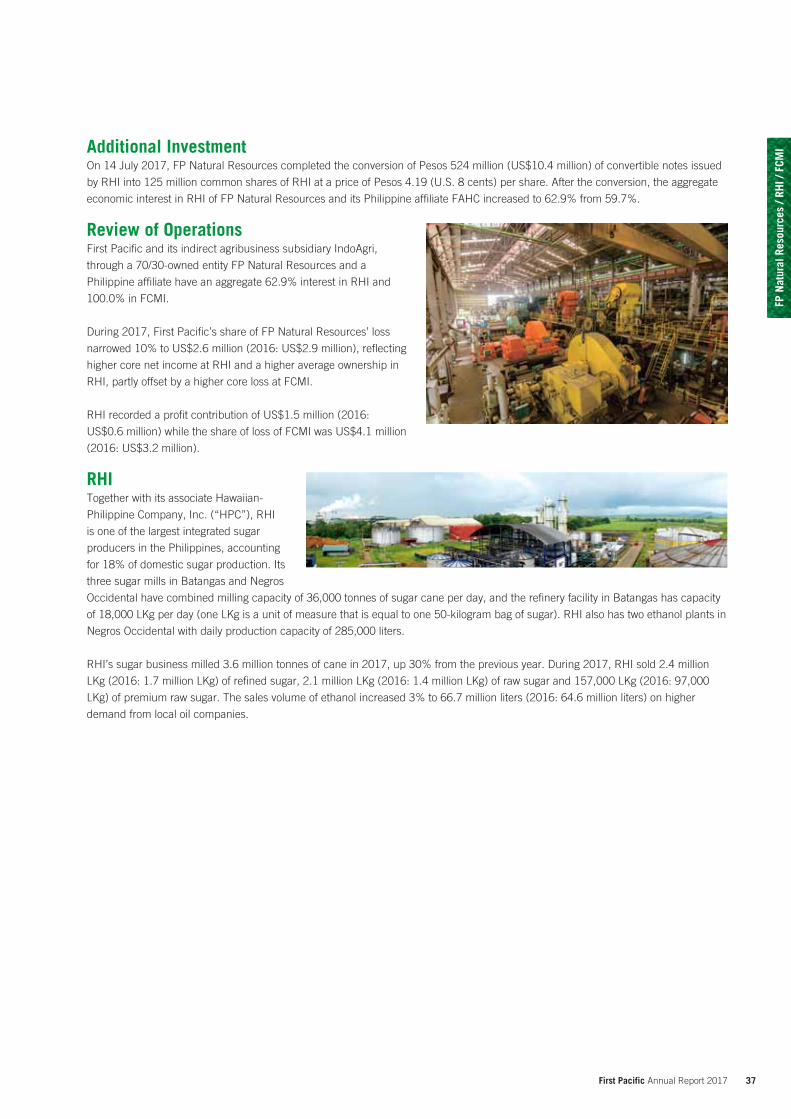
37 First Pacific Annual Report 2017
FP N
atur
al R
esou
rces
/ RH
I / F
CMIAdditional Investment
On 14 July 2017, FP Natural Resources completed the conversion of Pesos 524 million (US$10.4 million) of convertible notes issued
by RHI into 125 million common shares of RHI at a price of Pesos 4.19 (U.S. 8 cents) per share. After the conversion, the aggregate
economic interest in RHI of FP Natural Resources and its Philippine affiliate FAHC increased to 62.9% from 59.7%.
Review of OperationsFirst Pacific and its indirect agribusiness subsidiary IndoAgri,
through a 70/30-owned entity FP Natural Resources and a
Philippine affiliate have an aggregate 62.9% interest in RHI and
100.0% in FCMI.
During 2017, First Pacific’s share of FP Natural Resources’ loss
narrowed 10% to US$2.6 million (2016: US$2.9 million), reflecting
higher core net income at RHI and a higher average ownership in
RHI, partly offset by a higher core loss at FCMI.
RHI recorded a profit contribution of US$1.5 million (2016:
US$0.6 million) while the share of loss of FCMI was US$4.1 million
(2016: US$3.2 million).
RHITogether with its associate Hawaiian-
Philippine Company, Inc. (“HPC”), RHI
is one of the largest integrated sugar
producers in the Philippines, accounting
for 18% of domestic sugar production. Its
three sugar mills in Batangas and Negros
Occidental have combined milling capacity of 36,000 tonnes of sugar cane per day, and the refinery facility in Batangas has capacity
of 18,000 LKg per day (one LKg is a unit of measure that is equal to one 50-kilogram bag of sugar). RHI also has two ethanol plants in
Negros Occidental with daily production capacity of 285,000 liters.
RHI’s sugar business milled 3.6 million tonnes of cane in 2017, up 30% from the previous year. During 2017, RHI sold 2.4 million
LKg (2016: 1.7 million LKg) of refined sugar, 2.1 million LKg (2016: 1.4 million LKg) of raw sugar and 157,000 LKg (2016: 97,000
LKg) of premium raw sugar. The sales volume of ethanol increased 3% to 66.7 million liters (2016: 64.6 million liters) on higher
demand from local oil companies.
38 First Pacific Annual Report 2017
Review of Operations
Core net income up 86% to Pesos 240 million (US$4.8 million) from Pesos 129 million (US$2.7 million)
reflecting higher sales volumes of all products
improved production costs driven by upgraded facilities at production plants
partly offset by lower average selling prices of all products
Reported net income up 7% to Pesos 120 million (US$2.4 million) from Pesos 112 million (US$2.3 million)
reflecting higher core net income
partly offset by non-recurring expenses related to taxes for prior years
Revenue up 6% to Pesos 11.5 billion (US$228.9 million) from Pesos 10.8 billion (US$227.3 million)
driven by higher sales volumes of all products
partly offset by lower average selling prices of all products
Operating expenses up 1% to Pesos 936 million (US$18.6 million) from Pesos 932 million (US$19.6 million)
owing to higher staff-related costs
EBITDA up 17% to Pesos 1.6 billion (US$32.4 million) from Pesos 1.4 billion (US$29.4 million)
reflecting higher revenue and improved gross margins
EBITDA margin to 14% from 13% propelled by higher EBITDA
Debt ProfileAs at 31 December 2017, long-term debt of RHI stood at Pesos 5.7 billion (US$115.1 million) with maturities ranging from May 2018
to August 2024 at an annual interest of approximately 4.5%. Short-term debt stood at Pesos 4.4 billion (US$88.0 million) with an
average interest rate of approximately 4.0%.
FCMIIn 2017, supply of copra was under pressure in the first three quarters as the harvest continued to be impacted by effects of El Niño,
with some alleviation in the fourth quarter. Coconut oil is primarily used for food, cosmetics and pharmaceutical purposes and coconut
by-products remain in high demand for their health and nutritional benefits. However, the higher average selling price of crude
coconut oil was unable to compensate for the 19% increase in the cost of copra. FCMI sold 8,001 tonnes of crude coconut oil, 5,159
tonnes of cochin coconut oil and 1,194 tonnes of white refined, bleached and deodorized (“WRBD”) coconut oil.
In 2017, FCMI’s revenue remained at Pesos 1.2 billion (US$24.3 million), while core loss increased to Pesos 298 million (US$5.9
million) reflecting continued high raw material cost due to shortage of copra supply.
Debt ProfileAs at 31 December 2017, FCMI had short-term debts of Pesos 300 million (US$6.0 million) with an average interest rate of
approximately 3.8%.
2018 OutlookRHI expects better performance from its alcohol segment with improved production efficiencies which will bring higher production
volumes. Stable cane supply and stronger cost controls are expected to partially offset the impact of declining sugar prices and
increasing fuel prices.
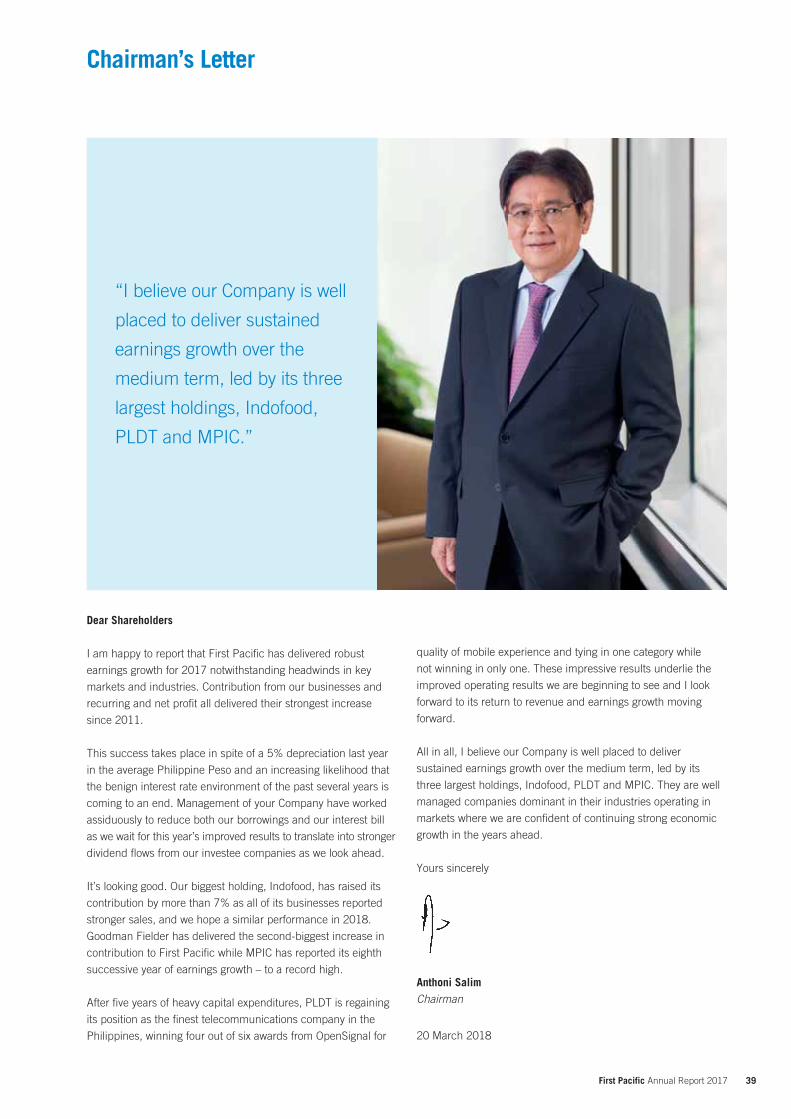
39 First Pacific Annual Report 2017
Chairman’s Letter
“I believe our Company is well
placed to deliver sustained
earnings growth over the
medium term, led by its three
largest holdings, Indofood,
PLDT and MPIC.”
Dear Shareholders
I am happy to report that First Pacific has delivered robust
earnings growth for 2017 notwithstanding headwinds in key
markets and industries. Contribution from our businesses and
recurring and net profit all delivered their strongest increase
since 2011.
This success takes place in spite of a 5% depreciation last year
in the average Philippine Peso and an increasing likelihood that
the benign interest rate environment of the past several years is
coming to an end. Management of your Company have worked
assiduously to reduce both our borrowings and our interest bill
as we wait for this year’s improved results to translate into stronger
dividend flows from our investee companies as we look ahead.
It’s looking good. Our biggest holding, Indofood, has raised its
contribution by more than 7% as all of its businesses reported
stronger sales, and we hope a similar performance in 2018.
Goodman Fielder has delivered the second-biggest increase in
contribution to First Pacific while MPIC has reported its eighth
successive year of earnings growth – to a record high.
After five years of heavy capital expenditures, PLDT is regaining
its position as the finest telecommunications company in the
Philippines, winning four out of six awards from OpenSignal for
quality of mobile experience and tying in one category while
not winning in only one. These impressive results underlie the
improved operating results we are beginning to see and I look
forward to its return to revenue and earnings growth moving
forward.
All in all, I believe our Company is well placed to deliver
sustained earnings growth over the medium term, led by its
three largest holdings, Indofood, PLDT and MPIC. They are well
managed companies dominant in their industries operating in
markets where we are confident of continuing strong economic
growth in the years ahead.
Yours sincerely
Anthoni SalimChairman
20 March 2018
40 First Pacific Annual Report 2017
Managing Director and Chief Executive Officer’s Letter
To My Fellow Shareholders
Looking at First Pacific’s results I cannot fail to be pleased to
see the largest increases in contribution, recurring profit and
net profit at our Company since 2011. The Group has evolved
enormously in the seven years since then as it has diversified
its sources of contribution, becoming less dependent on PLDT
and growing the share of contribution delivered by, in particular,
Indofood and MPIC.
As a corollary to the changing shape of our contribution, we have
seen a diversification in our dividend income as well, even as we
have had to adjust to a decline in the overall level. In 2011, PLDT
provided First Pacific with nearly three-quarters of our dividend
income, while Indofood delivered one-fifth and MPIC gave us
only 2% of total dividend income. Contrast that with 2017,
with Indofood’s share of the total doubling to 37% and MPIC
contributing 15% of dividend income. Even after four years of its
own challenges, PLDT still provided 43% of our dividend income
in 2017 and there is every indication that it will turn to earnings
growth in 2018 following a long and expensive transformation.
This in turn will lead to a return to a strengthening of its ability to
pay dividends.
This reshaping of our dividend sources is an important
development to First Pacific today, as this improved
diversification of our source of dividends – driven by change
in our earnings mix – has been accompanied by a meaningful
decline in our dividend income over that same period. We
have responded by cutting costs – particularly our interest bill,
which is down by a full 15% last year – and our overall level of
indebtedness. We have also launched a review of our assets with
an eye towards disposing of non-core investments that don’t
fit our return criteria. This effort continues, and we are keen to
release what funds we raise to finance further debt reduction and
a meaningful share repurchase program to signal our optimism
for the future of our Group as we rebalance our earnings and
sources of dividend income onto a more stable footing.
Notwithstanding the recent belt-tightening in our cash flow, your
Board of Directors feels it’s prudent to maintain First Pacific’s
own distribution unchanged on a per-share basis, meeting our
eight-year commitment to distribute 25% or more of recurring
profit to First Pacific shareholders. On recent data, the dividend
yield on First Pacific shares is a healthy 2.9% and compares well
with our peers as we look forward, with increasing confidence, to
sustained stronger performances across the First Pacific Group.
Our future as a stronger, slimmer and more focused holding
company is more clear than ever.
What is that future? A sustained turnaround at PLDT on the
strength of its Pesos 260 billion capex program to build a
world-class telecommunications network; continuing sales and
revenue growth at Indofood and Goodman Fielder as they tap
into the growing spending power of consumers in emerging
Asia; continuing volume growth at MPIC’s businesses even as it
seeks new toll road, water and other infrastructure investments
in the Philippines and elsewhere in Southeast Asia. Our core
investments are well managed, large, and growing. We look
forward to communicating our goals and strategies to our
shareholders and others in the months ahead.
I am disappointed regarding the current share price, given
the strong operational result in 2017 and our expectations of
continued improvement at most businesses in 2018 as well as
PLDT’s expected higher recurring core profit. Our optimism has
merit and I am hopeful that we will see a positive reaction from
shareholders during the current year and beyond.
Yours cordially
M V PangilinanManaging Director and Chief Executive Officer
20 March 2018
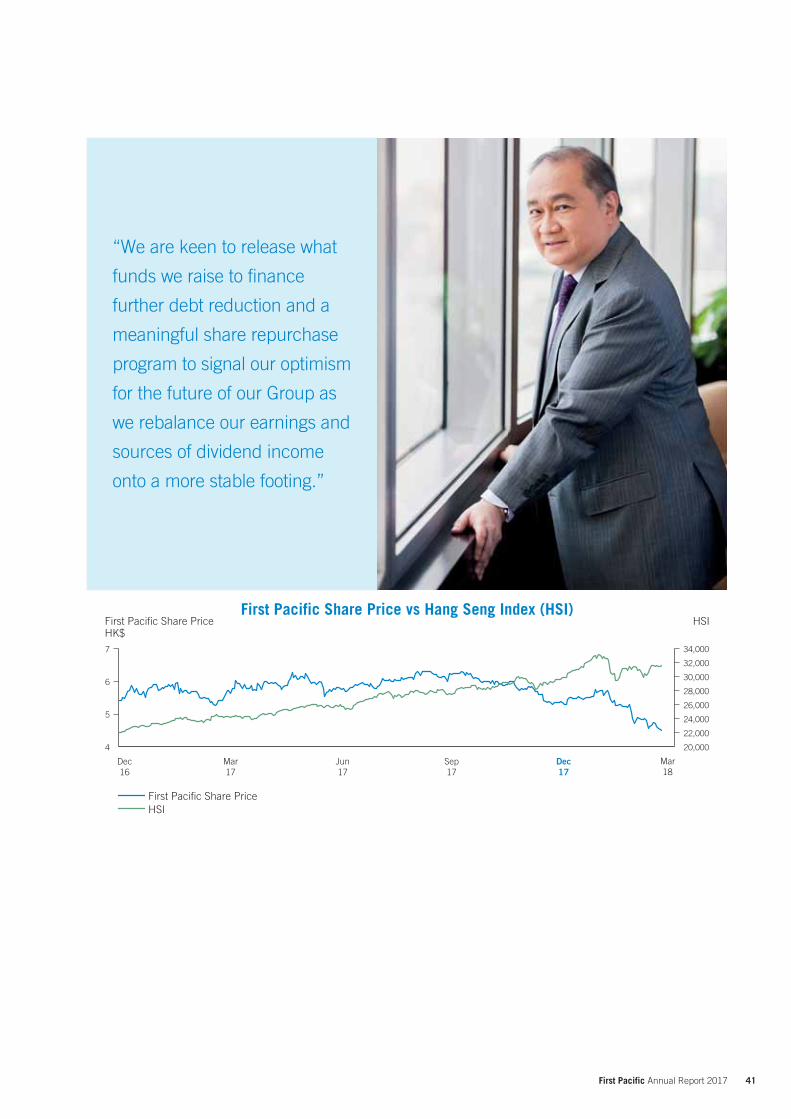
41 First Pacific Annual Report 2017
“We are keen to release what
funds we raise to finance
further debt reduction and a
meaningful share repurchase
program to signal our optimism
for the future of our Group as
we rebalance our earnings and
sources of dividend income
onto a more stable footing.”
4
5
6
7
First Pacific Share PriceHK$
HSI
Dec16
Mar17
Jun17
Sep17
Dec17
Mar18
First Pacific Share PriceHSI
20,000
22,000
24,000
26,000
28,000
30,000
32,000
34,000
First Pacific Share Price vs Hang Seng Index (HSI)
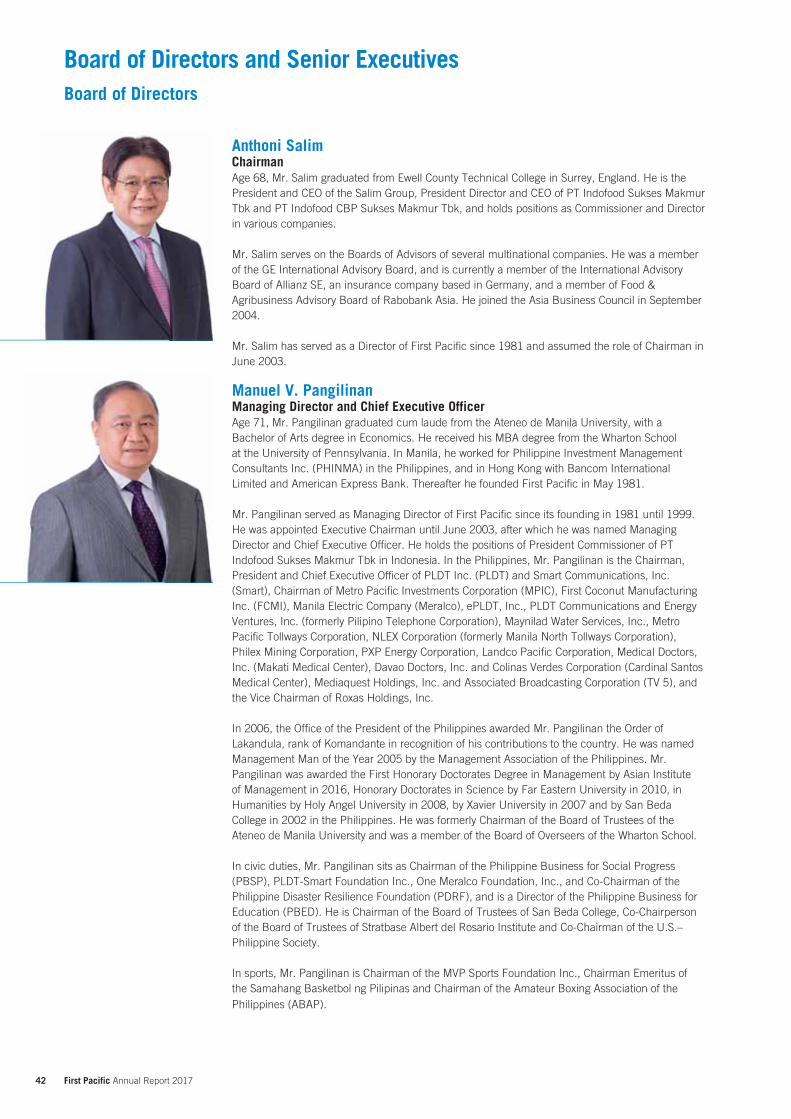
42 First Pacific Annual Report 2017
Board of Directors and Senior Executives
Anthoni SalimChairmanAge 68, Mr. Salim graduated from Ewell County Technical College in Surrey, England. He is the President and CEO of the Salim Group, President Director and CEO of PT Indofood Sukses Makmur Tbk and PT Indofood CBP Sukses Makmur Tbk, and holds positions as Commissioner and Director in various companies.
Mr. Salim serves on the Boards of Advisors of several multinational companies. He was a member of the GE International Advisory Board, and is currently a member of the International Advisory Board of Allianz SE, an insurance company based in Germany, and a member of Food & Agribusiness Advisory Board of Rabobank Asia. He joined the Asia Business Council in September 2004.
Mr. Salim has served as a Director of First Pacific since 1981 and assumed the role of Chairman in June 2003.
Manuel V. PangilinanManaging Director and Chief Executive OfficerAge 71, Mr. Pangilinan graduated cum laude from the Ateneo de Manila University, with a Bachelor of Arts degree in Economics. He received his MBA degree from the Wharton School at the University of Pennsylvania. In Manila, he worked for Philippine Investment Management Consultants Inc. (PHINMA) in the Philippines, and in Hong Kong with Bancom International Limited and American Express Bank. Thereafter he founded First Pacific in May 1981.
Mr. Pangilinan served as Managing Director of First Pacific since its founding in 1981 until 1999. He was appointed Executive Chairman until June 2003, after which he was named Managing Director and Chief Executive Officer. He holds the positions of President Commissioner of PT Indofood Sukses Makmur Tbk in Indonesia. In the Philippines, Mr. Pangilinan is the Chairman, President and Chief Executive Officer of PLDT Inc. (PLDT) and Smart Communications, Inc. (Smart), Chairman of Metro Pacific Investments Corporation (MPIC), First Coconut Manufacturing Inc. (FCMI), Manila Electric Company (Meralco), ePLDT, Inc., PLDT Communications and Energy Ventures, Inc. (formerly Pilipino Telephone Corporation), Maynilad Water Services, Inc., Metro Pacific Tollways Corporation, NLEX Corporation (formerly Manila North Tollways Corporation), Philex Mining Corporation, PXP Energy Corporation, Landco Pacific Corporation, Medical Doctors, Inc. (Makati Medical Center), Davao Doctors, Inc. and Colinas Verdes Corporation (Cardinal Santos Medical Center), Mediaquest Holdings, Inc. and Associated Broadcasting Corporation (TV 5), and the Vice Chairman of Roxas Holdings, Inc.
In 2006, the Office of the President of the Philippines awarded Mr. Pangilinan the Order of Lakandula, rank of Komandante in recognition of his contributions to the country. He was named Management Man of the Year 2005 by the Management Association of the Philippines. Mr. Pangilinan was awarded the First Honorary Doctorates Degree in Management by Asian Institute of Management in 2016, Honorary Doctorates in Science by Far Eastern University in 2010, in Humanities by Holy Angel University in 2008, by Xavier University in 2007 and by San Beda College in 2002 in the Philippines. He was formerly Chairman of the Board of Trustees of the Ateneo de Manila University and was a member of the Board of Overseers of the Wharton School.
In civic duties, Mr. Pangilinan sits as Chairman of the Philippine Business for Social Progress (PBSP), PLDT-Smart Foundation Inc., One Meralco Foundation, Inc., and Co-Chairman of the Philippine Disaster Resilience Foundation (PDRF), and is a Director of the Philippine Business for Education (PBED). He is Chairman of the Board of Trustees of San Beda College, Co-Chairperson of the Board of Trustees of Stratbase Albert del Rosario Institute and Co-Chairman of the U.S.– Philippine Society.
In sports, Mr. Pangilinan is Chairman of the MVP Sports Foundation Inc., Chairman Emeritus of the Samahang Basketbol ng Pilipinas and Chairman of the Amateur Boxing Association of the Philippines (ABAP).
Board of Directors
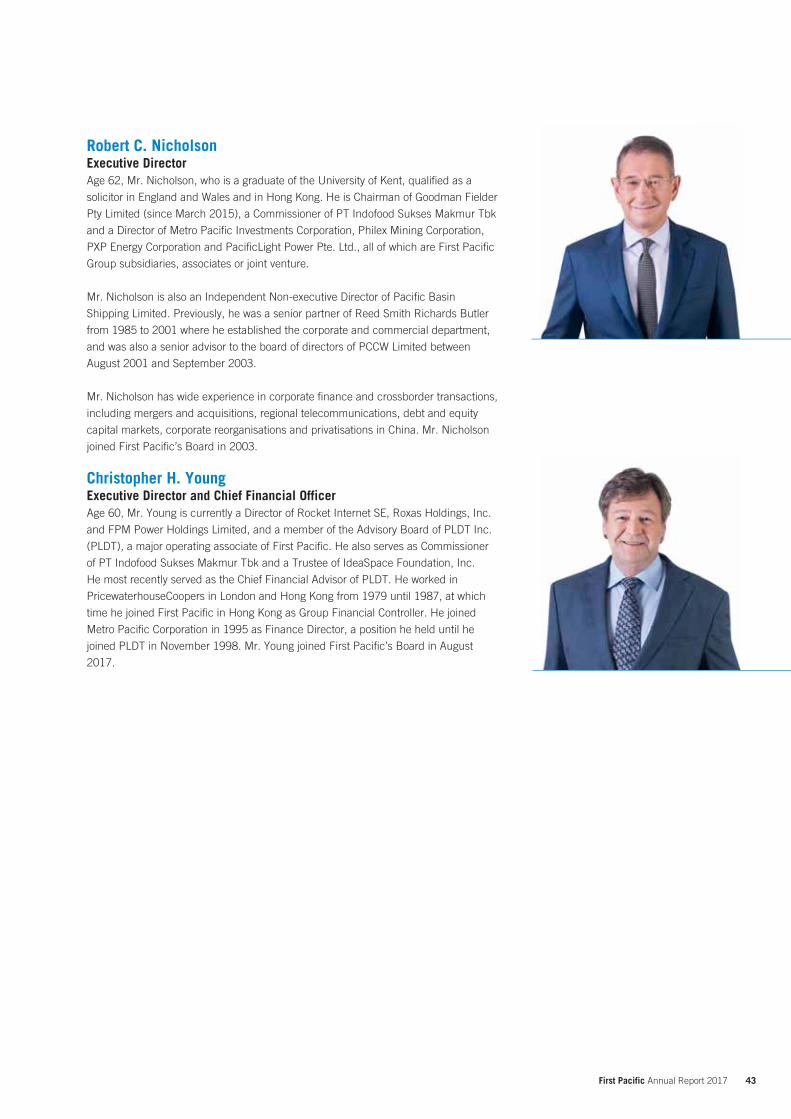
43 First Pacific Annual Report 2017
Robert C. NicholsonExecutive DirectorAge 62, Mr. Nicholson, who is a graduate of the University of Kent, qualified as a
solicitor in England and Wales and in Hong Kong. He is Chairman of Goodman Fielder
Pty Limited (since March 2015), a Commissioner of PT Indofood Sukses Makmur Tbk
and a Director of Metro Pacific Investments Corporation, Philex Mining Corporation,
PXP Energy Corporation and PacificLight Power Pte. Ltd., all of which are First Pacific
Group subsidiaries, associates or joint venture.
Mr. Nicholson is also an Independent Non-executive Director of Pacific Basin
Shipping Limited. Previously, he was a senior partner of Reed Smith Richards Butler
from 1985 to 2001 where he established the corporate and commercial department,
and was also a senior advisor to the board of directors of PCCW Limited between
August 2001 and September 2003.
Mr. Nicholson has wide experience in corporate finance and crossborder transactions,
including mergers and acquisitions, regional telecommunications, debt and equity
capital markets, corporate reorganisations and privatisations in China. Mr. Nicholson
joined First Pacific’s Board in 2003.
Christopher H. YoungExecutive Director and Chief Financial OfficerAge 60, Mr. Young is currently a Director of Rocket Internet SE, Roxas Holdings, Inc.
and FPM Power Holdings Limited, and a member of the Advisory Board of PLDT Inc.
(PLDT), a major operating associate of First Pacific. He also serves as Commissioner
of PT Indofood Sukses Makmur Tbk and a Trustee of IdeaSpace Foundation, Inc.
He most recently served as the Chief Financial Advisor of PLDT. He worked in
PricewaterhouseCoopers in London and Hong Kong from 1979 until 1987, at which
time he joined First Pacific in Hong Kong as Group Financial Controller. He joined
Metro Pacific Corporation in 1995 as Finance Director, a position he held until he
joined PLDT in November 1998. Mr. Young joined First Pacific’s Board in August
2017.

44 First Pacific Annual Report 2017
Board of Directors and Senior Executives
of the Investment Office of the National
University of Singapore. In 2008, she
founded Athenaeum Limited, a boutique
investment manager of Asian Pacific
funds. The funds business was sold
to Azimut Group in 2016. Since 2018,
Ms. Lee has started an advisory and
consultancy partnership to cater to Asian
Family Offices.
Ms. Lee has served on the board of
directors of Mapletree Investments Pte
Ltd, Aetos Security Pte Ltd and ECICS
Holdings of the Temasek Holdings stable
of companies. She was on Monetary
Authority of Singapore’s Financial Sector
Review Committee on the Liberalisation
of the Stockbroking Industry in 1997 and
the Business Development Review Group
for the Merged Exchange in 1998.
Ms. Lee currently serves on the Board
of The Community Foundation of
Singapore, Arts House Ltd. and the
Governing Council of Singapore Institute
of Management. She joined First Pacific’s
Board in September 2015.
Professor Edward K.Y. ChenGBS, CBE, JPIndependent Non-executive DirectorAge 73, educated at the University of Hong Kong and Oxford University, Professor Chen is an Independent Non-executive Director of Wharf Holdings Limited. He has served as President of Lingnan University; Professor and Director of the Centre of Asian Studies of the University of Hong Kong; Chairman of Hong Kong’s Consumer Council; as an Executive Councillor of the Hong Kong Government; and as a Legislative Councillor. He is now the Chairman of the HKU SPACE Board of Directors, a Board Director of the Hong Kong Institute for Monetary Research of the Hong Kong Monetary Authority, a Distinguished Fellow of the Hong Kong Institute for the Humanities and Social Sciences at the University of Hong Kong, and Honorary Professor of the Open University of Hong Kong. Professor Chen joined First Pacific’s
Board in 1993.
Mr. Fan had been an Executive Director
of CITIC Pacific Limited in charge of
industrial projects in China. Prior to his
retirement as the Executive Director and
General Manager of China Everbright
International Limited, he made significant
contribution to the company’s leadership
position in the Chinese Waste-to-energy
industry.
Mr. Fan is also an Independent Non-
executive Director of China Everbright
International Limited, Hysan Development
Company Limited, China Aircraft Leasing
Group Holdings Limited and PFC Devices
Inc. He joined First Pacific’s Board in
December 2012.
Philip Fan Yan HokIndependent Non-executive DirectorAge 68, Fan holds a Bachelor’s Degree in
Industrial Engineering, a Master’s Degree
in Operations Research from Stanford
University and a Master’s Degree in
Management Science from Massachusetts
Institute of Technology.
Madeleine Lee Suh ShinIndependent Non-executive DirectorAge 55, Ms. Lee graduated with a
Bachelor of Arts Honours in Economics
and Accounting from the University of
Leeds, UK and a Master of Business
Administration from the University of
Bradford, UK. She obtained her Chartered
Financial Analyst qualification in 1989.
Ms. Lee has 30 years in investment
management, having worked with the
Government of Singapore Investment
Corporation, Chase Manhattan and
Morgan Grenfell. She was appointed
Managing Director/Chief Investment
Officer at Commerzbank Asset
Management Asia in 1997. In 2001,
Ms. Lee co-founded BowtieAsia Pte
Ltd, which matched private equity
investments in the technology space
using an internet platform, a precursor to
“crowdfunding”. In 2002, she was made
a Fellow of the Eisenhower Exchange
Fellowship. From 2005 to 2007, Ms. Lee
was the Deputy Chief Investment Officer
Margaret Leung Ko May YeeSBS, JPIndependent Non-executive DirectorAge 65, Mrs. Leung holds a Bachelor’s
Degree in Economics, Accounting
and Business Administration from the
University of Hong Kong. She was the
Vice-Chairman and CEO of Hang Seng
Bank Limited and Chairman of Hang
Seng Bank (China) Limited prior to her
retirement on 30 June 2012. Mrs. Leung
also held various pivotal positions in
HSBC Holdings Plc and The Hongkong
and Shanghai Banking Corporation
Limited from February 1978 until 30
June 2012. She was also an Independent

45 First Pacific Annual Report 2017
Board in June 2016. He is also a Director
of Indra Philippines, Inc., PLDT Inc.,
Metro Pacific Investments Corporation
and Metro Pacific Tollways Corporation,
all of which are First Pacific Group
subsidiaries or associate.
Non-executive Director of the Hong Kong
listed Swire Pacific Limited, Hutchison
Whampoa Limited and China Construction
Bank Limited. Mrs. Leung was the
Chairman of the Board of Governors of
Hang Seng Management College and
Hang Seng School of Commerce until
March 2013, and a Member of the
Advisory Board and Chairman of the
Investment Committee of the Hong Kong
Export Credit Insurance Corporation until
December 2010.
Mrs. Leung is a council member and
Treasurer of the University of Hong
Kong. She is the Deputy Chairman and
Managing Director of Chong Hing Bank
Limited, and an Independent Non-
executive Director of Sun Hung Kai
Properties Limited, Hong Kong Exchanges
and Clearing Limited and Li & Fung
Limited. Mrs Leung joined First Pacific’s
Board in December 2012.
Ambassador del Rosario was conferred
the Order of Sikatuna, Rank of Datu,
the Order of Lakandula with a Rank of
Grand Cross (Bayani) and was recipient
of the EDSA II Presidential Heroes
Award. He was granted the 2013
Professional Chair for Public Service
and Governance by Ateneo School
of Government and the Metrobank
Foundation, 2014 Management Man of
the Year by Management Association
of the Philippines, 2016 Outstanding
Government National Official, 2016 Asia
CEO Awards as Life Contributor, and
Manuel L. Quezon Gawad Parangal as
Quezon City’s Most Outstanding Citizens
for 2016. He was also elevated to the
Xavier Hall of Fame in New York City in
2006 and received the AIM Washington
Sycip Distinguished Management
Leadership Award in 2011. He was
conferred Doctor of Laws (Honoris Causa)
for principled commitment to democracy,
integrity and the rule of law by the College
of Mount Saint Vincent, New York City in
2015. He received the Rotary Club Makati
West’s first “Albert del Rosario Award”
in 2016, the Outstanding Leadership
in Diplomatic Service award by Miriam
College Department of International
Studies and Philippine Tatler’s Diamond
Award.
He is Co-founder of Gotuaco del Rosario
Insurance Brokers Inc., the Chairman of
Philippine Stratbase Consultancy Inc. and
Stratbase ADR Institute, Inc. Ambassador
del Rosario is a Director of Sarimonde
Foods Corporation, Rockwell Land
Corporation and Asia Insurance (Phil.)
Corporation. He is also a trustee of the
Carlos P. Romulo Foundation for Peace
& Development and Philippine Cancer
Society, Inc. A member of Asia Society
Global Council and an Advisory Board
of Metrobank Foundation, Inc. and CSIS
Southeast Asia Program.
Ambassador del Rosario joined First
Pacific as an Independent Non-executive
Director in June 2003 and served as a
Non-executive Director from 2004 until
March 2011. He re-joined First Pacific’s
Albert F. del RosarioNon-executive DirectorAge 78, Ambassador del Rosario received
a Bachelor’s Degree in Economics from
New York University.
He served as Secretary of Foreign
Affairs of the Philippines from February
2011 to March 2016 and as Philippine
Ambassador to the United States of
America from October 2001 to August
2006. Prior to entering public service,
Ambassador del Rosario was on the
Board of Directors of over 50 firms, his
business career for over four decades
has spanned the insurance, banking, real
estate, shipping, telecommunications,
advertising, consumer products, retail,
pharmaceutical and food industries.
Tedy DjuharNon-executive DirectorAge 66, Mr. Djuhar received a Bachelor
of Economics degree from the University
of New England in Australia. He has also
completed the EMBA program at Cheung
Kong School of Business Beijing in
June 2014. Mr. Djuhar is Vice President
Commissioner of PT Indocement Tunggal
Prakarsa Tbk, a Director of Pacific
Industries and Development Limited and
a number of other Indonesian companies.
He joined First Pacific’s Board in 1981.
Benny S. SantosoNon-executive DirectorAge 59, Mr. Santoso graduated from
Ngee Ann College in Singapore. He serves
as a Commissioner of PT Indofood Sukses
Makmur Tbk, a President Commissioner
of PT Nippon Indosari Corpindo Tbk, a
Commissioner of PT Fast Food Indonesia
Tbk, a Director of PT Indocement Tunggal
Prakarsa Tbk and as a member of the
Advisory Board of PLDT Inc. He joined
First Pacific’s Board in 2003.
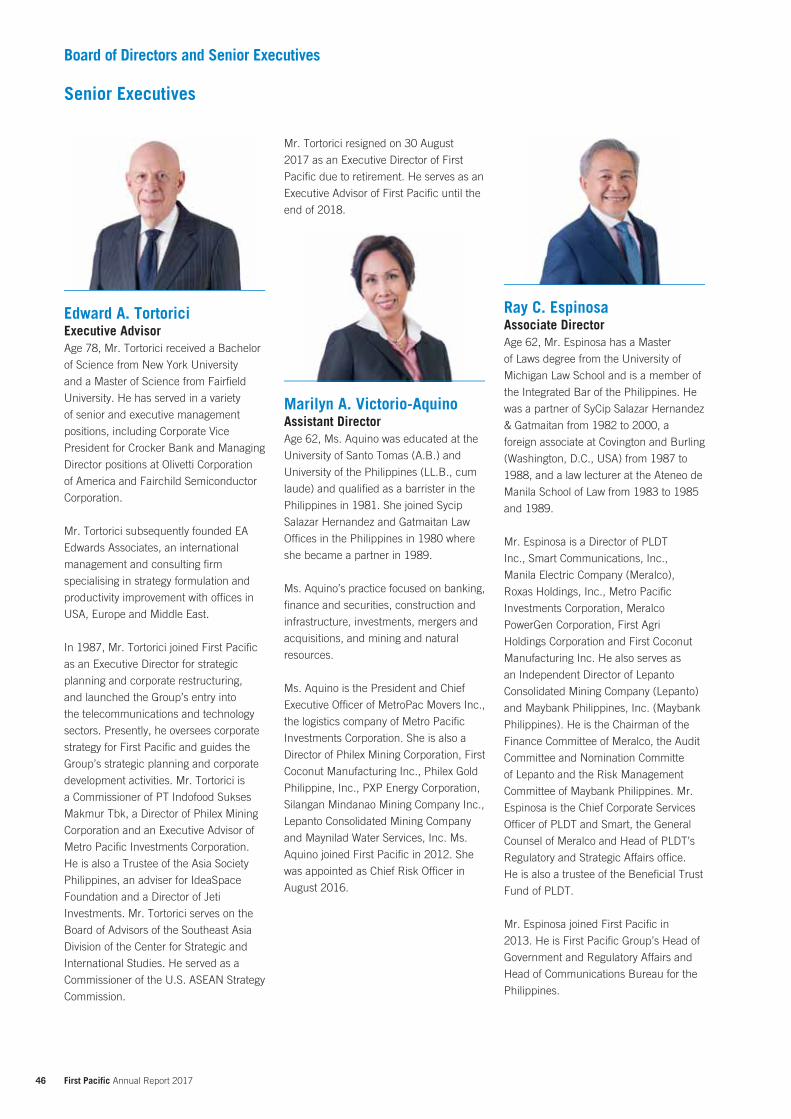
46 First Pacific Annual Report 2017
Board of Directors and Senior Executives
Ray C. EspinosaAssociate DirectorAge 62, Mr. Espinosa has a Master
of Laws degree from the University of
Michigan Law School and is a member of
the Integrated Bar of the Philippines. He
was a partner of SyCip Salazar Hernandez
& Gatmaitan from 1982 to 2000, a
foreign associate at Covington and Burling
(Washington, D.C., USA) from 1987 to
1988, and a law lecturer at the Ateneo de
Manila School of Law from 1983 to 1985
and 1989.
Mr. Espinosa is a Director of PLDT
Inc., Smart Communications, Inc.,
Manila Electric Company (Meralco),
Roxas Holdings, Inc., Metro Pacific
Investments Corporation, Meralco
PowerGen Corporation, First Agri
Holdings Corporation and First Coconut
Manufacturing Inc. He also serves as
an Independent Director of Lepanto
Consolidated Mining Company (Lepanto)
and Maybank Philippines, Inc. (Maybank
Philippines). He is the Chairman of the
Finance Committee of Meralco, the Audit
Committee and Nomination Committe
of Lepanto and the Risk Management
Committee of Maybank Philippines. Mr.
Espinosa is the Chief Corporate Services
Officer of PLDT and Smart, the General
Counsel of Meralco and Head of PLDT’s
Regulatory and Strategic Affairs office.
He is also a trustee of the Beneficial Trust
Fund of PLDT.
Mr. Espinosa joined First Pacific in
2013. He is First Pacific Group’s Head of
Government and Regulatory Affairs and
Head of Communications Bureau for the
Philippines.
Mr. Tortorici resigned on 30 August
2017 as an Executive Director of First
Pacific due to retirement. He serves as an
Executive Advisor of First Pacific until the
end of 2018.
Edward A. TortoriciExecutive AdvisorAge 78, Mr. Tortorici received a Bachelor
of Science from New York University
and a Master of Science from Fairfield
University. He has served in a variety
of senior and executive management
positions, including Corporate Vice
President for Crocker Bank and Managing
Director positions at Olivetti Corporation
of America and Fairchild Semiconductor
Corporation.
Mr. Tortorici subsequently founded EA
Edwards Associates, an international
management and consulting firm
specialising in strategy formulation and
productivity improvement with offices in
USA, Europe and Middle East.
In 1987, Mr. Tortorici joined First Pacific
as an Executive Director for strategic
planning and corporate restructuring,
and launched the Group’s entry into
the telecommunications and technology
sectors. Presently, he oversees corporate
strategy for First Pacific and guides the
Group’s strategic planning and corporate
development activities. Mr. Tortorici is
a Commissioner of PT Indofood Sukses
Makmur Tbk, a Director of Philex Mining
Corporation and an Executive Advisor of
Metro Pacific Investments Corporation.
He is also a Trustee of the Asia Society
Philippines, an adviser for IdeaSpace
Foundation and a Director of Jeti
Investments. Mr. Tortorici serves on the
Board of Advisors of the Southeast Asia
Division of the Center for Strategic and
International Studies. He served as a
Commissioner of the U.S. ASEAN Strategy
Commission.
Marilyn A. Victorio-AquinoAssistant DirectorAge 62, Ms. Aquino was educated at the
University of Santo Tomas (A.B.) and
University of the Philippines (LL.B., cum
laude) and qualified as a barrister in the
Philippines in 1981. She joined Sycip
Salazar Hernandez and Gatmaitan Law
Offices in the Philippines in 1980 where
she became a partner in 1989.
Ms. Aquino’s practice focused on banking,
finance and securities, construction and
infrastructure, investments, mergers and
acquisitions, and mining and natural
resources.
Ms. Aquino is the President and Chief
Executive Officer of MetroPac Movers Inc.,
the logistics company of Metro Pacific
Investments Corporation. She is also a
Director of Philex Mining Corporation, First
Coconut Manufacturing Inc., Philex Gold
Philippine, Inc., PXP Energy Corporation,
Silangan Mindanao Mining Company Inc.,
Lepanto Consolidated Mining Company
and Maynilad Water Services, Inc. Ms.
Aquino joined First Pacific in 2012. She
was appointed as Chief Risk Officer in
August 2016.
Senior Executives
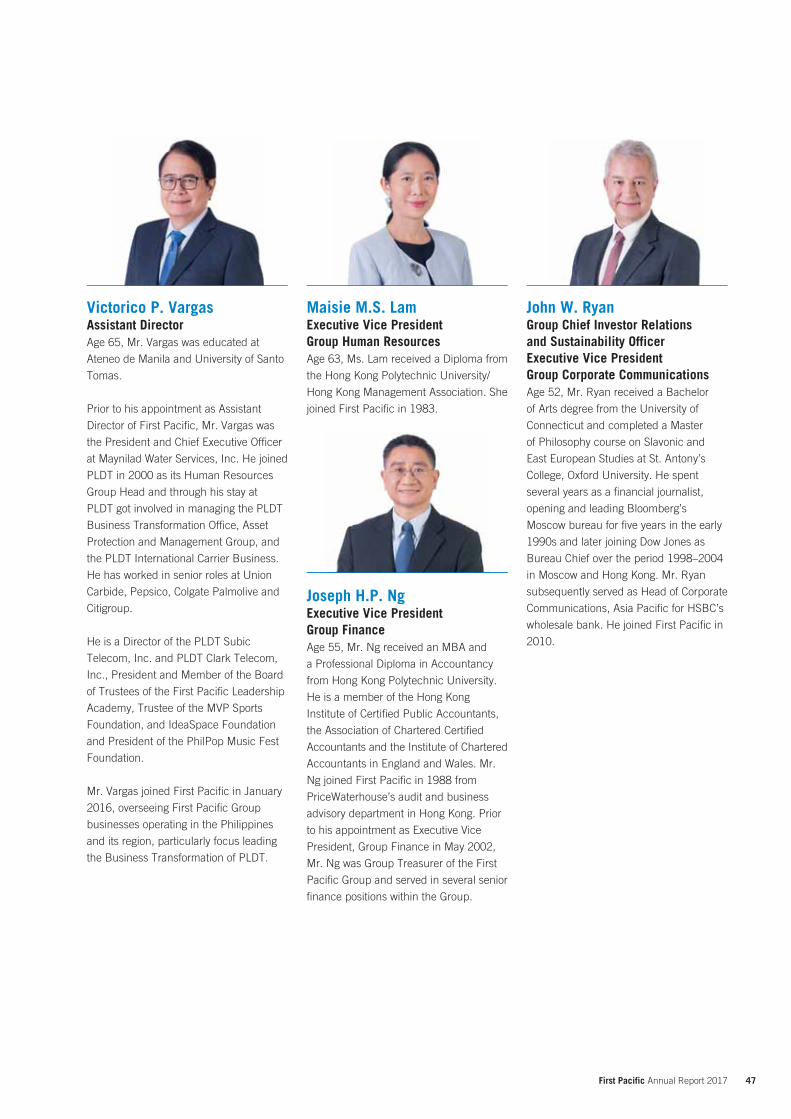
47 First Pacific Annual Report 2017
Maisie M.S. LamExecutive Vice PresidentGroup Human ResourcesAge 63, Ms. Lam received a Diploma from
the Hong Kong Polytechnic University/
Hong Kong Management Association. She
joined First Pacific in 1983.
John W. RyanGroup Chief Investor Relations and Sustainability OfficerExecutive Vice PresidentGroup Corporate CommunicationsAge 52, Mr. Ryan received a Bachelor
of Arts degree from the University of
Connecticut and completed a Master
of Philosophy course on Slavonic and
East European Studies at St. Antony’s
College, Oxford University. He spent
several years as a financial journalist,
opening and leading Bloomberg’s
Moscow bureau for five years in the early
1990s and later joining Dow Jones as
Bureau Chief over the period 1998–2004
in Moscow and Hong Kong. Mr. Ryan
subsequently served as Head of Corporate
Communications, Asia Pacific for HSBC’s
wholesale bank. He joined First Pacific in
2010.
Victorico P. VargasAssistant DirectorAge 65, Mr. Vargas was educated at
Ateneo de Manila and University of Santo
Tomas.
Prior to his appointment as Assistant
Director of First Pacific, Mr. Vargas was
the President and Chief Executive Officer
at Maynilad Water Services, Inc. He joined
PLDT in 2000 as its Human Resources
Group Head and through his stay at
PLDT got involved in managing the PLDT
Business Transformation Office, Asset
Protection and Management Group, and
the PLDT International Carrier Business.
He has worked in senior roles at Union
Carbide, Pepsico, Colgate Palmolive and
Citigroup.
He is a Director of the PLDT Subic
Telecom, Inc. and PLDT Clark Telecom,
Inc., President and Member of the Board
of Trustees of the First Pacific Leadership
Academy, Trustee of the MVP Sports
Foundation, and IdeaSpace Foundation
and President of the PhilPop Music Fest
Foundation.
Mr. Vargas joined First Pacific in January
2016, overseeing First Pacific Group
businesses operating in the Philippines
and its region, particularly focus leading
the Business Transformation of PLDT.
Joseph H.P. NgExecutive Vice PresidentGroup FinanceAge 55, Mr. Ng received an MBA and
a Professional Diploma in Accountancy
from Hong Kong Polytechnic University.
He is a member of the Hong Kong
Institute of Certified Public Accountants,
the Association of Chartered Certified
Accountants and the Institute of Chartered
Accountants in England and Wales. Mr.
Ng joined First Pacific in 1988 from
PriceWaterhouse’s audit and business
advisory department in Hong Kong. Prior
to his appointment as Executive Vice
President, Group Finance in May 2002,
Mr. Ng was Group Treasurer of the First
Pacific Group and served in several senior
finance positions within the Group.

48 First Pacific Annual Report 2017
Board of Directors and Senior Executives
Public Accountant (Practising), a CFA
charterholder and a Fellow of the
Hong Kong Institute of Certified Public
Accountants and the Association of
Chartered Certified Accountants. He
has experience in auditing, accounting,
finance and management spanning a
diverse range of business activities. Mr.
Chan joined First Pacific in 1996 from
KPMG. Prior to his appointment as Vice
President, Group Financial Controller in
2014, Mr. Chan was Vice President of
Group Finance.
Kong Institute of Company Secretaries
and The Institute of Chartered Secretaries
& Administrators of Great Britain. Ms. Li
joined First Pacific in 1987 from the Hong
Kong Polytechnic University’s academic
secretariat. Prior to that, she worked in
the company secretarial department of
Coopers & Lybrand. Ms. Li was appointed
as First Pacific’s Company Secretary in
2003.
Stanley H. YangExecutive Vice PresidentGroup Corporate DevelopmentAge 41, Mr. Yang received a Bachelor
of Science degree in Economics from
the Wharton School of the University of
Pennsylvania. He oversees the Group’s
corporate development activities including
mergers and acquisitions, strategic
investments, joint ventures, and other
portfolio company growth initiatives.
Prior to joining First Pacific, Mr. Yang
worked at Deutsche Bank where he led
investment banking coverage for the
diversified industrials sector in Asia. He
also previously served as a director in
Deutsche Bank’s mergers and acquisitions
department, where he advised clients on
mergers and acquisitions, divestitures
and leveraged investment transactions
in Asia and the United States. Mr. Yang
began his career in New York where he
gained transaction experience in principal
investments and investment banking.
He joined First Pacific in 2013 and is
currently a Director of FPW Singapore
Holdings Pte Ltd.
Richard P.C. ChanVice PresidentGroup Financial ControllerAge 48, Mr. Chan received a BBA
(Hons) degree from Hong Kong Baptist
University and an MBA from the Chinese
University of Hong Kong. He is a Certified
Sara S.K. CheungVice PresidentGroup Corporate CommunicationsAge 54, Ms. Cheung received a BA in
Business Economics from the University
of California, Los Angeles and an
MBA from Southern Illinois University,
Carbondale. She is a member of the Hong
Kong Investor Relations Association.
She joined First Pacific in 1997 from
the Public Affairs department of Wharf
Limited and Wheelock and Company.
Nancy L.M. LiVice PresidentCompany SecretaryAge 60, Ms. Li received a BA from
McMaster University in Canada and
a MSc in Corporate Governance and
Directorship from Hong Kong Baptist
University. She is a Fellow of the Hong
Peter T.H. LinDeputy TreasurerVice PresidentGroup TaxAge 48, Mr. Lin received a MSc in
Management Sciences from the
University of Southampton and a BSc in
Economics and Statistics from Coventry
University. He is a Fellow of the Institute
of Chartered Accountants in England and
Wales, Hong Kong Institute of Certified
Public Accountants and the Association of
Chartered Certified Accountants. Mr. Lin
joined First Pacific in 1998 from KPMG
where he was a Tax Manager. Prior to his
appointment as Deputy Treasurer and
Vice President of Group Tax in 2014, Mr.
Lin was Vice President of Group Tax and
Treasury.
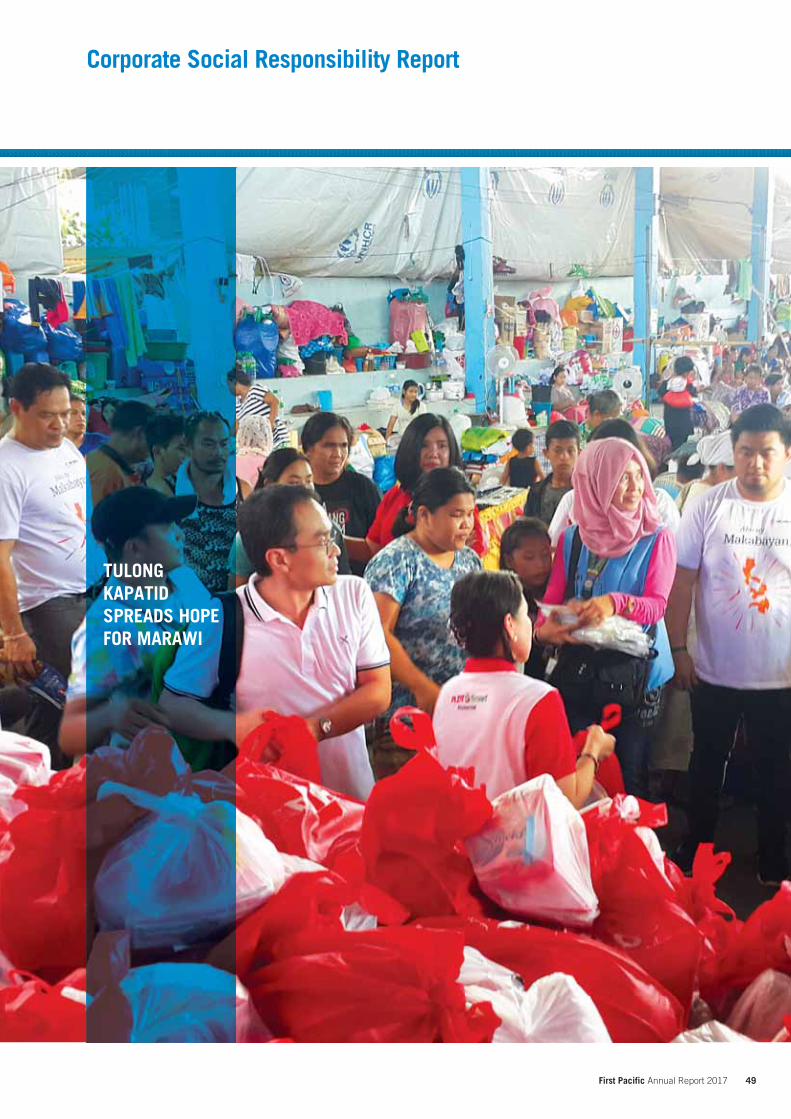
49 First Pacific Annual Report 2017
Corporate Social Responsibility Report
TULONG KAPATID SPREADS HOPE FOR MARAWI
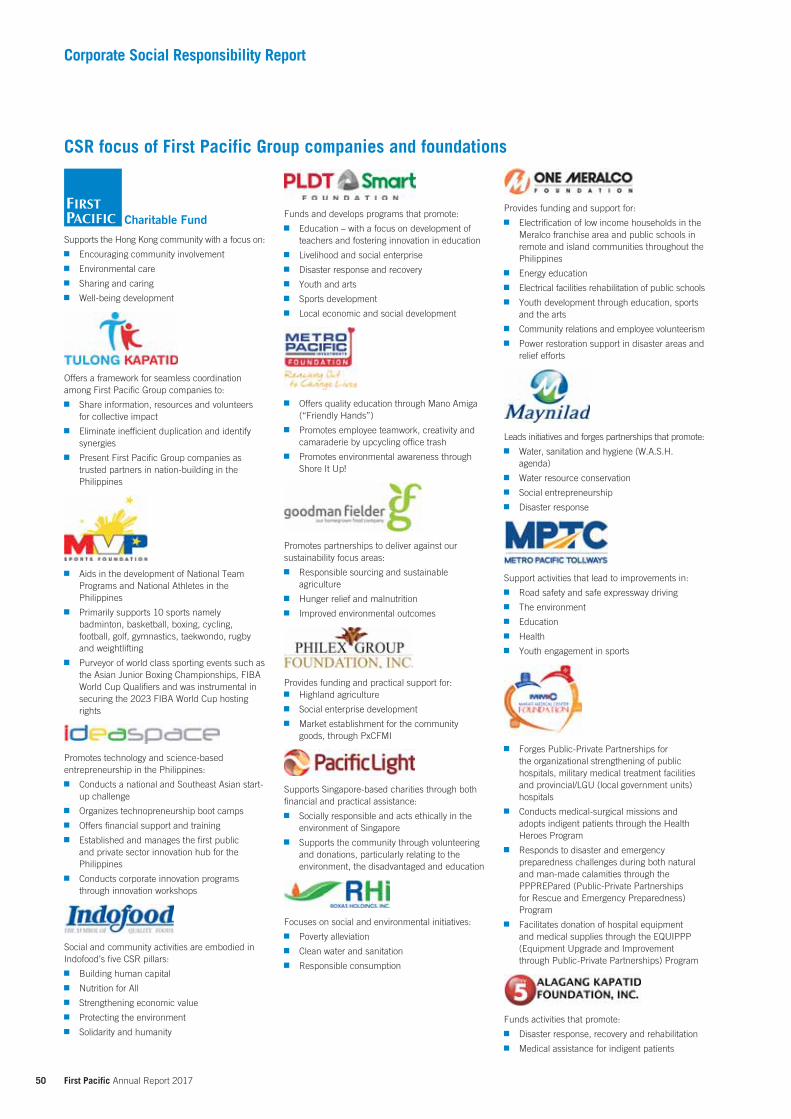
50 First Pacific Annual Report 2017
Corporate Social Responsibility Report
CSR focus of First Pacific Group companies and foundations
Funds activities that promote:
Disaster response, recovery and rehabilitation
Medical assistance for indigent patients
Leads initiatives and forges partnerships that promote:
Water, sanitation and hygiene (W.A.S.H. agenda)
Water resource conservation
Social entrepreneurship
Disaster response
Forges Public-Private Partnerships for the organizational strengthening of public hospitals, military medical treatment facilities and provincial/LGU (local government units) hospitals
Conducts medical-surgical missions and adopts indigent patients through the Health Heroes Program
Responds to disaster and emergency preparedness challenges during both natural and man-made calamities through the PPPREPared (Public-Private Partnerships for Rescue and Emergency Preparedness) Program
Facilitates donation of hospital equipment and medical supplies through the EQUIPPP (Equipment Upgrade and Improvement through Public-Private Partnerships) Program
Support activities that lead to improvements in:
Road safety and safe expressway driving
The environment
Education
Health
Youth engagement in sports
Promotes technology and science-based entrepreneurship in the Philippines:
Conducts a national and Southeast Asian start-up challenge
Organizes technopreneurship boot camps
Offers financial support and training
Established and manages the first public and private sector innovation hub for the Philippines
Conducts corporate innovation programs through innovation workshops
Provides funding and support for:
Electrification of low income households in the Meralco franchise area and public schools in remote and island communities throughout the Philippines
Energy education
Electrical facilities rehabilitation of public schools
Youth development through education, sports and the arts
Community relations and employee volunteerism
Power restoration support in disaster areas and relief efforts
Promotes partnerships to deliver against our sustainability focus areas:
Responsible sourcing and sustainable agriculture
Hunger relief and malnutrition
Improved environmental outcomes
Supports the Hong Kong community with a focus on:
Encouraging community involvement
Environmental care
Sharing and caring
Well-being development
Funds and develops programs that promote:
Education – with a focus on development of teachers and fostering innovation in education
Livelihood and social enterprise
Disaster response and recovery
Youth and arts
Sports development
Local economic and social development
Provides funding and practical support for: Highland agriculture
Social enterprise development
Market establishment for the community goods, through PxCFMI
Aids in the development of National Team Programs and National Athletes in the Philippines
Primarily supports 10 sports namely badminton, basketball, boxing, cycling, football, golf, gymnastics, taekwondo, rugby and weightlifting
Purveyor of world class sporting events such as the Asian Junior Boxing Championships, FIBA World Cup Qualifiers and was instrumental in securing the 2023 FIBA World Cup hosting rights
Offers quality education through Mano Amiga (“Friendly Hands”)
Promotes employee teamwork, creativity and camaraderie by upcycling office trash
Promotes environmental awareness through Shore It Up!
Focuses on social and environmental initiatives:
Poverty alleviation
Clean water and sanitation
Responsible consumption
Offers a framework for seamless coordination among First Pacific Group companies to:
Share information, resources and volunteers for collective impact
Eliminate inefficient duplication and identify synergies
Present First Pacific Group companies as trusted partners in nation-building in the Philippines
Social and community activities are embodied in Indofood’s five CSR pillars:
Building human capital
Nutrition for All
Strengthening economic value
Protecting the environment
Solidarity and humanity
Supports Singapore-based charities through both financial and practical assistance:
Socially responsible and acts ethically in the environment of Singapore
Supports the community through volunteering and donations, particularly relating to the environment, the disadvantaged and education
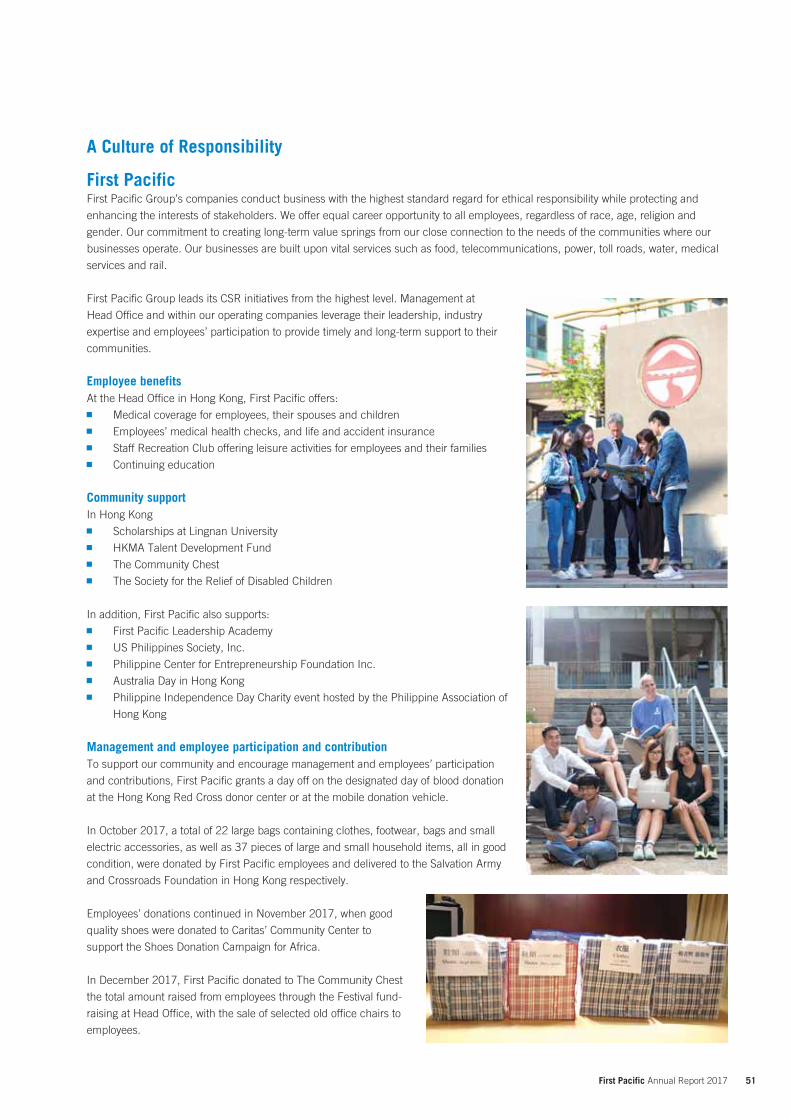
51 First Pacific Annual Report 2017
A Culture of Responsibility
First PacificFirst Pacific Group’s companies conduct business with the highest standard regard for ethical responsibility while protecting and
enhancing the interests of stakeholders. We offer equal career opportunity to all employees, regardless of race, age, religion and
gender. Our commitment to creating long-term value springs from our close connection to the needs of the communities where our
businesses operate. Our businesses are built upon vital services such as food, telecommunications, power, toll roads, water, medical
services and rail.
First Pacific Group leads its CSR initiatives from the highest level. Management at
Head Office and within our operating companies leverage their leadership, industry
expertise and employees’ participation to provide timely and long-term support to their
communities.
Employee benefitsAt the Head Office in Hong Kong, First Pacific offers:
Medical coverage for employees, their spouses and children
Employees’ medical health checks, and life and accident insurance
Staff Recreation Club offering leisure activities for employees and their families
Continuing education
Community supportIn Hong Kong
Scholarships at Lingnan University
HKMA Talent Development Fund
The Community Chest
The Society for the Relief of Disabled Children
In addition, First Pacific also supports:
First Pacific Leadership Academy
US Philippines Society, Inc.
Philippine Center for Entrepreneurship Foundation Inc.
Australia Day in Hong Kong
Philippine Independence Day Charity event hosted by the Philippine Association of
Hong Kong
Management and employee participation and contributionTo support our community and encourage management and employees’ participation
and contributions, First Pacific grants a day off on the designated day of blood donation
at the Hong Kong Red Cross donor center or at the mobile donation vehicle.
In October 2017, a total of 22 large bags containing clothes, footwear, bags and small
electric accessories, as well as 37 pieces of large and small household items, all in good
condition, were donated by First Pacific employees and delivered to the Salvation Army
and Crossroads Foundation in Hong Kong respectively.
Employees’ donations continued in November 2017, when good
quality shoes were donated to Caritas’ Community Center to
support the Shoes Donation Campaign for Africa.
In December 2017, First Pacific donated to The Community Chest
the total amount raised from employees through the Festival fund-
raising at Head Office, with the sale of selected old office chairs to
employees.
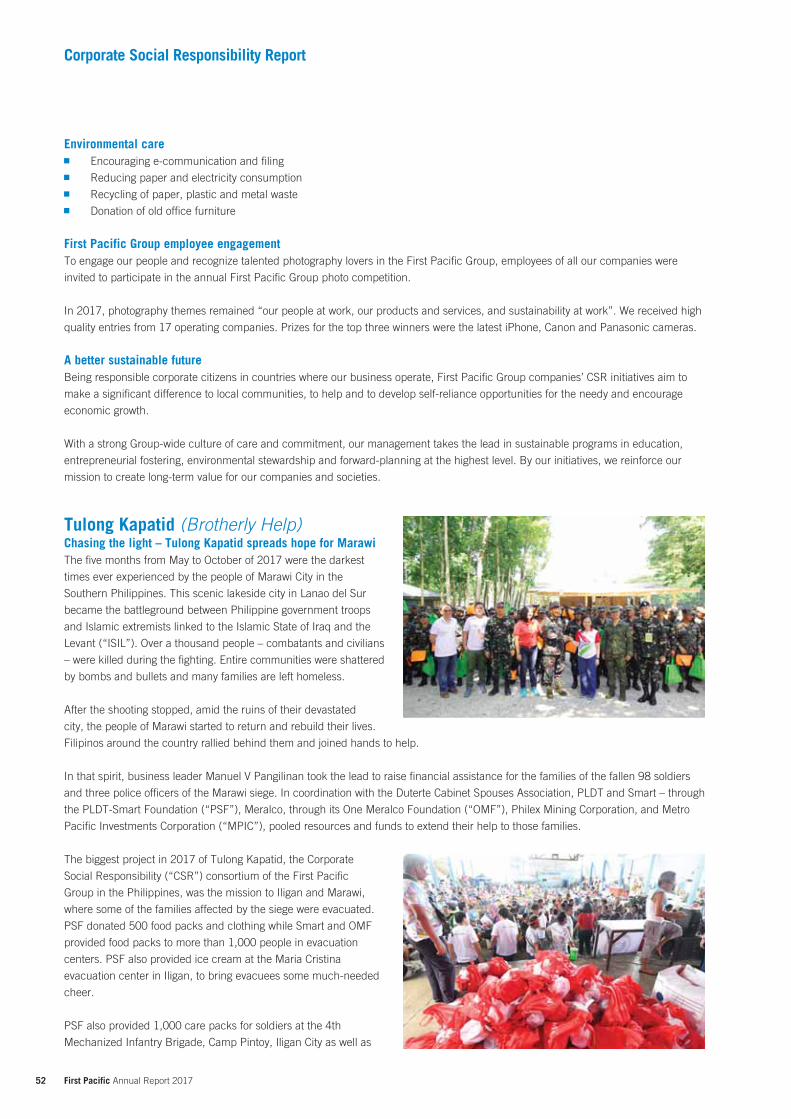
52 First Pacific Annual Report 2017
Corporate Social Responsibility Report
Environmental care Encouraging e-communication and filing
Reducing paper and electricity consumption
Recycling of paper, plastic and metal waste
Donation of old office furniture
First Pacific Group employee engagementTo engage our people and recognize talented photography lovers in the First Pacific Group, employees of all our companies were
invited to participate in the annual First Pacific Group photo competition.
In 2017, photography themes remained “our people at work, our products and services, and sustainability at work”. We received high
quality entries from 17 operating companies. Prizes for the top three winners were the latest iPhone, Canon and Panasonic cameras.
A better sustainable futureBeing responsible corporate citizens in countries where our business operate, First Pacific Group companies’ CSR initiatives aim to
make a significant difference to local communities, to help and to develop self-reliance opportunities for the needy and encourage
economic growth.
With a strong Group-wide culture of care and commitment, our management takes the lead in sustainable programs in education,
entrepreneurial fostering, environmental stewardship and forward-planning at the highest level. By our initiatives, we reinforce our
mission to create long-term value for our companies and societies.
Tulong Kapatid (Brotherly Help)Chasing the light – Tulong Kapatid spreads hope for MarawiThe five months from May to October of 2017 were the darkest
times ever experienced by the people of Marawi City in the
Southern Philippines. This scenic lakeside city in Lanao del Sur
became the battleground between Philippine government troops
and Islamic extremists linked to the Islamic State of Iraq and the
Levant (“ISIL”). Over a thousand people – combatants and civilians
– were killed during the fighting. Entire communities were shattered
by bombs and bullets and many families are left homeless.
After the shooting stopped, amid the ruins of their devastated
city, the people of Marawi started to return and rebuild their lives.
Filipinos around the country rallied behind them and joined hands to help.
In that spirit, business leader Manuel V Pangilinan took the lead to raise financial assistance for the families of the fallen 98 soldiers
and three police officers of the Marawi siege. In coordination with the Duterte Cabinet Spouses Association, PLDT and Smart – through
the PLDT-Smart Foundation (“PSF”), Meralco, through its One Meralco Foundation (“OMF”), Philex Mining Corporation, and Metro
Pacific Investments Corporation (“MPIC”), pooled resources and funds to extend their help to those families.
The biggest project in 2017 of Tulong Kapatid, the Corporate
Social Responsibility (“CSR”) consortium of the First Pacific
Group in the Philippines, was the mission to Iligan and Marawi,
where some of the families affected by the siege were evacuated.
PSF donated 500 food packs and clothing while Smart and OMF
provided food packs to more than 1,000 people in evacuation
centers. PSF also provided ice cream at the Maria Cristina
evacuation center in Iligan, to bring evacuees some much-needed
cheer.
PSF also provided 1,000 care packs for soldiers at the 4th
Mechanized Infantry Brigade, Camp Pintoy, Iligan City as well as
53 First Pacific Annual Report 2017
100 portable water filtration devices to address the problem of sanitation and potable water for both the troops and the evacuees. The
care packs contained snacks, cookies, sports drinks and more, supplementing the soldiers’ usual fare of sardines and rice. PSF also
donated hundreds of lifesaving chest seals and hemostatic agents to the Camp Evangelista Hospital in Cagayan de Oro.
To address the health needs of the families in the City of Marawi, PSF, Alagang Kapatid Foundation Inc. (“AKFI”) – the Corporate
Social Responsibility arm of TV5 – and Makati Medical Center Foundation provided timely healthcare assistance.
Alagang Kapatid and its private donors served more than 12,500 displaced families. Donations ranged from food and hygiene packs,
water and water containers to sleeping kits and school supplies. Other services such as free calls, free charging for mobile phones,
stress debriefing activities, including games and art sessions, were given to children of the evacuees. AKFI also gave rosaries to
soldiers, crafted by mothers displaced during Typhoon Pablo in Davao Oriental. The troops also received care packages including
undergarments, mosquito nets, mosquito repellants and toiletries.
Smart set up a mobile cell site for the use of government troops in the Marawi military camp, to improve coverage. PLDT and Smart
also provided Fibr internet and Wi-Fi routers so that soldiers could communicate more easily with their families at home.
Apart from giving relief assistance, PLDT and Smart also provided communication aid to displaced Marawi residents. Among these
services were free calls and texts within Smart, Sun and TNT networks; Libreng Tawag (Free Call) booths and text blast solutions
via Smart Infocast to aid in civil military operations. They also provided mobile and connectivity support for the Armed Forces of the
Philippines, National Disaster Risk Reduction and Management Council and rescue teams helping in the evacuation of residents.
The First Pacific Group brought smiles, hope and visible joy to
over 200 families through the annual Paskong Kapatid (Christmas)
program. Each company under the First Pacific Group CSR
Council provided noche buena (Christmas Eve) packs and hygiene
kits to the families. Council members who participated in Paskong
Kapatid 2017 were PSF, PLDT, DLSMC, AKFI, Maynilad, OMF,
MPIC, Asian Hospital, Makati Medical Center, Cardinal Medical
Charities Foundation, Roxas Holdings, Inc., and MVP Sports
Foundation. The Christmas party was hosted by the De Los Santos
Medical Center, and provided great happiness and treats for the
children.
PSF, together with Tulong Kapatid, held a memorable CSR Activity
day for some of the children from Marawi. The children were
brought to Kidzania Manila in Bonifacio Global City for a once-in-
a-lifetime experience. Tulong Kapatid made the day more special
by giving away thoughtful gifts. PSF provided eco-bags for the
giveaways as well as event t-shirts for the children. MPIC’s Hospital
group also gave medical attention to the children.
First Pacific Group companies such as PLDT, Smart, Meralco
and MPIC Water also pledged their ongoing support for the
rehabilitation of the devastated city of Marawi during a summit
sponsored by the United for Marawi consortium. The consortium is
made up of the Philippine Disaster Resilience Foundation (PDRF)
and the Philippine Business for Social Progress (PBSP); both are
headed by Manuel V Pangilinan.
During the summit, PLDT and SMART committed to build telecoms infrastructure. PSF’s Gabay Guro pledged to build new classrooms.
Meralco pledged to provide technical assistance for the restoration of electricity while Maynilad and MPIC Water will provide technical
assistance to rebuild the city’s water supply system. Pacific Global One Aviation will provide air transport and equipment.
Joining hands with other private sector groups, the First Pacific Group, led by its CSR Council, is actively helping to bring back light to
the lives of the people of Marawi.
54 First Pacific Annual Report 2017
Corporate Social Responsibility Report
IdeaSpaceIdeaSpace is a non-profit accelerator in the Philippines which aims
to uplift, develop, and equip Filipino technopreneurs to answer the
needs of the 21st century and build a thriving Philippine economy.
2017 saw further growth in the startup industry with IdeaSpace
increasing its commitment to nurturing startups and collaborative
partnerships with government, academia, and other business
ventures. To date, IdeaSpace has funded and supported 68
startups through its flagship incubation program, and enabled over
400 entrepreneurs.
IdeaSpace contributes to startup successAdding new startups to the program
At the end of its 5th Startup Competition, IdeaSpace welcomed 12 new startups as it continues to help potential tech-based
enterprises grow by providing them with resources such as funding, mentorship, and other operational needs. Each took part in the
IdeaSpace Program, designed to develop innovation and entrepreneurship as a pathway to economic development.
IdeaSpace alumni startups break revenue barriers
2017 saw leaps in the startups’ successes, as illustrated by the top performers’ exceptional revenues. Leading alumni startup
companies supported by the IdeaSpace Incubation Program generated a total of over Pesos 50 million in revenues for 2017. These
companies offer the following solutions: Time Free, a queuing management solution (Batch 2013); Tambio, a mobile application that
automates raffles for companies (Batch 2014); Frontlearners, an e-learning, ready-to-use school-in-a-box with interactive K-12 lessons
(Batch 2015); Investagrams, a Bloomberg-for-every-Juan solution to provide beginner-friendly mobile guides and tools on stock
market trading (Batch 2016); and Style Genie, the first styling+clothing subscription in the Philippines (Batch 2017).
Awards and accomplishments in the startup space
In both global and national arenas, IdeaSpace startups have
marked some very notable successes. Taxumo (Batch 2016), an
online solution which assists professionals, freelancers and small
businesses with their taxes, became the first beneficiary of the
Board of Investments (“BOI”) tax incentive package for startups.
Web and mobile school productivity solution, Wela School Systems
(Batch 2017), was the sole Philippine representative to Pitch
Jerusalem.
The e-learning and e-teaching company Frontlearners (Batch 2015) won two competitions: first place at the QBO/UNDP/PDRF/DTI-
Slingshot competition on disaster preparedness, “Startups to the RESQUE”, and the Model Overseas Filipino Family, awarded by
President Duterte. The competitions yielded Frontlearners a combined amount of Pesos 1 million.
Three of the 15 startups that were awarded a total of Pesos 61 million in grants through the Department of Science and Technology
(“DOST”) PCIEERD’s Start Up Research Grant Program (“SETUP”) were also alumni of the IdeaSpace Incubation Program. The
three awardees were: Tactiles (develops educational toys for electronics engineering), FAME (develops general aviation and maritime
transponders and gateways) and Cropital (an agriculture-focused crowdfunding platform). In addition, Blood Hero (Batch 2017),
a social utility app that connects blood donors, hospitals and organizations, represented the Philippines at Hack Osaka, Japan in
February 2018.
Pushing innovation with QBOQBO, the public-private collaboration between IdeaSpace, DOST, DTI and JP Morgan, has conducted and organized over 100 startup
programs and gained over 1,700 members. It organized its first competition in cooperation with the United Nations Development
Program (“UNDP”) and the Philippine Disaster Resilience Foundation (“PDRF”). This was an innovation challenge named Startups
to the RESQUE, staged in connection with Slingshot (an ASEAN-wide startup initiative). It focused on the Disaster Risk Reduction and
Resilient Recovery theme, challenging participants from eight ASEAN member states. QBO ends its first year by winning recognition as
the best accelerator at the Philippine Ricebowl Startup Awards.

55 First Pacific Annual Report 2017
IdeaSpace continues to forge partnershipsIdeaSpace recently established links with the Korea – Pangyo
Startup Campus. The city of Pangyo is known as the Silicon
Valley of Korea. IdeaSpace also increased its roster of mentors,
advisers and business development opportunities for its startups
through engagements with foreign chambers of commerce such
as the Israeli Chamber of Commerce and the German Chamber
of Commerce. On the home front, IdeaSpace strengthened its
links with four key government agencies (DOST, Department
of Information and Communications Technology (“DICT”),
Department of Trade and Industry (“DTI”) and the Senate)
through its involvement in various programs related to the startup
ecosystem.
To forge more collaboration across public and private sectors in 2017, IdeaSpace cultivated its institutional partnership with the Makati
Medical Center Foundation to benefit the Philippine Navy through its CUPPID Program (Connectivity Upgrade through Public-Private
Partnerships in Information Design). Team PN Medics – composed of intrapreneurial officers and employees from different services
of the Philippine Navy – developed an electronic medical records system designed for Philippine military hospitals. To date, they are
in the process of installing their solution within the out-patient department of the Cavite Naval Hospital and it will be rolled out to more
hospitals of the Philippine Navy in 2018.
Reporting on the state of startupsIdeaSpace, QBO, and PriceWatehouseCoopers (Philippines) co-authored the 2017 Philippine Startup Report, the first comprehensive
study on the Philippine startup scene. It surveyed 106 startup founders, providing a nationwide snapshot of the current state of
startups. As a participant of the European Union-funded Project BEEHIVE, IdeaSpace Foundation helped prepare the Towards the
Entrepreneurial University National Benchmarking Report for the Philippines. Published on 12 December 2017, the report assessed
the current situation in Philippine higher education institutions (“HEIs”), with regards to the entrepreneurial ecosystem.
IndofoodIndofood’s CSR programs have expanded in scope, reflecting the triple bottom line which drives the business not only to seek profit
but also with a purpose beyond profit: to protect the planet and people. Driven by Indofood’s Sustainability Commitment “Striving for Sustainable Growth through Innovation and the Management of Excellence”, Indofood developed a Sustainability Framework to
manage, measure and monitor this performance to meet stakeholder expectations.
Environmental stewardshipEnhancing governance in managing environment
Environmental policyIndofood’s Environmental Policy directs all divisions and operating units to adhere to regulations, prevent pollution and protect and
conserve resources.
Management systemIndofood implements international standards such as ISO 14001 for its Environmental Management System and ISO 50001 for its
Energy Management System.
Compliance to government regulationIndofood conducts environmental self-assessment based on Indonesian Government criteria on Pollution Control, Evaluation and
Rating (“PROPER”) to ensure environmental compliance in all operating units.
Carbon footprint: managing energy and greenhouse gas (“GHG”) emissions
Indofood endeavors to secure its energy supply while adopting energy efficiency and utilizing renewable energy alternatives. These
measures, together with land-use and soil management, as well as conservation in agribusiness sector contribute to mitigate GHG
emissions and reduce carbon footprint.
56 First Pacific Annual Report 2017
Corporate Social Responsibility Report
Managing water and wasteIndofood commits to manage its water and waste responsibly. Operating units are equipped with wastewater treatment plants (“WWTP”)
and discharge wastewater in accordance with government standard. Indofood applies Reduce, Reuse and Recycle (“3R”) to its solid
waste. All Agribusiness group mills’ by-products are reused as compost or feedstock for boilers.
Sustainable plantation
Indofood’s Agribusiness group adopts the principles of sustainable agriculture, implementing sustainable palm oil based on ISPO/
RSPO standards, maintaining High Conservation Value (“HCV”) and High Carbon Stock (“HCS”) areas, preserving peatland, improving
organic agricultural input and preventing haze risk. The Agribusiness group’s target is that all estates and plasma smallholders are
RSPO and ISPO certified by 2019.
Promoting green behavior among employees
The company promotes environmentally friendly behaviors at work through its green office program.
Labor practices, occupational safety and health practices Indofood has numerous employee training programs,
supported by dedicated education and training centers.
Employee safety and health are key Indofood priorities, as
outlined in the Safety, Health and Environment Policy. Several
operating units are certified to the National Occupational
Health and Safety Standard and the Occupational Health and
Safety Assessment Series (“OHSAS”) 18001 standard.
The company offers equal career opportunities to all
employees, regardless of race, religion and gender. It
complies with Indonesian labor laws, including the elimination
of child and forced labor. Its employees enjoy healthcare benefits, maternity and religious pilgrimage leave. Indofood provides a
scholarship program for employees’ children.
Social and community developmentIndofood’s social and community development comprises five pillars: Building Human Capital, Nutrition for All, Strengthening
Economic Value, Protecting the Environment and Solidarity and Humanity.
Building human capital
Indofood’s programs include the Indofood Scholarship (“BISMA”), the Indofood Riset Nugraha research grant, Indofood Rumah Pintar
educational community centers and Integrated Child-friendly
Public Spaces.
Nutrition for all
Indofood is committed to eliminating malnutrition. It partners
with the Indonesian government, United Nations, NGOs, private
philanthropists, businesses and scientists under the Public
Private Partnership for the Scaling Up Nutrition Movement (SUN
Movement). Programs include SUN Mobil Nutrition Service
for Mother and Infants, Integrated Health Posts, Nutrition for
Workforce and a Healthy Breakfast Program.
Strengthening economic value
The company created Farmer Partnerships, Cow Breeders
Partnerships, Tempe Producer Partnerships and Plasma Farmer
Partnerships, to generate long-term economic value.
Indofood has been a member of Partnership for Indonesia
Sustainable Agriculture (“PISAgro”) since 2011, and is the Chair of
Potato Working Group and a member of Soybean Working Group.
57 First Pacific Annual Report 2017
Indofood continued the Bogasari Mitra Card (“BMC”) Program
for SME Bogasari flour partners. The Noodles division group
developed the Warmindo program for small traders of Indomie
noodles. Indofood also implemented the Pojok Selera Program, an
entrepreneurship program for spouses, family members of farmers
and the community.
Engaging community for protecting the environment
The company encourages community participation in conserving
the environment through waste bank and tree planting programs.
Solidarity and humanity
Indofood continuously supports relief programs for people and
communities in need. In 2017, assistance has been provided to
Rohingya Refugees, Mount Agung-Karangasem Bali Eruption,
Yogyakarta Flood Relief, Sinabung volcano eruption and South
Tapanuli flood victims. Indofood supports communities during
Ramadan and other major religious events through Safari
Ramadan, Indofood Share the Love and Qurban Donations
Programs. Indofood, through the Agribusiness group, performs
cleft lip surgeries for children.
Delivering responsible productsEnsuring food safety
Food safety is Indofood’s top priority and is guided by Indofood’s “quality pledge”. It controls food safety in accordance with the
company’s Integrated Total Quality Management Program and Good Manufacturing Practices (“GMP”). It adopts international
quality and food safety management systems: ISO 9001, ISO 22000, HACCP, FSSC 22000, ISO 17025, Hygiene Certificate and AIB
International.
Producing only halal products
Indofood produces halal products that comply with the Assessment Institute for Food, Drugs and Cosmetics of the Indonesian Council
of Ulamas (“LPPOM MUI”). All Indofood’s products have obtained halal certification from LPPOM MUI. Indofood also has a Halal
operating system that is certified by Halal Assurance System (“HAS”). Indofood Halal Secretariat (“HIS”), was established to ensure
Indofood’s conformity to HAS.
Product labelling
Indofood’s products comply with applicable labelling regulations and can include information about ingredients, nutritional values,
product expiry dates and customer services.
Consumer facilities
The company strives to increase consumer satisfaction. Indofood Consumer Services (“ICS”) is a channel through which consumers
can make inquiries and lodge product complaints and receive a rapid and personalized response.
Indofood’s extensive and long-lasting CSR programsIndofood, through its extensive and long-lasting CSR programs across Indonesia, has continuously maintained its harmonious
relationship with the community, creating shared benefits for the people engaged in its value chain, has conserved the environment
and is well-recognized as a good corporate citizen. Indofood is recognized as an organization that supports Indonesia’s Sustainable
Development Goals (“SDGs”) to leave no-one behind in 2030.
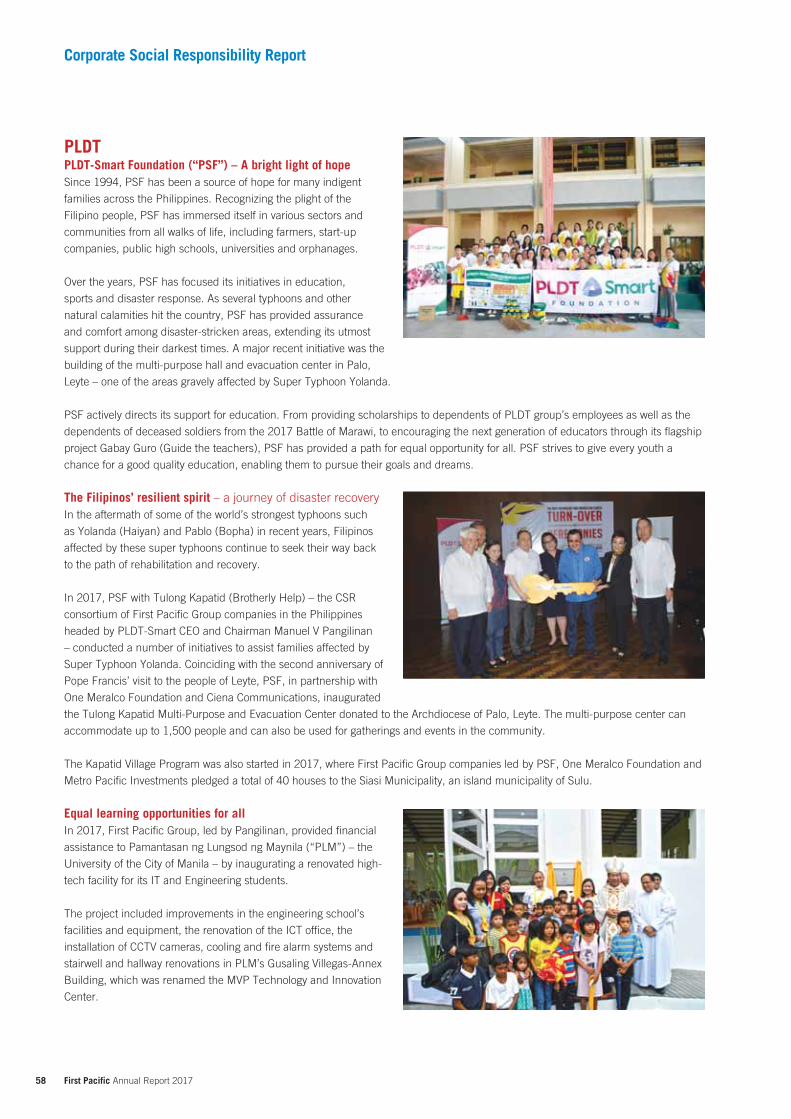
58 First Pacific Annual Report 2017
Corporate Social Responsibility Report
PLDTPLDT-Smart Foundation (“PSF”) – A bright light of hopeSince 1994, PSF has been a source of hope for many indigent
families across the Philippines. Recognizing the plight of the
Filipino people, PSF has immersed itself in various sectors and
communities from all walks of life, including farmers, start-up
companies, public high schools, universities and orphanages.
Over the years, PSF has focused its initiatives in education,
sports and disaster response. As several typhoons and other
natural calamities hit the country, PSF has provided assurance
and comfort among disaster-stricken areas, extending its utmost
support during their darkest times. A major recent initiative was the
building of the multi-purpose hall and evacuation center in Palo,
Leyte – one of the areas gravely affected by Super Typhoon Yolanda.
PSF actively directs its support for education. From providing scholarships to dependents of PLDT group’s employees as well as the
dependents of deceased soldiers from the 2017 Battle of Marawi, to encouraging the next generation of educators through its flagship
project Gabay Guro (Guide the teachers), PSF has provided a path for equal opportunity for all. PSF strives to give every youth a
chance for a good quality education, enabling them to pursue their goals and dreams.
The Filipinos’ resilient spirit – a journey of disaster recoveryIn the aftermath of some of the world’s strongest typhoons such
as Yolanda (Haiyan) and Pablo (Bopha) in recent years, Filipinos
affected by these super typhoons continue to seek their way back
to the path of rehabilitation and recovery.
In 2017, PSF with Tulong Kapatid (Brotherly Help) – the CSR
consortium of First Pacific Group companies in the Philippines
headed by PLDT-Smart CEO and Chairman Manuel V Pangilinan
– conducted a number of initiatives to assist families affected by
Super Typhoon Yolanda. Coinciding with the second anniversary of
Pope Francis’ visit to the people of Leyte, PSF, in partnership with
One Meralco Foundation and Ciena Communications, inaugurated
the Tulong Kapatid Multi-Purpose and Evacuation Center donated to the Archdiocese of Palo, Leyte. The multi-purpose center can
accommodate up to 1,500 people and can also be used for gatherings and events in the community.
The Kapatid Village Program was also started in 2017, where First Pacific Group companies led by PSF, One Meralco Foundation and
Metro Pacific Investments pledged a total of 40 houses to the Siasi Municipality, an island municipality of Sulu.
Equal learning opportunities for allIn 2017, First Pacific Group, led by Pangilinan, provided financial
assistance to Pamantasan ng Lungsod ng Maynila (“PLM”) – the
University of the City of Manila – by inaugurating a renovated high-
tech facility for its IT and Engineering students.
The project included improvements in the engineering school’s
facilities and equipment, the renovation of the ICT office, the
installation of CCTV cameras, cooling and fire alarm systems and
stairwell and hallway renovations in PLM’s Gusaling Villegas-Annex
Building, which was renamed the MVP Technology and Innovation
Center.
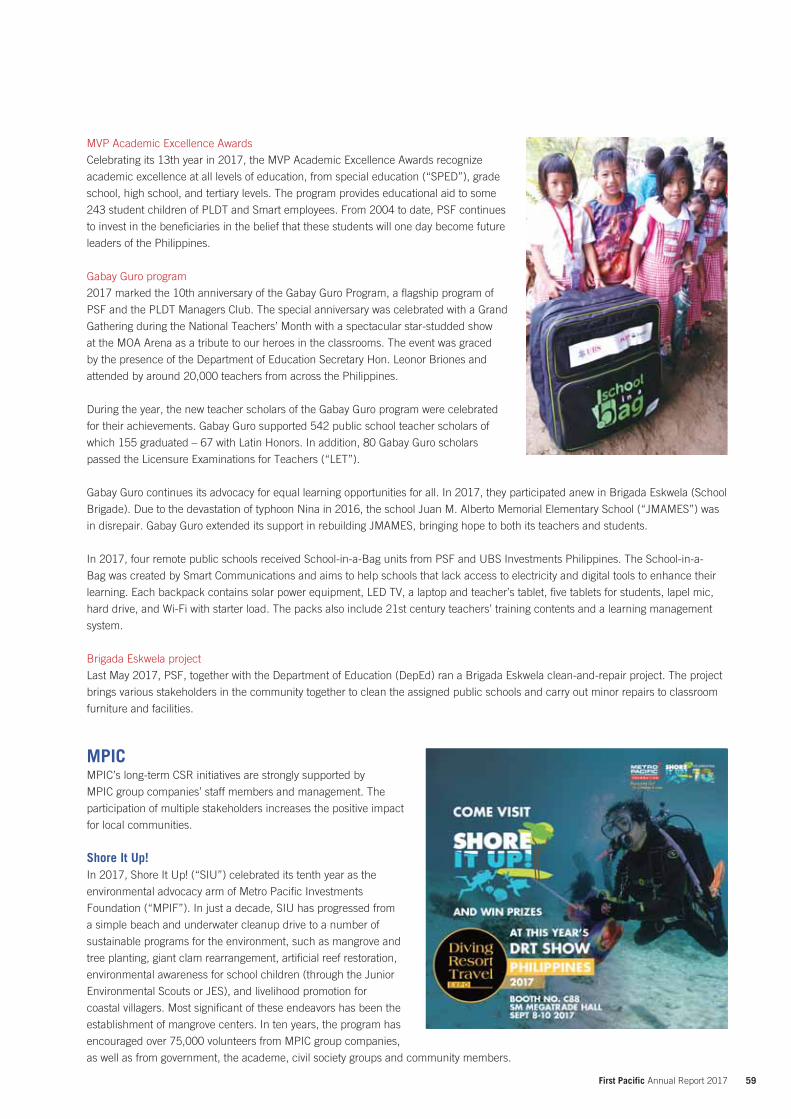
59 First Pacific Annual Report 2017
MVP Academic Excellence Awards
Celebrating its 13th year in 2017, the MVP Academic Excellence Awards recognize
academic excellence at all levels of education, from special education (“SPED”), grade
school, high school, and tertiary levels. The program provides educational aid to some
243 student children of PLDT and Smart employees. From 2004 to date, PSF continues
to invest in the beneficiaries in the belief that these students will one day become future
leaders of the Philippines.
Gabay Guro program
2017 marked the 10th anniversary of the Gabay Guro Program, a flagship program of
PSF and the PLDT Managers Club. The special anniversary was celebrated with a Grand
Gathering during the National Teachers’ Month with a spectacular star-studded show
at the MOA Arena as a tribute to our heroes in the classrooms. The event was graced
by the presence of the Department of Education Secretary Hon. Leonor Briones and
attended by around 20,000 teachers from across the Philippines.
During the year, the new teacher scholars of the Gabay Guro program were celebrated
for their achievements. Gabay Guro supported 542 public school teacher scholars of
which 155 graduated – 67 with Latin Honors. In addition, 80 Gabay Guro scholars
passed the Licensure Examinations for Teachers (“LET”).
Gabay Guro continues its advocacy for equal learning opportunities for all. In 2017, they participated anew in Brigada Eskwela (School
Brigade). Due to the devastation of typhoon Nina in 2016, the school Juan M. Alberto Memorial Elementary School (“JMAMES”) was
in disrepair. Gabay Guro extended its support in rebuilding JMAMES, bringing hope to both its teachers and students.
In 2017, four remote public schools received School-in-a-Bag units from PSF and UBS Investments Philippines. The School-in-a-
Bag was created by Smart Communications and aims to help schools that lack access to electricity and digital tools to enhance their
learning. Each backpack contains solar power equipment, LED TV, a laptop and teacher’s tablet, five tablets for students, lapel mic,
hard drive, and Wi-Fi with starter load. The packs also include 21st century teachers’ training contents and a learning management
system.
Brigada Eskwela project
Last May 2017, PSF, together with the Department of Education (DepEd) ran a Brigada Eskwela clean-and-repair project. The project
brings various stakeholders in the community together to clean the assigned public schools and carry out minor repairs to classroom
furniture and facilities.
MPICMPIC’s long-term CSR initiatives are strongly supported by
MPIC group companies’ staff members and management. The
participation of multiple stakeholders increases the positive impact
for local communities.
Shore It Up!In 2017, Shore It Up! (“SIU”) celebrated its tenth year as the
environmental advocacy arm of Metro Pacific Investments
Foundation (“MPIF”). In just a decade, SIU has progressed from
a simple beach and underwater cleanup drive to a number of
sustainable programs for the environment, such as mangrove and
tree planting, giant clam rearrangement, artificial reef restoration,
environmental awareness for school children (through the Junior
Environmental Scouts or JES), and livelihood promotion for
coastal villagers. Most significant of these endeavors has been the
establishment of mangrove centers. In ten years, the program has
encouraged over 75,000 volunteers from MPIC group companies,
as well as from government, the academe, civil society groups and community members.
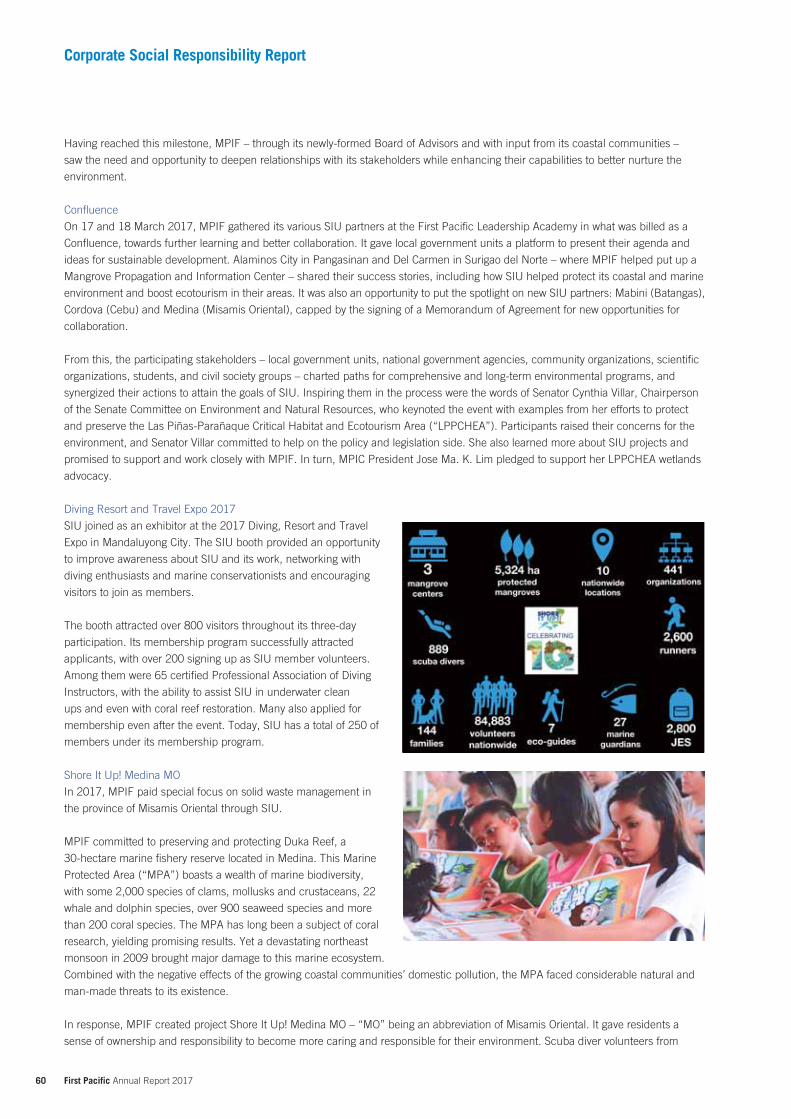
60 First Pacific Annual Report 2017
Corporate Social Responsibility Report
Having reached this milestone, MPIF – through its newly-formed Board of Advisors and with input from its coastal communities –
saw the need and opportunity to deepen relationships with its stakeholders while enhancing their capabilities to better nurture the
environment.
Confluence
On 17 and 18 March 2017, MPIF gathered its various SIU partners at the First Pacific Leadership Academy in what was billed as a
Confluence, towards further learning and better collaboration. It gave local government units a platform to present their agenda and
ideas for sustainable development. Alaminos City in Pangasinan and Del Carmen in Surigao del Norte – where MPIF helped put up a
Mangrove Propagation and Information Center – shared their success stories, including how SIU helped protect its coastal and marine
environment and boost ecotourism in their areas. It was also an opportunity to put the spotlight on new SIU partners: Mabini (Batangas),
Cordova (Cebu) and Medina (Misamis Oriental), capped by the signing of a Memorandum of Agreement for new opportunities for
collaboration.
From this, the participating stakeholders – local government units, national government agencies, community organizations, scientific
organizations, students, and civil society groups – charted paths for comprehensive and long-term environmental programs, and
synergized their actions to attain the goals of SIU. Inspiring them in the process were the words of Senator Cynthia Villar, Chairperson
of the Senate Committee on Environment and Natural Resources, who keynoted the event with examples from her efforts to protect
and preserve the Las Piñas-Parañaque Critical Habitat and Ecotourism Area (“LPPCHEA”). Participants raised their concerns for the
environment, and Senator Villar committed to help on the policy and legislation side. She also learned more about SIU projects and
promised to support and work closely with MPIF. In turn, MPIC President Jose Ma. K. Lim pledged to support her LPPCHEA wetlands
advocacy.
Diving Resort and Travel Expo 2017
SIU joined as an exhibitor at the 2017 Diving, Resort and Travel
Expo in Mandaluyong City. The SIU booth provided an opportunity
to improve awareness about SIU and its work, networking with
diving enthusiasts and marine conservationists and encouraging
visitors to join as members.
The booth attracted over 800 visitors throughout its three-day
participation. Its membership program successfully attracted
applicants, with over 200 signing up as SIU member volunteers.
Among them were 65 certified Professional Association of Diving
Instructors, with the ability to assist SIU in underwater clean
ups and even with coral reef restoration. Many also applied for
membership even after the event. Today, SIU has a total of 250 of
members under its membership program.
Shore It Up! Medina MO
In 2017, MPIF paid special focus on solid waste management in
the province of Misamis Oriental through SIU.
MPIF committed to preserving and protecting Duka Reef, a
30-hectare marine fishery reserve located in Medina. This Marine
Protected Area (“MPA”) boasts a wealth of marine biodiversity,
with some 2,000 species of clams, mollusks and crustaceans, 22
whale and dolphin species, over 900 seaweed species and more
than 200 coral species. The MPA has long been a subject of coral
research, yielding promising results. Yet a devastating northeast
monsoon in 2009 brought major damage to this marine ecosystem.
Combined with the negative effects of the growing coastal communities’ domestic pollution, the MPA faced considerable natural and
man-made threats to its existence.
In response, MPIF created project Shore It Up! Medina MO – “MO” being an abbreviation of Misamis Oriental. It gave residents a
sense of ownership and responsibility to become more caring and responsible for their environment. Scuba diver volunteers from
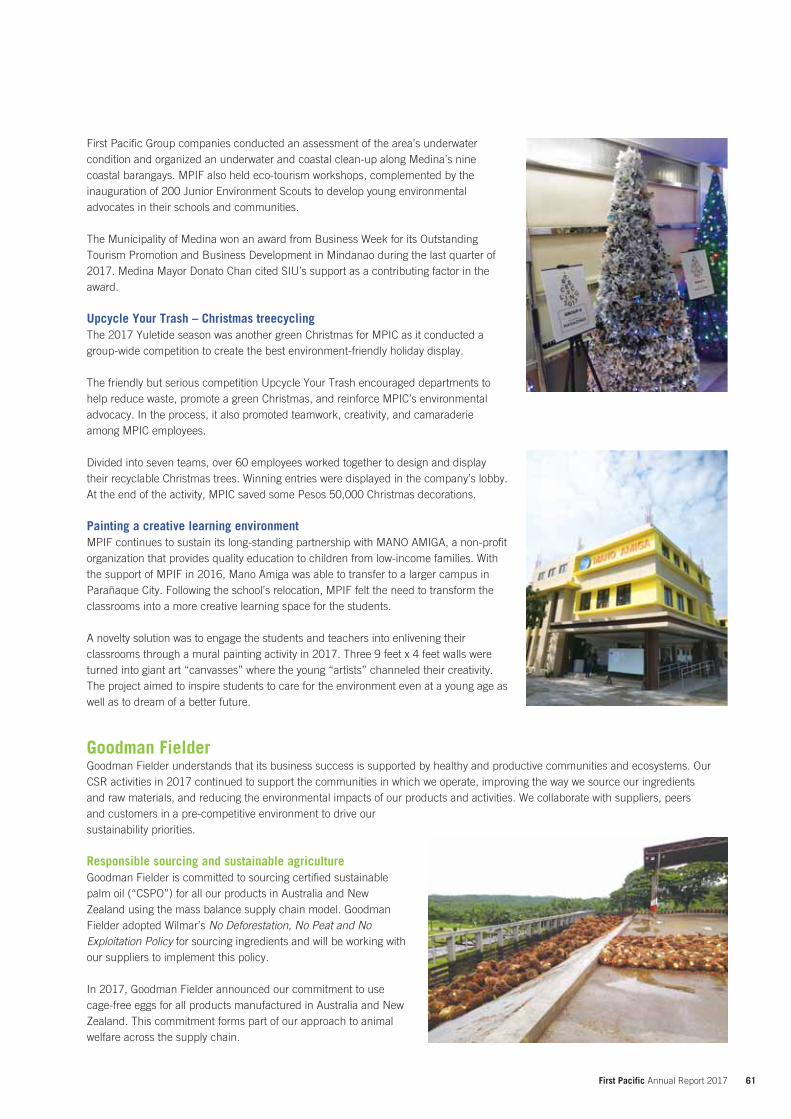
61 First Pacific Annual Report 2017
First Pacific Group companies conducted an assessment of the area’s underwater condition and organized an underwater and coastal clean-up along Medina’s nine coastal barangays. MPIF also held eco-tourism workshops, complemented by the inauguration of 200 Junior Environment Scouts to develop young environmental advocates in their schools and communities.
The Municipality of Medina won an award from Business Week for its Outstanding Tourism Promotion and Business Development in Mindanao during the last quarter of 2017. Medina Mayor Donato Chan cited SIU’s support as a contributing factor in the award.
Upcycle Your Trash – Christmas treecyclingThe 2017 Yuletide season was another green Christmas for MPIC as it conducted a group-wide competition to create the best environment-friendly holiday display.
The friendly but serious competition Upcycle Your Trash encouraged departments to help reduce waste, promote a green Christmas, and reinforce MPIC’s environmental advocacy. In the process, it also promoted teamwork, creativity, and camaraderie among MPIC employees.
Divided into seven teams, over 60 employees worked together to design and display their recyclable Christmas trees. Winning entries were displayed in the company’s lobby. At the end of the activity, MPIC saved some Pesos 50,000 Christmas decorations.
Painting a creative learning environmentMPIF continues to sustain its long-standing partnership with MANO AMIGA, a non-profit organization that provides quality education to children from low-income families. With the support of MPIF in 2016, Mano Amiga was able to transfer to a larger campus in Parañaque City. Following the school’s relocation, MPIF felt the need to transform the classrooms into a more creative learning space for the students.
A novelty solution was to engage the students and teachers into enlivening their classrooms through a mural painting activity in 2017. Three 9 feet x 4 feet walls were turned into giant art “canvasses” where the young “artists” channeled their creativity. The project aimed to inspire students to care for the environment even at a young age as well as to dream of a better future.
Goodman FielderGoodman Fielder understands that its business success is supported by healthy and productive communities and ecosystems. Our CSR activities in 2017 continued to support the communities in which we operate, improving the way we source our ingredients and raw materials, and reducing the environmental impacts of our products and activities. We collaborate with suppliers, peers and customers in a pre-competitive environment to drive our sustainability priorities.
Responsible sourcing and sustainable agricultureGoodman Fielder is committed to sourcing certified sustainable palm oil (“CSPO”) for all our products in Australia and New Zealand using the mass balance supply chain model. Goodman Fielder adopted Wilmar’s No Deforestation, No Peat and No Exploitation Policy for sourcing ingredients and will be working with our suppliers to implement this policy.
In 2017, Goodman Fielder announced our commitment to use cage-free eggs for all products manufactured in Australia and New Zealand. This commitment forms part of our approach to animal welfare across the supply chain.

62 First Pacific Annual Report 2017
Corporate Social Responsibility Report
As a foundation member of the Australian Chapter of the Sustainable Agriculture Initiative (“SAI”) Platform, Goodman
Fielder participated in project to refine a CSIRO-developed climate
change adaptation tool that assists agribusinesses to understand
and plan for potential climate-related business continuity risks.
As a signatory to the Australian Business Pledge against Forced Labour, Goodman Fielder collaborates in the fight against forced labour, including commissioning research into business approaches to remedy. This research has gained international support and is expected to be released in 2018, contributing to a broader understanding of how business can address this important component of human rights in supply chains.
Supporting our local communitiesGoodman Fielder Cares Trust (New Zealand)The Goodman Fielder Cares Trust is managed by employees of Goodman Fielder New Zealand and, through the support of the company, ensures that 100% of all donations received support the Trust’s initiatives.
Goodman Fielder employees contributed 655 volunteer hours in the year to 30 June 2017 to initiatives including the “Feed the Need” program providing meals to school children. The company also donated over 100,000 loaves of fresh bread to foodbanks, and matched, dollar for dollar, the employee payroll donations.
DINEAID (New Zealand)In 2017, Goodman Fielder was principal sponsor of DINEAID, an initiative by a small group of New Zealand restaurateurs to help those in need. DINEAID funds are redistributed to Foodbanks in Auckland, Wellington and Christchurch/South Island regions.
Fighting food waste and hunger (Australia)Goodman Fielder continued our long association with Foodbank, Australia’s largest hunger relief organization, donating product and staff time to support the packing of hampers. Goodman Fielder also participated in Oz Harvest’s CEO Cook Off, an event which raised nearly A$2 million for Australia’s leading food rescue organization and provided a memorable event for vulnerable men and women in Australia.
Community support programs (Pacific Islands)Our international operations in Fiji, Papua New Guinea and New Caledonia are all committed to supporting their local communities. In each country, we partner with local aid agencies to deliver food, health and education services to those in need.
Fiji businesses provide product and monetary donations to more than 10 local orphanages and aged care facilities. Goodman Fielder Fiji also supports the procurement and shipment of beds and specialized equipment for the high-support ward of the Frank Hilton Organization which provides holistic developmental support to over 200 children with disabilities.
The Fiji businesses also supported several healthcare facilities throughout 2017, assisting the Taveuni Hospital in raising funds to build two Health Centers, two Nursing Stations, the AdiBeti (Hospital Boat) and the Waiyevo Hospital.
63 First Pacific Annual Report 2017
Improving environmental performanceZero waste to landfill (New Zealand)The New Zealand operations team set an ambitious target of achieving zero waste to landfill from our manufacturing activities. Through a coordinated network of waste champions, supported by the leadership team, we have reduced waste to landfill by over 50%.The project now focuses on finding higher value outcomes for the remaining materials where alternatives to landfill do not exist.
Sustainable packagingGoodman Fielder continued our focus on reducing the environmental impacts of packaging in 2017. As members of the Red Cycle programme in Australia and New Zealand, Goodman Fielder supports the collection and recycling of used soft plastic packaging (e.g. bread bags). These services have resulted in over four million items of Goodman Fielder packaging being collected for recycling annually.
Our focus on sustainable packaging design resulted in the introduction of short skirt caps for our milk bottles in New Zealand. The
new caps use 41% less plastic and by working together with our peers for an industry change, 276 tonnes total of HDPE plastic waste is
saved per year.
PhilexPhilex Group Foundation Inc. (“PGFI”) is the ESG arm of Philex Mining Corporation, with the mandate to empower its partner-
communities to become socio-economically independent.
The Padcal mine has been in operation for six decades, and the ore life is expected to deplete soon. Aside from complying with the
post-mining rehabilitation plan, Philex intends to ensure that the communities left behind will continue to have a sustainable source
of income and livelihood once the mine life ends. With this in mind, the implementation of PGFI’s main programs went hand-in-hand
with the establishment of a social enterprise to provide a market for their partners in their entrepreneurial endeavors.
Padcal mineOrganic vegetable farming
2017 saw the continued expansion of the organic vegetable
farming program. Eight new farmers joined the program, along
with Ligay Elementary School and Torre Elementary School,
which adopted the activity in compliance with the Department of
Education’s requirement for schools to set up vegetable gardens in
their campuses.
In 2017, organic vegetable production from core partner-farmers
located at Balayan, Makalbeng and Torre increased 54% to 3,823
kilograms while incomes grew 66%.
Core partner-farmers taught newly joined farmers organic farming techniques and trained them how to be trainers. As a result, the
new partner-farmers, together with the two elementary schools, started well during the current year, with average weekly production of
approximately 100 kilograms.
PGFI’s social enterprise unit Px Community Foods and Marketing, Inc. (“PxCFMI”) renewed its certification from the Organic
Certification Center of the Philippines for all the partner-farms.
KapeBuhayan: coffee farming and roasting
PGFI received a grant from Metrobank Foundation, Inc. for the expansion of the KapeBuhayan program. The agreement involves
farm-based training and simultaneous actual farm rehabilitation, targeting four communities in the host and neighboring communities
around Padcal mine. The training will be conducted by the trained core partner-farmers and will be kicked off in 2018 in four targeted
community-farms located in Benguet.
64 First Pacific Annual Report 2017
Corporate Social Responsibility Report
Social development and management program
Health and sanitationThe Padcal mine’s Sto Niño Hospital caters to employees, their families, and the host and neighboring communities. On average,
it serves 350 out-patients daily with medical consultations, treatment and medicines provided. The Health Program also covered a
medical and dental mission, which offered free consultations and medicines. The company also provided Philippine Health Insurance
to 551 indigents from the HNCs.
To promote self-reliance, Philex provides equipment to other health clinics in neighboring communities to accredit these as lying-in
centers.
EducationPusong Philex, the company’s educational assistance program, supports and subsidizes elementary and high school students from
the HNCs.
Philex also provided financial support to 75 college students in Baguio City and La Trinidad, who are enrolled in courses such as
Engineering, Education, Criminology and Accountancy.
Livelihood and skill developmentIn 2017, Philex continued to support its local farmers and entrepreneurs through various projects and financial assistance for small and medium enterprises, aimed at enhancing opportunities for success.
The company provided seed capital for iodized salt retailing, equipment for a water refilling station, financial support for hog raising and poultry production, and the improvement of existing irrigation facilities.
Support to public infrastructureThe provision of public infrastructure provides safe access for users and Philex sustained this campaign in the host and neighboring communities through the following projects: Provision of infrastructure support to Health and Education
Programs Construction and improvement of buildings and facilities for
livelihood development Development and continuous improvement of farm-to-market
and access roads such as the Philex-Kias Road (Provincial Road)
Extension of secondary lines, electric wiring and installation of outlets
Among the notable infrastructure support provided under the program is the construction of teachers’ quarters. With the mountainous topography of the host and neighboring communities around Padcal mine, teachers, who are also mothers, are forced to travel to their assigned schools a day before their classes. With the provision of teachers’ quarters, travel time for teachers has substantially decreased, which allowed them more time for their own children.
In addition, Philex also prioritizes the construction and improvement of water systems as well as the delivery of water analysis equipment to ensure best access to potable water.
Silangan projectThe project has not yet commenced development but community development and environment enhancement programs are continuing, in compliance with the Environmental Compliance Certification (“ECC”) conditions and environmental, social and governance (“ESG”) commitments to the local communities. Among the critical programs, Information, Education and Communications (“IEC”) are the key focus of Silangan’s CSR initiatives as of now.
65 First Pacific Annual Report 2017
Employee volunteerism and transfer of technologyUnder this campaign, the Community Relations (“ComRel”) IEC Officer and Silangan IT Supervisor conducted a lecture and served as a speaker at a 3-day seminar on Information and Communication Technology at Timamana National High School.
IEC on Forestry LawIn conjunction with the City Environment and Natural Resources of Surigao del Norte, Silangan Mindanao Mining Company Inc. (“SMMCI”) conducted an IEC Campaign on Forestry Laws, Rules and Regulations to the host barangays around the project site. The activity was aimed at properly educating the community on forest laws, specifically with respect to addressing the problem of illegal tree-cutting activities within the Silangan controlled area.
HealthIn 2017, the company donated emergency kits and equipment to three earthquake-hit barangays in Sison: Tagbayani, Mayag and Gacepan. Each barangay received a rechargeable megaphone, a number of flashlights, emergency blankets, first-aid kits, rubber boots, raincoats, hard hat, whistle and a box of canned goods.
School supplies distributionFor school year 2017-2018, 5,173 students from 33 public schools located in four host local government units (“LGUs”) received school supplies from Silangan. In addition, regular meetings with the parents of Silangan Scholars in Timamana were conducted to
provide updates on Silangan’s Scholarship Program.
K-12 TVL work immersion partnership
Under the Memorandum of Agreement with the Department of Education, 27 K-12 students from Toldedo Pantilo Sr. Memorial
National High completed their work immersion program at Silangan to enrich and reinforce the students’ skills and competencies.
Workshops with the Barangay Water and Sanitation Committee and Councils
Three barangays developed a Community Water Management Plan, which addressed issues and concerns related to the acceptance
of the Silangan Community Water Project. After identifying and analyzing the said items, proper action plans were formulated.
Establishment of Bansiwag Corporation
To sustain and further strengthen the promotion of sustainable livelihood during the commercial operations of Silangan, the company
established the Bansiwag Corporation last year, a community-based corporation registered with the Securities and Exchange
Commission. The Bansiwag Corporation comprises of 12 organizations within Silangan’s host and neighboring communities, where
297 residents/members are the stockholders, and supplies the following services to Silangan:
Kitchen/catering services
Laundry services
Housekeeping services
Carpentry and electrical services
Seedlings production for SMECI Nursery
PLPPLP is part of the larger Singapore community and it is essential
that we engage at all levels to support the communities we
serve. PLP has been actively supporting various charity welfare
organizations through volunteering. We firmly believe in sponsoring
initiatives that promote education, environment conservation and
resources preservation to make Singapore a better place and
preserving resources for future generations.
Run for Hope 2017This annual fund-raising run at the Marina Bay Waterfront is
organized by the National Cancer Center Singapore (“NCCS”) to
raise awareness and support for cancer research. PLP staff and
their families have been supporting the run since 2014.
66 First Pacific Annual Report 2017
Corporate Social Responsibility Report
Willing Hearts soup kitchenStaff volunteers and their families spent a Saturday morning
assisting at the soup kitchen to prepare meals for the elderly,
disadvantaged families and people with disabilities. Willing Hearts
distributes 3,000 meals per day in Singapore.
Singapore International World Water Day@Jurong SpringPLP has supported this annual event since 2016 as a corporate
member of Friends of the Waterway. We joined Juying Secondary
School students in promoting water conservation with Jurong
Spring residents. The event was followed by a self-initiated litter
clearing session.
WE clean-up operations at Taman JurongTaman Jurong Grassroots Club organizes a litter clean-up, which PLP volunteers have joined since 2015. Waste collected at the public
housing areas was tabulated and recorded for analysis.
Volunteer spring cleaning at Healthy Start Child Development CenterPLP’s staff volunteers participated in cleaning and sanitizing the furniture, utensils, toys and floor of the pre-school to provide a healthy
and hygienic environment for the students.
Coastal clean-up at Punggol BeachOrganized by the International Coastal Clean Up Singapore (ICCS), PLP has participated
in the coastal event since 2016. In 2017, PLP’s staff worked at Punggol Beach where
60 kilograms of trash were collected; while an alarming total of 14,339 kilograms of
trash were collected from the 2017 Singapore – wide coastal clean-up.
NEMS charity day outing for children from Child at Street 21An annual event organized by the Electricity Market Company (EMC), PacificLight
Energy’s staff joined participants to offer children from Child at Street 21 a half-day
outing on a boat tour around Singapore.
Sustainable Singapore School Art CompetitionThe National Environmental Agency (NEA) is the leading public organization responsible
for improving and sustaining a clean and green environment in Singapore. Its annual
art competition program engages primary students in environmental conservation and
resource preservation. The theme for 2017 was “Be an Energy Hero”, with over 80
creative art pieces received. The winning pieces were showcased at the 2017 Clean and
Green Singapore carnival, as well as in PLP 2018’s corporate calendar.
RHISustainability is in RHI’s DNA, integrated in the business strategy and operations
together with the triple bottom line approach: People, Planet and Profit. RHI strives to
grow profitably and to be a responsible and positive contributor to our environment and
the communities.
Aligned with the United Nations Sustainable Development Goals, RHI’s CSR programs
focus on Environment; Livelihood, Education and Health.
Environmental stewardship: tree planting and river clean-up programsRHI is dedicated to complying with the appropriate and relevant environmental laws and
standards.

67 First Pacific Annual Report 2017
RHI’s Tree Planting and Adopt a River Programs, engage the Department of Environment and Natural Resources (DENR), the Local
Government Units (LGUs), the communities and our employees. The company planted more than 2,000 trees in 2017, and cleaned
up rivers and areas near the plant sites.
Building partnerships for inclusive growthRHI pursues a policy of continuous stakeholder engagement between the company and its partner communities and organizations.
Educated Marginalized Entrepreneurs Resource Generation (EMERGE) Program
The EMERGE Program is created by the Management Association
of the Philippines (MAP) to assist projects/businesses with potential
for growth and job generation.
Central Azucarera Don Pedro, Inc. (CADPI) implements a napier
grass biofuel program with low-income farmers.
RHI, with its subsidiary Agribusiness Development Corporation,
offers farmers mentorship, knowledge of planting napier grass and
good farming practices. An estimated harvest of 310 tons, from 7
hectares of farm lands, were sold to CADPI plant in 2017.
AgriClima Project
RHI engages World Wildlife Fund (WWF) for Nature Philippines,
Multi-sectoral Alliance for Development (MUAD) and the Bank of
the Philippine Islands (BPI) Foundation on the AgriClima Project.
AgriClima aims to reduce the impacts from agricultural production
and promote smart agricultural practices to increase productivity.
The partnership also facilitates farmers’ access to credit, financial
education and possible market linkage for intercrops. RHI supports
selected farm cooperatives in Pontevedra, La Castellana, Calatrava
and Carlos City in Negros Occidental.
Providing access to education: RHI Scholarship and the Tulong Aral ProgramsRHI places Education as a top priority. The aim is to nurture the
younger generation to contribute to their families and communities
and to play a role in national development. In 2017, RHI granted a total of 125 scholarships at Nasugbu, Batangas and Negros
Occidental.
Tulong Aral Program, in partnership with Roxas Foundation Inc., channels voluntary financial donations from RHI employees to help
deserving students. For the school year 2016/17, more than 50 deserving students were sponsored by employees at Central Azucarera
de la Carlota, Roxol Bioenergy Corporation and CADPI.
68 First Pacific Annual Report 2017
Corporate Governance Report
Governance FrameworkFirst Pacific is committed to building and maintaining high standards of corporate governance. The Company’s Corporate Governance
Committee, comprised of a majority of Independent Non-executive Directors (INEDs) and chaired by an INED, was delegated with the
responsibility for supervision of the Company’s corporate governance functions. The Committee carried out a review of its corporate
governance practices in respect of the year ended 31 December 2017 to ensure its compliance with the Listing Rule requirements.
This Committee is also tasked with the responsibility to oversee the process of Environmental, Social and Governance (ESG) reporting,
in compliance with the Listing Rule requirements. With the approval of the Corporate Governance Committee, the Company’s first ESG
report was published on the websites of the SEHK and the Company in mid-July 2017.
The Company has adopted its own Corporate Governance Code (the First Pacific Code), which incorporates the principles and
requirements set out in the Corporate Governance Code contained in Appendix 14 of the Main Board Listing Rules (the CG Code). The
First Pacific Code will be updated regularly following relevant amendments to the Listing Rules.
Throughout the current financial year, First Pacific has applied the principles and complied with most of the Code Provisions and,
where appropriate, adopted the Recommended Best Practices contained in the CG Code with the following exceptions:
Code Provision B.1.5: Issuers should disclose details of any remuneration payable to members of senior management by band in their annual reports. Recommended Best Practice B.1.8: Issuers should disclose details of any remuneration payable to members of senior management, on an individual and named basis, in their annual reports.
The Company does not disclose details of any remuneration payable to members of senior management, either by band or on an
individual and named basis as a large number of the senior executives employed by the Group are employed in jurisdictions that do
not require disclosure of such information. It will create inequality across the Group if only the remuneration of the senior executives at
the head office is disclosed.
Recommended Best Practices C.1.6 and C.1.7: An issuer should announce and publish quarterly financial results within 45 days after the end of the relevant quarter.
The Company does not issue quarterly financial results as most of our major operating units based in the Philippines, Indonesia and
Singapore already issue quarterly reports. As such, we believe that the relevant information is already available in the public domain.
Code Provision C.2.5: The Issuer should have an internal audit function. Issuers without an internal audit function should review the need for one on an annual basis and should disclose the reasons for the absence of such a function in the Corporate Governance Report.
The Company does not have an internal audit department. However, the Group has multiple listed companies in the Philippines,
Indonesia and Singapore, as well as a joint venture company in Australia, each of which has its own internal audit and/or risk
management functions to monitor the internal control system for operational, financial and compliance and risk management
functions. Accordingly, the Company can rely on group resources to carry out internal audit/risk management functions for members
of the Group. Taking this into account, the Company does not consider it necessary to have a separate internal audit function. The
Company will review the need for such function on an annual basis.
Model Code for Securities TransactionsThe Company has adopted its own Model Code for Securities Transactions by Directors (the Model Code) on terms no less exacting
than the required standards of the Model Code for Securities Transactions by Directors of Listed Issuers, as set out in Appendix 10 of
the Listing Rules. All Directors have confirmed, following specific enquiries by the Company, that they have complied with the required
standards set out in the Model Code for the year ended 31 December 2017.
Directors’ interest in securities of the Company and its associated corporations as at 31 December 2017 have been disclosed in the
Report of the Directors as set out in this Annual Report.
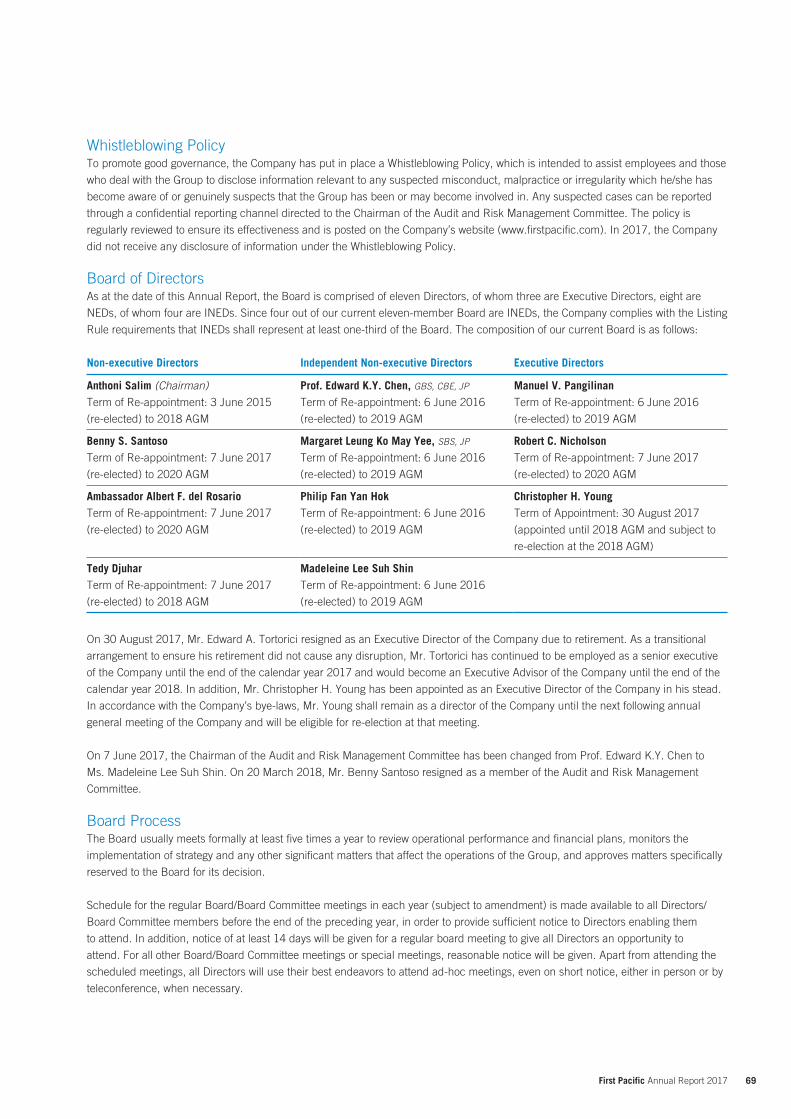
69 First Pacific Annual Report 2017
Whistleblowing PolicyTo promote good governance, the Company has put in place a Whistleblowing Policy, which is intended to assist employees and those
who deal with the Group to disclose information relevant to any suspected misconduct, malpractice or irregularity which he/she has
become aware of or genuinely suspects that the Group has been or may become involved in. Any suspected cases can be reported
through a confidential reporting channel directed to the Chairman of the Audit and Risk Management Committee. The policy is
regularly reviewed to ensure its effectiveness and is posted on the Company’s website (www.firstpacific.com). In 2017, the Company
did not receive any disclosure of information under the Whistleblowing Policy.
Board of DirectorsAs at the date of this Annual Report, the Board is comprised of eleven Directors, of whom three are Executive Directors, eight are
NEDs, of whom four are INEDs. Since four out of our current eleven-member Board are INEDs, the Company complies with the Listing
Rule requirements that INEDs shall represent at least one-third of the Board. The composition of our current Board is as follows:
Non-executive Directors Independent Non-executive Directors Executive Directors
Anthoni Salim (Chairman)Term of Re-appointment: 3 June 2015
(re-elected) to 2018 AGM
Prof. Edward K.Y. Chen, GBS, CBE, JP
Term of Re-appointment: 6 June 2016
(re-elected) to 2019 AGM
Manuel V. PangilinanTerm of Re-appointment: 6 June 2016
(re-elected) to 2019 AGM
Benny S. SantosoTerm of Re-appointment: 7 June 2017
(re-elected) to 2020 AGM
Margaret Leung Ko May Yee, SBS, JP
Term of Re-appointment: 6 June 2016
(re-elected) to 2019 AGM
Robert C. NicholsonTerm of Re-appointment: 7 June 2017
(re-elected) to 2020 AGM
Ambassador Albert F. del RosarioTerm of Re-appointment: 7 June 2017
(re-elected) to 2020 AGM
Philip Fan Yan HokTerm of Re-appointment: 6 June 2016
(re-elected) to 2019 AGM
Christopher H. YoungTerm of Appointment: 30 August 2017
(appointed until 2018 AGM and subject to
re-election at the 2018 AGM)
Tedy DjuharTerm of Re-appointment: 7 June 2017
(re-elected) to 2018 AGM
Madeleine Lee Suh ShinTerm of Re-appointment: 6 June 2016
(re-elected) to 2019 AGM
On 30 August 2017, Mr. Edward A. Tortorici resigned as an Executive Director of the Company due to retirement. As a transitional
arrangement to ensure his retirement did not cause any disruption, Mr. Tortorici has continued to be employed as a senior executive
of the Company until the end of the calendar year 2017 and would become an Executive Advisor of the Company until the end of the
calendar year 2018. In addition, Mr. Christopher H. Young has been appointed as an Executive Director of the Company in his stead.
In accordance with the Company’s bye-laws, Mr. Young shall remain as a director of the Company until the next following annual
general meeting of the Company and will be eligible for re-election at that meeting.
On 7 June 2017, the Chairman of the Audit and Risk Management Committee has been changed from Prof. Edward K.Y. Chen to
Ms. Madeleine Lee Suh Shin. On 20 March 2018, Mr. Benny Santoso resigned as a member of the Audit and Risk Management
Committee.
Board ProcessThe Board usually meets formally at least five times a year to review operational performance and financial plans, monitors the
implementation of strategy and any other significant matters that affect the operations of the Group, and approves matters specifically
reserved to the Board for its decision.
Schedule for the regular Board/Board Committee meetings in each year (subject to amendment) is made available to all Directors/
Board Committee members before the end of the preceding year, in order to provide sufficient notice to Directors enabling them
to attend. In addition, notice of at least 14 days will be given for a regular board meeting to give all Directors an opportunity to
attend. For all other Board/Board Committee meetings or special meetings, reasonable notice will be given. Apart from attending the
scheduled meetings, all Directors will use their best endeavors to attend ad-hoc meetings, even on short notice, either in person or by
teleconference, when necessary.
70 First Pacific Annual Report 2017
Corporate Governance Report
Meeting agendas for regular Board meetings are set after consultation with the Chairman and the Executive Directors. All Directors are
given an opportunity to include matters in the agenda. Directors have access to the advice and services of the Company Secretary to
ensure that board procedures, all applicable rules and regulations, are followed. Adequate and appropriate information, in the form of
agendas, board papers and related materials, are prepared and provided to the Directors prior to the scheduled dates for the Board
meetings in a timely manner.
The Company has implemented the distribution of Board/Board Committee papers through an electronic platform to those Directors
who choose to access Board/Board Committee papers through the electronic platform since March 2014. A reading room has been
added to the electronic platform to provide Directors with access to relevant information relating to the Company. The electronic
platform ensures timely and secure provision of information to Directors, while also reducing paper usage.
Minutes of the Board/Board Committee meetings are kept by the Company Secretary. Minutes are open for inspection at any
reasonable time on reasonable notice by any Director.
Minutes of the Board/Board Committee meetings have been recorded in sufficient detail including matters considered by the
Board/Board Committees, decisions reached, any concerns raised by the Directors/Board Committee members or dissenting views
expressed by them. Draft and final versions of minutes of the Board/Board Committee meetings are sent to all Directors/Board
Committee members for their comments and records respectively within a reasonable time after each meeting. Chairmen of the Board
Committees report on important issues discussed and reviewed by the Board Committees at each Board meeting.
In addition to the regular financial performance reports submitted to the Board at its regular meetings, the Directors also receive
monthly financial and business updates with information on the Company’s latest financial performance. Directors can therefore have
a balanced and understandable assessment of the Company’s performance, position and prospects throughout the year.
The Board reviews and evaluates its work process and effectiveness annually, with a view to identifying areas for improvement and
further enhancement. The Board also regularly reviews the time commitment required from the NEDs (including the INEDs).
Under the bye-laws of the Company, a Director should not vote or be counted in the quorum in respect of any contract, arrangement,
transaction or other proposal in which he/she or his/her associate(s) is/are materially interested.
Board EvaluationThe Company believes that good corporate governance involves a strong and effective board, one that understands its role and
responsibility, provides leadership and strategic guidance for the Company, establishes effective controls, oversees management and
sets the Company’s values and standards. In this respect, it is important to measure the effectiveness of the Board through proper
board evaluation process, on a regular basis.
The Company has been conducting internally-administered board evaluations for a number of years. In respect of the year 2016/2017,
to further enhance independence and objectivity, the Board decided to engage an independent consultant to conduct an externally
facilitated board evaluation. After considering competitive proposals, the Corporate Governance Committee recommended the
engagement of Practising Governance Limited (PGL), an independent consultant specialized in corporate governance. It was approved
by the Board.
Noting it being the Board’s first externally facilitated evaluation, a “facilitated questionnaire approach” (instead of individual interviews)
was adopted. Following review of the Company’s corporate and board documents, and seeking feedback from both executive
management and the Corporate Governance Committee, PGL developed a tailored questionnaire for directors. A combination of
ranking and open-ended questions were used in the questionnaire, with appropriate “prompts” to stimulate the directors’ thinking
process.
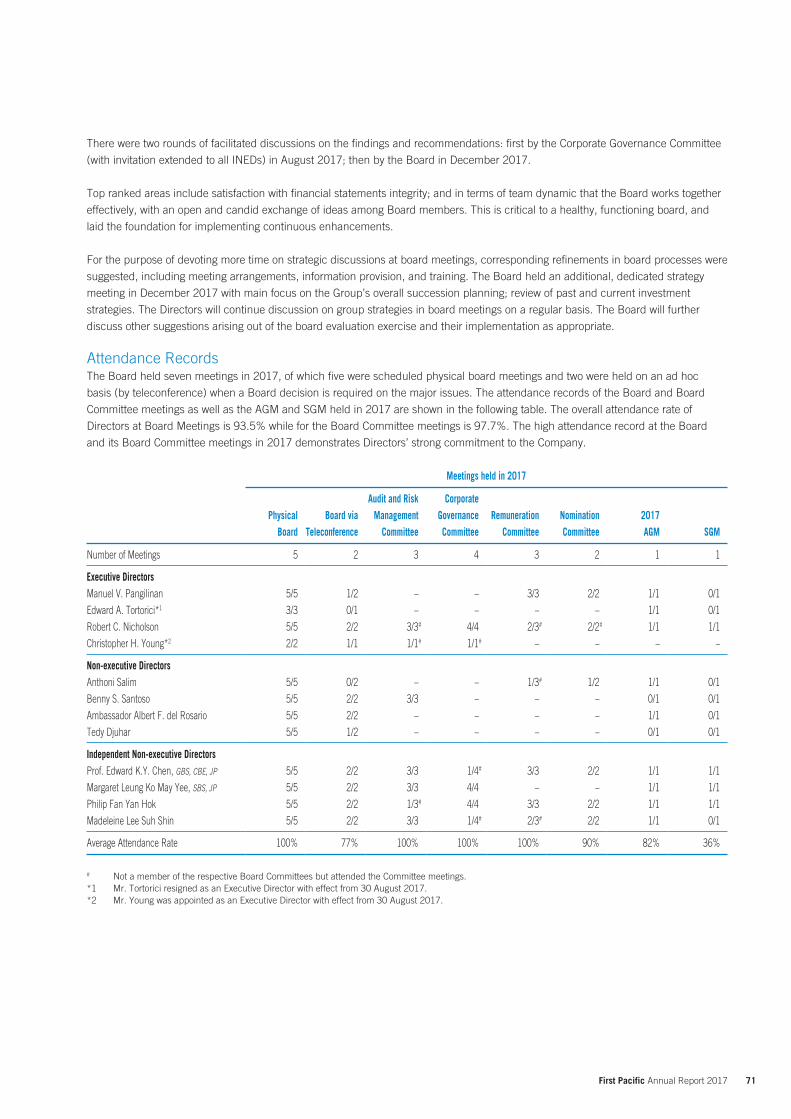
71 First Pacific Annual Report 2017
There were two rounds of facilitated discussions on the findings and recommendations: first by the Corporate Governance Committee
(with invitation extended to all INEDs) in August 2017; then by the Board in December 2017.
Top ranked areas include satisfaction with financial statements integrity; and in terms of team dynamic that the Board works together
effectively, with an open and candid exchange of ideas among Board members. This is critical to a healthy, functioning board, and
laid the foundation for implementing continuous enhancements.
For the purpose of devoting more time on strategic discussions at board meetings, corresponding refinements in board processes were
suggested, including meeting arrangements, information provision, and training. The Board held an additional, dedicated strategy
meeting in December 2017 with main focus on the Group’s overall succession planning; review of past and current investment
strategies. The Directors will continue discussion on group strategies in board meetings on a regular basis. The Board will further
discuss other suggestions arising out of the board evaluation exercise and their implementation as appropriate.
Attendance RecordsThe Board held seven meetings in 2017, of which five were scheduled physical board meetings and two were held on an ad hoc
basis (by teleconference) when a Board decision is required on the major issues. The attendance records of the Board and Board
Committee meetings as well as the AGM and SGM held in 2017 are shown in the following table. The overall attendance rate of
Directors at Board Meetings is 93.5% while for the Board Committee meetings is 97.7%. The high attendance record at the Board
and its Board Committee meetings in 2017 demonstrates Directors’ strong commitment to the Company.
Meetings held in 2017
PhysicalBoard
Board viaTeleconference
Audit and RiskManagement
Committee
CorporateGovernanceCommittee
RemunerationCommittee
NominationCommittee
2017AGM SGM
Number of Meetings 5 2 3 4 3 2 1 1
Executive DirectorsManuel V. Pangilinan 5/5 1/2 – – 3/3 2/2 1/1 0/1
Edward A. Tortorici*1 3/3 0/1 – – – – 1/1 0/1
Robert C. Nicholson 5/5 2/2 3/3# 4/4 2/3# 2/2# 1/1 1/1
Christopher H. Young*2 2/2 1/1 1/1# 1/1# – – – –
Non-executive DirectorsAnthoni Salim 5/5 0/2 – – 1/3# 1/2 1/1 0/1
Benny S. Santoso 5/5 2/2 3/3 – – – 0/1 0/1
Ambassador Albert F. del Rosario 5/5 2/2 – – – – 1/1 0/1
Tedy Djuhar 5/5 1/2 – – – – 0/1 0/1
Independent Non-executive DirectorsProf. Edward K.Y. Chen, GBS, CBE, JP 5/5 2/2 3/3 1/4# 3/3 2/2 1/1 1/1
Margaret Leung Ko May Yee, SBS, JP 5/5 2/2 3/3 4/4 – – 1/1 1/1
Philip Fan Yan Hok 5/5 2/2 1/3# 4/4 3/3 2/2 1/1 1/1
Madeleine Lee Suh Shin 5/5 2/2 3/3 1/4# 2/3# 2/2 1/1 0/1
Average Attendance Rate 100% 77% 100% 100% 100% 90% 82% 36%
# Not a member of the respective Board Committees but attended the Committee meetings.*1 Mr. Tortorici resigned as an Executive Director with effect from 30 August 2017.*2 Mr. Young was appointed as an Executive Director with effect from 30 August 2017.
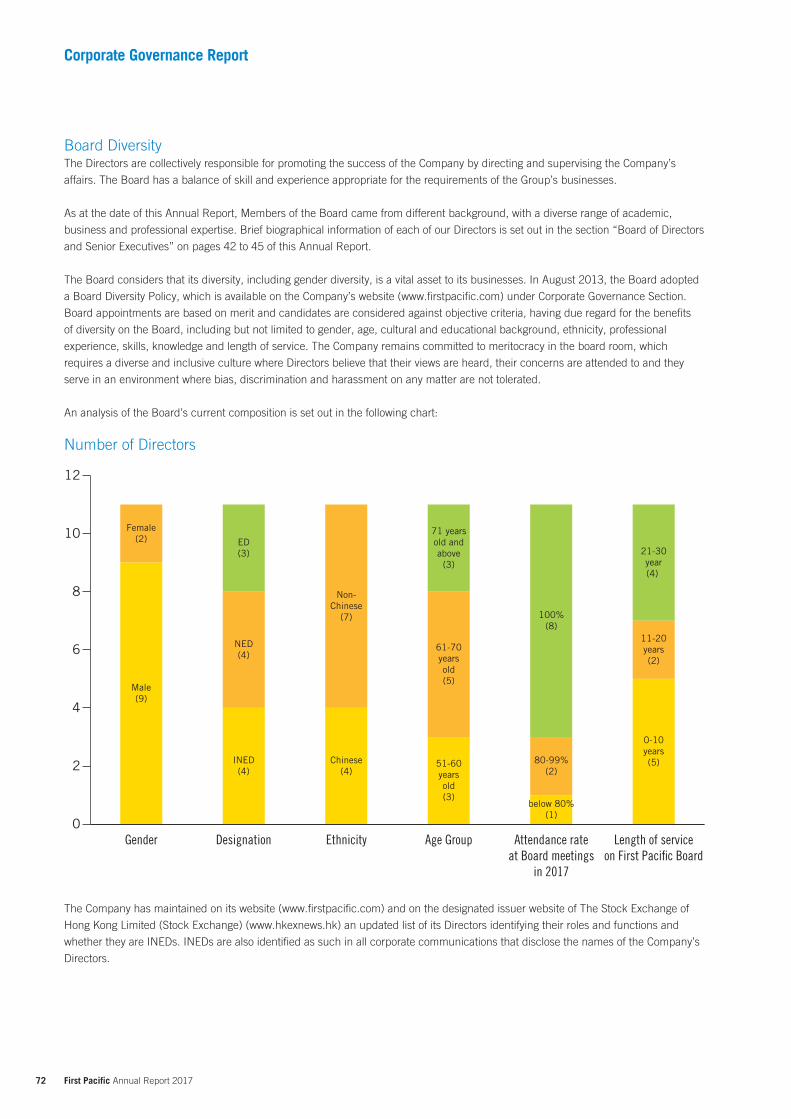
72 First Pacific Annual Report 2017
Corporate Governance Report
Board DiversityThe Directors are collectively responsible for promoting the success of the Company by directing and supervising the Company’s
affairs. The Board has a balance of skill and experience appropriate for the requirements of the Group’s businesses.
As at the date of this Annual Report, Members of the Board came from different background, with a diverse range of academic,
business and professional expertise. Brief biographical information of each of our Directors is set out in the section “Board of Directors
and Senior Executives” on pages 42 to 45 of this Annual Report.
The Board considers that its diversity, including gender diversity, is a vital asset to its businesses. In August 2013, the Board adopted
a Board Diversity Policy, which is available on the Company’s website (www.firstpacific.com) under Corporate Governance Section.
Board appointments are based on merit and candidates are considered against objective criteria, having due regard for the benefits
of diversity on the Board, including but not limited to gender, age, cultural and educational background, ethnicity, professional
experience, skills, knowledge and length of service. The Company remains committed to meritocracy in the board room, which
requires a diverse and inclusive culture where Directors believe that their views are heard, their concerns are attended to and they
serve in an environment where bias, discrimination and harassment on any matter are not tolerated.
An analysis of the Board’s current composition is set out in the following chart:
Number of Directors
0
2
4
6
8
10
12
Female(2)
Male(9)
NED(4)
ED(3)
INED(4)
Non-Chinese
(7)
Chinese(4)
51-60yearsold(3)
61-70yearsold(5)
71 yearsold andabove
(3)
100%(8)
80-99%(2)
below 80%(1)
0-10years(5)
11-20years(2)
21-30year(4)
Gender Designation Ethnicity Age Group Attendance rateat Board meetings
in 2017
Length of serviceon First Pacific Board
The Company has maintained on its website (www.firstpacific.com) and on the designated issuer website of The Stock Exchange of
Hong Kong Limited (Stock Exchange) (www.hkexnews.hk) an updated list of its Directors identifying their roles and functions and
whether they are INEDs. INEDs are also identified as such in all corporate communications that disclose the names of the Company’s
Directors.
73 First Pacific Annual Report 2017
Chairman and Chief ExecutiveThe roles of the Chairman and Chief Executive Officer of the Company are separate, with a clear division of responsibilities.
Currently, Mr. Anthoni Salim, a Non-executive Director, is the Chairman of the Company and Mr. Manuel V. Pangilinan, an Executive
Director, is the Managing Director and Chief Executive Officer of the Company. Accordingly, the roles of the Chairman and Chief
Executive Officer of the Company are segregated and are not exercised by the same individual. The division of responsibilities between
the Chairman and the Chief Executive Officer of the Company are set out in the First Pacific Code.
Responsibilities of DirectorsThe Board is responsible for the success of the Company by directing and supervising its affairs in a responsible and effective manner.
Each Director has a duty to act in good faith and in the best interests of the Company. Directors are expected to devote sufficient time
and attention to performing their duties and responsibilities. The Directors are aware of their collective and individual responsibilities to
all shareholders for the manner in which the affairs of the Company are managed, controlled and operated.
The Executive Directors, led by the Managing Director and Chief Executive Officer, are responsible for the day-to-day management of
the Company’s operations. In addition, there are regular meetings with the senior management of subsidiaries, associated and joint
venture companies, at which operating strategies and policies are formulated and communicated.
The Company has established a policy enabling all Directors to seek independent professional advice in appropriate circumstances, at
the Company’s expenses. The Board will provide separate independent professional advice to Directors to assist the relevant Director
or Directors to discharge his/her/their duties to the Company as and when requested or necessary.
The Company has arranged Directors’ and Officers’ Liability Insurance for a total liability limit of US$40 million, renewable annually in
May of each year. The underwriters are Berkshire Hathaway Specialty Insurance Company and AIG Insurance Hong Kong Limited,
who are both specialists in the Directors’ and Officers’ Liability Insurance market.
If a substantial shareholder or a Director has a conflict of interest in a matter to be considered by the Board which the Board has
determined to be material, the matter shall not be dealt with by way of circulation of written resolutions or by a Committee (except an
appropriate Board Committee set up for that purpose pursuant to a resolution passed in a Board meeting) but a Board meeting shall
be held. A majority of the INEDs who, and whose associates, have no material interest in the transaction shall be present at such
Board meeting.
Appointment and Re-election of DirectorsThe Company uses a formal, considered and transparent procedure for the appointment of new Directors. Before a prospective
Director’s name is formally proposed, opinions of the existing Directors (including the NEDs and INEDs) will be solicited. The proposed
appointment will first be reviewed by the Nomination Committee, taking into account the balance of skills, knowledge and experience
and diversity of the Board. Upon recommendation by the Nomination Committee, the proposed appointment will then be reviewed
and, if thought fit, approved by the Board after due deliberation.
In accordance with the Company’s bye-laws, any new Director appointed by the Board to fill a casual vacancy shall remain as a
Director of the Company until the next following AGM and then he/she shall be eligible for re-election at that meeting.
At the meeting of the Nomination Committee held on 30 August 2017, the Members considered and approved the resignation of Mr.
Edward A. Tortorici as an Executive Director of the Company due to retirement, and the proposed appointment of Mr. Christopher H.
Young, Chief Financial Officer of the Company, as an Executive Director of the Company in his stead. Upon the recommendation from
the Nomination Committee, the Board approved the change in directors and published an announcement in relation thereto.
In accordance with the Company’s bye-laws, Mr. Young shall remain as a director of the Company until the next following annual
general meeting of the Company to be held on 5 June 2018 (2018 AGM). Mr. Young will then be eligible for re-election at the 2018
AGM for a fixed term of approximately three years, commencing on the date of the 2018 AGM and expiring at the conclusion of the
annual general meeting of the Company to be held in the third year following the year of his re-election (being 2021 AGM).
74 First Pacific Annual Report 2017
Corporate Governance Report
In accordance with the Company’s bye-laws and the First Pacific Code, every Director, including the NEDs and INEDs, or those
appointed for a specific terms, shall be subject to retirement by rotation at least once every three years. A retiring Director shall be
eligible for re-election at the AGM.
Each year, the Nomination Committee received from each of the INEDs an annual confirmation of his/her independence. The
independence of the INEDs has been assessed in accordance with the guidelines set out in Rule 3.13 of the Listing Rules. As a good
corporate governance practice, every Nomination Committee member abstained from assessing his/her own independence.
Following such assessment, the Nomination Committee affirmed, and the Board concurred, that all the INEDs continued to
demonstrate strong independence in judgment and are free from any business or other relationship which could interfere with their
ability to discharge their duties effectively, and they are therefore considered as independent. Each INED is required to inform the
Company as soon as practicable if there is any change in his/her own personal particulars that may affect his/her independence. No
such notification was received during 2017.
All Directors do not have any financial, business, family, or other material/relevant relationship with each other. Non-executive
Directors (including INEDs) have the same duties of care and skill and fiduciary duties as Executive Directors. The biographies of the
Directors are set out in the section “Board of Directors and Senior Executives” on pages 42 to 45 of this Annual Report.
Succession PlanningThe Board recognizes the importance of having continuity in the senior management, maintaining leaders with appropriate skills and
experience to support the delivery of the Group’s strategic priorities. During the Strategic Session held in December 2017, special
emphasis was put on reviewing the succession planning in the First Pacific Group, particularly in the Philippines where the Company’s
major investments are held.
Directors’ TrainingThe Board was informed of updates of current Listing Rules, accounting practices and disclosure requirements, as and when
necessary.
Further, all Directors are provided with briefings and training on an on-going basis each year to ensure that they have a proper
understanding of the Company’s operations and business and are fully aware of their responsibilities under the applicable laws, rules
and regulations. Such briefings and training are provided at the Company’s expenses.
During the year, the Company arranged for a Directors’ facilitated discussion relating to Board Evaluation, which was attended by a
majority of our Directors and senior management.
Furthermore, certain Directors also attended external seminars on topics relevant to their duties as Directors, including topics such
as disclosure of inside information, risk management and internal controls. The Company maintains proper records of the training
provided to and received by its Directors during the year.
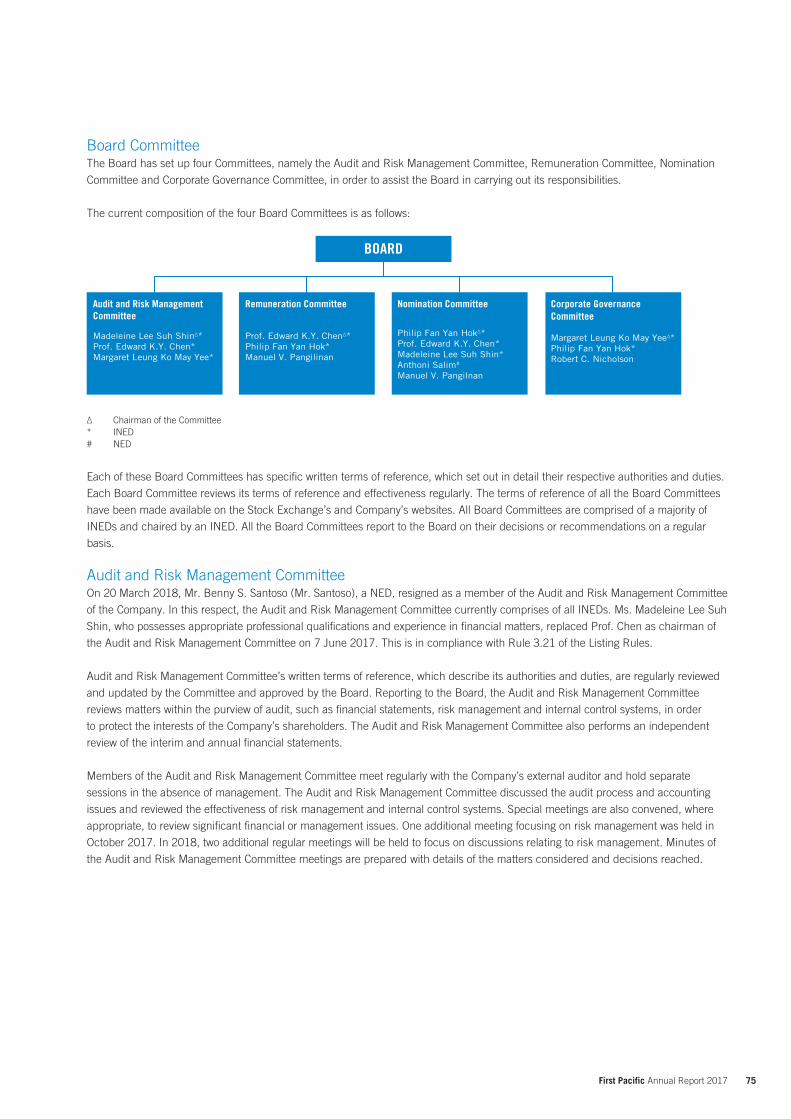
75 First Pacific Annual Report 2017
Board CommitteeThe Board has set up four Committees, namely the Audit and Risk Management Committee, Remuneration Committee, Nomination
Committee and Corporate Governance Committee, in order to assist the Board in carrying out its responsibilities.
The current composition of the four Board Committees is as follows:
Audit and Risk ManagementCommittee
Madeleine Lee Suh ShinΔ*Prof. Edward K.Y. Chen*Margaret Leung Ko May Yee*
Remuneration Committee
Prof. Edward K.Y. ChenΔ*Philip Fan Yan Hok*Manuel V. Pangilinan
Nomination Committee
Philip Fan Yan HokΔ*Prof. Edward K.Y. Chen*Madeleine Lee Suh Shin*Anthoni Salim#
Manuel V. Pangilnan
Corporate GovernanceCommittee
Margaret Leung Ko May YeeΔ*Philip Fan Yan Hok*Robert C. Nicholson
BOARD
Δ Chairman of the Committee* INED# NED
Each of these Board Committees has specific written terms of reference, which set out in detail their respective authorities and duties.
Each Board Committee reviews its terms of reference and effectiveness regularly. The terms of reference of all the Board Committees
have been made available on the Stock Exchange’s and Company’s websites. All Board Committees are comprised of a majority of
INEDs and chaired by an INED. All the Board Committees report to the Board on their decisions or recommendations on a regular
basis.
Audit and Risk Management CommitteeOn 20 March 2018, Mr. Benny S. Santoso (Mr. Santoso), a NED, resigned as a member of the Audit and Risk Management Committee
of the Company. In this respect, the Audit and Risk Management Committee currently comprises of all INEDs. Ms. Madeleine Lee Suh
Shin, who possesses appropriate professional qualifications and experience in financial matters, replaced Prof. Chen as chairman of
the Audit and Risk Management Committee on 7 June 2017. This is in compliance with Rule 3.21 of the Listing Rules.
Audit and Risk Management Committee’s written terms of reference, which describe its authorities and duties, are regularly reviewed
and updated by the Committee and approved by the Board. Reporting to the Board, the Audit and Risk Management Committee
reviews matters within the purview of audit, such as financial statements, risk management and internal control systems, in order
to protect the interests of the Company’s shareholders. The Audit and Risk Management Committee also performs an independent
review of the interim and annual financial statements.
Members of the Audit and Risk Management Committee meet regularly with the Company’s external auditor and hold separate
sessions in the absence of management. The Audit and Risk Management Committee discussed the audit process and accounting
issues and reviewed the effectiveness of risk management and internal control systems. Special meetings are also convened, where
appropriate, to review significant financial or management issues. One additional meeting focusing on risk management was held in
October 2017. In 2018, two additional regular meetings will be held to focus on discussions relating to risk management. Minutes of
the Audit and Risk Management Committee meetings are prepared with details of the matters considered and decisions reached.
76 First Pacific Annual Report 2017
Corporate Governance Report
During the year, the Audit and Risk Management Committee held three meetings. The attendance record of each Committee
members is shown in the section headed “Attendance Records” on page 71 of this Annual Report. Major work performed by the Audit
and Risk Management Committee during the year was as follows:
reviewed the Company’s annual results and financial statements for the year ended 31 December 2016 and the related
documents, financial reporting and audit issues noted by the Company’s external auditor;
reviewed the Company’s interim results and financial statements for the six months ended 30 June 2017 and the related
documents, financial reporting and audit issues noted by the Company’s external auditor;
reviewed the revised accounting standards and prospective changes to accounting standards, and the impact on the Group’s
financial statements;
conducted annual reviews of the Group’s continuing connected transactions pursuant to the Listing Rule requirements;
reviewed the engagement and remuneration of the Company’s external auditor, its independence and objectivity, and the
effectiveness of the audit process;
recommended the re-appointment of external auditor for shareholders’ approval at the 2017 AGM;
reviewed the adequacies of resources, qualifications and experience of staff of the Company’s accounting and financial reporting
function, and their training programmes and budgets;
exercised oversight over the Group’s financial reporting system, risk management and internal control systems;
exercised oversight over the audit and/or risk management committees of the Company’s major operating companies;
considered the 2017 Audit Plan for the First Pacific Group and the audit fee arrangement;
reviewed the Company’s Risk Matrix on a semi-annual basis;
reviewed the Audit and Risk Management Committee’s effectiveness in discharging its role and responsibilities and made
recommendation to the Board for any changes;
reviewed the change of the Chairman of the Audit and Risk Management Committee;
considered the role of the Chief Risk Officer (CRO) and to evaluate his/her interaction with the Audit and Risk Management
Committee; and
reviewed the terms of reference of the CRO.
Remuneration CommitteeThe Remuneration Committee is currently comprised of a majority of INEDs, and chaired by Prof. Edward Chen, an INED. It has
specific written terms of reference which deal clearly with its authorities and duties. The terms of reference of the Remuneration
Committee have included the specific authorities and duties set out in paragraphs B.1.3(a) to (j) of the First Pacific Code, with
appropriate modifications, where necessary.
During the year, the Remuneration Committee held three meetings. The attendance record of each Committee members is shown in
the section headed “Attendance Records” on page 71 of this Annual Report. Major work performed by the Remuneration Committee
during the year was as follows:
made recommendations to the Board on the Company’s policy and structure for Directors’ and senior management’s
remuneration;
assessed the performance of Executive Directors and approved the terms of Executive Directors’ service contracts;
reviewed and approved the management’s remuneration proposals with reference to the Board’s corporate goals and objectives;
determined, with delegated responsibility, the remuneration packages of individual Executive Directors and senior management;
reviewed the remuneration of non-executive directors and proposed an increase in the remuneration having regard to the recent
market trend and the steady increase in regulatory requirements which have significantly expanded the responsibilities and
commitment of the Company’s non-executive directors, which was subsequently approved by the shareholders at the 2017
AGM;
reviewed and approved the grant of share options under the share option scheme and the grant of subscription awards under
share award scheme to a senior executive upon her promotion in May 2017;
reviewed the 2018 salary budget and 2017 annual bonus; and
reviewed the Remuneration Committee’s effectiveness in discharging its role and responsibilities and made recommendation to
the Board for any changes.
77 First Pacific Annual Report 2017
Nomination CommitteeThe Nomination Committee is currently comprised of a majority of INEDs, and chaired by Mr. Philip Fan, an INED. It has specific
written terms of reference which deal clearly with its authorities and duties. The terms of reference of the Nomination Committee
have included the specific authorities and duties set out in paragraphs A.5.2(a) to (d) of the First Pacific Code, with appropriate
modifications, where necessary.
During the year, the Nomination Committee held two meetings. The attendance record of each Committee members is shown in the
section headed “Attendance Records” on page 71 of this Annual Report. Major work performed by the Nomination Committee during
the year was as follows:
reviewed the structure, size and composition of the Board;
reviewed succession planning for the Board;
reviewed and confirmed the independence of INEDs (details of which are set out in the section headed “Appointment and
Re-election of Directors” on page 73 of this Annual Report);
nominated the retiring Directors to stand for re-election at the 2017 AGM;
made recommendations to the Board on the appointment or re-appointment of Directors;
reviewed the resignation of Mr. Edward A. Tortorici and the appointment of Mr. Christopher H. Young as a new Executive
Director;
reviewed the composition and diversity of the Board and monitored the implementation of the Board Diversity Policy; and
reviewed the Nomination Committee’s effectiveness in discharging its role and responsibilities and its terms of reference and
made recommendation to the Board for any changes.
Corporate Governance CommitteeThe Corporate Governance Committee is currently comprised of a majority of INEDs, and chaired by Mrs. Margaret Leung, an INED.
It has specific written terms of reference which deal clearly with its authorities and duties. The terms of reference of the Corporate
Governance Committee have included the specific authorities and duties set out in paragraphs D.3.3(a) to (e) of the First Pacific Code,
with appropriate modifications, where necessary.
During the year, the Corporate Governance Committee held four meetings. The attendance record of each Committee members
is shown in the section headed “Attendance Records” on page 71 of this Annual Report. Major work performed by the Corporate
Governance Committee during the year was as follows:
developed and reviewed the Company’s policies and practices on corporate governance and made recommendations to the
Board;
reviewed and monitored the training and continuous professional development for Directors and senior management;
reviewed and monitored the Company’s policies and practices on compliance with legal and regulatory requirements;
reviewed the Company’s compliance with the CG Code and disclosure in this Corporate Governance Report;
reviewed and monitored the progress for ESG reporting and approved the formation of a management committee to finalize the
2016 ESG report for uploading to the websites of the Company and the SEHK before 31 July 2017;
considered and reviewed the proposal for Board Evaluation;
reviewed the terms of reference of the Corporate Governance Committee and the necessity for any change of name due to its
revised functions and responsibilities;
approved the adoption of revised terms of reference of the Corporate Governance Committee;
reviewed the role of the CRO and its terms of reference;
reviewed the proceedings for board meetings and recommended that more time should be devoted to strategy discussion; suggested holding a separate strategy session to focus on succession planning and corporate strategy; and
reviewed the Corporate Governance Committee’s effectiveness in discharging its role and responsibilities and made
recommendations to the Board for any changes.
78 First Pacific Annual Report 2017
Corporate Governance Report
Directors’ Service ContractNo Director has an unexpired service contract with the Company which is not determinable by the Company within one year without
payment of compensation, other than statutory compensation.
Disclosure of Inside InformationThe Company has put in place a framework for the disclosure of inside information, in compliance with the Securities and Futures
Ordinance of Hong Kong. The framework sets out the procedures for the handling and dissemination of inside information in a timely
manner so as to allow the shareholders, staff and other stakeholders to understand major developments within the Company and
its major operating companies. The framework and its effectiveness are subject to review on a regular basis in accordance with the
established procedures.
Financial ReportingIn order to enable the Directors to present a balanced, clear and comprehensive assessment of the Company’s performance,
financial position and prospects to its shareholders, financial reports with adequate information and explanations are prepared by the
Company’s management to the Board on a timely and regular basis.
Directors’ Responsibility for the Financial StatementsThe Hong Kong Companies Ordinance requires the Directors to prepare financial statements for each financial year that give a true
and fair view of the Company’s state of affairs as at the end of the financial year and of its results and cash flows for the year then
ended. In preparing the financial statements, the Directors are required to:
select suitable accounting policies and apply them on a consistent basis, making judgments and estimates that are prudent, fair
and reasonable;
state the reasons for any significant departure from the relevant accounting standards; and
prepare the financial statements on a going concern basis, unless it is not appropriate to presume that the Company will
continue in business for the foreseeable future.
The Directors are responsible for keeping proper accounting records, for safeguarding the assets of the Company and for taking
reasonable steps for the prevention and detection of fraud and other irregularities.
Auditor’s RemunerationAn analysis of auditor’s remuneration in respect of audit and non-audit services is as follows:
US$ millions 2017 2016
Auditor’s remuneration– Audit services 4.1 4.1
– Non-audit services(i) 0.7 0.3
Total 4.8 4.4
(i) Pertains to due diligence, review of continuing connected transactions and other transactions relating to the Group’s business development
Company SecretaryAll Directors have access to the advice and services of the Company Secretary, who is an employee of the Company and reports to
the Executive Directors on board governance matter. She is responsible for ensuring that the board procedures are followed and for
facilitating communications among Directors as well as with shareholders and management.
The Company Secretary’s biography is set out in the Board of Directors and Senior Management section of the 2017 Annual Report.
During 2017, the Company Secretary undertook over 15 hours of professional training to update her skills and knowledge in the
corporate governance field.
Constitutional DocumentsDuring 2017, there was no change in the constitutional documents. These documents are available on the Stock Exchange’s and the
Company’s websites.
79 First Pacific Annual Report 2017
Communications with ShareholdersEffective CommunicationFirst Pacific encourages an active and open dialogue with all of its shareholders, private and institutional, large and small. The Board
acknowledges that its role is to represent and promote the interests of the Company as a whole and that its members are accountable
to shareholders for the performance and activities of the Company. As such First Pacific is always responsive to the views and requests
of its shareholders.
The formal channels of communicating with shareholders are the annual and interim reports, press releases, published
announcements, shareholders’ circulars and the AGM. The annual and interim reports seek to communicate, both to shareholders
and the wider investment community, developments in the Company’s businesses. All of these initiatives are designed to better inform
shareholders and potential investors about the Company’s activities and strategic direction.
The AGM is the principal forum for formal dialogue with shareholders. The Company’s Chairman, Executive Directors, Chairmen of the
Board Committees and NEDs (including INEDs), will be present at the AGM, when practicable, to answer questions from shareholders
about specific resolutions being proposed at the meeting and also about the Group in general. In addition, where appropriate,
the Company will convene a special general meeting (SGM) to approve transactions in accordance with the Listing Rules and the
Company’s corporate governance procedures. These provide further opportunities for shareholders to comment and vote on specific
transactions.
In order to promote effective communication, the Company also maintains a website (www.firstpacific.com) which includes past and
present information relating to the Group and its businesses.
Voting by PollThe Company’s shareholders are adequately informed of the procedures for and their rights to demand voting by poll in shareholders’
meetings at which their approvals are sought through disclosure in the Company’s circulars. All voting at general meetings are
conducted by poll.
At the 2017 AGM and SGM, the chairman demanded a poll on all resolutions. The procedures for demanding a poll by the
shareholders were incorporated in the respective AGM and SGM circulars sent to the shareholders in the time stipulated.
Computershare Hong Kong Investor Services Limited, the Company’s Hong Kong Branch Registrar, was engaged as scrutineer to
ensure the votes were properly counted.
Shareholders Communication PolicyThe Company has put in place a Shareholders Communication Policy to ensure that Shareholders are provided with ready, equal
and timely access to balanced and understandable information about the Company. The policy is regularly reviewed to ensure its
effectiveness and is posted on the Company’s website.
Calling a Special General MeetingShareholders holding at the date of the deposit of the requisition not less than one-tenth of the paid-up capital of the Company
carrying the right of voting at general meetings of the Company shall at all times have the right, by written requisition to the Company,
to require a SGM to be called by the Board for the transaction of any business specified in such requisition.
The requisition:
must be in writing and state the purposes of the meeting;
must be signed by all the Shareholders concerned;
may consist of several documents in like form each signed by one or more Shareholders concerned; and
may either be deposited at the principal office of the Company at 24th Floor, Two Exchange Square, 8 Connaught Place, Central,
Hong Kong in hard copy form or sent by email to [email protected].
Details of the abovementioned procedures are set out in a document titled “Rights and procedures for shareholders to convene
meetings/put forward proposals” which is available on the Company’s website.
80 First Pacific Annual Report 2017
Corporate Governance Report
Putting Forward Proposals at General MeetingsShareholders can make a request to circulate a resolution at a general meeting or circulate a statement (of not more than one
thousand words) in connection with a proposed resolution or the business to be dealt with at a general meeting; the number of
shareholders necessary for such requisition shall be:
(a) shareholders representing not less than one-twentieth of the total voting rights of all the shareholders having at the date of the
requisition a right to vote at the meeting to which the requisition relates; or
(b) not less than one hundred shareholders of the Company.
A copy or copies of requisition signed by all requisitionists shall be deposited, with a sum reasonably sufficient to meet the Company’s
expenses in giving notice of the proposed resolution or circulating any necessary statement, either at the principal office of the
Company at 24th Floor, Two Exchange Square, 8 Connaught Place, Central, Hong Kong in hard copy form or sent by email to
[email protected] in the case of:
(a) a requisition requiring notice of a resolution, not less than six weeks before the meeting; and
(b) any other requisition, not less than one week before the meeting.
Details of the abovementioned procedures are set out in a document titled “Rights and procedures for shareholders to convene
meetings/put forward proposals” which is available on the website of the Company.
Further, a shareholder may propose a person other than a Director of the Company for election as a Director of the Company at a
general meeting at which elections to the office of directors are to be considered. For such purpose, the shareholder must send to the
Company’s principal address (for the attention of the Company Secretary) (i) a written notice of intention to propose a resolution at the
general meeting; and (ii) a notice signed by the proposed candidate of his/her willingness to be elected, together with that candidate’s
information as required to be disclosed under the Listing Rules and such other information as required by the Company, and his/her
written consent to the publication of his/her personal data. Such notice must be sent within a period of not less than seven days before
the date of the general meeting. Procedures for shareholders to propose a person for election as Directors of the Company are also
available on the website of the Company.
Putting Enquiries to the BoardShareholders may send their enquiries requiring the Board’s attention to the Company Secretary at the Company’s principal office
located at 24th Floor, Two Exchange Square, 8 Connaught Place, Central, Hong Kong in hard copy form or sent by email to
[email protected]. Questions concerning the procedures for convening or putting forward proposals at an AGM or
SGM may also be put to the Company Secretary in the same manner.
81 First Pacific Annual Report 2017
Continuing Connected Transactions and Connected TransactionsDuring the year, the INEDs agreed with the Directors in relation to the following continuing connected transactions and connected
transactions and approved the disclosure of those transactions in the form of published announcements:
28 March 2017 announcement: the Company announced that Metro Pacific Tollways Development Corporation (MPTDC)
entered into the 14% share sale and purchase agreement (SPA) with Egis Road Operation S.A. (Egis) on 27 December 2016 to
acquire the 14% interest in Tollways Management Corporation (TMC) for a cash consideration of Pesos 884.7 million (equivalent
to approximately US$17.7 million), with the beneficial ownership of the 14% TMC shares vested in MPTDC at that time. On 27
March 2017, MPTDC entered into the 7% SPA with Egis to acquire a further 7% interest in TMC for Pesos 442.3 million (equivalent
to approximately US$8.8 million), with the beneficial ownership of the 7% TMC shares vested in MPTDC upon completion of
the transaction on 4 April 2017. Prior to the 14% acquisition and the 7% acquisition, MPTDC held approximately 46% interest
in TMC, which, together with the 14% acquisition and 7% acquisition, would increase its beneficial shareholding in TMC to
approximately 67%.
As at the date of that announcement, MPTDC is a subsidiary of the Group. Egis Investment Partners Philippines, Inc. (Egis
Investment) owns NLEX Corporation as to 10%. Egis Investment is in turn owned as to approximately 54% by Egis and as to
approximately 46% by MPTDC. Accordingly, Egis and Egis Investment are able to control the exercise of 10% of the voting power
of NLEX Corporation at a general meeting of NLEX Corporation and are therefore substantial shareholders of NLEX Corporation.
The Group has an approximately 55% voting interest and an approximately 42% economic interest in MPIC, which in turn
owns MPTC as to approximately 99.9%. MPTC wholly owns MPTDC, which in turn directly and indirectly has an aggregate
effective interest in approximately 75.6% of the total number of NLEX Corporation common shares in issue. Accordingly, NLEX
Corporation is a subsidiary of the Group and Egis is a substantial shareholder of a subsidiary of the Group. Egis is therefore a
connected person of the Company. The 14% acquisition and the 7% acquisition are therefore, connected transactions for the
Company under the Listing Rules.
17 April 2017 announcement: the Company announced that NLEX Corporation and TMC, indirect subsidiaries of the Group,
entered into a plan of merger and articles of merger, pursuant to which TMC would merge with and into NLEX Corporation, with
NLEX Corporation as the surviving corporation. NLEX Corporation is the concessionaire for both the North Luzon Expressway
(NLEX) and the Subic-Clark-Tarlac Expressway projects. TMC is engaged in the operation and maintenance of the NLEX and
the Subic-Clark-Tarlac Expressway. The merger shall take effect 15 days from and after the approval by the Philippine Securities
and Exchange Commission (PSEC) of the articles of merger and the issuance of the certificate of filing of the articles of merger.
It is anticipated that the merger would be completed around the third quarter of 2017. Upon completion, the TMC Shareholders
participating in the merger shall transfer all of their respective TMC common shares to NLEX Corporation in exchange for 2.7
NLEX Corporation common shares for every 1 TMC common share (or such other exchange ratio as may be approved by the
PSEC).
The Group has an approximately 55% voting interest and an approximately 42% economic interest in MPIC, which in turn owns
MPTC as to approximately 99.9%. MPTC wholly owns MPTDC, which in turn has an aggregate effective interest in approximately
75.6% of the total number of NLEX Corporation common shares in issue and beneficially owns approximately 67% of the issued
share capital of TMC. Accordingly, TMC and NLEX Corporation are indirect subsidiaries of the Group. Egis Investment owns 10%
of NLEX Corporation and is, therefore, a substantial shareholder of NLEX Corporation and a connected person of the Company
under the Listing Rules. Egis Investment is owned as to approximately 54% by Egis, which is, therefore, also a connected person
of the Company under the Listing Rules. The merger includes the acquisition by NLEX Corporation of TMC common shares from
Egis, a substantial shareholder of NLEX Corporation and TMC and a connected person of the Company under the Listing Rules.
The merger is, therefore, a connected transaction for the Company under the Listing Rules.
82 First Pacific Annual Report 2017
Corporate Governance Report
26 April 2017 announcement: the Company announced that Indofood and CMZ BVI entered into a sale and purchase
agreement, pursuant to which Indofood has agreed to sell, and CMZ BVI has agreed to purchase, 196,249,971 shares in
China Minzhong Food Corporation Limited (CMZ), representing approximately 29.94% of its issued share capital, at a price of
S$1.20 (equivalent to approximately US$0.87) per CMZ Share, for an aggregate consideration of S$235,499,965 (equivalent to
approximately US$169.9 million), to be settled in cash in four instalments within 18 months from 26 June 2017. Immediately
following completion of the CMZ Share Sale on 26 April 2017, Indofood has ceased to own any shares in CMZ.
CMZ BVI is beneficially wholly-owned by Mr. Lin Guo Rong, Executive Chairman and Chief Executive Officer of CMZ. CMZ was
a subsidiary of Indofood before the Offer and ceased to be a subsidiary of Indofood and the Company upon settlement of the
consideration in respect of the CMZ Shares tendered by Indofood in acceptance of the Offer on 16 December 2016. Therefore,
Mr. Lin Guo Rong is a connected person of the Company at the subsidiary level, and CMZ BVI, being an associate of Mr. Lin
Guo Rong, is also a connected person of the Company at the subsidiary level. The CMZ Share Sale is a transaction with a person
connected only at the subsidiary level and is therefore, a connected transaction for the Company under the Listing Rules.
7 June 2017 announcement: the Company announced that on 7 June 2017, PT Aston Inti Makmur (AIM), a subsidiary of
Indofood, entered into two conditional sale and purchase agreements with Mr. Anthoni Salim (Mr. Salim) and PT Adithya
Suramitra (ADS), a company wholly-owned by Mr. Salim, respectively, for the purchase of six plots of land with a total area
of 42,877 m2 at a price of Rupiah 51 million (equivalent to approximately US$3,827) per m2, for an aggregate consideration
of Rupiah 2,186,727 million (equivalent to approximately US$164.1 million). The price of Rupiah 51 million (equivalent to
approximately US$3,827) per m2 was determined after arm’s length negotiations on normal commercial terms with reference to
the valuation of Rupiah 50.8 million (equivalent to approximately US$3,812) per m2 provided by an independent valuer.
The purchased lands are currently used by PT Salim Ivomas Pratama Tbk (SIMP), a subsidiary of Indofood, for its cooking oil
production facilities, pursuant to a licence agreement with Mr. Salim and a lease agreement with ADS. Having received an offer
from an independent third party to acquire the purchased lands for commercial development, Mr. Salim and ADS gave a priority
offer to the Indofood Group as the existing lessee to acquire the purchased lands, for purpose of ensuring the continuity of
SIMP’s cooking oil production operations.
Mr. Salim is the Chairman of the Board, a substantial shareholder of the Company and the President Director and Chief
Executive Officer of Indofood. ADS is a company in which Mr. Salim has an aggregate effective interest of 100% and an associate
of Mr. Salim. Therefore, both Mr. Salim and ADS are connected persons of the Company and the acquisition constitutes a
connected transaction for the Company.
14 June 2017 announcement: the Company announced that, on 13 June 2017, MPIC and PLDT Communications and Energy
Ventures, Inc. (PCEV) entered into the Beacon Acquisition Agreement, pursuant to which MPIC agreed to purchase, and
PCEV agreed to sell, the Beacon Acquisition Shares, representing a 25% economic interest in Beacon Electric Asset Holdings,
Inc. (Beacon Electric), for an aggregate purchase price of Pesos 21.8 billion (equivalent to approximately US$435.6 million).
Following completion of the Beacon Electric acquisition, the financial results of Beacon Electric would be consolidated (instead
of being equity-accounted for) in the financial statements of the Group. The Beacon Electric acquisition will align the Group’s
portfolio towards a more appropriate strategic ownership mix, with the interests in Beacon Electric and Meralco to be held by the
Group’s flagship infrastructure company (MPIC), rather than by PLDT, which is principally engaged in telecommunications and
related businesses.
As at the date of that announcement, Beacon Electric is an equity-accounted for joint venture of the Group because, although
MPIC holds 75% of the issued share capital of Beacon Electric, pursuant to a voting agreement MPIC is only entitled to exercise
50% of the voting rights in respect of Beacon Electric (PCEV is entitled to exercise the remaining 50%). However, as MPIC holds
more than half of Beacon Electric’s issued share capital, Beacon Electric is treated as a subsidiary of MPIC for the purposes of
the Listing Rules (notwithstanding the existence of the voting agreement). PCEV, as the holder of 25% of Beacon Electric’s issued
share capital, is a connected person of the Company and the Beacon Electric acquisition is, therefore, a connected transaction
for the Company under Chapter 14A of the Listing Rules.
83 First Pacific Annual Report 2017
30 June 2017 announcement: the Company announced that MPCALA Holdings, Inc. (MPCALA) and D.M. Consunji, Inc. (DMCI)
entered into the construction contract, pursuant to which DMCI has agreed to construct and complete the Civil Works for the
Laguna Segment of the Cavite-Laguna Expressway in the Philippines, in accordance with the terms of the construction contract.
The contract price for the project is Pesos 7.2 billion (equivalent to approximately US$142.7 million), inclusive of taxes, subject
to adjustments as provided for in the construction contract. The contract price was determined after arm’s length negotiations
between MPCALA and DMCI and was based on normal commercial terms with reference to the expertise, experience and
market position of DMCI, and the complexity, design, quality and quantity of the works for the project, and the allocation of risks
under the construction contract.
The Group has an approximately 55% voting interest and an approximately 42% economic interest in MPIC, which in turn
indirectly owns MPCALA as to approximately 99.9%. Accordingly, MPCALA is a subsidiary of the Group. The Group has an
approximately 51.3% interest in Maynilad Water Holdings Company Inc. (MWHC), the holding company of Maynilad Water
Services, Inc. (Maynilad), which holds an exclusive concession granted by Metropolitan Waterworks and Sewerage System on
behalf of the Philippine government, to provide water and sewerage services in the area of West Metro Manila. DMCI Holdings,
Inc. (DMCI Holdings), being the remaining 27.2% shareholder of MWHC, is a connected person of the Company. DMCI is
a subsidiary of DMCI Holdings and is, therefore, a connected person of the Company. Accordingly, the entering into of the
construction contract constitutes a connected transaction for the Company under Chapter 14A of the Listing Rules.
6 September 2017 announcement: following the Company’s previous announcement made on 10 November 2016 and the
Company’s circular dated 30 December 2016 in relation to certain CCTs relating to the Indofood Group, due to expansion of
businesses, the Company has undertaken a review in respect of Indofood’s Plantations Business Transactions, Distribution
Business transactions, Flour Business Transactions, Beverages Business – Salim Transactions, Dairy Business Transactions and
Beverages Business – Asahi Transactions. As a result of that review, the Company has revised the Annual Caps for each of those
business categories for the remainder of 2017 and for 2018 and 2019 in order to more closely reflect the projected transaction
amounts. As for Indofood’s Packaging Business Transactions, due to expansion of business and the addition of new CCTs, the
2017-2019 aggregated Annual Caps in respect of the Packaging Business transactions have been revised and are subject to the
reporting and announcement requirements, but not the Independent Shareholders’ approval requirements, under Chapter 14A
of the Listing Rules.
Set out in that announcement are details of the revised Annual Caps for the remainder of 2017, 2018 and 2019 in respect of
each of the Plantations Business Transactions, Distribution Business Transactions, Flour Business Transactions, Beverages
Business – Salim Transactions, Dairy Business Transactions, Beverages Business – Asahi Transactions and Packaging Business
Transactions.
2 October 2017 announcement: the Company announced that Indofood’s consumer branded products subsidiary, PT Indofood
CBP Sukses Makmur Tbk. (ICBP), replied to and accepted a non-legally binding letter of intent from Asahi Group Holdings,
Limited (Asahi) in relation to the possible sale of the entire equity interest of Asahi Group Holdings Southeast Asia Pte. Ltd. (Asahi
Group SEA), a wholly-owned subsidiary of Asahi, in each of PT Asahi Indofood Beverage Makmur (AIBM) and PT Indofood Asahi
Sukses Beverage (IASB).
As at the date of that announcement, AIBM is owned by ICBP as to 49% and by Asahi Group SEA as to 51%, while IASB is
owned by ICBP as to 51% and by Asahi Group SEA as to 49%. Following completion, both AIBM and IASB would be wholly
owned by ICBP.
84 First Pacific Annual Report 2017
Corporate Governance Report
22 December 2017 announcement: following the Company’s previous announcement made on 2 October 2017 in relation to the
possible purchase of a 51% interest in AIBM and a 49% interest in IASB by the Indofood Group from the Asahi Group, ICBP and
PT Prima Intipangan Sejati (as Purchasers), Asahi Group SEA (as Seller) and Asahi entered into a conditional sale and purchase
agreement (CSPA), pursuant to which the Purchasers agreed to purchase, and the Seller agreed to sell, 617,100 shares in
AIBM (representing approximately 51% of the total issued share capital of AIBM) and 632,100 shares in IASB (representing
approximately 49% of the total issued share capital of IASB) at the total consideration of US$20 million.
Within five business days after completion, the Purchasers shall satisfy or procure the satisfaction of the following conditions
subsequent:
(a) ICBP shall pay or procure IASB, AIBM, IASB subsidiaries and AIBM subsidiaries (collectively known as the Target Group)
to pay all outstanding principal amount and any unpaid interest owing under certain bank loan facilities provided by the
Japanese Banks to the Target Group specified in the CSPA, to each of the relevant Japanese Banks, and to release the
guarantees provided by Asahi in connection with those bank loan facilities; and
(b) ICBP shall repay, or procure the Target Group to repay, all outstanding shareholder loan amount owed by the Target Group
to Asahi under certain facility agreements specified in the CSPA.
As of 30 November 2017, the total outstanding principal amount drawn under those bank loan facilities was Rupiah 2.0 trillion
(equivalent to approximately US$147.6 million), of which the total amount guaranteed by Asahi was Rupiah 1.5 trillion (equivalent
to approximately US$110.7 million). The total outstanding shareholder loan amount drawn under those facility agreements was
Rupiah 60.5 billion (equivalent to approximately US$4.5 million).
As one or more of the applicable percentage ratios in respect of the transaction contemplated under the CSPA exceeds 5% but
all the applicable percentage ratios are less than 25%, it would constitute a discloseable transaction for the Company under
Chapter 14 of the Listing Rules.
As at the date of that announcement, IASB is a 51%-owned subsidiary of Indofood. Asahi Group SEA, the remaining 49%
shareholder of IASB, and Asahi, the holding company of Asahi Group SEA, are connected persons of the Company. In this
respect, the aforesaid transaction would also be a connected transaction for the Company under Chapter 14A of the Listing
Rules.
12 March 2018 announcement: following the Company’s previous announcement made on 16 January 2015 in relation to,
among other things, the execution of the framework agreement between DMCI and Maynilad dated 13 January 2015, the
Company announced that the framework agreement expired in accordance with its terms on 31 December 2017. In order to
continue performance of the services under the framework agreement and allow DMCI to continue to submit proposals for
business put out to competitive tender by Maynilad, DMCI and Maynilad have entered into a renewal agreement, pursuant to
which DMCI and Maynilad have agreed to renew the framework agreement for a period of three years. Save for the new annual
caps set for the years ending 31 December 2018, 2019 and 2020, all other terms and conditions of the framework agreement
will remain in full force and effect.
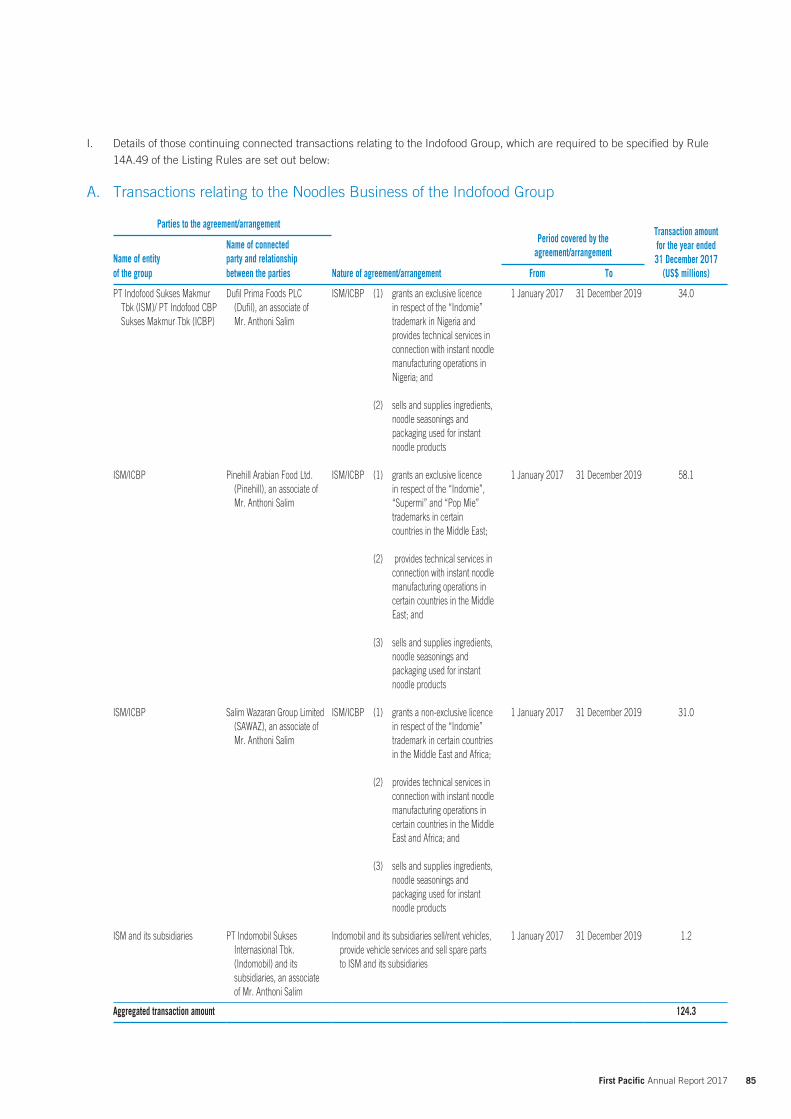
85 First Pacific Annual Report 2017
I. Details of those continuing connected transactions relating to the Indofood Group, which are required to be specified by Rule
14A.49 of the Listing Rules are set out below:
A. Transactions relating to the Noodles Business of the Indofood Group
Parties to the agreement/arrangementPeriod covered by the
agreement/arrangement
Transaction amount for the year ended31 December 2017
(US$ millions)Name of entity
Name of connected party and relationship
of the group between the parties Nature of agreement/arrangement From To
PT Indofood Sukses Makmur Tbk (ISM)/ PT Indofood CBP Sukses Makmur Tbk (ICBP)
Dufil Prima Foods PLC (Dufil), an associate of Mr. Anthoni Salim
ISM/ICBP (1) grants an exclusive licence in respect of the “Indomie” trademark in Nigeria and provides technical services in connection with instant noodle manufacturing operations in Nigeria; and
(2) sells and supplies ingredients, noodle seasonings and packaging used for instant noodle products
1 January 2017 31 December 2019 34.0
ISM/ICBP Pinehill Arabian Food Ltd. (Pinehill), an associate of Mr. Anthoni Salim
ISM/ICBP (1) grants an exclusive licence in respect of the “Indomie”, “Supermi” and “Pop Mie” trademarks in certain countries in the Middle East;
(2) provides technical services in connection with instant noodle manufacturing operations in certain countries in the Middle East; and
(3) sells and supplies ingredients, noodle seasonings and packaging used for instant noodle products
1 January 2017 31 December 2019 58.1
ISM/ICBP Salim Wazaran Group Limited (SAWAZ), an associate of Mr. Anthoni Salim
ISM/ICBP (1) grants a non-exclusive licence in respect of the “Indomie” trademark in certain countries in the Middle East and Africa;
(2) provides technical services in connection with instant noodle manufacturing operations in certain countries in the Middle East and Africa; and
(3) sells and supplies ingredients, noodle seasonings and packaging used for instant noodle products
1 January 2017 31 December 2019 31.0
ISM and its subsidiaries PT Indomobil Sukses Internasional Tbk. (Indomobil) and its subsidiaries, an associate of Mr. Anthoni Salim
Indomobil and its subsidiaries sell/rent vehicles, provide vehicle services and sell spare parts to ISM and its subsidiaries
1 January 2017 31 December 2019 1.2
Aggregated transaction amount 124.3
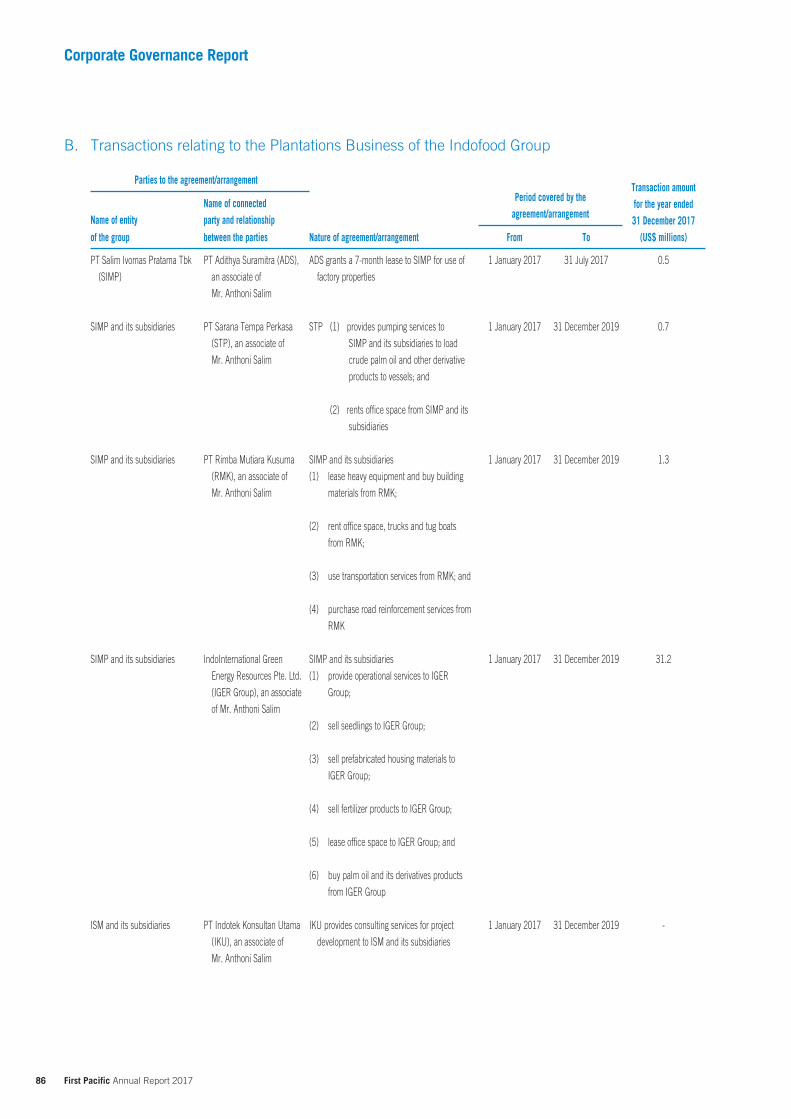
86 First Pacific Annual Report 2017
Corporate Governance Report
B. Transactions relating to the Plantations Business of the Indofood Group
Parties to the agreement/arrangement
Period covered by theagreement/arrangement
Transaction amount for the year ended31 December 2017
(US$ millions)
Name of entityName of connected party and relationship
of the group between the parties Nature of agreement/arrangement From To
PT Salim Ivomas Pratama Tbk
(SIMP)
PT Adithya Suramitra (ADS),
an associate of
Mr. Anthoni Salim
ADS grants a 7-month lease to SIMP for use of
factory properties
1 January 2017 31 July 2017 0.5
SIMP and its subsidiaries PT Sarana Tempa Perkasa
(STP), an associate of
Mr. Anthoni Salim
STP (1) provides pumping services to
SIMP and its subsidiaries to load
crude palm oil and other derivative
products to vessels; and
(2) rents office space from SIMP and its
subsidiaries
1 January 2017 31 December 2019 0.7
SIMP and its subsidiaries PT Rimba Mutiara Kusuma
(RMK), an associate of
Mr. Anthoni Salim
SIMP and its subsidiaries
(1) lease heavy equipment and buy building
materials from RMK;
(2) rent office space, trucks and tug boats
from RMK;
(3) use transportation services from RMK; and
(4) purchase road reinforcement services from
RMK
1 January 2017 31 December 2019 1.3
SIMP and its subsidiaries IndoInternational Green
Energy Resources Pte. Ltd.
(IGER Group), an associate
of Mr. Anthoni Salim
SIMP and its subsidiaries
(1) provide operational services to IGER
Group;
(2) sell seedlings to IGER Group;
(3) sell prefabricated housing materials to
IGER Group;
(4) sell fertilizer products to IGER Group;
(5) lease office space to IGER Group; and
(6) buy palm oil and its derivatives products
from IGER Group
1 January 2017 31 December 2019 31.2
ISM and its subsidiaries PT Indotek Konsultan Utama
(IKU), an associate of
Mr. Anthoni Salim
IKU provides consulting services for project
development to ISM and its subsidiaries
1 January 2017 31 December 2019 -
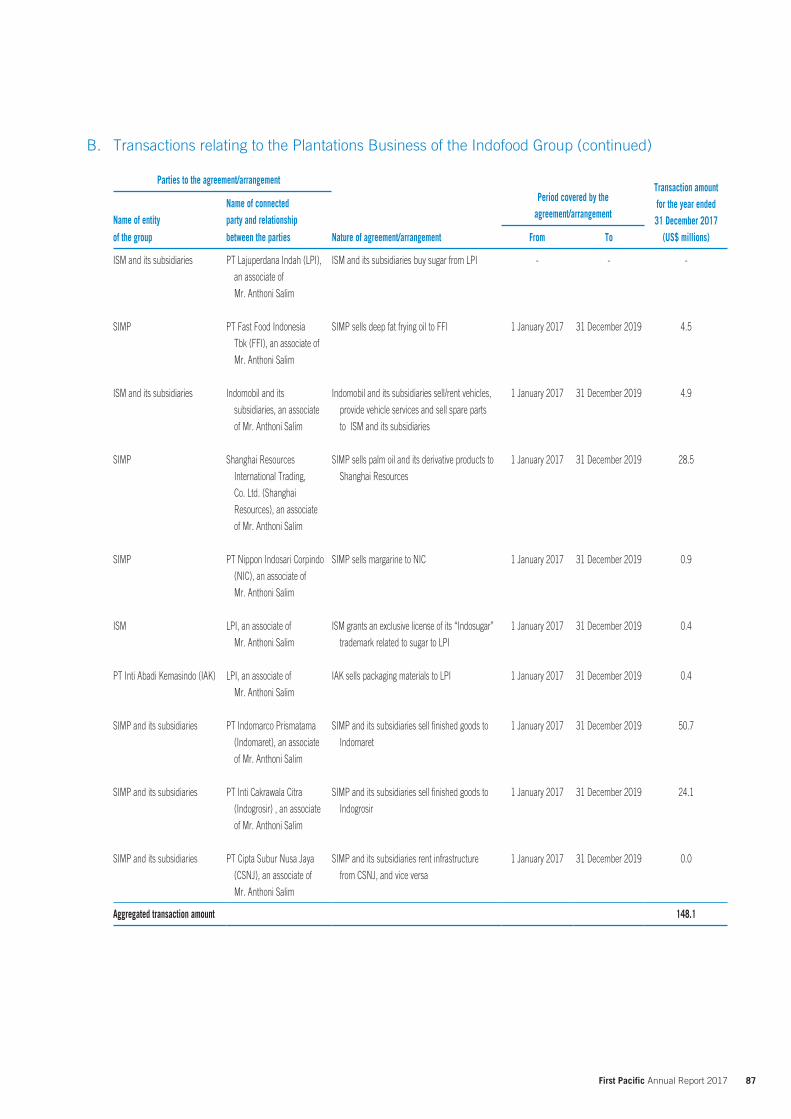
87 First Pacific Annual Report 2017
Parties to the agreement/arrangement
Period covered by theagreement/arrangement
Transaction amount for the year ended31 December 2017
(US$ millions)
Name of entityName of connected party and relationship
of the group between the parties Nature of agreement/arrangement From To
ISM and its subsidiaries PT Lajuperdana Indah (LPI),
an associate of
Mr. Anthoni Salim
ISM and its subsidiaries buy sugar from LPI - - -
SIMP PT Fast Food Indonesia
Tbk (FFI), an associate of
Mr. Anthoni Salim
SIMP sells deep fat frying oil to FFI 1 January 2017 31 December 2019 4.5
ISM and its subsidiaries Indomobil and its
subsidiaries, an associate
of Mr. Anthoni Salim
Indomobil and its subsidiaries sell/rent vehicles,
provide vehicle services and sell spare parts
to ISM and its subsidiaries
1 January 2017 31 December 2019 4.9
SIMP Shanghai Resources
International Trading,
Co. Ltd. (Shanghai
Resources), an associate
of Mr. Anthoni Salim
SIMP sells palm oil and its derivative products to
Shanghai Resources
1 January 2017 31 December 2019 28.5
SIMP PT Nippon Indosari Corpindo
(NIC), an associate of
Mr. Anthoni Salim
SIMP sells margarine to NIC 1 January 2017 31 December 2019 0.9
ISM LPI, an associate of
Mr. Anthoni Salim
ISM grants an exclusive license of its “Indosugar”
trademark related to sugar to LPI
1 January 2017 31 December 2019 0.4
PT Inti Abadi Kemasindo (IAK) LPI, an associate of
Mr. Anthoni Salim
IAK sells packaging materials to LPI 1 January 2017 31 December 2019 0.4
SIMP and its subsidiaries PT Indomarco Prismatama
(Indomaret), an associate
of Mr. Anthoni Salim
SIMP and its subsidiaries sell finished goods to
Indomaret
1 January 2017 31 December 2019 50.7
SIMP and its subsidiaries PT Inti Cakrawala Citra
(Indogrosir) , an associate
of Mr. Anthoni Salim
SIMP and its subsidiaries sell finished goods to
Indogrosir
1 January 2017 31 December 2019 24.1
SIMP and its subsidiaries PT Cipta Subur Nusa Jaya
(CSNJ), an associate of
Mr. Anthoni Salim
SIMP and its subsidiaries rent infrastructure
from CSNJ, and vice versa
1 January 2017 31 December 2019 0.0
Aggregated transaction amount 148.1
B. Transactions relating to the Plantations Business of the Indofood Group (continued)
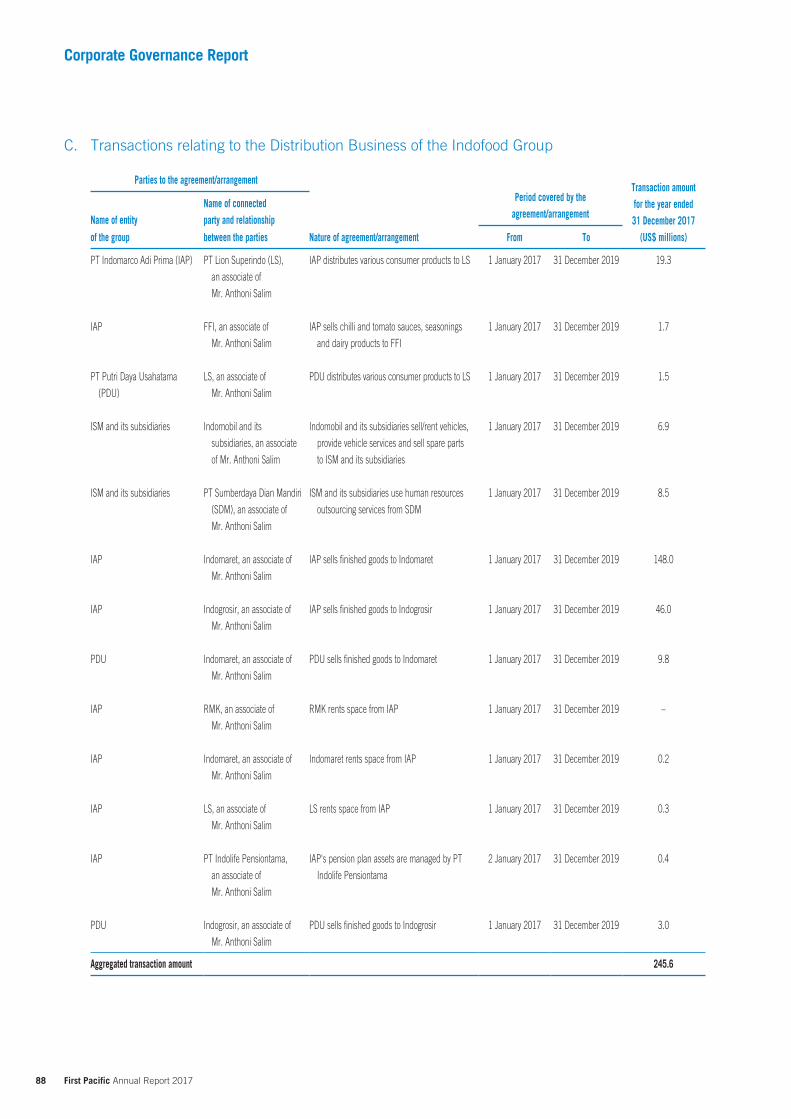
88 First Pacific Annual Report 2017
Corporate Governance Report
C. Transactions relating to the Distribution Business of the Indofood Group
Parties to the agreement/arrangement
Period covered by theagreement/arrangement
Transaction amount for the year ended31 December 2017
(US$ millions)
Name of entityName of connected party and relationship
of the group between the parties Nature of agreement/arrangement From To
PT Indomarco Adi Prima (IAP) PT Lion Superindo (LS),
an associate of
Mr. Anthoni Salim
IAP distributes various consumer products to LS 1 January 2017 31 December 2019 19.3
IAP FFI, an associate of
Mr. Anthoni Salim
IAP sells chilli and tomato sauces, seasonings
and dairy products to FFI
1 January 2017 31 December 2019 1.7
PT Putri Daya Usahatama
(PDU)
LS, an associate of
Mr. Anthoni Salim
PDU distributes various consumer products to LS 1 January 2017 31 December 2019 1.5
ISM and its subsidiaries Indomobil and its
subsidiaries, an associate
of Mr. Anthoni Salim
Indomobil and its subsidiaries sell/rent vehicles,
provide vehicle services and sell spare parts
to ISM and its subsidiaries
1 January 2017 31 December 2019 6.9
ISM and its subsidiaries PT Sumberdaya Dian Mandiri
(SDM), an associate of
Mr. Anthoni Salim
ISM and its subsidiaries use human resources
outsourcing services from SDM
1 January 2017 31 December 2019 8.5
IAP Indomaret, an associate of
Mr. Anthoni Salim
IAP sells finished goods to Indomaret 1 January 2017 31 December 2019 148.0
IAP Indogrosir, an associate of
Mr. Anthoni Salim
IAP sells finished goods to Indogrosir 1 January 2017 31 December 2019 46.0
PDU Indomaret, an associate of
Mr. Anthoni Salim
PDU sells finished goods to Indomaret 1 January 2017 31 December 2019 9.8
IAP RMK, an associate of
Mr. Anthoni Salim
RMK rents space from IAP 1 January 2017 31 December 2019 –
IAP Indomaret, an associate of
Mr. Anthoni Salim
Indomaret rents space from IAP 1 January 2017 31 December 2019 0.2
IAP LS, an associate of
Mr. Anthoni Salim
LS rents space from IAP 1 January 2017 31 December 2019 0.3
IAP PT Indolife Pensiontama,
an associate of
Mr. Anthoni Salim
IAP's pension plan assets are managed by PT
Indolife Pensiontama
2 January 2017 31 December 2019 0.4
PDU Indogrosir, an associate of
Mr. Anthoni Salim
PDU sells finished goods to Indogrosir 1 January 2017 31 December 2019 3.0
Aggregated transaction amount 245.6
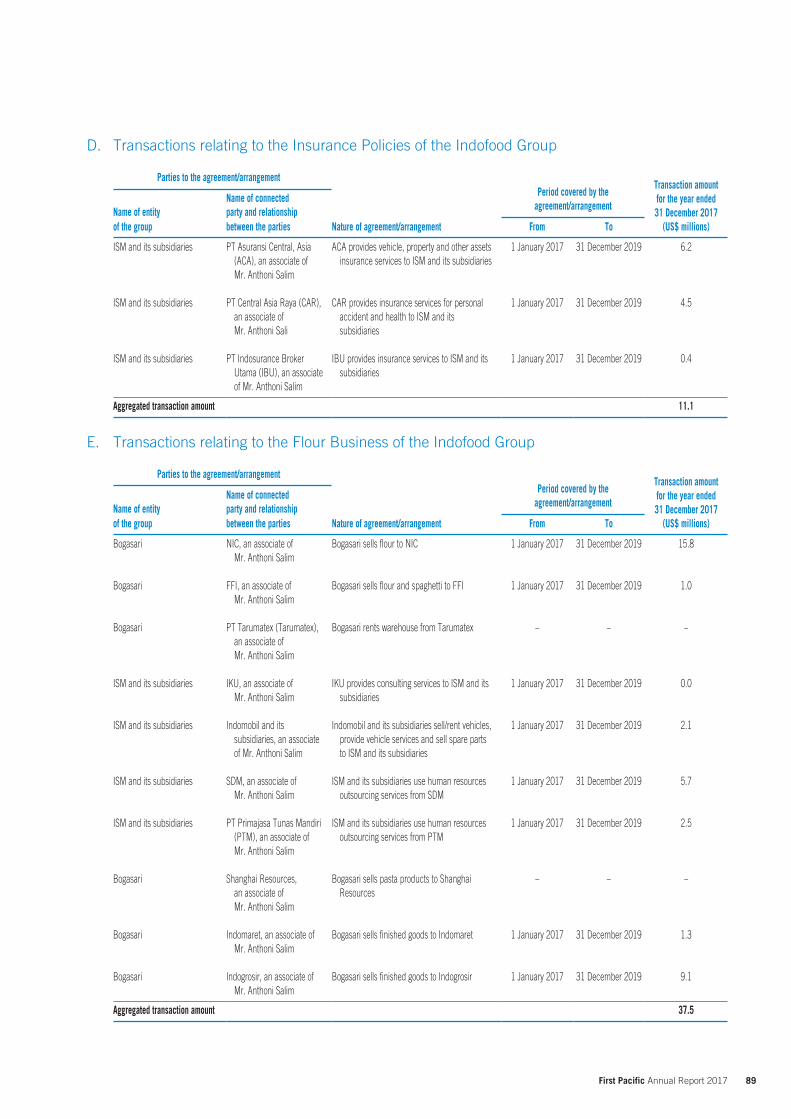
89 First Pacific Annual Report 2017
D. Transactions relating to the Insurance Policies of the Indofood Group
Parties to the agreement/arrangementPeriod covered by the
agreement/arrangement
Transaction amount for the year ended 31 December 2017
(US$ millions) Name of entity
Name of connected party and relationship
of the group between the parties Nature of agreement/arrangement From To
ISM and its subsidiaries PT Asuransi Central, Asia (ACA), an associate of Mr. Anthoni Salim
ACA provides vehicle, property and other assets insurance services to ISM and its subsidiaries
1 January 2017 31 December 2019 6.2
ISM and its subsidiaries PT Central Asia Raya (CAR), an associate of Mr. Anthoni Sali
CAR provides insurance services for personal accident and health to ISM and its subsidiaries
1 January 2017 31 December 2019 4.5
ISM and its subsidiaries PT Indosurance Broker Utama (IBU), an associate of Mr. Anthoni Salim
IBU provides insurance services to ISM and its subsidiaries
1 January 2017 31 December 2019 0.4
Aggregated transaction amount 11.1
E. Transactions relating to the Flour Business of the Indofood Group
Parties to the agreement/arrangementPeriod covered by the
agreement/arrangement
Transaction amount for the year ended31 December 2017
(US$ millions) Name of entity
Name of connected party and relationship
of the group between the parties Nature of agreement/arrangement From To
Bogasari NIC, an associate of Mr. Anthoni Salim
Bogasari sells flour to NIC 1 January 2017 31 December 2019 15.8
Bogasari FFI, an associate of Mr. Anthoni Salim
Bogasari sells flour and spaghetti to FFI 1 January 2017 31 December 2019 1.0
Bogasari PT Tarumatex (Tarumatex), an associate of Mr. Anthoni Salim
Bogasari rents warehouse from Tarumatex – – –
ISM and its subsidiaries IKU, an associate of Mr. Anthoni Salim
IKU provides consulting services to ISM and its subsidiaries
1 January 2017 31 December 2019 0.0
ISM and its subsidiaries Indomobil and its subsidiaries, an associate of Mr. Anthoni Salim
Indomobil and its subsidiaries sell/rent vehicles, provide vehicle services and sell spare parts to ISM and its subsidiaries
1 January 2017 31 December 2019 2.1
ISM and its subsidiaries SDM, an associate of Mr. Anthoni Salim
ISM and its subsidiaries use human resources outsourcing services from SDM
1 January 2017 31 December 2019 5.7
ISM and its subsidiaries PT Primajasa Tunas Mandiri (PTM), an associate of Mr. Anthoni Salim
ISM and its subsidiaries use human resources outsourcing services from PTM
1 January 2017 31 December 2019 2.5
Bogasari Shanghai Resources, an associate of Mr. Anthoni Salim
Bogasari sells pasta products to Shanghai Resources
– – –
Bogasari Indomaret, an associate of Mr. Anthoni Salim
Bogasari sells finished goods to Indomaret 1 January 2017 31 December 2019 1.3
Bogasari Indogrosir, an associate of Mr. Anthoni Salim
Bogasari sells finished goods to Indogrosir 1 January 2017 31 December 2019 9.1
Aggregated transaction amount 37.5
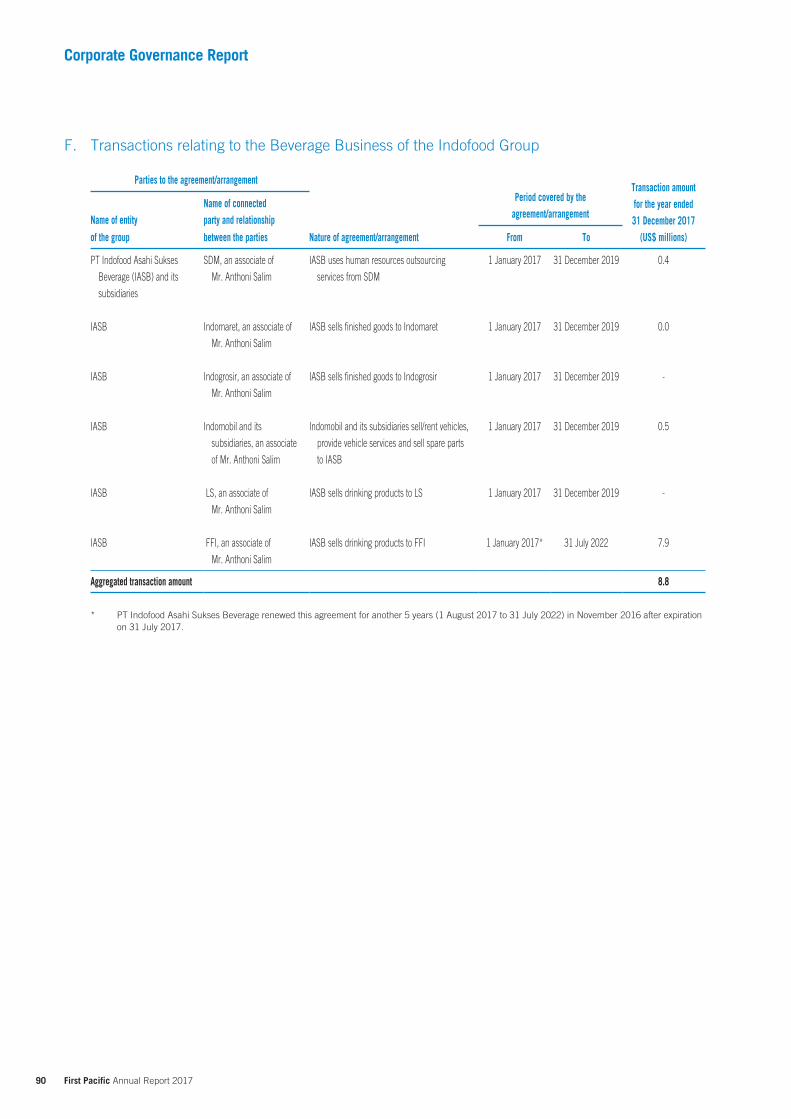
90 First Pacific Annual Report 2017
Corporate Governance Report
F. Transactions relating to the Beverage Business of the Indofood Group
Parties to the agreement/arrangement
Period covered by theagreement/arrangement
Transaction amount for the year ended31 December 2017
(US$ millions)
Name of entityName of connected party and relationship
of the group between the parties Nature of agreement/arrangement From To
PT Indofood Asahi Sukses
Beverage (IASB) and its
subsidiaries
SDM, an associate of
Mr. Anthoni Salim
IASB uses human resources outsourcing
services from SDM
1 January 2017 31 December 2019 0.4
IASB Indomaret, an associate of
Mr. Anthoni Salim
IASB sells finished goods to Indomaret 1 January 2017 31 December 2019 0.0
IASB Indogrosir, an associate of
Mr. Anthoni Salim
IASB sells finished goods to Indogrosir 1 January 2017 31 December 2019 -
IASB Indomobil and its
subsidiaries, an associate
of Mr. Anthoni Salim
Indomobil and its subsidiaries sell/rent vehicles,
provide vehicle services and sell spare parts
to IASB
1 January 2017 31 December 2019 0.5
IASB LS, an associate of
Mr. Anthoni Salim
IASB sells drinking products to LS 1 January 2017 31 December 2019 -
IASB FFI, an associate of
Mr. Anthoni Salim
IASB sells drinking products to FFI 1 January 2017* 31 July 2022 7.9
Aggregated transaction amount 8.8
* PT Indofood Asahi Sukses Beverage renewed this agreement for another 5 years (1 August 2017 to 31 July 2022) in November 2016 after expiration on 31 July 2017.
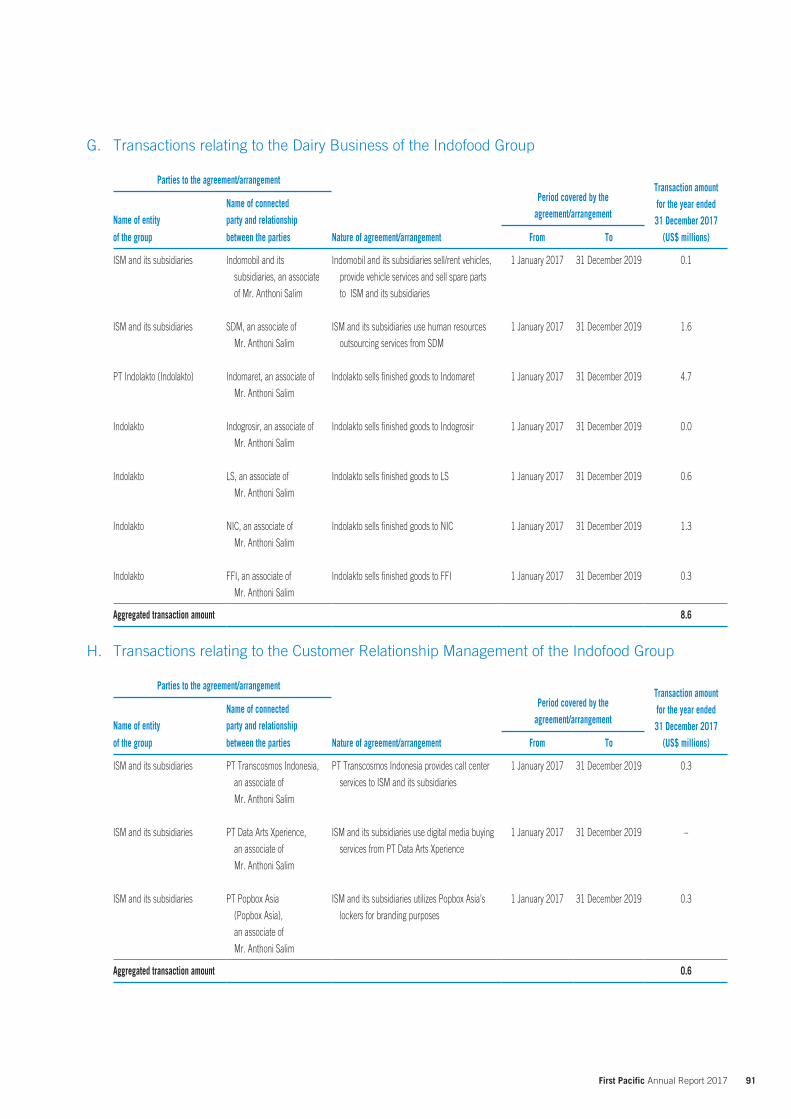
91 First Pacific Annual Report 2017
G. Transactions relating to the Dairy Business of the Indofood Group
Parties to the agreement/arrangement
Period covered by theagreement/arrangement
Transaction amount for the year ended 31 December 2017
(US$ millions)
Name of entityName of connected party and relationship
of the group between the parties Nature of agreement/arrangement From To
ISM and its subsidiaries Indomobil and its
subsidiaries, an associate
of Mr. Anthoni Salim
Indomobil and its subsidiaries sell/rent vehicles,
provide vehicle services and sell spare parts
to ISM and its subsidiaries
1 January 2017 31 December 2019 0.1
ISM and its subsidiaries SDM, an associate of
Mr. Anthoni Salim
ISM and its subsidiaries use human resources
outsourcing services from SDM
1 January 2017 31 December 2019 1.6
PT Indolakto (Indolakto) Indomaret, an associate of
Mr. Anthoni Salim
Indolakto sells finished goods to Indomaret 1 January 2017 31 December 2019 4.7
Indolakto Indogrosir, an associate of
Mr. Anthoni Salim
Indolakto sells finished goods to Indogrosir 1 January 2017 31 December 2019 0.0
Indolakto LS, an associate of
Mr. Anthoni Salim
Indolakto sells finished goods to LS 1 January 2017 31 December 2019 0.6
Indolakto NIC, an associate of
Mr. Anthoni Salim
Indolakto sells finished goods to NIC 1 January 2017 31 December 2019 1.3
Indolakto FFI, an associate of
Mr. Anthoni Salim
Indolakto sells finished goods to FFI 1 January 2017 31 December 2019 0.3
Aggregated transaction amount 8.6
H. Transactions relating to the Customer Relationship Management of the Indofood Group
Parties to the agreement/arrangement
Period covered by theagreement/arrangement
Transaction amount for the year ended31 December 2017
(US$ millions)
Name of entityName of connected party and relationship
of the group between the parties Nature of agreement/arrangement From To
ISM and its subsidiaries PT Transcosmos Indonesia,
an associate of
Mr. Anthoni Salim
PT Transcosmos Indonesia provides call center
services to ISM and its subsidiaries
1 January 2017 31 December 2019 0.3
ISM and its subsidiaries PT Data Arts Xperience,
an associate of
Mr. Anthoni Salim
ISM and its subsidiaries use digital media buying
services from PT Data Arts Xperience
1 January 2017 31 December 2019 –
ISM and its subsidiaries PT Popbox Asia
(Popbox Asia),
an associate of
Mr. Anthoni Salim
ISM and its subsidiaries utilizes Popbox Asia’s
lockers for branding purposes
1 January 2017 31 December 2019 0.3
Aggregated transaction amount 0.6
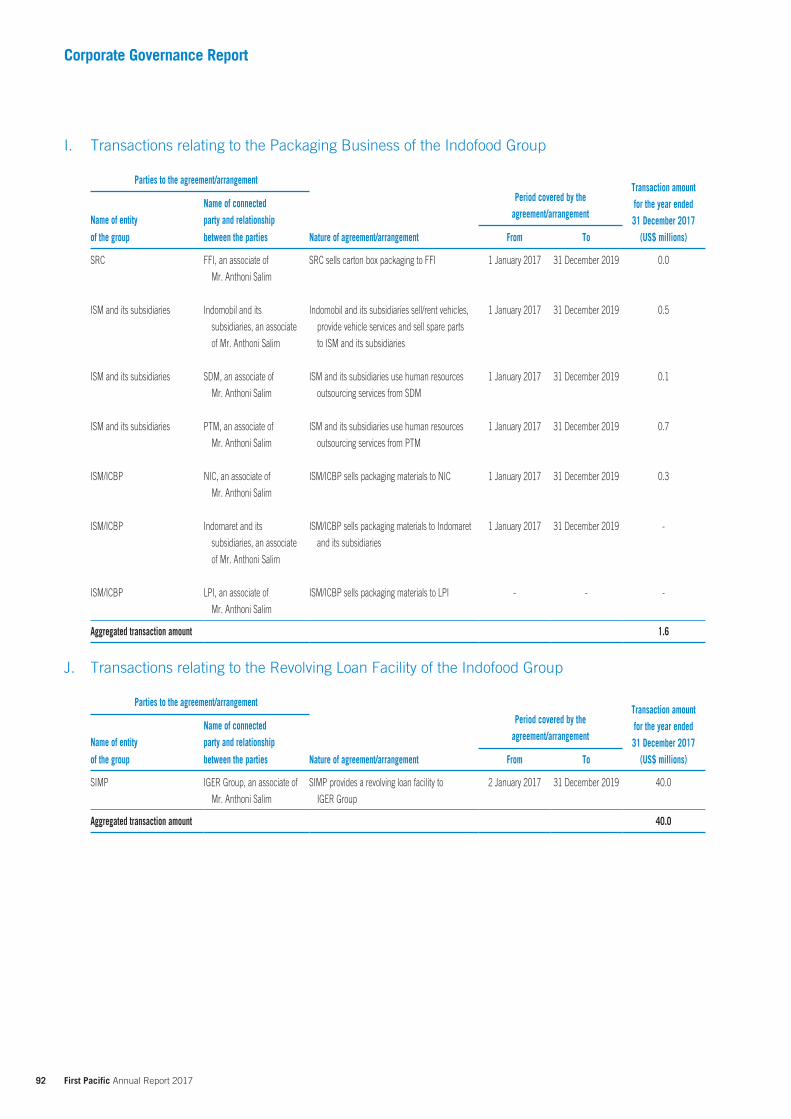
92 First Pacific Annual Report 2017
Corporate Governance Report
I. Transactions relating to the Packaging Business of the Indofood Group
Parties to the agreement/arrangement
Period covered by theagreement/arrangement
Transaction amount for the year ended31 December 2017
(US$ millions)
Name of entityName of connected party and relationship
of the group between the parties Nature of agreement/arrangement From To
SRC FFI, an associate of
Mr. Anthoni Salim
SRC sells carton box packaging to FFI 1 January 2017 31 December 2019 0.0
ISM and its subsidiaries Indomobil and its
subsidiaries, an associate
of Mr. Anthoni Salim
Indomobil and its subsidiaries sell/rent vehicles,
provide vehicle services and sell spare parts
to ISM and its subsidiaries
1 January 2017 31 December 2019 0.5
ISM and its subsidiaries SDM, an associate of
Mr. Anthoni Salim
ISM and its subsidiaries use human resources
outsourcing services from SDM
1 January 2017 31 December 2019 0.1
ISM and its subsidiaries PTM, an associate of
Mr. Anthoni Salim
ISM and its subsidiaries use human resources
outsourcing services from PTM
1 January 2017 31 December 2019 0.7
ISM/ICBP NIC, an associate of
Mr. Anthoni Salim
ISM/ICBP sells packaging materials to NIC 1 January 2017 31 December 2019 0.3
ISM/ICBP Indomaret and its
subsidiaries, an associate
of Mr. Anthoni Salim
ISM/ICBP sells packaging materials to Indomaret
and its subsidiaries
1 January 2017 31 December 2019 -
ISM/ICBP LPI, an associate of
Mr. Anthoni Salim
ISM/ICBP sells packaging materials to LPI - - -
Aggregated transaction amount 1.6
J. Transactions relating to the Revolving Loan Facility of the Indofood Group
Parties to the agreement/arrangement
Period covered by theagreement/arrangement
Transaction amount for the year ended31 December 2017
(US$ millions)
Name of entityName of connected party and relationship
of the group between the parties Nature of agreement/arrangement From To
SIMP IGER Group, an associate of
Mr. Anthoni Salim
SIMP provides a revolving loan facility to
IGER Group
2 January 2017 31 December 2019 40.0
Aggregated transaction amount 40.0
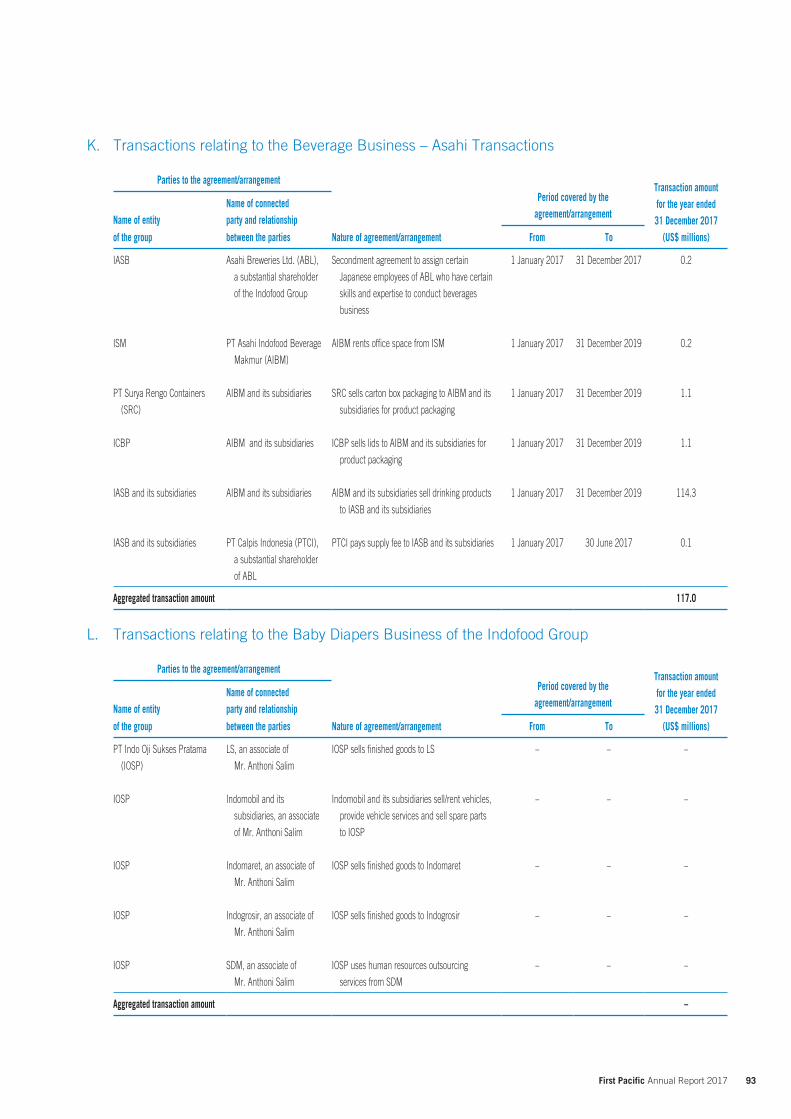
93 First Pacific Annual Report 2017
K. Transactions relating to the Beverage Business – Asahi Transactions
Parties to the agreement/arrangement
Period covered by theagreement/arrangement
Transaction amount for the year ended31 December 2017
(US$ millions)
Name of entityName of connected party and relationship
of the group between the parties Nature of agreement/arrangement From To
IASB Asahi Breweries Ltd. (ABL),
a substantial shareholder
of the Indofood Group
Secondment agreement to assign certain
Japanese employees of ABL who have certain
skills and expertise to conduct beverages
business
1 January 2017 31 December 2017 0.2
ISM PT Asahi Indofood Beverage
Makmur (AIBM)
AIBM rents office space from ISM 1 January 2017 31 December 2019 0.2
PT Surya Rengo Containers
(SRC)
AIBM and its subsidiaries SRC sells carton box packaging to AIBM and its
subsidiaries for product packaging
1 January 2017 31 December 2019 1.1
ICBP AIBM and its subsidiaries ICBP sells lids to AIBM and its subsidiaries for
product packaging
1 January 2017 31 December 2019 1.1
IASB and its subsidiaries AIBM and its subsidiaries AIBM and its subsidiaries sell drinking products
to IASB and its subsidiaries
1 January 2017 31 December 2019 114.3
IASB and its subsidiaries PT Calpis Indonesia (PTCI),
a substantial shareholder
of ABL
PTCI pays supply fee to IASB and its subsidiaries 1 January 2017 30 June 2017 0.1
Aggregated transaction amount 117.0
L. Transactions relating to the Baby Diapers Business of the Indofood Group
Parties to the agreement/arrangement
Period covered by theagreement/arrangement
Transaction amount for the year ended31 December 2017
(US$ millions)
Name of entityName of connected party and relationship
of the group between the parties Nature of agreement/arrangement From To
PT Indo Oji Sukses Pratama
(IOSP)
LS, an associate of
Mr. Anthoni Salim
IOSP sells finished goods to LS – – –
IOSP Indomobil and its
subsidiaries, an associate
of Mr. Anthoni Salim
Indomobil and its subsidiaries sell/rent vehicles,
provide vehicle services and sell spare parts
to IOSP
– – –
IOSP Indomaret, an associate of
Mr. Anthoni Salim
IOSP sells finished goods to Indomaret – – –
IOSP Indogrosir, an associate of
Mr. Anthoni Salim
IOSP sells finished goods to Indogrosir – – –
IOSP SDM, an associate of
Mr. Anthoni Salim
IOSP uses human resources outsourcing
services from SDM
– – –
Aggregated transaction amount –
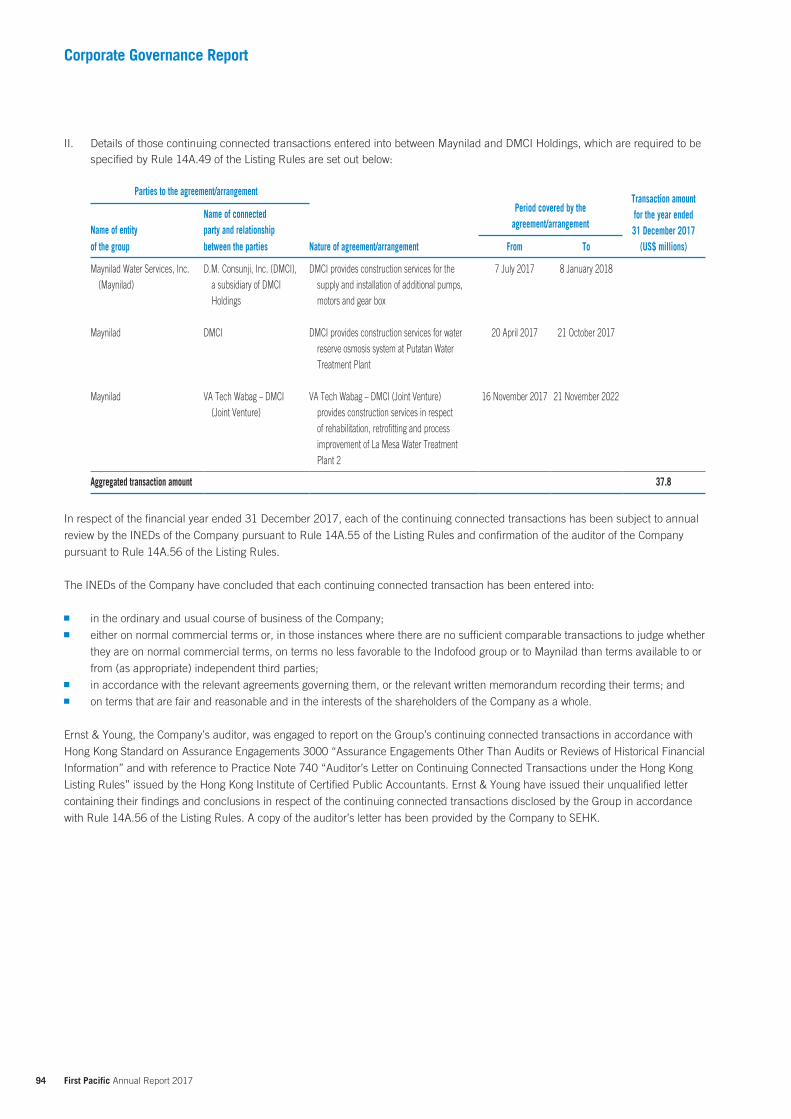
94 First Pacific Annual Report 2017
Corporate Governance Report
II. Details of those continuing connected transactions entered into between Maynilad and DMCI Holdings, which are required to be specified by Rule 14A.49 of the Listing Rules are set out below:
Parties to the agreement/arrangementPeriod covered by the
agreement/arrangement
Transaction amount for the year ended31 December 2017
(US$ millions) Name of entity
Name of connected party and relationship
of the group between the parties Nature of agreement/arrangement From To
Maynilad Water Services, Inc. (Maynilad)
D.M. Consunji, Inc. (DMCI), a subsidiary of DMCI Holdings
DMCI provides construction services for the supply and installation of additional pumps, motors and gear box
7 July 2017 8 January 2018
Maynilad DMCI DMCI provides construction services for water reserve osmosis system at Putatan Water Treatment Plant
20 April 2017 21 October 2017
Maynilad VA Tech Wabag – DMCI (Joint Venture)
VA Tech Wabag – DMCI (Joint Venture) provides construction services in respect of rehabilitation, retrofitting and process improvement of La Mesa Water Treatment Plant 2
16 November 2017 21 November 2022
Aggregated transaction amount 37.8
In respect of the financial year ended 31 December 2017, each of the continuing connected transactions has been subject to annual
review by the INEDs of the Company pursuant to Rule 14A.55 of the Listing Rules and confirmation of the auditor of the Company
pursuant to Rule 14A.56 of the Listing Rules.
The INEDs of the Company have concluded that each continuing connected transaction has been entered into:
in the ordinary and usual course of business of the Company;
either on normal commercial terms or, in those instances where there are no sufficient comparable transactions to judge whether
they are on normal commercial terms, on terms no less favorable to the Indofood group or to Maynilad than terms available to or
from (as appropriate) independent third parties;
in accordance with the relevant agreements governing them, or the relevant written memorandum recording their terms; and
on terms that are fair and reasonable and in the interests of the shareholders of the Company as a whole.
Ernst & Young, the Company’s auditor, was engaged to report on the Group’s continuing connected transactions in accordance with
Hong Kong Standard on Assurance Engagements 3000 “Assurance Engagements Other Than Audits or Reviews of Historical Financial
Information” and with reference to Practice Note 740 “Auditor’s Letter on Continuing Connected Transactions under the Hong Kong
Listing Rules” issued by the Hong Kong Institute of Certified Public Accountants. Ernst & Young have issued their unqualified letter
containing their findings and conclusions in respect of the continuing connected transactions disclosed by the Group in accordance
with Rule 14A.56 of the Listing Rules. A copy of the auditor’s letter has been provided by the Company to SEHK.
95 First Pacific Annual Report 2017
Risk Management and Internal ControlAs a decentralized organization in which local management have substantial autonomy to run and develop their respective company
business, the Group views well developed reporting systems and internal controls as essential. The Board plays a key role in the
implementation and monitoring of internal controls. Their responsibilities include:
conducting regular board meetings to focus on business strategy, operational issues and financial performance;
active participation on the boards of subsidiaries, associated companies and joint venture companies;
approving annual budgets for each operating company covering strategy, financial and business performance, key risks and
opportunities;
monitoring the compliance with applicable laws and regulations, and also with the First Pacific Code;
monitoring the quality, timeliness, and content of internal and external reporting; and
monitoring risks and the effectiveness of internal controls.
The Board is responsible for maintaining an adequate system of risk management and internal controls in the Group and reviewing
their effectiveness through the Audit and Risk Management Committee.
The Company does not have an internal audit department, each of the Group’s operating companies has its own internal audit
and/or risk management functions responsible for the implementation of an effective internal control system. Their effectiveness is
continuously being evaluated and enhanced by the respective operating companies’ audit committees/risk committees, which are
reviewed by the Company’s Audit and Risk Management Committee on a semi-annual basis.
In respect of the financial year ended 31 December 2017, the Board confirmed that it has received confirmations from the operating
companies’ audit committees, risk committees and/or internal auditor/chief risk officer on the effectiveness of the Group’s risk
management and internal control systems and that there is no significant area of concern to be disclosed.
The key controls and risk management measures undertaken by the operating companies are summarized below:
Operational Controls The Executive Directors actively participate in the various boards of directors of the operating companies (which includes
attending board meetings) and such boards manage the operating companies’ operating and financial activities, approving the
operating companies’ respective annual budgets, and monitoring of their compliance with applicable laws and regulations and
the quality of internal and external reporting.
Prior to the investments in new businesses, extensive due diligence regarding the operational, financial, regulatory aspects and
risk management of the concerned businesses are conducted. Risks to investment returns are calibrated and specific measures
to manage these risks are also determined.
Quality and timely monthly management reports and quarterly board papers or financial packages, with proper analysis of actual
operational and financial performance against budgets, forecasts and prior periods, are prepared and reviewed by the operating
companies’ management and submitted to their directors.
The management teams of the operating companies continuously evaluate the performances of their businesses and provide
periodical operational and financial reforecasts to the Executive Directors for their review.
The Executive Directors review monthly management reports and conduct regular meetings with the management teams of the
operating companies to communicate on their businesses’ actual operational and financial performances against budgets and
forecasts, and business risks and strategies.
To promote good governance, whistleblowing policies and procedures are in place in certain operating companies, which
provides employees with clearly defined processes to report concerns to their audit committees about any suspected
misconduct, malpractice or irregularity which he/she has become aware of or genuinely suspects that the operating companies
may have been involved.
96 First Pacific Annual Report 2017
Corporate Governance Report
Financial Controls The management in each of the operating companies manages and ensures that optimal capital structure of its company
is maintained. Information about the Group’s capital management is set out in Note 40(A) to the Consolidated Financial
Statements.
The finance and treasury teams in each of the operating companies undertake the management of the financial risks relating to
foreign exchange, interest rate, liquidity and commodity. Information about the Group’s management of its financial risks is set
out in the “Financial Review – Financial Risk Management” section and Note 40(B) to the Consolidated Financial Statements.
Compliance Controls The Company Secretary and legal team in each of the operating companies undertake the monitoring of compliance with relevant
laws, rules and regulations. In some of the regulated businesses, specific regulatory management groups with experienced
personnel are established to mitigate risk arising from potential differences with regulators in the interpretation of the relevant
laws, rules and regulations.
The financial reporting team and audit committee in each of the operating companies ensure that the financial statements of
their companies comply with the relevant financial reporting and accounting standards and regulatory requirements, and are
based on suitable accounting policies as well as prudent and reasonable judgments and estimates.
The treasury team in each of the operating companies undertakes the monitoring of compliance with relevant covenants for
borrowings.
Risk Management Head Office has formed a Risk Assessment Committee comprising of two Executive Directors and senior executives of
the Company to oversee the Head Office’s risk management function, in relation to its role as an investment holding and
management company. This Committee will report to the Audit and Risk Management Committee twice each year. The key risks
which need to be managed are those risks attributable to its business plans, the inherent risks of the operating companies in
which it is invested, evaluation of possible acquisitions and divestments in the context of the operating companies in which it is
invested and the risk that the Group’s overall performance does not meet market expectations. A risk matrix has been developed
and is reviewed by the Audit and Risk Management Committee and the Board on a semi-annual basis.
To ensure effective implementation of risk management and internal control systems, risk management processes are conducted
according to the operating companies’ prescribed risk management policies and procedures, based on carefully defined risk
management frameworks for the effective management of risk at all levels across all operating and functional units of the
operating companies.
Telecommunications – The PLDT Group’s Enterprise Risk Management team continuously implements its standard risk
evaluation processes to address the key identified risks. For 2017, the major risks relate to the competitive situation and
economic conditions which may significantly restrict growth opportunities and hamper its efforts to secure market leadership,
the rapid speed of disruptive innovations and/or new technologies within the industry which may outpace its ability to compete
and/or manage risk appropriately, succession challenges, resistance to change, decline in revenues and heightened capital
expenditures, reliance on outsourcing and strategic sourcing arrangements and dependence on third party vendors, timely
identification and escalation of risk issues, cyber threats, unexpected crises, regular occurrence of natural disasters, execution
and implementation its business transformation and digital pivot. In order to ensure effective management of the risks identified,
the PLDT Group has, among other measures, appointed new officers to oversee risks, to restructure the organization and to build
a superior network to support the migration and rollout of new services. It will continue to undertake its Digital Transformation
Program and promote a risk culture within the Group. Risk management activities are continuously monitored and reviewed to
ensure that critical risks are appropriately addressed across the organization.
97 First Pacific Annual Report 2017
Consumer food products – the major risks that Indofood identified are associated with food safety and quality, health and
safety in the working environment, availability and price fluctuations of raw materials, system and information, reputation due
to unsubstantiated news/rumors, environmental, new/changes of government regulations, talent and people, competition, and
natural disaster/global warming. Indofood strives to produce safe food for all consumers by adhering to Good Manufacturing
Practices that ensure products are manufactured through hygienic processes and according to Indofood quality standards;
and follows requirements set by authorities such as Halal standards. Related to risk of availability and price fluctuations of raw
materials, Indofood has collaborated and increased domestic farmers’ contributions, as well as monitoring the price movements
regularly. As for rising competition, Indofood conducts marketing initiatives to build strong brand awareness and loyalty, focuses
on innovation to develop new products, and introduces competitive terms to its customers. Indofood conducts ongoing people
development, professional training programs both internally and externally, and continues with succession plan assessment.
Indofood ensures adequate insurance coverage in the event of natural disasters, and implements crisis management system.
Indofood is committed to environmentally sustainable business practice, through the development of guidelines, improvement in
its operational facilities, increase awareness and ensure compliance with the government regulations.
Branded consumer foods – Goodman Fielder, through its Audit and Risk Management Committee, was established to assist
the Board in fulfilling its responsibility to oversee the quality and effectiveness of its risk management system and framework,
which set out the policy and process to be followed to enable the identification, assessment, treatment, reporting and monitoring
of risks on a per business and Group basis. Goodman Fielder considered its ability to secure private label contracts for bread
and dairy products a key risk, as failure to do so would significantly increase unit production costs. Currently, management is
renegotiating for the renewal of existing private label contracts. Goodman Fielder continues to focus on cash flow forecasting,
working capital and capital expenditure management program, and to pursue the sale of surplus assets to generate cash flow for
purpose of supporting the pursuit of strategic objectives; complying with loan covenants; funding capital expenditure and paying
dividend. Goodman Fielder strives to deliver a safe, high quality, low cost, flexible supply chain, and manufacturing footprint and
distribution network aligned with its strategic objectives. The Audit and Risk Management Committee reports to the Board on the
risks identified and the mitigation measures adopted on a regular basis.
98 First Pacific Annual Report 2017
Corporate Governance Report
Infrastructure – MPIC, through its Risk Management Committee, has identified the key potential risks specific to its businesses as
operational risks, political and regulatory risks for businesses which are directly regulated by the state or any agency thereof such
as: electricity distribution; water supply and distribution along with sewage treatment; tollroads and Light Rail. In order to mitigate
those risks, each operating company has a full management team which is responsible for managing the risks and dedicated
regulatory management groups with experienced personnel to manage the relationship with regulators, keeping management up-
to-date on the status of the relationship and ensuring that companies are well prepared for any forthcoming regulatory changes
or challenges, as well as adhering to the holding company’s investment disciplines.
Meralco recognizes the regulatory uncertainty risks relating to the inaction or delayed decisions/resolutions on pending and future
applications, petitions and cases before the Energy Regulatory Commission (ERC) competitive selection process, unjustified/
unsupported modifications of performance based regulation, system loss cap risk and uncertainty in the policies on retail
competition and open access. It monitors the risks through closely monitoring developments in cases and actively participating in
the hearings and in the deliberations of new draft rules at the ERC, legislative inquiries at both houses of Congress, emphasizing
and providing information/data to lawmakers and engaging qualified/competent technical consultants to conduct studies
covering comparable international locations and operating environment.
Maynilad has managed its water supply risk by reducing its reliance on the Angat dam by developing the Putatan water
treatment plants to secure alternative water supply. In respect of its legal and regulatory compliance risk, Maynilad engaged the
services of a consultant to assess its existing wastewater treatment facilities and recommends solutions on how to comply with
the new standards.
MPTC has managed the risk relating to the delay in commercial operations of new projects/segments by engaging qualified
contractors, accreditation of contractors/service providers, and close coordination with contractors and other government
agencies. Other risks identified are non approval of adjusted and periodic toll rates in future, and an unfavorable decision in the
arbitration case against the government on past due toll rate adjustments. MPTC has mitigated the risks through exploring and
timely pursuit of appropriate legal remedies and close coordination with government agencies.
LRTI has managed the risks relating to acts of terrorism in its trains and stations, significant damages due to earthquake,
defects on the tachymetry module and human error in the operations of the trains through implementation of security policies
and emergency response plans. It has a crisis management structure in place for earthquakes and other related policies. It has
ongoing testing and modification of actuators for improvement in detection, and ongoing signal testing, replacement and repair
of all tachymetry for Gen-1 trains. With regard to damages and injuries due to falling debris/ballast from the viaduct and cable
duct, LRTI is considering engaging a third party expert for stray current analysis and determination of an acceptable level.
In order to manage the regulatory risk leading to periodic disruption of services, GBP’s legal department regularly files PSA
applications to ERC within deadline and filed a motion for reconsideration with regard to the lowering of rates of PEDC3. With
regard to the replacement of low sulphur fuel oil (LSFO) with bunker fuel oil (BFO) for use by GBP’s diesel plants, which has
resulted in higher SOx emissions and exceeds DENR’s SPx standards, GBP has submitted a letter for consideration to DENR for
the use of BFO due to unavailability of LSFO. In terms of market competition risk, GBP offers competitive tariffs by increasing
plant efficiency and reliability and seeks out new markets such as ancillary services to NGCP and retail sales to contestable
customers.
For the Hospitals Group, the primary risk is that investment runs ahead of demand and patients’ ability to pay. To address the
risk, the Hospital Group will ensure that they fully understand their target market and scale improvements towards the patients’
ability to pay for hospital services.
99 First Pacific Annual Report 2017
Electricity generation business – risk management programs are undertaken by PLP to mitigate business risks, including
intense retail competition from independent retailers which are not constrained by generation cost; depressed pool prices due
to overcapacity in the market; regulatory decisions that impact the market dynamics and cost of compliance; and adverse
movement of its fuel cost relative to that of the competitors. PLP’s Team closely monitors the electricity wholesale and retail
markets and oil price movement to adjust its strategies accordingly.
Natural resources – Philex has undertaken a risk management program that will mitigate or eliminate identified physical,
social ecological and economic risks inherent in its mining business, thereby ensuring a productive and profitable operation. It
employs a comprehensive, integrated risk management program, effected across all levels of the organization, with the goal of
identifying, analyzing and managing its risks to an acceptable level, so as to enhance opportunities, reduce threats, and thus
sustain competitive advantage. As the local mining industry is heavily regulated, Philex continues to ensure strict compliance
with existing regulations and maintains strong working relationships with local and national government agencies directly and
indirectly. It continues to engage international consultants to resolve technical issues and concerns relating to capital project
execution at Padcal and Silangan. With regard to the continued opposition from anti-mining sectors across multi-media
channels, Philex continues to ensure strict compliance with regulatory requirements specifically with respect to ensuring safety
and environmental protection in all aspects of operations and maintains good relationship with regulatory agencies, LGUs and
host communities.
Risk assessments are conducted regularly by each operating company’s management team and reported to its audit and/or risk
management committee and its board of directors. The audit and/or risk management committees of the operating companies
meet with internal and external auditors as well as the operating companies’ management teams regularly to communicate
on the issues regarding the operating companies’ risks in order to ensure accuracy of risk assessment reports and proper
implementation of the reported risk mitigation strategies and controls.
During the year ended 31 December 2017, the Audit and Risk Management Committee reviewed and advised that:
The risk management and internal controls systems of the Group function are effective and are designed to provide reasonable
assurance that material assets are protected, business risks attributable to the Group are identified and monitored, material
transactions are executed in accordance with management’s authorization and the financial statements are reliable for
publication and compliant with all relevant laws and regulations.
There are processes in place for identifying, evaluating and managing the material business risks faced by the Group. Such
processes are incorporated in all the Group’s businesses.
There are adequate resources, qualified and experienced staff, training programs and budget for the Group’s accounting and
financial reporting function.
100 First Pacific Annual Report 2017
Corporate Governance Report
Remuneration PolicyDetails of Directors’ remuneration for the year are set out in Note 37(A) to the Consolidated Financial Statements. The remuneration of
senior executives, including Directors, consists of the following:
Salary and BenefitsSalary reflects an executive’s experience, responsibility and market value. Salary adjustments are based on effective management
of the Company and on increased responsibility, with consideration of cost of living and the expected pay increase in the market.
Benefits principally comprise housing allowance, educational support and health care, and are consistent with those provided by
comparable companies.
Bonus and Long-term IncentivesBonuses are based on the achievement of individual performance targets, and normally correlate with annual profit movements.
Long-term incentives comprise monetary payments, share options and/or share awards that link reward to the achievement of per-
determined objectives, such as retention of key employees for the Group’s operations and future development, achievement of
recurring profit target. The value of the long-term incentive offered to each executive is related to job grade and contribution to the
management of the business.
FeesIt is the Company’s policy that it does not pay any fees to the Company’s Executive Directors for attending Board or Board Committee
meetings. As for the Company’s NEDs (including the INEDs), they are paid at the sum of US$7,000 for each meeting of the Board (which
he or she attends in person or by telephone conference call) and each general meeting of Shareholders (which he or she attends in
person); and the sum of US$6,000 for each meeting of the Board Committees (which he or she attends in person or by telephone
conference call).
Pension ContributionsThe Company operates defined contribution schemes, in respect of which contributions are determined on the basis of basic salaries
and length of service.
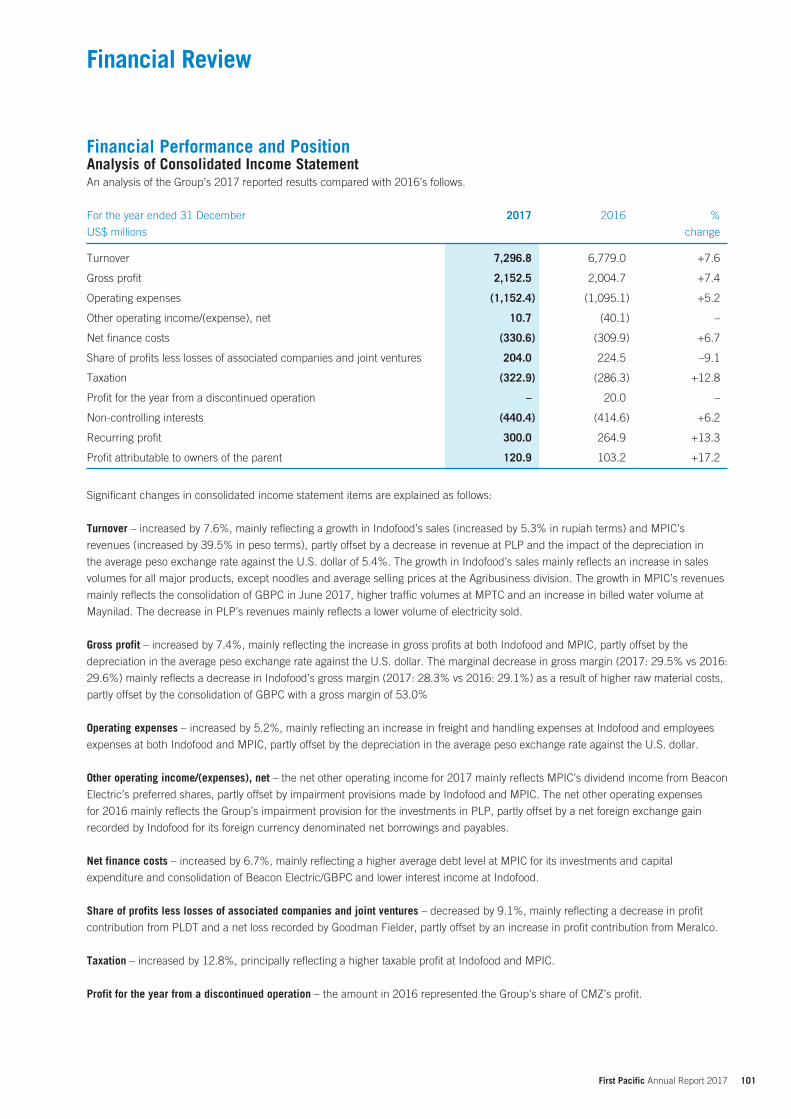
101 First Pacific Annual Report 2017
Financial Review
Financial Performance and PositionAnalysis of Consolidated Income StatementAn analysis of the Group’s 2017 reported results compared with 2016’s follows.
For the year ended 31 December
US$ millions
2017 2016 %
change
Turnover 7,296.8 6,779.0 +7.6
Gross profit 2,152.5 2,004.7 +7.4
Operating expenses (1,152.4) (1,095.1) +5.2
Other operating income/(expense), net 10.7 (40.1) –
Net finance costs (330.6) (309.9) +6.7
Share of profits less losses of associated companies and joint ventures 204.0 224.5 –9.1
Taxation (322.9) (286.3) +12.8
Profit for the year from a discontinued operation – 20.0 –
Non-controlling interests (440.4) (414.6) +6.2
Recurring profit 300.0 264.9 +13.3
Profit attributable to owners of the parent 120.9 103.2 +17.2
Significant changes in consolidated income statement items are explained as follows:
Turnover – increased by 7.6%, mainly reflecting a growth in Indofood’s sales (increased by 5.3% in rupiah terms) and MPIC’s
revenues (increased by 39.5% in peso terms), partly offset by a decrease in revenue at PLP and the impact of the depreciation in
the average peso exchange rate against the U.S. dollar of 5.4%. The growth in Indofood’s sales mainly reflects an increase in sales
volumes for all major products, except noodles and average selling prices at the Agribusiness division. The growth in MPIC’s revenues
mainly reflects the consolidation of GBPC in June 2017, higher traffic volumes at MPTC and an increase in billed water volume at
Maynilad. The decrease in PLP’s revenues mainly reflects a lower volume of electricity sold.
Gross profit – increased by 7.4%, mainly reflecting the increase in gross profits at both Indofood and MPIC, partly offset by the
depreciation in the average peso exchange rate against the U.S. dollar. The marginal decrease in gross margin (2017: 29.5% vs 2016:
29.6%) mainly reflects a decrease in Indofood’s gross margin (2017: 28.3% vs 2016: 29.1%) as a result of higher raw material costs,
partly offset by the consolidation of GBPC with a gross margin of 53.0%
Operating expenses – increased by 5.2%, mainly reflecting an increase in freight and handling expenses at Indofood and employees
expenses at both Indofood and MPIC, partly offset by the depreciation in the average peso exchange rate against the U.S. dollar.
Other operating income/(expenses), net – the net other operating income for 2017 mainly reflects MPIC’s dividend income from Beacon
Electric’s preferred shares, partly offset by impairment provisions made by Indofood and MPIC. The net other operating expenses
for 2016 mainly reflects the Group’s impairment provision for the investments in PLP, partly offset by a net foreign exchange gain
recorded by Indofood for its foreign currency denominated net borrowings and payables.
Net finance costs – increased by 6.7%, mainly reflecting a higher average debt level at MPIC for its investments and capital
expenditure and consolidation of Beacon Electric/GBPC and lower interest income at Indofood.
Share of profits less losses of associated companies and joint ventures – decreased by 9.1%, mainly reflecting a decrease in profit
contribution from PLDT and a net loss recorded by Goodman Fielder, partly offset by an increase in profit contribution from Meralco.
Taxation – increased by 12.8%, principally reflecting a higher taxable profit at Indofood and MPIC.
Profit for the year from a discontinued operation – the amount in 2016 represented the Group’s share of CMZ’s profit.
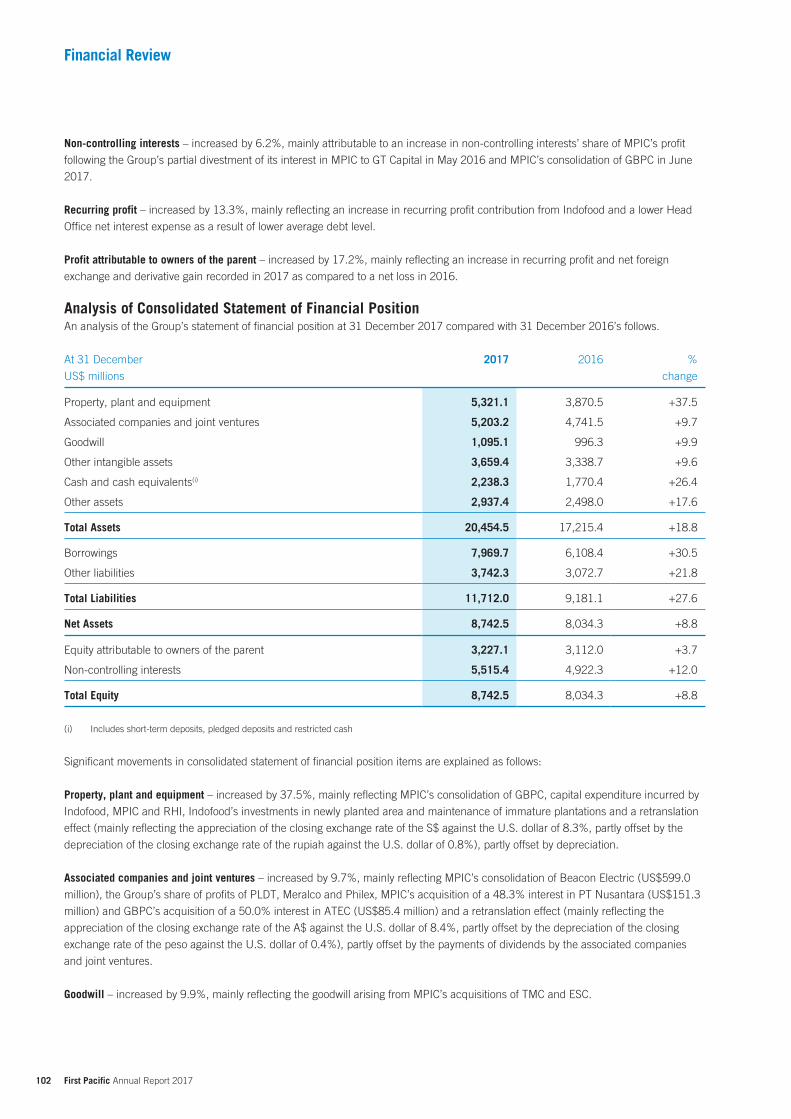
102 First Pacific Annual Report 2017
Financial Review
Non-controlling interests – increased by 6.2%, mainly attributable to an increase in non-controlling interests’ share of MPIC’s profit
following the Group’s partial divestment of its interest in MPIC to GT Capital in May 2016 and MPIC’s consolidation of GBPC in June
2017.
Recurring profit – increased by 13.3%, mainly reflecting an increase in recurring profit contribution from Indofood and a lower Head
Office net interest expense as a result of lower average debt level.
Profit attributable to owners of the parent – increased by 17.2%, mainly reflecting an increase in recurring profit and net foreign
exchange and derivative gain recorded in 2017 as compared to a net loss in 2016.
Analysis of Consolidated Statement of Financial PositionAn analysis of the Group’s statement of financial position at 31 December 2017 compared with 31 December 2016’s follows.
At 31 December
US$ millions
2017 2016 %
change
Property, plant and equipment 5,321.1 3,870.5 +37.5
Associated companies and joint ventures 5,203.2 4,741.5 +9.7
Goodwill 1,095.1 996.3 +9.9
Other intangible assets 3,659.4 3,338.7 +9.6
Cash and cash equivalents(i) 2,238.3 1,770.4 +26.4
Other assets 2,937.4 2,498.0 +17.6
Total Assets 20,454.5 17,215.4 +18.8
Borrowings 7,969.7 6,108.4 +30.5
Other liabilities 3,742.3 3,072.7 +21.8
Total Liabilities 11,712.0 9,181.1 +27.6
Net Assets 8,742.5 8,034.3 +8.8
Equity attributable to owners of the parent 3,227.1 3,112.0 +3.7
Non-controlling interests 5,515.4 4,922.3 +12.0
Total Equity 8,742.5 8,034.3 +8.8
(i) Includes short-term deposits, pledged deposits and restricted cash
Significant movements in consolidated statement of financial position items are explained as follows:
Property, plant and equipment – increased by 37.5%, mainly reflecting MPIC’s consolidation of GBPC, capital expenditure incurred by
Indofood, MPIC and RHI, Indofood’s investments in newly planted area and maintenance of immature plantations and a retranslation
effect (mainly reflecting the appreciation of the closing exchange rate of the S$ against the U.S. dollar of 8.3%, partly offset by the
depreciation of the closing exchange rate of the rupiah against the U.S. dollar of 0.8%), partly offset by depreciation.
Associated companies and joint ventures – increased by 9.7%, mainly reflecting MPIC’s consolidation of Beacon Electric (US$599.0
million), the Group’s share of profits of PLDT, Meralco and Philex, MPIC’s acquisition of a 48.3% interest in PT Nusantara (US$151.3
million) and GBPC’s acquisition of a 50.0% interest in ATEC (US$85.4 million) and a retranslation effect (mainly reflecting the
appreciation of the closing exchange rate of the A$ against the U.S. dollar of 8.4%, partly offset by the depreciation of the closing
exchange rate of the peso against the U.S. dollar of 0.4%), partly offset by the payments of dividends by the associated companies
and joint ventures.
Goodwill – increased by 9.9%, mainly reflecting the goodwill arising from MPIC’s acquisitions of TMC and ESC.
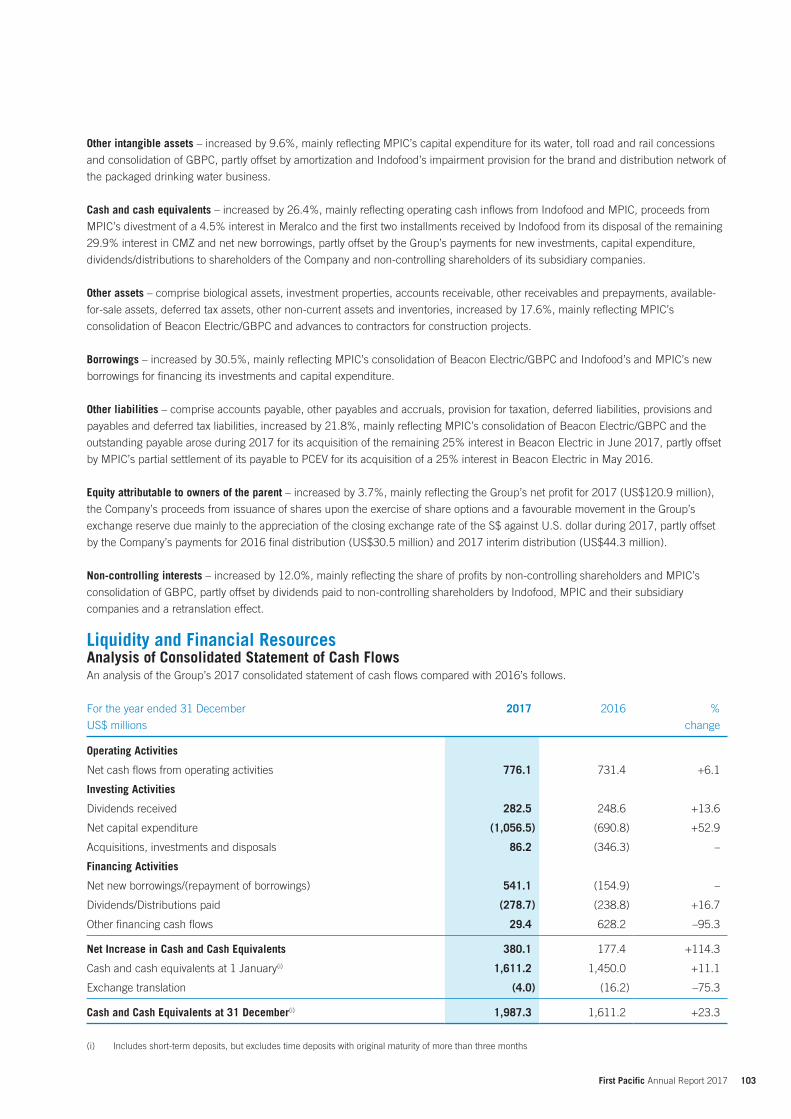
103 First Pacific Annual Report 2017
Other intangible assets – increased by 9.6%, mainly reflecting MPIC’s capital expenditure for its water, toll road and rail concessions
and consolidation of GBPC, partly offset by amortization and Indofood’s impairment provision for the brand and distribution network of
the packaged drinking water business.
Cash and cash equivalents – increased by 26.4%, mainly reflecting operating cash inflows from Indofood and MPIC, proceeds from
MPIC’s divestment of a 4.5% interest in Meralco and the first two installments received by Indofood from its disposal of the remaining
29.9% interest in CMZ and net new borrowings, partly offset by the Group’s payments for new investments, capital expenditure,
dividends/distributions to shareholders of the Company and non-controlling shareholders of its subsidiary companies.
Other assets – comprise biological assets, investment properties, accounts receivable, other receivables and prepayments, available-
for-sale assets, deferred tax assets, other non-current assets and inventories, increased by 17.6%, mainly reflecting MPIC’s
consolidation of Beacon Electric/GBPC and advances to contractors for construction projects.
Borrowings – increased by 30.5%, mainly reflecting MPIC’s consolidation of Beacon Electric/GBPC and Indofood’s and MPIC’s new
borrowings for financing its investments and capital expenditure.
Other liabilities – comprise accounts payable, other payables and accruals, provision for taxation, deferred liabilities, provisions and
payables and deferred tax liabilities, increased by 21.8%, mainly reflecting MPIC’s consolidation of Beacon Electric/GBPC and the
outstanding payable arose during 2017 for its acquisition of the remaining 25% interest in Beacon Electric in June 2017, partly offset
by MPIC’s partial settlement of its payable to PCEV for its acquisition of a 25% interest in Beacon Electric in May 2016.
Equity attributable to owners of the parent – increased by 3.7%, mainly reflecting the Group’s net profit for 2017 (US$120.9 million),
the Company’s proceeds from issuance of shares upon the exercise of share options and a favourable movement in the Group’s
exchange reserve due mainly to the appreciation of the closing exchange rate of the S$ against U.S. dollar during 2017, partly offset
by the Company’s payments for 2016 final distribution (US$30.5 million) and 2017 interim distribution (US$44.3 million).
Non-controlling interests – increased by 12.0%, mainly reflecting the share of profits by non-controlling shareholders and MPIC’s
consolidation of GBPC, partly offset by dividends paid to non-controlling shareholders by Indofood, MPIC and their subsidiary
companies and a retranslation effect.
Liquidity and Financial ResourcesAnalysis of Consolidated Statement of Cash FlowsAn analysis of the Group’s 2017 consolidated statement of cash flows compared with 2016’s follows.
For the year ended 31 December
US$ millions
2017 2016 %
change
Operating Activities
Net cash flows from operating activities 776.1 731.4 +6.1
Investing Activities
Dividends received 282.5 248.6 +13.6
Net capital expenditure (1,056.5) (690.8) +52.9
Acquisitions, investments and disposals 86.2 (346.3) –
Financing Activities
Net new borrowings/(repayment of borrowings) 541.1 (154.9) –
Dividends/Distributions paid (278.7) (238.8) +16.7
Other financing cash flows 29.4 628.2 –95.3
Net Increase in Cash and Cash Equivalents 380.1 177.4 +114.3
Cash and cash equivalents at 1 January(i) 1,611.2 1,450.0 +11.1
Exchange translation (4.0) (16.2) –75.3
Cash and Cash Equivalents at 31 December(i) 1,987.3 1,611.2 +23.3
(i) Includes short-term deposits, but excludes time deposits with original maturity of more than three months
104 First Pacific Annual Report 2017
Financial Review
Significant changes in consolidated statement of cash flows items are explained as follows:
Net cash flows from operating activities – increased by 6.1%, mainly reflecting the increase in operating cash inflows at Indofood and
MPIC, partly offset by the depreciation in the average peso exchange rate against the U.S. dollar.
Dividends received – increased by 13.6%, mainly reflecting the receipt of preferred share dividends from Beacon Electric and an
increase in dividend income from Meralco, partly offset by a decrease in dividend income from PLDT.
Net capital expenditure – increased by 52.9%, mainly reflecting higher investments in infrastructure projects at MPIC and property,
plant and equipment at Indofood.
Acquisitions, investments and disposals – 2017’s net cash inflow principally relates to MPIC’s proceeds from divestment of a 4.5%
interest in Meralco (US$246.2 million), Indofood’s receipt of the first two installments for its disposal of the remaining 29.9% interest
in CMZ (US$85.6 million) and MPIC’s proceeds from redemption of preferred shares by Beacon Electric (US$69.5 million), partly
offset by MPIC’s investments in PT Nusantara (US$151.3 million) and ATEC (US$85.4 million) and net cash outflow on acquisition of
Beacon Electric (US$112.0 million), TMC (US$5.7 million), a logistic business (US$4.0 million) and SEHI (US$2.3 million). 2016’s net
cash outflow principally relates to MPIC’s partial payments to PCEV for its acquisition of an additional 25% interest in Beacon Electric
in May 2016 (US$235.2 million), MPIC’s payments to PCEV for its acquisition of preferred shares issued by Beacon Electric (US$121.4
million) and to Beacon Electric for subscription of additional preferred shares (US$73.4 million) in May 2016, MPIC’s final payment
for its acquisition of an additional 10% direct interest in Meralco in April 2015 (US$89.0 million) and acquisition of a logistic business
(US$46.1 million), ESTII (US$36.2 million) and MVMC (US$20.1 million), partly offset by the net proceeds on disposal of CMZ in
December 2016 (US$258.7 million).
Net borrowings – 2017’s net cash inflow principally relates to net proceeds from borrowings at MPIC (US$529.6 million) and Indofood
(US$177.6 million), partly offset by net debt repayment at Head Office (US$167.6 million). 2016’s net cash outflow principally relates
to net debt repayments at Indofood mainly with the proceeds from disposal of CMZ (US$345.0 million), partly offset by net proceeds
from borrowings at MPIC (US$196.9 million).
Dividends/Distributions paid – increased by 16.7%. The amount represents the payments of 2016 final distribution and 2017 interim
distribution by the Company to its shareholders and by its subsidiary companies to their non-controlling shareholders. The increase
principally reflects an increase in dividends paid by Indofood and its subsidiary companies.
Other financing cash flows – decreased by 95.3%. 2017’s net cash inflow mainly relates to the Company’s proceeds from issuance of
shares upon the exercise of share options (US$38.2 million). 2016’s net cash inflow mainly relates to net proceeds from MPIC’s share
placement (US$460.7 million) and sale of 1.3 billion common shares in MPIC (US$168.6 million).
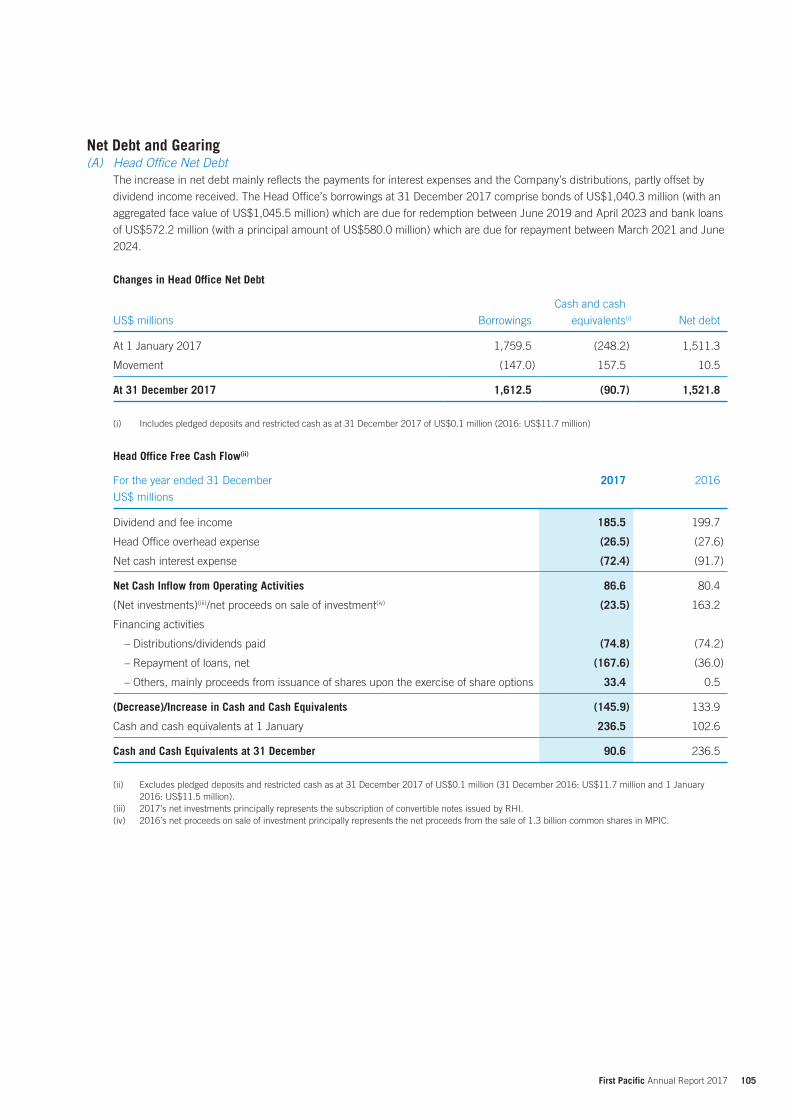
105 First Pacific Annual Report 2017
Net Debt and Gearing(A) Head Office Net Debt
The increase in net debt mainly reflects the payments for interest expenses and the Company’s distributions, partly offset by
dividend income received. The Head Office’s borrowings at 31 December 2017 comprise bonds of US$1,040.3 million (with an
aggregated face value of US$1,045.5 million) which are due for redemption between June 2019 and April 2023 and bank loans
of US$572.2 million (with a principal amount of US$580.0 million) which are due for repayment between March 2021 and June
2024.
Changes in Head Office Net Debt
US$ millions Borrowings
Cash and cash
equivalents(i) Net debt
At 1 January 2017 1,759.5 (248.2) 1,511.3
Movement (147.0) 157.5 10.5
At 31 December 2017 1,612.5 (90.7) 1,521.8
(i) Includes pledged deposits and restricted cash as at 31 December 2017 of US$0.1 million (2016: US$11.7 million)
Head Office Free Cash Flow(ii)
For the year ended 31 December
US$ millions
2017 2016
Dividend and fee income 185.5 199.7
Head Office overhead expense (26.5) (27.6)
Net cash interest expense (72.4) (91.7)
Net Cash Inflow from Operating Activities 86.6 80.4
(Net investments)(iii)/net proceeds on sale of investment(iv) (23.5) 163.2
Financing activities
– Distributions/dividends paid (74.8) (74.2)
– Repayment of loans, net (167.6) (36.0)
– Others, mainly proceeds from issuance of shares upon the exercise of share options 33.4 0.5
(Decrease)/Increase in Cash and Cash Equivalents (145.9) 133.9
Cash and cash equivalents at 1 January 236.5 102.6
Cash and Cash Equivalents at 31 December 90.6 236.5
(ii) Excludes pledged deposits and restricted cash as at 31 December 2017 of US$0.1 million (31 December 2016: US$11.7 million and 1 January 2016: US$11.5 million).
(iii) 2017’s net investments principally represents the subscription of convertible notes issued by RHI.(iv) 2016’s net proceeds on sale of investment principally represents the net proceeds from the sale of 1.3 billion common shares in MPIC.
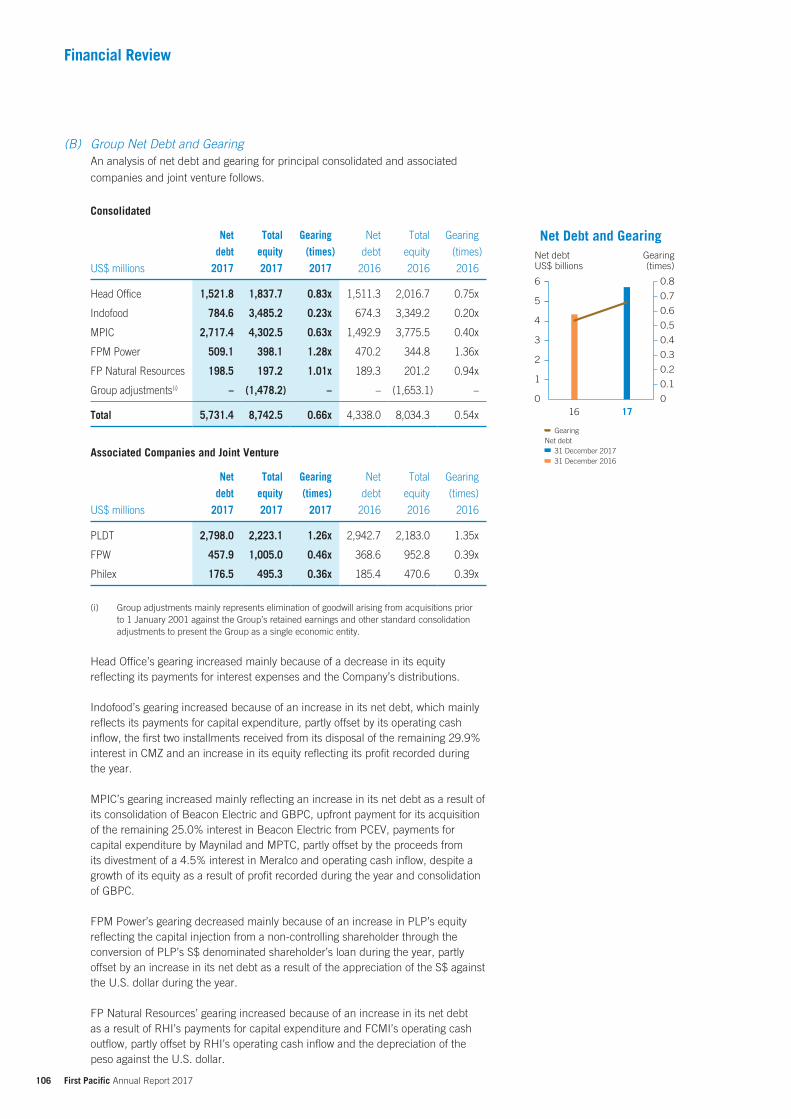
106 First Pacific Annual Report 2017
Financial Review
(B) Group Net Debt and GearingAn analysis of net debt and gearing for principal consolidated and associated
companies and joint venture follows.
Consolidated
US$ millions
Net debt
2017
Total equity 2017
Gearing (times)2017
Net
debt
2016
Total
equity
2016
Gearing
(times)
2016
Head Office 1,521.8 1,837.7 0.83x 1,511.3 2,016.7 0.75x
Indofood 784.6 3,485.2 0.23x 674.3 3,349.2 0.20x
MPIC 2,717.4 4,302.5 0.63x 1,492.9 3,775.5 0.40x
FPM Power 509.1 398.1 1.28x 470.2 344.8 1.36x
FP Natural Resources 198.5 197.2 1.01x 189.3 201.2 0.94x
Group adjustments(i) – (1,478.2) – – (1,653.1) –
Total 5,731.4 8,742.5 0.66x 4,338.0 8,034.3 0.54x
Associated Companies and Joint Venture
US$ millions
Net debt
2017
Total equity 2017
Gearing (times)
2017
Net
debt
2016
Total
equity
2016
Gearing
(times)
2016
PLDT 2,798.0 2,223.1 1.26x 2,942.7 2,183.0 1.35x
FPW 457.9 1,005.0 0.46x 368.6 952.8 0.39x
Philex 176.5 495.3 0.36x 185.4 470.6 0.39x
(i) Group adjustments mainly represents elimination of goodwill arising from acquisitions prior to 1 January 2001 against the Group’s retained earnings and other standard consolidation adjustments to present the Group as a single economic entity.
Head Office’s gearing increased mainly because of a decrease in its equity reflecting its payments for interest expenses and the Company’s distributions.
Indofood’s gearing increased because of an increase in its net debt, which mainly reflects its payments for capital expenditure, partly offset by its operating cash inflow, the first two installments received from its disposal of the remaining 29.9% interest in CMZ and an increase in its equity reflecting its profit recorded during the year.
MPIC’s gearing increased mainly reflecting an increase in its net debt as a result of its consolidation of Beacon Electric and GBPC, upfront payment for its acquisition of the remaining 25.0% interest in Beacon Electric from PCEV, payments for capital expenditure by Maynilad and MPTC, partly offset by the proceeds from its divestment of a 4.5% interest in Meralco and operating cash inflow, despite a growth of its equity as a result of profit recorded during the year and consolidation of GBPC.
FPM Power’s gearing decreased mainly because of an increase in PLP’s equity reflecting the capital injection from a non-controlling shareholder through the conversion of PLP’s S$ denominated shareholder’s loan during the year, partly offset by an increase in its net debt as a result of the appreciation of the S$ against the U.S. dollar during the year.
FP Natural Resources’ gearing increased because of an increase in its net debt as a result of RHI’s payments for capital expenditure and FCMI’s operating cash outflow, partly offset by RHI’s operating cash inflow and the depreciation of the peso against the U.S. dollar.
16 170
1
2
4
3
5
6
0
0.2
0.1
0.3
0.4
0.6
0.5
0.7
0.8
Net debtUS$ billions
Gearing(times)
Net debt31 December 201731 December 2016
Gearing
Net Debt and Gearing
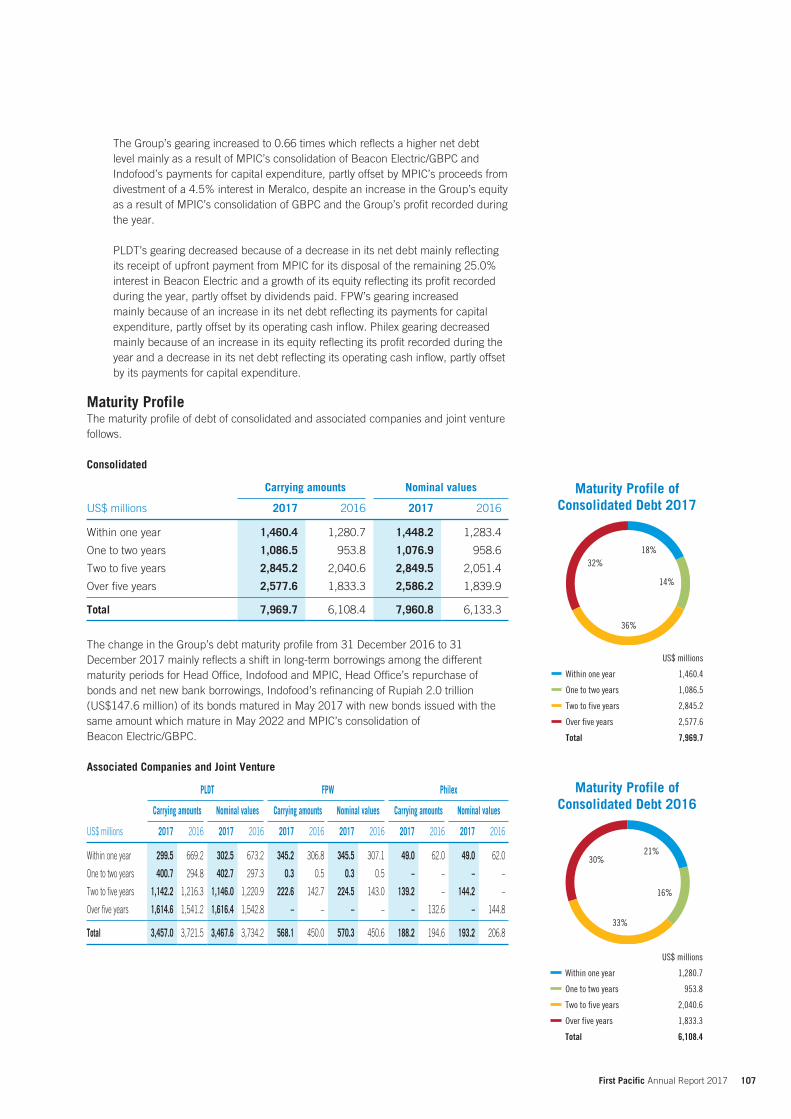
107 First Pacific Annual Report 2017
The Group’s gearing increased to 0.66 times which reflects a higher net debt level mainly as a result of MPIC’s consolidation of Beacon Electric/GBPC and Indofood’s payments for capital expenditure, partly offset by MPIC’s proceeds from divestment of a 4.5% interest in Meralco, despite an increase in the Group’s equity as a result of MPIC’s consolidation of GBPC and the Group’s profit recorded during the year.
PLDT’s gearing decreased because of a decrease in its net debt mainly reflecting its receipt of upfront payment from MPIC for its disposal of the remaining 25.0% interest in Beacon Electric and a growth of its equity reflecting its profit recorded during the year, partly offset by dividends paid. FPW’s gearing increased mainly because of an increase in its net debt reflecting its payments for capital expenditure, partly offset by its operating cash inflow. Philex gearing decreased mainly because of an increase in its equity reflecting its profit recorded during the year and a decrease in its net debt reflecting its operating cash inflow, partly offset by its payments for capital expenditure.
Maturity ProfileThe maturity profile of debt of consolidated and associated companies and joint venture follows.
Consolidated
Carrying amounts Nominal values US$ millions 2017 2016 2017 2016
Within one year 1,460.4 1,280.7 1,448.2 1,283.4
One to two years 1,086.5 953.8 1,076.9 958.6
Two to five years 2,845.2 2,040.6 2,849.5 2,051.4
Over five years 2,577.6 1,833.3 2,586.2 1,839.9
Total 7,969.7 6,108.4 7,960.8 6,133.3
The change in the Group’s debt maturity profile from 31 December 2016 to 31 December 2017 mainly reflects a shift in long-term borrowings among the different maturity periods for Head Office, Indofood and MPIC, Head Office’s repurchase of bonds and net new bank borrowings, Indofood’s refinancing of Rupiah 2.0 trillion (US$147.6 million) of its bonds matured in May 2017 with new bonds issued with the same amount which mature in May 2022 and MPIC’s consolidation of Beacon Electric/GBPC.
Associated Companies and Joint Venture
PLDT FPW Philex Carrying amounts Nominal values Carrying amounts Nominal values Carrying amounts Nominal values
US$ millions 2017 2016 2017 2016 2017 2016 2017 2016 2017 2016 2017 2016
Within one year 299.5 669.2 302.5 673.2 345.2 306.8 345.5 307.1 49.0 62.0 49.0 62.0
One to two years 400.7 294.8 402.7 297.3 0.3 0.5 0.3 0.5 – – – –
Two to five years 1,142.2 1,216.3 1,146.0 1,220.9 222.6 142.7 224.5 143.0 139.2 – 144.2 –
Over five years 1,614.6 1,541.2 1,616.4 1,542.8 – – – – – 132.6 – 144.8
Total 3,457.0 3,721.5 3,467.6 3,734.2 568.1 450.0 570.3 450.6 188.2 194.6 193.2 206.8
Maturity Profile ofConsolidated Debt 2017
US$ millions
Within one year 1,460.4
One to two years 1,086.5
Two to five years 2,845.2
Over five years 2,577.6
Total 7,969.7
18%
14%
36%
32%
Maturity Profile ofConsolidated Debt 2016
US$ millions
Within one year 1,280.7
One to two years 953.8
Two to five years 2,040.6
Over five years 1,833.3
Total 6,108.4
33%
16%
21%30%
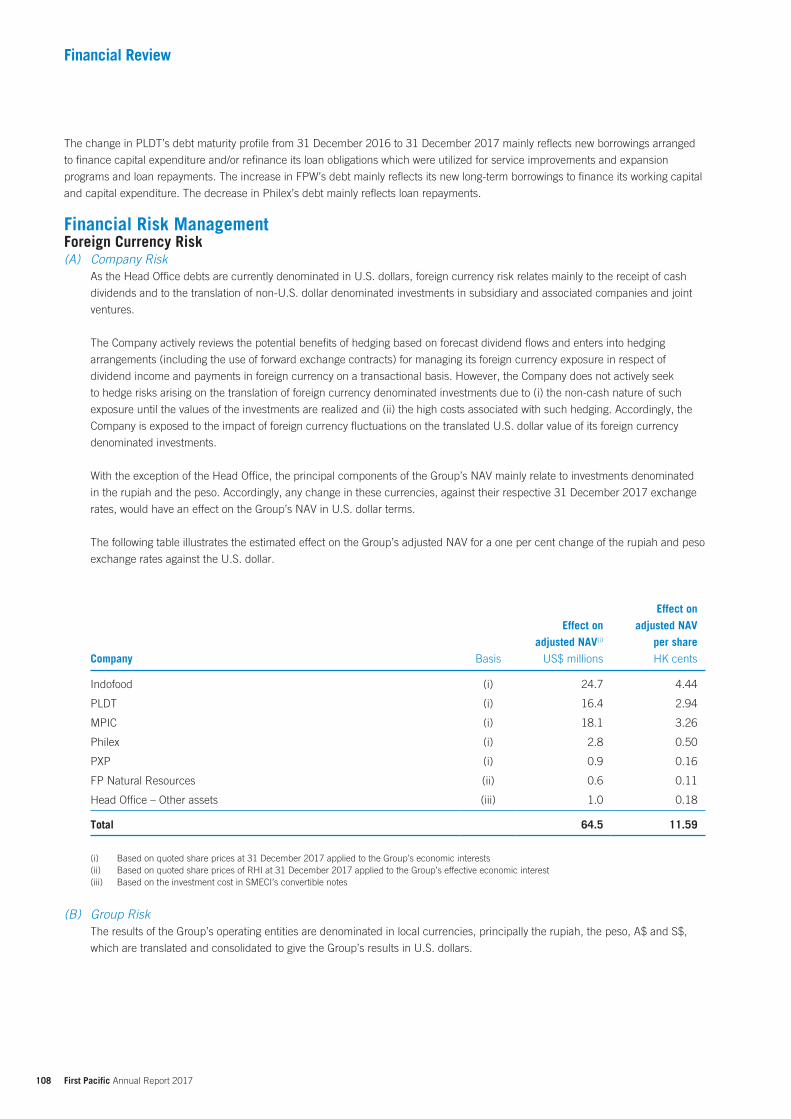
108 First Pacific Annual Report 2017
Financial Review
The change in PLDT’s debt maturity profile from 31 December 2016 to 31 December 2017 mainly reflects new borrowings arranged
to finance capital expenditure and/or refinance its loan obligations which were utilized for service improvements and expansion
programs and loan repayments. The increase in FPW’s debt mainly reflects its new long-term borrowings to finance its working capital
and capital expenditure. The decrease in Philex’s debt mainly reflects loan repayments.
Financial Risk ManagementForeign Currency Risk(A) Company Risk
As the Head Office debts are currently denominated in U.S. dollars, foreign currency risk relates mainly to the receipt of cash
dividends and to the translation of non-U.S. dollar denominated investments in subsidiary and associated companies and joint
ventures.
The Company actively reviews the potential benefits of hedging based on forecast dividend flows and enters into hedging
arrangements (including the use of forward exchange contracts) for managing its foreign currency exposure in respect of
dividend income and payments in foreign currency on a transactional basis. However, the Company does not actively seek
to hedge risks arising on the translation of foreign currency denominated investments due to (i) the non-cash nature of such
exposure until the values of the investments are realized and (ii) the high costs associated with such hedging. Accordingly, the
Company is exposed to the impact of foreign currency fluctuations on the translated U.S. dollar value of its foreign currency
denominated investments.
With the exception of the Head Office, the principal components of the Group’s NAV mainly relate to investments denominated
in the rupiah and the peso. Accordingly, any change in these currencies, against their respective 31 December 2017 exchange
rates, would have an effect on the Group’s NAV in U.S. dollar terms.
The following table illustrates the estimated effect on the Group’s adjusted NAV for a one per cent change of the rupiah and peso
exchange rates against the U.S. dollar.
Effect on adjusted NAV(i)
Effect on adjusted NAV
per shareCompany Basis US$ millions HK cents
Indofood (i) 24.7 4.44
PLDT (i) 16.4 2.94
MPIC (i) 18.1 3.26
Philex (i) 2.8 0.50
PXP (i) 0.9 0.16
FP Natural Resources (ii) 0.6 0.11
Head Office – Other assets (iii) 1.0 0.18
Total 64.5 11.59
(i) Based on quoted share prices at 31 December 2017 applied to the Group’s economic interests(ii) Based on quoted share prices of RHI at 31 December 2017 applied to the Group’s effective economic interest(iii) Based on the investment cost in SMECI’s convertible notes
(B) Group RiskThe results of the Group’s operating entities are denominated in local currencies, principally the rupiah, the peso, A$ and S$,
which are translated and consolidated to give the Group’s results in U.S. dollars.
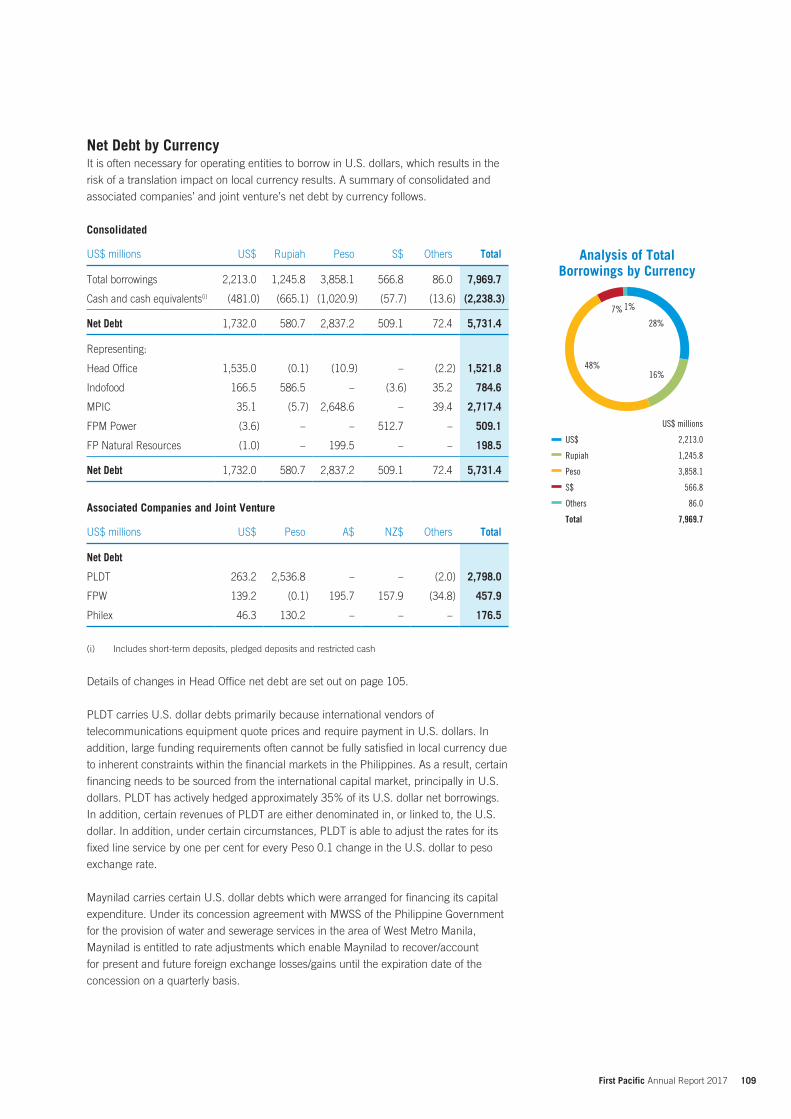
109 First Pacific Annual Report 2017
Net Debt by CurrencyIt is often necessary for operating entities to borrow in U.S. dollars, which results in the
risk of a translation impact on local currency results. A summary of consolidated and
associated companies’ and joint venture’s net debt by currency follows.
Consolidated
US$ millions US$ Rupiah Peso S$ Others Total
Total borrowings 2,213.0 1,245.8 3,858.1 566.8 86.0 7,969.7
Cash and cash equivalents(i) (481.0) (665.1) (1,020.9) (57.7) (13.6) (2,238.3)
Net Debt 1,732.0 580.7 2,837.2 509.1 72.4 5,731.4
Representing:
Head Office 1,535.0 (0.1) (10.9) – (2.2) 1,521.8
Indofood 166.5 586.5 – (3.6) 35.2 784.6
MPIC 35.1 (5.7) 2,648.6 – 39.4 2,717.4
FPM Power (3.6) – – 512.7 – 509.1
FP Natural Resources (1.0) – 199.5 – – 198.5
Net Debt 1,732.0 580.7 2,837.2 509.1 72.4 5,731.4
Associated Companies and Joint Venture
US$ millions US$ Peso A$ NZ$ Others Total
Net Debt
PLDT 263.2 2,536.8 – – (2.0) 2,798.0
FPW 139.2 (0.1) 195.7 157.9 (34.8) 457.9
Philex 46.3 130.2 – – – 176.5
(i) Includes short-term deposits, pledged deposits and restricted cash
Details of changes in Head Office net debt are set out on page 105.
PLDT carries U.S. dollar debts primarily because international vendors of
telecommunications equipment quote prices and require payment in U.S. dollars. In
addition, large funding requirements often cannot be fully satisfied in local currency due
to inherent constraints within the financial markets in the Philippines. As a result, certain
financing needs to be sourced from the international capital market, principally in U.S.
dollars. PLDT has actively hedged approximately 35% of its U.S. dollar net borrowings.
In addition, certain revenues of PLDT are either denominated in, or linked to, the U.S.
dollar. In addition, under certain circumstances, PLDT is able to adjust the rates for its
fixed line service by one per cent for every Peso 0.1 change in the U.S. dollar to peso
exchange rate.
Maynilad carries certain U.S. dollar debts which were arranged for financing its capital
expenditure. Under its concession agreement with MWSS of the Philippine Government
for the provision of water and sewerage services in the area of West Metro Manila,
Maynilad is entitled to rate adjustments which enable Maynilad to recover/account
for present and future foreign exchange losses/gains until the expiration date of the
concession on a quarterly basis.
Analysis of TotalBorrowings by Currency
US$ millions
US$ 2,213.0
Rupiah 1,245.8
Peso 3,858.1
S$ 566.8
Others 86.0
Total 7,969.7
48%
28%
16%
7% 1%
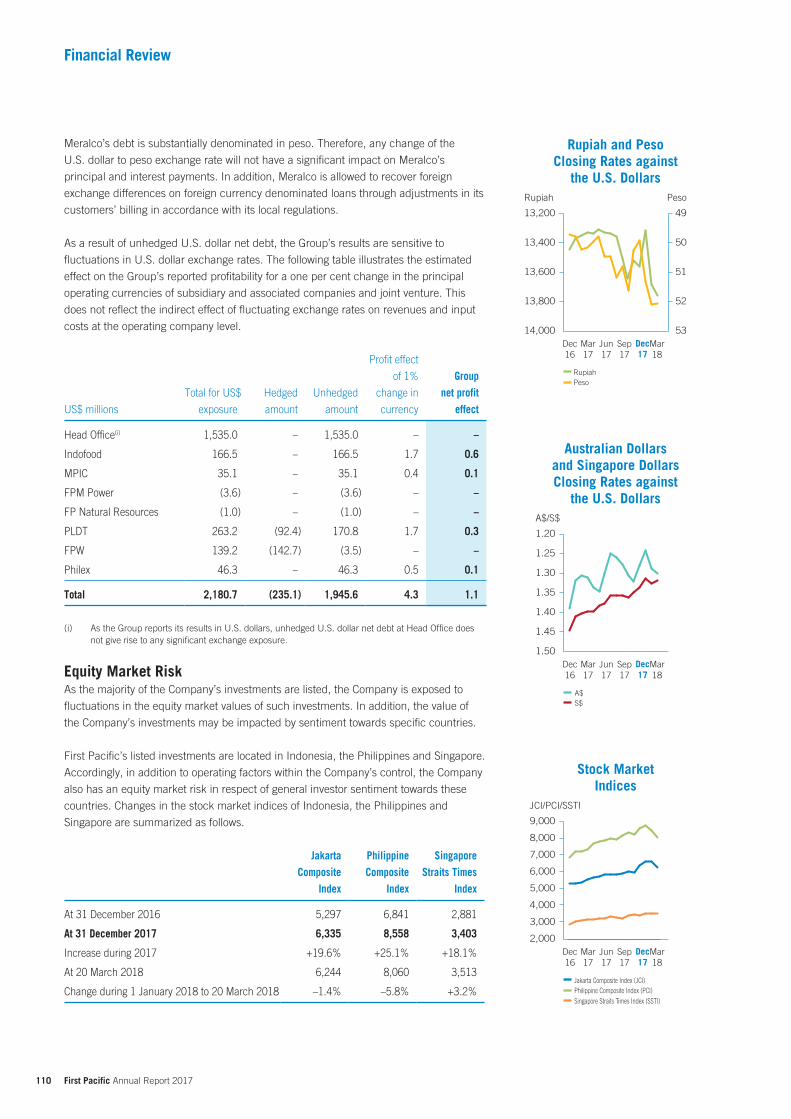
110 First Pacific Annual Report 2017
Financial Review
Meralco’s debt is substantially denominated in peso. Therefore, any change of the
U.S. dollar to peso exchange rate will not have a significant impact on Meralco’s
principal and interest payments. In addition, Meralco is allowed to recover foreign
exchange differences on foreign currency denominated loans through adjustments in its
customers’ billing in accordance with its local regulations.
As a result of unhedged U.S. dollar net debt, the Group’s results are sensitive to
fluctuations in U.S. dollar exchange rates. The following table illustrates the estimated
effect on the Group’s reported profitability for a one per cent change in the principal
operating currencies of subsidiary and associated companies and joint venture. This
does not reflect the indirect effect of fluctuating exchange rates on revenues and input
costs at the operating company level.
US$ millions
Total for US$
exposure
Hedged
amount
Unhedged
amount
Profit effect
of 1%
change in
currency
Group net profit
effect
Head Office(i) 1,535.0 – 1,535.0 – –
Indofood 166.5 – 166.5 1.7 0.6
MPIC 35.1 – 35.1 0.4 0.1
FPM Power (3.6) – (3.6) – –
FP Natural Resources (1.0) – (1.0) – –
PLDT 263.2 (92.4) 170.8 1.7 0.3
FPW 139.2 (142.7) (3.5) – –
Philex 46.3 – 46.3 0.5 0.1
Total 2,180.7 (235.1) 1,945.6 4.3 1.1
(i) As the Group reports its results in U.S. dollars, unhedged U.S. dollar net debt at Head Office does not give rise to any significant exchange exposure.
Equity Market RiskAs the majority of the Company’s investments are listed, the Company is exposed to
fluctuations in the equity market values of such investments. In addition, the value of
the Company’s investments may be impacted by sentiment towards specific countries.
First Pacific’s listed investments are located in Indonesia, the Philippines and Singapore.
Accordingly, in addition to operating factors within the Company’s control, the Company
also has an equity market risk in respect of general investor sentiment towards these
countries. Changes in the stock market indices of Indonesia, the Philippines and
Singapore are summarized as follows.
Jakarta Composite
Index
Philippine Composite
Index
Singapore Straits Times
Index
At 31 December 2016 5,297 6,841 2,881
At 31 December 2017 6,335 8,558 3,403
Increase during 2017 +19.6% +25.1% +18.1%
At 20 March 2018 6,244 8,060 3,513
Change during 1 January 2018 to 20 March 2018 –1.4% –5.8% +3.2%
Rupiah and PesoClosing Rates against
the U.S. Dollars
14,000
13,800
13,600
13,400
13,200
53
51
52
50
49
Rupiah Peso
Dec16
Mar17
Jun17
Mar18
Sep17
Dec17
RupiahPeso
Australian Dollarsand Singapore DollarsClosing Rates against
the U.S. DollarsA$/S$
1.50
1.45
1.40
1.35
1.30
1.25
1.20
Dec16
Mar17
Jun17
Sep17
Dec17
A$S$
Mar18
JCI/PCI/SSTI
Jakarta Composite Index (JCI)Philippine Composite Index (PCI)Singapore Straits Times Index (SSTI)
2,000
3,000
4,000
5,000
6,000
7,000
8,000
9,000
Dec16
Mar17
Jun17
Dec17
Mar18
Sep17
Stock MarketIndices
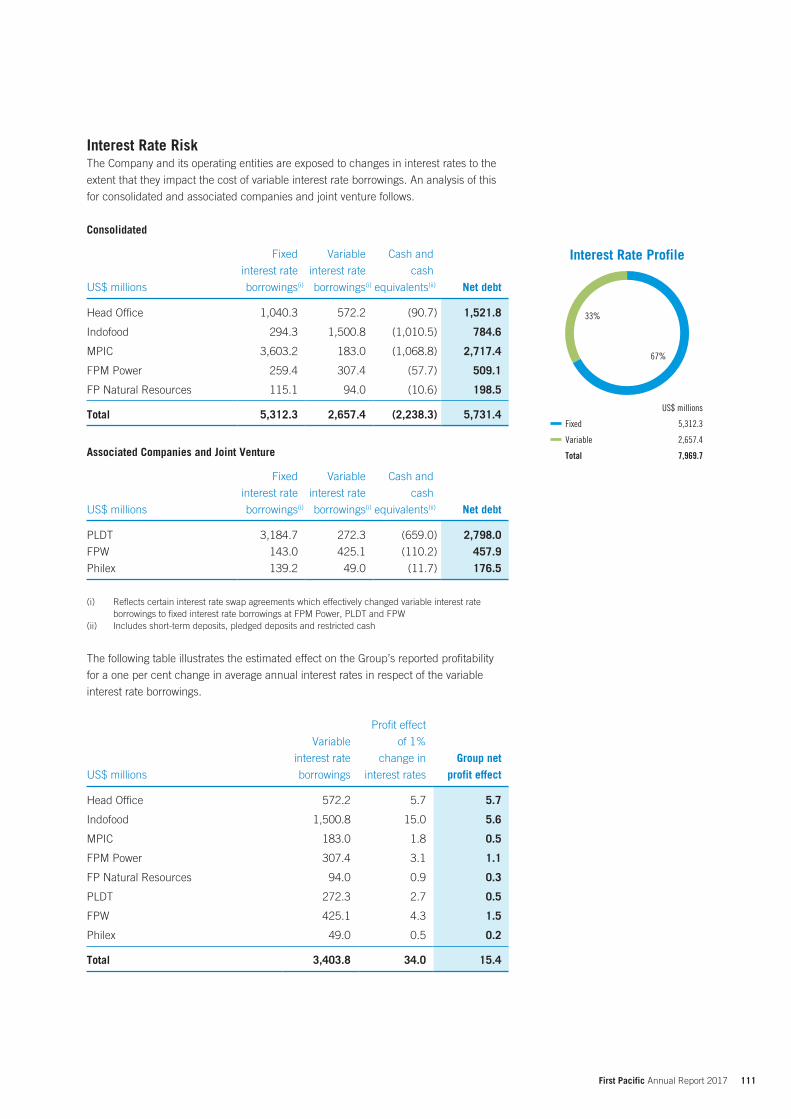
111 First Pacific Annual Report 2017
Interest Rate RiskThe Company and its operating entities are exposed to changes in interest rates to the
extent that they impact the cost of variable interest rate borrowings. An analysis of this
for consolidated and associated companies and joint venture follows.
Consolidated
US$ millions
Fixed
interest rate
borrowings(i)
Variable
interest rate
borrowings(i)
Cash and
cash
equivalents(ii) Net debt
Head Office 1,040.3 572.2 (90.7) 1,521.8
Indofood 294.3 1,500.8 (1,010.5) 784.6
MPIC 3,603.2 183.0 (1,068.8) 2,717.4
FPM Power 259.4 307.4 (57.7) 509.1
FP Natural Resources 115.1 94.0 (10.6) 198.5
Total 5,312.3 2,657.4 (2,238.3) 5,731.4
Associated Companies and Joint Venture
US$ millions
Fixed
interest rate
borrowings(i)
Variable
interest rate
borrowings(i)
Cash and
cash
equivalents(ii) Net debt
PLDT 3,184.7 272.3 (659.0) 2,798.0FPW 143.0 425.1 (110.2) 457.9Philex 139.2 49.0 (11.7) 176.5
(i) Reflects certain interest rate swap agreements which effectively changed variable interest rate borrowings to fixed interest rate borrowings at FPM Power, PLDT and FPW
(ii) Includes short-term deposits, pledged deposits and restricted cash
The following table illustrates the estimated effect on the Group’s reported profitability
for a one per cent change in average annual interest rates in respect of the variable
interest rate borrowings.
US$ millions
Variable
interest rate
borrowings
Profit effect
of 1%
change in
interest rates
Group net profit effect
Head Office 572.2 5.7 5.7
Indofood 1,500.8 15.0 5.6
MPIC 183.0 1.8 0.5
FPM Power 307.4 3.1 1.1
FP Natural Resources 94.0 0.9 0.3
PLDT 272.3 2.7 0.5
FPW 425.1 4.3 1.5
Philex 49.0 0.5 0.2
Total 3,403.8 34.0 15.4
Interest Rate Profile
US$ millions
Fixed 5,312.3
Variable 2,657.4
Total 7,969.7
67%
33%
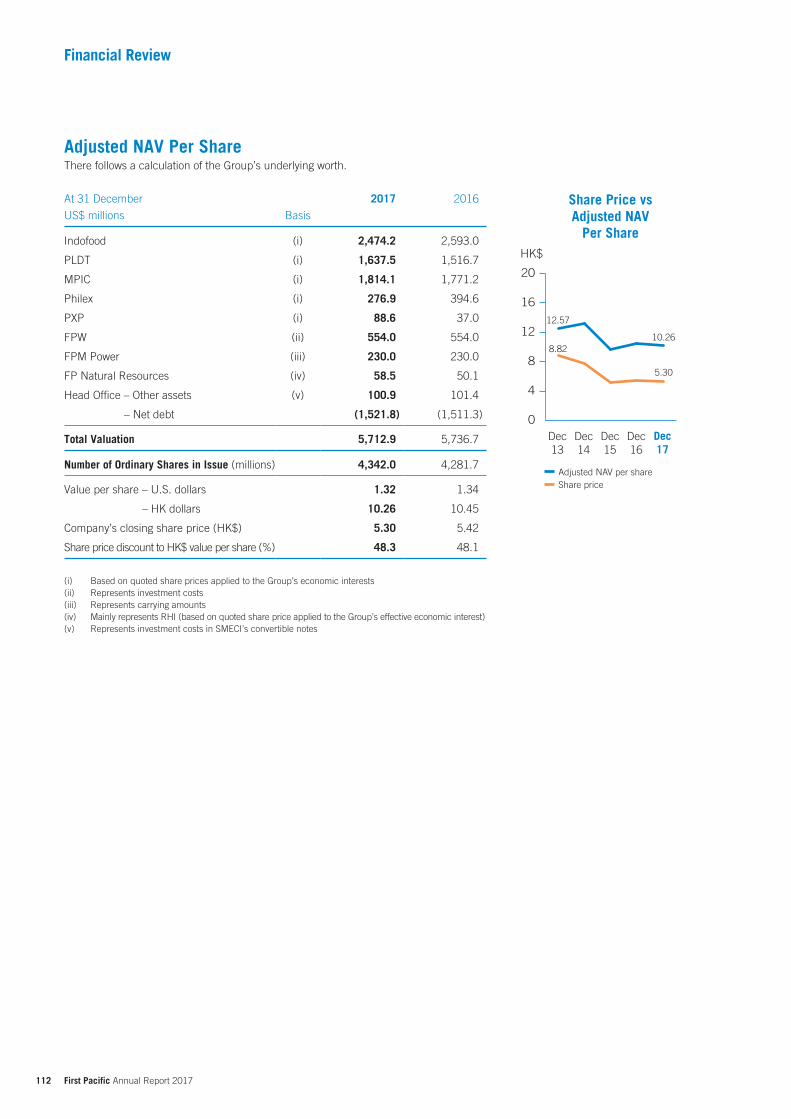
112 First Pacific Annual Report 2017
Financial Review
Adjusted NAV Per ShareThere follows a calculation of the Group’s underlying worth.
At 31 December
US$ millions Basis
2017 2016
Indofood (i) 2,474.2 2,593.0
PLDT (i) 1,637.5 1,516.7
MPIC (i) 1,814.1 1,771.2
Philex (i) 276.9 394.6
PXP (i) 88.6 37.0
FPW (ii) 554.0 554.0
FPM Power (iii) 230.0 230.0
FP Natural Resources (iv) 58.5 50.1
Head Office – Other assets (v) 100.9 101.4
– Net debt (1,521.8) (1,511.3)
Total Valuation 5,712.9 5,736.7
Number of Ordinary Shares in Issue (millions) 4,342.0 4,281.7
Value per share – U.S. dollars 1.32 1.34
– HK dollars 10.26 10.45
Company’s closing share price (HK$) 5.30 5.42
Share price discount to HK$ value per share (%) 48.3 48.1
(i) Based on quoted share prices applied to the Group’s economic interests(ii) Represents investment costs(iii) Represents carrying amounts(iv) Mainly represents RHI (based on quoted share price applied to the Group’s effective economic interest)(v) Represents investment costs in SMECI’s convertible notes
Share Price vsAdjusted NAV
Per ShareHK$
Adjusted NAV per share
12.57
8.8210.26
5.30
Share price
0
4
8
12
16
20
Dec13
Dec14
Dec15
Dec16
Dec17
113 First Pacific Annual Report 2017
Statutory Reports, Consolidated Financial Statementsand Notes to the Consolidated Financial Statements
Contents
Statutory ReportsReport of the Directors 114
Independent Auditor’s Report 120
Consolidated Financial StatementsConsolidated Income Statement 124
Consolidated Statement of Comprehensive Income 125
Consolidated Statement of Financial Position 126
Consolidated Statement of Changes in Equity 127
Consolidated Statement of Cash Flows 128
Notes to the Consolidated Financial StatementsGeneral Information1. Corporate and Group Information 130
2. Basis of Preparation and Summary of
Principal Accounting Policies 130
3. Significant Accounting Judgments and Estimates 154
Consolidated Income Statement4. Turnover and Operating Segmental Information 159
5. Finance Costs 162
6. Profit Before Taxation from Continuing Operations 163
7. Taxation 164
8. A Discontinued Operation 164
9. Profit Attributable to Owners of the Parent 166
10. Earnings Per Share Attributable to
Owners of the Parent 167
11. Ordinary Share Distribution 168
Consolidated Statement of Financial Position12. Property, Plant and Equipment 168
13. Biological Assets 169
14. Associated Companies and Joint Ventures 172
15. Goodwill 176
16. Other Intangible Assets 178
17. Investment Properties 185
18. Accounts Receivable, Other Receivables and
Prepayments 185
19. Available-for-sale Assets 187
20. Deferred Tax 188
21. Pledged Deposits and Restricted Cash 189
22. Other Non-current Assets 189
23. Cash and Cash Equivalents and Short-term Deposits 190
24. Inventories 190
25 Accounts Payable, Other Payables and Accruals 191
26. Borrowings 191
27. Provision for Taxation 194
28. Deferred Liabilities, Provisions and Payables 194
29. Share Capital 195
30. Shares Held for Share Award Scheme 195
31. Other Components of Equity 200
32. Non-controlling Interests 201
33. Other Comprehensive (Loss)/Income Attributable to
Owners of the Parent 203
Consolidated Statement of Cash Flows34. Notes to the Consolidated Statement of Cash Flows 203
Other Financial Information35. Commitments and Contingent Liabilities 207
36. Employees’ Benefits 209
37. Directors’ and Senior Executives’ Remuneration 214
38. Related Party Transactions 227
39. Financial Instruments by Category and
Fair Value Hierarchy 236
40. Capital and Financial Risk Management 239
41. Statement of Financial Position of the Company 244
42. Approval of the Consolidated Financial Statements 245
114 First Pacific Annual Report 2017
Statutory Reports
Report of the Directors
The Directors present their report and the audited financial statements of First Pacific Company Limited (the Company) and its
subsidiary companies (together, the Group) (the Consolidated Financial Statements) for the year ended 31 December 2017.
Principal Business Activities, Geographical Market Analysis of Operations and Business ReviewFirst Pacific Company Limited is a Hong Kong-based investment management and holding company with operations located in Asia-
Pacific. Its principal business interests relate to consumer food products, telecommunications, infrastructure and natural resources.
During the year, there were no significant changes in the nature of the Group’s principal business activities.
An analysis of the Group’s turnover and operating segmental information for the year is set out in Note 4 to the Consolidated Financial
Statements, and a summary of its principal investments is set out on pages 250 and 251.
Further discussion and analysis of these activities as required by Schedule 5 to the Hong Kong Companies Ordinance, including a
description of the principal risks and uncertainties facing the Group, an indication of likely future development in the Group’s business
and the Group’s environmental policies and performance, can be found in the “Review of Operations”, “Chairman’s Letter”, “Managing
Director and Chief Executive Officer’s Letter”, “Corporate Social Responsibility Report” and “Corporate Governance Report” sections
set out on pages 6 to 41 and pages 49 to 100 of this annual report. Those discussions form part of this Report of the Directors.
IncorporationThe Company was incorporated on 25 May 1988 in Bermuda with limited liability.
Share Capital, Shares Held for Share Award Scheme and Share OptionsDetails of movements in the Company’s share capital, shares held for share award scheme and share options issued by the Group
during the year, together with their reasons, are set out in Notes 29, 30 and 37(D)(a) to the Consolidated Financial Statements.
ReservesDetails of movements in the reserves of the Group and the Company during the year are set out in the Consolidated Financial
Statements on page 127 and page 245, respectively.
Purchase, Sale or Redemption of Listed Securities of the CompanyDuring the year ended 31 December 2017, the Company has not repurchased any of its ordinary shares (2016: Nil) on SEHK.
On 4 January 2017, the Company made tender offers inviting holders of the US$300 million 7.375% Guaranteed Secured Bonds
due July 2017 issued by FPMH Finance Limited (2017 Bonds) and the US$400 million 6.375% Guaranteed Secured Bonds due
September 2020 issued by FPT Finance Limited (2020 Bonds) to tender their Bonds for purchase by the Company for cash (Tender
Offer). The purchase price for the two bonds under the Tender Offer was 103.25% of the principal amount of the 2017 Bonds
and 109.00% of the principal amount of the 2020 Bonds, respectively. On expiration deadline of the Tender Offer, the Company
received valid tenders for an aggregate principal amount of US$69.0 million in respect of the 2017 Bonds (2016: US$12.5 million
repurchased) and US$83.2 million in respect of the 2020 Bonds (2016: US$4.6 million repurchased), which were accepted by the
Company for purchase, with settlement completed on 18 January 2017. These purchased bonds were subsequently cancelled.
On 24 July 2017, being the maturity date of the 2017 Bonds, FPMH Finance Limited redeemed all the outstanding 2017 Bonds
in aggregate principal amount of US$218.5 million, which bonds were subsequently cancelled and delisted from the Singapore
Exchange Securities Trading Limited.
In addition to the Tender Offer and redemption of the 2017 Bonds, during the year the Company also repurchased US$8.5 million
(2016: US$17.0 million) in principal amount of the US$400 million 4.5% Guaranteed Bonds due April 2023 issued by FPC Treasury
Limited at an aggregate consideration of US$8.8 million (2016: US$17.6 million) and US$25.5 million (2016: Nil) in principal amount
of the US$400 million 6% Guaranteed bonds due June 2019 issued by FPC Finance Limited, at an aggregate consideration of
US$27.7 million (2016: Nil). All such repurchased bonds were subsequently cancelled.
115 First Pacific Annual Report 2017
During the year ended 31 December 2017, the independent trustee managing the Company’s share award scheme subscribed
134,342 new shares (2016: 4,284,489 shares) issued by the Company at an aggregate consideration of approximately US$0.1 million
(2016: approximately US$2.8 million) and purchased 7,452,000 shares (2016: 6,764,000 shares) of the Company at an aggregate
consideration of approximately US$5.8 million (2016: US$4.7 million) at the cost of the Company.
Except as disclosed above, neither the Company, nor any of its subsidiary companies, has made any purchase, sale or redemption of
any of the Company’s listed securities during the year.
Results and AppropriationsThe consolidated profit of the Group for the year ended 31 December 2017 and the Group’s financial position at that date are set out
in the Consolidated Financial Statements on pages 124 to 245.
An interim distribution of HK8.00 cents (U.S. 1.03 cents) (2016: HK8.00 cents or U.S. 1.03 cents) per ordinary share, totaling
US$44.3 million (2016: US$44.0 million), was paid on 27 September 2017. The Directors recommended the payment of a final
distribution of HK5.50 cents (U.S. 0.71 cents) (2016: HK 5.50 cents or U.S. 0.71 cents) per ordinary share, totaling US$30.8 million
(2016: US$30.5 million). The total distribution per ordinary share for 2017 equals to HK13.50 cents (U.S. 1.74 cents) (2016: HK
13.50 cents or U.S. 1.74 cents), totaling US$75.1 million (2016: US$74.5 million).
Charitable ContributionsThe Group made charitable contributions totaling US$16.8 million in 2017 (2016: US$30.0 million).
Property, Plant and EquipmentDetails of movements in the Group’s property, plant and equipment during the year are provided in Note 12 to the Consolidated
Financial Statements.
BorrowingsDetails of the borrowings of the Group are provided in Note 26 to the Consolidated Financial Statements.
Distributable ReservesAt 31 December 2017, the Company’s reserves available for distribution, calculated in accordance with the provisions of the
Companies Act 1981 of Bermuda (as amended) amounted to US$1,840.2 million (2016: US$1,915.0 million), representing the
Company’s contributed surplus account. In addition, the Company’s share premium account of US$62.0 million (2016: US$5.3
million) may be distributed in the form of fully paid bonus shares.
Pre-emptive RightsThere is no provision for pre-emptive rights under the Company’s bye-laws or the laws of Bermuda which would oblige the Company
to offer new shares on a pro rata basis to existing shareholders.
DirectorsThe names and biographical details of the Directors of the Company who held office at 31 December 2017 are set out on pages 42 to
45. Details of the remuneration policy and other details are provided in the Corporate Governance Report on page 100 and Note 37(A)
to the Consolidated Financial Statements, respectively.
Interests of Directors in the Company and its Associated CorporationsAs at 31 December 2017, the interests and short positions of the Directors and chief executive of the Company in the shares of the
Company, underlying shares and debentures of the Company or any of its associated corporations (within the meaning of Part XV of
the Securities and Futures Ordinance (Chapter 571 of the Laws of Hong Kong) (SFO)) which (a) were recorded in the register required
to be kept under section 352 of Part XV of the SFO; or (b) were notified to the Company and SEHK pursuant to the Model Code for
Securities Transactions by Directors of Listed Issuers as adopted by the Company (Model Code) were as follows:

116 First Pacific Annual Report 2017
Statutory Reports
(A) Long Positions in Shares in the Company
Name Ordinary shares
Approximate percentage of issued share capital (%)
Ordinary share options
Anthoni Salim 1,925,474,957(C)(i) 44.35 –
Manuel V. Pangilinan 70,293,078(P)(ii) 1.62 10,224,972
Robert C. Nicholson 6,138,528(P)(iii) 0.14 13,927,435
Christopher H. Young 3,554,340(P)(iv) 0.08 –
Benny S. Santoso 446,535(P)(v) 0.01 3,868,235
Ambassador Albert F. del Rosario 1,722,231(P)(vi) 0.04 –
Prof. Edward K.Y. Chen, GBS, CBE, JP 1,989,559(P)(vii) 0.05 1,097,139
Margaret Leung Ko May Yee, SBS, JP 1,131,652(P)(viii) 0.03 1,812,887
Philip Fan Yan Hok 1,131,652(P)(ix) 0.03 1,812,887
Madeleine Lee Suh Shin 893,070(P)(x) 0.02 –
(C) = Corporate interest, (P) = Personal interest
(i) Anthoni Salim indirectly owns 100% of First Pacific Investments (B.V.I.) Limited, his indirect interests in First Pacific Investments (B.V.I.) Limited are held through Salerni International Limited (a company of which Anthoni Salim owns 100% share interests). First Pacific Investments (B.V.I.) Limited and Salerni International Limited are interested in 633,186,599 shares and 502,058,994 shares respectively in the Company. Anthoni Salim also owns 82.55% of First Pacific Investments Limited which, in turn, is interested in 790,229,364 shares in the Company. Of this, 4.04% is held by Anthoni Salim directly, 18.9% by Salerni International Limited and 59.61% by Asian Capital Finance Limited (a company in which Anthoni Salim owns 100% share interests). The remaining 17.45% interest in First Pacific Investments Limited is owned as to 12.12% by Sutanto Djuhar (a former Non-executive Director of the Company), 4.04% by Tedy Djuhar (a Non-executive Director of the Company) and 1.29% by a company controlled by the estate of the late Mr. Ibrahim Risjad (a former Non-executive Director of the Company).
(ii) It included Mr. Pangilinan’s interests in 2,976,920 awarded shares granted pursuant to the Company’s Share Award Scheme as adopted by the Board on 19 March 2013 (the Share Award Scheme) which remain unvested, and interests in 29,033,817 shares transferred to certain family trusts.
(iii) It included Mr. Nicholson’s interests in 1,759,880 awarded shares granted pursuant to the Company’s Share Award Scheme which remain unvested.(iv) It included Mr. Young’s interests in 2,369,560 awarded shares granted pursuant to the Company’s Share Award Scheme which remain unvested.(v) It included Mr. Santoso’s interests in 297,690 awarded shares granted pursuant to the Company’s Share Award Scheme which remain unvested.(vi) It included Ambassador del Rosario’s interests in 595,380 awarded shares granted pursuant to the Company’s Share Award Scheme which remain
unvested.(vii) It included Prof. Chen’s interests in 595,380 awarded shares granted pursuant to the Company’s Share Award Scheme which remain unvested.(viii) It included Mrs. Leung’s interests in 643,098 awarded shares granted pursuant to the Company’s Share Award Scheme which remain unvested.(ix) It included Mr. Fan’s interests in 643,098 awarded shares granted pursuant to the Company’s Share Award Scheme which remain unvested.(x) It represented Ms. Lee’s interests in 893,070 awarded shares granted pursuant to the Company’s Share Award Scheme which remain unvested.
(B) Long Positions in Shares in Associated Corporations Manuel V. Pangilinan owned (a) 30,092,404 common shares(P) (0.10%)* (which included 2,500,000 stock grant) in
MPIC, (b) 237,033 common shares(P) (0.11%)* in PLDT as beneficial owner and a further 15,417 common shares (less
than 0.01%)* in PLDT as nominee, (c) 4,655,000 common shares(P) (0.09%)* in Philex, (d) 1,603,465 common shares(P)
(0.09%)* in PXP, (e) 40,000 common shares(P) (less than 0.01%)* in Meralco, as well as (f) 61,547 common shares(P)
(less than 0.01%)* and 500,000 share options in RHI.
Robert C. Nicholson owned (a) 600,000 stock grant (less than 0.01%)* and 5,000,000 share options in MPIC, (b) 1,250
common shares(P) (less than 0.01%)* in Philex, (c) 337 common shares(P) (less than 0.01%)* in PXP, as well as (d)
US$600,000 of bonds due 2019 issued by FPC Finance Limited, US$200,000 of bonds due 2020 issued by FPT Finance
Limited and US$400,000 of bonds due 2023 issued by FPC Treasury Limited, all of which are wholly-owned subsidiaries of
the Company.
Christopher H. Young owned (a) 54,313 common shares(P) (0.02%)* in PLDT and (b) 61,547 common shares(P) (less than
0.01%)* in RHI.
Tedy Djuhar owned 15,520,335 ordinary shares(C) (0.18%)* in Indofood.
117 First Pacific Annual Report 2017
Anthoni Salim owned (a) 1,329,770 ordinary shares(P) (0.02%)* in Indofood and an indirect interest of 4,396,103,450
Indofood shares(C) (50.07%)* through the Company’s group companies, (b) an indirect interest of 2,007,788 shares(C)
(0.14%)* in IndoAgri through his controlled corporations other than the Company and an indirect interest of 1,037,760,830
IndoAgri shares(C) (74.34%)* through the Company’s group companies, (c) an indirect interest of 20,483,364 shares(C)
(0.13%)* in SIMP through his controlled corporations other than the Company and an indirect interest of 12,471,746,400
SIMP shares(C) (80.46%)* through the Company’s group companies; as well as (d) an indirect interest of 245,681,396
shares(C) (37.48%)* in CMZ in the form of security under a share charge over CMZ shares in favour of his controlled
corporations other than the Company and an indirect interest of 196,249,971 CMZ shares(C) (29.94%)* through the
Company’s group companies in the form of security under a share charge over CMZ shares in favour of Indofood.
Ambassador Albert F. del Rosario owned (a) 2,050,000 common shares(P) (which included 600,000 stock grant) in
personal capacity and 11,516,624 common shares(P) under joint names (collectively 0.04%)* in MPIC, (b) 1 common
share(P) in personal capacity and 142,409 common shares(P) under joint names (collectively 0.07%)* in PLDT, (c) 100
common shares(P) in personal capacity and 675,000 common shares(P) under joint names (collectively 0.01%)* in Philex,
(d) 28 common shares(P) in personal capacity and 187,650 common shares(P) under joint names (collectively 0.01%)* in
PXP, (e) 25,700 common shares(P) in personal capacity and 474,640 common shares(P) under joint names (collectively
0.04%)* in Meralco, as well as (f) US$200,000 of bonds due 2019 issued by FPC Finance Limited, which is a wholly-
owned subsidiary of the Company.
(P) = Personal interest, (C) = Corporate interest* Approximate percentage of the issued capital of the respective class of shares in the respective associated corporations as at 31 December 2017.
Save for those disclosed above, as at 31 December 2017, none of the Directors and chief executive of the Company had any interests
or short positions in respect of shares, underlying shares or debentures of the Company or any of its associated corporations (within
the meaning of Part XV of the SFO) as recorded in the register required to be kept under Section 352 of the SFO, or as otherwise
notified to the Company pursuant to the Model Code.
Interests of Substantial Shareholders in the CompanyThe interests and short positions of substantial shareholders in the shares and underlying shares of the Company as at 31 December
2017 as recorded in the register required to be kept under Section 336 of the SFO are set out below:
(a) Salerni International Limited (Salerni), which was incorporated in the British Virgin Islands, was interested in 1,135,245,593
ordinary shares of the Company at 31 December 2017, representing approximately 26.15% of the Company’s issued share
capital at that date, by way of 502,058,994 ordinary shares of the Company held, representing approximately 11.56% of the
Company’s issued share capital at that date and also its 100% interest in First Pacific Investments (B.V.I.) Limited (FPIL-BVI).
Anthoni Salim, Chairman of the Company, beneficially owns the entire issued share capital of Salerni and, accordingly, is taken
to be interested in the shares owned by Salerni.
(b) Asian Capital Finance Limited (ACFL), which was incorporated in the British Virgin Islands, was interested in 790,229,364
ordinary shares of the Company at 31 December 2017, representing approximately 18.20% of the Company’s issued share
capital at that date, by way of its 59.61% interest in First Pacific Investments Limited (FPIL-Liberia). Anthoni Salim, Chairman of
the Company, beneficially owns the entire issued share capital of ACFL and, accordingly, is taken to be interested in the shares
owned by ACFL.
(c) FPIL-Liberia, which was incorporated in the Republic of Liberia, beneficially owned 790,229,364 ordinary shares at 31
December 2017, representing approximately 18.20% of the Company’s issued share capital at that date. FPIL-Liberia is owned
by Salerni, ACFL, Anthoni Salim (Chairman of the Company), Tedy Djuhar (a Non-executive Director of the Company), Sutanto
Djuhar (a former Non-executive Director of the Company) and a company controlled by the estate of the late Ibrahim Risjad (a
former Non-executive Director of the Company), in the proportion specified in note (i) of the table on page 116. Anthoni Salim,
Chairman of the Company, is taken to be interested in the shares owned by FPIL-Liberia.
118 First Pacific Annual Report 2017
Statutory Reports
(d) FPIL-BVI, which was incorporated in the British Virgin Islands, beneficially owned 633,186,599 ordinary shares at 31 December
2017, representing approximately 14.58% of the Company’s issued share capital at that date. Anthoni Salim, Chairman of the
Company, indirectly owns the entire issued share capital of FPIL-BVI and, accordingly, is taken to be interested in the shares
owned by FPIL-BVI.
(e) Lazard Asset Management LLC (Lazard), a United States incorporated company, notified the Company that it held 249,258,361
ordinary shares of the Company as at 1 September 2017, representing approximately 5.74% of the Company’s issued share
capital at that date. At 31 December 2017, the Company has not received any other notification from Lazard of any change to
such holding.
(f) Brandes Investment Partners L.P. (Brandes), a United States incorporated company, notified the Company that it held
286,584,541 ordinary shares of the Company as at 28 September 2017, representing approximately 6.60% of the Company’s
issued share capital at that date. At 31 December 2017, the Company has not received any other notification from Brandes of
any change to such holding.
Other than as disclosed above, the Company had not been notified of any person (other than Directors or chief executive of the
Company) at 31 December 2017 who had an interest or short position in the shares or underlying shares of the Company to be
recorded in the register required to be kept under Section 336 of Part XV of the SFO.
Transactions, Arrangements or Contracts of SignificanceExcept for the related party transactions set out in Note 38 to the Consolidated Financial Statements, there were no transactions,
arrangements or contracts of significance in relation to the Company’s business to which the Company or its subsidiary companies
were parties, and in which a Director of the Company had a material interest, whether directly or indirectly, subsisted at the end of the
year or at any time during the year.
None of the Directors nor a connected entity of a Director had any direct or indirect interest in any assets which have been acquired,
disposed of by, or leased to, or are proposed to be acquired or disposed of by, or leased to the Company or any of its subsidiary
companies at the end of the year or at any time during the year.
Directors’ Rights to Acquire Shares or DebenturesApart from as disclosed under the heading “Interests of Directors in the Company and its Associated Corporations” above, “Shares
Held for Share Award Scheme” and “Share Options” in Notes 30 and 37(D)(a) to the Consolidated Financial Statements, at no
time during the year was the Company or any of its subsidiary companies a party to any arrangement to enable the Directors of the
Company to acquire benefits by means of the acquisition of shares in, or debentures of, the Company or any other body corporate and
none of the Directors of the Company or their spouses or minor children had any right to subscribe for securities of the Company, or
had exercised any such right during the year.
Summary Financial InformationA summary of the published results, assets, liabilities and non-controlling interests, and various information and financial ratios of the
Company and the Group for the last ten financial years, as extracted from the audited Consolidated Financial Statements and restated/
reclassified as appropriate, is set out on pages 2 and 3. This summary does not form part of the audited Consolidated Financial
Statements.
Major Customers and SuppliersIn 2017, sales to the Group’s five largest customers accounted for less than 30% of the total sales for the year, whereas purchases
from the Group’s five largest suppliers accounted for 34% (2016: 33%) of the total purchases for the year of which purchases from
the largest supplier included therein accounted for 22% (2016: 27%) of the total purchases.
119 First Pacific Annual Report 2017
Continuing Connected Transactions and Connected TransactionsContinuing connected transactions and connected transactions required to be disclosed in accordance with Chapter 14A of the Listing
Rules, are disclosed in the Corporate Governance Report on pages 81 to 95.
Sufficiency of Public FloatBased on information that is publicly available to the Company and within the knowledge of the Directors, at least 25% of the
Company’s total number of issued shares were held by the public at both 31 December 2017 and the date of this report.
Directors’ and Officers’ Liability InsuranceDuring the year, the Company has maintained appropriate Directors’ and officers’ liability insurance for all Directors and officers of the
Company and its related companies, save in those instances where individual companies have maintained their own coverage.
Employment PolicyThe Company has a policy of non-discrimination in respect of the age, religion, gender, race, disability or marital status of employees
and prospective employees. This ensures that individuals are treated equally, given their skills and abilities, in terms of career
development and opportunities for advancement.
AuditorErnst & Young retire and a resolution for their reappointment as auditor of the Company will be proposed at the forthcoming AGM.
On behalf of the Board of Directors
Nancy L.M. LiCompany Secretary
Hong Kong
20 March 2018
120 First Pacific Annual Report 2017
Independent Auditor’s Report
TO THE MEMBERS OF FIRST PACIFIC COMPANY LIMITED(Incorporated in Bermuda with limited liability)
OpinionWe have audited the consolidated financial statements of First Pacific Company Limited (the “Company”) and its subsidiaries (the
“Group”) set out on pages 124 to 245, which comprise the consolidated statement of financial position as at 31 December 2017, and
the consolidated income statement, the consolidated statement of comprehensive income, the consolidated statement of changes
in equity and the consolidated statement of cash flows for the year then ended, and notes to the consolidated financial statements,
including a summary of significant accounting policies.
In our opinion, the consolidated financial statements give a true and fair view of the consolidated financial position of the Group
as at 31 December 2017, and of its consolidated financial performance and its consolidated cash flows for the year then ended
in accordance with Hong Kong Financial Reporting Standards (“HKFRSs”) issued by the Hong Kong Institute of Certified Public
Accountants (“HKICPA”) and have been properly prepared in compliance with the disclosure requirements of the Hong Kong
Companies Ordinance.
Basis for OpinionWe conducted our audit in accordance with Hong Kong Standards on Auditing (“HKSAs”) issued by the HKICPA. Our responsibilities
under those standards are further described in the Auditor’s responsibilities for the audit of the consolidated financial statements
section of our report. We are independent of the Group in accordance with the HKICPA’s Code of Ethics for Professional Accountants (the “Code”), and we have fulfilled our other ethical responsibilities in accordance with the Code. We believe that the audit evidence
we have obtained is sufficient and appropriate to provide a basis for our opinion.
Key Audit MattersKey audit matters are those matters that, in our professional judgment, were of most significance in our audit of the consolidated
financial statements of the current period. These matters were addressed in the context of our audit of the consolidated financial
statements as a whole, and in forming our opinion thereon, and we do not provide a separate opinion on these matters. For each
matter below, our description of how our audit addressed the matter is provided in that context.
We have fulfilled the responsibilities described in the Auditor’s responsibilities for the audit of the consolidated financial statements section of our report, including in relation to these matters. Accordingly, our audit included the performance of procedures designed
to respond to our assessment of the risks of material misstatement of the consolidated financial statements. The results of our
audit procedures, including the procedures performed to address the matters below, provide the basis for our audit opinion on the
accompanying consolidated financial statements.
121 First Pacific Annual Report 2017
Independent Auditor’s Report (continued)
Key audit matter How our audit addressed the key audit matter
Impairment assessment of goodwill, intangible assets with indefinite useful life and concession assets not yet available for use (collectively, the “Intangible Assets”)
The Intangible Assets and their carrying amounts were allocated
to the Group’s respective cash-generating units (“CGUs”) for
impairment testing. Impairment was determined by assessing the
recoverable amount of the CGU to which each of the Intangible
Assets relates and whether the recoverable amount of the CGU
was less than the carrying amount. For the year under review, the
recoverable amounts of respective CGUs have been determined
based on value-in-use calculations using cash flow projections
specific to each CGU and applying discount rates which reflected
specific risks relating to the relevant CGUs.
The impairment testing of the Intangible Assets required
management to make significant assumptions and estimates that
would affect the reported amounts of the Intangible Assets and
related disclosures in the consolidated financial statements.
Related disclosures are included in Notes 3, 15 and 16 to the
consolidated financial statements.
We evaluated management’s assessment of impairment of the
Intangible Assets. Our audit procedures included evaluating
the methodologies, assumptions and estimates used by the
Group. In particular, for each relevant CGU, we assessed the
historical accuracy of the prior years’ assumptions and estimates,
and obtained an understanding of the current and expected
future developments of the Group and its environment. Certain
key assumptions, including discount rate, expected market
development and long term growth rates, were assessed with
the assistance from our valuation experts with relevant expertise
and with external information sources. We also evaluated the
management’s assessment about the reasonably possible
change in the relevant key assumptions.
Amortization of concession assets using unit-of-production method
The concession assets of the Group which were amortized using
the unit-of-production method were related to toll roads and
certain water distribution businesses. The amortization of toll road
concession assets was based on the ratio of actual traffic volume
to the total expected traffic volume of the underlying toll roads
over the remaining concession period, while the amortization of
the water distribution concession assets was based on actual
billed volume over the estimated billable water volume for the
period over which the concession agreement was in force.
The amortization method required management to make
significant estimates on the total expected volume of traffic
and total volume of billable water over the period for which the
corresponding concession assets were in force. These estimates
affected the reported amount of amortization expenses and
related disclosures in the consolidated financial statements.
Related disclosures are included in Notes 3 and 16 to the
consolidated financial statements.
We evaluated management’s schedule of amortization of
concession assets and related assumptions and estimates used
by the Group with reference to industry data and information
related to the estimated total traffic, billable water volume,
historical traffic and billed water volume. We also evaluated
the competence and objectivity of management’s specialists
who estimated the forecasted volumes. We recalculated the
amortization expense for the year and the amount of the
concession assets as of year-end based on the estimated
billable water volume and traffic volume.
122 First Pacific Annual Report 2017
Statutory Reports
Independent Auditor’s Report (continued)
Other Information included in the Annual ReportThe directors of the Company are responsible for the other information. The other information comprises the information included in
the Annual Report, other than the consolidated financial statements and our auditor’s report thereon.
Our opinion on the consolidated financial statements does not cover the other information and we do not express any form of assurance
conclusion thereon.
In connection with our audit of the consolidated financial statements, our responsibility is to read the other information and, in doing
so, consider whether the other information is materially inconsistent with the consolidated financial statements or our knowledge
obtained in the audit or otherwise appears to be materially misstated. If, based on the work we have performed, we conclude that there is
a material misstatement of this other information, we are required to report that fact. We have nothing to report in this regard.
Responsibilities of the Directors for the Consolidated Financial StatementsThe directors of the Company are responsible for the preparation of the consolidated financial statements that give a true and fair view
in accordance with HKFRSs issued by the HKICPA and the disclosure requirements of the Hong Kong Companies Ordinance, and for
such internal control as the directors determine is necessary to enable the preparation of consolidated financial statements that are
free from material misstatement, whether due to fraud or error.
In preparing the consolidated financial statements, the directors of the Company are responsible for assessing the Group’s ability
to continue as a going concern, disclosing, as applicable, matters related to going concern and using the going concern basis of
accounting unless the directors of the Company either intend to liquidate the Group or to cease operations or have no realistic
alternative but to do so.
The directors of the Company are assisted by the Audit and Risk Management Committee in discharging their responsibilities for
overseeing the Group’s financial reporting process.
Auditor’s Responsibilities for the Audit of the Consolidated Financial StatementsOur objectives are to obtain reasonable assurance about whether the consolidated financial statements as a whole are free from
material misstatement, whether due to fraud or error, and to issue an auditor’s report that includes our opinion. Our report is made
solely to you, as a body, in accordance with section 90 of the Bermuda Companies Act 1981, and for no other purpose. We do not
assume responsibility towards or accept liability to any other person for the contents of this report.
Reasonable assurance is a high level of assurance, but is not a guarantee that an audit conducted in accordance with HKSAs will
always detect a material misstatement when it exists. Misstatements can arise from fraud or error and are considered material if,
individually or in the aggregate, they could reasonably be expected to influence the economic decisions of users taken on the basis of
these consolidated financial statements.
As part of an audit in accordance with HKSAs, we exercise professional judgment and maintain professional scepticism throughout
the audit. We also:
Identify and assess the risks of material misstatement of the consolidated financial statements, whether due to fraud or error,
design and perform audit procedures responsive to those risks, and obtain audit evidence that is sufficient and appropriate to
provide a basis for our opinion. The risk of not detecting a material misstatement resulting from fraud is higher than for one
resulting from error, as fraud may involve collusion, forgery, intentional omissions, misrepresentations, or the override of internal
control.
Obtain an understanding of internal control relevant to the audit in order to design audit procedures that are appropriate in the
circumstances, but not for the purpose of expressing an opinion on the effectiveness of the Group’s internal control.
Evaluate the appropriateness of accounting policies used and the reasonableness of accounting estimates and related disclosures
made by the directors.
123 First Pacific Annual Report 2017
Independent Auditor’s Report (continued)
Conclude on the appropriateness of the directors’ use of the going concern basis of accounting and, based on the audit evidence
obtained, whether a material uncertainty exists related to events or conditions that may cast significant doubt on the Group’s ability
to continue as a going concern. If we conclude that a material uncertainty exists, we are required to draw attention in our auditor’s
report to the related disclosures in the consolidated financial statements or, if such disclosures are inadequate, to modify our
opinion. Our conclusions are based on the audit evidence obtained up to the date of our auditor’s report. However, future events
or conditions may cause the Group to cease to continue as a going concern.
Evaluate the overall presentation, structure and content of the consolidated financial statements, including the disclosures, and
whether the consolidated financial statements represent the underlying transactions and events in a manner that achieves fair
presentation.
Obtain sufficient appropriate audit evidence regarding the financial information of the entities or business activities within the
Group to express an opinion on the consolidated financial statements. We are responsible for the direction, supervision and
performance of the group audit. We remain solely responsible for our audit opinion.
We communicate with the Audit and Risk Management Committee regarding, among other matters, the planned scope and timing of
the audit and significant audit findings, including any significant deficiencies in internal control that we identify during our audit. We
also provide the Audit and Risk Management Committee with a statement that we have complied with relevant ethical requirements
regarding independence and to communicate with them all relationships and other matters that may reasonably be thought to bear on
our independence, and where applicable, related safeguards.
From the matters communicated with the Audit and Risk Management Committee, we determine those matters that were of most
significance in the audit of the consolidated financial statements of the current period and are therefore the key audit matters.
We describe these matters in our auditor’s report unless law or regulation precludes public disclosure about the matter or when,
in extremely rare circumstances, we determine that a matter should not be communicated in our report because the adverse
consequences of doing so would reasonably be expected to outweigh the public interest benefits of such communication.
The engagement partner on the audit resulting in this independent auditor’s report is Catherine Yen Kai Shun.
ERNST & YOUNGCertified Public Accountants
22/F CITIC Tower
1 Tim Mei Avenue
Central, Hong Kong
20 March 2018
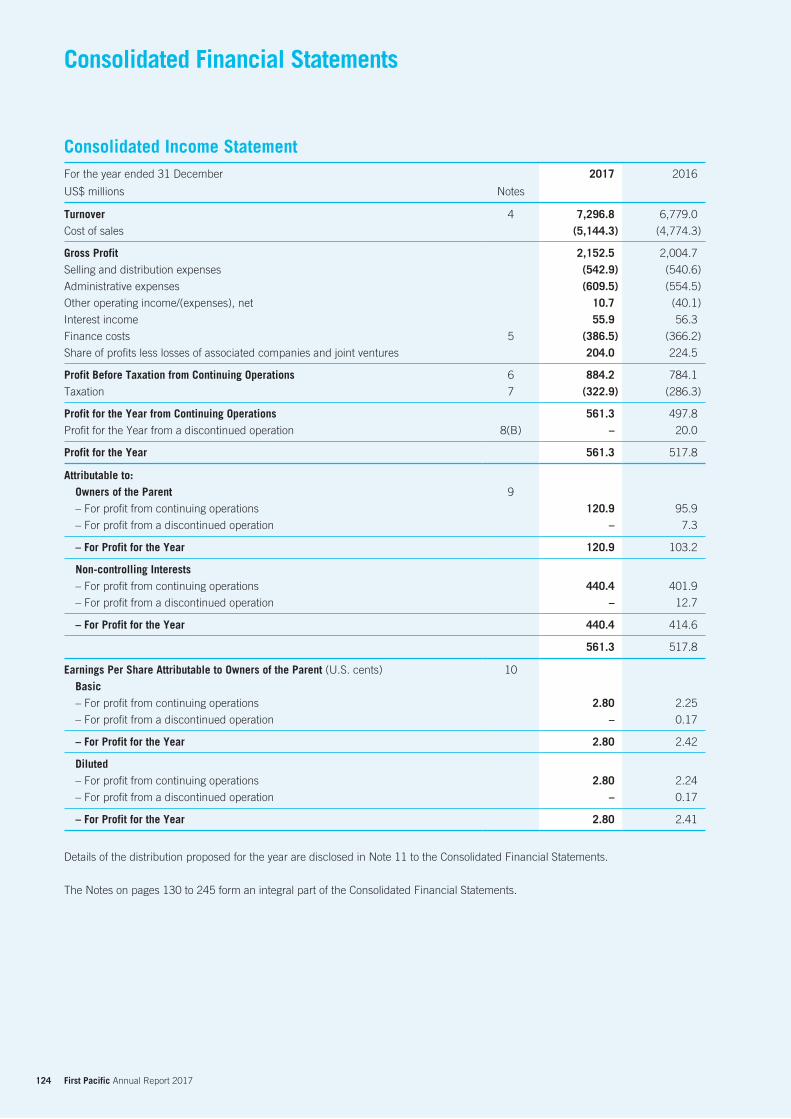
124 First Pacific Annual Report 2017
Consolidated Financial Statements
Consolidated Income StatementFor the year ended 31 December 2017 2016
US$ millions Notes
Turnover 4 7,296.8 6,779.0
Cost of sales (5,144.3) (4,774.3)
Gross Profit 2,152.5 2,004.7
Selling and distribution expenses (542.9) (540.6)
Administrative expenses (609.5) (554.5)
Other operating income/(expenses), net 10.7 (40.1)
Interest income 55.9 56.3
Finance costs 5 (386.5) (366.2)
Share of profits less losses of associated companies and joint ventures 204.0 224.5
Profit Before Taxation from Continuing Operations 6 884.2 784.1
Taxation 7 (322.9) (286.3)
Profit for the Year from Continuing Operations 561.3 497.8
Profit for the Year from a discontinued operation 8(B) – 20.0
Profit for the Year 561.3 517.8
Attributable to:Owners of the Parent 9
– For profit from continuing operations 120.9 95.9
– For profit from a discontinued operation – 7.3
– For Profit for the Year 120.9 103.2
Non-controlling Interests– For profit from continuing operations 440.4 401.9
– For profit from a discontinued operation – 12.7
– For Profit for the Year 440.4 414.6
561.3 517.8
Earnings Per Share Attributable to Owners of the Parent (U.S. cents) 10
Basic – For profit from continuing operations 2.80 2.25
– For profit from a discontinued operation – 0.17
– For Profit for the Year 2.80 2.42
Diluted– For profit from continuing operations 2.80 2.24
– For profit from a discontinued operation – 0.17
– For Profit for the Year 2.80 2.41
Details of the distribution proposed for the year are disclosed in Note 11 to the Consolidated Financial Statements.
The Notes on pages 130 to 245 form an integral part of the Consolidated Financial Statements.
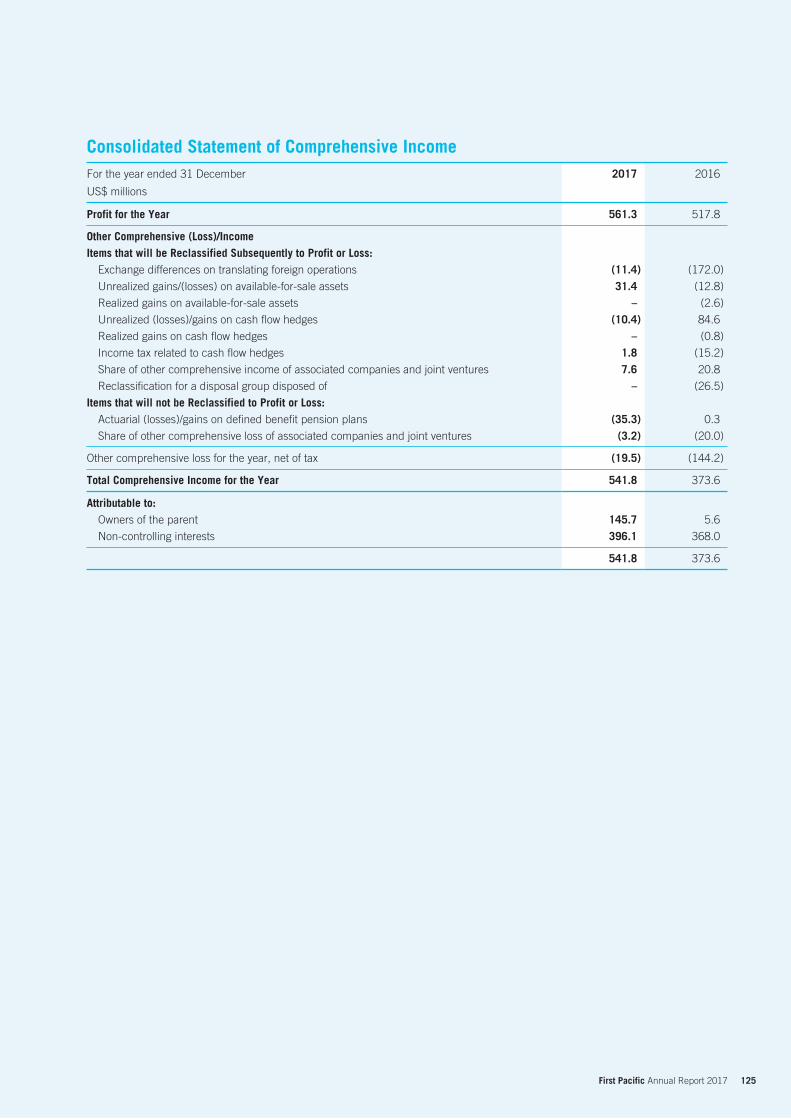
125 First Pacific Annual Report 2017
Consolidated Statement of Comprehensive IncomeFor the year ended 31 December 2017 2016
US$ millions
Profit for the Year 561.3 517.8
Other Comprehensive (Loss)/IncomeItems that will be Reclassified Subsequently to Profit or Loss:
Exchange differences on translating foreign operations (11.4) (172.0)
Unrealized gains/(losses) on available-for-sale assets 31.4 (12.8)
Realized gains on available-for-sale assets – (2.6)
Unrealized (losses)/gains on cash flow hedges (10.4) 84.6
Realized gains on cash flow hedges – (0.8)
Income tax related to cash flow hedges 1.8 (15.2)
Share of other comprehensive income of associated companies and joint ventures 7.6 20.8
Reclassification for a disposal group disposed of – (26.5)
Items that will not be Reclassified to Profit or Loss:Actuarial (losses)/gains on defined benefit pension plans (35.3) 0.3
Share of other comprehensive loss of associated companies and joint ventures (3.2) (20.0)
Other comprehensive loss for the year, net of tax (19.5) (144.2)
Total Comprehensive Income for the Year 541.8 373.6
Attributable to:Owners of the parent 145.7 5.6
Non-controlling interests 396.1 368.0
541.8 373.6
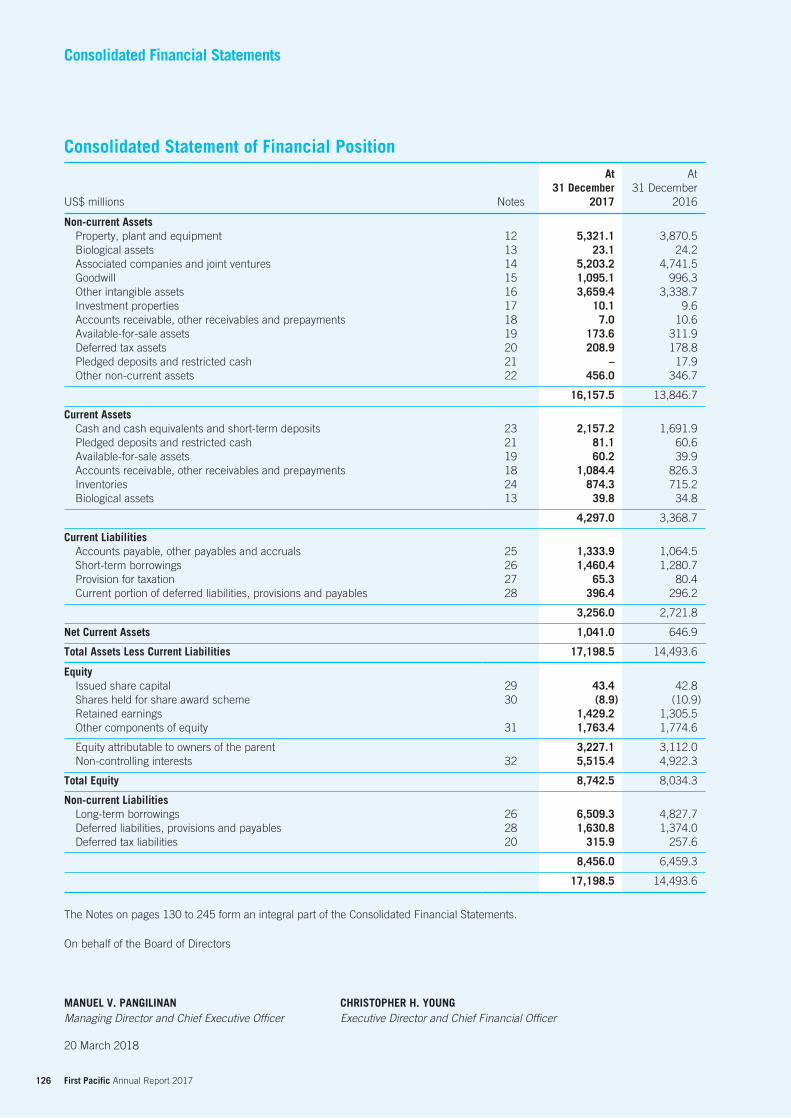
126 First Pacific Annual Report 2017
Consolidated Financial Statements
Consolidated Statement of Financial Position
US$ millions Notes
At 31 December
2017
At 31 December
2016
Non-current AssetsProperty, plant and equipment 12 5,321.1 3,870.5Biological assets 13 23.1 24.2Associated companies and joint ventures 14 5,203.2 4,741.5Goodwill 15 1,095.1 996.3Other intangible assets 16 3,659.4 3,338.7Investment properties 17 10.1 9.6Accounts receivable, other receivables and prepayments 18 7.0 10.6Available-for-sale assets 19 173.6 311.9Deferred tax assets 20 208.9 178.8Pledged deposits and restricted cash 21 – 17.9Other non-current assets 22 456.0 346.7
16,157.5 13,846.7 Current Assets
Cash and cash equivalents and short-term deposits 23 2,157.2 1,691.9Pledged deposits and restricted cash 21 81.1 60.6Available-for-sale assets 19 60.2 39.9Accounts receivable, other receivables and prepayments 18 1,084.4 826.3Inventories 24 874.3 715.2Biological assets 13 39.8 34.8
4,297.0 3,368.7 Current Liabilities
Accounts payable, other payables and accruals 25 1,333.9 1,064.5Short-term borrowings 26 1,460.4 1,280.7Provision for taxation 27 65.3 80.4Current portion of deferred liabilities, provisions and payables 28 396.4 296.2
3,256.0 2,721.8 Net Current Assets 1,041.0 646.9 Total Assets Less Current Liabilities 17,198.5 14,493.6 Equity
Issued share capital 29 43.4 42.8Shares held for share award scheme 30 (8.9) (10.9)Retained earnings 1,429.2 1,305.5Other components of equity 31 1,763.4 1,774.6 Equity attributable to owners of the parent 3,227.1 3,112.0Non-controlling interests 32 5,515.4 4,922.3
Total Equity 8,742.5 8,034.3 Non-current Liabilities
Long-term borrowings 26 6,509.3 4,827.7Deferred liabilities, provisions and payables 28 1,630.8 1,374.0Deferred tax liabilities 20 315.9 257.6
8,456.0 6,459.3 17,198.5 14,493.6
The Notes on pages 130 to 245 form an integral part of the Consolidated Financial Statements.
On behalf of the Board of Directors
MANUEL V. PANGILINAN CHRISTOPHER H. YOUNGManaging Director and Chief Executive Officer Executive Director and Chief Financial Officer
20 March 2018
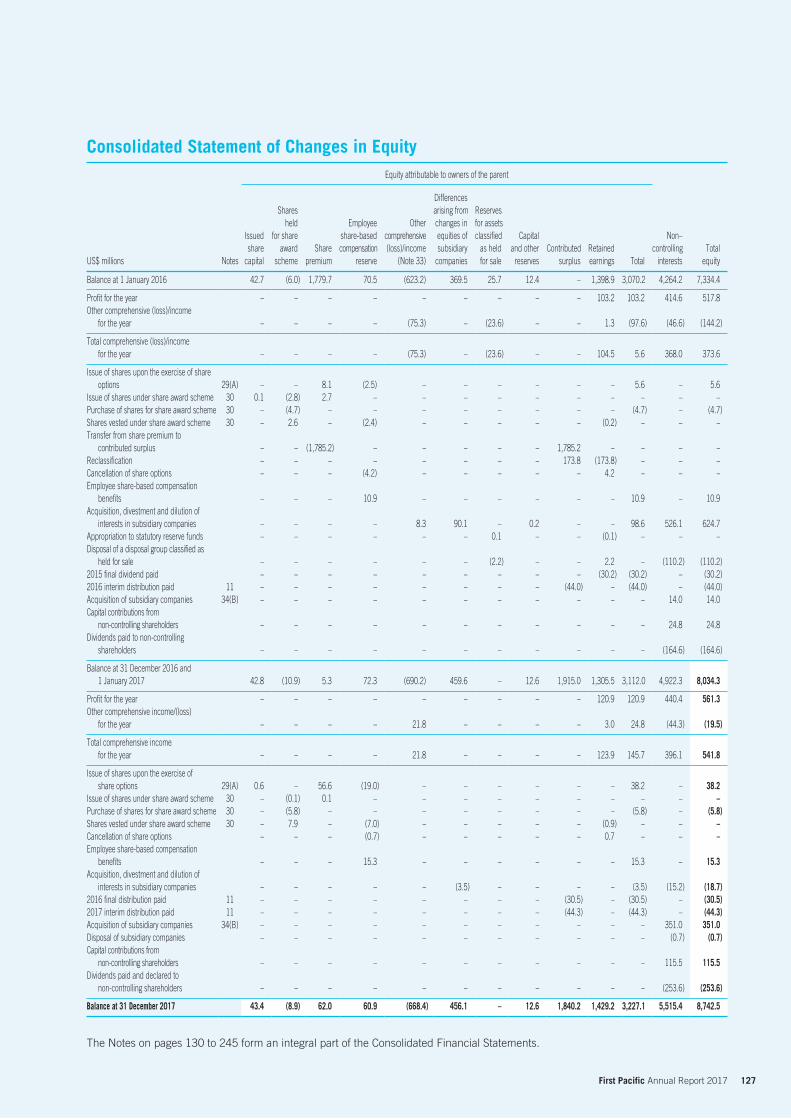
127 First Pacific Annual Report 2017
Consolidated Statement of Changes in EquityEquity attributable to owners of the parent
US$ millions Notes
Issuedshare
capital
Sharesheld
for shareaward
schemeShare
premium
Employeeshare-basedcompensation
reserve
Othercomprehensive(loss)/income
(Note 33)
Differencesarising fromchanges inequities ofsubsidiary
companies
Reservesfor assetsclassified
as heldfor sale
Capitaland other
reservesContributed
surplusRetainedearnings Total
Non–controlling
interestsTotal
equity
Balance at 1 January 2016 42.7 (6.0) 1,779.7 70.5 (623.2) 369.5 25.7 12.4 – 1,398.9 3,070.2 4,264.2 7,334.4 Profit for the year – – – – – – – – – 103.2 103.2 414.6 517.8Other comprehensive (loss)/income
for the year – – – – (75.3) – (23.6) – – 1.3 (97.6) (46.6) (144.2) Total comprehensive (loss)/income
for the year – – – – (75.3) – (23.6) – – 104.5 5.6 368.0 373.6 Issue of shares upon the exercise of share
options 29(A) – – 8.1 (2.5) – – – – – – 5.6 – 5.6Issue of shares under share award scheme 30 0.1 (2.8) 2.7 – – – – – – – – – –Purchase of shares for share award scheme 30 – (4.7) – – – – – – – – (4.7) – (4.7)Shares vested under share award scheme 30 – 2.6 – (2.4) – – – – – (0.2) – – –Transfer from share premium to
contributed surplus – – (1,785.2) – – – – – 1,785.2 – – – –Reclassification – – – – – – – – 173.8 (173.8) – – –Cancellation of share options – – – (4.2) – – – – – 4.2 – – –Employee share-based compensation
benefits – – – 10.9 – – – – – – 10.9 – 10.9Acquisition, divestment and dilution of
interests in subsidiary companies – – – – 8.3 90.1 – 0.2 – – 98.6 526.1 624.7Appropriation to statutory reserve funds – – – – – – 0.1 – – (0.1) – – –Disposal of a disposal group classified as
held for sale – – – – – – (2.2) – – 2.2 – (110.2) (110.2)2015 final dividend paid – – – – – – – – – (30.2) (30.2) – (30.2)2016 interim distribution paid 11 – – – – – – – – (44.0) – (44.0) – (44.0)Acquisition of subsidiary companies 34(B) – – – – – – – – – – – 14.0 14.0Capital contributions from
non-controlling shareholders – – – – – – – – – – – 24.8 24.8Dividends paid to non-controlling
shareholders – – – – – – – – – – – (164.6) (164.6) Balance at 31 December 2016 and
1 January 2017 42.8 (10.9) 5.3 72.3 (690.2) 459.6 – 12.6 1,915.0 1,305.5 3,112.0 4,922.3 8,034.3 Profit for the year – – – – – – – – – 120.9 120.9 440.4 561.3Other comprehensive income/(loss)
for the year – – – – 21.8 – – – – 3.0 24.8 (44.3) (19.5) Total comprehensive income
for the year – – – – 21.8 – – – – 123.9 145.7 396.1 541.8 Issue of shares upon the exercise of
share options 29(A) 0.6 – 56.6 (19.0) – – – – – – 38.2 – 38.2Issue of shares under share award scheme 30 – (0.1) 0.1 – – – – – – – – – –Purchase of shares for share award scheme 30 – (5.8) – – – – – – – – (5.8) – (5.8)Shares vested under share award scheme 30 – 7.9 – (7.0) – – – – – (0.9) – – –Cancellation of share options – – – (0.7) – – – – – 0.7 – – –Employee share-based compensation
benefits – – – 15.3 – – – – – – 15.3 – 15.3Acquisition, divestment and dilution of
interests in subsidiary companies – – – – – (3.5) – – – – (3.5) (15.2) (18.7)2016 final distribution paid 11 – – – – – – – – (30.5) – (30.5) – (30.5)2017 interim distribution paid 11 – – – – – – – – (44.3) – (44.3) – (44.3)Acquisition of subsidiary companies 34(B) – – – – – – – – – – – 351.0 351.0Disposal of subsidiary companies – – – – – – – – – – – (0.7) (0.7)Capital contributions from
non-controlling shareholders – – – – – – – – – – – 115.5 115.5Dividends paid and declared to
non-controlling shareholders – – – – – – – – – – – (253.6) (253.6) Balance at 31 December 2017 43.4 (8.9) 62.0 60.9 (668.4) 456.1 – 12.6 1,840.2 1,429.2 3,227.1 5,515.4 8,742.5
The Notes on pages 130 to 245 form an integral part of the Consolidated Financial Statements.
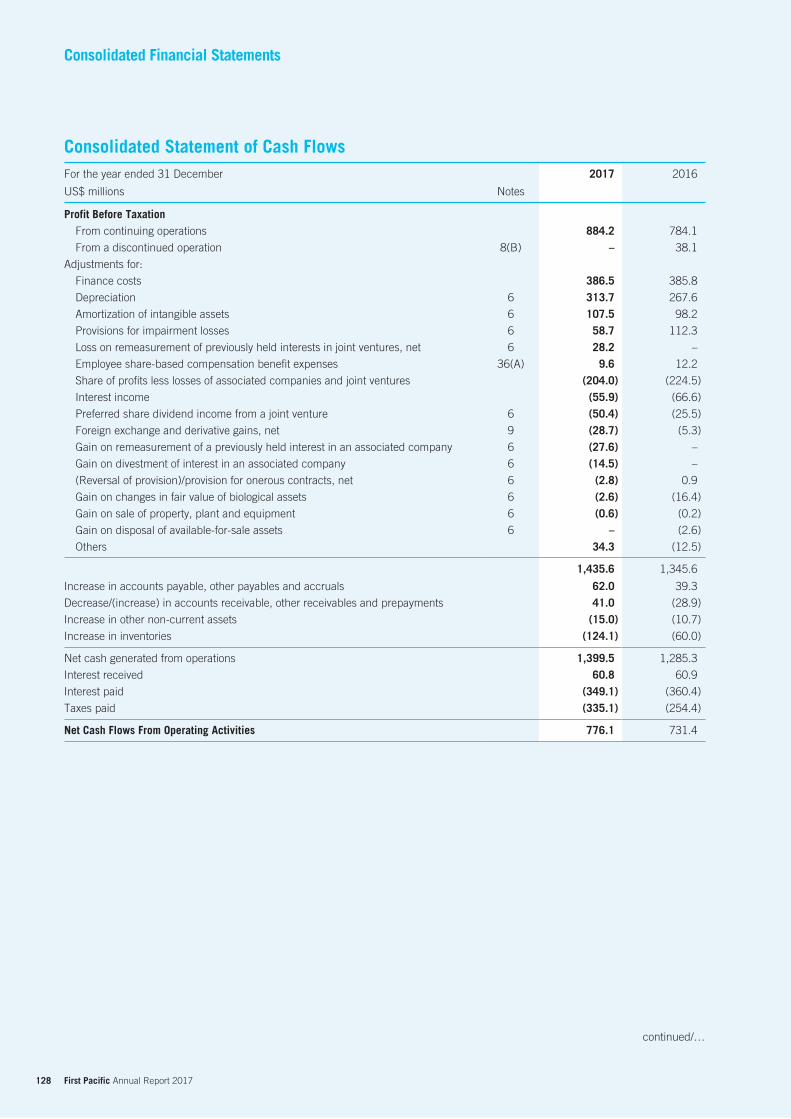
128 First Pacific Annual Report 2017
Consolidated Financial Statements
Consolidated Statement of Cash FlowsFor the year ended 31 December 2017 2016
US$ millions Notes
Profit Before TaxationFrom continuing operations 884.2 784.1
From a discontinued operation 8(B) – 38.1
Adjustments for:
Finance costs 386.5 385.8
Depreciation 6 313.7 267.6
Amortization of intangible assets 6 107.5 98.2
Provisions for impairment losses 6 58.7 112.3
Loss on remeasurement of previously held interests in joint ventures, net 6 28.2 –
Employee share-based compensation benefit expenses 36(A) 9.6 12.2
Share of profits less losses of associated companies and joint ventures (204.0) (224.5)
Interest income (55.9) (66.6)
Preferred share dividend income from a joint venture 6 (50.4) (25.5)
Foreign exchange and derivative gains, net 9 (28.7) (5.3)
Gain on remeasurement of a previously held interest in an associated company 6 (27.6) –
Gain on divestment of interest in an associated company 6 (14.5) –
(Reversal of provision)/provision for onerous contracts, net 6 (2.8) 0.9
Gain on changes in fair value of biological assets 6 (2.6) (16.4)
Gain on sale of property, plant and equipment 6 (0.6) (0.2)
Gain on disposal of available-for-sale assets 6 – (2.6)
Others 34.3 (12.5)
1,435.6 1,345.6
Increase in accounts payable, other payables and accruals 62.0 39.3
Decrease/(increase) in accounts receivable, other receivables and prepayments 41.0 (28.9)
Increase in other non-current assets (15.0) (10.7)
Increase in inventories (124.1) (60.0)
Net cash generated from operations 1,399.5 1,285.3
Interest received 60.8 60.9
Interest paid (349.1) (360.4)
Taxes paid (335.1) (254.4)
Net Cash Flows From Operating Activities 776.1 731.4
continued/…
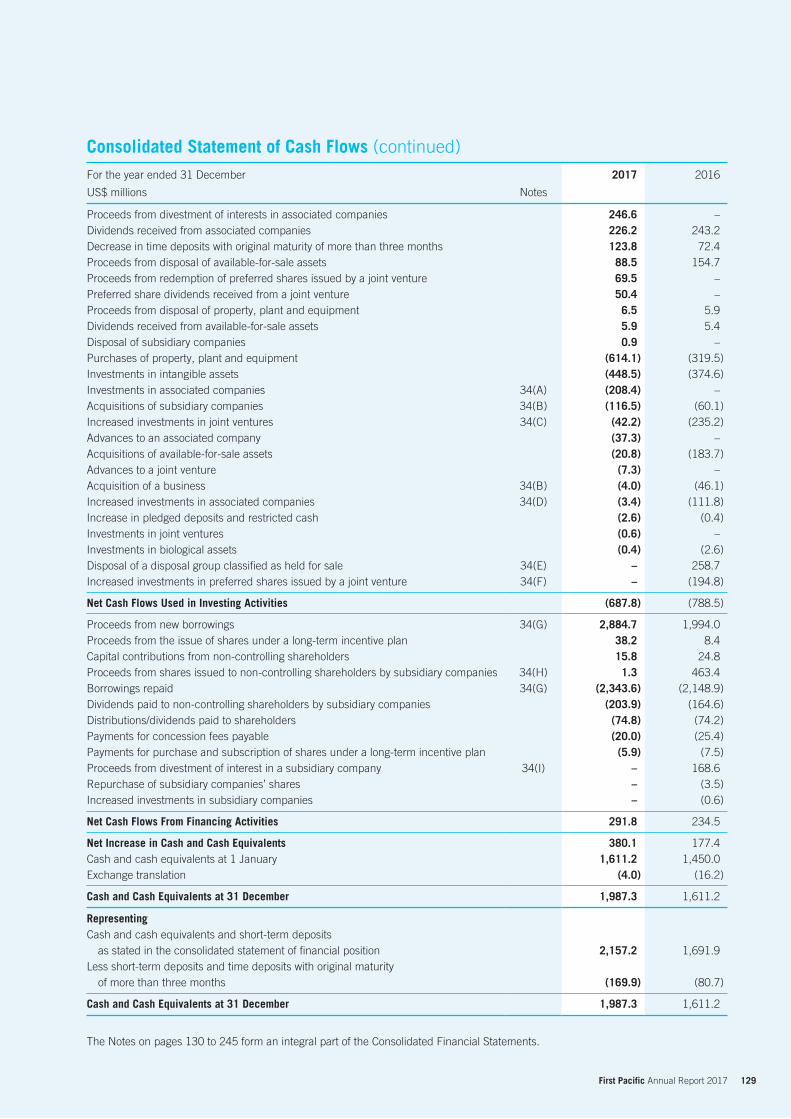
129 First Pacific Annual Report 2017
For the year ended 31 December 2017 2016
US$ millions Notes
Proceeds from divestment of interests in associated companies 246.6 –Dividends received from associated companies 226.2 243.2Decrease in time deposits with original maturity of more than three months 123.8 72.4Proceeds from disposal of available-for-sale assets 88.5 154.7Proceeds from redemption of preferred shares issued by a joint venture 69.5 –Preferred share dividends received from a joint venture 50.4 –Proceeds from disposal of property, plant and equipment 6.5 5.9Dividends received from available-for-sale assets 5.9 5.4Disposal of subsidiary companies 0.9 –Purchases of property, plant and equipment (614.1) (319.5)Investments in intangible assets (448.5) (374.6)Investments in associated companies 34(A) (208.4) –Acquisitions of subsidiary companies 34(B) (116.5) (60.1)Increased investments in joint ventures 34(C) (42.2) (235.2)Advances to an associated company (37.3) –Acquisitions of available-for-sale assets (20.8) (183.7)Advances to a joint venture (7.3) –Acquisition of a business 34(B) (4.0) (46.1)Increased investments in associated companies 34(D) (3.4) (111.8)Increase in pledged deposits and restricted cash (2.6) (0.4)Investments in joint ventures (0.6) –Investments in biological assets (0.4) (2.6)Disposal of a disposal group classified as held for sale 34(E) – 258.7Increased investments in preferred shares issued by a joint venture 34(F) – (194.8) Net Cash Flows Used in Investing Activities (687.8) (788.5) Proceeds from new borrowings 34(G) 2,884.7 1,994.0Proceeds from the issue of shares under a long-term incentive plan 38.2 8.4Capital contributions from non-controlling shareholders 15.8 24.8Proceeds from shares issued to non-controlling shareholders by subsidiary companies 34(H) 1.3 463.4Borrowings repaid 34(G) (2,343.6) (2,148.9)Dividends paid to non-controlling shareholders by subsidiary companies (203.9) (164.6)Distributions/dividends paid to shareholders (74.8) (74.2)Payments for concession fees payable (20.0) (25.4)Payments for purchase and subscription of shares under a long-term incentive plan (5.9) (7.5)Proceeds from divestment of interest in a subsidiary company 34(I) – 168.6Repurchase of subsidiary companies’ shares – (3.5)Increased investments in subsidiary companies – (0.6) Net Cash Flows From Financing Activities 291.8 234.5 Net Increase in Cash and Cash Equivalents 380.1 177.4Cash and cash equivalents at 1 January 1,611.2 1,450.0Exchange translation (4.0) (16.2) Cash and Cash Equivalents at 31 December 1,987.3 1,611.2 RepresentingCash and cash equivalents and short-term deposits
as stated in the consolidated statement of financial position 2,157.2 1,691.9Less short-term deposits and time deposits with original maturity
of more than three months (169.9) (80.7) Cash and Cash Equivalents at 31 December 1,987.3 1,611.2
The Notes on pages 130 to 245 form an integral part of the Consolidated Financial Statements.
Consolidated Statement of Cash Flows (continued)
130 First Pacific Annual Report 2017
Notes to the Consolidated Financial Statements
1. Corporate and Group InformationFirst Pacific Company Limited is a Hong Kong-based investment management and holding company with operations located in
Asia-Pacific. Its principal business interests relate to consumer food products, telecommunications, infrastructure and natural
resources.
The Company is a limited liability company incorporated in Bermuda. The address of its registered office is Canon’s Court,
22 Victoria Street, Hamilton HM12, Bermuda.
The Company’s ordinary shares are listed on the SEHK. Its shares are also available for trading in the United States through
ADRs (Level 1).
The Group comprises the Company and its subsidiary companies. Details of the principal subsidiary companies of the Company
which, in the opinion of the Directors, materially affect the results or net assets of the Group, are set out on pages 250 to 251.
2. Basis of Preparation and Summary of Principal Accounting Policies(A) Basis of Preparation
The Consolidated Financial Statements have been prepared in accordance with HKFRSs (which include all HKFRSs,
HKASs and HK(IFRIC)-Ints) issued by the HKICPA, Hong Kong GAAP and the disclosure requirements of the Hong Kong
Companies Ordinance. The Consolidated Financial Statements have been prepared under the historical cost convention
except for biological assets, investment properties, certain available-for-sale assets, derivative financial instruments and
pension scheme assets which, as disclosed in the accounting policies below, are stated at fair value. These Consolidated
Financial Statements are presented in United States dollars (US$) and all values are rounded to the nearest million (US$
millions) with one decimal place except when otherwise indicated.
(B) Impact of Revised HKFRSsDuring 2017, the Group has adopted the following revised HKFRSs effective for annual periods commencing on or after
1 January 2017 issued by the HKICPA:
HKAS 7 Amendments “Disclosure Initiative”
HKAS 12 Amendments “Recognition of Deferred Tax Assets for Unrealised Losses”
Annual Improvements to HKFRSs 2014-2016 HKFRS 12 Amendments “Disclosure of Interests in Other Entities”
The Group’s adoption of the above pronouncements has had no effect on both the profit attributable to owners of the parent
for the years ended 31 December 2017 and 2016 and the equity attributable to owners of the parent at 31 December 2017
and 31 December 2016. However, additional disclosure has been included in Note 34(G) to the Consolidated Financial
Statements to satisfy the new disclosure requirements introduced by HKAS 7 Amendments, which require entities to
provide disclosures that enable users of financial statements to evaluate the changes in liabilities arising from financing
activities, including both changes arising from cash flows and non-cash changes.
131 First Pacific Annual Report 2017
(C) Issued But Not Yet Effective HKFRSsThe Group has not applied the following new and revised HKFRSs, that have been issued but are not yet effective, in these
Consolidated Financial Statements.
HKAS 28 Amendments “Long-term Interests in Associates and Joint Ventures”(iii)
HKAS 40 Amendments “Transfers of Investment Property”(i)
HKFRS 2 Amendments “Classification and Measurement of Share-based Payment Transactions”(i)
HKFRS 4 Amendments “Applying HKFRS 9 Financial Instruments with HKFRS 4 Insurance
Contracts”(i)
HKFRS 9 “Financial Instruments”(i)
HKFRS 9 Amendments “Prepayment Features with Negative Compensation”(iii)
HKFRS 10 and HKAS 28 (2011) Amendments “Sale or Contribution of Assets between an Investor and its Associate or
Joint Venture”(ii)
HKFRS 15 “Revenue from Contracts with Customers”(i)
HKFRS 15 Amendments “Clarifications to HKFRS 15 Revenue from Contracts with Customers”(i)
HKFRS 16 “Leases”(iii)
HKFRS 17 “Insurance Contracts”(iv)
HK(IFRIC)-Int 22 “Foreign Currency Transactions and Advance Consideration”(i)
HK(IFRIC)-Int 23 “Uncertainty over Income Tax Treatments”(iii)
Improvement to HKFRSs Annual Improvements to HKFRSs 2014-2016(i)
Improvement to HKFRSs Annual Improvements to HKFRSs 2015-2017(iii)
(i) Effective for annual periods commencing on or after 1 January 2018(ii) No mandatory effective date yet determined but available for adoption(iii) Effective for annual periods commencing on or after 1 January 2019(iv) Effective for annual periods commencing on or after 1 January 2021
Further information about these HKFRSs is as follows:
HKAS 28 Amendments clarify that an entity should account for a long-term interest in an associate or joint venture to which
the equity method is not applied using HKFRS 9.
HKAS 40 Amendments clarify when an entity should transfer property, including property under construction or
development into, or out of investment property. The amendments state that a change in use occurs when the property
meets, or ceases to meet, the definition of investment property and there is evidence of the change in use. A mere change
in management’s intentions for the use of a property does not provide evidence of a change in use. Entities should apply
the amendments prospectively to changes in use that occur on or after the beginning of the annual reporting period in
which the entity first applies the amendments. An entity should reassess the classification of property held at that date and,
if applicable, reclassify property to reflect the conditions that exist at that date.
HKFRS 2 Amendments provide requirements on the accounting for (i) the effects of vesting and non-vesting conditions on
the measurement of cash-settled share-based payments, (ii) the classification of a share-based payment transaction with
net settlement feature for withholding tax obligations and (iii) a modification to the terms and conditions of a share-based
payment that changes the classification of the transaction from cash-settled to equity-settled.
132 First Pacific Annual Report 2017
Notes to the Consolidated Financial Statements
HKFRS 4 Amendments address concerns arising from implementing HKFRS 9 before implementing the forthcoming
insurance contracts standard. The new insurance contacts standard allow entities to choose between the overlay
approach and the deferral approach to deal with the transitional challenges. The overlay approach gives all entities that
issue insurance contracts the option to recognize in other comprehensive income, rather than profit or loss, the volatility
that could arise when HKFRS 9 is applied before the new insurance contracts standard is issued. On the other hand,
the deferral approach gives entities whose activities are predominantly connected with insurance an optional temporary
exemption from applying HKFRS 9 until the earlier of application of the forthcoming insurance contracts standard with
effective from 1 January 2021. The overlay approach and the deferral approach will only be available to an entity if it has
not previously applied HKFRS 9.
HKFRS 9 simplifies the many different rules in HKAS 39 “Financial Instruments: Recognition and Measurement” into a
single approach to determine whether a financial asset is measured at amortized cost or fair value. The approach is based
on how an entity manages its financial instruments (its business model) and the contractual cash flow characteristics of the
financial assets. The standard revises the measurement of financial liabilities designated at fair value through profit or loss
using the fair value option. For these fair value option liabilities, the amount of change in the fair value of a liability that is
attributable to changes in credit risk is required to be presented in other comprehensive income, whereas the remainder
of the change in fair value is required to be presented in profit or loss. The standard changes the requirements for the
calculation of impairment provision of financial assets, adds the requirements related to hedge accounting and made
some related changes to HKFRS 7 “Financial Instruments: Disclosures” and HKAS 39 which include the corresponding
disclosures about risk management activity for applying hedge accounting. The amendments to HKFRS 9 relax the
requirements for assessing hedge effectiveness which result in more risk management strategies being eligible for hedge
accounting. The amendments also allow greater flexibility on the hedged items and relax the rules on using purchased
options and non-derivative financial instruments as hedging instruments. In addition, the amendments to HKFRS 9 allow
an entity to apply only the improved accounting for own credit risk-related fair value gains and losses arising on fair value
option liabilities as introduced in 2010 without applying the other HKFRS 9 requirements concurrently. HKAS 39 is aimed
to be replaced by HKFRS 9 in its entirety. Before this entire replacement, the guidance in HKAS 39 on hedge accounting
and impairment of financial assets continues to apply.
HKFRS 9 Amendments clarify that prepayable financial assets with negative compensation can be measured at amortized
cost or at fair value through other comprehensive income, subjected to the business model of the entity, instead of at fair
value through profit or loss.
HKFRS 10 and HKAS 28 (2011) Amendments address an inconsistency between the requirements in HKFRS 10
“Consolidated Financial Statements” and in HKAS 28 (2011) “Investments in Associates and Joint Ventures” in dealing
with the sale or contribution of assets between an investor and its associate or joint venture. The amendments require a full
recognition of a gain or loss when the sale or contribution of assets between an investor and its associate or joint venture
constitutes a business. For a transaction involving assets that do not constitute a business, a gain or loss resulting from the
transaction is recognized in the investor’s profit or loss only to the extent of the unrelated investor’s interest in that associate
or joint venture. The HKICPA has deferred the effective date of these amendments indefinitely, but an entity that early
adopts the amendments must apply them prospectively.
HKFRS 15 establishes a new five-step model (which includes the steps of identifying the contract(s) with a customer,
identifying the performance obligations in the contract(s), determining the transaction price of the contract(s), allocating
the transaction price to the performance obligations in the contract(s), and recognizing revenue when the entity satisfies
a performance obligation in the contract(s)) that will apply to revenue arising from contracts with customers. Under
HKFRS 15, revenue is recognized at an amount that reflects the consideration to which an entity expects to be entitled in
exchange for transferring goods or services to a customer. The principles in HKFRS 15 provide a more structured approach
for measuring and recognizing revenue. The standard also introduces extensive qualitative and quantitative disclosure
requirements, including disaggregation of total revenue, information about performance obligations, changes in contract
asset and liability account balances between periods and key judgments and estimates. The standard will supersede all
current revenue recognition requirements under HKFRSs. In June 2016, the HKICPA issued amendments to HKFRS 15 to
address the implementation issues on identifying performance obligations, application guidance on principal versus agent
and licences of intellectual property, and transition. The amendments are also intended to help ensure a more consistent
application when entities adopt HKFRS 15 and decrease the cost and complexity of applying the standard.
133 First Pacific Annual Report 2017
HKFRS 16 replaces HKAS 17 “Leases”, HK(IFRIC)-Int 4 “Determining whether an Arrangement contains a Lease”,
HK(SIC)-Int 15 “Operating Leases – Incentives” and HK(SIC)-Int 27 “Evaluating the Substance of Transactions Involving
the Legal Form of a Lease”. The standard sets out the principles for the recognition, measurement, presentation and
disclosure of leases and requires lessees to recognize assets and liabilities for most leases. The standard includes two
elective recognition exemptions for lessees – leases of low-value assets and short-term leases. At the commencement date
of a lease, a lessee recognizes a liability to make lease payments (i.e., the lease liability) and an asset representing the
right to use the underlying asset during the lease term (i.e., the right-of-use asset). The right-of-use asset is subsequently
measured at cost less accumulated depreciation and any impairment losses unless the right-of-use asset meets the
definition of investment property in HKAS 40 “Investment Property”. The lease liability is subsequently increased to reflect
the interest on the lease liability and reduced for the lease payments. Lessees will be required to separately recognize the
interest expense on the lease liability and the depreciation expense on the right-of-use asset. Lessor accounting under
HKFRS 16 is substantially unchanged from the accounting under HKAS 17. Lessors will continue to classify all leases using
the same classification principle as in HKAS 17 and distinguish between operating leases and finance leases.
HKFRS 17 will replace HKFRS 4 “Insurance Contracts” that was issued in 2005. HKFRS 17 applies to all types of
insurance contracts (i.e., life, non-life, direct insurance and re-insurance), regardless of the type of entities that issue them,
as well as to certain guarantees and financial instruments with discretionary participation features. A few scope exceptions
will apply. The overall objective of HKFRS 17 is to provide an accounting model for insurance contracts that is more
useful and consistent for insurers. In contrast to the requirements in HKFRS 4, which are largely based on grandfathering
previous local accounting policies, HKFRS 17 provides a comprehensive model for insurance contracts, covering all
relevant accounting aspects. The core of HKFRS 17 is the general model, supplemented by (i) a specific adaptation
for contracts with direct participation features (the variable fee approach), and (ii) a simplified approach (the premium
allocation approach) mainly for short-duration contracts.
HK(IFRIC)-Int 22 clarifies that, in determining the spot exchange rate to use on initial recognition of the related asset,
expense or income (or part of it) on the derecognition of a non-monetary asset or non-monetary liability relating to advance
consideration, the date of the transaction is the date on which an entity initially recognizes the non-monetary asset or non-
monetary liability arising from the payment or receipt of advance consideration. If there are multiple payments or receipts in
advance, then the entity must determine the transaction date for each payment or receipt of advance consideration.
HK(IFRIC)-Int 23 addresses the accounting for income taxes when tax treatments involve uncertainty that affects the
application of HKAS 12 “Income Taxes” and does not apply to taxes or levies outside the scope of HKAS 12, nor does
it specifically include requirements relating to interest and penalties associated with uncertain tax treatments. The
Interpretation specifically addresses (i) whether an entity considers uncertain tax treatments separately, (ii) the assumptions
an entity makes about the examination of tax treatments by taxation authorities, (iii) how an entity determines taxable profit
(tax loss), tax bases, unused tax losses, unused tax credits and tax rates, and (iv) how an entity considers changes in facts
and circumstances. An entity must determine whether to consider each uncertain tax treatment separately or together with
one or more other uncertain tax treatments. The approach that better predicts the resolution of the uncertainty should be
followed.
“Annual Improvements to HKFRSs 2014-2016” set out amendments to a number of HKFRSs and HKASs, which include
certain changes that may result in accounting changes for presentation, recognition or measurement purpose.
The key amendments of “Annual Improvements to HKFRSs 2014-2016” are summarized as follows:
The HKAS 28 “Investments in Associates and Joint Ventures” amendments clarify that an entity that is a venture capital
organization, or other qualifying entity, may elect, at initial recognition on an investment-by-investment basis, to measure its
investments in associates and joint ventures at fair value through profit or loss. They also clarify that if an entity that is not
itself an investment entity has an interest in an associate or joint venture that is an investment entity, the entity may, when
applying the equity method, elect to retain the fair value measurement applied by that investment entity associate or joint
venture to the investment entity associate’s or joint venture’s interests in subsidiaries. This election is made separately for
each investment entity associate or joint venture, at the later of the date on which (i) the investment entity associate or joint
venture is initially recognized, (ii) the associate or joint venture becomes an investment entity and (iii) the investment entity
associate or joint venture first becomes a parent.
134 First Pacific Annual Report 2017
Notes to the Consolidated Financial Statements
“Annual Improvements to HKFRSs 2015-2017” set out amendments to a number of HKFRSs and HKASs, which include
certain changes that may result in accounting changes for presentation, recognition or measurement purpose.
The key amendments of “Annual Improvements to HKFRSs 2015-2017” are summarized as follows:
The HKAS 12 “Income Taxes” amendments clarify that an entity shall recognize the income tax consequences of dividends
when it recognizes a liability to pay a dividend. The income tax consequences of dividends are linked more directly to
past transactions or events that generated distributable profits than to distributions to owners. Therefore, an entity shall
recognize the income tax consequences of dividends in profit or loss, other comprehensive income or equity according to
where the entity originally recognized those past transactions or events.
The HKAS 23 “Borrowing Costs” amendments clarify to the extent that an entity borrows funds generally and uses
them for the purpose of obtaining a qualifying asset, the entity shall determine the amount of borrowing costs eligible
for capitalization by applying a capitalization rate to the expenditures on that asset. The capitalization rate shall be the
weighted average of the borrowing costs applicable to all borrowings of the entity that are outstanding during the period.
However, an entity shall exclude from this calculation the borrowing costs applicable to borrowings made specifically for the
purpose of obtaining a qualifying asset until substantially all the activities necessary to prepare that asset for its intended use
or sale are complete. The amount of borrowing costs that an entity capitalizes during a period shall not exceed the amount
of borrowing costs it incurred during that period.
The HKFRS 3 “Business Combinations” amendments clarify that when a party to a joint arrangement obtains control of a
business that is a joint operation, and had rights to the assets and obligations for the liabilities relating to that joint operation
immediately before the acquisition date, the transaction is a business combination achieved in stages. The acquirer shall
therefore apply the requirements for a business combination achieved in stages, including remeasuring its previously held
interest in the joint operation.
The HKFRS 11 “Joint Arrangements” amendments clarify that a party that participates in, but does not have joint control
of a joint operation, might obtain joint control of the joint operation in which the activity of the joint operation constitutes a
business. In such cases, previously held interests in the joint operation are not remeasured.
The Group has not early adopted the above new and revised HKFRSs for the year ended 31 December 2017. These new and revised HKFRSs are not expected to have a significant impact on the results of operations and financial position and presentation of the Consolidated Financial Statements, except for the HKFRS 9, HKFRS 15 and HKFRS 16 as described below. Based on the Group’s assessment completed to date, the adoption of these new HKFRSs will have the below effects to the Group in the period of initial application, which may have a significant impact on the results of operations and financial position and presentation of the Consolidated Financial Statements.
The Group’s adoption of HKFRS 9 will have an effect on the classification, measurement of and impairment methodology for its financial assets, but will have no impact on the classification and measurement of its financial liabilities. The adoption may also have an effect on its application of hedge accounting. The Group will adopt HKFRS 9 on 1 January 2018 and will not restate comparative information. During 2017, the Group has assessed the following aspects of HKFRS 9 based on currently available information.
135 First Pacific Annual Report 2017
(a) Classification and measurementHKFRS 9 introduces a new classification and measurement approach for financial assets that reflects the business model in which assets are managed and their cash flow characteristics. HKFRS 9 contains three principal classification categories for financial assets (i) measured at amortized cost, (ii) fair value through other comprehensive income, and (iii) fair value through profit or loss.
The Group’s certain listed equity investments that are currently classified as available-for-sale assets with gains or losses recorded in other comprehensive income will be classified and measured at fair value through profit or loss, which will increase volatility in profit or loss. The Group’s certain unlisted equity investments and convertible notes that are currently classified as available-for-sale assets and measured at cost less impairment provisions will be elected to classify and measure at fair value through other comprehensive income. Other than these changes, the Group does not expect other significant changes on the classification and measurement on the financial assets due to (i) debt securities that are currently classified as available-for-sale assets with gains or losses recorded in other comprehensive income will satisfy the conditions for the classification as fair value through other comprehensive income and hence no change to the accounting policy for these assets, (ii) certain unlisted investments and listed equity investments that are currently classified as available-for-sale assets with gains or losses recorded in other comprehensive income will be elected to be classified and measured at fair value through other comprehensive income. However, the accumulated gains of US$59.9 million as at 31 December 2017 in the available-for-sale assets revaluation reserve and future gains or losses will not be reclassified to the consolidated income statement upon the derecognition of these financial assets, and (iii) loans and receivables currently measured at amortized costs will meet the conditions for continuous classification at amortized cost under HKFRS 9.
(b) ImpairmentThe impairment requirements in HKFRS 9 of applying a new expected credit loss model, which replaces the incurred loss model currently applied. The Group intended to apply the simplified approach and record lifetime expected losses on all trade receivables that do not contain significant financing component. For financial assets that contain significant financing component, such as plasma receivables, the Group expected to apply general approach. Under the general approach, the Group assessed if there are any significant changes in credit risk of these financial assets to determine whether to provide credit losses based on 12-month or lifetime basis. The Group does not expect the impact to be material on the Consolidated Financial Statements.
(c) Hedge accountingHKFRS 9 does not fundamentally change the requirements relating to measuring and recognizing ineffectiveness under HKAS 39 and the Group assessed that its current hedge relationships will continue to qualify as hedges upon the adoption of HKFRS 9 and therefore expects that the accounting for its hedging relationships will not be significantly impacted.
The Group’s adoption of HKFRS 15 will have an effect on its accounting for revenues arising from contracts with customers, which required revenue to be recognized at an amount that reflects the consideration to which the Group expects to be entitled in exchange for transferring goods or services to a customer. The Group intends to adopt HKFRS 15 using the modified retrospective approach with the cumulative effect arising from the transition recognized as an adjustment to the opening balance of equity. Based on currently available information, the Group does not expect the adoption of HKFRS 15 will have a significant impact to the Group’s businesses with the exception of the telecommunications business.
Currently for revenue recognition which involves bundled sales of non-service component and service component, PLDT will allocate the total consideration to each component based on their relative fair value. Revenues from the sale of non-service component are recognized when the goods are delivered while revenues from service component are recognized when the services are provided. When the fair value is not directly observable, the total consideration is allocated using residual method. Under HKFRS 15, the total consideration in multiple-deliverable arrangements will be allocated to each performance obligation based on their stand-alone selling prices. The stand-alone selling prices will be determined based on the list prices at which PLDT sells the non-service component or rending of the service component in separate transactions. Based on the assessment, PLDT will recognize revenue for the service component over time rather than at a point of time. As a result, the Group’s opening balance of retained earnings in 2018 will increase by US$13.2 million with a corresponding increase in the investment in associated companies of US$13.2 million on the consolidated statement of financial position mainly due to PLDT’s early recognition of revenue from non-service component.
136 First Pacific Annual Report 2017
Notes to the Consolidated Financial Statements
In addition, the presentation and disclosure requirements in HKFRS 15 are more detailed than under current HKAS
18. The presentation requirements represent a significant change from current practice and significantly increases
the volume of disclosures required in the Group’s Consolidated Financial Statements. Many of the disclosure
requirements in HKFRS 15 are new and the Group has assessed that the impact of some of them will be significant.
In particular, the Group expects the notes to the Consolidated Financial Statements will be expanded because of the
disclosure of significant judgements made, including (i) when determining the transaction prices of those contracts
that include variable consideration, (ii) how the transaction price has been allocated to the performance obligations
and (iii) the assumptions made to estimate the stand-alone selling prices of each performance obligation.
The Group’s adoption of HKFRS 16 will have an effect on the accounting for its non-cancellable operating lease
commitments. Under HKFRS 16, the leases to which these commitments relate will be required to be recognized
as assets, reflecting the Group’s right to use the underlying assets and liabilities in respect of its obligations to make
lease payments. The Group is currently in the process of assessing the possible impact on the adoption of HKFRS 16
on the required effective date and analyzing the transitional approaches and practical expedients to be elected
on adoption.
(D) Summary of Principal Accounting Policies(a) Basis of consolidation
(I) Basis of consolidationThe Consolidated Financial Statements include the financial statements of the Company and its subsidiary
companies for the year up to 31 December 2017.
A subsidiary company is an entity controlled by the Company. Control exists when the Company has exposure,
or rights, to variable returns from its involvement with the entity and the ability to use its power over the entity
to affect the amount of those returns. When the Company has, directly or indirectly, less than a majority of the
voting or similar rights of an investee, the Group considers all relevant facts and circumstances in assessing
whether it has power over an investee, including: (i) the contractual arrangement with the other vote holders of
the investee, (ii) rights arising from other contractual arrangements, (iii) the Group’s voting rights and potential
voting rights and (iv) other factors which enable the Company to direct the relevant activities of the investee
unilaterally, such as the existence of control, through majority representatives appointed, over the board of
directors of the investee by the Company. Potential voting rights that are substantive (i.e., practically exercisable
by the Company considering all facts and circumstances), where applicable to certain Philippine affiliates of
the Company, are taken into account in determining whether an entity should be consolidated. The Group
reassesses whether or not it controls an investee if facts and circumstances indicate that there are changes in
the elements of control described above.
The results of subsidiary companies are included in the consolidated income statement from the effective
date of acquisition, being the date on which the Group obtains control, or up to the effective date of disposal,
as appropriate. Adjustments are made to bring into line any dissimilar accounting policies that may exist.
All significant intra-group transactions and balances within the Group are eliminated on consolidation. Total
comprehensive losses are attributed to the non-controlling interests even if it results in a deficit balance. Non-
controlling interests represent the interests of non-controlling shareholders not held by the Group in the results
and net position of the Company’s subsidiary companies.
A change in the ownership interest of a subsidiary company, without a change of control, is accounted for as an
equity transaction.
137 First Pacific Annual Report 2017
If the Group loses control over a subsidiary company, it (i) derecognizes the assets (including goodwill) and
liabilities of the former subsidiary company at their carrying amounts, (ii) derecognizes the carrying amount
of any non-controlling interests in the former subsidiary company, (iii) derecognizes the components of other
comprehensive income (e.g., cumulative exchange reserve) recorded in equity attributable to the former
subsidiary company, (iv) recognizes the fair value of the consideration received, (v) recognizes the fair value of
any investment in the former subsidiary company retained, (vi) recognizes any resulting difference as a gain
or loss on disposal in profit or loss, (vii) reclassifies the parent’s share of components of the former subsidiary
company previously recognized in other comprehensive income (except revaluation reserve) to profit or loss,
(viii) transfers the parent’s share of the former subsidiary company’s revaluation reserve previously recognized in
other comprehensive income directly to retained earnings and (ix) transfers the related differences arising from
changes in shareholdings of subsidiary companies without a change of control previously recognized as other
reserves directly to retained earnings.
(II) Business combination and goodwillBusiness combinations are accounted for using the acquisition method of accounting. This method involves
allocating the consideration transferred to the vendor to the fair value of the identifiable assets acquired, and
liabilities and contingent liabilities assumed at the date of acquisition. The consideration transferred is measured
at the aggregate of the fair value of the assets given, equity instruments issued and liabilities incurred or assumed
at the date of exchange. Non-controlling interests in the acquirees (that are present ownership interests and
entitle their holders to a proportionate share of the net assets in the event of liquidation) are measured either at
the non-controlling interests’ proportionate share of the acquirees’ identifiable net assets or at their fair values.
All other components of non-controlling interests are measured at fair values. All acquisition-related costs are
recognized as expenses in profit or loss. Contingent consideration is measured at fair value at the acquisition
date. Contingent consideration classified as an asset or liability is measured at fair value with changes in fair
value recognized in profit or loss. Contingent consideration that is classified as equity is not remeasured and
subsequent settlement is accounted for within equity.
Goodwill is initially measured at cost, being the excess of the aggregate of the consideration transferred, the
amount recognized for non-controlling interests and any fair value of the Group’s previously held equity interests
in the acquiree over the identifiable assets acquired, liabilities and contingent liabilities assumed. If the sum of
this consideration and other items is lower than the fair value of the assets acquired, liabilities and contingent
liabilities assumed, the difference is, after reassessment, recognized in profit or loss as a gain on bargain
purchase. In the case of associated companies and joint ventures, goodwill is included in the carrying amount
thereof, rather than as a separately identified asset in the consolidated statement of financial position.
If the initial accounting for business combination can be determined only provisionally by the end of the period
in which the combination is effected because the fair values to be assigned to the acquiree’s identifiable assets
and liabilities can be determined only provisionally, the Group accounts for the combination using provisional
amounts. During the measurement period, which is no longer than one year from the acquisition date, the
provisional amounts recognized at acquisition date are retrospectively adjusted to reflect new information
obtained about facts and circumstances that existed as of the acquisition date and, if known, would have
affected the measurement of the amounts recognized as of that date. Goodwill or any gain recognized shall be
adjusted from the acquisition date by an amount equal to the adjustment to the fair value at the acquisition date
of the identifiable asset, liability or contingent liability being recognized or adjusted.
Following initial recognition, goodwill is measured at cost less any accumulated impairment losses. Goodwill is
not amortized but reviewed for impairment, annually or more frequently if events or changes in circumstances
indicate that the carrying value may be impaired and its amount will be written down for impairment when it is
considered necessary. Impairment is determined by assessing the recoverable amount of the cash-generating
unit (group of cash-generating units) to which the goodwill relates. Where the recoverable amount of the
cash-generating unit (group of cash-generating units) is less than the carrying amount, an impairment loss is
recognized. A previously recognized impairment loss for goodwill is not reversed.
138 First Pacific Annual Report 2017
Notes to the Consolidated Financial Statements
For step acquisitions, the Group’s previously held equity interests are remeasured at its acquisition date fair
value and any resulting gain or loss is recognized in profit or loss.
For business combinations involving entities or businesses under common control (a business combination
in which all of the combining entities or businesses are ultimately controlled by the same party or parties both
before and after the business combination, and that control is not transitory), they are accounted for applying
the principles of merger accounting which is consistent with Accounting Guideline 5 “Merger Accounting for
Common Control Combinations” issued by the HKICPA. The method requires the combined entity to recognize
the assets, liabilities and equity of the combining entities or businesses at the carrying amounts (i.e., existing
book values from the controlling parties’ perspective) in the Consolidated Financial Statements of the controlling
party or parties prior to the common control combination. There is no recognition of any goodwill or excess of
the acquirer’s interest in the net fair value of the acquiree’s identified assets, liabilities and contingent liabilities
over the cost at the time of the common control combination to the extent of the controlling party’s or parties’
interests.
Where goodwill has been allocated to a cash-generating unit (group of cash-generating units) and part of the
operation within that unit is disposed of, the goodwill associated with the operation disposed of is included in
the carrying amount of the operation when determining the gain or loss on the disposal. Goodwill disposed of in
these circumstances is measured based on the relative value of the operation disposed of and the portion of the
cash-generating unit retained.
(b) Property, plant and equipment(I) Freehold land and other property, plant and equipment
Freehold land is stated at cost and is not depreciated. Other property, plant and equipment, other than
construction in progress, are stated at cost less accumulated depreciation and any impairment losses,
calculated on the straight-line basis at annual rates estimated to write off their book values to residual values
over their expected useful lives. Details of depreciation rates are given as follows.
The principal annual rates of depreciation:
Freehold land Nil
Leasehold land under finance leases Over the lease terms
Buildings 2.5% to 20.0%
Machinery, equipment and vessels 3.3% to 50.0%
Construction in progress Nil
When an item of property, plant and equipment is classified as held for sale or when it is part of a disposal
group classified as held for sale, it is not depreciated and measured at the lower of its carrying amount and fair
value less costs to sell.
The initial cost of property, plant and equipment comprises its purchase price and any costs directly attributable
in bringing the asset to its working condition and location for its intended use. Cost also includes asset
retirement obligations, interest on borrowed funds used during the construction period and qualified finance
costs from foreign exchange losses related to foreign currency denominated liabilities used to acquire such assets.
Major costs incurred in restoring property, plant and equipment to their normal working condition are normally
charged to the consolidated income statement. Where the recognition criteria are satisfied, improvements
are capitalized and depreciated over their expected useful lives to the Group. When assets are sold or retired,
their costs and accumulated depreciation, amortization and impairment losses, if any, are eliminated from the
accounts and any gain or loss resulting from their disposal is included in the consolidated income statement.
139 First Pacific Annual Report 2017
Where parts of an item of property, plant and equipment have different useful lives, the cost of that item is
allocated on a reasonable basis among the parts and each part is depreciated separately. Residual values,
useful lives and the depreciation method are reviewed periodically to ensure that the periods and method of
depreciation are consistent with the expected pattern of economic benefits from items of property, plant and
equipment.
Construction in progress is stated at cost less any impairment losses, and is not depreciated. Cost comprises
the direct costs of construction and capitalized finance and other costs incurred in connection with the
borrowing of funds, including exchange differences arising from foreign currency borrowings, during the period
of construction. Construction in progress is reclassified to the appropriate category of property, plant and
equipment when completed and ready for use.
(II) Bearer plantsBearer plants are living plants used in the production or supply of agricultural produce. They are expected to
bear produce for more than one period and have a remote likelihood of being sold as agricultural produce,
except for incidental scrap sales.
The Group’s bearer plants comprise oil palm, rubber and sugar cane plantations. The Group elected to
account for its bearer plants using the cost model under HKAS 16. Immature bearer plants are accounted for
at accumulated cost, which consist mainly of the accumulated cost of land clearing, planting, fertilizing, up-
keeping and maintaining the plantations, and allocations of indirect overhead costs up to the time the plants
become commercially productive and available for harvest. Costs also include capitalized borrowing costs
and other charges incurred in connection with the financing of the development of immature bearer plants.
Immature bearer plants are not amortized.
Immature bearer plants are reclassified to mature bearer plants when they are commercially productive and
available for harvest. In general, an oil palm plantation takes about three to four years to reach maturity from the
time of planting the seedlings, while a rubber plantation takes about five to six years to reach maturity. A sugar
cane plantation takes about a year to reach maturity and can be harvested for an average of four times after the
initial planting.
Mature bearer plants are stated at cost, and are depreciated using the straight-line method over their estimated
useful lives of 25 years for oil palm plantations and rubber plantations, and four years for sugar cane plantations.
The carrying amounts of bearer plants are reviewed for impairment when events or changes in circumstances
indicate that the carrying values may not be fully recoverable.
The carrying amount of an item of bearer plants is derecognized upon disposal or when no future economic
benefits are expected from its use or disposal. Any gain or loss arising from derecognition of the asset (calculated
as the difference between the net disposal proceeds and the carrying amount of the asset) is directly included in
the profit or loss when the item is derecognized.
The assets useful lives and depreciation method are reviewed at each year end and adjusted prospectively if
necessary.
Upkeep and maintenance costs are recognized in the profit or loss when they are incurred. The cost of major
renovation and restoration is included in the carrying amount of the related asset when it is probable that future
economic benefits in excess of the originally assessed standard of performance of the existing asset will flow to
the Group, and is depreciated over the remaining useful life of the related asset.
140 First Pacific Annual Report 2017
Notes to the Consolidated Financial Statements
(c) Asset retirement obligationsThe net present value of legal obligations associated with the retirement of an item of property, plant and equipment
that resulted from the acquisition, construction or development of property, plant and equipment is recognized in
the period in which the obligations arise. The obligations are reviewed and adjusted, if appropriate, at least at each
financial year end.
(d) Biological assetsThe Group’s biological assets comprise timber plantations and agricultural produce of the bearer plants, which
primarily comprise of fresh fruit bunches and sugar cane.
The Group recognized the fair value of biological assets in accordance with HKAS 41. Biological assets are stated at
fair value less costs to sell. Gains or losses arising on initial recognition of biological assets and from the change in fair
value of biological assets at each reporting date are recognized in the profit or loss for the period in which they arise.
The Group adopted the income approach to measure the fair value of the biological assets. For the valuation of
unharvested produce of oil palm and rubber plantations, the Group has applied the actual harvest data subsequent
to each reporting date to derive the fair value. For the valuation of sugar cane, the Group has applied discounted cash
flow models to derive its fair value.
For timber plantations, the Group appoints an independent valuer to determine the fair value of timber at year
end and any resultant gains or losses arising from the changes in fair values is recognized in the profit or loss. The
independent appraiser adopts the income approach for the valuation of timber trees using a discounted cash flow
model.
(e) Associated companies and joint venturesAn associated company is an entity, not being a subsidiary company or a joint venture, in which the Group over whose
management is in a position to exercise significant influence, including participation in the financial and operating
policy decisions. Generally, significant influence is assumed to exist when the Group has a long-term interest of not
less than 20% of the equity voting rights in the entity.
The Group has interests in joint ventures, whereby the Group and the other venturers have contractual arrangements
that give them joint controls and rights to the net assets of the arrangement. Joint control is the contractually agreed
sharing of control of an arrangement which exists only when decisions about the relevant activities require the
unanimous consent of the parties sharing control.
Investments in associated companies and joint ventures are accounted for by the equity method of accounting, less
any impairment losses. Adjustments are made to bring into line any dissimilar accounting policies that may exist.
The Group’s investments in associated companies and joint ventures include goodwill (net of any accumulated
impairment losses) identified on acquisition. The Group’s share of its associated companies’ and joint ventures’ post-
acquisition profits and losses is recognized in the consolidated income statement as the Group’s share of profits less
losses of associated companies and joint ventures, and its share of post-acquisition other comprehensive income
is recognized in the Group’s consolidated other comprehensive income and when applicable in the consolidated
statement of changes in equity. The cumulative post-acquisition movements are adjusted against the carrying amount
of the investment.
Unrealized gains and losses resulting from transactions between the Group and its associates or joint ventures are
eliminated to the extent of the Group’s investments in the associates or joint ventures, except where unrealized losses
provide evidence of an impairment of the assets transferred.
141 First Pacific Annual Report 2017
Equity accounting is discontinued when the carrying amount of the investment in an associated company or a joint
venture reaches zero, unless the Group has incurred obligations or guaranteed obligations in respect of the associated
company or joint venture.
After application of the equity method, the Group determines whether it is necessary to recognize an impairment loss
on its investments in associated companies and joint ventures. At each reporting date, the Group determines whether
there is objective evidence that the investment in an associated company or a joint venture is impaired. If there is
such evidence, the Group calculates the amount of impairment as the difference between the recoverable amount of
the associated company or joint venture and its carrying value, and then recognizes the loss as share of profits less
losses of associated companies and joint ventures in the consolidated income statement.
If an investment in an associated company becomes an investment in a joint venture or vice versa, the retained
interest is not remeasured. Instead, the investment continues to be accounted for under the equity method. In
all other cases, when the Group discontinues the use of the equity method from the date when it ceases to have
significant influence over an associated company or joint control over the joint venture, the Group measures at fair
value any investment that the Group retains in the former associated company or joint venture. The Group recognizes
in the consolidated income statement any difference between (i) the fair value of any retained investment and any
proceeds from disposing of part of the interest in the associated company or joint venture and (ii) the carrying amount
of the investment at the date when significant influence or joint control is lost.
(f) Intangible assets (other than goodwill)Intangible assets acquired separately are measured on initial recognition at cost. The cost of intangible assets
acquired from business combinations is initially recognized at fair value at the date of acquisition. Additions of service
concession assets subsequent to business combinations are initially measured at present value of any additional
estimated future concession fee payments pursuant to the concession agreements and/or the costs of rehabilitation
works incurred. Following initial recognition, intangible assets are carried at cost less any accumulated amortization
and any accumulated impairment loss. The useful lives of intangible assets are assessed to be either finite or
indefinite.
Intangible assets with finite lives are amortized over the useful economic life and assessed for impairment whenever
there is an indication that the intangible asset may be impaired. The amortization period and the amortization method
for an intangible asset with a finite useful life are reviewed at least at the end of each reporting period. Changes in the
expected useful life or the expected pattern of consumption of future economic benefits embodied in the intangible
assets are accounted for by changing the amortization period or method, as appropriate, and are treated as changes
in accounting estimates. The Group’s concession assets represent the fair value of concessions of right granted by
governments to charge users of public services provided. The Group’s concession assets for the water distribution
business are amortized using either the unit of production method or the straight-line method over the term of the
concessions. The Group’s concession assets for the toll road business are amortized using the unit of production
method over the term of the concessions. The Group’s concession assets for the rail business are amortized using
the straight-line basis. The Group’s brands represent the brands for its various milk related products. The brands
are amortized using the straight-line method over their estimated useful lives. The Group’s vesting contract is a
commitment to produce a specified quantity of electricity at a specified price, limiting the Group’s exposure to volatility
in the electricity prices, providing certainty on cost recovery for a portion of the electricity generated. The vesting
contract is amortized using the straight-line method. The Group’s software is amortized using the straight-line method
over its estimated useful life.
Intangible asset with an indefinite life is not amortized. The useful life of an intangible asset with an indefinite useful
life is reviewed annually to determine whether the useful life assessment continues to be supportable. If not, the
change in useful life from indefinite to finite is made on a prospective basis. Intangible asset with an indefinite life
is tested for impairment annually and when circumstances indicate that the carrying value may be impaired. The
Group’s intangible assets with indefinite lives mainly consist of the registered brand name and distribution and
customer networks of its packaged drinking water business, for which the Group does not expect to incur significant
expenses to maintain the future economic benefits that can be generated from these assets.
142 First Pacific Annual Report 2017
Notes to the Consolidated Financial Statements
Intangible assets not yet available for use are tested for impairment annually or more frequently when events or
changes in circumstances indicate that the carrying values may be impaired. The intangible assets not yet available
for use mainly relate to concession agreements signed with the relevant government authorities as regards to the
building and operation of toll roads and rail extension for which constructions have not been completed.
(g) Investment propertiesInvestment properties are interests in land and buildings (including the leasehold interest under an operating lease
for a property which would otherwise meet the definition of an investment property) held to earn rental income and/
or for capital appreciation, rather than for use in the production or supply of goods or services or for administrative
purposes; or for sale in the ordinary course of business. Such properties are measured initially at cost, including
transaction costs. Subsequent to initial recognition, investment properties are stated at fair value, which reflects
market conditions at the end of the reporting period.
Gains or losses arising from changes in the fair values of investment properties are included in the consolidated
income statement in the year in which they arise.
Any gains or losses on the retirement or disposal of an investment property are recognized in the consolidated income
statement in the year of the retirement or disposal.
(h) Fair value measurementThe Group measures its biological assets, investment properties, certain available-for-sale assets, derivative financial
instruments and pension scheme assets at fair value at the end of each reporting period. Fair value is the price that
would be received to sell an asset or paid to transfer a liability in an orderly transaction between market participants
at the measurement date. The fair value measurement is based on the presumption that the transaction to sell the
asset or transfer the liability takes place either in the principal market for the asset or liability, or in the absence of a
principal market, in the most advantageous market for the asset or liability. The principal or the most advantageous
market must be accessible by the Group. The fair value of an asset or a liability is measured using the assumptions
that market participants would use when pricing the asset or liability, assuming that market participants act in their
economic best interest.
A fair value measurement of a non-financial asset takes into account a market participant’s ability to generate
economic benefits by using the asset in its highest and best use or by selling it to another market participant that
would use the asset in its highest and best use.
The Group uses valuation techniques that are appropriate in the circumstances and for which sufficient data
are available to measure fair value, maximizing the use of relevant observable inputs and minimizing the use of
unobservable inputs.
All assets and liabilities for which fair value is measured or disclosed in the financial statements are categorized
within the fair value hierarchy, described as follows, based on the lowest level input that is significant to the fair value
measurement as a whole:
Level 1 – based on quoted prices (unadjusted) in active markets for identical assets or liabilities
Level 2 – based on valuation techniques for which the lowest level input that is significant to the fair value
measurement is observable, either directly or indirectly
Level 3 – based on valuation techniques for which the lowest level input that is significant to the fair value
measurement is unobservable
For assets and liabilities that are recognized in the financial statements on a recurring basis, the Group determines
whether transfers have occurred between levels in the hierarchy by reassessing categorization (based on the lowest
level input that is significant to the fair value measurement as a whole) at the end of each reporting period.
143 First Pacific Annual Report 2017
(i) Impairment of non-financial assetsAn assessment is made at the end of each reporting period as to whether there is an indication of impairment of assets
including property, plant and equipment, other intangible assets and other non-current assets, or whether there is any
indication that an impairment loss previously recognized for an asset in prior years may no longer exist or may have
decreased. If any such indication exists, the asset’s recoverable amount is estimated. An asset’s recoverable amount is
calculated as the higher of the asset’s fair value less costs of disposal and value in use.
An impairment loss is recognized only if the carrying amount of an asset exceeds its recoverable amount. An
impairment loss is charged to the consolidated income statement in the period in which it arises, unless the asset is
carried at a revalued amount, then the impairment loss is accounted for in accordance with the relevant accounting
policy for that revalued asset.
A previously recognized impairment loss of all assets other than goodwill is reversed only if there has been a change
in the estimates used to determine the recoverable amount of the asset. However, this is limited and will not give
rise to an amount higher than the carrying amount that would have been determined (net of any depreciation/
amortization), had no impairment loss been recognized for the asset in prior years.
A reversal of such an impairment loss is credited to the consolidated income statement in the period in which it arises,
unless the asset is carried at a revalued amount, in which case the reversal of the impairment loss is accounted for in
accordance with the relevant accounting policy for that revalued asset.
(j) Cash and cash equivalents and short-term depositsFor the purpose of the consolidated statement of financial position, cash and cash equivalents comprise cash on
hand and at banks, including term deposits, which are not restricted as to use, whereas short-term deposits are
highly liquid money market placements with maturities of more than three months but less than one year from the
dates of acquisition. Cash restricted as to use represent cash which are restricted from being exchanged or used to
settle a liability.
For the purpose of the consolidated statement of cash flows, cash and cash equivalents comprise cash on hand and
demand deposits, and short-term highly liquid investments which are readily convertible into known amounts of cash,
are subject to an insignificant risk of changes in value, and have original maturities of three months or less from the
dates of acquisition, less bank overdrafts which are repayable on demand and which form an integral part of the
Group’s cash management.
(k) Financial assets and financial liabilities(I) Classification, initial recognition and measurement
The Group recognizes a financial asset or a financial liability in the consolidated statement of financial position
when the Group becomes a party to the contractual provisions of the instrument. The Group determines
the classification of its financial assets and financial liabilities at initial recognition and, where allowed and
appropriate, re-evaluates this designation at the end of the reporting period. In the case of a regular way
purchase or sale of financial assets, recognition and derecognition, as applicable, is done using the trade date
accounting, which means the accounting based on the date that the Group commits to purchase or sell the asset.
144 First Pacific Annual Report 2017
Notes to the Consolidated Financial Statements
Financial assets are classified, at initial recognition, as loans and receivables, held-to-maturity investments,
financial assets at fair value through profit or loss, and available-for-sale financial investments, or as derivatives
designated as hedging instruments in an effective hedge, as appropriate. Financial assets at fair value through
profit or loss include financial assets held for trading and financial assets designated upon initial recognition
as at fair value through profit or loss. Financial assets are classified as held for trading if they are acquired for
the purpose of sale in the near term. Derivatives, including separated embedded derivatives, are also classified
as held for trading unless they are designated as effective hedging instruments as defined by HKAS 39. Loans
and receivables are non-derivative financial assets with fixed or determinable payments that are not quoted in
an active market. Non-derivative financial assets with fixed or determinable payments and fixed maturity are
classified as held to maturity when the Group has the positive intention and ability to hold to maturity. Available-
for-sale financial investments are non-derivative financial assets in listed and unlisted equity investments and
debt securities. Equity investments classified as available-for-sale are those that are neither classified as held-
for-trading nor designated at fair value through profit or loss. Debt securities in this category are those that are
intended to be held for an indefinite period of time and that may be sold in response to liquidity requirements or
in response to changes in the market conditions.
Financial liabilities are classified, at initial recognition, as financial liabilities at fair value through profit or
loss, loans and borrowings, or as derivatives designated as hedging instruments in an effective hedge, as
appropriate. Financial liabilities at fair value through profit or loss include financial liabilities held for trading and
financial liabilities designated upon initial recognition as at fair value through profit or loss. Financial liabilities
are classified as held for trading if they are acquired for the purpose of repurchasing in the near term. This
category includes derivative financial instruments entered into by the Group that are not designated as hedging
instruments in hedge relationships as defined by HKAS 39. Separated embedded derivatives are also classified as
held for trading unless they are designated as effective hedging instruments.
Financial guarantee contracts issued by the Group are those contracts that require a payment to be made to
reimburse the holder for a loss it incurs because the specified debtor fails to make a payment when due in
accordance with the terms of a debt instrument. Financial guarantee contracts are recognized initially as a
liability at fair value, adjusted for transaction costs that are directly attributable to the issuance of the guarantee.
A financial asset or financial liability may be designated as a financial asset or financial liability at fair value
through profit or loss at initial recognition if any of the following criteria are met:
(i) it eliminates or significantly reduces a measurement or recognition inconsistency that would otherwise
arise from measuring assets or liabilities or recognizing the gains and losses on them on a different basis;
(ii) a group of financial assets, financial liabilities or both are managed and their performance is evaluated
on a fair value basis, in accordance with a documented risk management or investment strategy, and
information about the group is provided internally on that basis to the Group’s key management personnel;
or
(iii) financial instrument contains an embedded derivative, unless the embedded derivative does not
significantly modify the cash flows or it is clear, with little or no analysis, that it would not be separately
recorded.
Financial assets or financial liabilities are recognized initially at fair value including transaction costs that are
attributable to the acquisition of the financial assets or recognition of financial liabilities except for financial
instruments at fair value through profit or loss.
145 First Pacific Annual Report 2017
(II) Subsequent measurementAfter initial recognition, the following financial assets and liabilities are measured at amortized cost using
the effective interest method: (i) loans and receivables; (ii) held-to-maturity investments; and (iii) loans and
borrowings. Amortized cost is calculated taking into account any discount or premium on acquisition and
includes fees that are an integral part of the effective interest rate and transaction costs.
Financial assets and liabilities at fair value through profit or loss are carried in the consolidated statement of
financial position at fair value with net changes in fair value recognized in the consolidated income statement.
Derivatives embedded in host contracts are accounted for as separate derivatives and recorded at fair value
if their economic characteristics and risks are not closely related to those of the host contracts and the host
contracts are not held for trading or designated at fair value through profit or loss. These embedded derivatives
are measured at fair value with changes in fair value recognized in the consolidated income statement.
Reassessment only occurs if there is either a change in the terms of the contract that significantly modifies the
cash flows that would otherwise be required or a reclassification of a financial asset out of the fair value through
profit or loss.
After initial recognition, available-for-sale financial investments are subsequently measured at fair value, with
changes in fair value recognized in other comprehensive income or loss and accumulated in the unrealized
gains/losses on available-for-sale assets revaluation reserve until the investment is derecognized, except for
impairment losses and foreign exchange gains and losses, at that time the cumulative unrealized gain or loss is
reclassified to the consolidated income statement. Interest and dividends earned whilst holding the available-for-
sale financial investments are reported as interest income and dividend income, respectively and are recognized
in the consolidated income statement as other income in accordance with the policies set out for “Turnover and
revenue recognition”.
When the fair value of unlisted equity investments cannot be reliably measured because (a) the variability in the
range of reasonable fair value estimates is significant for that investment or (b) the probabilities of the various
estimates within the range cannot be reasonably assessed and used in estimating fair value, such investments
are stated at cost less any impairment losses.
The Group evaluates whether the ability and intention to sell its available-for-sale financial assets in the near
term are still appropriate. When, in rare circumstances, the Group is unable to trade these financial assets due
to inactive markets, the Group may elect to reclassify these financial assets if management has the ability and
intention to hold the assets for the foreseeable future or until maturity.
For a financial asset reclassified from the available-for-sale category, the fair value carrying amount at the date
of reclassification becomes its new amortized cost and any previous gain or loss on that asset that has been
recognized in equity is amortized to profit or loss over the remaining life of the investment using the effective
interest rate. Any difference between the new amortized cost and the maturity amount is also amortized over
the remaining life of the asset using the effective interest rate. If the asset is subsequently determined to be
impaired, then the amount recorded in equity is reclassified to the consolidated income statement.
(III) DerecognitionA financial asset (or, where applicable, a part of a financial asset or part of a group of similar financial assets)
is primarily derecognized (i.e. removed from the Group’s consolidated statement of financial position) when (i)
the rights to receive cash flows from the asset have expired, or (ii) the Group has transferred its rights to receive
cash flows from the asset or has assumed an obligation to pay the received cash flows in full without material
delay to a third party under a “pass-through” arrangement; and either the Group has transferred substantially
all the risks and rewards of the asset, or the Group has neither transferred nor retained substantially all the risks
and rewards of the asset, but has transferred control of the asset.
146 First Pacific Annual Report 2017
Notes to the Consolidated Financial Statements
When the Group has transferred its rights to receive cash flows from an asset or has entered into a pass-through
arrangement, it evaluates if and to what extent it has retained the risk and rewards of ownership of the asset.
When it has neither transferred nor retained substantially all the risks and rewards of the asset nor transferred
control of the asset, the asset is recognized to the extent of the Group’s continuing involvement in the asset. In
that case, the Group also recognizes an associated liability. The transferred asset and the associated liability are
measured on a basis that reflects the rights and obligations that the Group has retained.
Continuing involvement that takes the form of a guarantee over the transferred asset is measured at the lower
of the original carrying amount of the asset and the maximum amount of consideration that the Group could be
required to repay.
A financial liability is derecognized when the obligation under the liability is discharged or cancelled, or expires.
When an existing financial liability is replaced by another from the same lender on substantially different terms,
or the terms of an existing liability are substantially modified, such an exchange or modification is treated
as a derecognition of the original liability and a recognition of a new liability, and the difference between the
respective carrying amounts is recognized in the consolidated income statement.
(IV) Offsetting of financial instrumentsFinancial assets and financial liabilities are offset and the net amount is reported in the statement of financial
position if there is a currently enforceable legal right to offset the recognized amounts and there is an intention
to settle on a net basis, or to realize the assets and settle the liabilities simultaneously.
(V) Impairment of financial assetsThe Group assesses at the end of each reporting period whether there is any objective evidence that a financial
asset is impaired. An impairment exists if one or more events that occurred after the initial recognition of the
asset have an impact on the estimated future cash flows of the financial asset or the group of financial assets
that can be reliably estimated. Evidence of impairment may include indications that a debtor or a group of
debtors is experiencing significant financial difficulty, default or delinquency in interest or principal payments,
the probability that they will enter bankruptcy or other financial reorganization and observable data indicating
that there is a measurable decrease in the estimated future cash flows, such as changes in arrears or economic
conditions that correlate with defaults.
(i) Financial assets carried at amortized cost
For financial assets carried at amortized cost, the Group first assesses whether impairment exists
individually for financial assets that are individually significant, or collectively for financial assets that are
not individually significant. If the Group determines that no objective evidence of impairment exists for an
individually assessed financial asset, whether significant or not, it includes the asset in a group of financial
assets with similar credit risk characteristics and collectively assesses them for impairment. Assets that are
individually assessed for impairment and for which an impairment loss is, or continues to be, recognized
are not included in a collective assessment of impairment. If there is objective evidence that an impairment
loss has been incurred, the amount of the loss is measured as the difference between the asset’s carrying
amount and the present value of estimated future cash flows (excluding future credit losses that have not
been incurred) discounted at the financial asset’s original effective interest rate (i.e., the effective interest
rate computed at initial recognition). The carrying amount of the asset is reduced either directly or through
the use of an allowance account. Interest income continues to be accrued on the reduced carrying
amount using the rate of interest used to discount the future cash flows for the purpose of measuring the
impairment loss. Loans and receivables together with any associated allowance are written off when there
is no realistic prospect of future recovery and all collateral has been realized or has been transferred to the
Group. The amount of the impairment loss is recognized in the consolidated income statement.
If, in a subsequent period, the amount of the estimated loss increases or decreases because of an event
occurring after the impairment was recognized, the previously recognized impairment loss is increased or
reduced by adjusting the allowance amount. If a write-off is later recovered, the recovery is credited to the
consolidated income statement.
147 First Pacific Annual Report 2017
(ii) Financial assets carried at cost
If there is objective evidence that an impairment loss has been incurred on an unquoted equity instrument
that is not carried at fair value because its fair value cannot be reliably measured, the amount of the loss is
measured as the difference between the asset’s carrying amount and the present value of estimated future
cash flows discounted at the current market rate of return for a similar financial asset. Impairment losses
on these assets are not reversed.
(iii) Available-for-sale financial assets
If an available-for-sale asset is impaired, an amount comprising the difference between its cost (net of
any principal payment and amortization) and its current fair value, less any impairment loss previously
recognized in the consolidated income statement, is removed from other comprehensive income and
recognized in the consolidated income statement.
In the case of equity investments classified as available for sale, objective evidence would include a
significant or prolonged decline in the fair value of an investment below its cost. “Significant” is evaluated
against the carrying cost of the investment and “prolonged” against the period in which the fair value has
been below its carrying cost. Where there is evidence of impairment, the cumulative loss – measured
as the difference between the acquisition cost and the current fair value, less any impairment loss on
that investment previously recognized in the consolidated income statement – is removed from other
comprehensive income and recognized in the consolidated income statement. Impairment losses on equity
instruments classified as available for sale are not reversed through the consolidated income statement.
Increases in their fair value after impairment are recognized directly in other comprehensive income. The
determination of what is “significant” or “prolonged” requires judgment. In making this judgment, the
Group evaluates, among other factors, the extent or duration to which the fair value of an investment is
less than its cost.
In the case of debt instruments classified as available for sale, impairment is assessed based on the same
criteria as financial assets carried at amortized cost. However, the amount recorded for impairment is the
cumulative loss measured as the difference between the acquisition cost (net of any principal repayment
and amortization) and the current fair value, less any impairment loss on that instrument previously
recognized in the consolidated income statement. Future interest income continues to be accrued based
on the reduced carrying amount of the asset using the rate of interest used to discount the future cash
flows for the purpose of measuring the impairment loss. The interest income is recorded as part of finance
income. Impairment losses on debt instruments are reversed through the consolidated income statement
if the subsequent increase in fair value of the instruments can be objectively related to an event occurring
after the impairment loss was recognized in the consolidated income statement.
(l) Derivative instruments and hedge accountingThe Group uses derivative financial instruments such as currency swaps, foreign currency forwards, interest rate
swaps, commodity swaps and electricity futures to hedge its risks associated with foreign currency, interest rate and
commodity price fluctuations. Such derivative financial instruments are stated at fair value.
The criteria for a derivative instrument to be classified as a hedge include (i) the hedge transaction is expected to be
highly effective in offsetting changes in fair value or cash flows attributable to the hedged risk; (ii) the effectiveness
of the hedge can be reliably measured; (iii) there is adequate documentation of the hedging relationships at the
inception of the hedge; and (iv) for cash flow hedges, the forecast transaction, which is the subject of the hedge, must
be highly probable and must present an exposure to variations in cash flows that could ultimately affect profit or loss.
For the purpose of hedge accounting, hedges are classified as (i) fair value hedges where they hedge the exposure to
changes in the fair value of a recognized asset or liability or an unrecognized firm commitment, (ii) cash flow hedges
where they hedge exposure to variability in cash flows that is either attributable to a particular risk associated with a
recognized asset or liability, a highly probable forecast transaction, or a foreign currency risk in an unrecognized firm
commitment, or (iii) hedges of a net investment in a foreign operation.
148 First Pacific Annual Report 2017
Notes to the Consolidated Financial Statements
At the inception of a hedge relationship, the Group formally designates and documents the hedge relationship to
which it wishes to apply hedge accounting and the risk management objective and strategy for undertaking the hedge.
The documentation includes identification of the hedging instrument, the hedged item or transaction, the nature of
the risk being hedged and how the entity will assess the effectiveness of changes in the hedging instrument’s fair
value in offsetting the exposure to changes in the hedged item’s fair value or cash flows attributable to the hedged
risk. Such hedges are expected to be highly effective in achieving offsetting changes in fair value or cash flows and
are assessed on an ongoing basis to determine that they actually have been highly effective throughout the financial
reporting periods for which they were designated.
In relation to fair value hedges which meet the conditions for hedge accounting, any gain or loss from remeasuring
the hedging instrument at fair value is recognized immediately in the consolidated income statement. Any gain or loss
on the hedged item attributable to the hedged risk is adjusted against the carrying amount of the hedged item and
recognized in the consolidated income statement.
In relation to cash flow hedges, the portion of the gain or loss on the hedging instrument that is determined to be an
effective hedge is recognized directly as other comprehensive income and the ineffective portion is recognized in
the consolidated income statement. The gains or losses that are accumulated in other comprehensive income are
transferred to the consolidated income statement in the same period in which the hedged item affects profit or loss.
If the hedging instrument expires or is sold, terminated or exercised without replacement or rollover (as part of the
hedging strategy), or if its designation as a hedge is revoked, or when the hedge no longer meets the criteria for hedge
accounting, any cumulative gain or loss previously recognized in other comprehensive income remains separately in
equity until the forecast transaction occurs or the foreign currency firm commitment is met.
Hedges of a net investment in a foreign operation, including a hedge of a monetary item that is accounted for as
part of the net investment, are accounted for in a way similar to cash flow hedges. Gains or losses on the hedging
instrument relating to the effective portion of the hedge are recognized in other comprehensive income while any
gains or losses relating to the ineffective portion are recognized in the consolidated income statement. On disposal of
the foreign operation, the cumulative value of any such gains or losses recognized in other comprehensive income is
transferred to the consolidated income statement.
For derivatives that do not qualify for hedge accounting, any gains or losses arising from changes in fair value are
taken directly to the consolidated income statement.
(m) InventoriesInventories are stated at the lower of cost and net realizable value. Cost is calculated using the first-in, first-out
method, the weighted average method or the moving average method, and in the case of work in progress and
finished goods, comprises direct materials, direct labor and an appropriate proportion of overheads. The cost of goods
purchased for resale includes costs incurred in bringing the goods to their present location. Net realizable value is
determined on the basis of current anticipated selling prices less estimated costs to be incurred to completion and
selling expenses. The Group provides allowance for obsolescence and/or decline in market values of inventories
based on periodic reviews of the physical conditions and net realizable value.
(n) Provisions, contingent liabilities and assetsA provision is recognized when the Group has a present legal or constructive obligation as a result of a past event, it
is probable that an outflow of resources will be required to settle the obligation, and a reliable estimate of the amount
can be made. When the Group expects some or all of a provision to be reimbursed, for example, under an insurance
contract, the reimbursement is recognized as a separate asset, but only when the reimbursement is virtually certain.
The expense relating to a provision is presented in the consolidated income statement net of any reimbursement.
When the effect of discounting is material, the amount recognized for a provision is the present value, at the end of
the reporting period, of the future expenditures expected to be required to settle the obligation. The increase in the
discounted present value amount, arising from the passage of time, is included in finance costs in the consolidated
income statement.
149 First Pacific Annual Report 2017
Where it is not probable that an outflow of economic benefits will be required, or the amount cannot be estimated
reliably, the obligation is disclosed as a contingent liability, unless the probability of outflow is remote.
A contingent liability recognized in a business combination is initially measured at its fair value. Subsequently, it
is measured at the higher of (i) the amount that would be recognized in accordance with the general guidance for
provisions above and (ii) the amount initially recognized less, when appropriate, cumulative amortization recognized
in accordance with the general guidance for revenue recognition.
Contingent assets represent assets arising from unplanned or unexpected events that give rise to the possibility of an
inflow of economic benefits to the Group. Contingent assets are not recognized in the Group’s Consolidated Financial
Statements, but are disclosed where an inflow of economic benefits is probable.
(o) Income taxIncome tax comprises current and deferred taxes. Income tax relating to items recognized outside profit or loss is
recognized outside profit or loss, either in other comprehensive income or directly in equity.
Current tax assets and liabilities are measured at the amount expected to be recovered from or paid to the taxation
authorities. The tax rates (and tax laws) used to compute the amounts are those that are enacted or substantively
enacted, by the end of the reporting period, in the countries where the Group operates and generates taxable income.
Deferred tax is provided, using the liability method, on all temporary differences arising between the tax bases of assets
and liabilities and their carrying values for financial reporting purposes.
Deferred tax liabilities are recognized for all taxable temporary differences (with limited exceptions) while deferred tax
assets are recognized for all deductible temporary differences, the carry-forward of unused tax assets and unused
tax losses (with limited exceptions). For deferred tax liabilities for the withholding taxes that would be payable on
unremitted earnings that are subject to withholding taxes, the Group fully recognizes the amounts for its associated
companies and recognizes the amounts to the extent representing the earnings to be distributed as dividends for its
subsidiary companies. The carrying amount of deferred tax assets is reviewed at the end of the reporting period and
reduced to the extent that it is no longer probable that sufficient taxable profit will be available to allow all or part of
the deferred tax asset to be recovered. Conversely, previously unrecognized deferred tax assets are recognized to the
extent that it is probable that sufficient taxable profit will be available to allow all or part of the deferred tax asset to be
recovered.
Deferred tax assets and liabilities are measured at the tax rates that are expected to apply to the period when the asset is
realized or the liability is settled, based on tax rates (and tax laws) that have been enacted or substantively enacted at
the end of the reporting period.
Deferred tax assets and deferred tax liabilities are offset if and only if the Group has a legally enforceable right to
set off current tax assets and current tax liabilities and the deferred tax assets and deferred tax liabilities relate to
income taxes levied by the same taxation authority on either the same taxable entity or different taxable entities which
intend either to settle current tax liabilities and assets on a net basis, or to realize the assets and settle the liabilities
simultaneously, in each future period in which significant amounts of deferred tax liabilities or assets are expected to
be settled or recovered.
(p) Dividends/DistributionsFinal dividends/distributions proposed by the Directors are recognized as a liability when they have been declared
and approved by the shareholders in an annual general meeting. Proposed final dividends/distributions are disclosed
in the notes to the Consolidated Financial Statements.
Interim dividends/distributions (including special dividends/distributions, if any) are simultaneously proposed and
declared, because the Company’s memorandum and bye-laws grant the Directors the authority to declare interim
dividends/distributions. Consequently, interim dividends/distributions are recognized immediately as a liability when
they are proposed and declared.
150 First Pacific Annual Report 2017
Notes to the Consolidated Financial Statements
(q) Convertible instrumentsConvertible instruments are separated into liability and equity components based on the terms of the contracts. Upon the issuance of the convertible instruments, the fair value of the liability component is determined using a market rate for an equivalent non-convertible instrument. This amount is classified as a financial liability measured at amortized cost (net of transaction costs) until it is extinguished on conversion or redemption. The remainder of the proceeds is allocated to the conversion option that is recognized and included in shareholders’ equity (net of transaction costs with the associated income tax). The carrying amount of the conversion option is not remeasured in subsequent years. Transaction costs are apportioned between the liability and equity components of the convertible instruments based on the allocation of proceeds to the liability and equity components when the instruments are initially recognized.
(r) Turnover and revenue recognitionTurnover represents the amounts received and receivable from the sale of goods and electricity and the rendering of services to third parties, falling within the ordinary activities of the Group’s businesses. Turnover from sales is recognized when the risks and rewards of ownership of goods sold have been transferred to the buyer. Turnover from services is recognized when it can be measured reliably by reference to stages of completion for the rendering of the said services. Turnover from the supply of electricity is recognized upon delivery.
Dividend income is recognized when the Group’s right to receive payment has been established. Interest income is recognized as it accrues, taking into account the principal amount outstanding and the effective interest rate.
(s) Employee benefits(I) Pension obligations
The Group operates defined contribution and defined benefit retirement schemes.
Contributions to defined contribution schemes by the Group and employees are calculated as a percentage of the employees’ basic salaries. The Group’s contributions to defined contribution schemes are expensed as incurred and are reduced by contributions forfeited by those employees who leave the schemes prior to the contributions vesting fully.
The Group’s net obligations in respect of defined benefit schemes is calculated by fair value of the pension scheme assets and estimates of the effects of future events on the actuarial present value of accrued pension obligations, and are determined on the basis of actuarial valuations using the projected unit credit method. Remeasurements comprising actuarial gains and losses, return on plan assets and any change in the effect of the asset ceiling (excluding net interest on defined benefit liability) are recognized immediately in other comprehensive income in the period in which they arise. Remeasurements are not reclassified to profit or loss in subsequent periods. Past service costs are recognized in the consolidated income statement at the earlier of the date of (i) when the plan amendment occurs and (ii) when the related restructuring or termination costs are recognized. Interest on net defined benefit obligation is calculated using the discount rate used to measure the pension benefit obligation and recognized in the consolidated income statement.
(II) Long service paymentsCertain of the Group’s employees are eligible for long service payments in the event of the termination of their employment. A provision is recognized in respect of the probable future long service payments expected to be made. The provision is the best estimate of the present value of probable future payments, calculated using the projected unit credit method, that have been earned by the employees from their service to the Group at the end of the reporting period.
(III) Equity-settled transactionsThe cost of equity-settled transactions with employees is measured by reference to the fair values of the share options and awarded shares at the date at which they are granted.
For grant of share options, the total amount to be expensed is determined by reference to the fair value of the options granted by using option-pricing models, which include the impact of market performance conditions but excludes the impact of service conditions and non-market performance conditions. For grant of awarded shares, the total amount to be expensed is determined by reference to the market performance conditions at the grant date, taking into account all non-vesting conditions associated with the grants.
151 First Pacific Annual Report 2017
The cost of equity-settled transactions is recognized in employee benefit expenses, together with a
corresponding increase in the employee share-based compensation reserve, over the period in which the
performance conditions are fulfilled. The cumulative expense recognized for equity-settled transactions at each
reporting period end until the vesting date reflects the extent to which the vesting period has expired and the
number of awards that will ultimately vest, based on the best available estimate.
Upon the exercise of share options, the related amount accumulated in the employee share-based
compensation reserve is transferred to share premium. Upon the vesting and transfer to the awardees, the
related costs of the awarded shares are credited to shares held for the share award scheme, and the related fair
value of the shares is debited to the employee share-based compensation reserve. The difference between the
cost and the fair value of the vested awarded shares is credited to retained earnings if the fair value is higher
than the cost or debited against retained earnings if the fair value is less than the cost.
Service and non-market performance conditions are not taken into account when determining the grant date fair
value of awards, but the likelihood of the conditions being met is assessed as part of the Group’s best estimate
of the number of equity instruments that will ultimately vest. Market performance conditions are reflected
within the grant date fair value. Any other conditions attached to an award, but without an associated service
requirement, are considered to be non-vested conditions. Non-vesting conditions are reflected into fair value of
an award and lead to an immediate expensing of an award unless there are also services and/or performance
conditions.
For awards that do not ultimately vest because non-market performance and/or service conditions have not
been met, no expense is recognized. Where awards include a market or non-vesting condition, the transactions
are treated as vesting irrespective of whether the market or non-vesting condition is satisfied, provided that all
other performance and/or service conditions are satisfied.
Where the terms of an equity-settled award are modified, an expense, as a minimum, is recognized as if
the terms had not been modified if the original terms of the award are met. An expense is recognized for
any increase in the fair value of the transactions as a result of the modification, as measured at the date of
modification. If the modification occurs during the vesting period, the incremental fair value granted is included
in the measurement of the amount recognized for services received over the period from the modification date
until the date when the modified equity instruments vest, in addition to the amount based on the grant date fair
value of the original equity instruments, which is recognized over the remainder of the original vesting period.
If the modification occurs after vesting date, the incremental fair value granted is recognized immediately, or
over the vesting period if the employee is required to complete an additional period of service before becoming
unconditionally entitled to those modified equity instruments.
Where an equity-settled award is cancelled, it is treated as if it had vested on the date of cancellation, and any
expense not yet recognized for the award is recognized immediately. This includes any award where nonvesting
conditions within the control of either the Group or the employee are not met. However, if a new award is
substituted for the cancelled award, and designated as a replacement award on the date that it is granted, the
cancelled and new awards are treated as if they were a modification of the original award, as described in the
previous paragraph. All cancellations of equity-settled transaction awards are treated equally.
(IV) Cash long-term employee benefitsThe Group’s long-term incentive plans (“LTIP”) grant cash incentives to eligible key employees, which are
contingent upon the achievement of approved targets, such as recurring profit/core income over a performance
cycle, usually three years, with payments usually made at the end of the performance cycle. Liability under LTIP
is determined using the projected unit credit method. Employee benefit costs include current service costs,
interest cost, actuarial gains and losses, and past service costs. Past service costs and actuarial gains and losses
are recognized immediately in the consolidated income statement when they occur.
152 First Pacific Annual Report 2017
Notes to the Consolidated Financial Statements
(V) Paid leave carried forwardThe Group provides paid annual leave to its employees under their employment contracts on a calendar year
basis. Under certain circumstances, such leave which remains untaken as at the end of the reporting period
is permitted to be carried forward and utilized by the respective employees in the following year. An accrual is
made at the end of the reporting period for the expected future cost of such paid leave earned during the year
by the employees and carried forward.
(VI) Termination benefitsTermination benefits are employee benefits provided in exchange for the termination of an employee’s
employment as a result of either an entity’s decision to terminate an employee’s employment before the normal
retirement date or an employee’s decision to accept an offer of benefits in exchange for the termination of
employment.
Termination benefits are recognized at the earlier of (i) when the Group can no longer withdraw the offer of those
benefits and (ii) when the Group recognizes the related restructuring costs. Initial recognition and subsequent
changes to termination benefits are measured in accordance with the nature of the employee benefit, as either
post-employment benefits, short term employee benefits, or other long-term employee benefits.
(VIII) Short-term employee benefitsEmployee benefits are classified as short-term if the expected timing of settlement is within 12 months after the
end of the reporting period.
(t) LeasesLeases, where substantially all of the risks and rewards of ownership of assets remain with the lessor, are accounted
for as operating leases. Where the Group is the lessor, assets leased by the Group under operating leases are
included in non-current assets, and rentals receivable under the operating leases are credited to the consolidated
income statement on the straight-line basis over the lease terms. Where the Group is the lessee, rentals payable
under operating leases are recorded in the consolidated income statement on the straight-line basis over the lease
terms.
Leases that transfer substantially all the rewards and risks of ownership of assets to the Group, other than legal title,
are accounted for as finance leases. At the inception of a finance lease, the cost of the leased asset is capitalized at
the present value of the minimum lease payments and recorded together with the obligation, excluding the interest
element, to reflect the purchase and financing. Assets held under capitalized finance leases, including prepaid land
lease payments under finance leases, are included in property, plant and equipment, and are depreciated over the
shorter of the lease terms and the estimated useful lives of the assets. Finance lease payments are apportioned
between the finance charges and reduction of the lease liability so as to achieve a constant rate of interest on the
remaining balance of the liability. A finance lease gives rise to a depreciation expense for the asset as well as a
borrowing cost for each period. Finance charges are charged directly to current operations. The depreciation policy
for leased assets is consistent with that for depreciable assets that are owned by the Group.
(u) Finance costsFinance costs are interest expense calculated using the effective method and other costs incurred in connection
with the borrowing of funds. Other costs include exchange differences on foreign currency borrowings. Exchange
differences arising from foreign currency borrowings are included in finance costs to the extent that they are regarded
as an adjustment to interest costs.
Finance costs are expensed in the consolidated income statement in the year in which they are incurred, except to
the extent that they are capitalized as being directly attributable to the acquisition, construction or production of an
asset (principally the assets classified as property, plant and equipment and concession assets classified as intangible
assets for the Group) which necessarily takes a substantial period of time to prepare for its intended use or sale. The
capitalization of such borrowing costs ceases when the assets are substantially ready for their intended use or sale.
153 First Pacific Annual Report 2017
(v) Foreign currencies(I) Functional and presentation currency
Items included in the financial statements of each of the Group’s entities are measured using the currency of
the primary economic environment in which the entity operates (functional currency, principally the rupiah, the
peso, A$ and S$). The Consolidated Financial Statements are presented in the currency of the United States
dollar, which is the Company’s functional currency.
(II) Transactions and balancesForeign currency transactions are translated into the functional currency using the exchange rates prevailing
at the dates of the transactions. Foreign exchange gains and losses resulting from the settlement of such
transactions and from the translation at year-end exchange rates of monetary assets and liabilities denominated
in foreign currencies are recognized in the consolidated income statement (except for those which will be
refunded or billed to customers through billings as approved by governments under service concession
arrangements). Non-monetary items that are measured in terms of historical cost in a foreign currency are
translated using the exchange rates at the dates of the initial transactions. Non-monetary items measured at
fair value in a foreign currency are translated using the exchange rates at the date when the fair value was
measured. The gain or loss arising on translation of a non-monetary item measured at fair value is treated in line
with the recognition of the gain or loss on change in fair value of the item.
(III) Group companiesThe results and financial position of all the group entities (none of which has the currency of a hyperinflationary
economy) that have a functional currency other than the United States dollar are translated into the United
States dollar as follows:
(i) assets and liabilities for each consolidated statement of financial position presented are translated at the
closing rate at the end of the reporting period;
(ii) income and expenses for each consolidated income statement and consolidated statement of
comprehensive income presented are translated at average exchange rates; and
(iii) all resulting exchange differences are recognized in other comprehensive income. On consolidation,
exchange differences arising from the translation of the net investment in foreign entities, and of
borrowings and other currency instruments designated as hedges of such investments, are taken to equity.
When a foreign operation is sold, such exchange differences are recognized in the consolidated income
statement as part of the gain or loss on disposal.
Goodwill and fair value adjustments arising on the acquisition of a foreign entity are treated as assets and
liabilities of the foreign entity and are translated at the rates at the dates of the transactions.
(IV) Consolidated statement of cash flowsFor the purpose of the consolidated statement of cash flows, the cash flows of overseas subsidiary companies
are translated into United States dollars at the average exchange rates of the year.
(w) Operating segmental informationAn operating segment is a component of the Group that engages in business activities from which it may earn
revenues and incur expenses (including revenues and expenses relating to transactions with other components of
the Group), whose operating results are regularly reviewed by the Group’s chief operating decision maker who makes
decisions about how resources are to be allocated to the segment and to assess its performance, and for which
discrete financial information is available.
Segment revenue, expenses, results, assets and liabilities include items directly attributable to a segment as well as
those that can be allocated on a reasonable basis to that segment. They are determined before intragroup balances
and intragroup transactions are eliminated as part of the consolidation process.
154 First Pacific Annual Report 2017
Notes to the Consolidated Financial Statements
(x) Related partiesA related party is considered as a person or an entity that is related to the Group if:
(I) A person or a close member of that person’s family is related to the Group if that person:
(i) has control or joint control over the Group;
(ii) has significant influence over the Group; or
(iii) is a member of the key management personnel of the Group;
or
(II) An entity is related to the Group if any of the following conditions applies:
(i) the entity and the Group are members of the same group (which means that parent, each subsidiary
company and each fellow subsidiary company is related to the others);
(ii) one entity is an associated company or a joint venture of the other entity (or an associated company or a
joint venture of a member of a group of which the other entity is a member);
(iii) the entity and the Group are joint ventures of the same third party;
(iv) one entity is a joint venture of a third entity and the other entity is an associated company of the third
entity;
(v) the entity is a post-employment benefit plan for the benefit of employees of either the Group or an entity
related to the Group;
(vi) the entity is controlled or jointly controlled by a person identified in (I);
(vii) a person identified in (I)(i) has significant influence over the entity or is a member of the key management
personnel of the entity (or of a parent of the entity); or
(viii) the entity, or any member of a group of which it is a part, provides key management personnel services to
the Group or to the parent of the Group.
Key management personnel are those persons having the authority and responsibility for planning, directing and
controlling the activities of the Group, directly or indirectly.
3. Significant Accounting Judgments and EstimatesThe preparation of the Group’s Consolidated Financial Statements requires management to make judgments, estimates and
assumptions that affect the reported amounts of revenues, expenses, assets and liabilities and their accompanying disclosures,
and the disclosure of contingent liabilities. The estimates and underlying assumptions are reviewed on an ongoing basis.
Revisions to accounting estimates are recognized in the period in which the estimate is revised if the revision affects only that
period, or in the period of the revision and future periods if the revision affects both current and future periods. Uncertainty about
these assumptions and estimates could result in outcomes that could require a material adjustment to the carrying amounts of
the assets or liabilities affected in the future.
(A) JudgmentsIn the process of applying the Group’s accounting policies, management has made the following judgments, apart from
those involving estimations, which have the most significant effect on the amounts recognized in the Consolidated Financial
Statements:
(a) Service concession arrangementsIn applying HK(IFRIC)-Int 12 to the service concession arrangements of the Group’s water (Maynilad, Philippine
Hydro, Inc. (“PHI”) and MIBWSC), toll road (NLEX Corporation, CIC, MPCALA and CCLEC) and rail (LRMC)
businesses, the Group has made judgments that these arrangements qualify for the application of the intangible
asset model. The methods of amortization that the Group use depends on which method best reflect the pattern of
consumption of the concession assets. NLEX Corporation, CIC and Maynilad use the unit of production method for
amortizing service concession assets. The Group annually reviews the actual billed volume and the estimated billable
water volume, in the case of the water concession, and the actual traffic volume and the expected traffic volume,
in the case of the toll concession, based on factors that include market conditions such as population growth and
consumption of water/usage of the toll facility, and the status of the Group’s projects. It is possible that future results
of operations could be materially affected by changes in the Group’s estimates brought about by changes in the
aforementioned factors.
155 First Pacific Annual Report 2017
In applying HKAS 23 “Borrowing Costs” to the Group’s service concession arrangements undergoing rehabilitation (in
the case of the existing LRT-1) and pre/on-going construction (in the case of the construction of the CALAX, Segment
10 of NLEX, the Connector Road, CCLEX and LRT-1 extension) as qualifying assets, the Group capitalizes borrowing
costs that are directly attributable to the acquisition or construction of the qualifying asset as part of the cost of that
asset using the specific borrowing approach, as the Group uses specific borrowings to finance its qualifying assets.
Capitalization of borrowing costs ceases when substantially all the activities necessary to prepare the components of
the service concession asset for its intended use are completed. Details of the Group’s accounting policy in respect of
intangible assets (other than goodwill) are set out in Note 2(D)(f) to the Consolidated Financial Statements.
(b) Classification of financial assets and financial liabilitiesThe Group determines the classification of certain assets and liabilities as financial assets and financial liabilities by
judging whether they meet the definition of financial assets and financial liabilities set out in HKAS 39. Accordingly,
the financial assets and financial liabilities are accounted for in accordance with the Group’s accounting policies set
out in Note 2(D)(k) to the Consolidated Financial Statements.
(c) Power to exercise significant influence or controlWhere the Group holds less than 20% of interest in an investee but the Group has the power to exercise significant
influence, such an investment is treated as an associate. See Note 14(D) to the Consolidated Financial Statements for
application of the above judgment.
Where the Group holds more than 50% of interest in the investee but the Group does not have the power to
exercise control, such an investment is treated as an associate or a joint venture. In May 2016, MPIC increased its
ownership interest in Beacon Electric from 50.0% to 75.0%. Despite a majority ownership interest of 75.0%, MPIC’s
investment in Beacon Electric remained to be accounted for as a joint venture as MPIC continued to have rights to
the joint arrangement’s net assets based on the structure, legal form, contractual agreement and other facts and
circumstances. In December 2016, MPTC increased its ownership interest in TMC from 46.0% to 60.0%. Despite a
majority ownership interest of 60.0%, MPTC’s investments in TMC remained to be accounted for as an associate as
another significant shareholder held significant veto rights relating to changes to operating and dividend policies that
affected investors returns. During 2017, the Group further increased its interests in Beacon Electric and TMC which
resulted in both of them became the Group’s subsidiary companies (Note 34 (B)).
(B) Estimation UncertaintyThe key assumptions concerning the future and other key sources of estimation uncertainty at the end of the reporting
period, that have a significant risk of causing a material adjustment to the carrying amounts of the assets and liabilities
within the next financial year are described below.
(a) Estimating useful lives and residual values of property, plant and equipmentThe Group estimates the useful lives and residual values of its property, plant and equipment based on the period
over which the assets are expected to be available for use. The estimated useful lives and residual values of the
property, plant and equipment are reviewed annually and are updated if expectations differ from previous estimates
due to physical wear and tear, technical or commercial obsolescence and legal or other limits on the use of the assets.
In addition, the Group’s estimation of the useful lives and residual values of its property, plant and equipment is based
on its collective assessment of industry practice, internal technical evaluation and experience with similar assets. It is
possible, however, that future results of operations could be materially affected by changes in those estimates brought
about by changes in factors mentioned above. The amounts and timing of recorded expenses for any period would be
affected by changes in these factors and circumstances. A reduction in the estimated useful lives and residual values
of the Group’s property, plant and equipment would increase its recorded depreciation expenses and decrease its
non-current assets.
156 First Pacific Annual Report 2017
Notes to the Consolidated Financial Statements
(b) Measurement of fair value of biological assetsThe Group recognizes its timber plantations and agricultural produce of bearer plants at fair value less costs to sell,
which requires the use of accounting estimates and assumptions.
The Group adopts the income approach to measure the fair value of unharvested produce of bearer plants and timber
plantations. The significant assumptions applied to determine the fair value of biological assets included the projected
selling prices, production yields, discount rate, inflation rate and exchange rates. For the valuation of unharvested fruit
bunches of oil palm, the Group has applied the actual harvest data subsequent to year end and the market selling
prices at year end to derive the fair value of unharvested produce of oil palm at year end. For the valuation of sugar
cane and timber, the Group has applied discounted cash flow models to derive their fair values.
The amount of changes in fair values would differ if there are changes to the assumptions used. Any changes in
fair values of these agricultural produces would affect the Group’s consolidated profit or loss and equity. The key
assumptions applied in the determination of fair value of biological assets including a sensitivity analysis are disclosed
and further explained in Note 13 to the Consolidated Financial Statements.
(c) Purchase price allocation and impairment of non-financial assetsAcquisition accounting requires extensive use of accounting estimates to allocate the purchase price to the fair market
values of the assets and liabilities purchased, including intangible assets and contingent liabilities. Determining
the fair value of property, plant and equipment, biological assets, and intangible assets (other than goodwill) at the
date of acquisition of business requires the Group to make estimates and assumptions that can materially affect its
Consolidated Financial Statements.
Any difference in the purchase price and the fair values of the net assets acquired is recorded as either goodwill in
the consolidated statement of financial position or a gain on bargain purchase in profit or loss. The Group’s business
acquisitions have resulted in goodwill, which is subject to yearly impairment testing and whenever there is an
indication that goodwill may be impaired. The Group also assesses whether there are any indicators of impairment
for all non-financial assets at the end of each reporting period. Indefinite life intangible assets and intangible assets
that has not yet been brought into use are tested for impairment annually and at other times when such an indicator
exists.
Other non-financial assets are tested for impairment when there are indicators that the carrying amounts may not
be recoverable. An impairment exists when the carrying value of an asset or a cash-generating unit exceeds its
recoverable amount, which is the higher of its fair value less costs of disposal and its value in use. The calculation
of the fair value less costs of disposal is based on available data from binding sales transactions in an arm’s length
transaction of similar assets or observable market prices less incremental costs for disposing of the asset. Estimating
the value in use requires the Group to make an estimate of the expected future cash flows from the cash-generating
units and also to choose a suitable discount rate in order to calculate the present value of those cash flows.
The preparation of estimated future cash flows involves significant estimations. While the Group believes that
its assumptions are appropriate and reasonable, significant changes in its assumptions may materially affect its
assessment of recoverable values and may lead to future additional impairment charges. Any resulting impairment
loss would affect directly the Group’s consolidated profit or loss and equity.
(d) Estimating useful lives of brandsThe Group estimates the useful lives of the brands for its packaged drinking water and various milk-related products.
The estimated useful lives of the brands are reviewed annually and are updated if expectations differ from previous
estimates due to changes in market situations or other limits. It is possible, however, that future results of operations
could be materially affected by changes in those estimates brought about by changes in the factors mentioned
above. The amounts and timing of recorded expenses for any period would be affected by changes in these factors
and circumstances. A reduction in the estimated useful lives of the Group’s brands would increase its recorded
amortization expenses and decrease its other intangible assets.
157 First Pacific Annual Report 2017
(e) Financial assets and liabilitiesHKFRS requires that the Group carries certain of its financial assets and liabilities at fair value, which requires
extensive use of accounting estimates. While significant components of fair value measurement were determined using
verifiable objective evidence (i.e., foreign exchange rates and interest rates), the amount of changes in fair value
would differ if the Group utilized different valuation methodologies. Any changes in fair value of these financial assets
and liabilities would affect directly the Group’s consolidated profit or loss and equity.
(f) Estimating allowances for loans and receivablesThe Group estimates the allowance for receivables based on two methods. The amounts calculated using each of
these methods are combined to determine the total amount it provides. Firstly, the Group evaluates specific accounts
where it has information that certain customers are unable to meet their financial obligations. In these cases, the
Group estimates, based on the best available facts and circumstances, including but not limited to, the length of
its relationship with the customer and the customer’s current credit status based on third party credit reports and
known market factors, to record specific provisions for customers against amounts due to reduce its receivable
amounts that the Group expects to collect. These specific provisions are re-evaluated and adjusted as additional
information received affects the amounts estimated. Secondly, if the Group determines that no objective evidence
of impairment exists for individually assessed trade receivables, whether significant or not, it includes the asset in a
group of financial assets with similar credit risk characteristics and collectively assesses them for impairment. The
characteristics chosen are relevant to the estimation of future cash flows for groups of such trade receivables by being
indicative of the customers’ ability to pay all amounts due. Future cash flows in a group of trade receivables that are
collectively evaluated for impairment are estimated on the basis of historical loss experience for the trade receivables
with credit risk characteristics similar to those in the group.
The amounts and timing of recorded expenses for any period would differ if the Group utilized different estimates. An
increase in the Group’s allowance for receivables would increase its recorded operating expenses and decrease its
consolidated profit or loss and equity.
(g) Impairment of available-for-sale assetsThe Group treats an available-for-sale equity financial asset as impaired when there had been a significant or
prolonged decline in the fair value below its acquisition cost or where other objective evidence of impairment exists.
The determination of what is “significant” or “prolonged” requires judgment. In addition, the Group evaluates other
factors, including normal volatility in share prices for quoted equities and the future cash flows and the discount
factors for unquoted equities.
For debt instruments classified as available-for-sale assets, the Group considers loss events that have an impact
on the estimated future cash flows of the financial asset. Evidence of loss events may include indication that the
issuer is experiencing significant financial difficulty, default or delinquency in interest or principal payments, and the
probability that they will enter bankruptcy or other financial reorganization. Other observable data may indicate that
there is a measurable decrease in the estimated future cash flows, such as changes in arrears or economic conditions
that correlate with defaults.
(h) Estimating allowances for inventoriesThe Group estimates the allowance for inventories based on the best available facts and circumstances, including but
not limited to, the inventories’ own conditions (i.e., whether they are damaged or become wholly or partially obsolete),
their market selling prices, estimated costs of completion and estimated costs to be incurred for their sale. The
provisions are re-evaluated and adjusted as additional information received affects the amount estimated.
(i) TaxesUncertainties exist with respect to the interpretation of complex tax regulations, changes in tax laws, and the amount
and timing of future taxable income. Given the diversity of the Group’s businesses and the long-term nature and
complexity of existing contractual agreements or the nature of the business itself, changes in differences arising
between the actual results and the assumptions made, or future changes to such assumptions, could necessitate
future adjustments to tax income and expense already recorded.
158 First Pacific Annual Report 2017
Notes to the Consolidated Financial Statements
The Group establishes provisions, based on reasonable estimates, for possible consequences of audits by the
tax authorities in which the Group operates. The amount of such provisions is based on various factors, such
as experience of previous tax audits and differing interpretations of tax regulations by the taxable entity and the
responsible tax authority. Such differences in interpretation may arise for a wide variety of issues depending on the
conditions prevailing in the respective domicile or to the operations of the Group.
The Group reviews the carrying amounts at the end of each reporting period and reduces deferred tax assets to the
extent that it is no longer probable that sufficient taxable profit will be available to allow all or part of the deferred tax
assets to be utilized based on the likely timing and level of future taxable profits together with future tax planning
strategies. However, there is no assurance that the Group will generate sufficient taxable profit to allow all or part of its
recognized deferred tax assets to be utilized.
(j) ProvisionsThe Group recognizes provisions based on estimates of whether it is probable that an outflow of resources will be
required to settle an obligation. Where the final outcome of these matters is different from the amounts that were
initially recognized, such differences will impact the financial performance in the current period in which such
determination is made.
(k) Pension and other retirement benefitsThe determination of the Group’s obligation, fair value of plan assets and cost for defined benefits is performed by
independent actuaries engaged by the Group and dependent on the selection of certain assumptions used by them in
calculating such amounts. Those assumptions include among others, discount rates, expected returns on plan assets,
future annual salary increases and the average remaining working life of employees. In accordance with the Group’s
accounting policy for pension obligations, actual results that differ from the Group’s assumptions are recognized
immediately in other comprehensive income as and when they occur. While the Group believes that the actuaries’
assumptions are reasonable and appropriate, significant differences in the Group’s actual experience or significant
changes in the Group’s assumptions may materially affect its pension and other retirement obligations.
(l) Employee benefit expensesHKFRS 2 requires that the Group measures its share options and awarded shares at fair value at the date at which
they are granted, which requires the extensive use of accounting estimates. The determination of such fair value is
performed by an independent valuer engaged by the Group or management’s estimates. Significant components of
fair value measurement were determined using assumptions including expected volatility and dividend yield and the
average risk-free interest rate for share options, and expected dividend payments during the vesting period for share
awards. The amount of fair value determined at the date on which the share options and awarded shares are granted
would differ if the Group utilized different assumptions. Any changes in fair value of the share options and awarded
shares determined at the date on which they are granted would affect directly the Group’s profit or loss in subsequent
periods when these fair values are recognized as expenses over the vesting period of the share options and awarded
shares.
The cost of cash LTIP is determined using the projected unit credit method based on prevailing discount rates
and estimated achievement of profit targets. While management’s assumptions are believed to be reasonable and
appropriate, significant differences in actual results or changes in assumptions may materially affect the Group’s
consolidated profit or loss and equity.
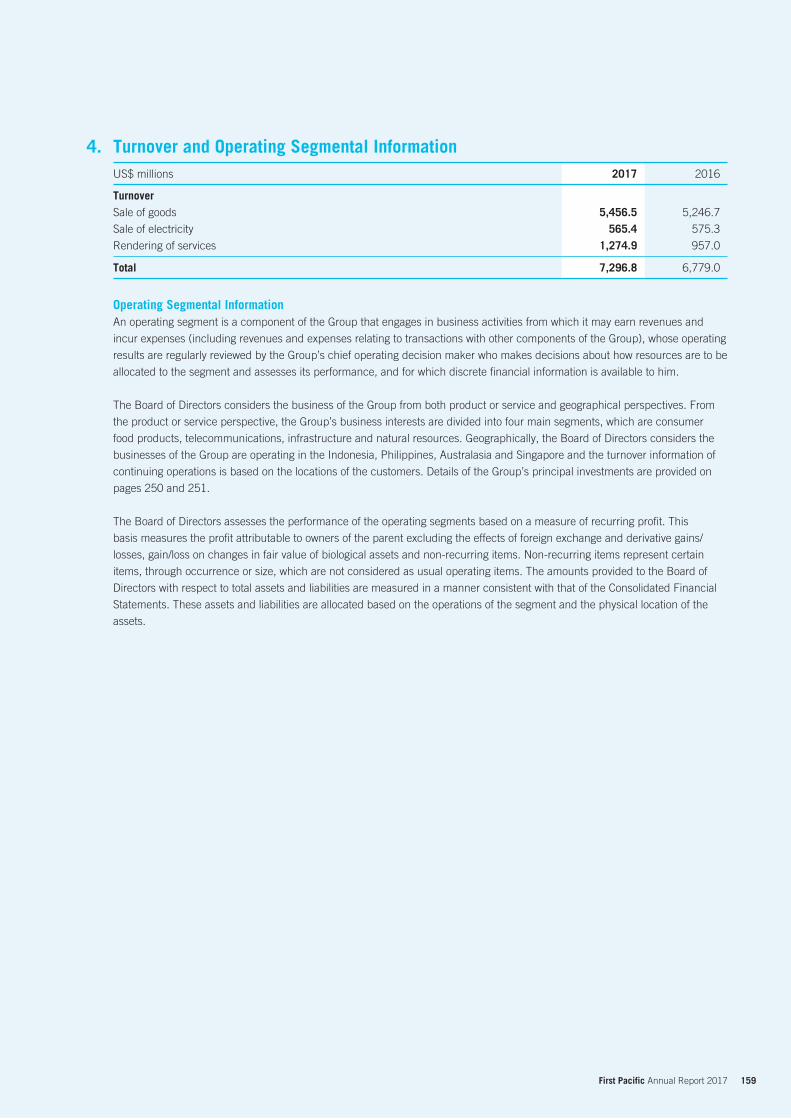
159 First Pacific Annual Report 2017
4. Turnover and Operating Segmental InformationUS$ millions 2017 2016
TurnoverSale of goods 5,456.5 5,246.7
Sale of electricity 565.4 575.3
Rendering of services 1,274.9 957.0
Total 7,296.8 6,779.0
Operating Segmental InformationAn operating segment is a component of the Group that engages in business activities from which it may earn revenues and
incur expenses (including revenues and expenses relating to transactions with other components of the Group), whose operating
results are regularly reviewed by the Group’s chief operating decision maker who makes decisions about how resources are to be
allocated to the segment and assesses its performance, and for which discrete financial information is available to him.
The Board of Directors considers the business of the Group from both product or service and geographical perspectives. From
the product or service perspective, the Group’s business interests are divided into four main segments, which are consumer
food products, telecommunications, infrastructure and natural resources. Geographically, the Board of Directors considers the
businesses of the Group are operating in the Indonesia, Philippines, Australasia and Singapore and the turnover information of
continuing operations is based on the locations of the customers. Details of the Group’s principal investments are provided on
pages 250 and 251.
The Board of Directors assesses the performance of the operating segments based on a measure of recurring profit. This
basis measures the profit attributable to owners of the parent excluding the effects of foreign exchange and derivative gains/
losses, gain/loss on changes in fair value of biological assets and non-recurring items. Non-recurring items represent certain
items, through occurrence or size, which are not considered as usual operating items. The amounts provided to the Board of
Directors with respect to total assets and liabilities are measured in a manner consistent with that of the Consolidated Financial
Statements. These assets and liabilities are allocated based on the operations of the segment and the physical location of the
assets.
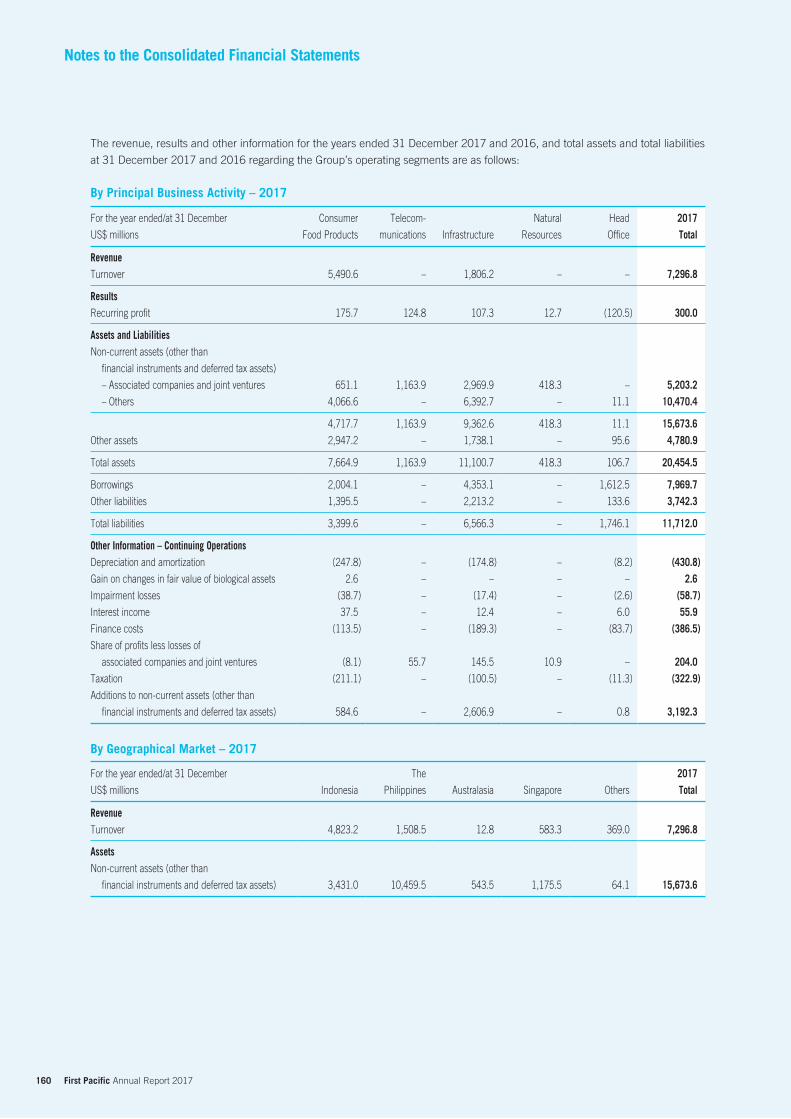
160 First Pacific Annual Report 2017
Notes to the Consolidated Financial Statements
The revenue, results and other information for the years ended 31 December 2017 and 2016, and total assets and total liabilities
at 31 December 2017 and 2016 regarding the Group’s operating segments are as follows:
By Principal Business Activity – 2017
For the year ended/at 31 December Consumer Telecom- Natural Head 2017US$ millions Food Products munications Infrastructure Resources Office Total
RevenueTurnover 5,490.6 – 1,806.2 – – 7,296.8 ResultsRecurring profit 175.7 124.8 107.3 12.7 (120.5) 300.0 Assets and LiabilitiesNon-current assets (other than
financial instruments and deferred tax assets)
– Associated companies and joint ventures 651.1 1,163.9 2,969.9 418.3 – 5,203.2– Others 4,066.6 – 6,392.7 – 11.1 10,470.4
4,717.7 1,163.9 9,362.6 418.3 11.1 15,673.6Other assets 2,947.2 – 1,738.1 – 95.6 4,780.9 Total assets 7,664.9 1,163.9 11,100.7 418.3 106.7 20,454.5 Borrowings 2,004.1 – 4,353.1 – 1,612.5 7,969.7Other liabilities 1,395.5 – 2,213.2 – 133.6 3,742.3 Total liabilities 3,399.6 – 6,566.3 – 1,746.1 11,712.0 Other Information – Continuing OperationsDepreciation and amortization (247.8) – (174.8) – (8.2) (430.8)Gain on changes in fair value of biological assets 2.6 – – – – 2.6Impairment losses (38.7) – (17.4) – (2.6) (58.7)Interest income 37.5 – 12.4 – 6.0 55.9Finance costs (113.5) – (189.3) – (83.7) (386.5)Share of profits less losses of
associated companies and joint ventures (8.1) 55.7 145.5 10.9 – 204.0Taxation (211.1) – (100.5) – (11.3) (322.9)Additions to non-current assets (other than
financial instruments and deferred tax assets) 584.6 – 2,606.9 – 0.8 3,192.3
By Geographical Market – 2017
For the year ended/at 31 December The 2017US$ millions Indonesia Philippines Australasia Singapore Others Total
RevenueTurnover 4,823.2 1,508.5 12.8 583.3 369.0 7,296.8 Assets Non-current assets (other than
financial instruments and deferred tax assets) 3,431.0 10,459.5 543.5 1,175.5 64.1 15,673.6
161 First Pacific Annual Report 2017
By Principal Business Activity – 2016
For the year ended/at 31 December Consumer Telecom- Natural Head 2016
US$ millions Food Products munications Infrastructure Resources Office Total
RevenueTurnover 5,263.5 – 1,515.5 – – 6,779.0
ResultsRecurring profit 159.0 127.7 103.3 10.2 (135.3) 264.9
Assets and LiabilitiesNon-current assets (other than
financial instruments and deferred tax assets)
– Associated companies and joint ventures 629.2 1,185.0 2,515.5 411.8 – 4,741.5
– Others 3,823.7 – 4,659.3 – 15.1 8,498.1
4,452.9 1,185.0 7,174.8 411.8 15.1 13,239.6
Other assets 2,821.5 – 895.3 – 259.0 3,975.8
Total assets 7,274.4 1,185.0 8,070.1 411.8 274.1 17,215.4
Borrowings 1,876.0 – 2,472.9 – 1,759.5 6,108.4
Other liabilities 1,312.2 – 1,643.7 – 116.8 3,072.7
Total liabilities 3,188.2 – 4,116.6 – 1,876.3 9,181.1
Other Information – Continuing OperationsDepreciation and amortization (229.5) – (136.2) – (12.3) (378.0)
Gain on changes in fair value of biological assets 16.4 – – – – 16.4
Impairment losses (20.2) – (92.1) – – (112.3)
Interest income 40.9 – 8.7 – 6.7 56.3
Finance costs (125.8) – (141.5) – (98.9) (366.2)
Share of profits less losses of
associated companies and joint ventures 7.6 93.2 152.9 (29.2) – 224.5
Taxation (190.0) – (84.0) – (12.3) (286.3)
Additions to non-current assets (other than
financial instruments and deferred tax assets) 268.7 – 890.5 – 0.1 1,159.3
162 First Pacific Annual Report 2017
Notes to the Consolidated Financial Statements
By Geographical Market – 2016
For the year ended/at 31 December The 2016
US$ millions Indonesia Philippines Australasia Singapore Others Total
RevenueTurnover 4,623.5 1,209.6 13.5 591.3 341.1 6,779.0
Assets Non-current assets (other than
financial instruments and deferred tax assets) 3,265.6 8,329.9 514.4 1,053.6 76.1 13,239.6
There was no revenue from transactions with a single customer that accounted for 10% or more of the Group’s consolidated
revenues during the year (2016: None).
A reconciliation between profit before taxation as shown in the consolidated income statement and recurring profit is as follows:
US$ millions 2017 2016
Profit before taxation
From continuing operations 884.2 784.1
From a discontinued operation (Note 8(b)) – 38.1
Exclusion of:
– Foreign exchange and derivative gains, net (Note 9) (34.8) (5.4)
– Gain on changes in fair value of biological assets (2.6) (16.4)
– Non-recurring items 271.6 206.9
Deduction of attributable taxation and non-controlling interests (818.4) (742.4)
Recurring Profit 300.0 264.9
5. Finance CostsUS$ millions 2017 2016
Finance costs on bank loans and other loans 452.4 427.5
Less: Finance costs capitalized in
– Intangible assets (57.7) (49.2)
– Property, plant and equipment (8.2) (12.1)
Total 386.5 366.2
The capitalization rate of borrowings costs for 2017 was 20.0% (2016: 21.1%).
163 First Pacific Annual Report 2017
6. Profit Before Taxation from Continuing OperationsUS$ millions Notes 2017 2016
Profit Before Taxation from Continuing Operations is Stated after (Charging)/Crediting
Cost of inventories sold (2,860.3) (2,853.5)
Employees’ remuneration (808.5) (750.0)
Cost of services rendered (568.4) (333.2)
Depreciation 12 (313.7) (267.6)
Amortization of intangible assets(i) 16 (107.5) (98.2)
Loss on remeasurement of previously held interests in joint ventures, net (28.2) –
Impairment losses
– Other intangible assets(ii) 16 (27.4) (12.4)
– Associated companies and joint ventures(ii) (11.3) (16.2)
– Inventories(iii) (7.1) (5.4)
– Goodwill(ii) 15 (7.0) (66.1)
– Available-for-sale assets(ii) (3.1) –
– Accounts receivable(iv) 18(C) (2.8) (2.3)
– Other non-current assets(ii) – (9.9)
Operating lease rentals
– Hire of plant and equipment (20.1) (10.1)
– Land and buildings (18.8) (12.2)
– Others (10.4) (3.5)
Auditor’s remuneration
– Audit services (4.1) (4.1)
– Non-audit services(v) (0.7) (0.3)
Preferred share dividend income from a joint venture 50.4 25.5
Foreign exchange and derivative gains, net 28.7 8.0
Gain on remeasurement of a previously held interest in an associated company 27.6 –
Gain on divestment of interest in an associated company 14.5 –
Dividends income from available-for-sale assets 4.7 5.4
Reversal of provision/(provision) for onerous contracts, net 2.8 (0.9)
Gain on changes in fair value of biological assets 2.6 16.4
Gain on sale of property, plant and equipment 0.6 0.2
Gain on disposal of available-for-sale assets – 2.6
(i) US$80.3 million (2016: US$78.1 million) included in cost of sales, US$23.8 million (2016: US$14.6 million) included in other operating income/(expenses), net and US$3.4 million (2016: US$5.5 million) included in administrative expenses
(ii) Included in other operating income/(expenses), net(iii) Included in cost of sales(iv) Included in selling and distribution expenses(v) Pertained to due diligence, review of continuing connected transactions and other transactions relating to the Group’s business development
164 First Pacific Annual Report 2017
Notes to the Consolidated Financial Statements
7. TaxationNo Hong Kong profits tax (2016: Nil) has been provided as the Group had no estimated assessable profits (2016: Nil) arising in
Hong Kong for the year. Taxation on assessable profits generated outside Hong Kong has been provided at the rates of taxation
prevailing in the countries in which the Company’s subsidiary companies operate.
US$ millions 2017 2016
Subsidiary Companies – OverseasCurrent taxation 305.6 289.4
Deferred taxation 17.3 (3.1)
Total 322.9 286.3
Included within the share of profits less losses of associated companies and joint ventures was taxation of US$99.1 million (2016:
US$90.5 million) which is analyzed as follows:
US$ millions 2017 2016
Associated Companies and Joint Ventures – OverseasCurrent taxation 131.2 138.9
Deferred taxation (32.1) (48.4)
Total 99.1 90.5
A reconciliation between profit before taxation from continuing operations multiplied by the applicable tax rates and the taxation
amount as shown in the consolidated income statement is as follows:
2017 2016
US$ millions % %
Profit Before Taxation from Continuing Operations 884.2 784.1
Notional tax on profit before taxation from continuing operations,
calculated at the rates applicable to profits in the tax
jurisdictions concerned 263.3 29.8 230.7 29.4
Tax effect of:
– Non-deductible expenses 58.6 6.6 58.2 7.4
– Income not subject to tax (15.9) (1.8) (19.2) (2.4)
– Share of profits less losses of associated companies
and joint ventures (53.4) (6.0) (42.8) (5.5)
– Others 70.3 7.9 59.4 7.6
Taxation 322.9 36.5 286.3 36.5
8. A Discontinued OperationThe discontinued operation in 2016 related to Indofood’s 82.9% interest in CMZ which has been classified as a disposal group
held for sale and a discontinued operation since 31 December 2014 and sold by Indofood on 16 December 2016. Following
the completion of the disposal, CMZ ceased to be a subsidiary company of Indofood and the Group. The exchangeable bonds
acquired by Indofood in connection with this transaction were accounted for as available-for-sale assets and were exchanged for
approximately 29.94% interest in CMZ in February 2017. On 26 April 2017, Indofood disposed of its entire 29.94% interest in
CMZ to CMZ BVI for a consideration of S$235.5 million (US$169.9 million).
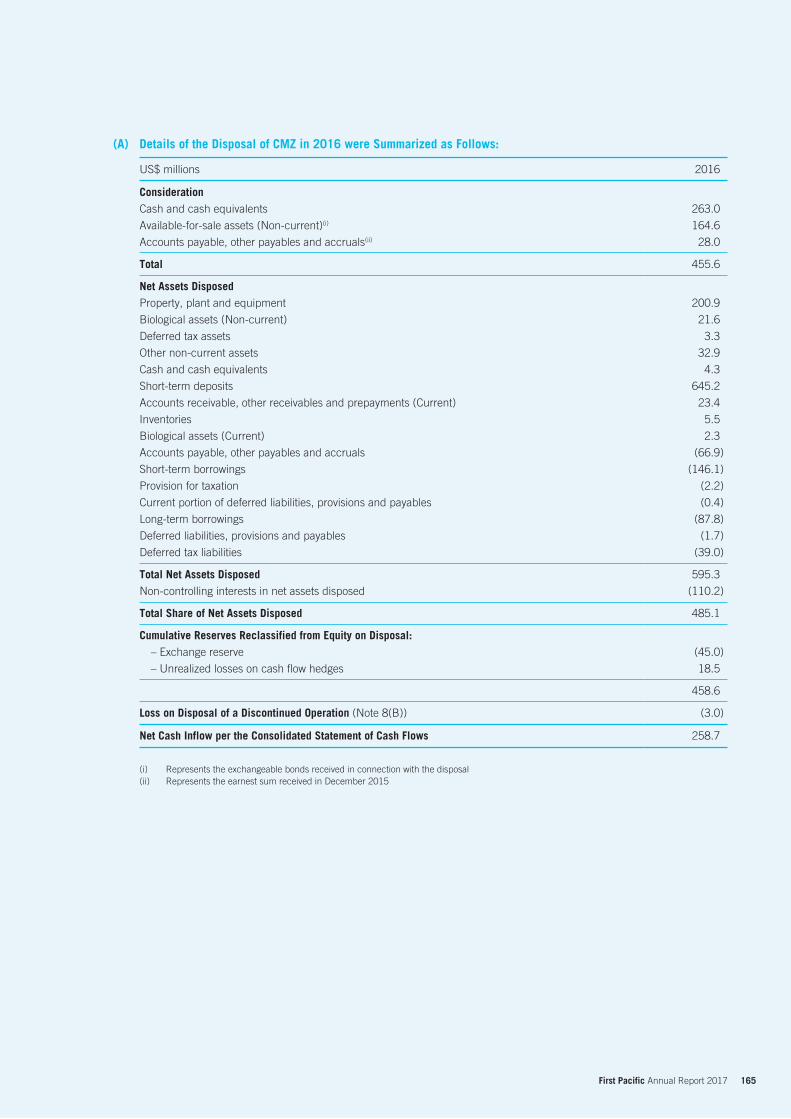
165 First Pacific Annual Report 2017
(A) Details of the Disposal of CMZ in 2016 were Summarized as Follows:
US$ millions 2016
ConsiderationCash and cash equivalents 263.0
Available-for-sale assets (Non-current)(i) 164.6
Accounts payable, other payables and accruals(ii) 28.0
Total 455.6
Net Assets DisposedProperty, plant and equipment 200.9
Biological assets (Non-current) 21.6
Deferred tax assets 3.3
Other non-current assets 32.9
Cash and cash equivalents 4.3
Short-term deposits 645.2
Accounts receivable, other receivables and prepayments (Current) 23.4
Inventories 5.5
Biological assets (Current) 2.3
Accounts payable, other payables and accruals (66.9)
Short-term borrowings (146.1)
Provision for taxation (2.2)
Current portion of deferred liabilities, provisions and payables (0.4)
Long-term borrowings (87.8)
Deferred liabilities, provisions and payables (1.7)
Deferred tax liabilities (39.0)
Total Net Assets Disposed 595.3
Non-controlling interests in net assets disposed (110.2)
Total Share of Net Assets Disposed 485.1
Cumulative Reserves Reclassified from Equity on Disposal:– Exchange reserve (45.0)
– Unrealized losses on cash flow hedges 18.5
458.6
Loss on Disposal of a Discontinued Operation (Note 8(B)) (3.0)
Net Cash Inflow per the Consolidated Statement of Cash Flows 258.7
(i) Represents the exchangeable bonds received in connection with the disposal(ii) Represents the earnest sum received in December 2015
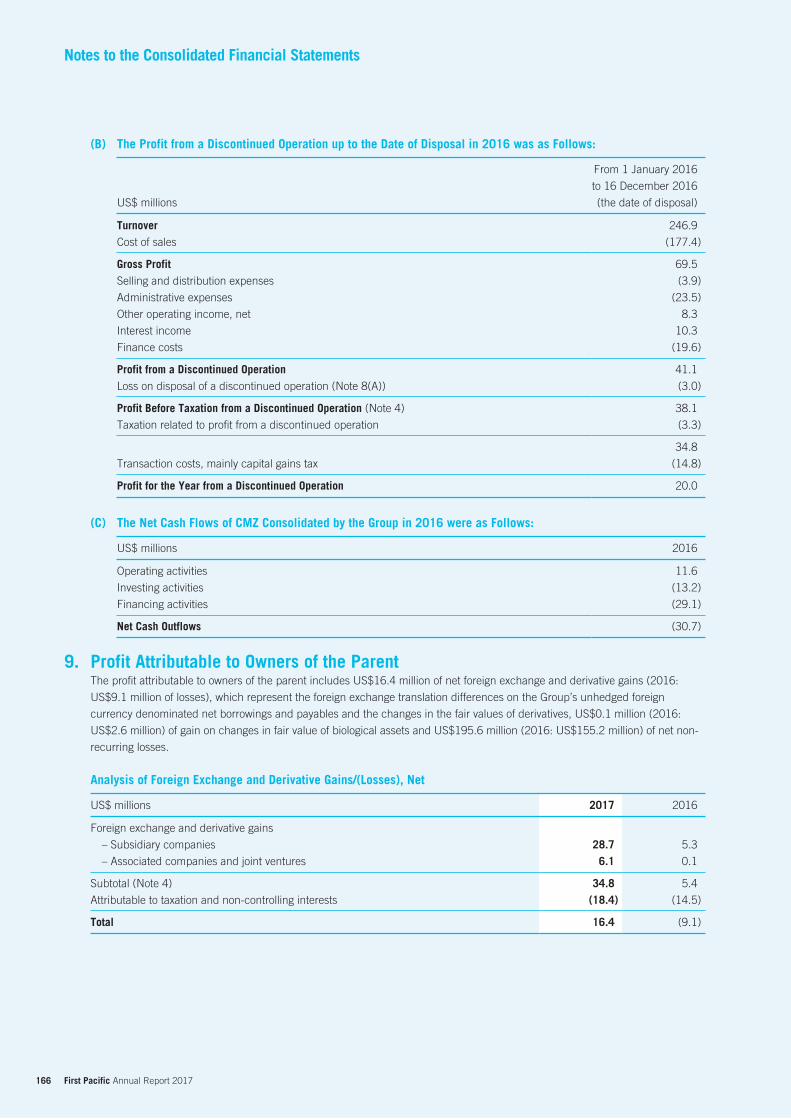
166 First Pacific Annual Report 2017
Notes to the Consolidated Financial Statements
(B) The Profit from a Discontinued Operation up to the Date of Disposal in 2016 was as Follows:
US$ millions
From 1 January 2016
to 16 December 2016
(the date of disposal)
Turnover 246.9
Cost of sales (177.4)
Gross Profit 69.5
Selling and distribution expenses (3.9)
Administrative expenses (23.5)
Other operating income, net 8.3
Interest income 10.3
Finance costs (19.6)
Profit from a Discontinued Operation 41.1
Loss on disposal of a discontinued operation (Note 8(A)) (3.0)
Profit Before Taxation from a Discontinued Operation (Note 4) 38.1
Taxation related to profit from a discontinued operation (3.3)
34.8
Transaction costs, mainly capital gains tax (14.8)
Profit for the Year from a Discontinued Operation 20.0
(C) The Net Cash Flows of CMZ Consolidated by the Group in 2016 were as Follows:
US$ millions 2016
Operating activities 11.6
Investing activities (13.2)
Financing activities (29.1)
Net Cash Outflows (30.7)
9. Profit Attributable to Owners of the ParentThe profit attributable to owners of the parent includes US$16.4 million of net foreign exchange and derivative gains (2016:
US$9.1 million of losses), which represent the foreign exchange translation differences on the Group’s unhedged foreign
currency denominated net borrowings and payables and the changes in the fair values of derivatives, US$0.1 million (2016:
US$2.6 million) of gain on changes in fair value of biological assets and US$195.6 million (2016: US$155.2 million) of net non-
recurring losses.
Analysis of Foreign Exchange and Derivative Gains/(Losses), Net
US$ millions 2017 2016
Foreign exchange and derivative gains
– Subsidiary companies 28.7 5.3
– Associated companies and joint ventures 6.1 0.1
Subtotal (Note 4) 34.8 5.4
Attributable to taxation and non-controlling interests (18.4) (14.5)
Total 16.4 (9.1)
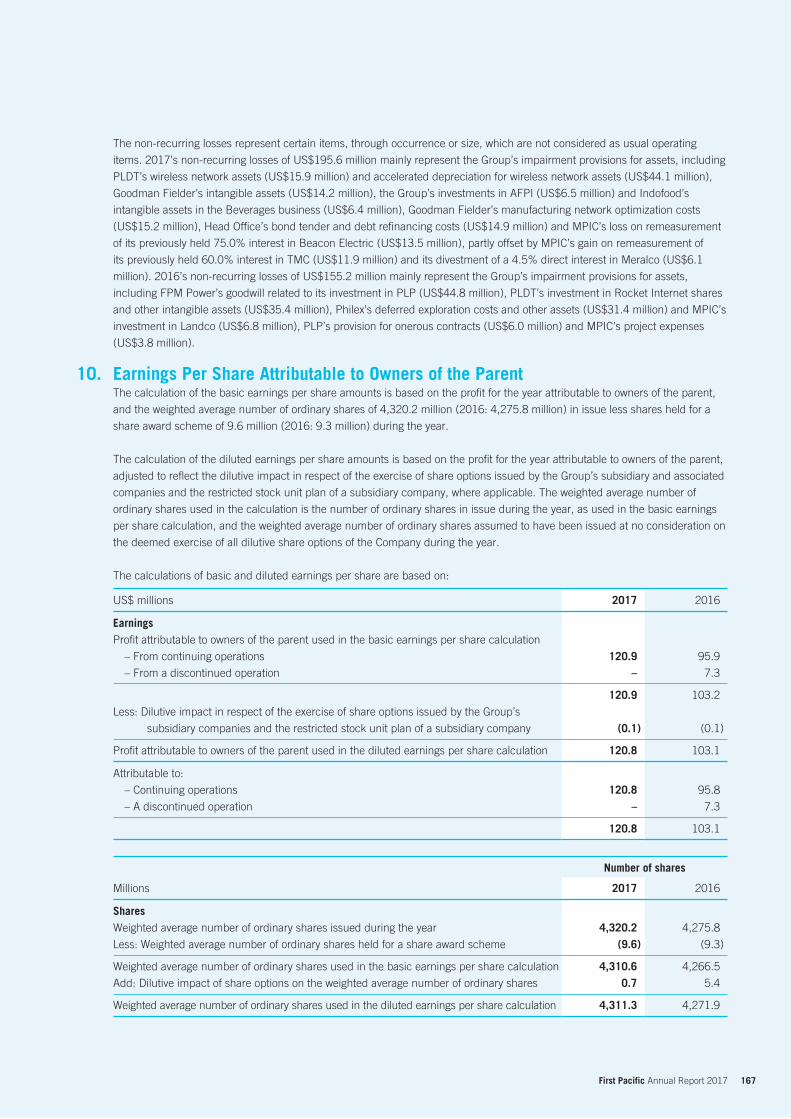
167 First Pacific Annual Report 2017
The non-recurring losses represent certain items, through occurrence or size, which are not considered as usual operating
items. 2017’s non-recurring losses of US$195.6 million mainly represent the Group’s impairment provisions for assets, including
PLDT’s wireless network assets (US$15.9 million) and accelerated depreciation for wireless network assets (US$44.1 million),
Goodman Fielder’s intangible assets (US$14.2 million), the Group’s investments in AFPI (US$6.5 million) and Indofood’s
intangible assets in the Beverages business (US$6.4 million), Goodman Fielder’s manufacturing network optimization costs
(US$15.2 million), Head Office’s bond tender and debt refinancing costs (US$14.9 million) and MPIC’s loss on remeasurement
of its previously held 75.0% interest in Beacon Electric (US$13.5 million), partly offset by MPIC’s gain on remeasurement of
its previously held 60.0% interest in TMC (US$11.9 million) and its divestment of a 4.5% direct interest in Meralco (US$6.1
million). 2016’s non-recurring losses of US$155.2 million mainly represent the Group’s impairment provisions for assets,
including FPM Power’s goodwill related to its investment in PLP (US$44.8 million), PLDT’s investment in Rocket Internet shares
and other intangible assets (US$35.4 million), Philex’s deferred exploration costs and other assets (US$31.4 million) and MPIC’s
investment in Landco (US$6.8 million), PLP’s provision for onerous contracts (US$6.0 million) and MPIC’s project expenses
(US$3.8 million).
Earnings Per Share Attributable to Owners of the ParentThe calculation of the basic earnings per share amounts is based on the profit for the year attributable to owners of the parent,
and the weighted average number of ordinary shares of 4,320.2 million (2016: 4,275.8 million) in issue less shares held for a
share award scheme of 9.6 million (2016: 9.3 million) during the year.
The calculation of the diluted earnings per share amounts is based on the profit for the year attributable to owners of the parent,
adjusted to reflect the dilutive impact in respect of the exercise of share options issued by the Group’s subsidiary and associated
companies and the restricted stock unit plan of a subsidiary company, where applicable. The weighted average number of
ordinary shares used in the calculation is the number of ordinary shares in issue during the year, as used in the basic earnings
per share calculation, and the weighted average number of ordinary shares assumed to have been issued at no consideration on
the deemed exercise of all dilutive share options of the Company during the year.
The calculations of basic and diluted earnings per share are based on:
US$ millions 2017 2016
EarningsProfit attributable to owners of the parent used in the basic earnings per share calculation
– From continuing operations 120.9 95.9
– From a discontinued operation – 7.3
120.9 103.2
Less: Dilutive impact in respect of the exercise of share options issued by the Group’s
subsidiary companies and the restricted stock unit plan of a subsidiary company (0.1) (0.1)
Profit attributable to owners of the parent used in the diluted earnings per share calculation 120.8 103.1
Attributable to:
– Continuing operations 120.8 95.8
– A discontinued operation – 7.3
120.8 103.1
Number of shares
Millions 2017 2016
SharesWeighted average number of ordinary shares issued during the year 4,320.2 4,275.8
Less: Weighted average number of ordinary shares held for a share award scheme (9.6) (9.3)
Weighted average number of ordinary shares used in the basic earnings per share calculation 4,310.6 4,266.5
Add: Dilutive impact of share options on the weighted average number of ordinary shares 0.7 5.4
Weighted average number of ordinary shares used in the diluted earnings per share calculation 4,311.3 4,271.9
10.
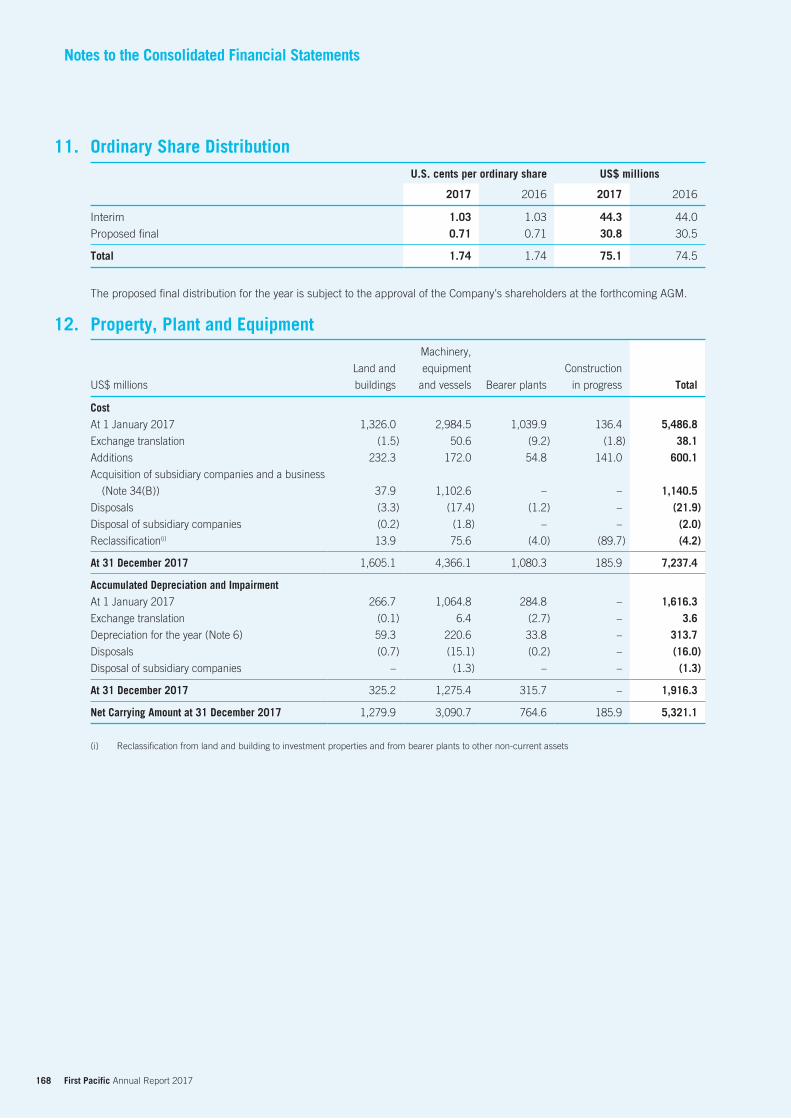
168 First Pacific Annual Report 2017
Notes to the Consolidated Financial Statements
Ordinary Share DistributionU.S. cents per ordinary share US$ millions
2017 2016 2017 2016
Interim 1.03 1.03 44.3 44.0
Proposed final 0.71 0.71 30.8 30.5
Total 1.74 1.74 75.1 74.5
The proposed final distribution for the year is subject to the approval of the Company’s shareholders at the forthcoming AGM.
Property, Plant and Equipment
US$ millions
Land and
buildings
Machinery,
equipment
and vessels Bearer plants
Construction
in progress Total
CostAt 1 January 2017 1,326.0 2,984.5 1,039.9 136.4 5,486.8Exchange translation (1.5) 50.6 (9.2) (1.8) 38.1Additions 232.3 172.0 54.8 141.0 600.1Acquisition of subsidiary companies and a business
(Note 34(B)) 37.9 1,102.6 – – 1,140.5Disposals (3.3) (17.4) (1.2) – (21.9)Disposal of subsidiary companies (0.2) (1.8) – – (2.0)Reclassification(i) 13.9 75.6 (4.0) (89.7) (4.2) At 31 December 2017 1,605.1 4,366.1 1,080.3 185.9 7,237.4 Accumulated Depreciation and ImpairmentAt 1 January 2017 266.7 1,064.8 284.8 – 1,616.3Exchange translation (0.1) 6.4 (2.7) – 3.6Depreciation for the year (Note 6) 59.3 220.6 33.8 – 313.7Disposals (0.7) (15.1) (0.2) – (16.0)Disposal of subsidiary companies – (1.3) – – (1.3) At 31 December 2017 325.2 1,275.4 315.7 – 1,916.3 Net Carrying Amount at 31 December 2017 1,279.9 3,090.7 764.6 185.9 5,321.1
(i) Reclassification from land and building to investment properties and from bearer plants to other non-current assets
11.
12.
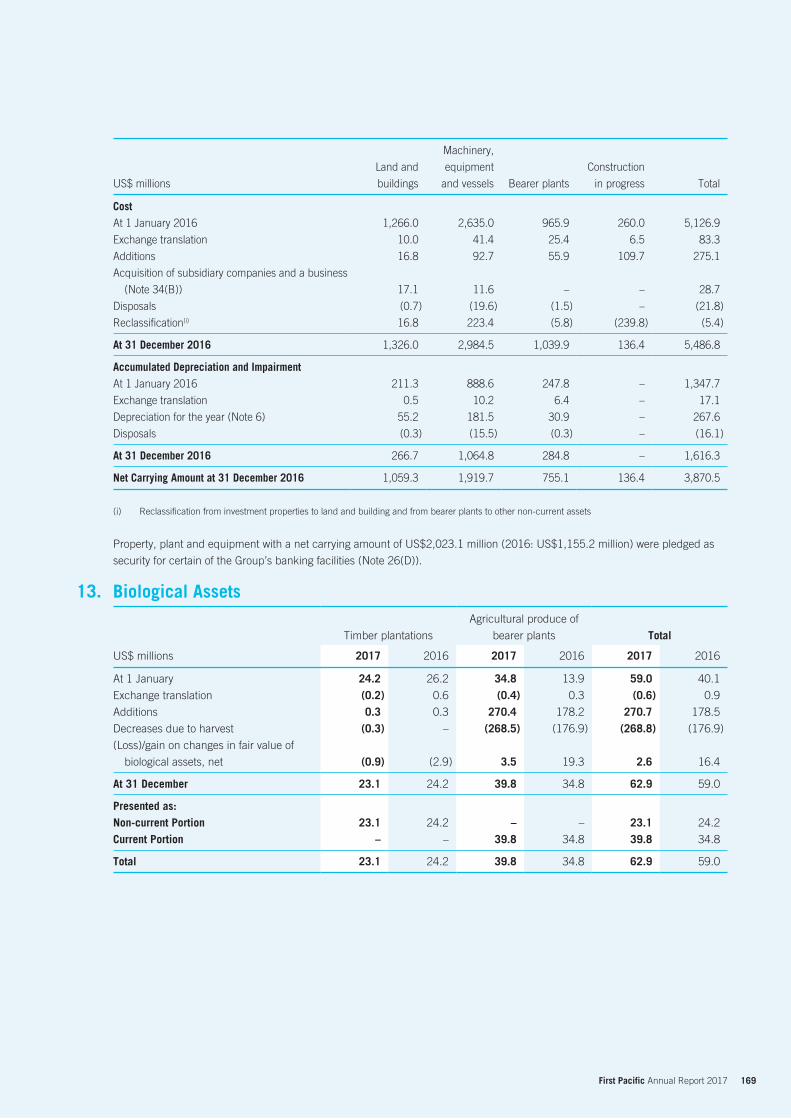
169 First Pacific Annual Report 2017
US$ millions
Land and
buildings
Machinery,
equipment
and vessels Bearer plants
Construction
in progress Total
CostAt 1 January 2016 1,266.0 2,635.0 965.9 260.0 5,126.9
Exchange translation 10.0 41.4 25.4 6.5 83.3
Additions 16.8 92.7 55.9 109.7 275.1
Acquisition of subsidiary companies and a business
(Note 34(B)) 17.1 11.6 – – 28.7
Disposals (0.7) (19.6) (1.5) – (21.8)
Reclassification(i) 16.8 223.4 (5.8) (239.8) (5.4)
At 31 December 2016 1,326.0 2,984.5 1,039.9 136.4 5,486.8
Accumulated Depreciation and ImpairmentAt 1 January 2016 211.3 888.6 247.8 – 1,347.7
Exchange translation 0.5 10.2 6.4 – 17.1
Depreciation for the year (Note 6) 55.2 181.5 30.9 – 267.6
Disposals (0.3) (15.5) (0.3) – (16.1)
At 31 December 2016 266.7 1,064.8 284.8 – 1,616.3
Net Carrying Amount at 31 December 2016 1,059.3 1,919.7 755.1 136.4 3,870.5
(i) Reclassification from investment properties to land and building and from bearer plants to other non-current assets
Property, plant and equipment with a net carrying amount of US$2,023.1 million (2016: US$1,155.2 million) were pledged as
security for certain of the Group’s banking facilities (Note 26(D)).
Biological Assets
Timber plantations
Agricultural produce of
bearer plants Total
US$ millions 2017 2016 2017 2016 2017 2016
At 1 January 24.2 26.2 34.8 13.9 59.0 40.1
Exchange translation (0.2) 0.6 (0.4) 0.3 (0.6) 0.9
Additions 0.3 0.3 270.4 178.2 270.7 178.5
Decreases due to harvest (0.3) – (268.5) (176.9) (268.8) (176.9)
(Loss)/gain on changes in fair value of
biological assets, net (0.9) (2.9) 3.5 19.3 2.6 16.4
At 31 December 23.1 24.2 39.8 34.8 62.9 59.0
Presented as:Non-current Portion 23.1 24.2 – – 23.1 24.2
Current Portion – – 39.8 34.8 39.8 34.8
Total 23.1 24.2 39.8 34.8 62.9 59.0
13.
170 First Pacific Annual Report 2017
Notes to the Consolidated Financial Statements
(A) The Group’s biological assets primarily comprise timber plantations, and agricultural produce of bearer plants owned
by Indofood. For timber plantations, the Group appointed an independent valuer, KJPP Benedictus Darmapuspita dan
Rekan, to determine their fair value annually and any resultant gains or losses arising from the changes in fair values
is recognized in the profit or loss. The independent valuer adopted the income approach for the fair valuation of timber
using a discounted cash flow model. The cash flow models estimate the relevant future cash flows which are expected to
be generated in the future, and are discounted to the present value by using a discount rate. For the agricultural produce
of bearer plants, which mainly comprise FFB and sugar cane, the Group adopted the income approach to measure their
fair value. For the valuation of unharvested FFB, the Group has applied the actual harvest data subsequent to year end to
derive their fair value at year end. For the valuation of sugar cane, the Group has applied discounted cash flow model to
derive its fair value.
(B) Timber plantations – Key assumptions applied in determining the fair values of the timber plantations are as follows:
(a) Timber trees are available for harvest only once about eight years from initial planting.
(b) Discount rate used represents the asset specific rate for the Group’s timber plantation operations which is applied in
the discounted future cash flows calculation.
(c) The projected selling price of logs over the projection period are based on the actual domestic price of the produce
which is extrapolated based on changes of plywood log price published by World Bank.
(C) FFB – Key assumptions applied determining the fair values of FFB are as follows:
(a) Estimated volume of subsequent harvest as of reporting date.
(b) Selling price of FFB based on the market price at year end.
(D) Sugar cane – Key assumptions applied in determining the fair values of the sugar cane are as follows:
(a) Cane trees are available for annual harvest for 12 months after initial planting.
(b) Discount rate used represents the asset specific rate for the Group’s sugar cane produce which is applied in the
discounted future cash flows calculation.
(c) The projected selling price of sugar over the projection period is based on the extrapolation of historical selling prices
and the forecasted price trend from the World Bank or the minimum sugar price imposed by the Ministry of Trade of
Indonesia, whichever is higher.
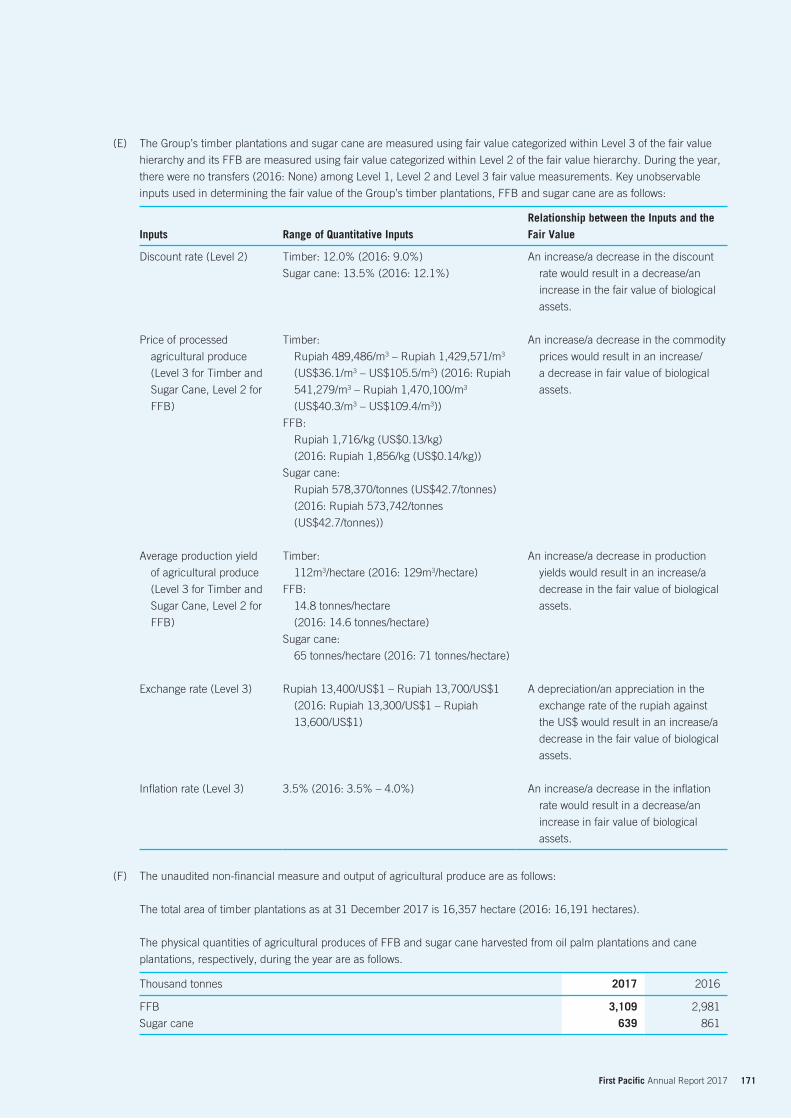
171 First Pacific Annual Report 2017
(E) The Group’s timber plantations and sugar cane are measured using fair value categorized within Level 3 of the fair value
hierarchy and its FFB are measured using fair value categorized within Level 2 of the fair value hierarchy. During the year,
there were no transfers (2016: None) among Level 1, Level 2 and Level 3 fair value measurements. Key unobservable
inputs used in determining the fair value of the Group’s timber plantations, FFB and sugar cane are as follows:
Inputs Range of Quantitative InputsRelationship between the Inputs and the Fair Value
Discount rate (Level 2) Timber: 12.0% (2016: 9.0%)
Sugar cane: 13.5% (2016: 12.1%)
An increase/a decrease in the discount
rate would result in a decrease/an
increase in the fair value of biological
assets.
Price of processed
agricultural produce
(Level 3 for Timber and
Sugar Cane, Level 2 for
FFB)
Timber:
Rupiah 489,486/m3 – Rupiah 1,429,571/m3
(US$36.1/m3 – US$105.5/m3) (2016: Rupiah
541,279/m3 – Rupiah 1,470,100/m3
(US$40.3/m3 – US$109.4/m3))
FFB:
Rupiah 1,716/kg (US$0.13/kg)
(2016: Rupiah 1,856/kg (US$0.14/kg))
Sugar cane:
Rupiah 578,370/tonnes (US$42.7/tonnes)
(2016: Rupiah 573,742/tonnes
(US$42.7/tonnes))
An increase/a decrease in the commodity
prices would result in an increase/
a decrease in fair value of biological
assets.
Average production yield
of agricultural produce
(Level 3 for Timber and
Sugar Cane, Level 2 for
FFB)
Timber:
112m3/hectare (2016: 129m3/hectare)
FFB:
14.8 tonnes/hectare
(2016: 14.6 tonnes/hectare)
Sugar cane:
65 tonnes/hectare (2016: 71 tonnes/hectare)
An increase/a decrease in production
yields would result in an increase/a
decrease in the fair value of biological
assets.
Exchange rate (Level 3) Rupiah 13,400/US$1 – Rupiah 13,700/US$1
(2016: Rupiah 13,300/US$1 – Rupiah
13,600/US$1)
A depreciation/an appreciation in the
exchange rate of the rupiah against
the US$ would result in an increase/a
decrease in the fair value of biological
assets.
Inflation rate (Level 3) 3.5% (2016: 3.5% – 4.0%) An increase/a decrease in the inflation
rate would result in a decrease/an
increase in fair value of biological
assets.
(F) The unaudited non-financial measure and output of agricultural produce are as follows:
The total area of timber plantations as at 31 December 2017 is 16,357 hectare (2016: 16,191 hectares).
The physical quantities of agricultural produces of FFB and sugar cane harvested from oil palm plantations and cane
plantations, respectively, during the year are as follows.
Thousand tonnes 2017 2016
FFB 3,109 2,981
Sugar cane 639 861
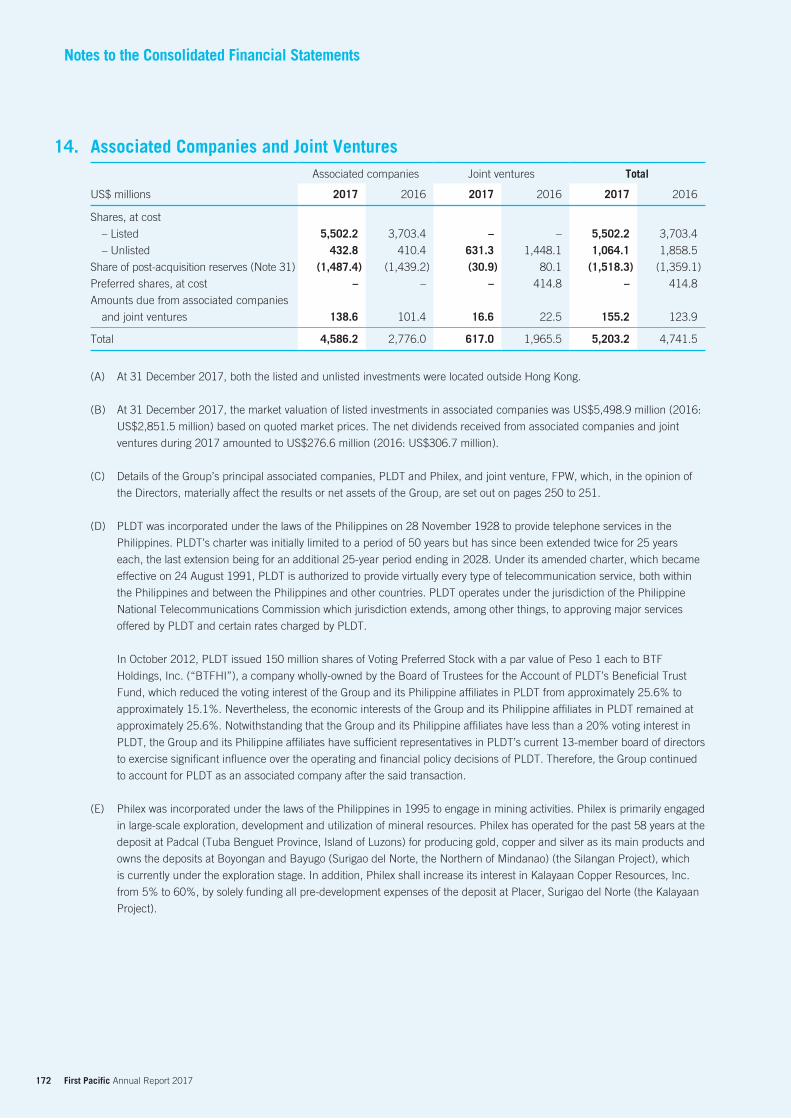
172 First Pacific Annual Report 2017
Notes to the Consolidated Financial Statements
Associated Companies and Joint VenturesAssociated companies Joint ventures Total
US$ millions 2017 2016 2017 2016 2017 2016
Shares, at cost
– Listed 5,502.2 3,703.4 – – 5,502.2 3,703.4
– Unlisted 432.8 410.4 631.3 1,448.1 1,064.1 1,858.5
Share of post-acquisition reserves (Note 31) (1,487.4) (1,439.2) (30.9) 80.1 (1,518.3) (1,359.1)
Preferred shares, at cost – – – 414.8 – 414.8
Amounts due from associated companies
and joint ventures 138.6 101.4 16.6 22.5 155.2 123.9
Total 4,586.2 2,776.0 617.0 1,965.5 5,203.2 4,741.5
(A) At 31 December 2017, both the listed and unlisted investments were located outside Hong Kong.
(B) At 31 December 2017, the market valuation of listed investments in associated companies was US$5,498.9 million (2016:
US$2,851.5 million) based on quoted market prices. The net dividends received from associated companies and joint
ventures during 2017 amounted to US$276.6 million (2016: US$306.7 million).
(C) Details of the Group’s principal associated companies, PLDT and Philex, and joint venture, FPW, which, in the opinion of
the Directors, materially affect the results or net assets of the Group, are set out on pages 250 to 251.
(D) PLDT was incorporated under the laws of the Philippines on 28 November 1928 to provide telephone services in the
Philippines. PLDT’s charter was initially limited to a period of 50 years but has since been extended twice for 25 years
each, the last extension being for an additional 25-year period ending in 2028. Under its amended charter, which became
effective on 24 August 1991, PLDT is authorized to provide virtually every type of telecommunication service, both within
the Philippines and between the Philippines and other countries. PLDT operates under the jurisdiction of the Philippine
National Telecommunications Commission which jurisdiction extends, among other things, to approving major services
offered by PLDT and certain rates charged by PLDT.
In October 2012, PLDT issued 150 million shares of Voting Preferred Stock with a par value of Peso 1 each to BTF
Holdings, Inc. (“BTFHI”), a company wholly-owned by the Board of Trustees for the Account of PLDT’s Beneficial Trust
Fund, which reduced the voting interest of the Group and its Philippine affiliates in PLDT from approximately 25.6% to
approximately 15.1%. Nevertheless, the economic interests of the Group and its Philippine affiliates in PLDT remained at
approximately 25.6%. Notwithstanding that the Group and its Philippine affiliates have less than a 20% voting interest in
PLDT, the Group and its Philippine affiliates have sufficient representatives in PLDT’s current 13-member board of directors
to exercise significant influence over the operating and financial policy decisions of PLDT. Therefore, the Group continued
to account for PLDT as an associated company after the said transaction.
(E) Philex was incorporated under the laws of the Philippines in 1995 to engage in mining activities. Philex is primarily engaged
in large-scale exploration, development and utilization of mineral resources. Philex has operated for the past 58 years at the
deposit at Padcal (Tuba Benguet Province, Island of Luzons) for producing gold, copper and silver as its main products and
owns the deposits at Boyongan and Bayugo (Surigao del Norte, the Northern of Mindanao) (the Silangan Project), which
is currently under the exploration stage. In addition, Philex shall increase its interest in Kalayaan Copper Resources, Inc.
from 5% to 60%, by solely funding all pre-development expenses of the deposit at Placer, Surigao del Norte (the Kalayaan
Project).
14.
173 First Pacific Annual Report 2017
(F) Meralco was incorporated under the laws of the Philippines in 1903 and was granted a franchise to provide electric power
distribution services in the Philippines. In June 2003, Meralco was granted a new 25-year franchise to construct, operate,
and maintain an electric distribution system in the cities and municipalities of Bulacan, Cavite, Metro Manila, and Rizal
and certain cities, municipalities, and barangays in Batangas, Laguna, Pampanga, and Quezon. Meralco is subject to the
ratemaking regulations and regulatory policies of the Philippine Energy Regulatory Commission.
Beacon Electric, a joint venture formed by MPIC and PLDT Communications and Energy Ventures Inc. (PCEV, a
99.9%-owned subsidiary company of PLDT) with the main purpose to hold the respective shareholdings in Meralco. On 30
May 2016, MPIC acquired from PCEV a 25.0% interest in Beacon Electric, which increased its interest in Beacon Electric
to 75.0% from 50.0%. In consideration of the agreement of PCEV to receiving the purchase price on installments, MPIC
agreed that for as long as either (a) PCEV owns not less than 20.0% of the outstanding capital stock of Beacon Electric or
(b) the purchase price for MPIC’s acquisition of these Beacon shares has not been fully paid by MPIC, PCEV shall retain its
right to vote for 50.0% of the outstanding capital stock of Beacon Electric. On 27 June 2017, MPIC acquired the remaining
25% interest in Beacon Electric from PCEV. Following the completion of the acquisition, MPIC’s economic interest in
Beacon Electric increased to 100% from 75% and Beacon Electric become a subsidiary company of MPIC.
In March 2010, MPIC subscribed Pesos 8.0 billion (US$161.1 million) of Beacon Electric’s preferred shares. In June
2012, MPIC acquired approximately Pesos 3.6 billion (US$71.7 million) of Beacon Electric’s preferred shares. In May
2016, MPIC subscribed Pesos 3.5 billion (US$70.4 million) of Beacon Electric’s preferred shares and acquired Pesos 5.8
billion (US$116.7 million) (with a book carrying amount, which reflected the effect of discounting, of Pesos 5.5 billion or
US$111.6 million) of Beacon Electric’s preferred shares from PCEV (Note 38(I)). The preferred shares of Beacon Electric
are non-voting, non-convertible to common shares or any shares of any class of Beacon Electric, have no pre-emptive
rights to subscribe to any share or convertible debt securities or warrants issued or sold by Beacon Electric and entitle the
preference shareholder to liquidation preference and yearly cumulative dividends.
Meralco is an associated company of the Group in view of the Group’s 10.5% (2016: 15.0%) direct interest in Meralco
acquired and indirect interests in Meralco held through Beacon Electric as mentioned above, which allows the Group to
exercise significant influence over Meralco by virtue of power to participate in its operating and financial policy decisions.
(G) FPW was incorporated under the laws of Singapore on 27 June 2014, which has become a 50%/50% joint venture owned
by the Group and Wilmar since 17 February 2015. FPW’s principal investment is a 100% interest in Goodman Fielder,
following FPW’s acquisition of an additional 99.7% interest in Goodman Fielder on 17 March 2015. Goodman Fielder
is primarily engaged in the manufacturing, marketing and distribution of food ingredients and consumer branded food,
beverage and related products, including packaged bread and other related goods, dairy products, flour, edible oils and
meal components in Australasia.
At 31 December 2017, the loan to FPW of US$413.7 million (2016: US$381.6 million) is unsecured, interest-free and have
no fixed terms of repayment.
(H) Amounts due from associated companies and joint ventures represent the Group’s investment in SMECI’s convertible
notes of US$100.9 million (2016: US$101.4 million) and advances to associated companies and joint ventures of US$54.3
million (2016: US$22.5 million). The convertible notes were stated at cost as there are no reliable sources and bases
for subsequent fair value determination and the terms of the convertible notes have been disclosed in Note 38(G). The
advances to associated companies and joint ventures are unsecured, interest-free and have no fixed terms of repayment.
(I) At 31 December 2017, the Group’s share of its major joint venture’s own contracted capital commitments amounted
to US$13.1 million (2016: US$2.2 million), which principally related to purchase of property, plant and equipment by
Goodman Fielder.
(J) The Group’s associated companies and joint ventures are involved in certain legal, contractual and regulatory matters
arising from the ordinary course of business. The management of the associated companies and joint ventures, together
with their legal counsels, reassess these matters regularly to consider any new relevant information and estimates.
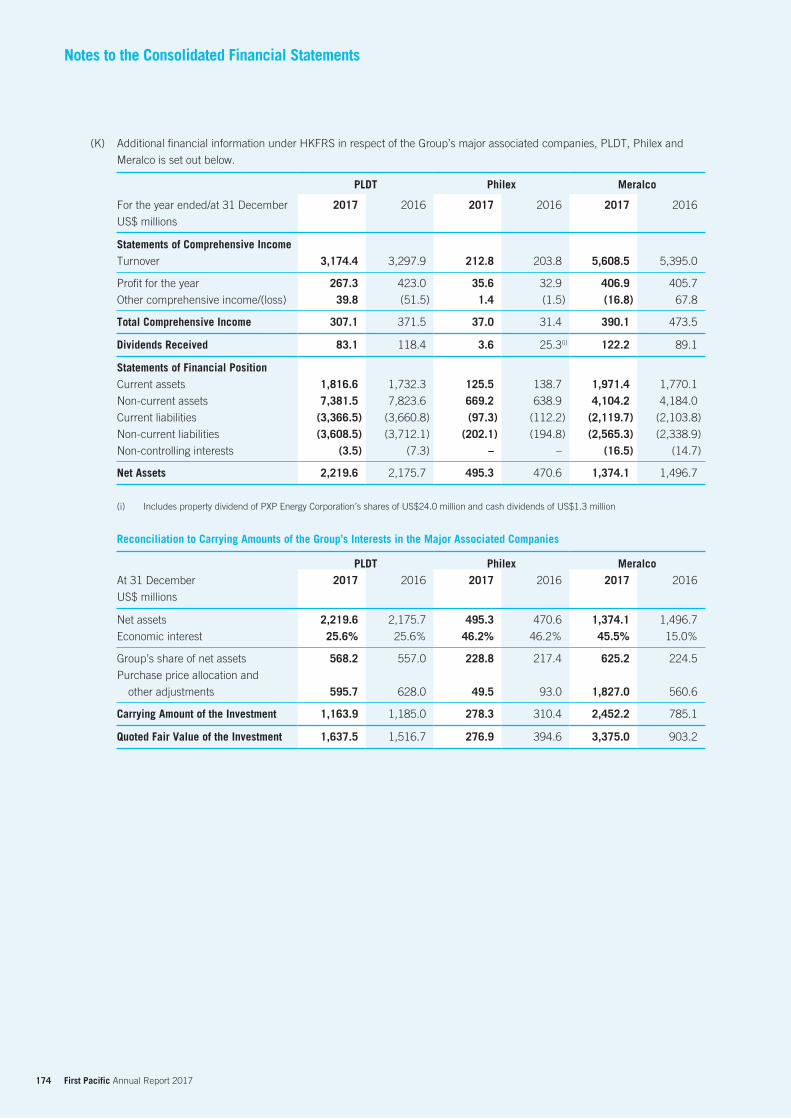
174 First Pacific Annual Report 2017
Notes to the Consolidated Financial Statements
(K) Additional financial information under HKFRS in respect of the Group’s major associated companies, PLDT, Philex and
Meralco is set out below.
PLDT Philex Meralco
For the year ended/at 31 December
US$ millions
2017 2016 2017 2016 2017 2016
Statements of Comprehensive IncomeTurnover 3,174.4 3,297.9 212.8 203.8 5,608.5 5,395.0
Profit for the year 267.3 423.0 35.6 32.9 406.9 405.7
Other comprehensive income/(loss) 39.8 (51.5) 1.4 (1.5) (16.8) 67.8
Total Comprehensive Income 307.1 371.5 37.0 31.4 390.1 473.5
Dividends Received 83.1 118.4 3.6 25.3(i) 122.2 89.1
Statements of Financial PositionCurrent assets 1,816.6 1,732.3 125.5 138.7 1,971.4 1,770.1
Non-current assets 7,381.5 7,823.6 669.2 638.9 4,104.2 4,184.0
Current liabilities (3,366.5) (3,660.8) (97.3) (112.2) (2,119.7) (2,103.8)
Non-current liabilities (3,608.5) (3,712.1) (202.1) (194.8) (2,565.3) (2,338.9)
Non-controlling interests (3.5) (7.3) – – (16.5) (14.7)
Net Assets 2,219.6 2,175.7 495.3 470.6 1,374.1 1,496.7
(i) Includes property dividend of PXP Energy Corporation’s shares of US$24.0 million and cash dividends of US$1.3 million
Reconciliation to Carrying Amounts of the Group’s Interests in the Major Associated Companies
PLDT Philex MeralcoAt 31 December
US$ millions
2017 2016 2017 2016 2017 2016
Net assets 2,219.6 2,175.7 495.3 470.6 1,374.1 1,496.7
Economic interest 25.6% 25.6% 46.2% 46.2% 45.5% 15.0%
Group’s share of net assets 568.2 557.0 228.8 217.4 625.2 224.5
Purchase price allocation and
other adjustments 595.7 628.0 49.5 93.0 1,827.0 560.6
Carrying Amount of the Investment 1,163.9 1,185.0 278.3 310.4 2,452.2 785.1
Quoted Fair Value of the Investment 1,637.5 1,516.7 276.9 394.6 3,375.0 903.2
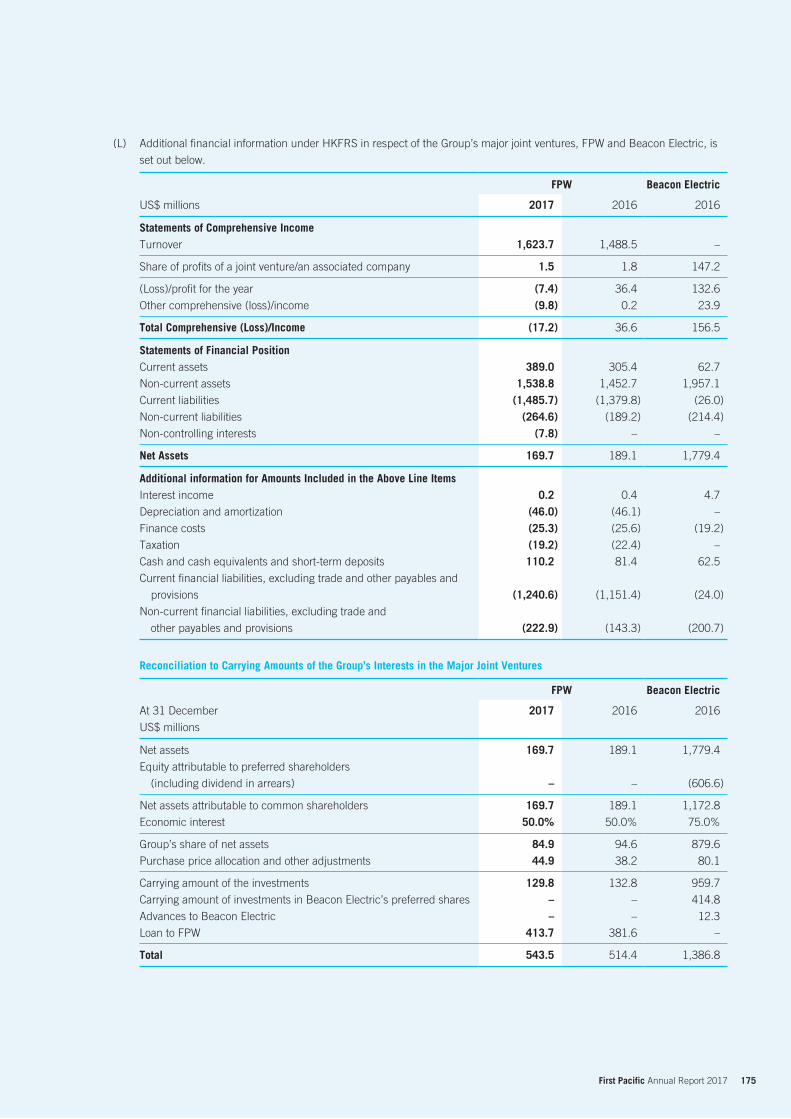
175 First Pacific Annual Report 2017
(L) Additional financial information under HKFRS in respect of the Group’s major joint ventures, FPW and Beacon Electric, is
set out below.
FPW Beacon Electric
US$ millions 2017 2016 2016
Statements of Comprehensive IncomeTurnover 1,623.7 1,488.5 –
Share of profits of a joint venture/an associated company 1.5 1.8 147.2
(Loss)/profit for the year (7.4) 36.4 132.6
Other comprehensive (loss)/income (9.8) 0.2 23.9
Total Comprehensive (Loss)/Income (17.2) 36.6 156.5
Statements of Financial PositionCurrent assets 389.0 305.4 62.7
Non-current assets 1,538.8 1,452.7 1,957.1
Current liabilities (1,485.7) (1,379.8) (26.0)
Non-current liabilities (264.6) (189.2) (214.4)
Non-controlling interests (7.8) – –
Net Assets 169.7 189.1 1,779.4
Additional information for Amounts Included in the Above Line ItemsInterest income 0.2 0.4 4.7
Depreciation and amortization (46.0) (46.1) –
Finance costs (25.3) (25.6) (19.2)
Taxation (19.2) (22.4) –
Cash and cash equivalents and short-term deposits 110.2 81.4 62.5
Current financial liabilities, excluding trade and other payables and
provisions (1,240.6) (1,151.4) (24.0)
Non-current financial liabilities, excluding trade and
other payables and provisions (222.9) (143.3) (200.7)
Reconciliation to Carrying Amounts of the Group’s Interests in the Major Joint Ventures
FPW Beacon Electric
At 31 December
US$ millions
2017 2016 2016
Net assets 169.7 189.1 1,779.4
Equity attributable to preferred shareholders
(including dividend in arrears) – – (606.6)
Net assets attributable to common shareholders 169.7 189.1 1,172.8
Economic interest 50.0% 50.0% 75.0%
Group’s share of net assets 84.9 94.6 879.6
Purchase price allocation and other adjustments 44.9 38.2 80.1
Carrying amount of the investments 129.8 132.8 959.7
Carrying amount of investments in Beacon Electric’s preferred shares – – 414.8
Advances to Beacon Electric – – 12.3
Loan to FPW 413.7 381.6 –
Total 543.5 514.4 1,386.8
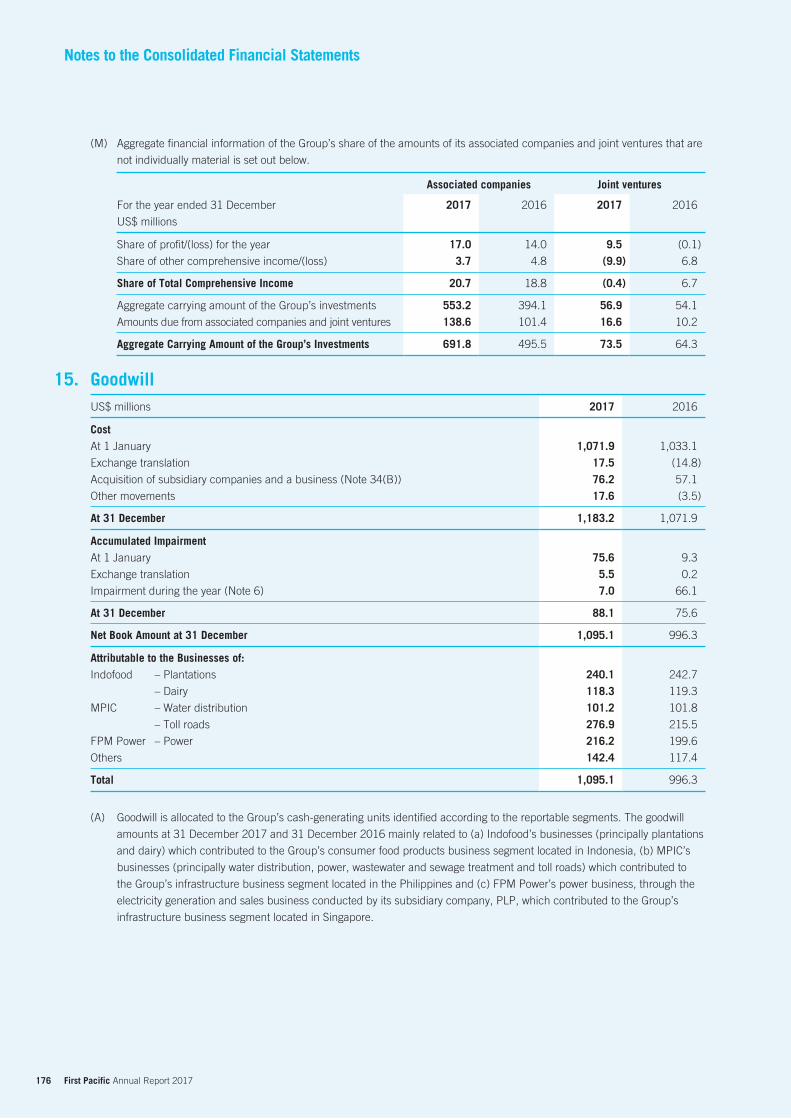
176 First Pacific Annual Report 2017
Notes to the Consolidated Financial Statements
(M) Aggregate financial information of the Group’s share of the amounts of its associated companies and joint ventures that are
not individually material is set out below.
Associated companies Joint ventures
For the year ended 31 December
US$ millions
2017 2016 2017 2016
Share of profit/(loss) for the year 17.0 14.0 9.5 (0.1)
Share of other comprehensive income/(loss) 3.7 4.8 (9.9) 6.8
Share of Total Comprehensive Income 20.7 18.8 (0.4) 6.7
Aggregate carrying amount of the Group’s investments 553.2 394.1 56.9 54.1
Amounts due from associated companies and joint ventures 138.6 101.4 16.6 10.2
Aggregate Carrying Amount of the Group’s Investments 691.8 495.5 73.5 64.3
GoodwillUS$ millions 2017 2016
CostAt 1 January 1,071.9 1,033.1
Exchange translation 17.5 (14.8)
Acquisition of subsidiary companies and a business (Note 34(B)) 76.2 57.1
Other movements 17.6 (3.5)
At 31 December 1,183.2 1,071.9
Accumulated ImpairmentAt 1 January 75.6 9.3
Exchange translation 5.5 0.2
Impairment during the year (Note 6) 7.0 66.1
At 31 December 88.1 75.6
Net Book Amount at 31 December 1,095.1 996.3
Attributable to the Businesses of:Indofood – Plantations 240.1 242.7
– Dairy 118.3 119.3
MPIC – Water distribution 101.2 101.8
– Toll roads 276.9 215.5
FPM Power – Power 216.2 199.6
Others 142.4 117.4
Total 1,095.1 996.3
(A) Goodwill is allocated to the Group’s cash-generating units identified according to the reportable segments. The goodwill
amounts at 31 December 2017 and 31 December 2016 mainly related to (a) Indofood’s businesses (principally plantations
and dairy) which contributed to the Group’s consumer food products business segment located in Indonesia, (b) MPIC’s
businesses (principally water distribution, power, wastewater and sewage treatment and toll roads) which contributed to
the Group’s infrastructure business segment located in the Philippines and (c) FPM Power’s power business, through the
electricity generation and sales business conducted by its subsidiary company, PLP, which contributed to the Group’s
infrastructure business segment located in Singapore.
15.
177 First Pacific Annual Report 2017
(B) In assessing the impairment for goodwill, the Group compares the carrying amounts of the underlying assets against their recoverable amounts (the higher of the assets’ fair value less costs of disposal and their value in use). The recoverable amounts of Indofood’s, MPIC’s and PLP’s businesses have been determined based on value in use calculations, using cash flow projections covering periods from 5 years (for established plantations and the dairy companies) up to 10 years (for the plantation estates in early development stage) (2016: 5 years (for established plantations and the dairy companies) to 10 years (for the plantation estates in early development stage)) for Indofood’s businesses, 18 to 20 years (2016: 19 to 21 years) of concession lives for MPIC’s water distribution business, 20 to 36 years (2016: 17 to 29 years) of concession lives for MPIC’s toll road business and 8 years (2016: 5 years) for PLP’s power business. The discount rates applied to cash flow projections range from 7.5% to 17.8% (2016: 7.9% to 15.4%) for Indofood’s businesses, 9.1% to 10.0% (2016: 9.4% to 10.3%) for MPIC’s water distribution business, 8.6% (2016: 8.8%) for MPIC’s toll road business and 8.0% (2016: 8.3%) for PLP’s power business, which reflect the weighted average cost of capital of the relevant businesses.
In the assessment of the recoverable amount of Indofood’s plantation businesses, the projected prices of CPO are based on the World Bank forecast for the projection period; the projected selling prices of RSS1 and other rubber products of the Group over the projection period are based on the extrapolation of historical selling prices and the forecasted price trend from the World Bank; the sugar prices used in the projection are based on the extrapolation of historical selling prices and the forecasted price trend from the World Bank or the minimum sugar price imposed by the Ministry of Trade of Indonesia, whichever is higher; and, the projected selling price of logs over the projection period are based on actual domestic price of produce which is extrapolated based on changes of plywood log price published by World Bank. The forecasted periods for Indofood’s plantation businesses in early development stage are more than five years as the plantations mainly comprising of oil palm plantations are either in immature stage or early state of maturity and will only reach maturity in the fourth year. The cash flows beyond the projection periods are extrapolated using an estimated terminal growth rate of 5.4% (2016: 5.2%) which does not exceed the long-term average growth rate of the industry in Indonesia where the businesses operate.
In the assessment of the recoverable amount of Indofood’s dairy businesses, their values in use were calculated based on their cash flow projections as per the most recent financial budgets and forecasts, which management believes are reasonable and are management’s best estimates of the ranges of economic conditions that will exist over the forecast period. The cash flows beyond the projection periods are extrapolated using an estimated terminal growth rate of 5.0% (2016: 5.0%) which does not exceed the long-term average growth rate of the industry in Indonesia where the businesses operate.
In the assessment of the recoverable amount of MPIC’s water distribution and toll road businesses, their values in use were calculated based on their cash flow projections as per the most recent financial budgets and forecasts, which management believes are reasonable and are management’s best estimates of the ranges of economic conditions that will exist over the forecast period. The forecasted periods for MPIC’s water distribution and toll road businesses are more than five years as management can reliably estimate the cash flows for their entire concession periods. The cash flows during the projection periods are derived using estimated average growth rates ranging from 1.4% to 2.7% (2016: 1.1% to 3.3%) for the water distribution business and from 2.6% to 4.1% (2016: 2.5% to 5.0%) for the toll road business, which do not exceed the long-term average growth rates of the industries in the Philippines where the businesses operate.
In the assessment of the recoverable amount of PLP’s power business, its value in use was calculated based on its cash flow projections as per the most recent financial budget and forecast, which management believes are reasonable and are management’s best estimates of the ranges of economic conditions that will exist over the forecast period. The forecasted period is more than five years to reflect the impacts upon the expiry of a vesting contract and a long-term gas supply agreement. The cash flows beyond the projection periods are extrapolated using an estimated growth rate of 2.3% (2016: 1.8%) which does not exceed the long-term average growth rate of the industry in Singapore where the business operates.
Changes to the assumptions used by management to determine the recoverable amounts, in particular the discount and growth rates, can have a significant impact on the results of the assessment. Management is of the opinion that no reasonably possible change in any of the key assumptions stated above would cause the carrying amounts of the goodwill for each of the cash-generating units to materially exceed the recoverable amounts.
During the year ended 31 December 2017, the Group recognized an impairment loss of US$7.0 million principally relating to the goodwill arising from the logistics business acquired in 2016 as the recoverable amount was lower than the carrying amount.
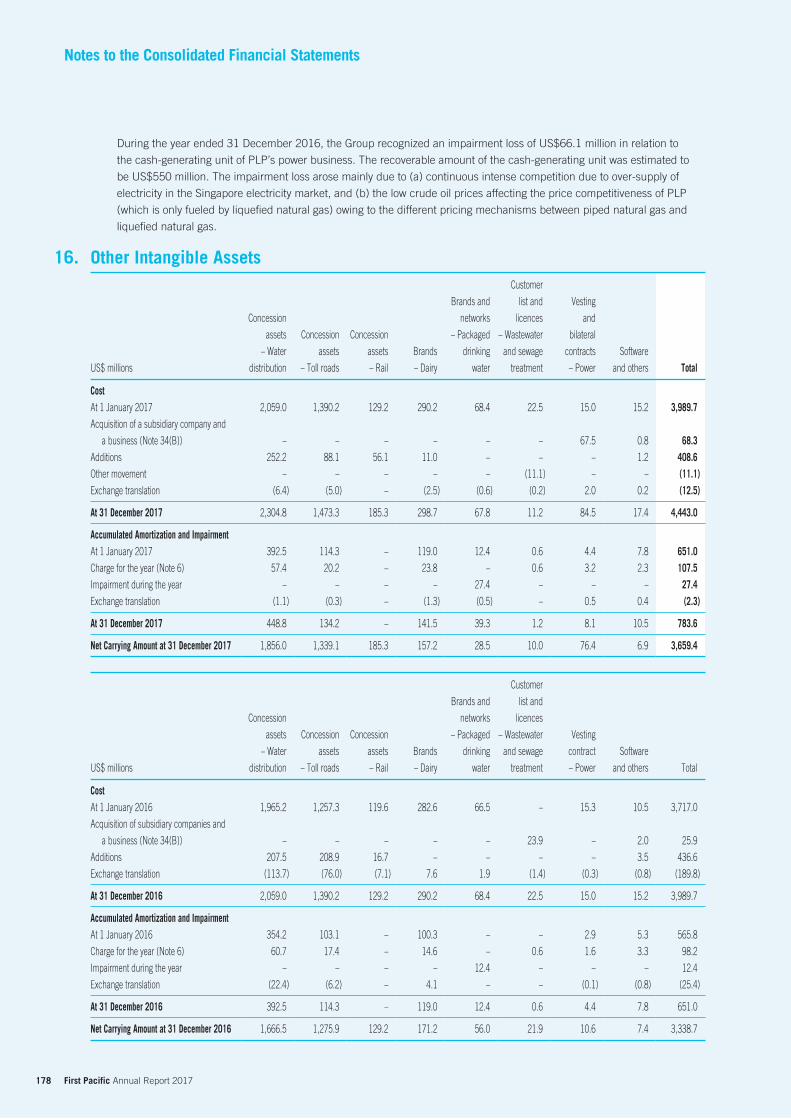
178 First Pacific Annual Report 2017
Notes to the Consolidated Financial Statements
During the year ended 31 December 2016, the Group recognized an impairment loss of US$66.1 million in relation to
the cash-generating unit of PLP’s power business. The recoverable amount of the cash-generating unit was estimated to
be US$550 million. The impairment loss arose mainly due to (a) continuous intense competition due to over-supply of
electricity in the Singapore electricity market, and (b) the low crude oil prices affecting the price competitiveness of PLP
(which is only fueled by liquefied natural gas) owing to the different pricing mechanisms between piped natural gas and
liquefied natural gas.
Other Intangible Assets
US$ millions
Concession
assets
– Water
distribution
Concession
assets
– Toll roads
Concession
assets
– Rail
Brands
– Dairy
Brands and
networks
– Packaged
drinking
water
Customer
list and
licences
– Wastewater
and sewage
treatment
Vesting
and
bilateral
contracts
– Power
Software
and others Total
CostAt 1 January 2017 2,059.0 1,390.2 129.2 290.2 68.4 22.5 15.0 15.2 3,989.7Acquisition of a subsidiary company and
a business (Note 34(B)) – – – – – – 67.5 0.8 68.3Additions 252.2 88.1 56.1 11.0 – – – 1.2 408.6Other movement – – – – – (11.1) – – (11.1)Exchange translation (6.4) (5.0) – (2.5) (0.6) (0.2) 2.0 0.2 (12.5) At 31 December 2017 2,304.8 1,473.3 185.3 298.7 67.8 11.2 84.5 17.4 4,443.0 Accumulated Amortization and ImpairmentAt 1 January 2017 392.5 114.3 – 119.0 12.4 0.6 4.4 7.8 651.0Charge for the year (Note 6) 57.4 20.2 – 23.8 – 0.6 3.2 2.3 107.5Impairment during the year – – – – 27.4 – – – 27.4Exchange translation (1.1) (0.3) – (1.3) (0.5) – 0.5 0.4 (2.3) At 31 December 2017 448.8 134.2 – 141.5 39.3 1.2 8.1 10.5 783.6 Net Carrying Amount at 31 December 2017 1,856.0 1,339.1 185.3 157.2 28.5 10.0 76.4 6.9 3,659.4
US$ millions
Concession
assets
– Water
distribution
Concession
assets
– Toll roads
Concession
assets
– Rail
Brands
– Dairy
Brands and
networks
– Packaged
drinking
water
Customer
list and
licences
– Wastewater
and sewage
treatment
Vesting
contract
– Power
Software
and others Total
CostAt 1 January 2016 1,965.2 1,257.3 119.6 282.6 66.5 – 15.3 10.5 3,717.0
Acquisition of subsidiary companies and
a business (Note 34(B)) – – – – – 23.9 – 2.0 25.9
Additions 207.5 208.9 16.7 – – – – 3.5 436.6
Exchange translation (113.7) (76.0) (7.1) 7.6 1.9 (1.4) (0.3) (0.8) (189.8)
At 31 December 2016 2,059.0 1,390.2 129.2 290.2 68.4 22.5 15.0 15.2 3,989.7
Accumulated Amortization and ImpairmentAt 1 January 2016 354.2 103.1 – 100.3 – – 2.9 5.3 565.8
Charge for the year (Note 6) 60.7 17.4 – 14.6 – 0.6 1.6 3.3 98.2
Impairment during the year – – – – 12.4 – – – 12.4
Exchange translation (22.4) (6.2) – 4.1 – – (0.1) (0.8) (25.4)
At 31 December 2016 392.5 114.3 – 119.0 12.4 0.6 4.4 7.8 651.0
Net Carrying Amount at 31 December 2016 1,666.5 1,275.9 129.2 171.2 56.0 21.9 10.6 7.4 3,338.7
16.
179 First Pacific Annual Report 2017
(A) Concession assets – Water distribution represents the exclusive right granted to Maynilad, PHI and MIBWSC to provide water distribution, sewerage services and water production and charge users for these services during its concession period.
Additions to the concession assets for water distribution include costs of rehabilitation, construction costs and concession fees paid and payable for expansion projects.
(a) MayniladIn February 1997, Maynilad entered into a concession agreement with MWSS, with respect to the MWSS West Service Area. Under the concession agreement, MWSS grants Maynilad, the sole right to manage, operate, repair, decommission and refurbish all fixed and movable assets required to provide water and sewerage services in the West Service Area for 25 years ending in 2022. In September 2009, MWSS approved an extension of its concession agreement with Maynilad for another 15 years to 2037. The legal titles to all property, plant and equipment contributed to the existing MWSS system by Maynilad during the concession period remain with Maynilad until the expiration date at which time, all rights, titles and interests in such assets will automatically vest to MWSS.
Under the concession agreement, Maynilad is entitled to (a) an annual standard rate adjustment to compensate for increases in the consumer price index subject to a rate adjustment limit; (b) an extraordinary price adjustment to account for the financial consequences of the occurrence of certain unforeseen events subject to grounds stipulated in the concession agreement; and (c) a rate rebasing mechanism which allows rates to be adjusted every five years to enable Maynilad to efficiently and prudently recover expenditures incurred, Philippine business taxes and payments corresponding to debt service on concession fees and Maynilad loans incurred to finance such expenditure.
In October 2013, Maynilad disagreed with the rate rebasing adjustments proposed by MWSS for the rate rebasing period from 2013 to 2017 and exercised its right under the concession agreement to file a notice of dispute with the Secretariat of the International Court of Arbitration in the Philippines for an arbitration. In December 2013, MWSS released a resolution regarding the implementation of a status quo for Maynilad’s tariff rates until a final resolution of this issue is reached. On 29 December 2014, the Appeals Panel of the International Court of Arbitration in the Philippines upheld the alternative rebasing adjustment of Maynilad regarding its tariff dispute with MWSS. This would, if implemented immediately, result in a 9.8% increase in the 2013 average basic water charge of Pesos 31.28/cubic meter. However, MWSS refused to implement the final award notwithstanding Maynilad’s repeated written demands for implementation.
Following the inaction of the Philippine Government represented by the Department of Finance (“DOF”) in response to Maynilad’s request to compel MWSS to implement the final award, Maynilad, on 27 March 2015 served a notice of arbitration and statement of claim upon the Philippine Government and demanded the Philippine government’s failure or refusal to pay it the demanded revenue losses that it had sustained as a direct result of MWSS’s refusal to implement its current rebasing adjustment to be referred to arbitration before a three-member panel appointed and conducting proceedings in Singapore. The Arbitral Tribunal (“Tribunal”) panel was constituted in 2015. Evidentiary hearings were completed in December 2016. Maynilad and MWSS filed their respective memorials and counter-memorials on 31 January 2017 and 20 February 2017, respectively. On 24 July 2017, the Tribunal in Singapore unanimously upheld Maynilad’s claim for compensation for the delayed implementation of its tariff increases. The Tribunal ordered the Philippine Government to reimburse Maynilad the amount of Pesos 3.4 billion (US$68.1 million) (subsequently adjusted to Pesos 3.2 billion (US$64.1 million)) for losses from 11 March 2015 to 31 August 2016, without prejudice to any rights that Maynilad may have to seek recourse against the MWSS for losses incurred from 1 January 2013 to 10 March 2015. Further, the Tribunal ruled that Maynilad is entitled to recover from the Philippine Government its losses from 1 September 2016 onwards. In case a disagreement on the amount of such losses arises, Maynilad may revert to the Tribunal for further determination. On 9 February 2018, the Philippine Government filed an application with The High Court of Singapore to set aside the arbitration award issued on 24 July 2017. Maynilad has already engaged its Singapore counsel to ensure the Philippine Government’s application is disposed of expeditiously. The financial effect of Maynilad’s win in this arbitration will be subject to the outcome of Maynilad’s discussion with the Philippine Government with respect to the implementation of the arbitration award and hence cannot be determined yet. As at the date of these financial statements, the result of this case was still pending.
180 First Pacific Annual Report 2017
Notes to the Consolidated Financial Statements
(b) PHI
In August 2012, Maynilad acquired a 100% interest in PHI, which engages in the water distribution business in
central and southern Luzon. PHI is granted the sole right to distribute water in these areas under certain concession
agreements granted by the Philippine Government for 25 years to 2035.
(c) MIBWSC
On 4 July 2016, pursuant to a joint venture agreement between MetroPac Oloilo Holdings Corporation, a wholly-
owned subsidiary of MPW, and the Metro Iloilo Water District (“MIWD”) of the Philippines, created and established
MIBWSC, to implement a 170 million liters per day (MLD) Bulk Water Supply Project (“BWS Project”). The BWS
Project covers (i) the rehabilitation and upgrading of MIWD’s existing 55 MLD water facilities, (ii) the expansion and
construction of new water facilities to increase production to up to 115 MLD and (iii) delivery of contracted water
demand to MIWD in accordance with the bulk water supply agreement. The BWS Project covers an initial 25-year
period and shall be extended for an additional 25 years counted from the date of completion of the agreed upon
expansion obligation, but in no event shall exceed an aggregate of 50 years. MIWD retains ownership of the existing
facilities subject to the right of MIBWSC to access and use. MIBWSC in turn retains ownership of the new facilities but is
required to handback the BWS Project, including transfer of the full ownership of the new facilities, at the end of the
concession period. On 5 July 2016, MIBWSC officially took over operations from the MIWD.
(B) Concession assets – Toll roads represent the concession comprising the rights, interests and privileges to finance, design,
construct, operate and maintain toll roads, toll facilities and other facilities generating toll-related and non-toll related
income held by (a) NLEX Corporation in respect of the North Luzon Expressway (also known as NLEX), Subic Clark Tarlac
Expressway (SCTEX) and Connector Road, (b) CIC in respect of CAVITEX, (c) MPCALA in respect of CALAX and (d) CCLEC
in respect of CCLEX during their concession periods.
Additions to the concession assets for toll roads include payments for both ongoing construction costs, preconstruction
costs for various toll road projects and concession fees paid and payable for new projects.
(a) NLEX Corporation’s NLEX
In August 1995, First Philippine Infrastructure Development Corporation (“FPIDC”), the parent company of NLEX
Corporation, entered into a joint venture agreement with Philippine National Construction Corporation (“PNCC”), in
which PNCC assigned its rights, interests and privileges under its franchise to construct, operate and maintain toll
facilities in the NLEX and its extensions, stretches, linkages and diversions in favour of NLEX Corporation, including
the design, funding, construction, rehabilitation, refurbishing and modernization and selection and installation of an
appropriate toll collection system therein during the concession period subject to prior approval by the President of
the Philippines. In April 1998, the Philippine Government, acting through the Toll Regulatory Board as the grantor,
PNCC as the franchisee and NLEX Corporation as the concessionaire, executed a Supplemental Toll Operation
Agreement (STOA) whereby the Philippine Government recognized and accepted the assignment by PNCC of its
usufructuary rights, interests and privileges under its franchise in favor of NLEX Corporation as approved by the
President of the Philippines and granted NLEX Corporation concession rights, obligations and privileges including
the authority to finance, design, construct, operate and maintain the NLEX project roads as toll roads commencing
upon the date on which the STOA comes into effect until 31 December 2030 or 30 years after the issuance of the Toll
Operation Permit for the last completed phase, whichever is earlier. In October 2008, the concession agreement was
extended for another seven years to 2037. Pursuant to the STOA, NLEX Corporation is required to pay franchise fees
to PNCC and to pay for the government’s project overhead expenses based on certain percentages of construction
costs and maintenance works on the project roads. Upon expiry of the concession period, NLEX Corporation shall
handover the project roads to the Philippine Government without cost, free from any and all liens and encumbrances
and fully operational and in good working condition, including any and all existing land required, works, toll road
facilities and equipment found therein directly related to and in connection with the operation of the toll road facilities.
181 First Pacific Annual Report 2017
(b) NLEX Corporation’s SCTEX
On 9 February 2015, NLEX Corporation received a notice of award from the Philippine Bases Conversion and
Development Authority (“BCDA”) for the management, operation and maintenance of the 94-kilometer SCTEX subject
to compliance with specific conditions. The notice of award was issued by the BCDA following the results of the price
challenge held on 30 January 2015. On 26 February 2015, NLEX Corporation and the BCDA entered into a business
agreement involving the assignment of the BCDA’s rights and obligations relating to the management, operation and
maintenance of SCTEX as provided in the SCTEX concession (Toll Operation Agreement or TOA). The assignment
includes the exclusive right to use the SCTEX toll road facilities and the right to collect toll until 30 October 2043. On
22 May 2015, the Supplementary Toll Operation Agreement was executed by and among the Philippine Government
and the BCDA and NLEX Corporation. At the end of the contract term, the SCTEX, as well as the as-built plans,
specification and operation/repair/maintenance manuals relating to the same shall be turned over to the BCDA or its
successor-in-interest. At a consideration of Pesos 3.5 billion (US$76.7 million) upfront cash payment, the operation
and management of the SCTEX was officially turned over to NLEX Corporation on 27 October 2015. MNTC shall also
pay the BCDA monthly concession fees amounting to 50% of the audited gross toll revenues of SCTEX for the relevant
month from effective date of 27 October 2015 to 30 October 2043.
(c) NLEX Corporation’s Connector Road
On 23 November 2016, NLEX Corporation and the Philippine Government acting through the Department of Public
Works and Highways (“DPWH”) signed a concession agreement for the design, financing, construction, operation
and maintenance of the Connector Road. The Connector Road is a four lane toll expressway structure with a length
of eight kilometers all passing through and above the right of way of the Philippine National Railways starting NLEX
Segment 10 in C3 Road Caloocan City and seamlessly connecting to SLEX through Metro Manila Skyway Stage 3
Project. The concession period shall commence on the commencement date of its construction, and shall end on its
thirty-seventh anniversary, unless otherwise extended or terminated in accordance with the concession agreement.
Connector Road Project, with an estimated project cost of Pesos 23.3 billion (US$466.7 million), is expected to
commence construction in 2018 and to complete by 2020.
Under the concession agreement, NLEX Corporation will pay the DPWH periodic payments as consideration for the
grant of the right of way for the project.
(d) CIC’s CAVITEX
Pursuant to a toll operation agreement and an operations and maintenance agreement which CIC signed in November
1996 with the Philippine Reclamation Authority and the Toll Regulatory Board (“TRB”) of the Philippines, CIC was
responsible for the design, financing, construction and supervision of the operation and maintenance of CAVITEX.
The concession for CAVITEX extends to 2033 for the originally built road and to 2046 for a subsequent extension.
Upon expiry of the concession period, CIC shall hand over the project roads to the Philippine Government.
(e) MPCALA’s CALAX
On 10 July 2015, MPCALA signed a concession agreement for the CALAX Project with the Department Public Works
and Highways (“DPWH”) of the Philippines. Under the concession agreement, MPCALA is granted the concession
to design, finance, construct, operate and maintain the CALAX, including the right to collect toll fees, over a 35-year
concession period. The CALAX is a closed-system tolled expressway connecting the CAVITEX and the SLEX. The
CALAX Project was awarded to MPCALA following a competitive public bidding process where MPCALA was declared
as the highest complying bidder with its offer to pay the Philippine Government concession fees amounting Pesos
27.3 billion (US$546.8 million) over nine years. On 3 July 2017, MPCALA commenced the construction works for the
project which are expected to be completed in 2020 and CALAX is expected to be fully operational by 2021.
182 First Pacific Annual Report 2017
Notes to the Consolidated Financial Statements
(f) CCLEC’s CCLEX
On 3 October 2016, CCLEC, the Cebu City and Municipality of Cordova (as the grantors) signed the concession
agreement for the CCLEX. CCLEX, consists of the main alignment starting from the Cebu South Coastal Road and
ending at the Mactan Circumferential Road, inclusive of interchange ramps aligning the Guadalupe River, the main
span bridge, approaches, viaducts, causeways, low-height bridges, at-grade road, toll plazas and toll operations
center.
Under the concession agreement, CCLEC is granted the concession to design, finance, construct, operate and
maintain the CCLEX, including the right to collect toll fees over a 35-year concession period (including construction
period). CCLEX is estimated to cost Pesos 26.3 billion (US$526.7 million) with the construction of the project to be
completed by 2021. No upfront payments or concession fees are to be paid but the grantors shall share 2% of the
project’s revenue.
NLEX Corporation and CIC derive substantially all of their revenues from toll collections from the users of the toll roads. The
concession agreements establish toll rate formulas and adjustment procedures for setting the appropriate toll rates. Subject
to the TRB of the Philippines validating the calculation of the toll rate adjustments in accordance with the formulas, toll rate
adjustments are scheduled every two calendar years for the NLEX, every year for SCTEX and every three calendar years
for the CAVITEX. As at the date of these financial statements, the Philippine Government has not yet implemented the toll
rate adjustments for NLEX Corporation and CIC in respect of CAVITEX, NLEX and SCTEX, which should have been effective
from 1 January 2012 and 1 January 2015 for CAVITEX’s originally built road, 1 January 2014 and 1 January 2017 for
CAVITEX’s extension, 1 January 2013, and 1 January 2015 and 1 January 2017 for NLEX and 1 January 2017 for SCTEX.
In April 2016, NLEX Corporation and CIC each issued a notice of arbitration and statement of claim to the Philippine
Government, through the TRB, to obtain compensation for TRB’s inaction on lawful toll rate adjustments which were
overdue. On 18 October 2017, the TRB provisionally approved a Peso 0.25/km petition for add-on toll rate adjustment
for NLEX closed system in relation with NLEX Corporation’s investment on the NLEX lane widening project. CIC, however,
has yet to receive regulatory approval for the claims and is in constructive discussions with the Philippine Government to
resolve this.
(C) Concession assets – Rail represents concession comprising of the exclusive right during the concession period to operate
and maintain the current LRT1 system, collect farebox revenue and construct the LRT1 Extension.
Additions to the concession assets for rail include cost of station and rehabilitation works, engineering, procurement,
construction and other consultancy cost for various rail projects.
The DOTC and LRTA formally awarded the project to LRMC on 15 September 2014. On 2 October 2014, LRMC signed
together with the Department of Transportation and Communications (“DOTC”) and the Light Rail Transit Authority (“LRTA”)
(the grantors) a concession agreement for the Light Rail Transit Line 1 Cavite Extension and Operations & Maintenance
Project (“LRT1 Project”). Under the concession agreement, LRMC will operate and maintain the existing 20.7-kilometer
LRT1 (Existing System) and construct an 11.7-kilometer extension from the present end-point at Baclaran to the Niog area
in Bacoor, Cavite. A total of eight new stations will be built along the extension, which traverses the cities of Parañaque and
Las Piñas up to Bacoor, Cavite. The concession agreement is for a period of 32 years commencing from the effective date
of 12 September 2015 when LRMC took over of the LRT1 operations.
In accordance with the LRT1 Project concession agreement, LRMC is entitled to the reimbursement of the unavoidable
increment costs that it will incur to restore the Existing System to the level necessary to meet all of the baseline Existing
System Requirements (“ESR”) as certified by an independent consultant. LRMC is also entitled to receive compensation
from the grantors if the grantors do not make available a minimum of 100 light rail vehicles (LRV) on the effective date of
the turnover of the system. On the turnover date of the system on 12 September 2015, LRMC only received 72 LRVs.
On various dates in 2015 through 2017, LRMC submitted letters to the DOTC representing its claim for ESR costs and
LRV shortfall on the premise of the grantor’s obligation in relation to the condition of the Existing System prior or as
of the effective date of the turnover of the system by the grantors to LRMC. In addition, LRMC requested the grantors
compensation for the revenue loss arising from the grantors’ implementation of fare increases below the concession
agreement fares. The above claims were still undergoing discussion as at the date of these financial statements.
183 First Pacific Annual Report 2017
(D) Brands – Dairy represent the brands, with useful life of 20 years, held by Indolakto for its various milk-related products,
which include Indomilk, Cap Enaak, Tiga Sapi, Crima, Kremer and Indoeskrim.
(E) Brands and networks – Packaged drinking water represent the registered brand name, CLUB, and distribution and
customer networks of Indofood’s packaged drinking water business.
The brands and networks are determined to have indefinite useful lives as (i) the brands can be renewed indefinitely at
no significant costs; (ii) Indofood has the intention to renew the brands and maintain the network indefinitely; and (iii) no
significant expenses are expected to be incurred to maintain the future economic benefits that can be generated from
these assets.
In assessing the impairment for brands and networks with indefinite useful life, the Group compares the carrying amounts
of the intangible assets against their recoverable amounts (the higher of the assets’ fair value less costs of disposal and
their value in use). The recoverable amounts of brands and networks have been determined based on value in use
calculations using cash flow projections as per the most recent financial budgets and forecasts, which management
believes are reasonable and are management’s best estimates of the ranges of economic conditions that will exist over the
forecast period of 10 years (2016: 10 years). The discount rate applied to cash flow projections was ranged from 11.2% to
13.0% (2016: 13.4% to 14.0%), which reflects the weighted average cost of capital. The cash flows beyond the projection
periods are extrapolated using an estimated terminal growth rate of 3.3% (2016: 3.8%) which does not exceed the long-
term average growth rate of the industry in Indonesia where the businesses operate.
During the year ended 31 December 2017, the Group recognized an impairment loss of US$27.4 million (2016: US$12.4
million) in relation to the brands and networks. The recoverable amount of the brands and networks determined based on
value in use calculation is estimated to be US$28.5 million (2016: US$56.0 million). The impairment loss was driven by
lower projected future cash flows in light of current market condition which may be inadequate to cover the said intangible
assets.
(F) Customer list and licences – Wastewater and sewage treatment represents ESTII’s customer relationship, contracts and
licences for intellectual property rights over patents and utility models.
(G) Vesting and bilateral contracts – Power represents the electricity supply agreement entered by PLP and GBPC.
(a) PLP’s vesting contract
It represents an agreement entered into between PLP and a Singapore government agency, which requires PLP to sell
electricity at a specified volume and a specified price to the agency over a period of 10 years from November 2013 to
November 2023.
(b) GBPC’s bilateral contracts
GBPC, through its operating generation subsidiary companies, entered into bilateral off-take arrangements with
power off-takers, such as distribution utilities, electric cooperatives, retail electricity suppliers and directly connected
industrial customers, for the supply of electricity over a period of 10 to 25 years.
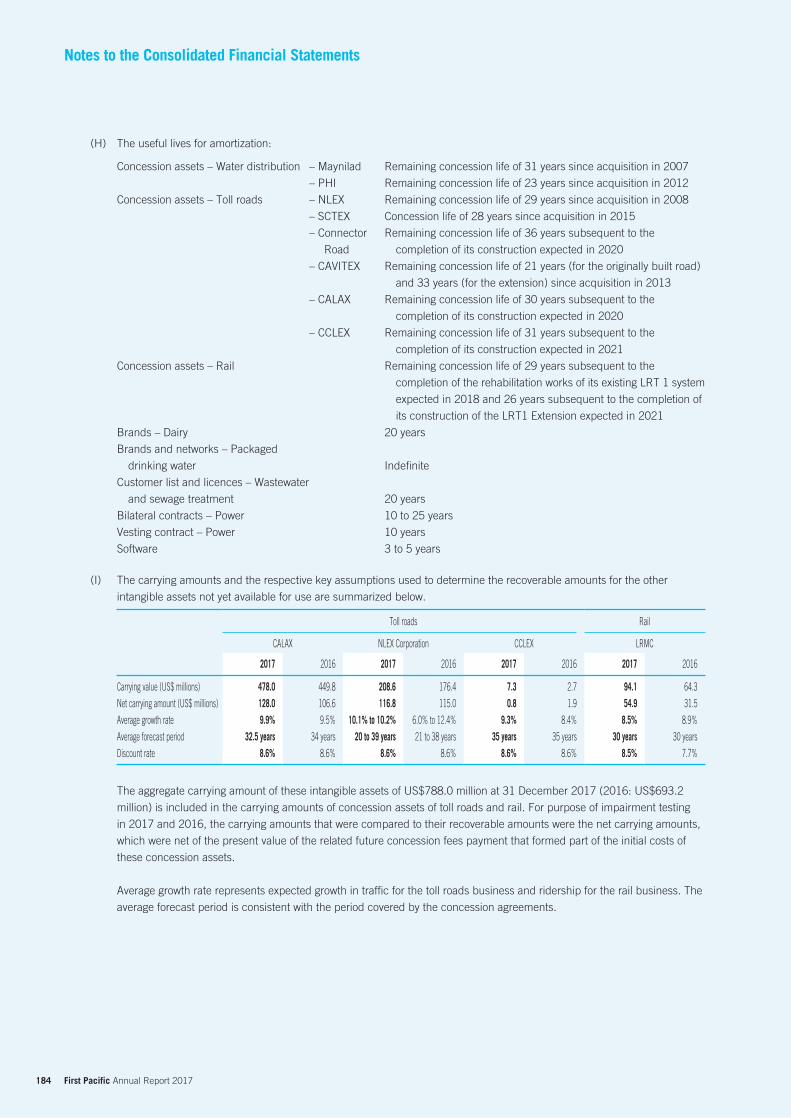
184 First Pacific Annual Report 2017
Notes to the Consolidated Financial Statements
(H) The useful lives for amortization:
Concession assets – Water distribution – Maynilad Remaining concession life of 31 years since acquisition in 2007
– PHI Remaining concession life of 23 years since acquisition in 2012
Concession assets – Toll roads – NLEX Remaining concession life of 29 years since acquisition in 2008
– SCTEX Concession life of 28 years since acquisition in 2015
– Connector
Road
Remaining concession life of 36 years subsequent to the
completion of its construction expected in 2020
– CAVITEX Remaining concession life of 21 years (for the originally built road)
and 33 years (for the extension) since acquisition in 2013
– CALAX Remaining concession life of 30 years subsequent to the
completion of its construction expected in 2020
– CCLEX Remaining concession life of 31 years subsequent to the
completion of its construction expected in 2021
Concession assets – Rail Remaining concession life of 29 years subsequent to the
completion of the rehabilitation works of its existing LRT 1 system
expected in 2018 and 26 years subsequent to the completion of
its construction of the LRT1 Extension expected in 2021
Brands – Dairy 20 years
Brands and networks – Packaged
drinking water Indefinite
Customer list and licences – Wastewater
and sewage treatment 20 years
Bilateral contracts – Power 10 to 25 years
Vesting contract – Power 10 years
Software 3 to 5 years
(I) The carrying amounts and the respective key assumptions used to determine the recoverable amounts for the other
intangible assets not yet available for use are summarized below.
Toll roads Rail
CALAX NLEX Corporation CCLEX LRMC
2017 2016 2017 2016 2017 2016 2017 2016
Carrying value (US$ millions) 478.0 449.8 208.6 176.4 7.3 2.7 94.1 64.3
Net carrying amount (US$ millions) 128.0 106.6 116.8 115.0 0.8 1.9 54.9 31.5
Average growth rate 9.9% 9.5% 10.1% to 10.2% 6.0% to 12.4% 9.3% 8.4% 8.5% 8.9%
Average forecast period 32.5 years 34 years 20 to 39 years 21 to 38 years 35 years 35 years 30 years 30 years
Discount rate 8.6% 8.6% 8.6% 8.6% 8.6% 8.6% 8.5% 7.7%
The aggregate carrying amount of these intangible assets of US$788.0 million at 31 December 2017 (2016: US$693.2
million) is included in the carrying amounts of concession assets of toll roads and rail. For purpose of impairment testing
in 2017 and 2016, the carrying amounts that were compared to their recoverable amounts were the net carrying amounts,
which were net of the present value of the related future concession fees payment that formed part of the initial costs of
these concession assets.
Average growth rate represents expected growth in traffic for the toll roads business and ridership for the rail business. The
average forecast period is consistent with the period covered by the concession agreements.
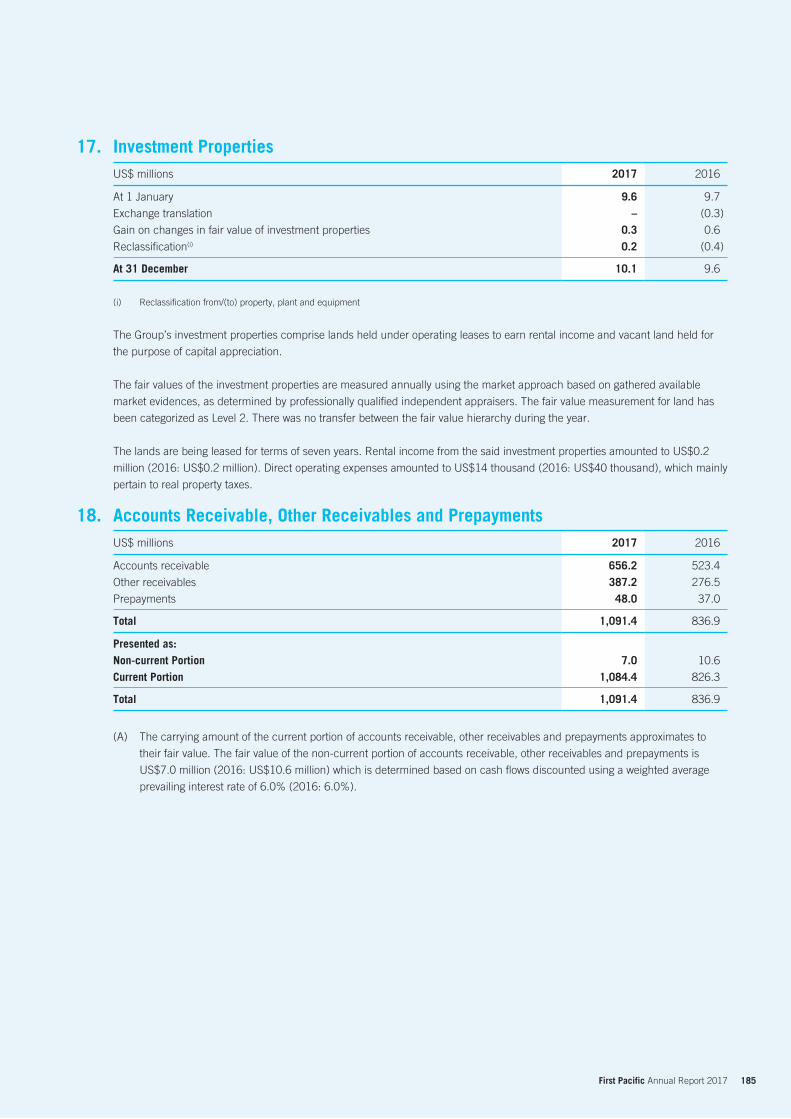
185 First Pacific Annual Report 2017
Investment PropertiesUS$ millions 2017 2016
At 1 January 9.6 9.7
Exchange translation – (0.3)
Gain on changes in fair value of investment properties 0.3 0.6
Reclassification(i) 0.2 (0.4)
At 31 December 10.1 9.6
(i) Reclassification from/(to) property, plant and equipment
The Group’s investment properties comprise lands held under operating leases to earn rental income and vacant land held for
the purpose of capital appreciation.
The fair values of the investment properties are measured annually using the market approach based on gathered available
market evidences, as determined by professionally qualified independent appraisers. The fair value measurement for land has
been categorized as Level 2. There was no transfer between the fair value hierarchy during the year.
The lands are being leased for terms of seven years. Rental income from the said investment properties amounted to US$0.2
million (2016: US$0.2 million). Direct operating expenses amounted to US$14 thousand (2016: US$40 thousand), which mainly
pertain to real property taxes.
Accounts Receivable, Other Receivables and PrepaymentsUS$ millions 2017 2016
Accounts receivable 656.2 523.4
Other receivables 387.2 276.5
Prepayments 48.0 37.0
Total 1,091.4 836.9
Presented as:Non-current Portion 7.0 10.6
Current Portion 1,084.4 826.3
Total 1,091.4 836.9
(A) The carrying amount of the current portion of accounts receivable, other receivables and prepayments approximates to
their fair value. The fair value of the non-current portion of accounts receivable, other receivables and prepayments is
US$7.0 million (2016: US$10.6 million) which is determined based on cash flows discounted using a weighted average
prevailing interest rate of 6.0% (2016: 6.0%).
17.
18.
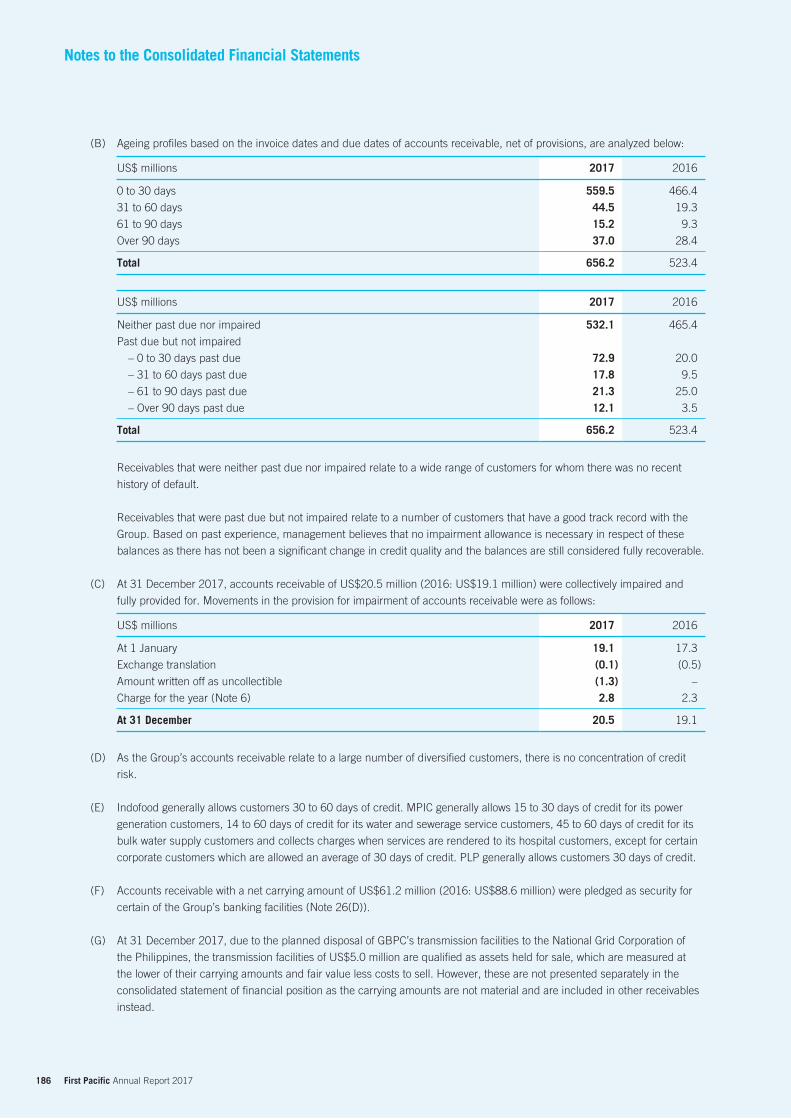
186 First Pacific Annual Report 2017
Notes to the Consolidated Financial Statements
(B) Ageing profiles based on the invoice dates and due dates of accounts receivable, net of provisions, are analyzed below:
US$ millions 2017 2016
0 to 30 days 559.5 466.4
31 to 60 days 44.5 19.3
61 to 90 days 15.2 9.3
Over 90 days 37.0 28.4
Total 656.2 523.4
US$ millions 2017 2016
Neither past due nor impaired 532.1 465.4
Past due but not impaired
– 0 to 30 days past due 72.9 20.0
– 31 to 60 days past due 17.8 9.5
– 61 to 90 days past due 21.3 25.0
– Over 90 days past due 12.1 3.5
Total 656.2 523.4
Receivables that were neither past due nor impaired relate to a wide range of customers for whom there was no recent
history of default.
Receivables that were past due but not impaired relate to a number of customers that have a good track record with the
Group. Based on past experience, management believes that no impairment allowance is necessary in respect of these
balances as there has not been a significant change in credit quality and the balances are still considered fully recoverable.
(C) At 31 December 2017, accounts receivable of US$20.5 million (2016: US$19.1 million) were collectively impaired and
fully provided for. Movements in the provision for impairment of accounts receivable were as follows:
US$ millions 2017 2016
At 1 January 19.1 17.3
Exchange translation (0.1) (0.5)
Amount written off as uncollectible (1.3) –
Charge for the year (Note 6) 2.8 2.3
At 31 December 20.5 19.1
(D) As the Group’s accounts receivable relate to a large number of diversified customers, there is no concentration of credit
risk.
(E) Indofood generally allows customers 30 to 60 days of credit. MPIC generally allows 15 to 30 days of credit for its power
generation customers, 14 to 60 days of credit for its water and sewerage service customers, 45 to 60 days of credit for its
bulk water supply customers and collects charges when services are rendered to its hospital customers, except for certain
corporate customers which are allowed an average of 30 days of credit. PLP generally allows customers 30 days of credit.
(F) Accounts receivable with a net carrying amount of US$61.2 million (2016: US$88.6 million) were pledged as security for
certain of the Group’s banking facilities (Note 26(D)).
(G) At 31 December 2017, due to the planned disposal of GBPC’s transmission facilities to the National Grid Corporation of
the Philippines, the transmission facilities of US$5.0 million are qualified as assets held for sale, which are measured at
the lower of their carrying amounts and fair value less costs to sell. However, these are not presented separately in the
consolidated statement of financial position as the carrying amounts are not material and are included in other receivables
instead.
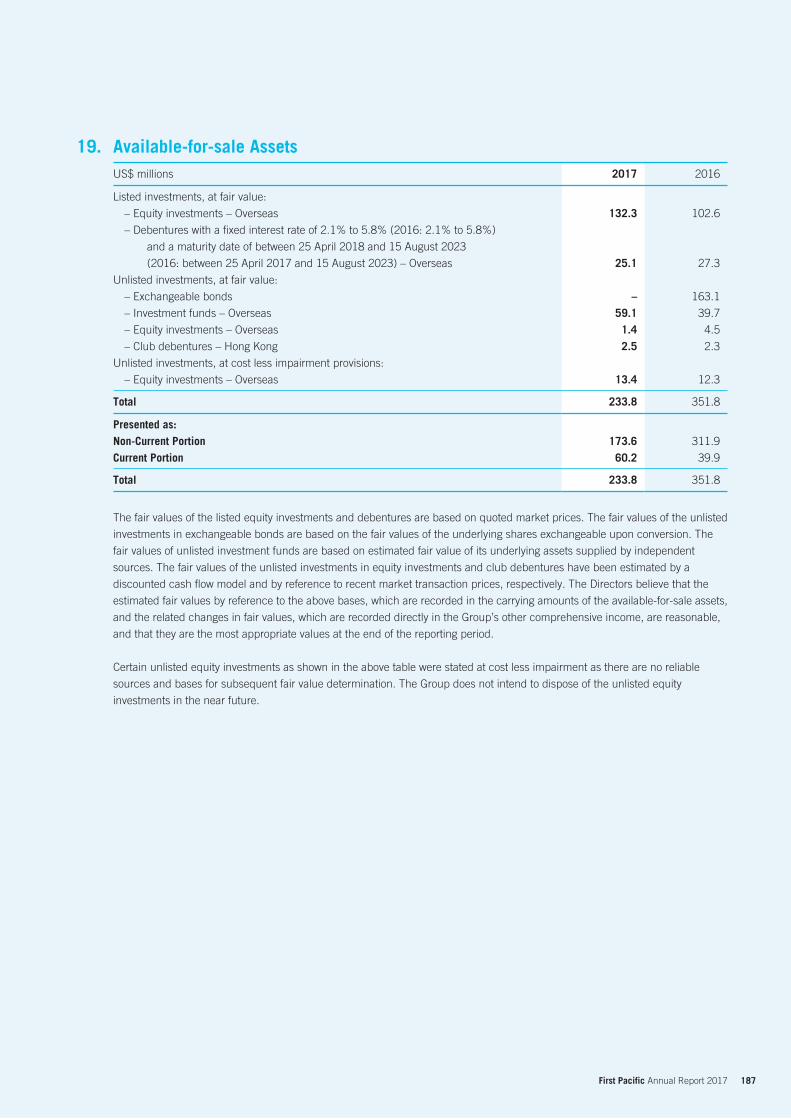
187 First Pacific Annual Report 2017
Available-for-sale AssetsUS$ millions 2017 2016
Listed investments, at fair value:
– Equity investments – Overseas 132.3 102.6
– Debentures with a fixed interest rate of 2.1% to 5.8% (2016: 2.1% to 5.8%)
and a maturity date of between 25 April 2018 and 15 August 2023
(2016: between 25 April 2017 and 15 August 2023) – Overseas 25.1 27.3
Unlisted investments, at fair value:
– Exchangeable bonds – 163.1
– Investment funds – Overseas 59.1 39.7
– Equity investments – Overseas 1.4 4.5
– Club debentures – Hong Kong 2.5 2.3
Unlisted investments, at cost less impairment provisions:
– Equity investments – Overseas 13.4 12.3
Total 233.8 351.8
Presented as:Non-Current Portion 173.6 311.9
Current Portion 60.2 39.9
Total 233.8 351.8
The fair values of the listed equity investments and debentures are based on quoted market prices. The fair values of the unlisted
investments in exchangeable bonds are based on the fair values of the underlying shares exchangeable upon conversion. The
fair values of unlisted investment funds are based on estimated fair value of its underlying assets supplied by independent
sources. The fair values of the unlisted investments in equity investments and club debentures have been estimated by a
discounted cash flow model and by reference to recent market transaction prices, respectively. The Directors believe that the
estimated fair values by reference to the above bases, which are recorded in the carrying amounts of the available-for-sale assets,
and the related changes in fair values, which are recorded directly in the Group’s other comprehensive income, are reasonable,
and that they are the most appropriate values at the end of the reporting period.
Certain unlisted equity investments as shown in the above table were stated at cost less impairment as there are no reliable
sources and bases for subsequent fair value determination. The Group does not intend to dispose of the unlisted equity
investments in the near future.
19.
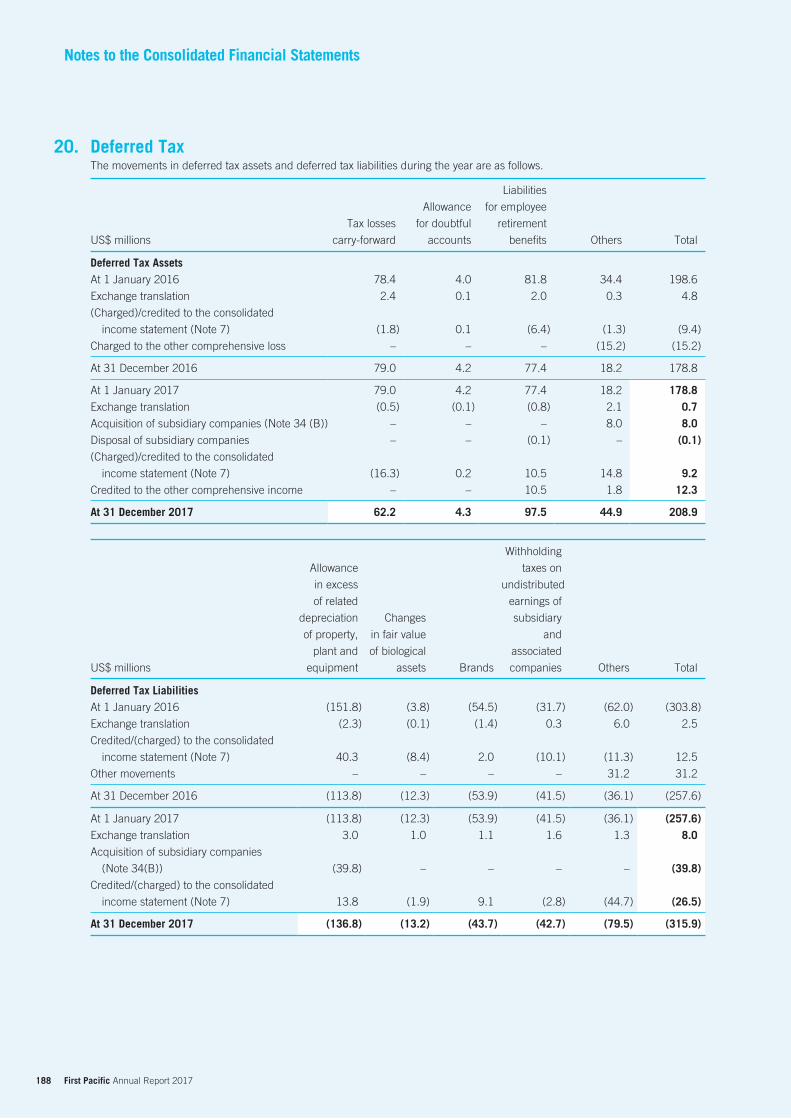
188 First Pacific Annual Report 2017
Notes to the Consolidated Financial Statements
Deferred TaxThe movements in deferred tax assets and deferred tax liabilities during the year are as follows.
US$ millions
Tax losses
carry-forward
Allowance
for doubtful
accounts
Liabilities
for employee
retirement
benefits Others Total
Deferred Tax AssetsAt 1 January 2016 78.4 4.0 81.8 34.4 198.6
Exchange translation 2.4 0.1 2.0 0.3 4.8
(Charged)/credited to the consolidated
income statement (Note 7) (1.8) 0.1 (6.4) (1.3) (9.4)
Charged to the other comprehensive loss – – – (15.2) (15.2)
At 31 December 2016 79.0 4.2 77.4 18.2 178.8
At 1 January 2017 79.0 4.2 77.4 18.2 178.8Exchange translation (0.5) (0.1) (0.8) 2.1 0.7Acquisition of subsidiary companies (Note 34 (B)) – – – 8.0 8.0Disposal of subsidiary companies – – (0.1) – (0.1)(Charged)/credited to the consolidated
income statement (Note 7) (16.3) 0.2 10.5 14.8 9.2Credited to the other comprehensive income – – 10.5 1.8 12.3 At 31 December 2017 62.2 4.3 97.5 44.9 208.9
US$ millions
Allowance
in excess
of related
depreciation
of property,
plant and
equipment
Changes
in fair value
of biological
assets Brands
Withholding
taxes on
undistributed
earnings of
subsidiary
and
associated
companies Others Total
Deferred Tax LiabilitiesAt 1 January 2016 (151.8) (3.8) (54.5) (31.7) (62.0) (303.8)
Exchange translation (2.3) (0.1) (1.4) 0.3 6.0 2.5
Credited/(charged) to the consolidated
income statement (Note 7) 40.3 (8.4) 2.0 (10.1) (11.3) 12.5
Other movements – – – – 31.2 31.2
At 31 December 2016 (113.8) (12.3) (53.9) (41.5) (36.1) (257.6)
At 1 January 2017 (113.8) (12.3) (53.9) (41.5) (36.1) (257.6)Exchange translation 3.0 1.0 1.1 1.6 1.3 8.0Acquisition of subsidiary companies
(Note 34(B)) (39.8) – – – – (39.8)Credited/(charged) to the consolidated
income statement (Note 7) 13.8 (1.9) 9.1 (2.8) (44.7) (26.5) At 31 December 2017 (136.8) (13.2) (43.7) (42.7) (79.5) (315.9)
20.
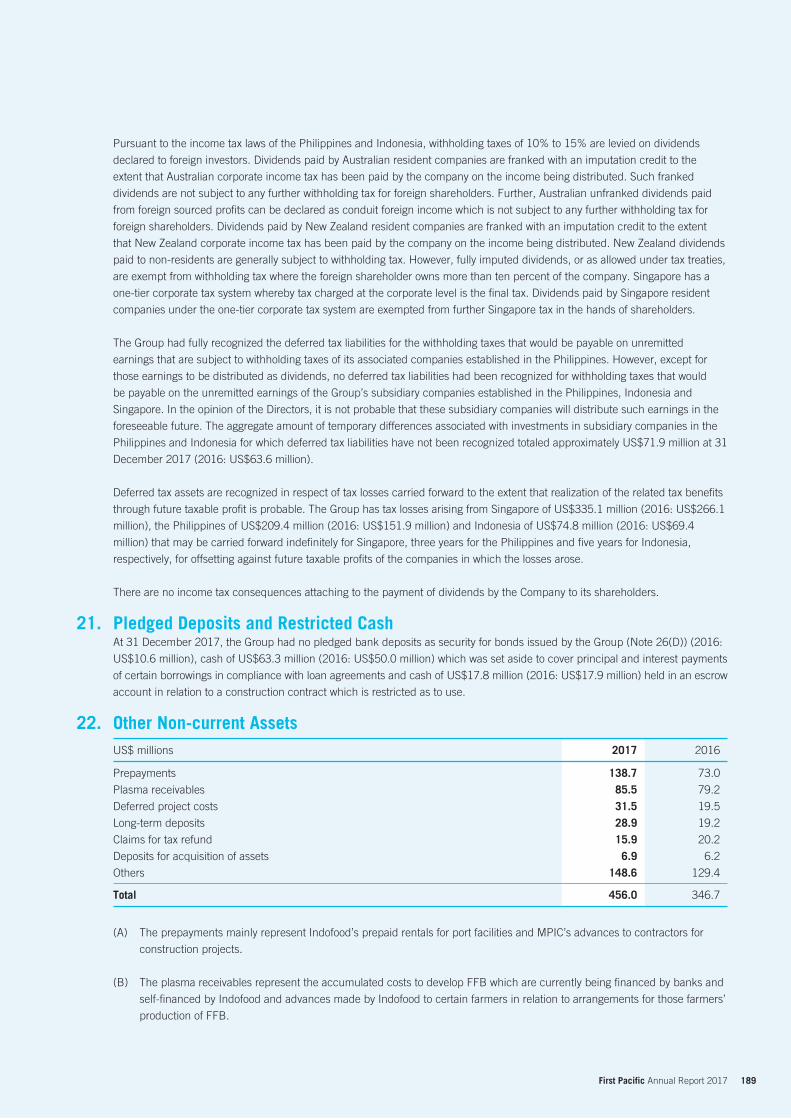
189 First Pacific Annual Report 2017
Pursuant to the income tax laws of the Philippines and Indonesia, withholding taxes of 10% to 15% are levied on dividends
declared to foreign investors. Dividends paid by Australian resident companies are franked with an imputation credit to the
extent that Australian corporate income tax has been paid by the company on the income being distributed. Such franked
dividends are not subject to any further withholding tax for foreign shareholders. Further, Australian unfranked dividends paid
from foreign sourced profits can be declared as conduit foreign income which is not subject to any further withholding tax for
foreign shareholders. Dividends paid by New Zealand resident companies are franked with an imputation credit to the extent
that New Zealand corporate income tax has been paid by the company on the income being distributed. New Zealand dividends
paid to non-residents are generally subject to withholding tax. However, fully imputed dividends, or as allowed under tax treaties,
are exempt from withholding tax where the foreign shareholder owns more than ten percent of the company. Singapore has a
one-tier corporate tax system whereby tax charged at the corporate level is the final tax. Dividends paid by Singapore resident
companies under the one-tier corporate tax system are exempted from further Singapore tax in the hands of shareholders.
The Group had fully recognized the deferred tax liabilities for the withholding taxes that would be payable on unremitted
earnings that are subject to withholding taxes of its associated companies established in the Philippines. However, except for
those earnings to be distributed as dividends, no deferred tax liabilities had been recognized for withholding taxes that would
be payable on the unremitted earnings of the Group’s subsidiary companies established in the Philippines, Indonesia and
Singapore. In the opinion of the Directors, it is not probable that these subsidiary companies will distribute such earnings in the
foreseeable future. The aggregate amount of temporary differences associated with investments in subsidiary companies in the
Philippines and Indonesia for which deferred tax liabilities have not been recognized totaled approximately US$71.9 million at 31
December 2017 (2016: US$63.6 million).
Deferred tax assets are recognized in respect of tax losses carried forward to the extent that realization of the related tax benefits
through future taxable profit is probable. The Group has tax losses arising from Singapore of US$335.1 million (2016: US$266.1
million), the Philippines of US$209.4 million (2016: US$151.9 million) and Indonesia of US$74.8 million (2016: US$69.4
million) that may be carried forward indefinitely for Singapore, three years for the Philippines and five years for Indonesia,
respectively, for offsetting against future taxable profits of the companies in which the losses arose.
There are no income tax consequences attaching to the payment of dividends by the Company to its shareholders.
Pledged Deposits and Restricted CashAt 31 December 2017, the Group had no pledged bank deposits as security for bonds issued by the Group (Note 26(D)) (2016:
US$10.6 million), cash of US$63.3 million (2016: US$50.0 million) which was set aside to cover principal and interest payments
of certain borrowings in compliance with loan agreements and cash of US$17.8 million (2016: US$17.9 million) held in an escrow
account in relation to a construction contract which is restricted as to use.
Other Non-current AssetsUS$ millions 2017 2016
Prepayments 138.7 73.0
Plasma receivables 85.5 79.2
Deferred project costs 31.5 19.5
Long-term deposits 28.9 19.2
Claims for tax refund 15.9 20.2
Deposits for acquisition of assets 6.9 6.2
Others 148.6 129.4
Total 456.0 346.7
(A) The prepayments mainly represent Indofood’s prepaid rentals for port facilities and MPIC’s advances to contractors for
construction projects.
(B) The plasma receivables represent the accumulated costs to develop FFB which are currently being financed by banks and
self-financed by Indofood and advances made by Indofood to certain farmers in relation to arrangements for those farmers’
production of FFB.
21.
22.
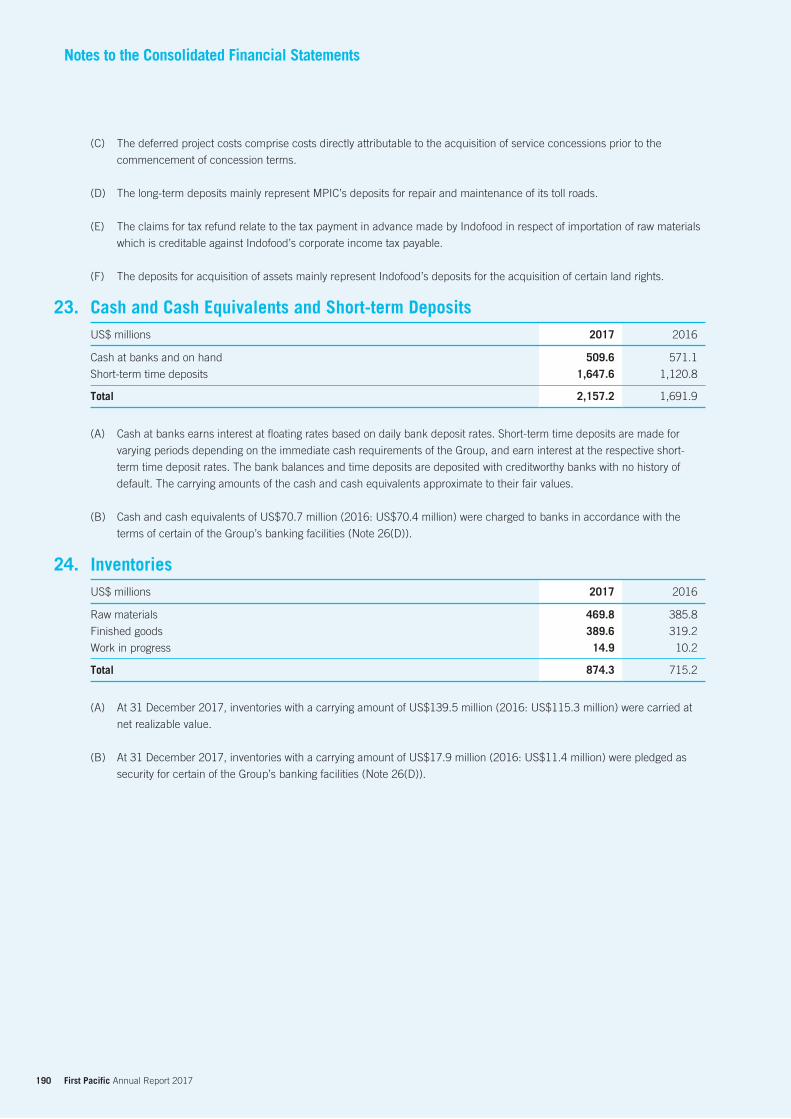
190 First Pacific Annual Report 2017
Notes to the Consolidated Financial Statements
(C) The deferred project costs comprise costs directly attributable to the acquisition of service concessions prior to the
commencement of concession terms.
(D) The long-term deposits mainly represent MPIC’s deposits for repair and maintenance of its toll roads.
(E) The claims for tax refund relate to the tax payment in advance made by Indofood in respect of importation of raw materials
which is creditable against Indofood’s corporate income tax payable.
(F) The deposits for acquisition of assets mainly represent Indofood’s deposits for the acquisition of certain land rights.
Cash and Cash Equivalents and Short-term DepositsUS$ millions 2017 2016
Cash at banks and on hand 509.6 571.1
Short-term time deposits 1,647.6 1,120.8
Total 2,157.2 1,691.9
(A) Cash at banks earns interest at floating rates based on daily bank deposit rates. Short-term time deposits are made for
varying periods depending on the immediate cash requirements of the Group, and earn interest at the respective short-
term time deposit rates. The bank balances and time deposits are deposited with creditworthy banks with no history of
default. The carrying amounts of the cash and cash equivalents approximate to their fair values.
(B) Cash and cash equivalents of US$70.7 million (2016: US$70.4 million) were charged to banks in accordance with the
terms of certain of the Group’s banking facilities (Note 26(D)).
InventoriesUS$ millions 2017 2016
Raw materials 469.8 385.8
Finished goods 389.6 319.2
Work in progress 14.9 10.2
Total 874.3 715.2
(A) At 31 December 2017, inventories with a carrying amount of US$139.5 million (2016: US$115.3 million) were carried at
net realizable value.
(B) At 31 December 2017, inventories with a carrying amount of US$17.9 million (2016: US$11.4 million) were pledged as
security for certain of the Group’s banking facilities (Note 26(D)).
23.
24.
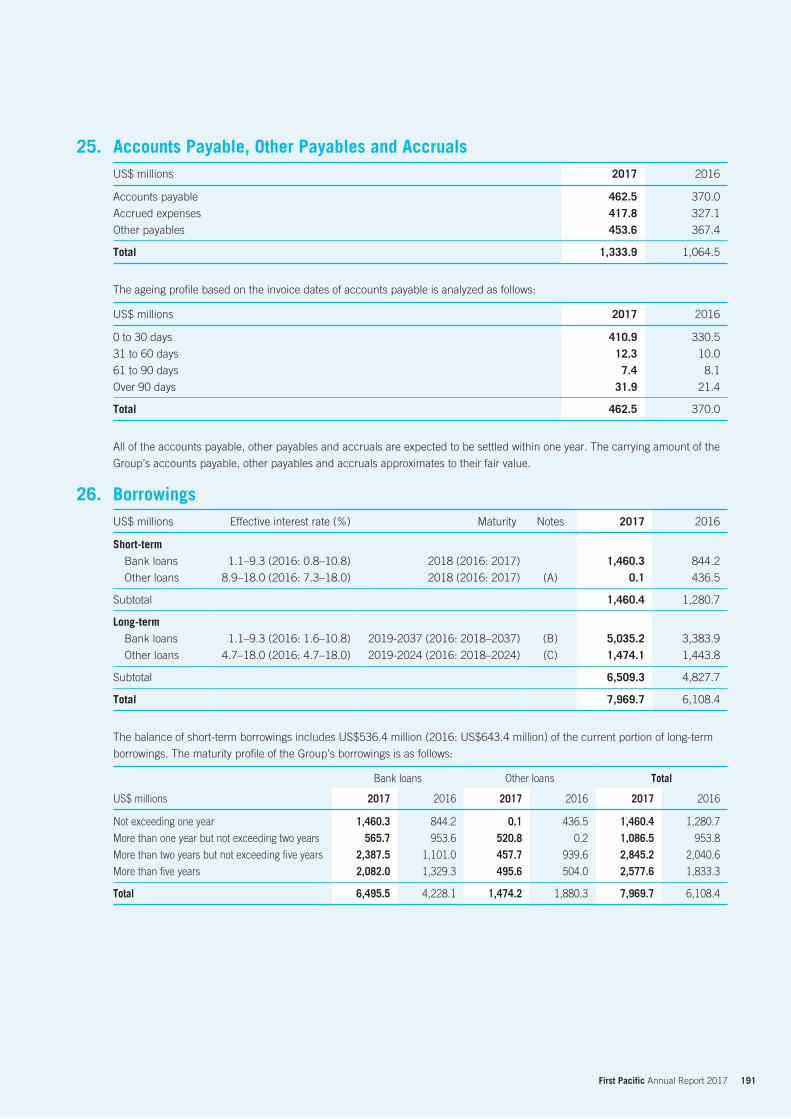
191 First Pacific Annual Report 2017
Accounts Payable, Other Payables and AccrualsUS$ millions 2017 2016
Accounts payable 462.5 370.0
Accrued expenses 417.8 327.1
Other payables 453.6 367.4
Total 1,333.9 1,064.5
The ageing profile based on the invoice dates of accounts payable is analyzed as follows:
US$ millions 2017 2016
0 to 30 days 410.9 330.5
31 to 60 days 12.3 10.0
61 to 90 days 7.4 8.1
Over 90 days 31.9 21.4
Total 462.5 370.0
All of the accounts payable, other payables and accruals are expected to be settled within one year. The carrying amount of the
Group’s accounts payable, other payables and accruals approximates to their fair value.
BorrowingsUS$ millions Effective interest rate (%) Maturity Notes 2017 2016
Short-termBank loans 1.1–9.3 (2016: 0.8–10.8) 2018 (2016: 2017) 1,460.3 844.2
Other loans 8.9–18.0 (2016: 7.3–18.0) 2018 (2016: 2017) (A) 0.1 436.5
Subtotal 1,460.4 1,280.7
Long-termBank loans 1.1–9.3 (2016: 1.6–10.8) 2019-2037 (2016: 2018–2037) (B) 5,035.2 3,383.9
Other loans 4.7–18.0 (2016: 4.7–18.0) 2019-2024 (2016: 2018–2024) (C) 1,474.1 1,443.8
Subtotal 6,509.3 4,827.7
Total 7,969.7 6,108.4
The balance of short-term borrowings includes US$536.4 million (2016: US$643.4 million) of the current portion of long-term
borrowings. The maturity profile of the Group’s borrowings is as follows:
Bank loans Other loans Total
US$ millions 2017 2016 2017 2016 2017 2016
Not exceeding one year 1,460.3 844.2 0.1 436.5 1,460.4 1,280.7
More than one year but not exceeding two years 565.7 953.6 520.8 0.2 1,086.5 953.8
More than two years but not exceeding five years 2,387.5 1,101.0 457.7 939.6 2,845.2 2,040.6
More than five years 2,082.0 1,329.3 495.6 504.0 2,577.6 1,833.3
Total 6,495.5 4,228.1 1,474.2 1,880.3 7,969.7 6,108.4
25.
26.
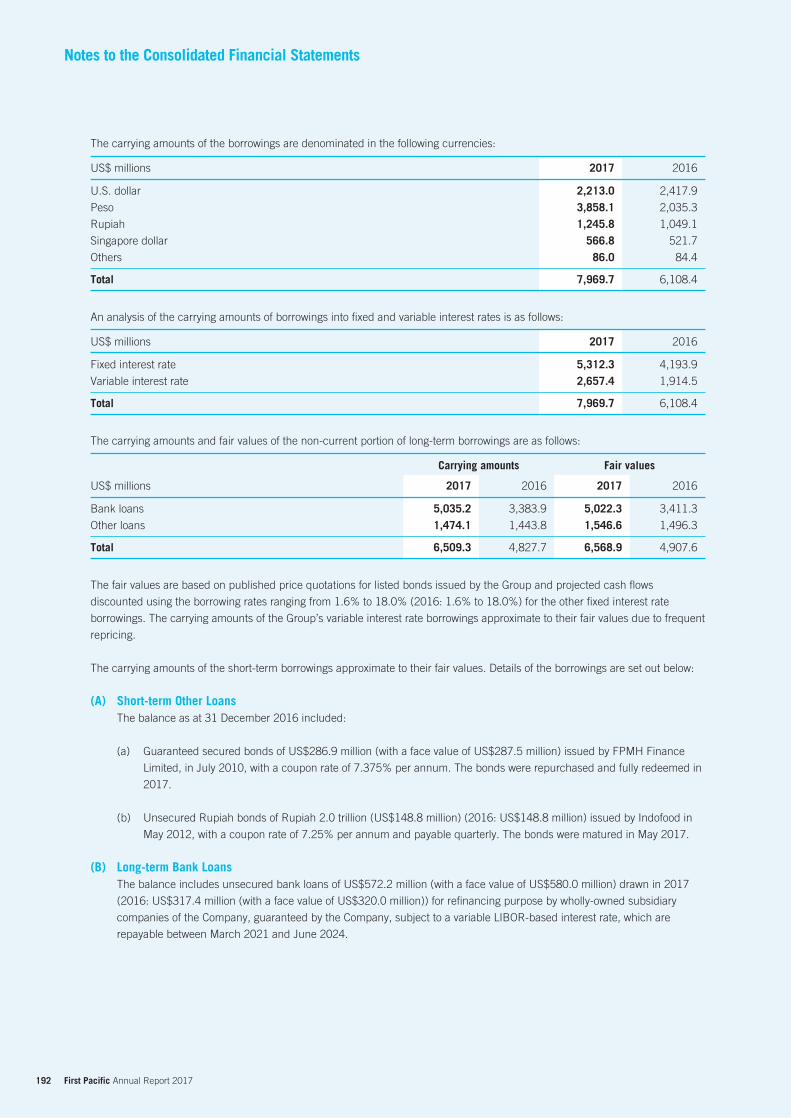
192 First Pacific Annual Report 2017
Notes to the Consolidated Financial Statements
The carrying amounts of the borrowings are denominated in the following currencies:
US$ millions 2017 2016
U.S. dollar 2,213.0 2,417.9
Peso 3,858.1 2,035.3
Rupiah 1,245.8 1,049.1
Singapore dollar 566.8 521.7
Others 86.0 84.4
Total 7,969.7 6,108.4
An analysis of the carrying amounts of borrowings into fixed and variable interest rates is as follows:
US$ millions 2017 2016
Fixed interest rate 5,312.3 4,193.9
Variable interest rate 2,657.4 1,914.5
Total 7,969.7 6,108.4
The carrying amounts and fair values of the non-current portion of long-term borrowings are as follows:
Carrying amounts Fair values
US$ millions 2017 2016 2017 2016
Bank loans 5,035.2 3,383.9 5,022.3 3,411.3
Other loans 1,474.1 1,443.8 1,546.6 1,496.3
Total 6,509.3 4,827.7 6,568.9 4,907.6
The fair values are based on published price quotations for listed bonds issued by the Group and projected cash flows
discounted using the borrowing rates ranging from 1.6% to 18.0% (2016: 1.6% to 18.0%) for the other fixed interest rate
borrowings. The carrying amounts of the Group’s variable interest rate borrowings approximate to their fair values due to frequent
repricing.
The carrying amounts of the short-term borrowings approximate to their fair values. Details of the borrowings are set out below:
(A) Short-term Other LoansThe balance as at 31 December 2016 included:
(a) Guaranteed secured bonds of US$286.9 million (with a face value of US$287.5 million) issued by FPMH Finance
Limited, in July 2010, with a coupon rate of 7.375% per annum. The bonds were repurchased and fully redeemed in
2017.
(b) Unsecured Rupiah bonds of Rupiah 2.0 trillion (US$148.8 million) (2016: US$148.8 million) issued by Indofood in
May 2012, with a coupon rate of 7.25% per annum and payable quarterly. The bonds were matured in May 2017.
(B) Long-term Bank LoansThe balance includes unsecured bank loans of US$572.2 million (with a face value of US$580.0 million) drawn in 2017
(2016: US$317.4 million (with a face value of US$320.0 million)) for refinancing purpose by wholly-owned subsidiary
companies of the Company, guaranteed by the Company, subject to a variable LIBOR-based interest rate, which are
repayable between March 2021 and June 2024.
193 First Pacific Annual Report 2017
(C) Long-term Other LoansThe balance includes bonds issued by wholly-owned subsidiary companies of the Company, Indofood and MPIC. Details
are summarized as follows:
(a) Guaranteed secured bonds of US$310.9 million (with a face value of US$312.2 million) (2016: US$393.2 million (with
a face value of US$395.4 million)) issued by FPT Finance Limited, in September 2010, with a coupon rate of 6.375%
per annum, payable semi-annually, and mature in September 2020. The bonds are guaranteed by the Company and
secured by a 12% (2016: 12.0%) interest in PLDT.
During the year, the Company repurchased US$83.2 million (2016: US$4.6 million) of the above-mentioned bonds at
an aggregate consideration of US$92.3 million (2016: US$5.1 million). These bonds were subsequently cancelled.
(b) Unsecured bonds of US$373.2 million (with a face value of US$374.5 million) (2016: US$397.9 million (with a face
value of US$400.0 million)) issued by FPC Finance Limited, in June 2012, with a coupon rate of 6.0% per annum,
payable semi-annually, and mature in June 2019. The bonds are guaranteed by the Company.
During the year, the Company repurchased US$25.5 million (2016: Nil) of the above-mentioned bonds at an
aggregate consideration of US$27.7 million (2016: Nil). These bonds were subsequently cancelled.
(c) Unsecured bonds of US$356.2 million (with a face value of US$358.8 million) (2016: US$364.1 million (with a face
value of US$367.3 million)) issued by FPC Treasury Limited, in April 2013, with a coupon rate of 4.5% per annum,
payable semi-annually, and mature in April 2023. The bonds are guaranteed by the Company.
During the year, the Company repurchased US$8.5 million (2016: US$17.0 million) of the above-mentioned bonds at
an aggregate consideration of US$8.8 million (2016: US$17.6 million). These bonds were subsequently cancelled.
(d) Unsecured Rupiah bonds of Rupiah 2.0 trillion (US$147.4 million) (2016: US$148.4 million) issued by Indofood in
June 2014, with a coupon rate of 10.125% per annum, payable quarterly, and mature in June 2019.
(e) Unsecured Rupiah bonds of Rupiah 2.0 trillion (US$146.9 million) (2016: Nil) issued by Indofood in May 2017, with
a coupon rate of 8.7% per annum, payable quarterly, and mature in May 2022.
(f) Unsecured Peso bonds of Pesos 4.4 billion (US$87.6 million) (2016: US$88.0 million) issued by NLEX Corporation in
June 2014, with a coupon rate of 5.07% per annum, payable quarterly, and mature in June 2021.
(g) Unsecured Peso bonds of Pesos 2.6 billion (US$51.7 million) (2016: US$51.9 million) issued by NLEX Corporation in
June 2014, with a coupon rate of 5.50% per annum, payable quarterly, and mature in June 2024.
(D) Charges on Group AssetsAt 31 December 2017, certain bank and other borrowings were secured by the Group’s property, plant and equipment,
accounts receivable, pledged deposits, cash and cash equivalents and inventories amounting to a net book value of
US$2,172.9 million (2016: US$1,336.2 million), receipts from future toll collections and funds in the related accounts
of CIC and the following interests of the Group’s 12.0% (2016: 12.0%) in PLDT, none (2016: 35.6%) in MPIC, 56.0% in
GBPC (2016: None), 13.1% in Meralco (2016: None), 100% (2016: 100%) in CIC, 100% (2016: 100%) in AIF Toll Road
Holdings (Thailand) Limited, 25.9% (2016: 25.9%) in DMT, 70.0% (2016: 70.0%) in PLP, 93.7% (2016: 93.7%) in SCBI
and 45.1% (2016: 45.1%) in Hawaiian-Philippine Company, Inc.
194 First Pacific Annual Report 2017
Notes to the Consolidated Financial Statements
Provision for TaxationUS$ millions 2017 2016
At 1 January 80.4 44.7Exchange translation 0.2 0.1Provision for taxation on estimated assessable profits for the year 305.6 289.4Acquisition of subsidiary companies (Note 34(B)) 6.6 –Other movements 7.6 –Taxes paid (335.1) (253.8) At 31 December 65.3 80.4
Deferred Liabilities, Provisions and Payables
US$ millionsLong-term
liabilities Pension
Loans from non-controlling
shareholders Others 2017 2016
At 1 January 767.6 403.3 277.4 221.9 1,670.2 1,477.0Exchange translation (1.4) (5.8) 3.4 1.6 (2.2) (41.5)Additions 221.0 136.8 – 97.8 455.6 381.8Payment and utilization (59.7) (30.3) (88.3) (37.2) (215.5) (147.3)Acquisition of subsidiary companies (Note 34(B)) – 16.4 – 102.7 119.1 0.2 At 31 December 927.5 520.4 192.5 386.8 2,027.2 1,670.2 Presented as:Non-current Portion 822.5 520.4 79.0 208.9 1,630.8 1,374.0Current Portion 105.0 – 113.5 177.9 396.4 296.2 Total 927.5 520.4 192.5 386.8 2,027.2 1,670.2
The long-term liabilities mainly relate to (a) Maynilad’s concession fees payable to MWSS, including a provision for certain additional concession fees payable and related interest amounts in dispute between Maynilad and MWSS, recognized by the Group upon its acquisition of Maynilad, (b) MPCALA’s concession fees payable to the Philippine Government in respect of CALAX, (c) LRMC’s concession fees payable to the Philippine Government in respect of LRT1, (d) NLEX Corporation’s concession fees payable to the Philippine Government in respect of Connector Road and (e) MPIC’s outstanding payable for its acquisition of 50% interest in Beacon Electric from PCEV. In respect of the disputed amounts between Maynilad and MWSS, no final resolution has been reached at 31 December 2017.
The pension relates to accrued liabilities in relation to defined benefit retirement schemes and long service payments.
The loans from non-controlling shareholders represent unsecured loans provided by non-controlling shareholders of FPM Power, PLP and IndoAgri, a subsidiary company of Indofood. In December 2017, the non-controlling shareholder of PLP has converted its S$ denominated loans of S$105.3 million (US$76.6 million) into equity of PLP.
The others mainly represent (a) Maynilad’s real property tax payables on certain common purpose facilities, (b) contractual obligations of NLEX Corporation and CIC to restore their service concession assets to a specified level of serviceability during their service concession periods and to maintain these assets in good condition prior to the handover of these assets to the Philippine Government at the end of their concession periods, (c) provision for certain business tax payables, (d) provisions for various claims and potential claims against the Group, (e) derivative liabilities arising from foreign exchange forward contracts, interest rate swaps, fuel swaps and electricity futures, (f) provision for heavy maintenance and (g) the Group’s payables on LTIP.
At the end of the reporting period, certain Group’s subsidiary companies are parties to other cases and claims arising from the ordinary course of business filed by third parties, which are either pending decisions by the courts or are subjected to settlement agreements. The outcome of these claims cannot be presently determined. In the opinion of the Directors and/or legal counsels, the eventual liability from these lawsuits or claims, if any, will not have a material adverse effect on the Consolidated Financial Statements. Other disclosures required by HKAS 37 were not provided as it may prejudice the subsidiary companies’ position in on–going claims, litigations and assessments.
27.
28.
195 First Pacific Annual Report 2017
Share CapitalUS$ millions 2017 2016
Authorized6,000,000,000 (2016: 6,000,000,000) ordinary shares of U.S. 1 cent each 60.0 60.0
Issued and fully paid At 1 January 42.8 42.7
Issue of shares upon the exercise of share options 0.6 –
Issue of shares under share award scheme – 0.1
At 31 December 4,341,986,968 (2016: 4,281,679,008) ordinary shares of U.S. 1 cent each 43.4 42.8
(A) During the year, 60,173,618 (2016: 8,928,916) share options were exercised at the exercise price at HK$4.9457 per share
(2016: between HK$4.9457 per share and HK$5.1932 per share), resulting in the issue of 60,173,618 (2016: 8,928,916)
new ordinary shares of U.S. 1 cent each for a total cash consideration of HK$297.6 million (US$38.2 million) (2016:
HK$44.2 million or US$5.6 million). Details of the Company’s share option scheme are set out in Note 37(D)(a) to the
Consolidated Financial Statements.
(B) During the year, the Company has not repurchased any of its ordinary shares on SEHK (2016: None).
Shares Held for Share Award SchemeNumber of
allocated shares held for
Number of unallocated shares
held for
Shares held for
Share Award Purchase
AwardsSubscription
AwardsSubscription
AwardsScheme
US$m
At 1 January 2016 4,060,666 1,173,571 132,000 (6.0)
Granted and issued – 4,416,489 (132,000) (2.8)
Granted and purchased 6,764,000 – – (4.7)
Vested and transferred (1,801,176) (500,781) – 2.6
At 31 December 2016 9,023,490 5,089,279 – (10.9)Granted and issued – 134,342 – (0.1)Granted and purchased 7,452,000 – – (5.8)Vested and transferred (8,325,612) (1,800,953) – 7.9 At 31 December 2017 8,149,878 3,422,668 – (8.9)
For the Purchase Awards, during 2017, the independent trustee managing the Company’s share award scheme purchased
7,452,000 shares (2016: 6,764,000) of the Company at an aggregate consideration of HK$45.6 million (US$5.8 million) (2016:
HK$37.1 million (US$4.7 million)) from the open market at the cost of the Company.
For the Subscription Awards, during 2017, the independent trustee managing the Company’s share award scheme subscribed
134,342 new shares (2016: 4,284,489) issued by the Company at an aggregate consideration of HK$0.8 million (US$0.1
million) (2016: HK$21.3 million (US$2.8 million)).
29.
30.
196 First Pacific Annual Report 2017
Notes to the Consolidated Financial Statements
Particulars of the share awards of the Company granted to the Directors and senior executives of the Company at 31 December 2017 are set out below.
(a) Particulars of the Company’s Purchase Awards
Shares granted Shares Shares granted and unvested vested and and unvested
shares held transferred shares held atat 1 January during 31 December
2017 the year Reclassification(i) 2017 Grant date Vesting period(ii)
Executive DirectorsManuel V. Pangilinan, 681,668 (681,668) – – – –
Managing Director and
Chief Executive Officer
4,465,380 (1,488,460) – 2,976,920 15 April 2016 April 2017 toApril 2019
Robert C. Nicholson 443,083 (443,083) – – – –2,639,820 (879,940) – 1,759,880 15 April 2016 April 2017 to
April 2019
Christopher H. Young – – 2,369,560 2,369,560 15 April 2016 April 2017 toApril 2019
Non-executive DirectorsBenny S. Santoso 446,535 (148,845) – 297,690 15 April 2016 April 2017 to
April 2019Ambassador Albert F. del Rosario 893,070 (297,690) – 595,380 30 June 2016 June 2017 to
June 2019
Independent Non-executive DirectorsProf. Edward K.Y. Chen,
GBS, CBE, JP
95,434 (95,434) – – – –
893,070 (297,690) – 595,380 15 April 2016 April 2017 toApril 2019
Margaret Leung Ko May Yee, SBS, JP
95,434 (47,716) – 47,718 12 July 2013 March 2015 toMarch 2018
893,070 (297,690) – 595,380 15 April 2016 April 2017 toApril 2019
Philip Fan Yan Hok 95,434 (47,716) – 47,718 12 July 2013 March 2015 toMarch 2018
893,070 (297,690) – 595,380 15 April 2016 April 2017 toApril 2019
Madeleine Lee Suh Shin 893,070 – – 893,070 15 April 2016 April 2018 toApril 2019
Senior Executives 313,570 (313,570) – – – –344,000 (172,000) – 172,000 12 July 2013 July 2015 to
July 20188,449,260 (2,816,420) (2,369,560) 3,263,280 15 April 2016 April 2017 to
April 2019 Total 22,534,968 (8,325,612) – 14,209,356
(i) Mr. Christopher H. Young was appointed as Executive Director of the Company with effect from 30 August 2017 and his outstanding awarded shares were reclassified under “Executive Directors”.
(ii) The vesting periods of the awarded shares are as follows:(a) For the 2013 grant, the shares would be vested in five equal tranches in September 2013, September 2014, September 2015,
September 2016 and September 2017, except for new recruits (Independent Non-executive Directors: 40% in March 2015 and 20% each in March 2016, March 2017 and March 2018; Senior executives: 40% in the second year and 20% each for the third to the fifth years after the grant).
(b) For the 2016 grants, the shares would be vested in three equal tranches from the first to the third years after the shares are granted, except for new recruit (Independent Non-executive Director (INED): 60% in the second year and 40% in the third year after the grant).
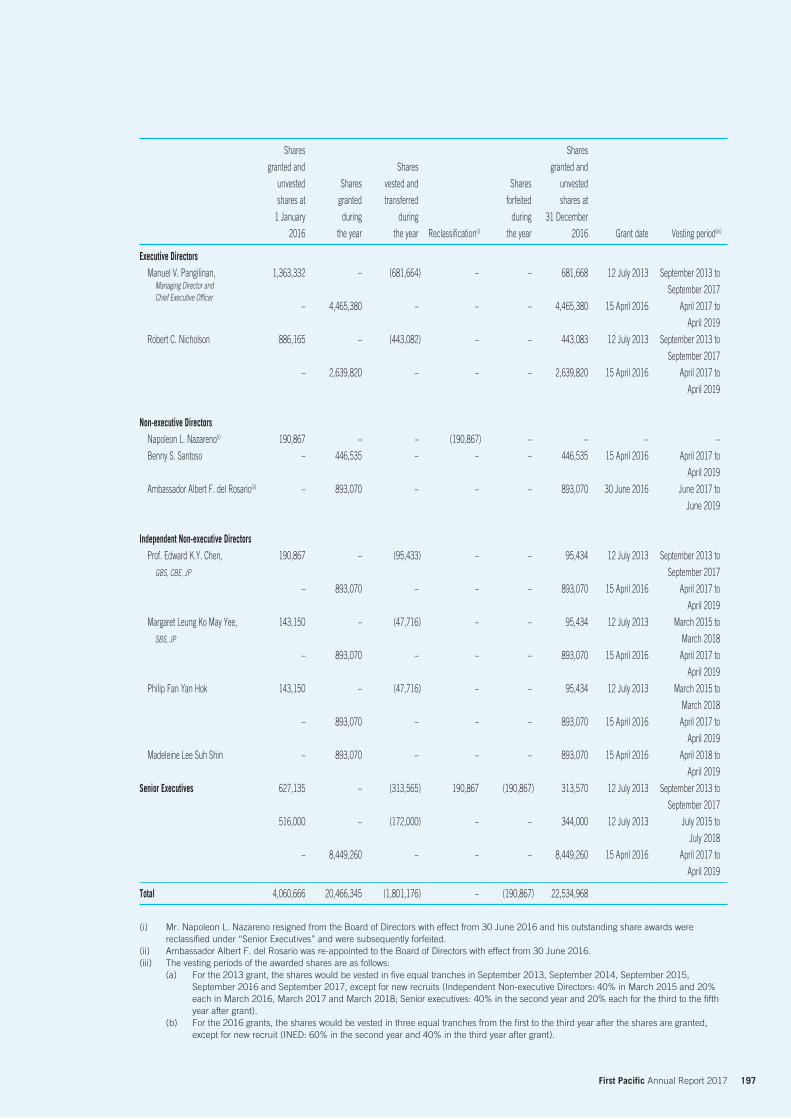
197 First Pacific Annual Report 2017
Shares Shares
granted and Shares granted and
unvested Shares vested and Shares unvested
shares at granted transferred forfeited shares at
1 January during during during 31 December
2016 the year the year Reclassification(i) the year 2016 Grant date Vesting period(iii)
Executive DirectorsManuel V. Pangilinan,
Managing Director and Chief Executive Officer
1,363,332 – (681,664) – – 681,668 12 July 2013 September 2013 to
September 2017
– 4,465,380 – – – 4,465,380 15 April 2016 April 2017 to
April 2019
Robert C. Nicholson 886,165 – (443,082) – – 443,083 12 July 2013 September 2013 to
September 2017
– 2,639,820 – – – 2,639,820 15 April 2016 April 2017 to
April 2019
Non-executive DirectorsNapoleon L. Nazareno(i) 190,867 – – (190,867) – – – –
Benny S. Santoso – 446,535 – – – 446,535 15 April 2016 April 2017 to
April 2019
Ambassador Albert F. del Rosario(ii) – 893,070 – – – 893,070 30 June 2016 June 2017 to
June 2019
Independent Non-executive DirectorsProf. Edward K.Y. Chen,
GBS, CBE, JP
190,867 – (95,433) – – 95,434 12 July 2013 September 2013 to
September 2017
– 893,070 – – – 893,070 15 April 2016 April 2017 to
April 2019
Margaret Leung Ko May Yee,
SBS, JP
143,150 – (47,716) – – 95,434 12 July 2013 March 2015 to
March 2018
– 893,070 – – – 893,070 15 April 2016 April 2017 to
April 2019
Philip Fan Yan Hok 143,150 – (47,716) – – 95,434 12 July 2013 March 2015 to
March 2018
– 893,070 – – – 893,070 15 April 2016 April 2017 to
April 2019
Madeleine Lee Suh Shin – 893,070 – – – 893,070 15 April 2016 April 2018 to
April 2019
Senior Executives 627,135 – (313,565) 190,867 (190,867) 313,570 12 July 2013 September 2013 to
September 2017
516,000 – (172,000) – – 344,000 12 July 2013 July 2015 to
July 2018
– 8,449,260 – – – 8,449,260 15 April 2016 April 2017 to
April 2019
Total 4,060,666 20,466,345 (1,801,176) – (190,867) 22,534,968
(i) Mr. Napoleon L. Nazareno resigned from the Board of Directors with effect from 30 June 2016 and his outstanding share awards were reclassified under “Senior Executives” and were subsequently forfeited.
(ii) Ambassador Albert F. del Rosario was re-appointed to the Board of Directors with effect from 30 June 2016.(iii) The vesting periods of the awarded shares are as follows:
(a) For the 2013 grant, the shares would be vested in five equal tranches in September 2013, September 2014, September 2015, September 2016 and September 2017, except for new recruits (Independent Non-executive Directors: 40% in March 2015 and 20% each in March 2016, March 2017 and March 2018; Senior executives: 40% in the second year and 20% each for the third to the fifth year after grant).
(b) For the 2016 grants, the shares would be vested in three equal tranches from the first to the third year after the shares are granted, except for new recruit (INED: 60% in the second year and 40% in the third year after grant).
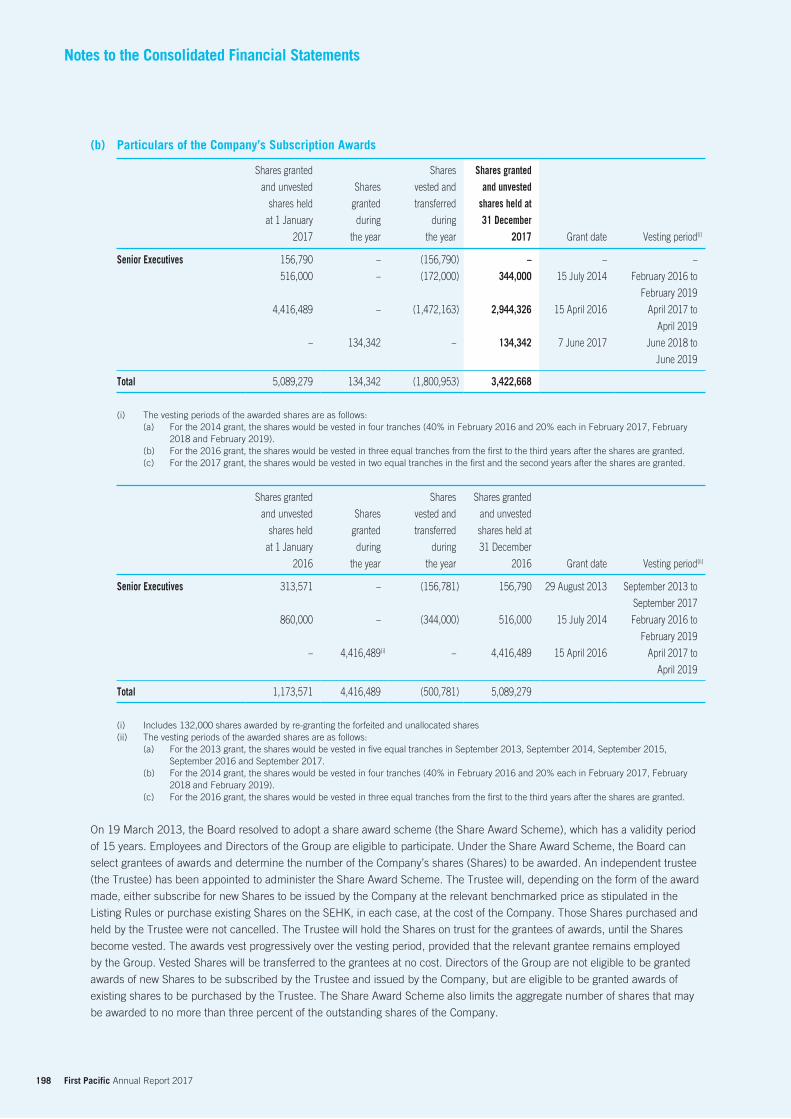
198 First Pacific Annual Report 2017
Notes to the Consolidated Financial Statements
(b) Particulars of the Company’s Subscription Awards
Shares granted Shares Shares granted and unvested Shares vested and and unvested
shares held granted transferred shares held atat 1 January during during 31 December
2017 the year the year 2017 Grant date Vesting period(i)
Senior Executives 156,790 – (156,790) – – –
516,000 – (172,000) 344,000 15 July 2014 February 2016 to
February 2019
4,416,489 – (1,472,163) 2,944,326 15 April 2016 April 2017 to
April 2019
– 134,342 – 134,342 7 June 2017 June 2018 to
June 2019
Total 5,089,279 134,342 (1,800,953) 3,422,668
(i) The vesting periods of the awarded shares are as follows:(a) For the 2014 grant, the shares would be vested in four tranches (40% in February 2016 and 20% each in February 2017, February
2018 and February 2019).(b) For the 2016 grant, the shares would be vested in three equal tranches from the first to the third years after the shares are granted.(c) For the 2017 grant, the shares would be vested in two equal tranches in the first and the second years after the shares are granted.
Shares granted Shares Shares granted
and unvested Shares vested and and unvested
shares held granted transferred shares held at
at 1 January during during 31 December
2016 the year the year 2016 Grant date Vesting period(ii)
Senior Executives 313,571 – (156,781) 156,790 29 August 2013 September 2013 to
September 2017
860,000 – (344,000) 516,000 15 July 2014 February 2016 to
February 2019
– 4,416,489(i) – 4,416,489 15 April 2016 April 2017 to
April 2019
Total 1,173,571 4,416,489 (500,781) 5,089,279
(i) Includes 132,000 shares awarded by re-granting the forfeited and unallocated shares(ii) The vesting periods of the awarded shares are as follows:
(a) For the 2013 grant, the shares would be vested in five equal tranches in September 2013, September 2014, September 2015, September 2016 and September 2017.
(b) For the 2014 grant, the shares would be vested in four tranches (40% in February 2016 and 20% each in February 2017, February 2018 and February 2019).
(c) For the 2016 grant, the shares would be vested in three equal tranches from the first to the third years after the shares are granted.
On 19 March 2013, the Board resolved to adopt a share award scheme (the Share Award Scheme), which has a validity period
of 15 years. Employees and Directors of the Group are eligible to participate. Under the Share Award Scheme, the Board can
select grantees of awards and determine the number of the Company’s shares (Shares) to be awarded. An independent trustee
(the Trustee) has been appointed to administer the Share Award Scheme. The Trustee will, depending on the form of the award
made, either subscribe for new Shares to be issued by the Company at the relevant benchmarked price as stipulated in the
Listing Rules or purchase existing Shares on the SEHK, in each case, at the cost of the Company. Those Shares purchased and
held by the Trustee were not cancelled. The Trustee will hold the Shares on trust for the grantees of awards, until the Shares
become vested. The awards vest progressively over the vesting period, provided that the relevant grantee remains employed
by the Group. Vested Shares will be transferred to the grantees at no cost. Directors of the Group are not eligible to be granted
awards of new Shares to be subscribed by the Trustee and issued by the Company, but are eligible to be granted awards of
existing shares to be purchased by the Trustee. The Share Award Scheme also limits the aggregate number of shares that may
be awarded to no more than three percent of the outstanding shares of the Company.
199 First Pacific Annual Report 2017
On 12 July 2013, 9,483,061 share awards under the Company’s Share Award Scheme were granted as Purchase Awards. The
average fair value of shares granted as calculated by Towers Watson Hong Kong Limited, by adjusting the closing share price
at the grant date by the present value of expected dividend payments during the vesting period, was HK$8.18 per share or an
aggregate value of US$9.9 million for all shares granted. The assumptions used were as follows:
Share price at the date of grant HK$8.70 per share
Expected dividend yield 2.7% per annum
Average risk-free interest rate (based on the Hong Kong Exchange Fund Notes) 0.5% per annum
On 29 August 2013, 1,003,914 share awards under the Company’s Share Award Scheme were granted as Subscription Awards.
The average fair value of shares granted as calculated by Towers Watson Hong Kong Limited, by adjusting the closing share
price at the grant date by the present value of expected dividend payments during the vesting period, was HK$7.63 per share or
an aggregate value of US$1.0 million for all shares granted. The assumptions used were as follows:
Share price at the date of grant HK$8.11 per share
Expected dividend yield 2.7% per annum
Average risk-free interest rate (based on the Hong Kong Exchange Fund Notes) 0.5% per annum
On 15 July 2014, 860,000 share awards under the Company’s Share Award Scheme were granted as Subscription Awards. The
average fair value of shares granted as calculated by Towers Watson Hong Kong Limited, by adjusting the closing share price
at the grant date by the present value of expected dividend payments during the vesting period, was HK$8.55 per share or an
aggregate value of US$0.9 million for all shares granted. The assumptions used were as follows:
Share price at the date of grant HK$9.23 per share
Expected dividend yield 2.7% per annum
Average risk-free interest rate (based on the Hong Kong Exchange Fund Notes) 0.7% per annum
On 15 April 2016, 19,573,275 share awards under the Company’s Share Award Scheme were granted as Purchase Awards and
4,416,489 share awards were granted as Subscription Awards under the Company’s Share Award Scheme. The average fair
value of shares granted as calculated by Towers Watson Hong Kong Limited, by adjusting the closing share price at the grant
date by the present value of expected dividend payments during the vesting period, was HK$4.71 per share or an aggregate
value of US$14.5 million for all shares granted. The assumptions used were as follows:
Share price at the date of grant HK$4.95 per share
Expected dividend yield 2.4% per annum
Average risk-free interest rate (based on the Hong Kong Exchange Fund Notes) 0.6% per annum
On 30 June 2016, 893,070 share awards under the Company’s Share Award Scheme were granted as Purchase Awards. The
average fair value of shares granted as calculated by Towers Watson Hong Kong Limited, by adjusting the closing share price
at the grant date by the present value of expected dividend payments during the vesting period, was HK$5.35 per share or an
aggregate value of US$0.6 million for all shares granted. The assumptions used were as follows:
Share price at the date of grant HK$5.62 per share
Expected dividend yield 2.4% per annum
Average risk-free interest rate (based on the Hong Kong Exchange Fund Notes) 0.4% per annum
On 7 June 2017, 134,342 share awards under the Company’s Share Award Scheme were granted as Subscription Awards. The
average fair value of shares granted as calculated by Towers Watson Hong Kong Limited, by adjusting the closing share price
at the grant date by the present value of expected dividend payments during the vesting period, was HK$5.77 per share or an
aggregate value of US$0.1 million for all shares granted. The assumptions used were as follows:
Share price at the date of grant HK$5.98 per share
Expected dividend yield 2.4% per annum
Average risk-free interest rate (based on the Hong Kong Exchange Fund Notes) 0.5% per annum
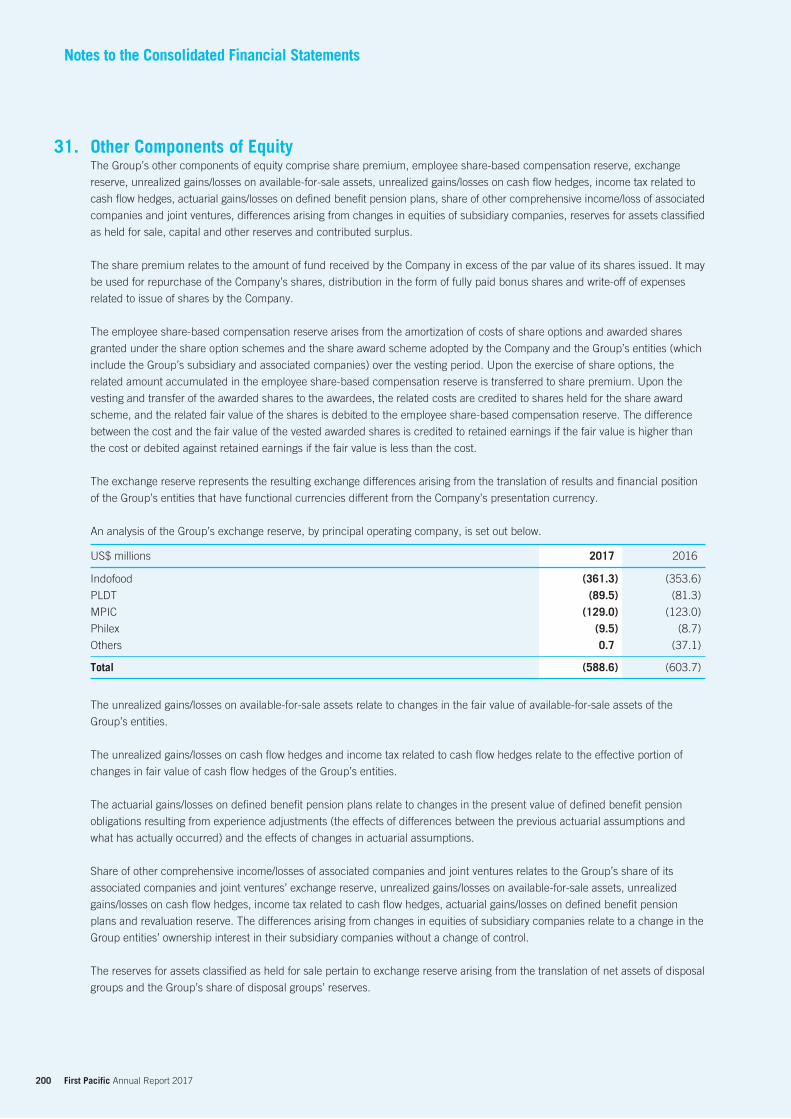
200 First Pacific Annual Report 2017
Notes to the Consolidated Financial Statements
Other Components of EquityThe Group’s other components of equity comprise share premium, employee share-based compensation reserve, exchange
reserve, unrealized gains/losses on available-for-sale assets, unrealized gains/losses on cash flow hedges, income tax related to
cash flow hedges, actuarial gains/losses on defined benefit pension plans, share of other comprehensive income/loss of associated
companies and joint ventures, differences arising from changes in equities of subsidiary companies, reserves for assets classified
as held for sale, capital and other reserves and contributed surplus.
The share premium relates to the amount of fund received by the Company in excess of the par value of its shares issued. It may
be used for repurchase of the Company’s shares, distribution in the form of fully paid bonus shares and write-off of expenses
related to issue of shares by the Company.
The employee share-based compensation reserve arises from the amortization of costs of share options and awarded shares
granted under the share option schemes and the share award scheme adopted by the Company and the Group’s entities (which
include the Group’s subsidiary and associated companies) over the vesting period. Upon the exercise of share options, the
related amount accumulated in the employee share-based compensation reserve is transferred to share premium. Upon the
vesting and transfer of the awarded shares to the awardees, the related costs are credited to shares held for the share award
scheme, and the related fair value of the shares is debited to the employee share-based compensation reserve. The difference
between the cost and the fair value of the vested awarded shares is credited to retained earnings if the fair value is higher than
the cost or debited against retained earnings if the fair value is less than the cost.
The exchange reserve represents the resulting exchange differences arising from the translation of results and financial position
of the Group’s entities that have functional currencies different from the Company’s presentation currency.
An analysis of the Group’s exchange reserve, by principal operating company, is set out below.
US$ millions 2017 2016
Indofood (361.3) (353.6)
PLDT (89.5) (81.3)
MPIC (129.0) (123.0)
Philex (9.5) (8.7)
Others 0.7 (37.1)
Total (588.6) (603.7)
The unrealized gains/losses on available-for-sale assets relate to changes in the fair value of available-for-sale assets of the
Group’s entities.
The unrealized gains/losses on cash flow hedges and income tax related to cash flow hedges relate to the effective portion of
changes in fair value of cash flow hedges of the Group’s entities.
The actuarial gains/losses on defined benefit pension plans relate to changes in the present value of defined benefit pension
obligations resulting from experience adjustments (the effects of differences between the previous actuarial assumptions and
what has actually occurred) and the effects of changes in actuarial assumptions.
Share of other comprehensive income/losses of associated companies and joint ventures relates to the Group’s share of its
associated companies and joint ventures’ exchange reserve, unrealized gains/losses on available-for-sale assets, unrealized
gains/losses on cash flow hedges, income tax related to cash flow hedges, actuarial gains/losses on defined benefit pension
plans and revaluation reserve. The differences arising from changes in equities of subsidiary companies relate to a change in the
Group entities’ ownership interest in their subsidiary companies without a change of control.
The reserves for assets classified as held for sale pertain to exchange reserve arising from the translation of net assets of disposal
groups and the Group’s share of disposal groups’ reserves.
31.
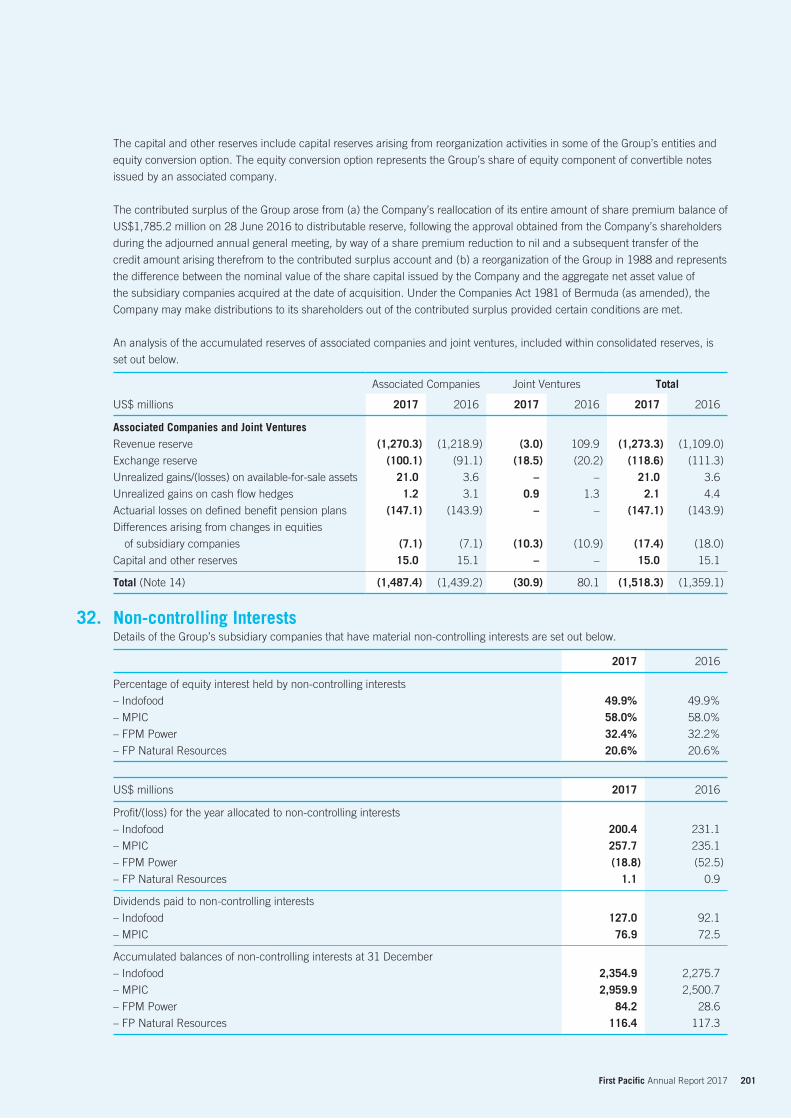
201 First Pacific Annual Report 2017
The capital and other reserves include capital reserves arising from reorganization activities in some of the Group’s entities and
equity conversion option. The equity conversion option represents the Group’s share of equity component of convertible notes
issued by an associated company.
The contributed surplus of the Group arose from (a) the Company’s reallocation of its entire amount of share premium balance of
US$1,785.2 million on 28 June 2016 to distributable reserve, following the approval obtained from the Company’s shareholders
during the adjourned annual general meeting, by way of a share premium reduction to nil and a subsequent transfer of the
credit amount arising therefrom to the contributed surplus account and (b) a reorganization of the Group in 1988 and represents
the difference between the nominal value of the share capital issued by the Company and the aggregate net asset value of
the subsidiary companies acquired at the date of acquisition. Under the Companies Act 1981 of Bermuda (as amended), the
Company may make distributions to its shareholders out of the contributed surplus provided certain conditions are met.
An analysis of the accumulated reserves of associated companies and joint ventures, included within consolidated reserves, is
set out below.
Associated Companies Joint Ventures Total
US$ millions 2017 2016 2017 2016 2017 2016
Associated Companies and Joint VenturesRevenue reserve (1,270.3) (1,218.9) (3.0) 109.9 (1,273.3) (1,109.0)
Exchange reserve (100.1) (91.1) (18.5) (20.2) (118.6) (111.3)
Unrealized gains/(losses) on available-for-sale assets 21.0 3.6 – – 21.0 3.6
Unrealized gains on cash flow hedges 1.2 3.1 0.9 1.3 2.1 4.4
Actuarial losses on defined benefit pension plans (147.1) (143.9) – – (147.1) (143.9)
Differences arising from changes in equities
of subsidiary companies (7.1) (7.1) (10.3) (10.9) (17.4) (18.0)
Capital and other reserves 15.0 15.1 – – 15.0 15.1
Total (Note 14) (1,487.4) (1,439.2) (30.9) 80.1 (1,518.3) (1,359.1)
Non-controlling InterestsDetails of the Group’s subsidiary companies that have material non-controlling interests are set out below.
2017 2016
Percentage of equity interest held by non-controlling interests
– Indofood 49.9% 49.9%
– MPIC 58.0% 58.0%
– FPM Power 32.4% 32.2%
– FP Natural Resources 20.6% 20.6%
US$ millions 2017 2016
Profit/(loss) for the year allocated to non-controlling interests
– Indofood 200.4 231.1
– MPIC 257.7 235.1
– FPM Power (18.8) (52.5)
– FP Natural Resources 1.1 0.9
Dividends paid to non-controlling interests
– Indofood 127.0 92.1
– MPIC 76.9 72.5
Accumulated balances of non-controlling interests at 31 December
– Indofood 2,354.9 2,275.7
– MPIC 2,959.9 2,500.7
– FPM Power 84.2 28.6
– FP Natural Resources 116.4 117.3
32.
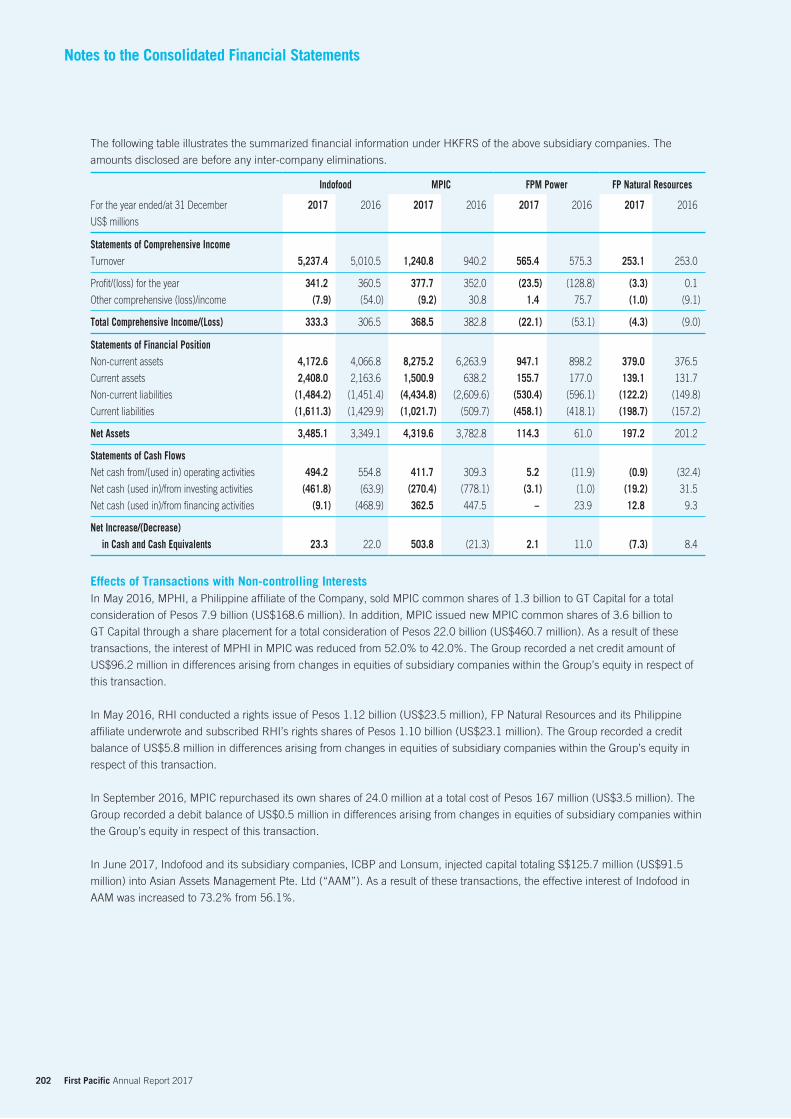
202 First Pacific Annual Report 2017
Notes to the Consolidated Financial Statements
The following table illustrates the summarized financial information under HKFRS of the above subsidiary companies. The
amounts disclosed are before any inter-company eliminations.
Indofood MPIC FPM Power FP Natural Resources
For the year ended/at 31 December
US$ millions
2017 2016 2017 2016 2017 2016 2017 2016
Statements of Comprehensive IncomeTurnover 5,237.4 5,010.5 1,240.8 940.2 565.4 575.3 253.1 253.0
Profit/(loss) for the year 341.2 360.5 377.7 352.0 (23.5) (128.8) (3.3) 0.1
Other comprehensive (loss)/income (7.9) (54.0) (9.2) 30.8 1.4 75.7 (1.0) (9.1)
Total Comprehensive Income/(Loss) 333.3 306.5 368.5 382.8 (22.1) (53.1) (4.3) (9.0)
Statements of Financial PositionNon-current assets 4,172.6 4,066.8 8,275.2 6,263.9 947.1 898.2 379.0 376.5
Current assets 2,408.0 2,163.6 1,500.9 638.2 155.7 177.0 139.1 131.7
Non-current liabilities (1,484.2) (1,451.4) (4,434.8) (2,609.6) (530.4) (596.1) (122.2) (149.8)
Current liabilities (1,611.3) (1,429.9) (1,021.7) (509.7) (458.1) (418.1) (198.7) (157.2)
Net Assets 3,485.1 3,349.1 4,319.6 3,782.8 114.3 61.0 197.2 201.2
Statements of Cash Flows Net cash from/(used in) operating activities 494.2 554.8 411.7 309.3 5.2 (11.9) (0.9) (32.4)
Net cash (used in)/from investing activities (461.8) (63.9) (270.4) (778.1) (3.1) (1.0) (19.2) 31.5
Net cash (used in)/from financing activities (9.1) (468.9) 362.5 447.5 – 23.9 12.8 9.3
Net Increase/(Decrease) in Cash and Cash Equivalents 23.3 22.0 503.8 (21.3) 2.1 11.0 (7.3) 8.4
Effects of Transactions with Non-controlling InterestsIn May 2016, MPHI, a Philippine affiliate of the Company, sold MPIC common shares of 1.3 billion to GT Capital for a total
consideration of Pesos 7.9 billion (US$168.6 million). In addition, MPIC issued new MPIC common shares of 3.6 billion to
GT Capital through a share placement for a total consideration of Pesos 22.0 billion (US$460.7 million). As a result of these
transactions, the interest of MPHI in MPIC was reduced from 52.0% to 42.0%. The Group recorded a net credit amount of
US$96.2 million in differences arising from changes in equities of subsidiary companies within the Group’s equity in respect of
this transaction.
In May 2016, RHI conducted a rights issue of Pesos 1.12 billion (US$23.5 million), FP Natural Resources and its Philippine
affiliate underwrote and subscribed RHI’s rights shares of Pesos 1.10 billion (US$23.1 million). The Group recorded a credit
balance of US$5.8 million in differences arising from changes in equities of subsidiary companies within the Group’s equity in
respect of this transaction.
In September 2016, MPIC repurchased its own shares of 24.0 million at a total cost of Pesos 167 million (US$3.5 million). The
Group recorded a debit balance of US$0.5 million in differences arising from changes in equities of subsidiary companies within
the Group’s equity in respect of this transaction.
In June 2017, Indofood and its subsidiary companies, ICBP and Lonsum, injected capital totaling S$125.7 million (US$91.5
million) into Asian Assets Management Pte. Ltd (“AAM”). As a result of these transactions, the effective interest of Indofood in
AAM was increased to 73.2% from 56.1%.
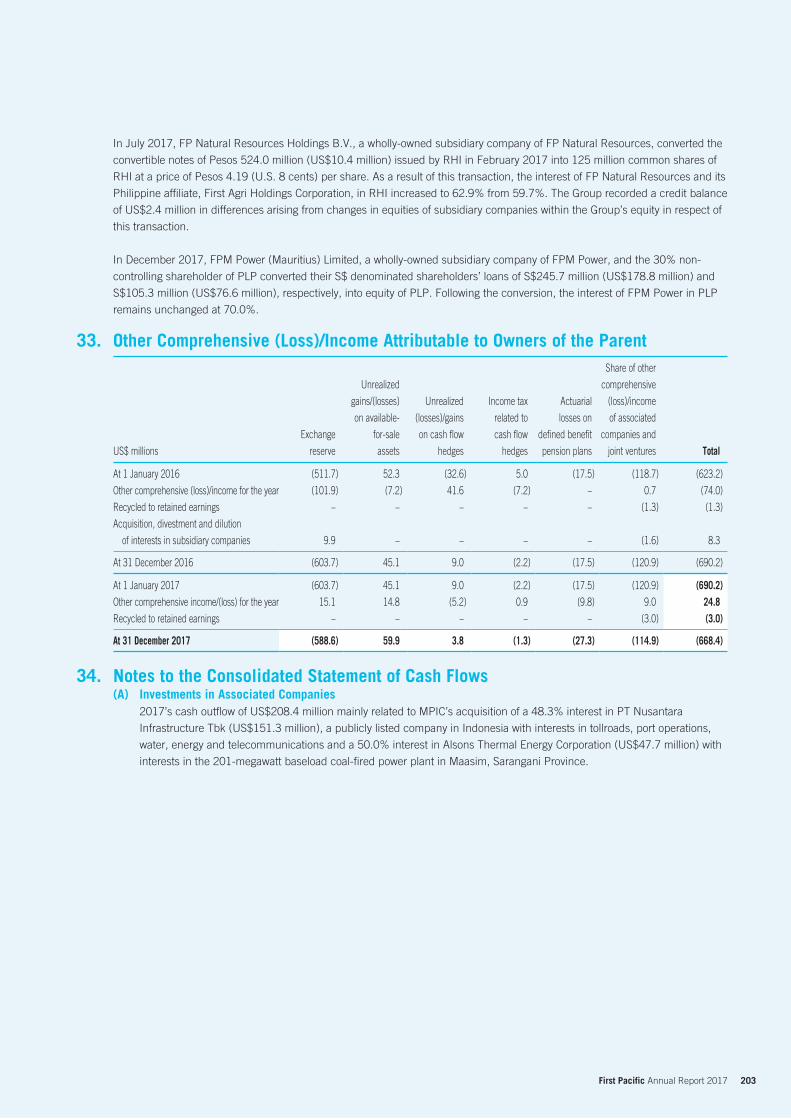
203 First Pacific Annual Report 2017
In July 2017, FP Natural Resources Holdings B.V., a wholly-owned subsidiary company of FP Natural Resources, converted the
convertible notes of Pesos 524.0 million (US$10.4 million) issued by RHI in February 2017 into 125 million common shares of
RHI at a price of Pesos 4.19 (U.S. 8 cents) per share. As a result of this transaction, the interest of FP Natural Resources and its
Philippine affiliate, First Agri Holdings Corporation, in RHI increased to 62.9% from 59.7%. The Group recorded a credit balance
of US$2.4 million in differences arising from changes in equities of subsidiary companies within the Group’s equity in respect of
this transaction.
In December 2017, FPM Power (Mauritius) Limited, a wholly-owned subsidiary company of FPM Power, and the 30% non-
controlling shareholder of PLP converted their S$ denominated shareholders’ loans of S$245.7 million (US$178.8 million) and
S$105.3 million (US$76.6 million), respectively, into equity of PLP. Following the conversion, the interest of FPM Power in PLP
remains unchanged at 70.0%.
Other Comprehensive (Loss)/Income Attributable to Owners of the ParentShare of other
Unrealized comprehensive
gains/(losses) Unrealized Income tax Actuarial (loss)/income
on available- (losses)/gains related to losses on of associated
Exchange for-sale on cash flow cash flow defined benefit companies and
US$ millions reserve assets hedges hedges pension plans joint ventures Total
At 1 January 2016 (511.7) 52.3 (32.6) 5.0 (17.5) (118.7) (623.2)
Other comprehensive (loss)/income for the year (101.9) (7.2) 41.6 (7.2) – 0.7 (74.0)
Recycled to retained earnings – – – – – (1.3) (1.3)
Acquisition, divestment and dilution
of interests in subsidiary companies 9.9 – – – – (1.6) 8.3
At 31 December 2016 (603.7) 45.1 9.0 (2.2) (17.5) (120.9) (690.2)
At 1 January 2017 (603.7) 45.1 9.0 (2.2) (17.5) (120.9) (690.2)Other comprehensive income/(loss) for the year 15.1 14.8 (5.2) 0.9 (9.8) 9.0 24.8Recycled to retained earnings – – – – – (3.0) (3.0) At 31 December 2017 (588.6) 59.9 3.8 (1.3) (27.3) (114.9) (668.4)
Notes to the Consolidated Statement of Cash Flows(A) Investments in Associated Companies
2017’s cash outflow of US$208.4 million mainly related to MPIC’s acquisition of a 48.3% interest in PT Nusantara
Infrastructure Tbk (US$151.3 million), a publicly listed company in Indonesia with interests in tollroads, port operations,
water, energy and telecommunications and a 50.0% interest in Alsons Thermal Energy Corporation (US$47.7 million) with
interests in the 201-megawatt baseload coal-fired power plant in Maasim, Sarangani Province.
33.
34.
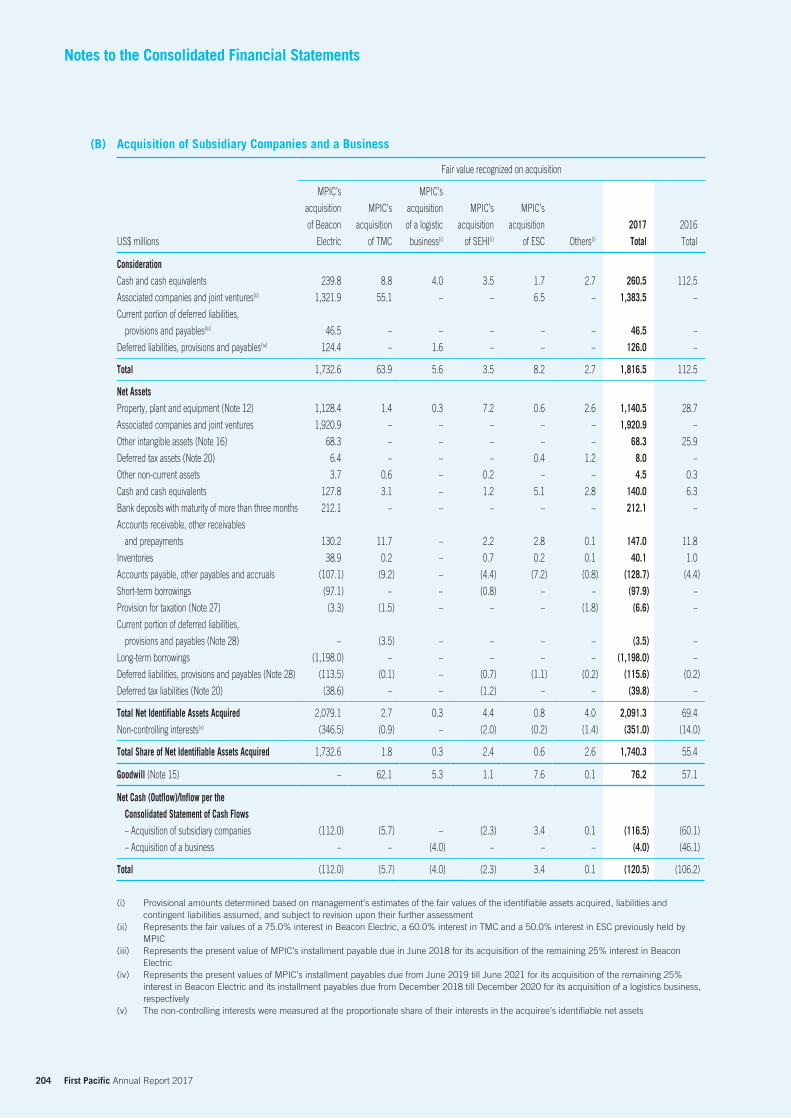
204 First Pacific Annual Report 2017
Notes to the Consolidated Financial Statements
(B) Acquisition of Subsidiary Companies and a Business
Fair value recognized on acquisition
US$ millions
MPIC’s
acquisition
of Beacon
Electric
MPIC’s
acquisition
of TMC
MPIC’s
acquisition
of a logistic
business(i)
MPIC’s
acquisition
of SEHI(i)
MPIC’s
acquisition
of ESC Others(i)
2017 Total
2016
Total
ConsiderationCash and cash equivalents 239.8 8.8 4.0 3.5 1.7 2.7 260.5 112.5
Associated companies and joint ventures(ii) 1,321.9 55.1 – – 6.5 – 1,383.5 –
Current portion of deferred liabilities,
provisions and payables(iii) 46.5 – – – – – 46.5 –
Deferred liabilities, provisions and payables(iv) 124.4 – 1.6 – – – 126.0 –
Total 1,732.6 63.9 5.6 3.5 8.2 2.7 1,816.5 112.5
Net AssetsProperty, plant and equipment (Note 12) 1,128.4 1.4 0.3 7.2 0.6 2.6 1,140.5 28.7
Associated companies and joint ventures 1,920.9 – – – – – 1,920.9 –
Other intangible assets (Note 16) 68.3 – – – – – 68.3 25.9
Deferred tax assets (Note 20) 6.4 – – – 0.4 1.2 8.0 –
Other non-current assets 3.7 0.6 – 0.2 – – 4.5 0.3
Cash and cash equivalents 127.8 3.1 – 1.2 5.1 2.8 140.0 6.3
Bank deposits with maturity of more than three months 212.1 – – – – – 212.1 –
Accounts receivable, other receivables
and prepayments 130.2 11.7 – 2.2 2.8 0.1 147.0 11.8
Inventories 38.9 0.2 – 0.7 0.2 0.1 40.1 1.0
Accounts payable, other payables and accruals (107.1) (9.2) – (4.4) (7.2) (0.8) (128.7) (4.4)
Short-term borrowings (97.1) – – (0.8) – – (97.9) –
Provision for taxation (Note 27) (3.3) (1.5) – – – (1.8) (6.6) –
Current portion of deferred liabilities,
provisions and payables (Note 28) – (3.5) – – – – (3.5) –
Long-term borrowings (1,198.0) – – – – – (1,198.0) –
Deferred liabilities, provisions and payables (Note 28) (113.5) (0.1) – (0.7) (1.1) (0.2) (115.6) (0.2)
Deferred tax liabilities (Note 20) (38.6) – – (1.2) – – (39.8) –
Total Net Identifiable Assets Acquired 2,079.1 2.7 0.3 4.4 0.8 4.0 2,091.3 69.4
Non-controlling interests(v) (346.5) (0.9) – (2.0) (0.2) (1.4) (351.0) (14.0)
Total Share of Net Identifiable Assets Acquired 1,732.6 1.8 0.3 2.4 0.6 2.6 1,740.3 55.4
Goodwill (Note 15) – 62.1 5.3 1.1 7.6 0.1 76.2 57.1
Net Cash (Outflow)/Inflow per the Consolidated Statement of Cash Flows– Acquisition of subsidiary companies (112.0) (5.7) – (2.3) 3.4 0.1 (116.5) (60.1)
– Acquisition of a business – – (4.0) – – – (4.0) (46.1)
Total (112.0) (5.7) (4.0) (2.3) 3.4 0.1 (120.5) (106.2)
(i) Provisional amounts determined based on management’s estimates of the fair values of the identifiable assets acquired, liabilities and contingent liabilities assumed, and subject to revision upon their further assessment
(ii) Represents the fair values of a 75.0% interest in Beacon Electric, a 60.0% interest in TMC and a 50.0% interest in ESC previously held by MPIC
(iii) Represents the present value of MPIC’s installment payable due in June 2018 for its acquisition of the remaining 25% interest in Beacon Electric
(iv) Represents the present values of MPIC’s installment payables due from June 2019 till June 2021 for its acquisition of the remaining 25% interest in Beacon Electric and its installment payables due from December 2018 till December 2020 for its acquisition of a logistics business, respectively
(v) The non-controlling interests were measured at the proportionate share of their interests in the acquiree’s identifiable net assets
205 First Pacific Annual Report 2017
On 4 April 2017, Metro Pacific Tollways Development Corporation (MPTDC), a subsidiary company of MPIC, acquired an
additional 7.0% interest in TMC at a consideration of Pesos 442 million (US$8.8 million). The veto rights of another significant
shareholder of TMC fell away following the completion of this transaction. As a result, TMC became a subsidiary of MPTDC and
MPIC following the increase in MPTDC’s interest in TMC to 67.0% from 60.0% . The fair value and gross amount of TMC’s trade
receivables were US$6.0 million. The transaction costs of US$0.1 million incurred by MPTDC for this business combination have
been recognized as administrative expenses in the consolidated income statement.
On 4 April 2017, PremierLogistics, Inc. (PLI), a subsidiary company of MMI and MPIC, acquired a logistic business and certain
assets at a consideration of Pesos 280 million (US$5.6 million). The transaction costs of US$0.3 million incurred by PLI for this
business combination have been recognized as administrative expenses in the consolidated income statement.
On 27 June 2017, MPIC acquired the remaining 25% interest in Beacon Electric from PCEV at a consideration of Pesos 21.8
billion (US$435.6 million). Following the completion of the acquisition, MPIC’s interest in Beacon Electric increased to 100%
from 75% and Beacon Electric became a subsidiary company of MPIC. Prior to the completion of this transaction, MPIC
accounted for its investment in Beacon Electric as a joint venture. The fair value and gross amount of Beacon Electric’s trade
receivables were US$82.7 million and US$88.6 million, respectively. The transaction costs of US$0.1 million incurred by MPIC
for this business combination have been recognized as administrative expenses in the consolidated income statement.
On 5 October 2017, Metro Pacific Hospital Holdings, Inc. (“MPHHI”), a subsidiary company of MPIC, acquired a 54.0% interest
in St. Elizabeth Hospital, Inc. (“SEHI”) at a consideration of Peso 178 million (US$3.5 million). The fair value and gross amount
of SEHI’s trade receivables were US$2.1 million and US$3.2 million, respectively. The transaction costs of US$0.1 million
incurred by MPHHI for this business combination have been recognized as administrative expenses in the consolidated income
statement.
On 10 October 2017, MPTC, a subsidiary of MPIC, acquired an additional 16% interest in Easytrip Services Corporation
(“ESC”) from Egis Easytrip Services SA for a consideration of Pesos 85 million (US$1.7 million). Following the completion of the
acquisition, MPTC’s interest in ESC increased to 66% from 50% and ESC became a subsidiary of MPIC. Prior to the completion
of this transaction, MPIC accounted for its investment in ESC as a joint venture. The fair value and gross amount of ESC’s trade
receivables were US$2.3 million. The transaction costs of US$0.1 million incurred by MPIC for this business combination have
been recognized as administrative expenses in the consolidated income statement.
The net assets of the logistics business and SEHI recognized in the Group’s 2017 Consolidated Financial Statements were based
on provisional assessments of their fair values while the Group is still evaluating the fair values of their assets acquired and
liabilities and contingent liabilities assumed. The valuation and assessment had not been completed by the date the Group’s
2017 Consolidated Financial Statements were approved for issue by the Board of Directors. If new information obtained within
one year of the acquisition dates about facts and circumstances that existed at the acquisition dates identifies adjustments to the
above provisional amounts, or any provisions that existed at the acquisition dates, then the accounting for the acquisition will be
revised.
The goodwill arising from MPIC’s acquisition of the Beacon Electric, TMC, logistics business, SEHI and ESC pertains to, but is
not limited to, the expected synergies in the Group arising from the acquisition. None of the goodwill recognized is expected to
be deductible for income tax purposes.
Since the dates of acquisition, the above acquired subsidiary companies recorded in aggregate a turnover of US$264.0 million
and profit for the period of US$15.7 million which are included in the consolidated income statement of the Group. If the
acquisitions had taken place on 1 January 2017, the turnover and profit for the year ended 31 December 2017 of the Group
would have been US$7,520.9 million and US$575.2 million, respectively.
2016’s net cash outflow of US$106.2 million mainly related to MPIC’s subsidiary companies, MMI, MPW and MPHHI, acquisition
of a logistics business and certain assets, a 65.0% interest in ESTII and a 93.1% interest in MVMC. ESTII principally engages in
the business of designing, supplying, constructing, installing and operating and maintaining wastewater and sewage treatment
plant facilities in the Philippines. MVMC is a prominent tertiary hospital along Sumulong Highway in Marikina.
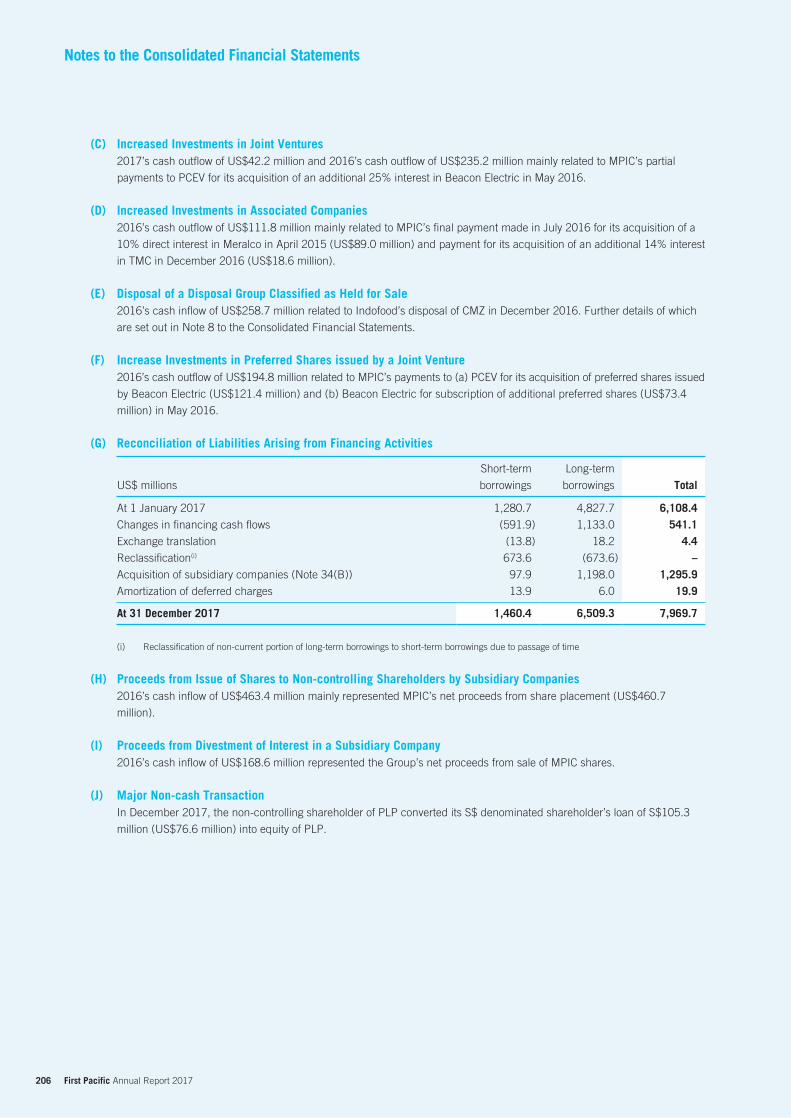
206 First Pacific Annual Report 2017
Notes to the Consolidated Financial Statements
(C) Increased Investments in Joint Ventures2017’s cash outflow of US$42.2 million and 2016’s cash outflow of US$235.2 million mainly related to MPIC’s partial
payments to PCEV for its acquisition of an additional 25% interest in Beacon Electric in May 2016.
(D) Increased Investments in Associated Companies2016’s cash outflow of US$111.8 million mainly related to MPIC’s final payment made in July 2016 for its acquisition of a
10% direct interest in Meralco in April 2015 (US$89.0 million) and payment for its acquisition of an additional 14% interest
in TMC in December 2016 (US$18.6 million).
(E) Disposal of a Disposal Group Classified as Held for Sale2016’s cash inflow of US$258.7 million related to Indofood’s disposal of CMZ in December 2016. Further details of which
are set out in Note 8 to the Consolidated Financial Statements.
(F) Increase Investments in Preferred Shares issued by a Joint Venture2016’s cash outflow of US$194.8 million related to MPIC’s payments to (a) PCEV for its acquisition of preferred shares issued
by Beacon Electric (US$121.4 million) and (b) Beacon Electric for subscription of additional preferred shares (US$73.4
million) in May 2016.
(G) Reconciliation of Liabilities Arising from Financing Activities
US$ millions
Short-term
borrowings
Long-term
borrowings Total
At 1 January 2017 1,280.7 4,827.7 6,108.4Changes in financing cash flows (591.9) 1,133.0 541.1Exchange translation (13.8) 18.2 4.4Reclassification(i) 673.6 (673.6) –Acquisition of subsidiary companies (Note 34(B)) 97.9 1,198.0 1,295.9Amortization of deferred charges 13.9 6.0 19.9 At 31 December 2017 1,460.4 6,509.3 7,969.7
(i) Reclassification of non-current portion of long-term borrowings to short-term borrowings due to passage of time
(H) Proceeds from Issue of Shares to Non-controlling Shareholders by Subsidiary Companies2016’s cash inflow of US$463.4 million mainly represented MPIC’s net proceeds from share placement (US$460.7
million).
(I) Proceeds from Divestment of Interest in a Subsidiary Company2016’s cash inflow of US$168.6 million represented the Group’s net proceeds from sale of MPIC shares.
(J) Major Non-cash TransactionIn December 2017, the non-controlling shareholder of PLP converted its S$ denominated shareholder’s loan of S$105.3
million (US$76.6 million) into equity of PLP.
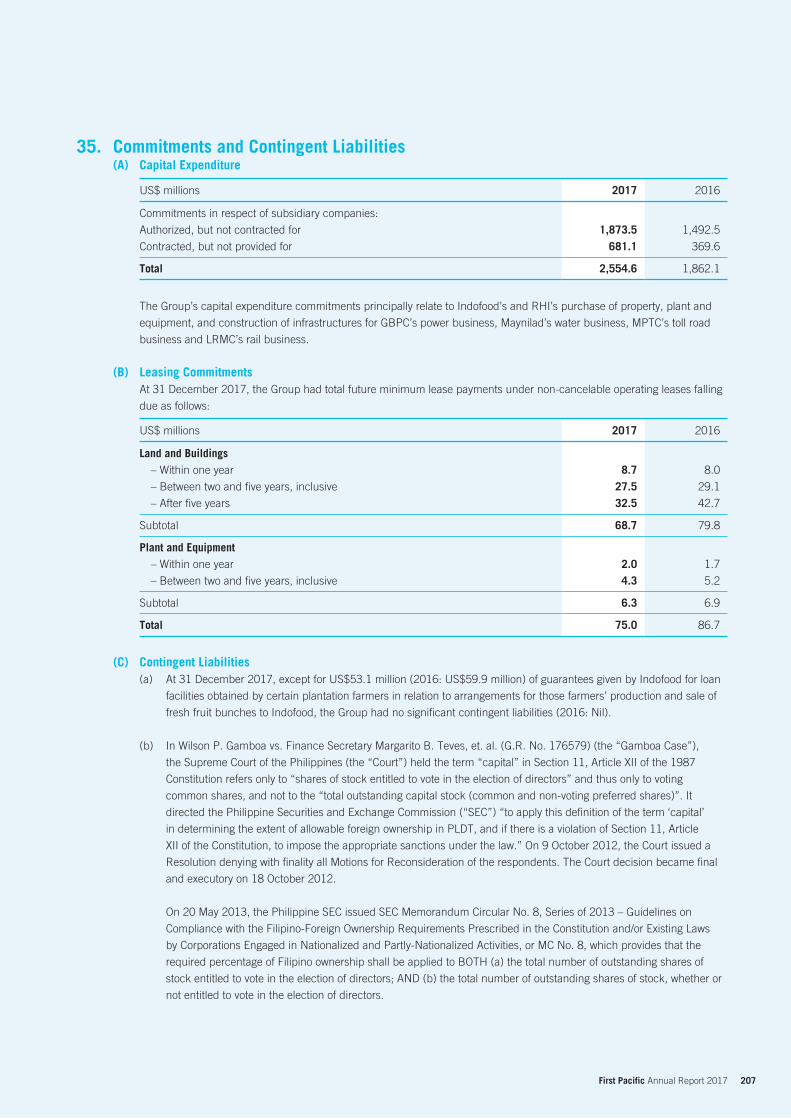
207 First Pacific Annual Report 2017
Commitments and Contingent Liabilities(A) Capital Expenditure
US$ millions 2017 2016
Commitments in respect of subsidiary companies:
Authorized, but not contracted for 1,873.5 1,492.5
Contracted, but not provided for 681.1 369.6
Total 2,554.6 1,862.1
The Group’s capital expenditure commitments principally relate to Indofood’s and RHI’s purchase of property, plant and
equipment, and construction of infrastructures for GBPC’s power business, Maynilad’s water business, MPTC’s toll road
business and LRMC’s rail business.
(B) Leasing CommitmentsAt 31 December 2017, the Group had total future minimum lease payments under non-cancelable operating leases falling
due as follows:
US$ millions 2017 2016
Land and Buildings– Within one year 8.7 8.0
– Between two and five years, inclusive 27.5 29.1
– After five years 32.5 42.7
Subtotal 68.7 79.8
Plant and Equipment – Within one year 2.0 1.7
– Between two and five years, inclusive 4.3 5.2
Subtotal 6.3 6.9
Total 75.0 86.7
(C) Contingent Liabilities(a) At 31 December 2017, except for US$53.1 million (2016: US$59.9 million) of guarantees given by Indofood for loan
facilities obtained by certain plantation farmers in relation to arrangements for those farmers’ production and sale of
fresh fruit bunches to Indofood, the Group had no significant contingent liabilities (2016: Nil).
(b) In Wilson P. Gamboa vs. Finance Secretary Margarito B. Teves, et. al. (G.R. No. 176579) (the “Gamboa Case”),
the Supreme Court of the Philippines (the “Court”) held the term “capital” in Section 11, Article XII of the 1987
Constitution refers only to “shares of stock entitled to vote in the election of directors” and thus only to voting
common shares, and not to the “total outstanding capital stock (common and non-voting preferred shares)”. It
directed the Philippine Securities and Exchange Commission (“SEC”) “to apply this definition of the term ‘capital’
in determining the extent of allowable foreign ownership in PLDT, and if there is a violation of Section 11, Article
XII of the Constitution, to impose the appropriate sanctions under the law.” On 9 October 2012, the Court issued a
Resolution denying with finality all Motions for Reconsideration of the respondents. The Court decision became final
and executory on 18 October 2012.
On 20 May 2013, the Philippine SEC issued SEC Memorandum Circular No. 8, Series of 2013 – Guidelines on
Compliance with the Filipino-Foreign Ownership Requirements Prescribed in the Constitution and/or Existing Laws
by Corporations Engaged in Nationalized and Partly-Nationalized Activities, or MC No. 8, which provides that the
required percentage of Filipino ownership shall be applied to BOTH (a) the total number of outstanding shares of
stock entitled to vote in the election of directors; AND (b) the total number of outstanding shares of stock, whether or
not entitled to vote in the election of directors.
35.
208 First Pacific Annual Report 2017
Notes to the Consolidated Financial Statements
On 10 June, 2013, Jose M. Roy III filed before the Court a Petition for Certiorari against the Philippine SEC, Philippine
SEC Chairman and PLDT, or the Petition, claiming: (1) that MC No. 8 violates the decision of the Court in the Gamboa
Case, which according to the Petitioner required that (a) the 60-40 ownership requirement be imposed on “each
class of shares” and (b) Filipinos must have full beneficial ownership of 60% of the outstanding capital stock of
those corporations subject to that 60-40 Filipino-foreign ownership requirement; and (2) that the PLDT Beneficial
Trust Fund is not a Filipino-owned entity and consequently, the corporations owned by PLDT Beneficial Trust
Fund, including BTF Holdings, Inc. (“BTFHI”), which owns 150 million voting preferred shares in PLDT, cannot be
considered a Filipino-owned corporation. PLDT and Philippine SEC sought the dismissal of the Petition.
In 16 July, 2013, Wilson C. Gamboa, Jr. et. al. filed a Motion for Leave to file a Petition-in-Intervention dated 16 July,
2013, which the Court granted on 6 August, 2013. The Petition-in-Intervention raised identical arguments and issues as
those in the Petition.
The Court, in its 22 November 2016 decision, dismissed the Petition and upheld the validity of SEC Memorandum
Circular No. 8, Series of 2013, dated 20 May 2013, or MC No. 8. In the course of discussing the Petition, the
Court expressly rejected petitioners’ argument that the 60% Filipino ownership requirement for public utilities
must be applied to each class of shares. According to the Court, the position is “simply beyond the literal text and
contemplation of Section 11, Article XII of the 1987 Constitution” and that the petitioners’ suggestion would “effectively
and unwarrantedly amend or change” the Court’s ruling in Gamboa. In categorically rejecting the petitioners’ claim,
the Court declared and stressed that its Gamboa ruling “did NOT make any definitive ruling that the 60% Filipino
ownership requirement was intended to apply to each class of shares.” On the contrary, according to the Court,
“nowhere in the discussion of the term ‘capital’ in Section 11, Article XII of the 1987 Constitution in the Gamboa
Decision did the Court mention the 60% Filipino equity requirement to be applied to each class of shares.”
In respect of ensuring Filipino ownership and control of public utilities, the Court noted that this is already achieved
by the requirements under MC No. 8. According to the Court, “since Filipinos own at least 60% of the outstanding
shares of stock entitled to vote directors, which is what the Constitution precisely requires, then the Filipino
stockholders control the corporation – i.e., they dictate corporate actions and decisions…”
The Court further noted that the application of the Filipino ownership requirement as proposed by petitioners “fails to
understand and appreciate the nature and features of stocks and financial instruments” and would “greatly erode” a
corporation’s “access to capital – which a stock corporation may need for expansion, debt relief/repayment, working
capital requirement and other corporate pursuits.” The Court reaffirmed that “stock corporations are allowed to create
shares of different classes with varying features” and that this “is a flexibility that is granted, among others, for the
corporation to attract and generate capital (funds) from both local and foreign capital markets” and that “this access
to capital – which a stock corporation may need for expansion, debt relief/repayment, working capital requirement
and other corporate pursuits – will be greatly eroded with further unwarranted limitations that are not articulated in
the Constitution.” The Court added that “the intricacies and delicate balance between debt instruments (liabilities)
and equity (capital) that stock corporations need to calibrate to fund their business requirements and achieve their
financial targets are better left to the judgment of their boards and officers, whose bounden duty is to steer their
companies to financial stability and profitability and who are ultimately answerable to their shareholders.”
The Court went on to say that “a too restrictive definition of ‘capital’, one that was never contemplated in the Gamboa
Decision, will surely have a dampening effect on the business milieu by eroding the flexibility inherent in the issuance
of preferred shares with varying terms and conditions. Consequently, the rights and prerogatives of the owners of the
corporation will be unwarrantedly stymied.” Accordingly, the Court said that the petitioners’ “restrictive interpretation
of the term ‘capital’ would have a tremendous adverse impact on the country as a whole – and to all Filipinos.”
Petitioner Jose M. Roy III filed a Motion for Reconsideration of the Court Decision dated 22 November 2016. On 18
April 2017, the Court denied with finality Petitioner’s Motion for Reconsideration.
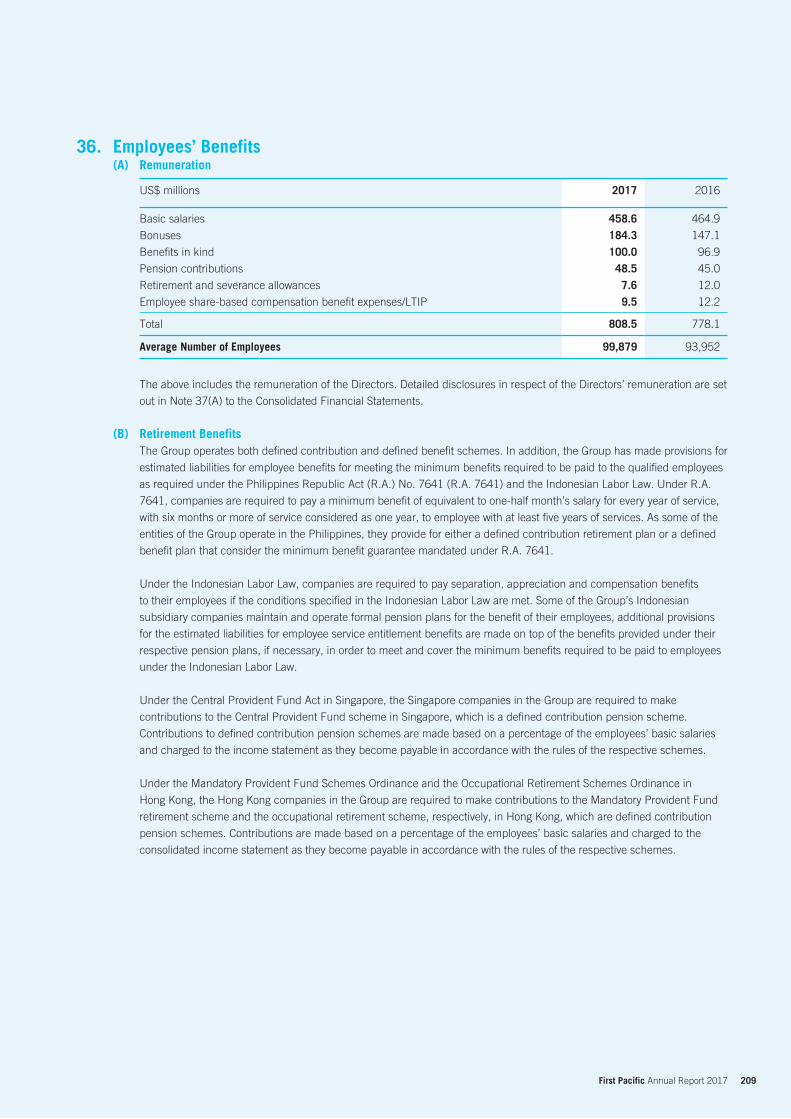
209 First Pacific Annual Report 2017
Employees’ Benefits(A) Remuneration
US$ millions 2017 2016
Basic salaries 458.6 464.9
Bonuses 184.3 147.1
Benefits in kind 100.0 96.9
Pension contributions 48.5 45.0
Retirement and severance allowances 7.6 12.0
Employee share-based compensation benefit expenses/LTIP 9.5 12.2
Total 808.5 778.1
Average Number of Employees 99,879 93,952
The above includes the remuneration of the Directors. Detailed disclosures in respect of the Directors’ remuneration are set
out in Note 37(A) to the Consolidated Financial Statements.
(B) Retirement BenefitsThe Group operates both defined contribution and defined benefit schemes. In addition, the Group has made provisions for
estimated liabilities for employee benefits for meeting the minimum benefits required to be paid to the qualified employees
as required under the Philippines Republic Act (R.A.) No. 7641 (R.A. 7641) and the Indonesian Labor Law. Under R.A.
7641, companies are required to pay a minimum benefit of equivalent to one-half month’s salary for every year of service,
with six months or more of service considered as one year, to employee with at least five years of services. As some of the
entities of the Group operate in the Philippines, they provide for either a defined contribution retirement plan or a defined
benefit plan that consider the minimum benefit guarantee mandated under R.A. 7641.
Under the Indonesian Labor Law, companies are required to pay separation, appreciation and compensation benefits
to their employees if the conditions specified in the Indonesian Labor Law are met. Some of the Group’s Indonesian
subsidiary companies maintain and operate formal pension plans for the benefit of their employees, additional provisions
for the estimated liabilities for employee service entitlement benefits are made on top of the benefits provided under their
respective pension plans, if necessary, in order to meet and cover the minimum benefits required to be paid to employees
under the Indonesian Labor Law.
Under the Central Provident Fund Act in Singapore, the Singapore companies in the Group are required to make
contributions to the Central Provident Fund scheme in Singapore, which is a defined contribution pension scheme.
Contributions to defined contribution pension schemes are made based on a percentage of the employees’ basic salaries
and charged to the income statement as they become payable in accordance with the rules of the respective schemes.
Under the Mandatory Provident Fund Schemes Ordinance and the Occupational Retirement Schemes Ordinance in
Hong Kong, the Hong Kong companies in the Group are required to make contributions to the Mandatory Provident Fund
retirement scheme and the occupational retirement scheme, respectively, in Hong Kong, which are defined contribution
pension schemes. Contributions are made based on a percentage of the employees’ basic salaries and charged to the
consolidated income statement as they become payable in accordance with the rules of the respective schemes.
36.
210 First Pacific Annual Report 2017
Notes to the Consolidated Financial Statements
(a) Defined contribution schemesThe Group operates nine (2016: seven) defined contribution schemes covering approximately 15,536 (2016: 17,028)
employees. The assets of these schemes are held separately from the Group and are administered by independent
trustees. Contributions to the schemes, either by the Group or by the employees, are determined by reference to the
employees’ salaries and length of service and range from 0% to 40% (2016: 0% to 20%). Under the terms of the
schemes, the Group cannot be requested to make additional payments over and above these levels of contributions.
In five (2016: three) of the schemes, forfeited contributions may be used to reduce the existing levels of employer
contributions and, in 2017, no amount (2016: Nil) was used for this purpose. At 31 December 2017, the forfeited
contributions had been fully utilized.
The Group’s Indonesian and Singapore subsidiary companies have defined contribution retirement plans covering
substantially all of their qualified permanent employees. The related liability arising from the difference between
the cumulative funding since the establishment of the program and the cumulative pension costs charged to
the consolidated income statement during the same period is recognized as employee benefit liabilities in the
consolidated statement of financial position.
Although the Group’s Philippine operating companies operate defined contribution schemes, they are covered under
R.A. 7641 which provides for its qualified employees under a defined benefit minimum guarantee. The defined
minimum guarantee is equivalent to a certain percentage of the monthly salary payment to an employee at the normal
retirement age with the required credited years of service based on the provisions of R.A. 7641. The Philippine
operating companies account for the retirement obligation under the higher of defined benefit obligation relating to
the minimum guarantee and the obligation arising from the defined contribution plan.
(b) Defined benefit schemes and estimated liabilities for employee benefitsThe Group operates 27 (2016: 22) defined benefit schemes covering approximately 13,676 (2016: 8,957)
employees. 11 (2016: Six) of the plans are unfunded where the Group meets the benefit payment obligations as
they fall due while 16 (2016: 16) of defined benefit payments are from trustee-administered funds. For unfunded
schemes, the Group engages the services of actuaries to conduct valuation studies to determine the retirement
obligations to ensure that these maturing obligations and expected benefit payments are covered and budgeted
for. For the funded schemes, the assets are held separately from the Group and are administered by independent
trustees. Benefits are determined by reference to employees’ final salaries and length of service, and the schemes
have undergone independent valuations on an annual basis. These actuarial valuations, performed by the actuaries
of PT Kappa Konsultan Utama (a member of the Actuarial Consultant Association of Indonesia), Actuarial Advisers,
Inc., Institutional Synergy, Inc., ActuarialExponents, Inc. and E.M. Zalamea Actuarial Services, Inc. (members of the
Actuary Society of the Philippines), were based on the projected unit credit method. The plan assets do not include
any financial instruments of the Group or property occupied by, or other assets used by, the Group. At 31 December
2017, the Group’s level of funding in respect of its defined benefit schemes was 65.3% (2016: 69.5%).
The Group’s plan assets mainly comprise equities, debt securities, properties, receivables, cash in banks, time
deposits and unit trust funds. Thus, the cash flow from the assets alters in accordance with the change of equity
prices and interest rates, and the assets are subject to various risks including credit, investment and liquidity risks.
While the Group does not perform any asset-liability matching study, the risks arising from the nature of the assets
comprising the fund, are mitigated by limiting the investments in financial assets only to the good quality instruments
as recommended by the trust managers, investing in reputable equity shares with good fair values and contributing
to the respective fund from time to time, based on the recommendations of their actuaries with the objective of
maintaining their respective funds in a sound condition.
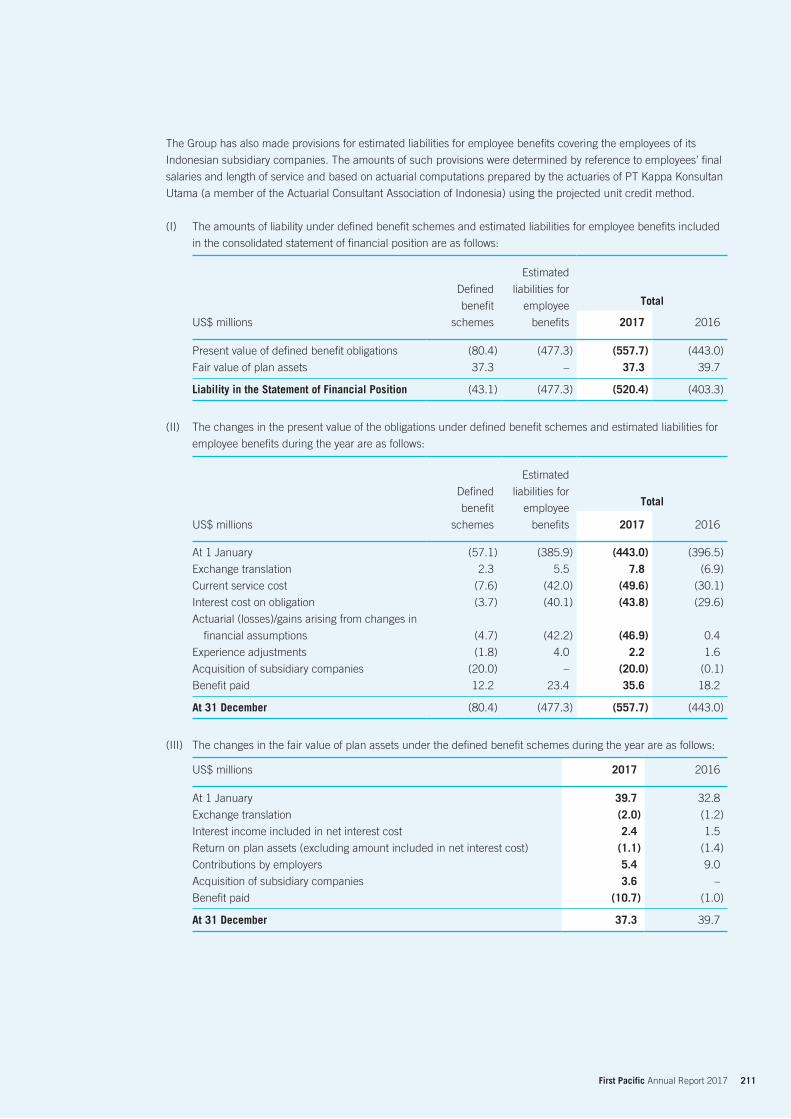
211 First Pacific Annual Report 2017
The Group has also made provisions for estimated liabilities for employee benefits covering the employees of its
Indonesian subsidiary companies. The amounts of such provisions were determined by reference to employees’ final
salaries and length of service and based on actuarial computations prepared by the actuaries of PT Kappa Konsultan
Utama (a member of the Actuarial Consultant Association of Indonesia) using the projected unit credit method.
(I) The amounts of liability under defined benefit schemes and estimated liabilities for employee benefits included
in the consolidated statement of financial position are as follows:
US$ millions
Defined
benefit
schemes
Estimated
liabilities for
employee
benefits
Total
2017 2016
Present value of defined benefit obligations (80.4) (477.3) (557.7) (443.0)
Fair value of plan assets 37.3 – 37.3 39.7
Liability in the Statement of Financial Position (43.1) (477.3) (520.4) (403.3)
(II) The changes in the present value of the obligations under defined benefit schemes and estimated liabilities for
employee benefits during the year are as follows:
US$ millions
Defined
benefit
schemes
Estimated
liabilities for
employee
benefits
Total
2017 2016
At 1 January (57.1) (385.9) (443.0) (396.5)
Exchange translation 2.3 5.5 7.8 (6.9)
Current service cost (7.6) (42.0) (49.6) (30.1)
Interest cost on obligation (3.7) (40.1) (43.8) (29.6)
Actuarial (losses)/gains arising from changes in
financial assumptions (4.7) (42.2) (46.9) 0.4
Experience adjustments (1.8) 4.0 2.2 1.6
Acquisition of subsidiary companies (20.0) – (20.0) (0.1)
Benefit paid 12.2 23.4 35.6 18.2
At 31 December (80.4) (477.3) (557.7) (443.0)
(III) The changes in the fair value of plan assets under the defined benefit schemes during the year are as follows:
US$ millions 2017 2016
At 1 January 39.7 32.8
Exchange translation (2.0) (1.2)
Interest income included in net interest cost 2.4 1.5
Return on plan assets (excluding amount included in net interest cost) (1.1) (1.4)
Contributions by employers 5.4 9.0
Acquisition of subsidiary companies 3.6 –
Benefit paid (10.7) (1.0)
At 31 December 37.3 39.7
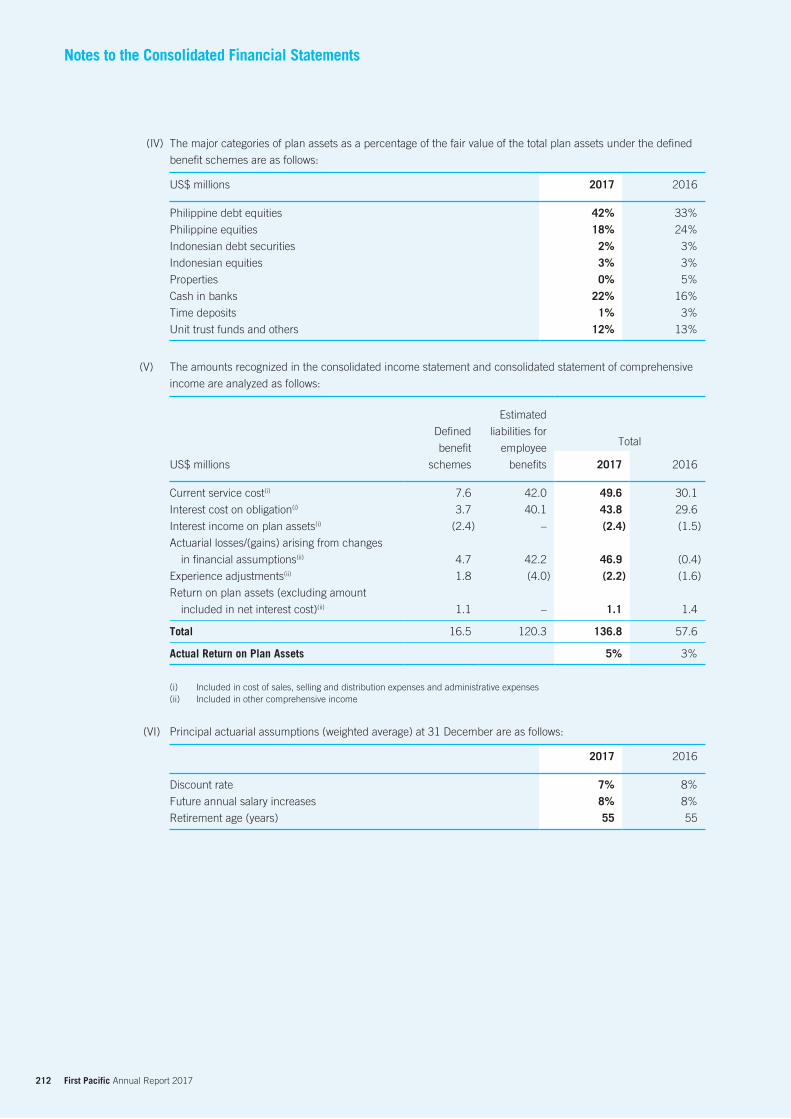
212 First Pacific Annual Report 2017
Notes to the Consolidated Financial Statements
(IV) The major categories of plan assets as a percentage of the fair value of the total plan assets under the defined
benefit schemes are as follows:
US$ millions 2017 2016
Philippine debt equities 42% 33%
Philippine equities 18% 24%
Indonesian debt securities 2% 3%
Indonesian equities 3% 3%
Properties 0% 5%
Cash in banks 22% 16%
Time deposits 1% 3%
Unit trust funds and others 12% 13%
(V) The amounts recognized in the consolidated income statement and consolidated statement of comprehensive
income are analyzed as follows:
US$ millions
Defined
benefit
schemes
Estimated
liabilities for
employee
benefits
Total
2017 2016
Current service cost(i) 7.6 42.0 49.6 30.1
Interest cost on obligation(i) 3.7 40.1 43.8 29.6
Interest income on plan assets(i) (2.4) – (2.4) (1.5)
Actuarial losses/(gains) arising from changes
in financial assumptions(ii) 4.7 42.2 46.9 (0.4)
Experience adjustments(ii) 1.8 (4.0) (2.2) (1.6)
Return on plan assets (excluding amount
included in net interest cost)(ii) 1.1 – 1.1 1.4
Total 16.5 120.3 136.8 57.6
Actual Return on Plan Assets 5% 3%
(i) Included in cost of sales, selling and distribution expenses and administrative expenses(ii) Included in other comprehensive income
(VI) Principal actuarial assumptions (weighted average) at 31 December are as follows:
2017 2016
Discount rate 7% 8%
Future annual salary increases 8% 8%
Retirement age (years) 55 55
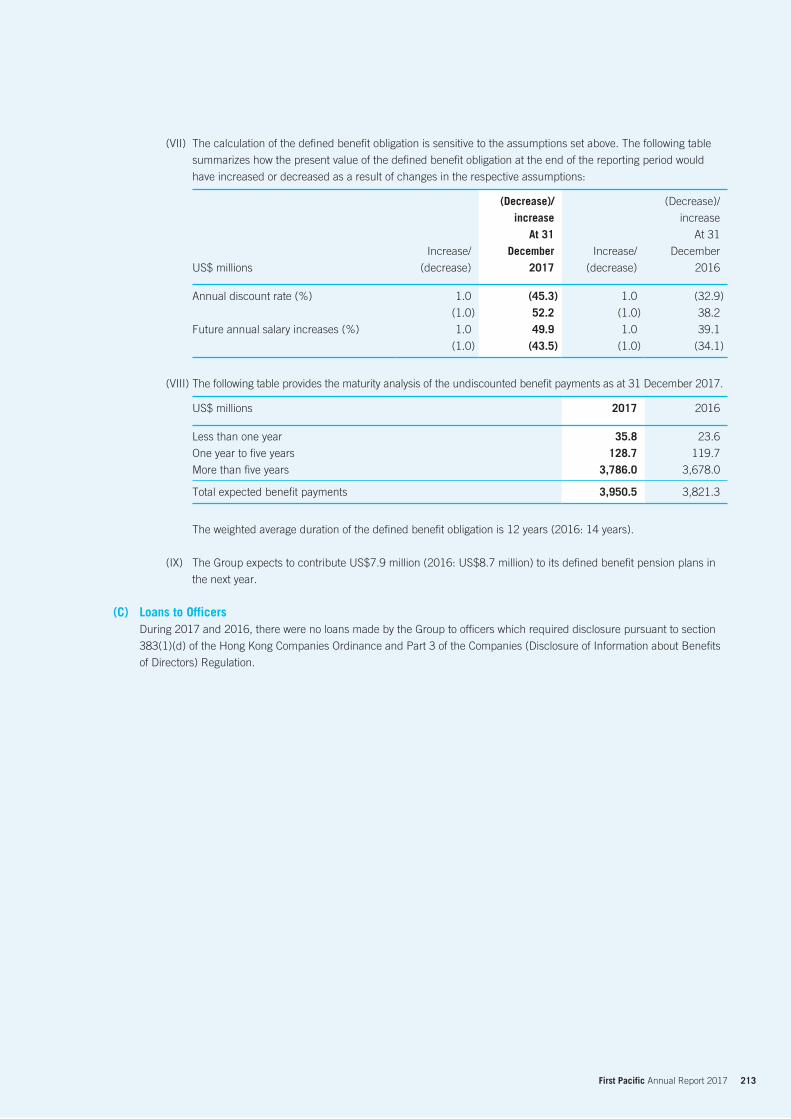
213 First Pacific Annual Report 2017
(VII) The calculation of the defined benefit obligation is sensitive to the assumptions set above. The following table
summarizes how the present value of the defined benefit obligation at the end of the reporting period would
have increased or decreased as a result of changes in the respective assumptions:
US$ millions
Increase/
(decrease)
(Decrease)/ increase
At 31 December
2017Increase/
(decrease)
(Decrease)/
increase
At 31
December
2016
Annual discount rate (%) 1.0 (45.3) 1.0 (32.9)
(1.0) 52.2 (1.0) 38.2
Future annual salary increases (%) 1.0 49.9 1.0 39.1
(1.0) (43.5) (1.0) (34.1)
(VIII) The following table provides the maturity analysis of the undiscounted benefit payments as at 31 December 2017.
US$ millions 2017 2016
Less than one year 35.8 23.6
One year to five years 128.7 119.7
More than five years 3,786.0 3,678.0
Total expected benefit payments 3,950.5 3,821.3
The weighted average duration of the defined benefit obligation is 12 years (2016: 14 years).
(IX) The Group expects to contribute US$7.9 million (2016: US$8.7 million) to its defined benefit pension plans in
the next year.
(C) Loans to OfficersDuring 2017 and 2016, there were no loans made by the Group to officers which required disclosure pursuant to section
383(1)(d) of the Hong Kong Companies Ordinance and Part 3 of the Companies (Disclosure of Information about Benefits
of Directors) Regulation.
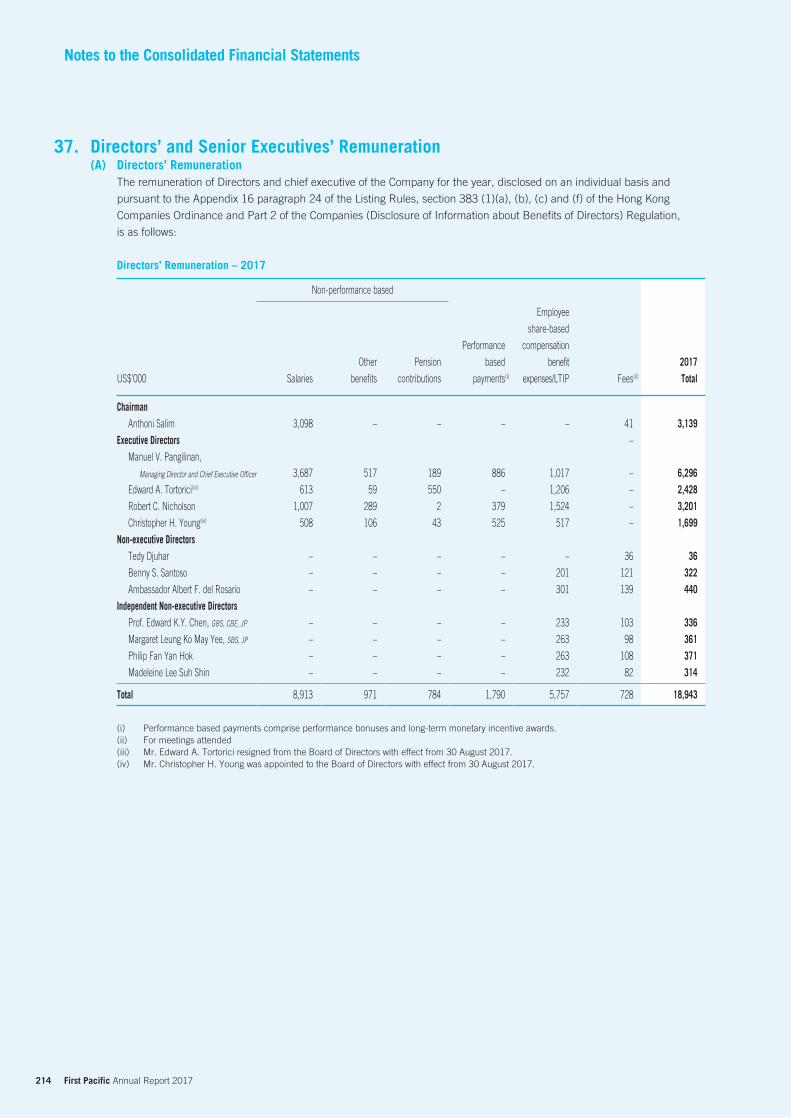
214 First Pacific Annual Report 2017
Notes to the Consolidated Financial Statements
Directors’ and Senior Executives’ Remuneration(A) Directors’ Remuneration
The remuneration of Directors and chief executive of the Company for the year, disclosed on an individual basis and
pursuant to the Appendix 16 paragraph 24 of the Listing Rules, section 383 (1)(a), (b), (c) and (f) of the Hong Kong
Companies Ordinance and Part 2 of the Companies (Disclosure of Information about Benefits of Directors) Regulation,
is as follows:
Directors’ Remuneration – 2017
Non-performance based
US$’000 Salaries
Other
benefits
Pension
contributions
Performance
based
payments(i)
Employee
share-based
compensation
benefit
expenses/LTIP Fees(ii)
2017 Total
ChairmanAnthoni Salim 3,098 – – – – 41 3,139
Executive Directors –
Manuel V. Pangilinan,
Managing Director and Chief Executive Officer 3,687 517 189 886 1,017 – 6,296Edward A. Tortorici(iii) 613 59 550 – 1,206 – 2,428Robert C. Nicholson 1,007 289 2 379 1,524 – 3,201Christopher H. Young(iv) 508 106 43 525 517 – 1,699
Non-executive DirectorsTedy Djuhar – – – – – 36 36Benny S. Santoso – – – – 201 121 322Ambassador Albert F. del Rosario – – – – 301 139 440
Independent Non-executive DirectorsProf. Edward K.Y. Chen, GBS, CBE, JP – – – – 233 103 336Margaret Leung Ko May Yee, SBS, JP – – – – 263 98 361Philip Fan Yan Hok – – – – 263 108 371Madeleine Lee Suh Shin – – – – 232 82 314
Total 8,913 971 784 1,790 5,757 728 18,943
(i) Performance based payments comprise performance bonuses and long-term monetary incentive awards.(ii) For meetings attended(iii) Mr. Edward A. Tortorici resigned from the Board of Directors with effect from 30 August 2017.(iv) Mr. Christopher H. Young was appointed to the Board of Directors with effect from 30 August 2017.
37.
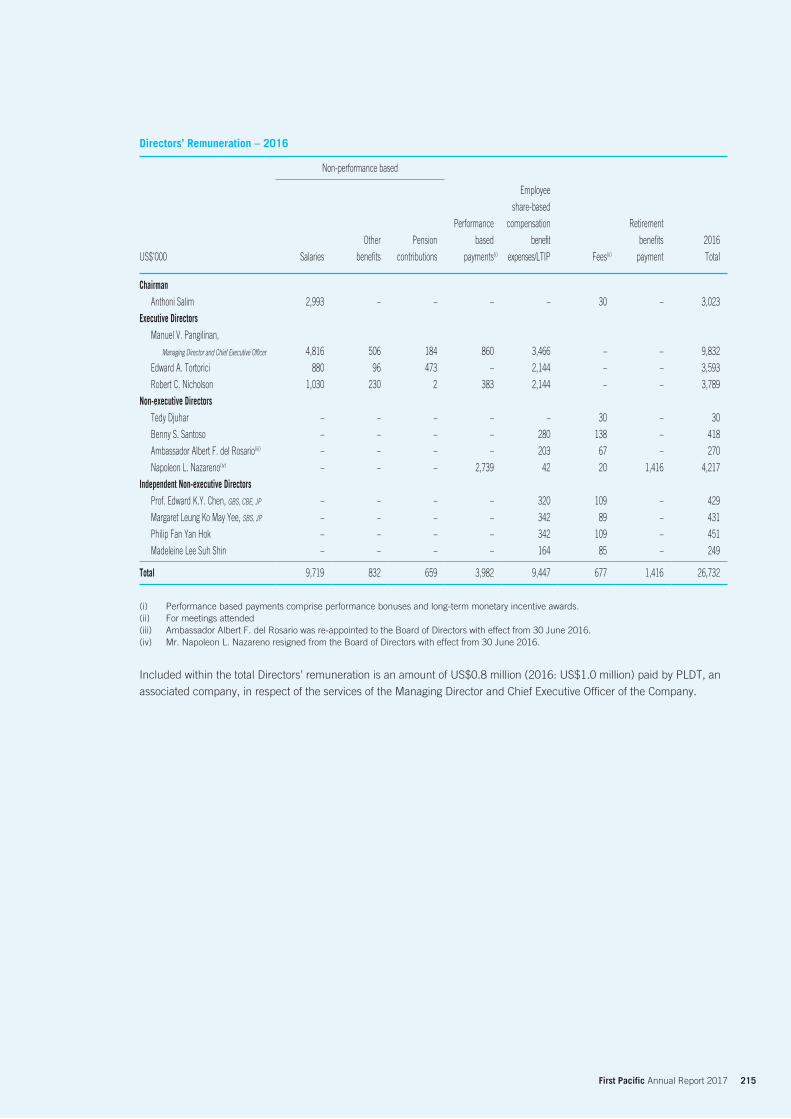
215 First Pacific Annual Report 2017
Directors’ Remuneration – 2016
Non-performance based
US$’000 Salaries
Other
benefits
Pension
contributions
Performance
based
payments(i)
Employee
share-based
compensation
benefit
expenses/LTIP Fees(ii)
Retirement
benefits
payment
2016
Total
ChairmanAnthoni Salim 2,993 – – – – 30 – 3,023
Executive DirectorsManuel V. Pangilinan,
Managing Director and Chief Executive Officer 4,816 506 184 860 3,466 – – 9,832
Edward A. Tortorici 880 96 473 – 2,144 – – 3,593
Robert C. Nicholson 1,030 230 2 383 2,144 – – 3,789
Non-executive DirectorsTedy Djuhar – – – – – 30 – 30
Benny S. Santoso – – – – 280 138 – 418
Ambassador Albert F. del Rosario(iii) – – – – 203 67 – 270
Napoleon L. Nazareno(iv) – – – 2,739 42 20 1,416 4,217
Independent Non-executive DirectorsProf. Edward K.Y. Chen, GBS, CBE, JP – – – – 320 109 – 429
Margaret Leung Ko May Yee, SBS, JP – – – – 342 89 – 431
Philip Fan Yan Hok – – – – 342 109 – 451
Madeleine Lee Suh Shin – – – – 164 85 – 249
Total 9,719 832 659 3,982 9,447 677 1,416 26,732
(i) Performance based payments comprise performance bonuses and long-term monetary incentive awards.(ii) For meetings attended(iii) Ambassador Albert F. del Rosario was re-appointed to the Board of Directors with effect from 30 June 2016.(iv) Mr. Napoleon L. Nazareno resigned from the Board of Directors with effect from 30 June 2016.
Included within the total Directors’ remuneration is an amount of US$0.8 million (2016: US$1.0 million) paid by PLDT, an
associated company, in respect of the services of the Managing Director and Chief Executive Officer of the Company.
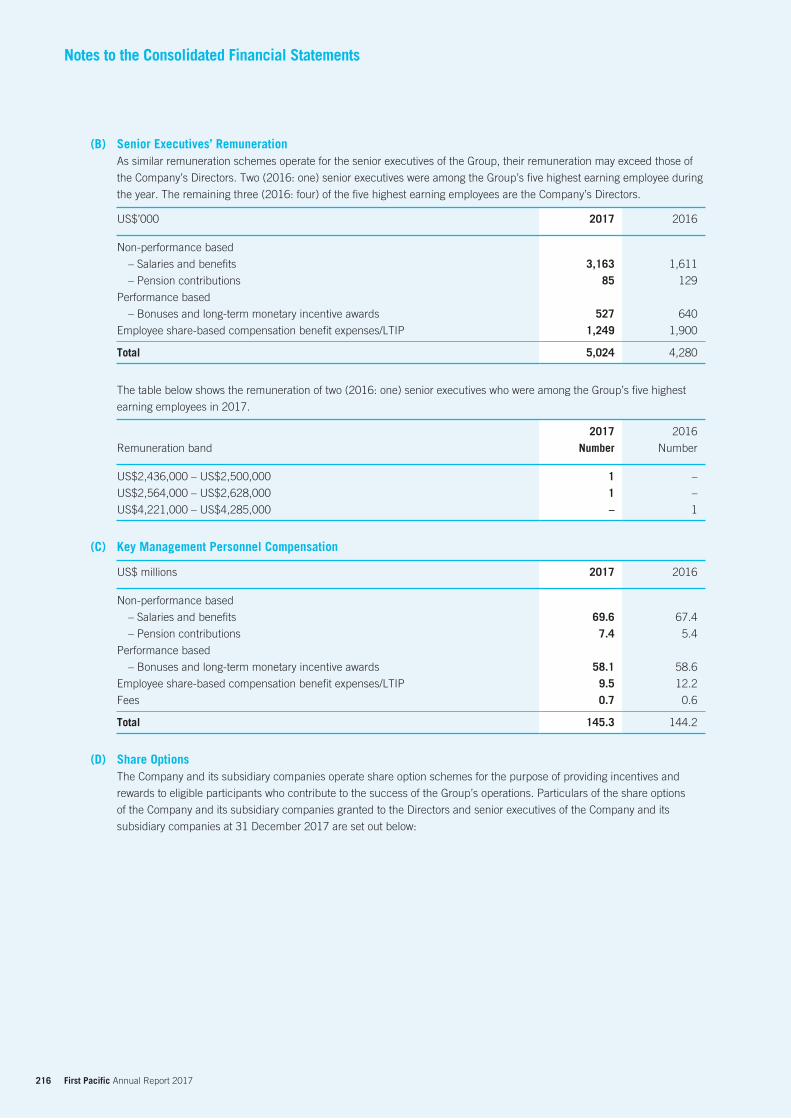
216 First Pacific Annual Report 2017
Notes to the Consolidated Financial Statements
(B) Senior Executives’ RemunerationAs similar remuneration schemes operate for the senior executives of the Group, their remuneration may exceed those of
the Company’s Directors. Two (2016: one) senior executives were among the Group’s five highest earning employee during
the year. The remaining three (2016: four) of the five highest earning employees are the Company’s Directors.
US$’000 2017 2016
Non-performance based
– Salaries and benefits 3,163 1,611
– Pension contributions 85 129
Performance based
– Bonuses and long-term monetary incentive awards 527 640
Employee share-based compensation benefit expenses/LTIP 1,249 1,900
Total 5,024 4,280
The table below shows the remuneration of two (2016: one) senior executives who were among the Group’s five highest
earning employees in 2017.
Remuneration band
2017 Number
2016
Number
US$2,436,000 – US$2,500,000 1 –
US$2,564,000 – US$2,628,000 1 –
US$4,221,000 – US$4,285,000 – 1
(C) Key Management Personnel Compensation
US$ millions 2017 2016
Non-performance based
– Salaries and benefits 69.6 67.4
– Pension contributions 7.4 5.4
Performance based
– Bonuses and long-term monetary incentive awards 58.1 58.6
Employee share-based compensation benefit expenses/LTIP 9.5 12.2
Fees 0.7 0.6
Total 145.3 144.2
(D) Share OptionsThe Company and its subsidiary companies operate share option schemes for the purpose of providing incentives and
rewards to eligible participants who contribute to the success of the Group’s operations. Particulars of the share options
of the Company and its subsidiary companies granted to the Directors and senior executives of the Company and its
subsidiary companies at 31 December 2017 are set out below:
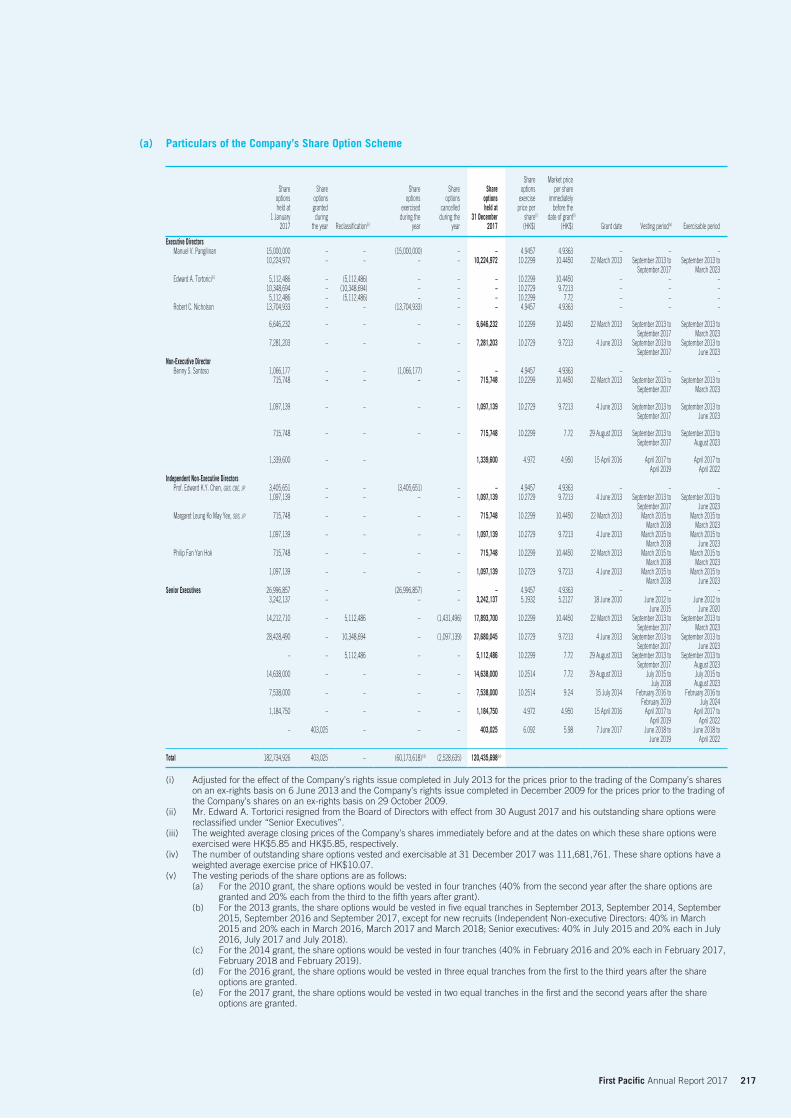
217 First Pacific Annual Report 2017
(a) Particulars of the Company’s Share Option Scheme
Share options held at
1 January 2017
Share options granted during
the year Reclassification(ii)
Share options
exercised during the
year
Share options
cancelled during the
year
Share options held at
31 December 2017
Share options
exercise price per
share(i)
(HK$)
Market price per share
immediately before the
date of grant(i)
(HK$) Grant date Vesting period(v) Exercisable period
Executive DirectorsManuel V. Pangilinan 15,000,000 – – (15,000,000) – – 4.9457 4.9363 – – –
10,224,972 – – – – 10,224,972 10.2299 10.4450 22 March 2013 September 2013 to September 2017
September 2013 to March 2023
Edward A. Tortorici(ii) 5,112,486 – (5,112,486) – – – 10.2299 10.4450 – – –10,348,694 – (10,348,694) – – – 10.2729 9.7213 – – –5,112,486 – (5,112,486) – – – 10.2299 7.72 – – –
Robert C. Nicholson 13,704,933 – – (13,704,933) – – 4.9457 4.9363 – – –
6,646,232 – – – – 6,646,232 10.2299 10.4450 22 March 2013 September 2013 to September 2017
September 2013 to March 2023
7,281,203 – – – – 7,281,203 10.2729 9.7213 4 June 2013 September 2013 to September 2017
September 2013 to June 2023
Non-Executive DirectorBenny S. Santoso 1,066,177 – – (1,066,177) – – 4.9457 4.9363 – – –
715,748 – – – – 715,748 10.2299 10.4450 22 March 2013 September 2013 to September 2017
September 2013 to March 2023
1,097,139 – – – – 1,097,139 10.2729 9.7213 4 June 2013 September 2013 to September 2017
September 2013 to June 2023
715,748 – – – – 715,748 10.2299 7.72 29 August 2013 September 2013 to September 2017
September 2013 to August 2023
1,339,600 – – 1,339,600 4.972 4.950 15 April 2016 April 2017 to April 2019
April 2017 to April 2022
Independent Non-Executive DirectorsProf. Edward K.Y. Chen, GBS, CBE, JP 3,405,651 – – (3,405,651) – – 4.9457 4.9363 – – –
1,097,139 – – – – 1,097,139 10.2729 9.7213 4 June 2013 September 2013 to September 2017
September 2013 to June 2023
Margaret Leung Ko May Yee, SBS, JP 715,748 – – – – 715,748 10.2299 10.4450 22 March 2013 March 2015 to March 2018
March 2015 to March 2023
1,097,139 – – – – 1,097,139 10.2729 9.7213 4 June 2013 March 2015 to March 2018
March 2015 to June 2023
Philip Fan Yan Hok 715,748 – – – – 715,748 10.2299 10.4450 22 March 2013 March 2015 to March 2015 toMarch 2018 March 2023
1,097,139 – – – – 1,097,139 10.2729 9.7213 4 June 2013 March 2015 to March 2018
March 2015 to June 2023
Senior Executives 26,996,857 – (26,996,857) – – 4.9457 4.9363 – – –3,242,137 – – – 3,242,137 5.1932 5.2127 18 June 2010 June 2012 to
June 2015June 2012 to
June 202014,212,710 – 5,112,486 – (1,431,496) 17,893,700 10.2299 10.4450 22 March 2013 September 2013 to
September 2017September 2013 to
March 202328,428,490 – 10,348,694 – (1,097,139) 37,680,045 10.2729 9.7213 4 June 2013 September 2013 to
September 2017September 2013 to
June 2023– – 5,112,486 – – 5,112,486 10.2299 7.72 29 August 2013 September 2013 to
September 2017September 2013 to
August 202314,638,000 – – – – 14,638,000 10.2514 7.72 29 August 2013 July 2015 to
July 2018July 2015 to August 2023
7,538,000 – – – – 7,538,000 10.2514 9.24 15 July 2014 February 2016 to February 2019
February 2016 to July 2024
1,184,750 – – – – 1,184,750 4.972 4.950 15 April 2016 April 2017 to April 2019
April 2017 to April 2022
– 403,025 – – – 403,025 6.092 5.98 7 June 2017 June 2018 to June 2019
June 2018 to April 2022
Total 182,734,926 403,025 – (60,173,618)(iii) (2,528,635) 120,435,698(iv)
(i) Adjusted for the effect of the Company’s rights issue completed in July 2013 for the prices prior to the trading of the Company’s shares on an ex-rights basis on 6 June 2013 and the Company’s rights issue completed in December 2009 for the prices prior to the trading of the Company’s shares on an ex-rights basis on 29 October 2009.
(ii) Mr. Edward A. Tortorici resigned from the Board of Directors with effect from 30 August 2017 and his outstanding share options were reclassified under “Senior Executives”.
(iii) The weighted average closing prices of the Company’s shares immediately before and at the dates on which these share options were exercised were HK$5.85 and HK$5.85, respectively.
(iv) The number of outstanding share options vested and exercisable at 31 December 2017 was 111,681,761. These share options have a weighted average exercise price of HK$10.07.
(v) The vesting periods of the share options are as follows:(a) For the 2010 grant, the share options would be vested in four tranches (40% from the second year after the share options are
granted and 20% each from the third to the fifth years after grant).(b) For the 2013 grants, the share options would be vested in five equal tranches in September 2013, September 2014, September
2015, September 2016 and September 2017, except for new recruits (Independent Non-executive Directors: 40% in March 2015 and 20% each in March 2016, March 2017 and March 2018; Senior executives: 40% in July 2015 and 20% each in July 2016, July 2017 and July 2018).
(c) For the 2014 grant, the share options would be vested in four tranches (40% in February 2016 and 20% each in February 2017, February 2018 and February 2019).
(d) For the 2016 grant, the share options would be vested in three equal tranches from the first to the third years after the share options are granted.
(e) For the 2017 grant, the share options would be vested in two equal tranches in the first and the second years after the share options are granted.
September 2017 March 2023
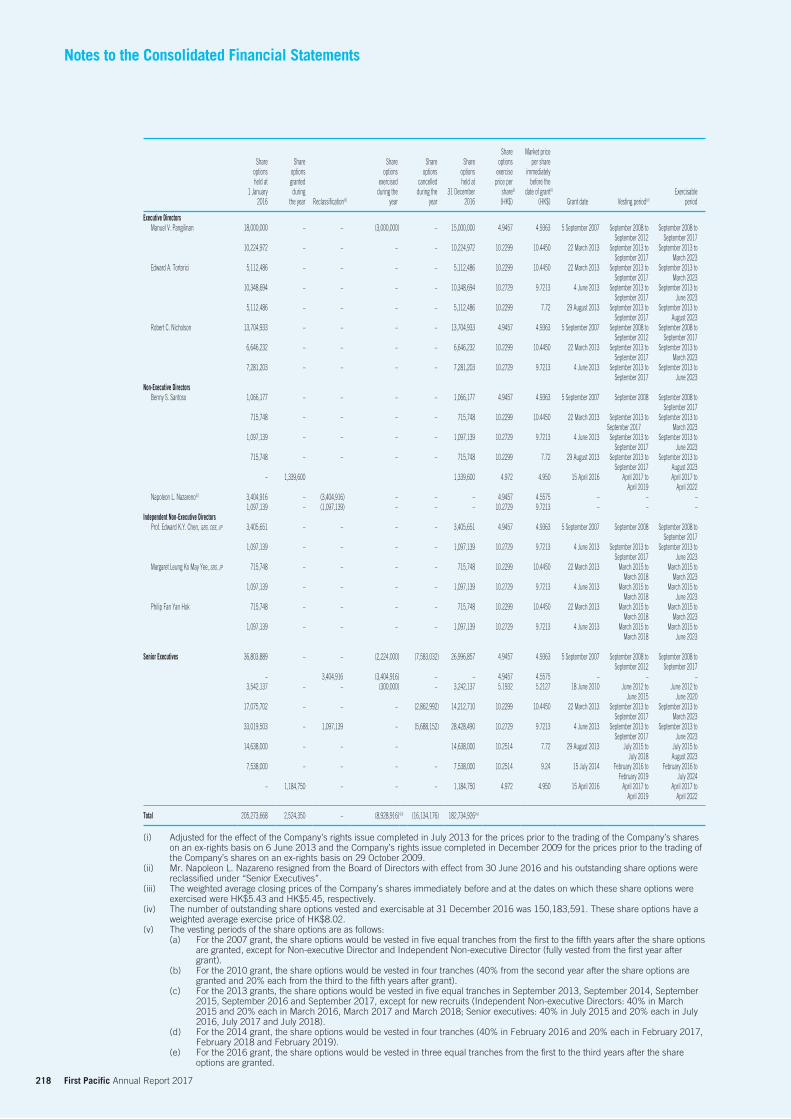
218 First Pacific Annual Report 2017
Notes to the Consolidated Financial Statements
Share options held at
1 January 2016
Share options granted during
the year Reclassification(ii)
Share options
exercised during the
year
Share options
cancelled during the
year
Share options held at
31 December 2016
Share options
exercise price per
share(i)
(HK$)
Market price per share
immediately before the
date of grant(i)
(HK$) Grant date Vesting period(v)Exercisable
period
Executive DirectorsManuel V. Pangilinan 18,000,000 – – (3,000,000) – 15,000,000 4.9457 4.9363 5 September 2007 September 2008 to
September 2012September 2008 to
September 201710,224,972 – – – – 10,224,972 10.2299 10.4450 22 March 2013 September 2013 to
September 2017September 2013 to
March 2023Edward A. Tortorici 5,112,486 – – – – 5,112,486 10.2299 10.4450 22 March 2013 September 2013 to
September 2017September 2013 to
March 202310,348,694 – – – – 10,348,694 10.2729 9.7213 4 June 2013 September 2013 to
September 2017September 2013 to
June 20235,112,486 – – – – 5,112,486 10.2299 7.72 29 August 2013 September 2013 to
September 2017September 2013 to
August 2023Robert C. Nicholson 13,704,933 – – – – 13,704,933 4.9457 4.9363 5 September 2007 September 2008 to
September 2012September 2008 to
September 20176,646,232 – – – – 6,646,232 10.2299 10.4450 22 March 2013 September 2013 to
September 2017September 2013 to
March 20237,281,203 – – – – 7,281,203 10.2729 9.7213 4 June 2013 September 2013 to
September 2017September 2013 to
June 2023Non-Executive Directors
Benny S. Santoso 1,066,177 – – – – 1,066,177 4.9457 4.9363 5 September 2007 September 2008 September 2008 to September 2017
715,748 – – – – 715,748 10.2299 10.4450 22 March 2013 September 2013 to September 2017
September 2013 to March 2023
1,097,139 – – – – 1,097,139 10.2729 9.7213 4 June 2013 September 2013 to September 2017
September 2013 to June 2023
715,748 – – – – 715,748 10.2299 7.72 29 August 2013 September 2013 to September 2017
September 2013 to August 2023
– 1,339,600 1,339,600 4.972 4.950 15 April 2016 April 2017 to April 2019
April 2017 to April 2022
Napoleon L. Nazareno(ii) 3,404,916 – (3,404,916) – – – 4.9457 4.5575 – – –1,097,139 – (1,097,139) – – – 10.2729 9.7213 – – –
Independent Non-Executive DirectorsProf. Edward K.Y. Chen, GBS, CBE, JP 3,405,651 – – – – 3,405,651 4.9457 4.9363 5 September 2007 September 2008 September 2008 to
September 20171,097,139 – – – – 1,097,139 10.2729 9.7213 4 June 2013 September 2013 to
September 2017 September 2013 to
June 2023Margaret Leung Ko May Yee, SBS, JP 715,748 – – – – 715,748 10.2299 10.4450 22 March 2013 March 2015 to
March 2018March 2015 to
March 20231,097,139 – – – – 1,097,139 10.2729 9.7213 4 June 2013 March 2015 to
March 2018March 2015 to
June 2023Philip Fan Yan Hok 715,748 – – – – 715,748 10.2299 10.4450 22 March 2013 March 2015 to
March 2018March 2015 to
March 20231,097,139 – – – – 1,097,139 10.2729 9.7213 4 June 2013 March 2015 to
March 2018March 2015 to
June 2023
Senior Executives 36,803,889 – – (2,224,000) (7,583,032) 26,996,857 4.9457 4.9363 5 September 2007 September 2008 to September 2012
September 2008 to September 2017
– 3,404,916 (3,404,916) – – 4.9457 4.5575 – – –3,542,137 – – (300,000) – 3,242,137 5.1932 5.2127 18 June 2010 June 2012 to
June 2015June 2012 to
June 202017,075,702 – – – (2,862,992) 14,212,710 10.2299 10.4450 22 March 2013 September 2013 to
September 2017September 2013 to
March 202333,019,503 – 1,097,139 – (5,688,152) 28,428,490 10.2729 9.7213 4 June 2013 September 2013 to
September 2017September 2013 to
June 202314,638,000 – – – 14,638,000 10.2514 7.72 29 August 2013 July 2015 to
July 2018July 2015 to August 2023
7,538,000 – – – – 7,538,000 10.2514 9.24 15 July 2014 February 2016 to February 2019
February 2016 to July 2024
– 1,184,750 – – – 1,184,750 4.972 4.950 15 April 2016 April 2017 to April 2019
April 2017 to April 2022
Total 205,273,668 2,524,350 – (8,928,916)(iii) (16,134,176) 182,734,926(iv)
(i) Adjusted for the effect of the Company’s rights issue completed in July 2013 for the prices prior to the trading of the Company’s shares on an ex-rights basis on 6 June 2013 and the Company’s rights issue completed in December 2009 for the prices prior to the trading of the Company’s shares on an ex-rights basis on 29 October 2009.
(ii) Mr. Napoleon L. Nazareno resigned from the Board of Directors with effect from 30 June 2016 and his outstanding share options were reclassified under “Senior Executives”.
(iii) The weighted average closing prices of the Company’s shares immediately before and at the dates on which these share options were exercised were HK$5.43 and HK$5.45, respectively.
(iv) The number of outstanding share options vested and exercisable at 31 December 2016 was 150,183,591. These share options have a weighted average exercise price of HK$8.02.
(v) The vesting periods of the share options are as follows:(a) For the 2007 grant, the share options would be vested in five equal tranches from the first to the fifth years after the share options
are granted, except for Non-executive Director and Independent Non-executive Director (fully vested from the first year after grant).
(b) For the 2010 grant, the share options would be vested in four tranches (40% from the second year after the share options are granted and 20% each from the third to the fifth years after grant).
(c) For the 2013 grants, the share options would be vested in five equal tranches in September 2013, September 2014, September 2015, September 2016 and September 2017, except for new recruits (Independent Non-executive Directors: 40% in March 2015 and 20% each in March 2016, March 2017 and March 2018; Senior executives: 40% in July 2015 and 20% each in July 2016, July 2017 and July 2018).
(d) For the 2014 grant, the share options would be vested in four tranches (40% in February 2016 and 20% each in February 2017, February 2018 and February 2019).
(e) For the 2016 grant, the share options would be vested in three equal tranches from the first to the third years after the share options are granted.
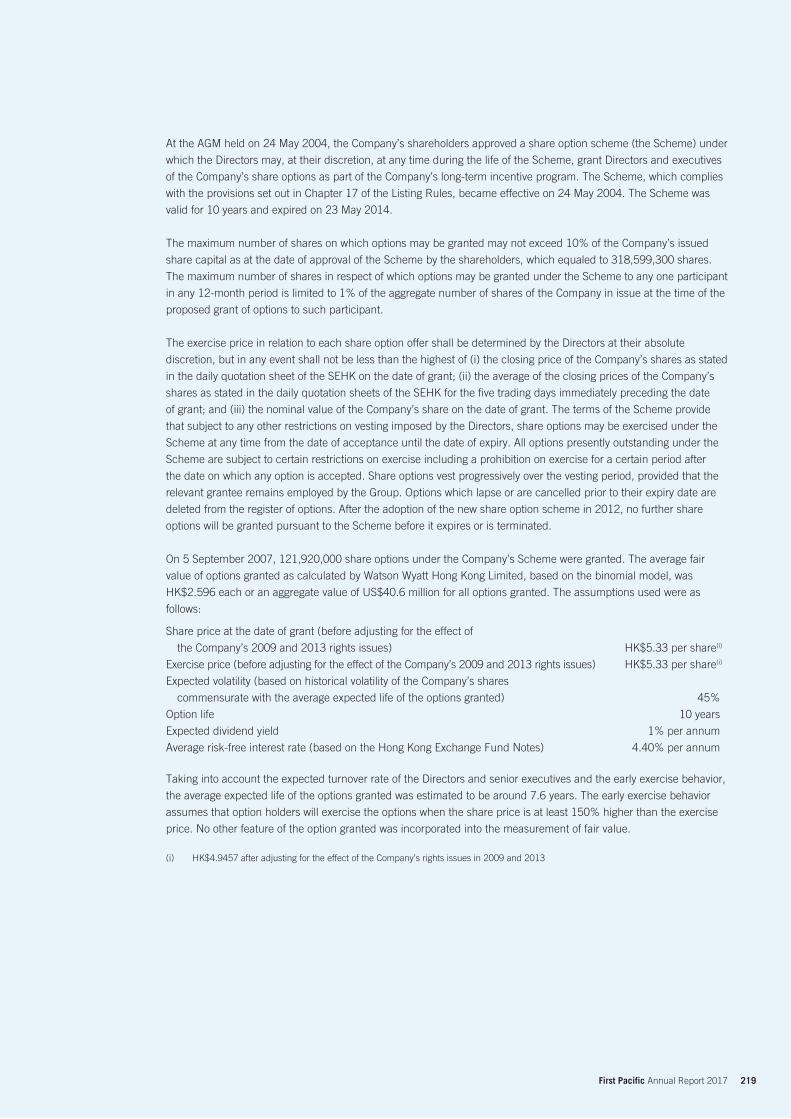
219 First Pacific Annual Report 2017
At the AGM held on 24 May 2004, the Company’s shareholders approved a share option scheme (the Scheme) under
which the Directors may, at their discretion, at any time during the life of the Scheme, grant Directors and executives
of the Company’s share options as part of the Company’s long-term incentive program. The Scheme, which complies
with the provisions set out in Chapter 17 of the Listing Rules, became effective on 24 May 2004. The Scheme was
valid for 10 years and expired on 23 May 2014.
The maximum number of shares on which options may be granted may not exceed 10% of the Company’s issued
share capital as at the date of approval of the Scheme by the shareholders, which equaled to 318,599,300 shares.
The maximum number of shares in respect of which options may be granted under the Scheme to any one participant
in any 12-month period is limited to 1% of the aggregate number of shares of the Company in issue at the time of the
proposed grant of options to such participant.
The exercise price in relation to each share option offer shall be determined by the Directors at their absolute
discretion, but in any event shall not be less than the highest of (i) the closing price of the Company’s shares as stated
in the daily quotation sheet of the SEHK on the date of grant; (ii) the average of the closing prices of the Company’s
shares as stated in the daily quotation sheets of the SEHK for the five trading days immediately preceding the date
of grant; and (iii) the nominal value of the Company’s share on the date of grant. The terms of the Scheme provide
that subject to any other restrictions on vesting imposed by the Directors, share options may be exercised under the
Scheme at any time from the date of acceptance until the date of expiry. All options presently outstanding under the
Scheme are subject to certain restrictions on exercise including a prohibition on exercise for a certain period after
the date on which any option is accepted. Share options vest progressively over the vesting period, provided that the
relevant grantee remains employed by the Group. Options which lapse or are cancelled prior to their expiry date are
deleted from the register of options. After the adoption of the new share option scheme in 2012, no further share
options will be granted pursuant to the Scheme before it expires or is terminated.
On 5 September 2007, 121,920,000 share options under the Company’s Scheme were granted. The average fair
value of options granted as calculated by Watson Wyatt Hong Kong Limited, based on the binomial model, was
HK$2.596 each or an aggregate value of US$40.6 million for all options granted. The assumptions used were as
follows:
Share price at the date of grant (before adjusting for the effect of
the Company’s 2009 and 2013 rights issues) HK$5.33 per share(i)
Exercise price (before adjusting for the effect of the Company’s 2009 and 2013 rights issues) HK$5.33 per share(i)
Expected volatility (based on historical volatility of the Company’s shares
commensurate with the average expected life of the options granted) 45%
Option life 10 years
Expected dividend yield 1% per annum
Average risk-free interest rate (based on the Hong Kong Exchange Fund Notes) 4.40% per annum
Taking into account the expected turnover rate of the Directors and senior executives and the early exercise behavior,
the average expected life of the options granted was estimated to be around 7.6 years. The early exercise behavior
assumes that option holders will exercise the options when the share price is at least 150% higher than the exercise
price. No other feature of the option granted was incorporated into the measurement of fair value.
(i) HK$4.9457 after adjusting for the effect of the Company’s rights issues in 2009 and 2013
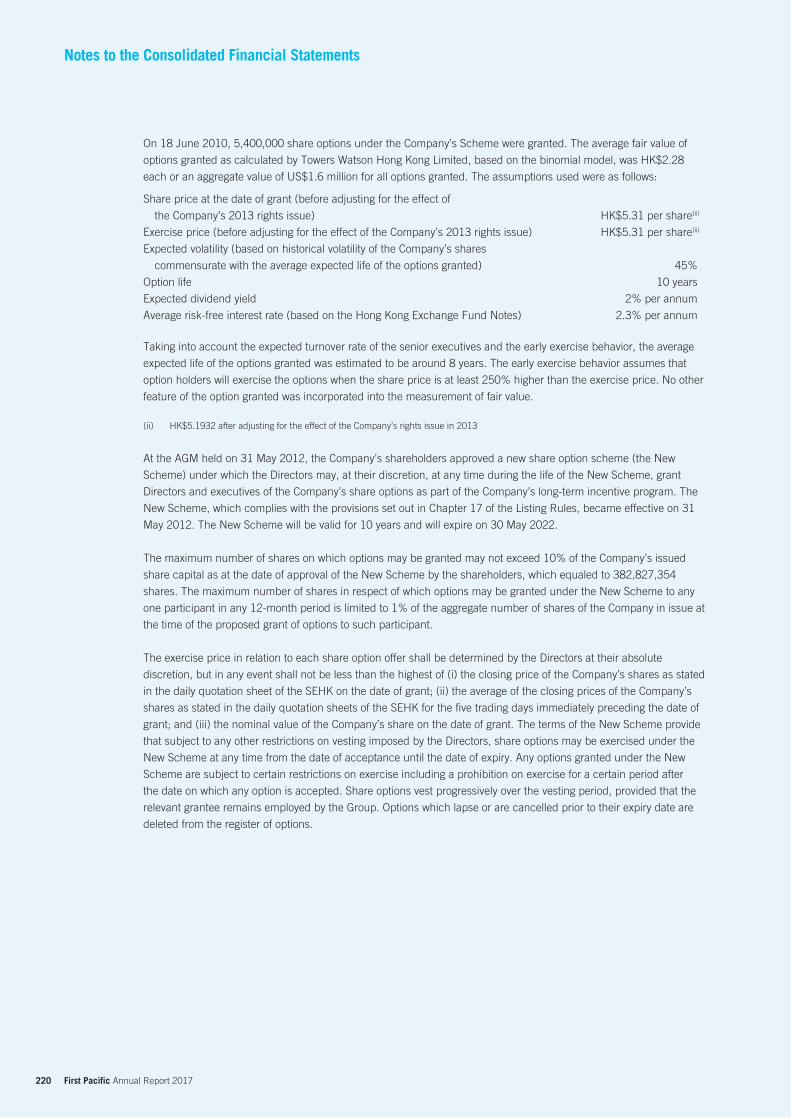
220 First Pacific Annual Report 2017
Notes to the Consolidated Financial Statements
On 18 June 2010, 5,400,000 share options under the Company’s Scheme were granted. The average fair value of
options granted as calculated by Towers Watson Hong Kong Limited, based on the binomial model, was HK$2.28
each or an aggregate value of US$1.6 million for all options granted. The assumptions used were as follows:
Share price at the date of grant (before adjusting for the effect of
the Company’s 2013 rights issue) HK$5.31 per share(ii)
Exercise price (before adjusting for the effect of the Company’s 2013 rights issue) HK$5.31 per share(ii)
Expected volatility (based on historical volatility of the Company’s shares
commensurate with the average expected life of the options granted) 45%
Option life 10 years
Expected dividend yield 2% per annum
Average risk-free interest rate (based on the Hong Kong Exchange Fund Notes) 2.3% per annum
Taking into account the expected turnover rate of the senior executives and the early exercise behavior, the average
expected life of the options granted was estimated to be around 8 years. The early exercise behavior assumes that
option holders will exercise the options when the share price is at least 250% higher than the exercise price. No other
feature of the option granted was incorporated into the measurement of fair value.
(ii) HK$5.1932 after adjusting for the effect of the Company’s rights issue in 2013
At the AGM held on 31 May 2012, the Company’s shareholders approved a new share option scheme (the New
Scheme) under which the Directors may, at their discretion, at any time during the life of the New Scheme, grant
Directors and executives of the Company’s share options as part of the Company’s long-term incentive program. The
New Scheme, which complies with the provisions set out in Chapter 17 of the Listing Rules, became effective on 31
May 2012. The New Scheme will be valid for 10 years and will expire on 30 May 2022.
The maximum number of shares on which options may be granted may not exceed 10% of the Company’s issued
share capital as at the date of approval of the New Scheme by the shareholders, which equaled to 382,827,354
shares. The maximum number of shares in respect of which options may be granted under the New Scheme to any
one participant in any 12-month period is limited to 1% of the aggregate number of shares of the Company in issue at
the time of the proposed grant of options to such participant.
The exercise price in relation to each share option offer shall be determined by the Directors at their absolute
discretion, but in any event shall not be less than the highest of (i) the closing price of the Company’s shares as stated
in the daily quotation sheet of the SEHK on the date of grant; (ii) the average of the closing prices of the Company’s
shares as stated in the daily quotation sheets of the SEHK for the five trading days immediately preceding the date of
grant; and (iii) the nominal value of the Company’s share on the date of grant. The terms of the New Scheme provide
that subject to any other restrictions on vesting imposed by the Directors, share options may be exercised under the
New Scheme at any time from the date of acceptance until the date of expiry. Any options granted under the New
Scheme are subject to certain restrictions on exercise including a prohibition on exercise for a certain period after
the date on which any option is accepted. Share options vest progressively over the vesting period, provided that the
relevant grantee remains employed by the Group. Options which lapse or are cancelled prior to their expiry date are
deleted from the register of options.
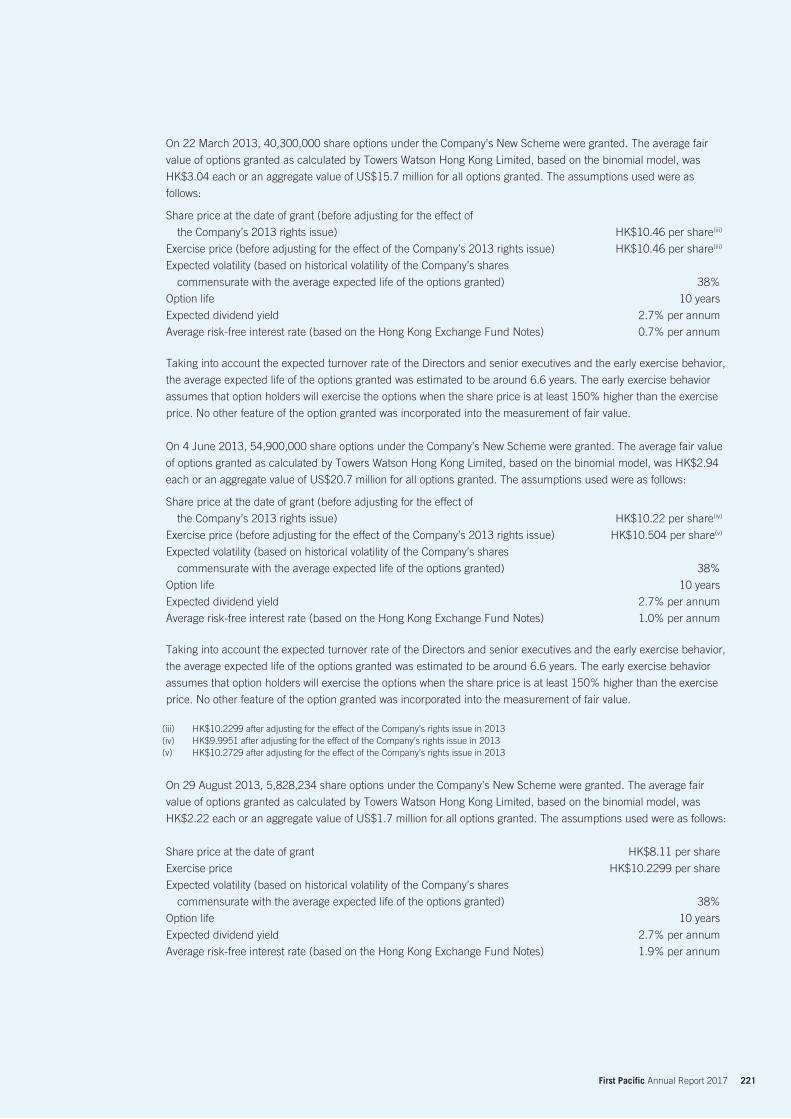
221 First Pacific Annual Report 2017
On 22 March 2013, 40,300,000 share options under the Company’s New Scheme were granted. The average fair
value of options granted as calculated by Towers Watson Hong Kong Limited, based on the binomial model, was
HK$3.04 each or an aggregate value of US$15.7 million for all options granted. The assumptions used were as
follows:
Share price at the date of grant (before adjusting for the effect of
the Company’s 2013 rights issue) HK$10.46 per share(iii)
Exercise price (before adjusting for the effect of the Company’s 2013 rights issue) HK$10.46 per share(iii)
Expected volatility (based on historical volatility of the Company’s shares
commensurate with the average expected life of the options granted) 38%
Option life 10 years
Expected dividend yield 2.7% per annum
Average risk-free interest rate (based on the Hong Kong Exchange Fund Notes) 0.7% per annum
Taking into account the expected turnover rate of the Directors and senior executives and the early exercise behavior,
the average expected life of the options granted was estimated to be around 6.6 years. The early exercise behavior
assumes that option holders will exercise the options when the share price is at least 150% higher than the exercise
price. No other feature of the option granted was incorporated into the measurement of fair value.
On 4 June 2013, 54,900,000 share options under the Company’s New Scheme were granted. The average fair value
of options granted as calculated by Towers Watson Hong Kong Limited, based on the binomial model, was HK$2.94
each or an aggregate value of US$20.7 million for all options granted. The assumptions used were as follows:
Share price at the date of grant (before adjusting for the effect of
the Company’s 2013 rights issue) HK$10.22 per share(iv)
Exercise price (before adjusting for the effect of the Company’s 2013 rights issue) HK$10.504 per share(v)
Expected volatility (based on historical volatility of the Company’s shares
commensurate with the average expected life of the options granted) 38%
Option life 10 years
Expected dividend yield 2.7% per annum
Average risk-free interest rate (based on the Hong Kong Exchange Fund Notes) 1.0% per annum
Taking into account the expected turnover rate of the Directors and senior executives and the early exercise behavior,
the average expected life of the options granted was estimated to be around 6.6 years. The early exercise behavior
assumes that option holders will exercise the options when the share price is at least 150% higher than the exercise
price. No other feature of the option granted was incorporated into the measurement of fair value.
(iii) HK$10.2299 after adjusting for the effect of the Company’s rights issue in 2013(iv) HK$9.9951 after adjusting for the effect of the Company’s rights issue in 2013(v) HK$10.2729 after adjusting for the effect of the Company’s rights issue in 2013
On 29 August 2013, 5,828,234 share options under the Company’s New Scheme were granted. The average fair
value of options granted as calculated by Towers Watson Hong Kong Limited, based on the binomial model, was
HK$2.22 each or an aggregate value of US$1.7 million for all options granted. The assumptions used were as follows:
Share price at the date of grant HK$8.11 per share
Exercise price HK$10.2299 per share
Expected volatility (based on historical volatility of the Company’s shares
commensurate with the average expected life of the options granted) 38%
Option life 10 years
Expected dividend yield 2.7% per annum
Average risk-free interest rate (based on the Hong Kong Exchange Fund Notes) 1.9% per annum
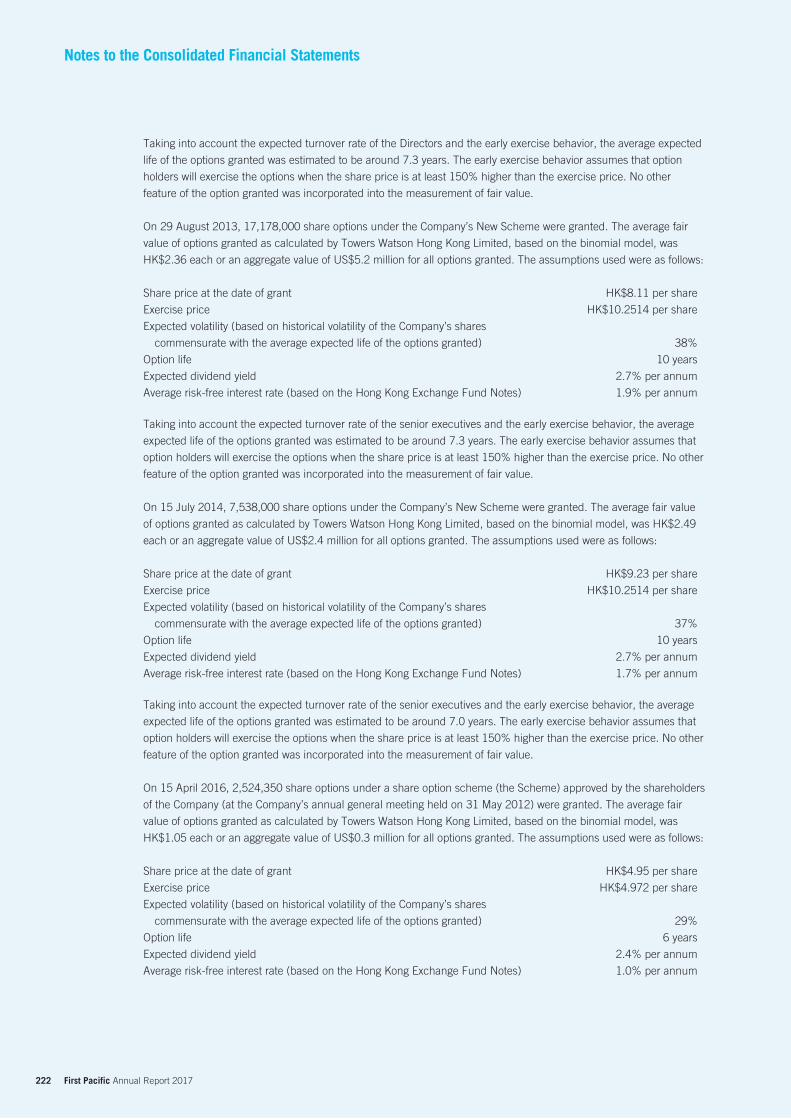
222 First Pacific Annual Report 2017
Notes to the Consolidated Financial Statements
Taking into account the expected turnover rate of the Directors and the early exercise behavior, the average expected
life of the options granted was estimated to be around 7.3 years. The early exercise behavior assumes that option
holders will exercise the options when the share price is at least 150% higher than the exercise price. No other
feature of the option granted was incorporated into the measurement of fair value.
On 29 August 2013, 17,178,000 share options under the Company’s New Scheme were granted. The average fair
value of options granted as calculated by Towers Watson Hong Kong Limited, based on the binomial model, was
HK$2.36 each or an aggregate value of US$5.2 million for all options granted. The assumptions used were as follows:
Share price at the date of grant HK$8.11 per share
Exercise price HK$10.2514 per share
Expected volatility (based on historical volatility of the Company’s shares
commensurate with the average expected life of the options granted) 38%
Option life 10 years
Expected dividend yield 2.7% per annum
Average risk-free interest rate (based on the Hong Kong Exchange Fund Notes) 1.9% per annum
Taking into account the expected turnover rate of the senior executives and the early exercise behavior, the average
expected life of the options granted was estimated to be around 7.3 years. The early exercise behavior assumes that
option holders will exercise the options when the share price is at least 150% higher than the exercise price. No other
feature of the option granted was incorporated into the measurement of fair value.
On 15 July 2014, 7,538,000 share options under the Company’s New Scheme were granted. The average fair value
of options granted as calculated by Towers Watson Hong Kong Limited, based on the binomial model, was HK$2.49
each or an aggregate value of US$2.4 million for all options granted. The assumptions used were as follows:
Share price at the date of grant HK$9.23 per share
Exercise price HK$10.2514 per share
Expected volatility (based on historical volatility of the Company’s shares
commensurate with the average expected life of the options granted) 37%
Option life 10 years
Expected dividend yield 2.7% per annum
Average risk-free interest rate (based on the Hong Kong Exchange Fund Notes) 1.7% per annum
Taking into account the expected turnover rate of the senior executives and the early exercise behavior, the average
expected life of the options granted was estimated to be around 7.0 years. The early exercise behavior assumes that
option holders will exercise the options when the share price is at least 150% higher than the exercise price. No other
feature of the option granted was incorporated into the measurement of fair value.
On 15 April 2016, 2,524,350 share options under a share option scheme (the Scheme) approved by the shareholders
of the Company (at the Company’s annual general meeting held on 31 May 2012) were granted. The average fair
value of options granted as calculated by Towers Watson Hong Kong Limited, based on the binomial model, was
HK$1.05 each or an aggregate value of US$0.3 million for all options granted. The assumptions used were as follows:
Share price at the date of grant HK$4.95 per share
Exercise price HK$4.972 per share
Expected volatility (based on historical volatility of the Company’s shares
commensurate with the average expected life of the options granted) 29%
Option life 6 years
Expected dividend yield 2.4% per annum
Average risk-free interest rate (based on the Hong Kong Exchange Fund Notes) 1.0% per annum
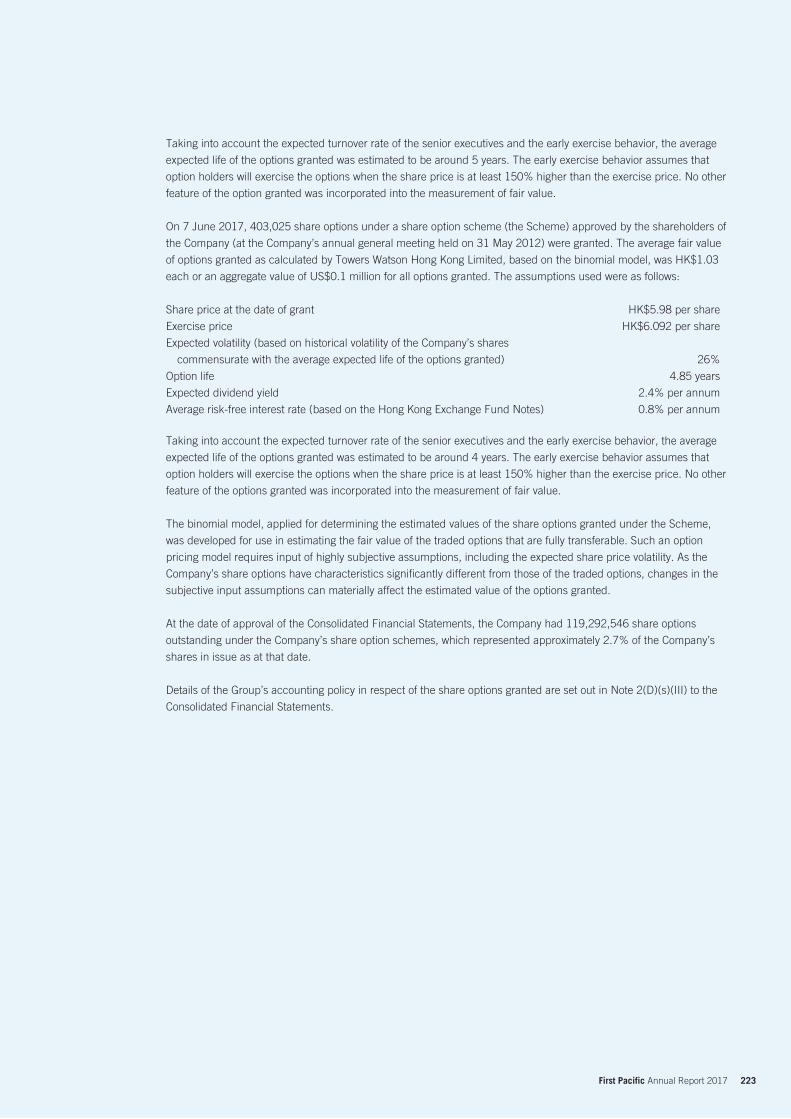
223 First Pacific Annual Report 2017
Taking into account the expected turnover rate of the senior executives and the early exercise behavior, the average
expected life of the options granted was estimated to be around 5 years. The early exercise behavior assumes that
option holders will exercise the options when the share price is at least 150% higher than the exercise price. No other
feature of the option granted was incorporated into the measurement of fair value.
On 7 June 2017, 403,025 share options under a share option scheme (the Scheme) approved by the shareholders of
the Company (at the Company’s annual general meeting held on 31 May 2012) were granted. The average fair value
of options granted as calculated by Towers Watson Hong Kong Limited, based on the binomial model, was HK$1.03
each or an aggregate value of US$0.1 million for all options granted. The assumptions used were as follows:
Share price at the date of grant HK$5.98 per share
Exercise price HK$6.092 per share
Expected volatility (based on historical volatility of the Company’s shares
commensurate with the average expected life of the options granted) 26%
Option life 4.85 years
Expected dividend yield 2.4% per annum
Average risk-free interest rate (based on the Hong Kong Exchange Fund Notes) 0.8% per annum
Taking into account the expected turnover rate of the senior executives and the early exercise behavior, the average
expected life of the options granted was estimated to be around 4 years. The early exercise behavior assumes that
option holders will exercise the options when the share price is at least 150% higher than the exercise price. No other
feature of the options granted was incorporated into the measurement of fair value.
The binomial model, applied for determining the estimated values of the share options granted under the Scheme,
was developed for use in estimating the fair value of the traded options that are fully transferable. Such an option
pricing model requires input of highly subjective assumptions, including the expected share price volatility. As the
Company’s share options have characteristics significantly different from those of the traded options, changes in the
subjective input assumptions can materially affect the estimated value of the options granted.
At the date of approval of the Consolidated Financial Statements, the Company had 119,292,546 share options
outstanding under the Company’s share option schemes, which represented approximately 2.7% of the Company’s
shares in issue as at that date.
Details of the Group’s accounting policy in respect of the share options granted are set out in Note 2(D)(s)(III) to the
Consolidated Financial Statements.
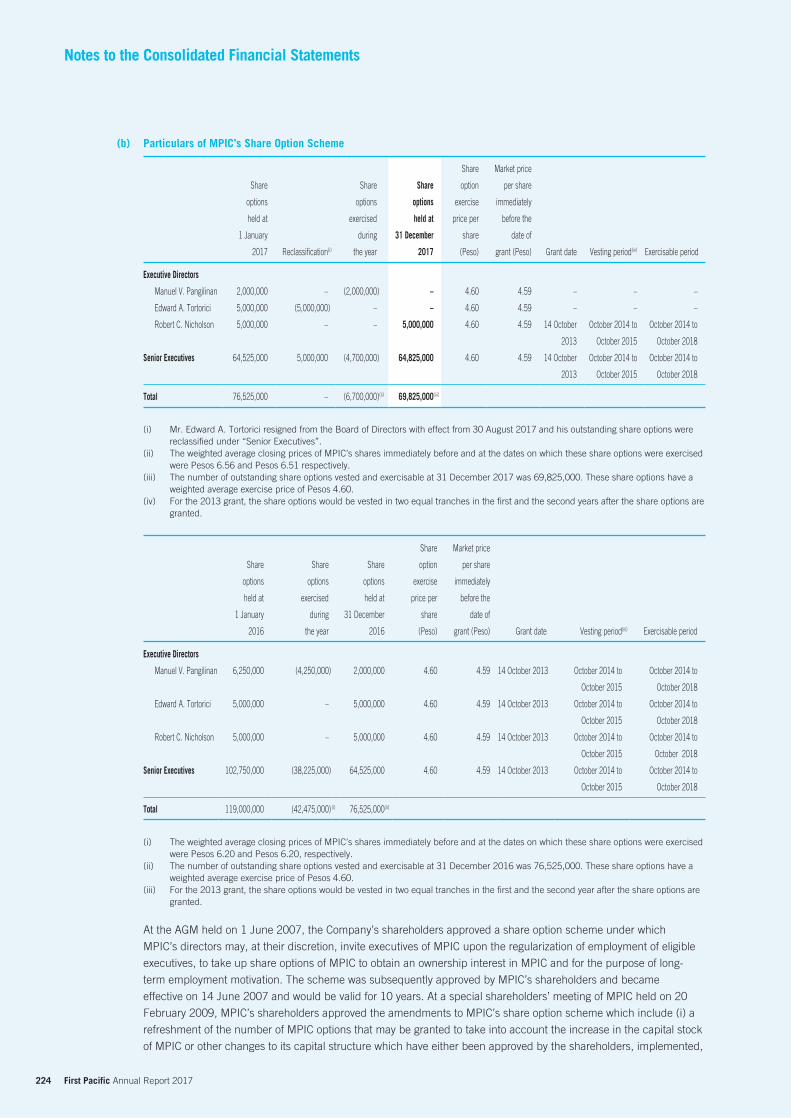
224 First Pacific Annual Report 2017
Notes to the Consolidated Financial Statements
(b) Particulars of MPIC’s Share Option Scheme
Share
options
held at
1 January
2017 Reclassification(i)
Share
options
exercised
during
the year
Share
options
held at
31 December
2017
Share
option
exercise
price per
share
(Peso)
Market price
per share
immediately
before the
date of
grant (Peso) Grant date Vesting period(iv) Exercisable period
Executive Directors
Manuel V. Pangilinan 2,000,000 – (2,000,000) – 4.60 4.59 – – –
Edward A. Tortorici 5,000,000 (5,000,000) – – 4.60 4.59 – – –
Robert C. Nicholson 5,000,000 – – 5,000,000 4.60 4.59 14 October
2013
October 2014 to
October 2015
October 2014 to
October 2018
Senior Executives 64,525,000 5,000,000 (4,700,000) 64,825,000 4.60 4.59 14 October
2013
October 2014 to
October 2015
October 2014 to
October 2018
Total 76,525,000 – (6,700,000)(ii) 69,825,000(iii)
(i) Mr. Edward A. Tortorici resigned from the Board of Directors with effect from 30 August 2017 and his outstanding share options were reclassified under “Senior Executives”.
(ii) The weighted average closing prices of MPIC’s shares immediately before and at the dates on which these share options were exercised were Pesos 6.56 and Pesos 6.51 respectively.
(iii) The number of outstanding share options vested and exercisable at 31 December 2017 was 69,825,000. These share options have a weighted average exercise price of Pesos 4.60.
(iv) For the 2013 grant, the share options would be vested in two equal tranches in the first and the second years after the share options are granted.
Share
options
held at
1 January
2016
Share
options
exercised
during
the year
Share
options
held at
31 December
2016
Share
option
exercise
price per
share
(Peso)
Market price
per share
immediately
before the
date of
grant (Peso) Grant date Vesting period(iii) Exercisable period
Executive Directors
Manuel V. Pangilinan 6,250,000 (4,250,000) 2,000,000 4.60 4.59 14 October 2013 October 2014 to
October 2015
October 2014 to
October 2018
Edward A. Tortorici 5,000,000 – 5,000,000 4.60 4.59 14 October 2013 October 2014 to
October 2015
October 2014 to
October 2018
Robert C. Nicholson 5,000,000 – 5,000,000 4.60 4.59 14 October 2013 October 2014 to
October 2015
October 2014 to
October 2018
Senior Executives 102,750,000 (38,225,000) 64,525,000 4.60 4.59 14 October 2013 October 2014 to
October 2015
October 2014 to
October 2018
Total 119,000,000 (42,475,000) (i) 76,525,000(ii)
(i) The weighted average closing prices of MPIC’s shares immediately before and at the dates on which these share options were exercised were Pesos 6.20 and Pesos 6.20, respectively.
(ii) The number of outstanding share options vested and exercisable at 31 December 2016 was 76,525,000. These share options have a weighted average exercise price of Pesos 4.60.
(iii) For the 2013 grant, the share options would be vested in two equal tranches in the first and the second year after the share options are granted.
At the AGM held on 1 June 2007, the Company’s shareholders approved a share option scheme under which
MPIC’s directors may, at their discretion, invite executives of MPIC upon the regularization of employment of eligible
executives, to take up share options of MPIC to obtain an ownership interest in MPIC and for the purpose of long-
term employment motivation. The scheme was subsequently approved by MPIC’s shareholders and became
effective on 14 June 2007 and would be valid for 10 years. At a special shareholders’ meeting of MPIC held on 20
February 2009, MPIC’s shareholders approved the amendments to MPIC’s share option scheme which include (i) a
refreshment of the number of MPIC options that may be granted to take into account the increase in the capital stock
of MPIC or other changes to its capital structure which have either been approved by the shareholders, implemented,
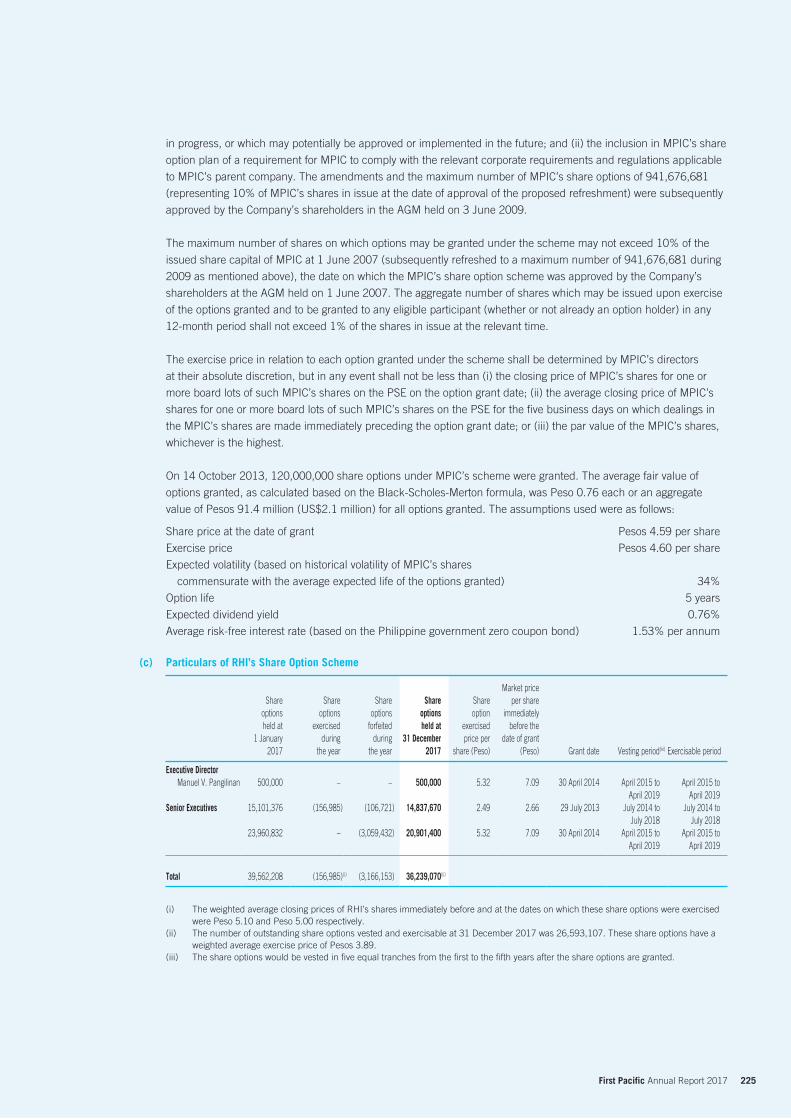
225 First Pacific Annual Report 2017
in progress, or which may potentially be approved or implemented in the future; and (ii) the inclusion in MPIC’s share
option plan of a requirement for MPIC to comply with the relevant corporate requirements and regulations applicable
to MPIC’s parent company. The amendments and the maximum number of MPIC’s share options of 941,676,681
(representing 10% of MPIC’s shares in issue at the date of approval of the proposed refreshment) were subsequently
approved by the Company’s shareholders in the AGM held on 3 June 2009.
The maximum number of shares on which options may be granted under the scheme may not exceed 10% of the
issued share capital of MPIC at 1 June 2007 (subsequently refreshed to a maximum number of 941,676,681 during
2009 as mentioned above), the date on which the MPIC’s share option scheme was approved by the Company’s
shareholders at the AGM held on 1 June 2007. The aggregate number of shares which may be issued upon exercise
of the options granted and to be granted to any eligible participant (whether or not already an option holder) in any
12-month period shall not exceed 1% of the shares in issue at the relevant time.
The exercise price in relation to each option granted under the scheme shall be determined by MPIC’s directors
at their absolute discretion, but in any event shall not be less than (i) the closing price of MPIC’s shares for one or
more board lots of such MPIC’s shares on the PSE on the option grant date; (ii) the average closing price of MPIC’s
shares for one or more board lots of such MPIC’s shares on the PSE for the five business days on which dealings in
the MPIC’s shares are made immediately preceding the option grant date; or (iii) the par value of the MPIC’s shares,
whichever is the highest.
On 14 October 2013, 120,000,000 share options under MPIC’s scheme were granted. The average fair value of
options granted, as calculated based on the Black-Scholes-Merton formula, was Peso 0.76 each or an aggregate
value of Pesos 91.4 million (US$2.1 million) for all options granted. The assumptions used were as follows:
Share price at the date of grant Pesos 4.59 per share
Exercise price Pesos 4.60 per share
Expected volatility (based on historical volatility of MPIC’s shares
commensurate with the average expected life of the options granted) 34%
Option life 5 years
Expected dividend yield 0.76%
Average risk-free interest rate (based on the Philippine government zero coupon bond) 1.53% per annum
(c) Particulars of RHI’s Share Option Scheme
Share options held at
1 January 2017
Share options
exercised during
the year
Share options
forfeited during
the year
Share options held at
31 December 2017
Share option
exercised price per
share (Peso)
Market price per share
immediately before the
date of grant (Peso) Grant date Vesting period(iii) Exercisable period
Executive DirectorManuel V. Pangilinan 500,000 – – 500,000 5.32 7.09 30 April 2014 April 2015 to
April 2019April 2015 to
April 2019Senior Executives 15,101,376 (156,985) (106,721) 14,837,670 2.49 2.66 29 July 2013 July 2014 to
July 2018July 2014 to
July 201823,960,832 – (3,059,432) 20,901,400 5.32 7.09 30 April 2014 April 2015 to
April 2019April 2015 to
April 2019
Total 39,562,208 (156,985)(i) (3,166,153) 36,239,070(ii)
(i) The weighted average closing prices of RHI’s shares immediately before and at the dates on which these share options were exercised were Peso 5.10 and Peso 5.00 respectively.
(ii) The number of outstanding share options vested and exercisable at 31 December 2017 was 26,593,107. These share options have a weighted average exercise price of Pesos 3.89.
(iii) The share options would be vested in five equal tranches from the first to the fifth years after the share options are granted.
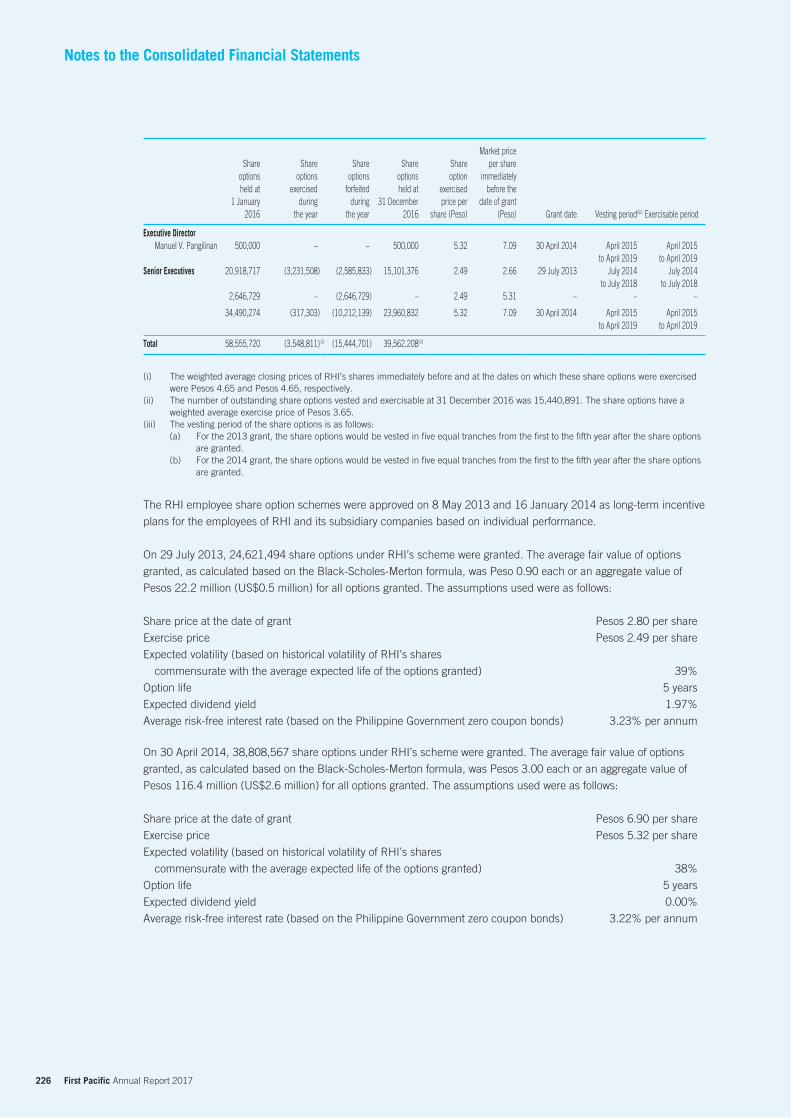
226 First Pacific Annual Report 2017
Notes to the Consolidated Financial Statements
Share options held at
1 January 2016
Share options
exercised during
the year
Share options
forfeited during
the year
Share options held at
31 December 2016
Share option
exercised price per
share (Peso)
Market price per share
immediately before the
date of grant (Peso) Grant date Vesting period(iii) Exercisable period
Executive DirectorManuel V. Pangilinan 500,000 – – 500,000 5.32 7.09 30 April 2014 April 2015
to April 2019April 2015
to April 2019Senior Executives 20,918,717 (3,231,508) (2,585,833) 15,101,376 2.49 2.66 29 July 2013 July 2014
to July 2018July 2014
to July 20182,646,729 – (2,646,729) – 2.49 5.31 – – –
34,490,274 (317,303) (10,212,139) 23,960,832 5.32 7.09 30 April 2014 April 2015 to April 2019
April 2015 to April 2019
Total 58,555,720 (3,548,811)(i) (15,444,701) 39,562,208(ii)
(i) The weighted average closing prices of RHI’s shares immediately before and at the dates on which these share options were exercised were Pesos 4.65 and Pesos 4.65, respectively.
(ii) The number of outstanding share options vested and exercisable at 31 December 2016 was 15,440,891. The share options have a weighted average exercise price of Pesos 3.65.
(iii) The vesting period of the share options is as follows:(a) For the 2013 grant, the share options would be vested in five equal tranches from the first to the fifth year after the share options
are granted.(b) For the 2014 grant, the share options would be vested in five equal tranches from the first to the fifth year after the share options
are granted.
The RHI employee share option schemes were approved on 8 May 2013 and 16 January 2014 as long-term incentive
plans for the employees of RHI and its subsidiary companies based on individual performance.
On 29 July 2013, 24,621,494 share options under RHI’s scheme were granted. The average fair value of options
granted, as calculated based on the Black-Scholes-Merton formula, was Peso 0.90 each or an aggregate value of
Pesos 22.2 million (US$0.5 million) for all options granted. The assumptions used were as follows:
Share price at the date of grant Pesos 2.80 per share
Exercise price Pesos 2.49 per share
Expected volatility (based on historical volatility of RHI’s shares
commensurate with the average expected life of the options granted) 39%
Option life 5 years
Expected dividend yield 1.97%
Average risk-free interest rate (based on the Philippine Government zero coupon bonds) 3.23% per annum
On 30 April 2014, 38,808,567 share options under RHI’s scheme were granted. The average fair value of options
granted, as calculated based on the Black-Scholes-Merton formula, was Pesos 3.00 each or an aggregate value of
Pesos 116.4 million (US$2.6 million) for all options granted. The assumptions used were as follows:
Share price at the date of grant Pesos 6.90 per share
Exercise price Pesos 5.32 per share
Expected volatility (based on historical volatility of RHI’s shares
commensurate with the average expected life of the options granted) 38%
Option life 5 years
Expected dividend yield 0.00%
Average risk-free interest rate (based on the Philippine Government zero coupon bonds) 3.22% per annum
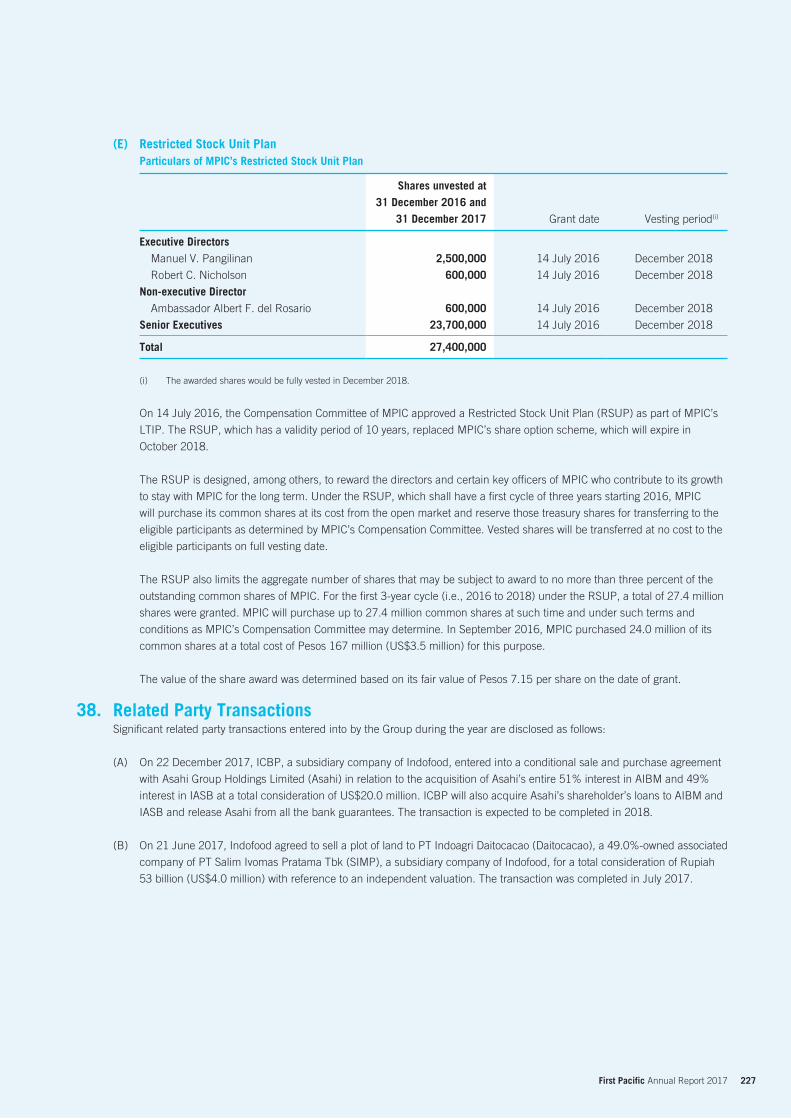
227 First Pacific Annual Report 2017
(E) Restricted Stock Unit PlanParticulars of MPIC’s Restricted Stock Unit Plan
Shares unvested at31 December 2016 and
31 December 2017 Grant date Vesting period(i)
Executive DirectorsManuel V. Pangilinan 2,500,000 14 July 2016 December 2018
Robert C. Nicholson 600,000 14 July 2016 December 2018
Non-executive DirectorAmbassador Albert F. del Rosario 600,000 14 July 2016 December 2018
Senior Executives 23,700,000 14 July 2016 December 2018
Total 27,400,000
(i) The awarded shares would be fully vested in December 2018.
On 14 July 2016, the Compensation Committee of MPIC approved a Restricted Stock Unit Plan (RSUP) as part of MPIC’s
LTIP. The RSUP, which has a validity period of 10 years, replaced MPIC’s share option scheme, which will expire in
October 2018.
The RSUP is designed, among others, to reward the directors and certain key officers of MPIC who contribute to its growth
to stay with MPIC for the long term. Under the RSUP, which shall have a first cycle of three years starting 2016, MPIC
will purchase its common shares at its cost from the open market and reserve those treasury shares for transferring to the
eligible participants as determined by MPIC’s Compensation Committee. Vested shares will be transferred at no cost to the
eligible participants on full vesting date.
The RSUP also limits the aggregate number of shares that may be subject to award to no more than three percent of the
outstanding common shares of MPIC. For the first 3-year cycle (i.e., 2016 to 2018) under the RSUP, a total of 27.4 million
shares were granted. MPIC will purchase up to 27.4 million common shares at such time and under such terms and
conditions as MPIC’s Compensation Committee may determine. In September 2016, MPIC purchased 24.0 million of its
common shares at a total cost of Pesos 167 million (US$3.5 million) for this purpose.
The value of the share award was determined based on its fair value of Pesos 7.15 per share on the date of grant.
Related Party TransactionsSignificant related party transactions entered into by the Group during the year are disclosed as follows:
(A) On 22 December 2017, ICBP, a subsidiary company of Indofood, entered into a conditional sale and purchase agreement
with Asahi Group Holdings Limited (Asahi) in relation to the acquisition of Asahi’s entire 51% interest in AIBM and 49%
interest in IASB at a total consideration of US$20.0 million. ICBP will also acquire Asahi’s shareholder’s loans to AIBM and
IASB and release Asahi from all the bank guarantees. The transaction is expected to be completed in 2018.
(B) On 21 June 2017, Indofood agreed to sell a plot of land to PT Indoagri Daitocacao (Daitocacao), a 49.0%-owned associated
company of PT Salim Ivomas Pratama Tbk (SIMP), a subsidiary company of Indofood, for a total consideration of Rupiah
53 billion (US$4.0 million) with reference to an independent valuation. The transaction was completed in July 2017.
38.
228 First Pacific Annual Report 2017
Notes to the Consolidated Financial Statements
(C) On 7 June 2017, PT Aston Inti Makmur (AIM), a subsidiary company of Indofood, agreed to acquire six plots of land from
Mr. Anthoni Salim, the Chairman and a substantial shareholder of the Company, and PT Adithya Suramitra, a company
wholly owned by Mr. Anthoni Salim, at a total consideration of Rupiah 2.2 trillion (US$165.1 million) with reference to an
independent valuation. The transaction was completed in August 2017.
(D) In March 2013, Meralco PowerGen, through its wholly-owned subsidiary company, MPG Asia Limited, provided a loan
of US$110.0 million to FPM Power. In June 2014, MPG Asia Limited provided an additional loan of US$3.5 million to
FPM Power. The loans are unsecured, interest-free and have no fixed terms of repayment. The loans of US$113.5 million
(2016: US$113.5 million) remained outstanding at 31 December 2017 and are included in the current portion of deferred
liabilities, provisions and payables (Note 28).
(E) At 31 December 2017, Petronas Power Sdn. Bhd. (Petronas), the 30% shareholder of PLP, has outstanding loans due
from PLP of approximately US$53.1 million (2016: US$117.3 million), which have been included in non-current portion
of deferred liabilities, provisions and payables (Note 28). In December 2017, Petronas converted its S$ denominated
shareholder’s loan of S$105.3 million (US$76.6 million) into equity of PLP. The loans are unsecured, subject to a variable
London Interbank Offered Rate for the portion denominated in U.S. dollars and Singapore Swap Offer Rate for the portion
denominated in S$, which are payable semi-annually. The tenor for each loan shall be 10 years. For the year ended
31 December 2017, PLP accrued interest expenses of US$8.8 million (2016: US$8.3 million) to Petronas, which were
compounded as part of the outstanding loans from Petronas. At 31 December 2017, PLP has approximately US$34,638
(2016: US$47,160) of outstanding interest payable due to Petronas which has been included in accounts payable, other
payables and accruals.
(F) Asia Link B.V. (ALBV), a wholly-owned subsidiary company of the Company, has a technical assistance agreement with
Smart, a wholly-owned subsidiary company of PLDT, for ALBV to provide Smart with technical support services and
assistance in the operations and maintenance of cellular mobile telecommunications services for a period of four years
from 23 February 2012, subject to renewal upon mutual agreement between the parties. The agreement expired on 23
February 2016 and was renewed for a period of two years to 23 February 2018. The agreement provides for payments of
technical service fees equivalent to 0.4% (2016: 0.4%) of the consolidated net revenue of Smart.
For the year ended 31 December 2017, the fees under the above arrangement amounted to Pesos 190 million (US$3.8
million) (2016: Pesos 183 million or US$3.8 million). At 31 December 2017 and 2016, no technical service fee payable
remained outstanding.
(G) In December 2014, ALBV entered into a subscription agreement with SMECI, a wholly-owned subsidiary company of
Philex, in respect of the subscription for the convertible notes issued by SMECI with a principal amount of Pesos 5.04
billion (US$100.9 million) (out of the total Pesos 7.2 billion (US$144.2 million) convertible notes issued by SMECI),
principally for financing capital expenditure of the Silangan project and repaying the advances from Philex. The convertible
notes bear interest at a coupon rate of 1.5%, payable semi-annually every 18 June and 18 December and has a maturity of
8 years, with a one-time redemption option exercisable by SMECI on the first anniversary of the issuance of the notes (i.e.,
18 December 2015). A redemption premium, payable at a rate of 3% per annum, retroactively from the issue date and
compounded semi-annually, will apply if SMECI exercises the redemption option or upon the maturity of the convertible
notes. SMECI did not exercise the one-time redemption option on 18 December 2015. During the year ended 31 December
2017, ALBV accrued interest income of US$4.6 million (2016: US$4.7 million) on these notes.
229 First Pacific Annual Report 2017
(H) First Pacific Investment Management Limited (FPIML, or formerly known as First Pacific Management Services Limited),
a wholly-owned subsidiary company of the Company, has a service agreement with Goodman Fielder for FPIML to provide
Goodman Fielder with management, advisory and financial services with effect from 17 March 2015 and subject to an
annual review on the terms and conditions by the end of each reporting period between the parties.
For the year ended 31 December 2017, the fees under the above arrangement amounted to A$1.2 million (US$0.9
million) (2016: A$0.9 million (US$0.7 million)). At 31 December 2017, FPIML had outstanding service fees receivable of
approximately A$0.1 million (US$0.1 million) (2016: A$0.2 million (US$0.1 million)) from Goodman Fielder which have
been included in accounts receivable, other receivables and prepayments.
(I) On 27 June 2017, MPIC acquired from PCEV the remaining 25.0% interest in Beacon Electric’s common and preferred
shares at a consideration of Pesos 21.8 billion (US$435.6 million), of which Pesos 12.0 billion (US$239.8 million) was
settled in cash upfront. The outstanding payable of Pesos 9.8 billion (US$195.8 million) will be settled in equal annual
installments until June 2021. At 31 December 2017, the outstanding consideration payable due in June 2018 of Pesos 2.45
billion (US$49.1 million) (with a present value of US$48.0 million) was included in the current portion of deferred liabilities,
provisions and payables (Note 28) and the remaining outstanding consideration due between June 2019 and June 2021 of
Pesos 7.35 billion (US$147.2 million) (with a present value of US$129.4 million) was included in the non-current portion of
deferred liabilities, provisions and payables (Note 28).
On 30 May 2016, MPIC acquired from PCEV, a subsidiary company of PLDT, a 25.0% interest in Beacon Electric’s
common shares and preferred shares at a total consideration of Pesos 26.2 billion (US$549.6 million), of which Pesos 17.0
billion (US$356.6 million) was settled in cash upfront and Pesos 2.0 billion (US$40.0 million) was settled in June 2017.
The outstanding payable of Pesos 7.2 billion (US$144.2 million) will be settled in annual installments until June 2020. At
31 December 2017, the outstanding consideration payable due in June 2018 of Pesos 2.0 billion (US$40.1 million) (with a
present value of US$39.5 million) was included in the current portion of deferred liabilities, provisions and payables (Note
28) and the remaining outstanding consideration due between June 2019 and June 2020 of Pesos 5.2 billion (US$104.1
million) (with a present value of US$94.6 million) was included in the non-current portion of deferred liabilities, provisions
and payables (Note 28).
(J) In January 2017, the Company through a tender offer repurchased US$400,000 bonds due 2017 issued by FPMH Finance
Limited from Mr. Robert C. Nicholson, a Director of the Company, at US$413,000. At 31 December 2017, Mr. Robert C.
Nicholson did not own any (2016: US$400,000) bonds due 2017 issued by FPMH Finance Limited and owned bonds of
US$600,000 (2016: US$600,000) due 2019 issued by FPC Finance Limited, bonds of US$200,000 (2016: US$200,000)
due 2020 issued by FPT Finance Limited and bonds of US$400,000 (31 December 2016: Nil) due 2023 issued by FPC
Treasury Limited, where all the issuers are wholly-owned subsidiary companies of the Company. For the year ended 31
December 2017, Mr. Nicholson earned interest income of US$67,712 (2016: US$78,250) on these bonds.
(K) For the period from 1 January 2017 to 30 August 2017, Mr. Edward A. Tortorici, who was a Director of the Company up
till 30 August 2017, earned interest income of US$23,868 on the US$600,000 of bonds due 2019 issued by FPC Finance
Limited, a wholly-owned subsidiary company of the Company. At 31 December 2016, Mr. Edward A. Tortorici owned
US$600,000 of bonds due 2019 issued by FPC Finance Limited and earned interest income of US$36,000 on these bonds
in 2016.
(L) In January 2017, the Company through a tender offer repurchased bonds of US$200,000 due 2020 issued by FPT
Finance Limited from Ambassador Albert F. del Rosario, a Director of the Company, at US$218,000. At 31 December
2017, Ambassador Albert F. del Rosario owned bonds of US$200,000 (2016: US$200,000) due 2019 issued by FPC
Finance Limited and did not own any (2016: US$200,000) bonds due 2020 issued by FPT Finance Limited, where both of
the issuers are wholly-owned subsidiary companies of the Company. For the year ended 31 December 2017, Ambassador
Albert F. del Rosario earned interest income of US$12,629 (For the period from 30 June 2016 to 31 December 2016:
US$12,375) on these bonds.
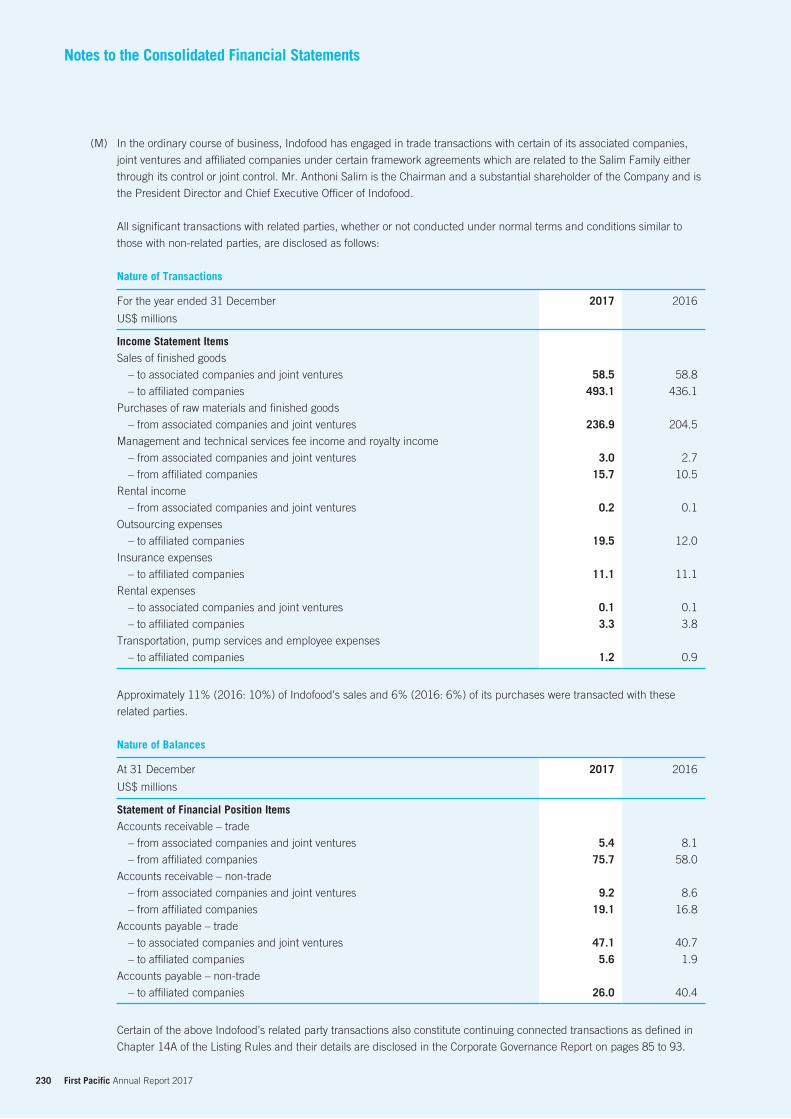
230 First Pacific Annual Report 2017
Notes to the Consolidated Financial Statements
(M) In the ordinary course of business, Indofood has engaged in trade transactions with certain of its associated companies,
joint ventures and affiliated companies under certain framework agreements which are related to the Salim Family either
through its control or joint control. Mr. Anthoni Salim is the Chairman and a substantial shareholder of the Company and is
the President Director and Chief Executive Officer of Indofood.
All significant transactions with related parties, whether or not conducted under normal terms and conditions similar to
those with non-related parties, are disclosed as follows:
Nature of Transactions
For the year ended 31 December 2017 2016
US$ millions
Income Statement ItemsSales of finished goods
– to associated companies and joint ventures 58.5 58.8
– to affiliated companies 493.1 436.1
Purchases of raw materials and finished goods
– from associated companies and joint ventures 236.9 204.5
Management and technical services fee income and royalty income
– from associated companies and joint ventures 3.0 2.7
– from affiliated companies 15.7 10.5
Rental income
– from associated companies and joint ventures 0.2 0.1
Outsourcing expenses
– to affiliated companies 19.5 12.0
Insurance expenses
– to affiliated companies 11.1 11.1
Rental expenses
– to associated companies and joint ventures 0.1 0.1
– to affiliated companies 3.3 3.8
Transportation, pump services and employee expenses
– to affiliated companies 1.2 0.9
Approximately 11% (2016: 10%) of Indofood’s sales and 6% (2016: 6%) of its purchases were transacted with these
related parties.
Nature of Balances
At 31 December 2017 2016
US$ millions
Statement of Financial Position ItemsAccounts receivable – trade
– from associated companies and joint ventures 5.4 8.1
– from affiliated companies 75.7 58.0
Accounts receivable – non-trade
– from associated companies and joint ventures 9.2 8.6
– from affiliated companies 19.1 16.8
Accounts payable – trade
– to associated companies and joint ventures 47.1 40.7
– to affiliated companies 5.6 1.9
Accounts payable – non-trade
– to affiliated companies 26.0 40.4
Certain of the above Indofood’s related party transactions also constitute continuing connected transactions as defined in
Chapter 14A of the Listing Rules and their details are disclosed in the Corporate Governance Report on pages 85 to 93.
231 First Pacific Annual Report 2017
(N) In January 2015, MPIC’s subsidiary company, Maynilad renewed (i) the framework agreement with D.M. Consunji, Inc.
(“Consunji”), a subsidiary company of DMCI Holdings, Inc. (“DMCI”) (a 27.2% shareholder of Maynilad Water Holding
Company, Inc. (“MWHC”), Maynilad’s parent company) for the period from 13 January 2015 to 31 December 2017 on
substantially the same terms as the previous framework agreement in relation to the provision of engineering, procurement
and construction services by Consunji to Maynilad and (ii) the lease agreement with DMCI Project Developer, Inc.
(“DMCIPD”), a subsidiary company of DMCI, for the renting of certain premises in Makati City by DMCIPD to Maynilad for
the period from 1 February 2015 to 31 January 2018. The lease agreement was pre-terminated on 31 December 2016
with a penalty equivalent to one-month’s rental of Pesos 0.4 million (US$8,489). For the year ended 31 December 2017,
Maynilad entered into certain construction contracts with DMCI group for the latter’s construction of water infrastructure
for Maynilad.
All significant transactions with DMCI group, whether or not conducted under normal terms and conditions similar to those
with non-related parties, are disclosed as follows:
Nature of Transactions
For the year ended 31 December 2017 2016
US$ millions
Capital Expenditure ItemConstruction services for water infrastructure 37.8 27.0
Income Statement ItemRental expenses – 0.1
(O) For the period from 1 January 2017 to 4 April 2017, MPIC’s subsidiary company, NLEX Corporation, collected toll fees
through TMC, an associated company of MPIC up to 4 April 2017 (Note 34(B)).
All significant transactions with TMC, whether or not conducted under normal terms and conditions similar to those with
non-related parties, are disclosed as follows:
Nature of Transactions
For the year ended 31 December 2017 2016
US$ millions
Income Statement ItemsOperator’s fees 9.0(i) 42.0
Management income 0.3(i) 1.2
(i) Relates to the period from 1 January 2017 to 4 April 2017 when TMC was an associated company of the Group
At 31 December 2016, NLEX Corporation had accounts receivable of US$0.8 million due from TMC and accounts payable
of US$6.8 million due to TMC.
232 First Pacific Annual Report 2017
Notes to the Consolidated Financial Statements
(P) For the year ended 31 December 2017, MPIC, RHI and their subsidiary companies were charged for electricity expenses
by Meralco, an associated company of the Group.
All significant transactions with Meralco, whether or not conducted under normal terms and conditions similar to those with
non-related parties, are disclosed as follows:
Nature of Transactions
For the year ended 31 December 2017 2016
US$ millions
Income Statement ItemElectricity expenses 25.6 21.8
Nature of Balances
At 31 December 2017 2016
US$ millions
Statement of Financial Position ItemAccounts payable – trade 2.4 0.8
(Q) For the period from 1 January 2017 to 27 June 2017, MPIC was entitled to dividend income on preferred shares from
Beacon Electric, a joint venture of the Group up to 27 June 2017 (Note 34(B)). In March 2010, MPIC subscribed Pesos
8.0 billion (US$161.1 million) of Beacon Electric’s preferred shares and extended non-interest-bearing cash advances to
Beacon Electric of Pesos 756 million (US$15.2 million), for which Pesos 144 million (US$2.9 million) was repaid in 2016.
In June 2012, MPIC acquired approximately Pesos 3.6 billion (US$71.7 million) of Beacon Electric’s preferred shares
from PCEV. In May 2016, MPIC subscribed Pesos 3.5 billion (US$70.4 million) of Beacon Electric’s preferred shares
and acquired Pesos 5.8 billion (US$116.7 million) (with a book value amount, which reflected the effect of discounting,
of Pesos 5.5 billion or US$111.6 million) of Beacon Electric’s preferred shares from PCEV. At 31 December 2016, MPIC
had an investment in preferred shares issued by Beacon Electric of Pesos 20.6 billion (US$414.8 million) and amounts
due from Beacon Electric of Pesos 612 million (US$12.3 million), which were included in associated companies and joint
ventures in the consolidated statement of financial position.
In May 2017, Beacon Electric redeemed Pesos 3.5 billion (US$69.9 million) of its preferred shares issued to MPIC in May
2016 and repaid its amounts due to MPIC of Pesos 612 million (US$12.3 million). In June 2017, MPIC acquired Pesos
5.8 billion (US$114.9 million) (with a book value amount, which reflected the effect of discounting, of Pesos 5.5 billion
or US$108.5 million) of Beacon Electric’s preferred shares from PCEV. At 27 June 2017, MPIC had an investment in
preferred shares issued by Beacon Electric of Pesos 22.6 billion (US$447.8 million), which was eliminated at consolidation
level after Beacon Electric became a subsidiary company of the Group on that date (Note 34(B)).
All significant transactions with Beacon Electric, whether or not conducted under normal terms and conditions similar to
those with non-related parties, are disclosed as follows:
Nature of Transactions
For the year ended 31 December 2017 2016
US$ millions
Income Statement ItemPreferred share dividend income 50.4(i) 25.5
(i) Relates to the period from 1 January 2017 to 27 June 2017 when Beacon Electric was a joint venture of the Group
233 First Pacific Annual Report 2017
Nature of Balances
At 31 December 2017 2016
US$ millions
Statement of Financial Position ItemsAssociated companies and joint ventures
– Preferred shares, at cost – 414.8
– Amounts due from associated companies and joint ventures – 12.3
(R) For the year ended 31 December 2017, MPIC, RHI and their subsidiary companies had the following transactions with
PLDT, an associated company of the Group.
All significant transactions with PLDT, whether or not conducted under normal terms and conditions similar to those with
non-related parties, are disclosed as follows:
Nature of Transactions
For the year ended 31 December 2017 2016
US$ millions
Income Statement ItemsIncome from advertising 0.4 0.9
Voice and data service expenses 2.1 1.6
Rental expenses 0.3 0.3
Nature of Balances
At 31 December 2017 2016
US$ millions
Statement of Financial Position ItemsAccounts receivable – trade 0.7 0.9
Accounts payable – trade 1.8 1.5
(S) For the period from 1 January 2017 to 10 October 2017, NLEX Corporation had the following transaction with Easytrip
Services Corporation (ESC), a joint venture of the Group up to 10 October 2017 (Note 34(B)).
All significant transactions with ESC, whether or not conducted under normal terms and conditions similar to those with
non-related parties, are disclosed as follows:
Nature of Transactions
For the year ended 31 December 2017 2016
US$ millions
Income Statement ItemService expenses 1.1(i) 1.5
(i) Relates to the period from 1 January 2017 to 10 October 2017 when ESC was a joint venture of the Group
At 31 December 2016, NLEX Corporation had accounts receivable of US$4.9 million due from ESC and accounts payable
of US$1.8 million due to ESC.
234 First Pacific Annual Report 2017
Notes to the Consolidated Financial Statements
(T) For the year ended 31 December 2017, MPIC and its subsidiary companies had the following transactions with Indra
Philippines Inc. (Indra), an associated company of the Group.
All significant transactions with Indra, whether or not conducted under normal terms and conditions similar to those with
non-related parties, are disclosed as follows:
Nature of Transactions
For the year ended 31 December 2017 2016
US$ millions
Income Statement ItemService expenses 5.1 5.2
Nature of Balances
At 31 December 2017 2016
US$ millions
Statement of Financial Position ItemAccounts payable – trade 0.5 0.4
(U) At 31 December 2017, MPIC and its subsidiary companies had the following transactions with Landco Pacific Corporation,
a joint venture of the Group.
All significant transactions with Landco Pacific Corporation, whether or not conducted under normal terms and conditions
similar to those with non-related parties, are disclosed as follows:
Nature of Balances
At 31 December 2017 2016
US$ millions
Statement of Financial Position ItemAssociated companies and joint ventures
– Amounts due from associated companies and joint ventures 16.6 10.2
(V) At 31 December 2017, MPIC and its subsidiary companies had the following transactions with ATEC, an associated
company of the Group.
All significant transactions with ATEC, whether or not conducted under normal terms and conditions similar to those with
non-related parties, are disclosed as follows:
Nature of Balances
At 31 December 2017 2016
US$ millions
Statement of Financial Position ItemAssociated companies and joint ventures
– Amounts due from associated companiess and joint ventures 37.7 –
235 First Pacific Annual Report 2017
(W) For period from 27 June 2017 to 31 December 2017, GBPC, which became a subsidiary company of the Group on 27
June 2017, sells electricity to Meralco, an associated company of the Group.
All significant transactions with Meralco, whether or not conducted under normal terms and conditions similar to those with
non-related parties, are disclosed as follows:
Nature of Transactions
For the year ended 31 December 2017 2016
US$ millions
Income Statement ItemSales of electricity 25.6(i) –
(i) Relates to the period from 27 June 2017 to 31 December 2017 when GBPC became a subsidiary company of the Group
Nature of Balances
At 31 December 2017 2016
US$ millions
Statement of Financial Position ItemAccounts receivable – trade 10.4 –
(X) Disclosures pursuant to Chapter 14A.72 of the Listing Rules:
(I) Related party transactions numbered (A), (C), (I), (M) and (N) are connected transactions, or continuing connected
transactions, under Chapter 14A of the Listing Rules. The Company has complied with the disclosure requirements
for such connected transactions, or continuing connected transactions, in accordance with Chapter 14A of the Listing
Rules.
(II) Related party transactions numbered (D), (E), (F), (J), (K), (L), (P), (R) and (W) are connected transactions, or
continuing connected transactions, under Chapter 14A of the Listing Rules, but are fully exempted from all disclosure
requirements.
(III) Related party transactions numbered (B), (G), (H), (O), (Q), (S), (T), (U) and (V) are not connected transactions, or
continuing connected transactions, under Chapter 14A of the Listing Rules.
236 First Pacific Annual Report 2017
Notes to the Consolidated Financial Statements
Financial Instruments by Category and Fair Value Hierarchy(A) Financial Instruments by Category
(a) Financial AssetsThe following table summarizes the Group’s financial assets at the end of the reporting period.
2017 2016
US$ million
Loans and receivables
Available-for-sale
financial assets
Financial assets at fair value Total
Loans and
receivables
Available-
for-sale
financial
assets
Financial
assets at
fair value Total
Accounts and other receivables
(Non-current) 4.0 – 3.0 7.0 6.0 – 4.6 10.6
Available-for-sale assets
(Non-current) – 274.5(i) – 274.5 – 828.1(i) – 828.1
Pledged deposits and restricted cash
(Non-current) – – – – 17.9 – – 17.9
Other non-current assets 85.5 – – 85.5 79.2 – – 79.2
Cash and cash equivalents and
short-term deposits 2,157.2 – – 2,157.2 1,691.9 – – 1,691.9
Pledges deposits and restricted cash
(Current) 81.1 – – 81.1 60.6 – – 60.6
Available-for-sale assets (Current) – 60.2 – 60.2 – 39.9 – 39.9
Accounts and other receivables (Current) 1,019.3 – 18.9 1,038.2 757.0 – 32.3 789.3
Total 3,347.1 334.7 21.9(ii) 3,703.7 2,612.6 868.0 36.9(ii) 3,517.5
(i) Includes SMECI’s convertible notes of US$100.9 million (2016: preferred shares issued by Beacon Electric of US$414.8 million and SMECI’s convertible notes of US$101.4 million)
(ii) Represents derivative assets designated as hedge items
(b) Financial LiabilitiesThe following table summarizes the financial liabilities measured at amortized cost at the end of the reporting period.
2017 2016
US$ million
Financial liabilities at
amortized cost
Financial liabilities at
fair value Total
Financial
liabilities at
amortized cost
Financial
liabilities at
fair value Total
Accounts payable, other payables
and accruals 1,063.9 – 1,063.9 870.9 – 870.9
Short-term borrowings 1,460.4 – 1,460.4 1,280.7 – 1,280.7
Current portion of deferred liabilities,
provisions and payables 105.0 8.3 113.3 50.3 9.6 59.9
Long-term borrowings 6,509.3 – 6,509.3 4,827.7 – 4,827.7
Deferred liabilities, provisions and payables 896.8 2.5 899.3 720.8 0.4 721.2
Total 10,035.4 10.8(i) 10,046.2 7,750.4 10.0(i) 7,760.4
(i) Represents derivative liabilities designated as hedge items
39.
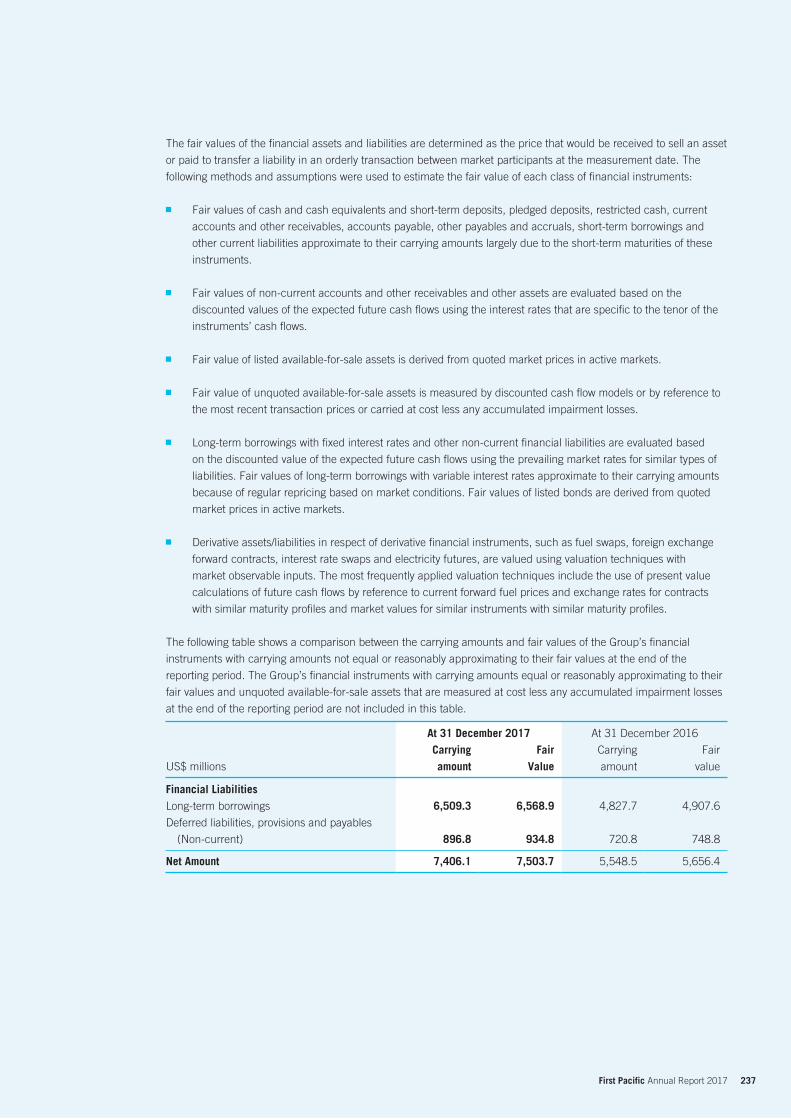
237 First Pacific Annual Report 2017
The fair values of the financial assets and liabilities are determined as the price that would be received to sell an asset
or paid to transfer a liability in an orderly transaction between market participants at the measurement date. The
following methods and assumptions were used to estimate the fair value of each class of financial instruments:
Fair values of cash and cash equivalents and short-term deposits, pledged deposits, restricted cash, current
accounts and other receivables, accounts payable, other payables and accruals, short-term borrowings and
other current liabilities approximate to their carrying amounts largely due to the short-term maturities of these
instruments.
Fair values of non-current accounts and other receivables and other assets are evaluated based on the
discounted values of the expected future cash flows using the interest rates that are specific to the tenor of the
instruments’ cash flows.
Fair value of listed available-for-sale assets is derived from quoted market prices in active markets.
Fair value of unquoted available-for-sale assets is measured by discounted cash flow models or by reference to
the most recent transaction prices or carried at cost less any accumulated impairment losses.
Long-term borrowings with fixed interest rates and other non-current financial liabilities are evaluated based
on the discounted value of the expected future cash flows using the prevailing market rates for similar types of
liabilities. Fair values of long-term borrowings with variable interest rates approximate to their carrying amounts
because of regular repricing based on market conditions. Fair values of listed bonds are derived from quoted
market prices in active markets.
Derivative assets/liabilities in respect of derivative financial instruments, such as fuel swaps, foreign exchange
forward contracts, interest rate swaps and electricity futures, are valued using valuation techniques with
market observable inputs. The most frequently applied valuation techniques include the use of present value
calculations of future cash flows by reference to current forward fuel prices and exchange rates for contracts
with similar maturity profiles and market values for similar instruments with similar maturity profiles.
The following table shows a comparison between the carrying amounts and fair values of the Group’s financial
instruments with carrying amounts not equal or reasonably approximating to their fair values at the end of the
reporting period. The Group’s financial instruments with carrying amounts equal or reasonably approximating to their
fair values and unquoted available-for-sale assets that are measured at cost less any accumulated impairment losses
at the end of the reporting period are not included in this table.
At 31 December 2017 At 31 December 2016
US$ millions
Carrying amount
Fair Value
Carrying
amount
Fair
value
Financial LiabilitiesLong-term borrowings 6,509.3 6,568.9 4,827.7 4,907.6
Deferred liabilities, provisions and payables
(Non-current) 896.8 934.8 720.8 748.8
Net Amount 7,406.1 7,503.7 5,548.5 5,656.4
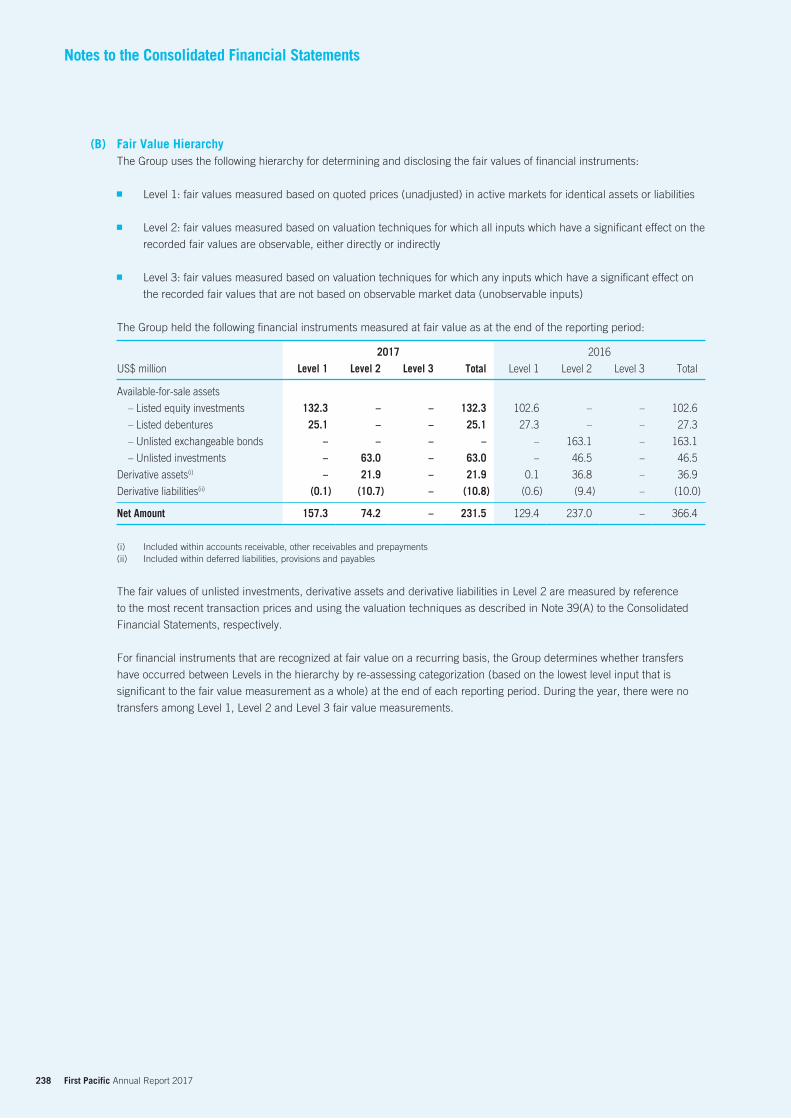
238 First Pacific Annual Report 2017
Notes to the Consolidated Financial Statements
(B) Fair Value HierarchyThe Group uses the following hierarchy for determining and disclosing the fair values of financial instruments:
Level 1: fair values measured based on quoted prices (unadjusted) in active markets for identical assets or liabilities
Level 2: fair values measured based on valuation techniques for which all inputs which have a significant effect on the
recorded fair values are observable, either directly or indirectly
Level 3: fair values measured based on valuation techniques for which any inputs which have a significant effect on
the recorded fair values that are not based on observable market data (unobservable inputs)
The Group held the following financial instruments measured at fair value as at the end of the reporting period:
2017 2016
US$ million Level 1 Level 2 Level 3 Total Level 1 Level 2 Level 3 Total
Available-for-sale assets
– Listed equity investments 132.3 – – 132.3 102.6 – – 102.6
– Listed debentures 25.1 – – 25.1 27.3 – – 27.3
– Unlisted exchangeable bonds – – – – – 163.1 – 163.1
– Unlisted investments – 63.0 – 63.0 – 46.5 – 46.5
Derivative assets(i) – 21.9 – 21.9 0.1 36.8 – 36.9
Derivative liabilities(ii) (0.1) (10.7) – (10.8) (0.6) (9.4) – (10.0)
Net Amount 157.3 74.2 – 231.5 129.4 237.0 – 366.4
(i) Included within accounts receivable, other receivables and prepayments(ii) Included within deferred liabilities, provisions and payables
The fair values of unlisted investments, derivative assets and derivative liabilities in Level 2 are measured by reference
to the most recent transaction prices and using the valuation techniques as described in Note 39(A) to the Consolidated
Financial Statements, respectively.
For financial instruments that are recognized at fair value on a recurring basis, the Group determines whether transfers
have occurred between Levels in the hierarchy by re-assessing categorization (based on the lowest level input that is
significant to the fair value measurement as a whole) at the end of each reporting period. During the year, there were no
transfers among Level 1, Level 2 and Level 3 fair value measurements.
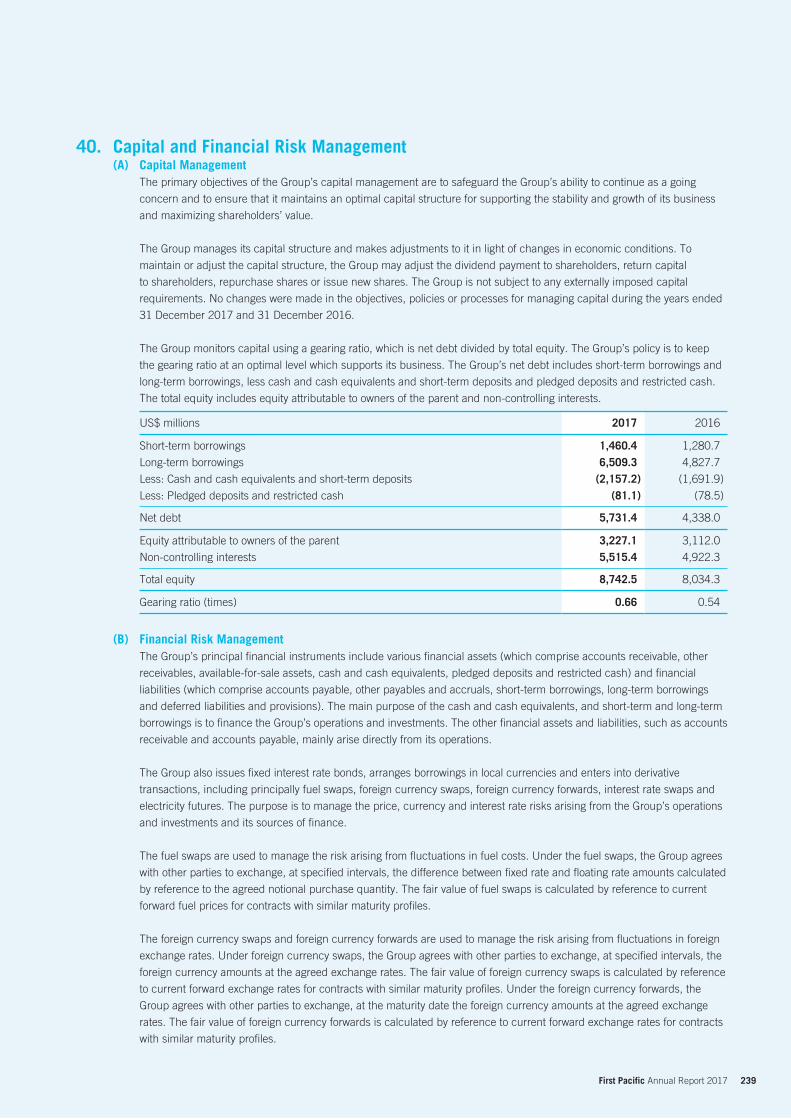
239 First Pacific Annual Report 2017
Capital and Financial Risk Management(A) Capital Management
The primary objectives of the Group’s capital management are to safeguard the Group’s ability to continue as a going
concern and to ensure that it maintains an optimal capital structure for supporting the stability and growth of its business
and maximizing shareholders’ value.
The Group manages its capital structure and makes adjustments to it in light of changes in economic conditions. To
maintain or adjust the capital structure, the Group may adjust the dividend payment to shareholders, return capital
to shareholders, repurchase shares or issue new shares. The Group is not subject to any externally imposed capital
requirements. No changes were made in the objectives, policies or processes for managing capital during the years ended
31 December 2017 and 31 December 2016.
The Group monitors capital using a gearing ratio, which is net debt divided by total equity. The Group’s policy is to keep
the gearing ratio at an optimal level which supports its business. The Group’s net debt includes short-term borrowings and
long-term borrowings, less cash and cash equivalents and short-term deposits and pledged deposits and restricted cash.
The total equity includes equity attributable to owners of the parent and non-controlling interests.
US$ millions 2017 2016
Short-term borrowings 1,460.4 1,280.7
Long-term borrowings 6,509.3 4,827.7
Less: Cash and cash equivalents and short-term deposits (2,157.2) (1,691.9)
Less: Pledged deposits and restricted cash (81.1) (78.5)
Net debt 5,731.4 4,338.0
Equity attributable to owners of the parent 3,227.1 3,112.0
Non-controlling interests 5,515.4 4,922.3
Total equity 8,742.5 8,034.3
Gearing ratio (times) 0.66 0.54
(B) Financial Risk ManagementThe Group’s principal financial instruments include various financial assets (which comprise accounts receivable, other
receivables, available-for-sale assets, cash and cash equivalents, pledged deposits and restricted cash) and financial
liabilities (which comprise accounts payable, other payables and accruals, short-term borrowings, long-term borrowings
and deferred liabilities and provisions). The main purpose of the cash and cash equivalents, and short-term and long-term
borrowings is to finance the Group’s operations and investments. The other financial assets and liabilities, such as accounts
receivable and accounts payable, mainly arise directly from its operations.
The Group also issues fixed interest rate bonds, arranges borrowings in local currencies and enters into derivative
transactions, including principally fuel swaps, foreign currency swaps, foreign currency forwards, interest rate swaps and
electricity futures. The purpose is to manage the price, currency and interest rate risks arising from the Group’s operations
and investments and its sources of finance.
The fuel swaps are used to manage the risk arising from fluctuations in fuel costs. Under the fuel swaps, the Group agrees
with other parties to exchange, at specified intervals, the difference between fixed rate and floating rate amounts calculated
by reference to the agreed notional purchase quantity. The fair value of fuel swaps is calculated by reference to current
forward fuel prices for contracts with similar maturity profiles.
The foreign currency swaps and foreign currency forwards are used to manage the risk arising from fluctuations in foreign
exchange rates. Under foreign currency swaps, the Group agrees with other parties to exchange, at specified intervals, the
foreign currency amounts at the agreed exchange rates. The fair value of foreign currency swaps is calculated by reference
to current forward exchange rates for contracts with similar maturity profiles. Under the foreign currency forwards, the
Group agrees with other parties to exchange, at the maturity date the foreign currency amounts at the agreed exchange
rates. The fair value of foreign currency forwards is calculated by reference to current forward exchange rates for contracts
with similar maturity profiles.
40.
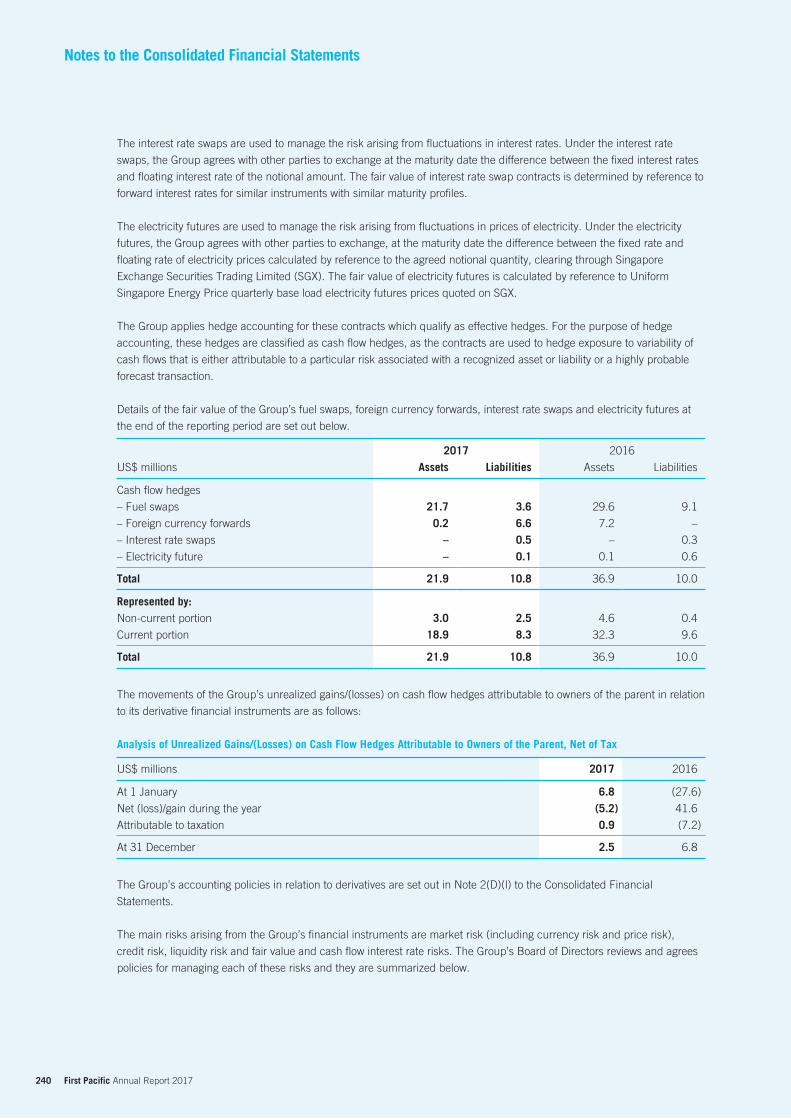
240 First Pacific Annual Report 2017
Notes to the Consolidated Financial Statements
The interest rate swaps are used to manage the risk arising from fluctuations in interest rates. Under the interest rate
swaps, the Group agrees with other parties to exchange at the maturity date the difference between the fixed interest rates
and floating interest rate of the notional amount. The fair value of interest rate swap contracts is determined by reference to
forward interest rates for similar instruments with similar maturity profiles.
The electricity futures are used to manage the risk arising from fluctuations in prices of electricity. Under the electricity
futures, the Group agrees with other parties to exchange, at the maturity date the difference between the fixed rate and
floating rate of electricity prices calculated by reference to the agreed notional quantity, clearing through Singapore
Exchange Securities Trading Limited (SGX). The fair value of electricity futures is calculated by reference to Uniform
Singapore Energy Price quarterly base load electricity futures prices quoted on SGX.
The Group applies hedge accounting for these contracts which qualify as effective hedges. For the purpose of hedge
accounting, these hedges are classified as cash flow hedges, as the contracts are used to hedge exposure to variability of
cash flows that is either attributable to a particular risk associated with a recognized asset or liability or a highly probable
forecast transaction.
Details of the fair value of the Group’s fuel swaps, foreign currency forwards, interest rate swaps and electricity futures at
the end of the reporting period are set out below.
2017 2016
US$ millions Assets Liabilities Assets Liabilities
Cash flow hedges
– Fuel swaps 21.7 3.6 29.6 9.1
– Foreign currency forwards 0.2 6.6 7.2 –
– Interest rate swaps – 0.5 – 0.3
– Electricity future – 0.1 0.1 0.6
Total 21.9 10.8 36.9 10.0
Represented by:Non-current portion 3.0 2.5 4.6 0.4
Current portion 18.9 8.3 32.3 9.6
Total 21.9 10.8 36.9 10.0
The movements of the Group’s unrealized gains/(losses) on cash flow hedges attributable to owners of the parent in relation
to its derivative financial instruments are as follows:
Analysis of Unrealized Gains/(Losses) on Cash Flow Hedges Attributable to Owners of the Parent, Net of Tax
US$ millions 2017 2016
At 1 January 6.8 (27.6)
Net (loss)/gain during the year (5.2) 41.6
Attributable to taxation 0.9 (7.2)
At 31 December 2.5 6.8
The Group’s accounting policies in relation to derivatives are set out in Note 2(D)(l) to the Consolidated Financial
Statements.
The main risks arising from the Group’s financial instruments are market risk (including currency risk and price risk),
credit risk, liquidity risk and fair value and cash flow interest rate risks. The Group’s Board of Directors reviews and agrees
policies for managing each of these risks and they are summarized below.
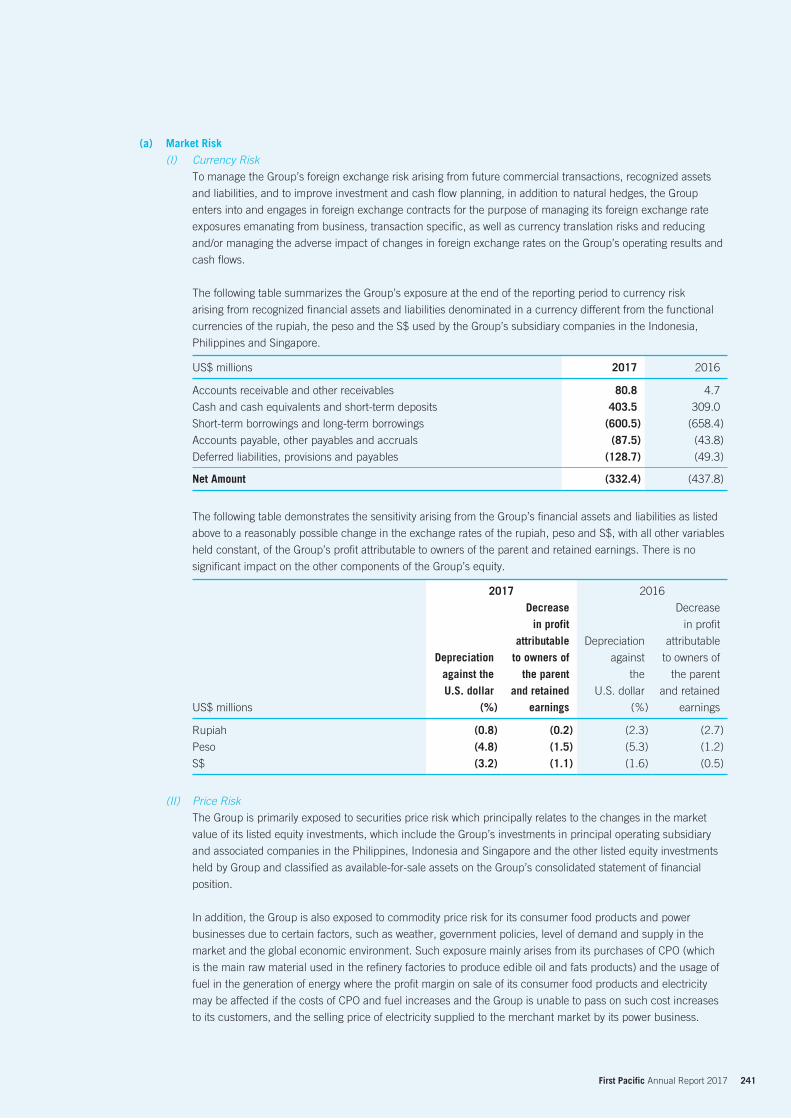
241 First Pacific Annual Report 2017
(a) Market Risk(I) Currency Risk
To manage the Group’s foreign exchange risk arising from future commercial transactions, recognized assets
and liabilities, and to improve investment and cash flow planning, in addition to natural hedges, the Group
enters into and engages in foreign exchange contracts for the purpose of managing its foreign exchange rate
exposures emanating from business, transaction specific, as well as currency translation risks and reducing
and/or managing the adverse impact of changes in foreign exchange rates on the Group’s operating results and
cash flows.
The following table summarizes the Group’s exposure at the end of the reporting period to currency risk
arising from recognized financial assets and liabilities denominated in a currency different from the functional
currencies of the rupiah, the peso and the S$ used by the Group’s subsidiary companies in the Indonesia,
Philippines and Singapore.
US$ millions 2017 2016
Accounts receivable and other receivables 80.8 4.7
Cash and cash equivalents and short-term deposits 403.5 309.0
Short-term borrowings and long-term borrowings (600.5) (658.4)
Accounts payable, other payables and accruals (87.5) (43.8)
Deferred liabilities, provisions and payables (128.7) (49.3)
Net Amount (332.4) (437.8)
The following table demonstrates the sensitivity arising from the Group’s financial assets and liabilities as listed
above to a reasonably possible change in the exchange rates of the rupiah, peso and S$, with all other variables
held constant, of the Group’s profit attributable to owners of the parent and retained earnings. There is no
significant impact on the other components of the Group’s equity.
2017 2016
US$ millions
Depreciation against the U.S. dollar
(%)
Decrease in profit
attributable to owners of
the parent and retained
earnings
Depreciation
against
the
U.S. dollar
(%)
Decrease
in profit
attributable
to owners of
the parent
and retained
earnings
Rupiah (0.8) (0.2) (2.3) (2.7)
Peso (4.8) (1.5) (5.3) (1.2)
S$ (3.2) (1.1) (1.6) (0.5)
(II) Price RiskThe Group is primarily exposed to securities price risk which principally relates to the changes in the market
value of its listed equity investments, which include the Group’s investments in principal operating subsidiary
and associated companies in the Philippines, Indonesia and Singapore and the other listed equity investments
held by Group and classified as available-for-sale assets on the Group’s consolidated statement of financial
position.
In addition, the Group is also exposed to commodity price risk for its consumer food products and power
businesses due to certain factors, such as weather, government policies, level of demand and supply in the
market and the global economic environment. Such exposure mainly arises from its purchases of CPO (which
is the main raw material used in the refinery factories to produce edible oil and fats products) and the usage of
fuel in the generation of energy where the profit margin on sale of its consumer food products and electricity
may be affected if the costs of CPO and fuel increases and the Group is unable to pass on such cost increases
to its customers, and the selling price of electricity supplied to the merchant market by its power business.
242 First Pacific Annual Report 2017
Notes to the Consolidated Financial Statements
The Group’s policy is to minimize the risks of its raw material costs arising from the fluctuations in the
commodity prices by increasing self-sufficiency in the supply of CPO for the refinery operations (through the
purchase of CPO from the Group’s own plantations). For the years ended 31 December 2017 and 2016, no
hedging in the said commodity price risk have been undertaken.
The Group has entered into fuel swap contracts that for its power business oblige it to make payments for fuel
at fixed prices on an agreed notional purchase quantity and receive payments for fuel at floating prices on the
same amounts.
The Group has entered into electricity futures that oblige it to make or receive payments for electricity futures
at fixed rates of electricity prices on notional quantity and receive or make payments for electricity futures at
floating rates of electricity prices on the same amounts.
At 31 December 2017, if the fuel and electricity prices increased/decreased by 10%, the Group’s unrealized
cash flow hedge reserve and equity attributable to owners of the parent would have been US$5.3 million (2016:
US$5.5 million) higher/lower with, all other variables including tax rate being held constant.
(b) Credit RiskFor the consumer food products business, the Group has credit risk arising from the credit given to the customers,
but it has policies in place to ensure that wholesales of products are made to creditworthy customers with an
appropriate credit history. The Group has policies that limit the amount of credit exposure to any particular customer,
such as requiring sub-distributors to provide bank guarantees. For the water distribution business, the Group
generally allows 14 to 60 days of credit for its water and sewerage service customers, 45 to 60 days of credit for
its bulk water supply customers. For the hospital business, the Group sets credit limits for all customers, extends
credit only to reputable entities and regularly review the credit exposures and credit worthiness of counterparties. In
addition, receivable balances are monitored on an ongoing basis to reduce the Group’s exposure to bad debts. For the
electricity generation business, the Group generally allows 15 to 30 days of credit to its customers. PLP also requires
deposits and guarantees from creditworthy financial institutions to secure substantial obligations of its customers.
Further quantitative data in respect of the Group’s exposure to credit risk arising from accounts receivable are
disclosed in Note 18 to the Consolidated Financial Statements.
The credit risk of the Group’s other financial assets, which include other receivables, certain investments in debt
securities classified as available-for-sale assets, cash and cash equivalents and short-term deposits, pledged deposits
and restricted cash, arises from default of the counterparty, with a maximum exposure equal to the aggregate carrying
amount of these instruments and the unrealized losses, if any, on available-for-sale assets charged directly to the
Group’s equity. The Group is also exposed to credit risk through the granting of financial guarantees. Further details
of which are set out in Note 35(C)(a) to the Consolidated Financial Statements.
The Group has no significant concentrations of credit risk.
(c) Liquidity RiskThe Group manages its liquidity profile to be able to finance its capital expenditure and service its maturing debts by
maintaining sufficient cash and marketable securities, and the availability of funding through an adequate amount of
committed credit facilities.
The Group regularly evaluates its projected and actual cash flow information and continuously assesses conditions
in the financial markets for opportunities to pursue fund-raising initiatives. These initiatives may include bank loans,
debt capital and equity capital issues.
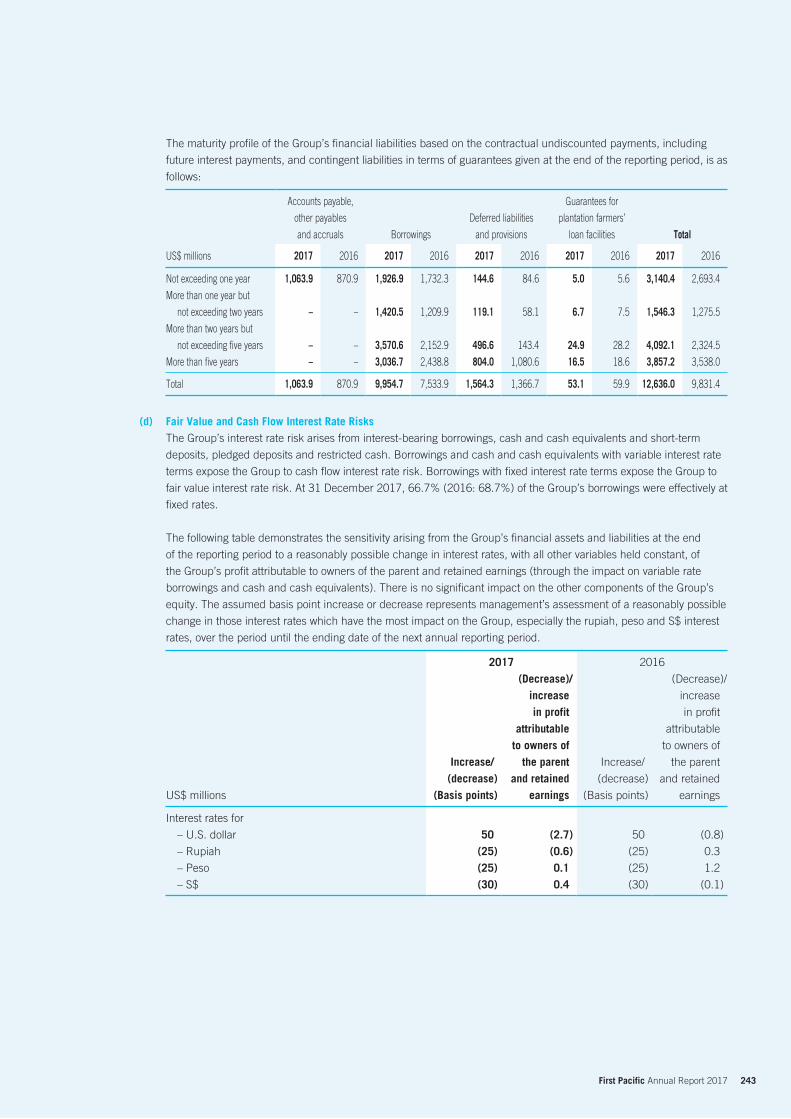
243 First Pacific Annual Report 2017
The maturity profile of the Group’s financial liabilities based on the contractual undiscounted payments, including
future interest payments, and contingent liabilities in terms of guarantees given at the end of the reporting period, is as
follows:
Accounts payable,
other payables
and accruals Borrowings
Deferred liabilities
and provisions
Guarantees for
plantation farmers’
loan facilities Total
US$ millions 2017 2016 2017 2016 2017 2016 2017 2016 2017 2016
Not exceeding one year 1,063.9 870.9 1,926.9 1,732.3 144.6 84.6 5.0 5.6 3,140.4 2,693.4
More than one year but
not exceeding two years – – 1,420.5 1,209.9 119.1 58.1 6.7 7.5 1,546.3 1,275.5
More than two years but
not exceeding five years – – 3,570.6 2,152.9 496.6 143.4 24.9 28.2 4,092.1 2,324.5
More than five years – – 3,036.7 2,438.8 804.0 1,080.6 16.5 18.6 3,857.2 3,538.0
Total 1,063.9 870.9 9,954.7 7,533.9 1,564.3 1,366.7 53.1 59.9 12,636.0 9,831.4
(d) Fair Value and Cash Flow Interest Rate RisksThe Group’s interest rate risk arises from interest-bearing borrowings, cash and cash equivalents and short-term
deposits, pledged deposits and restricted cash. Borrowings and cash and cash equivalents with variable interest rate
terms expose the Group to cash flow interest rate risk. Borrowings with fixed interest rate terms expose the Group to
fair value interest rate risk. At 31 December 2017, 66.7% (2016: 68.7%) of the Group’s borrowings were effectively at
fixed rates.
The following table demonstrates the sensitivity arising from the Group’s financial assets and liabilities at the end
of the reporting period to a reasonably possible change in interest rates, with all other variables held constant, of
the Group’s profit attributable to owners of the parent and retained earnings (through the impact on variable rate
borrowings and cash and cash equivalents). There is no significant impact on the other components of the Group’s
equity. The assumed basis point increase or decrease represents management’s assessment of a reasonably possible
change in those interest rates which have the most impact on the Group, especially the rupiah, peso and S$ interest
rates, over the period until the ending date of the next annual reporting period.
2017 2016
US$ millions
Increase/ (decrease)
(Basis points)
(Decrease)/increase in profit
attributable to owners of
the parent and retained
earnings
Increase/
(decrease)
(Basis points)
(Decrease)/
increase
in profit
attributable
to owners of
the parent
and retained
earnings
Interest rates for
– U.S. dollar 50 (2.7) 50 (0.8)
– Rupiah (25) (0.6) (25) 0.3
– Peso (25) 0.1 (25) 1.2
– S$ (30) 0.4 (30) (0.1)
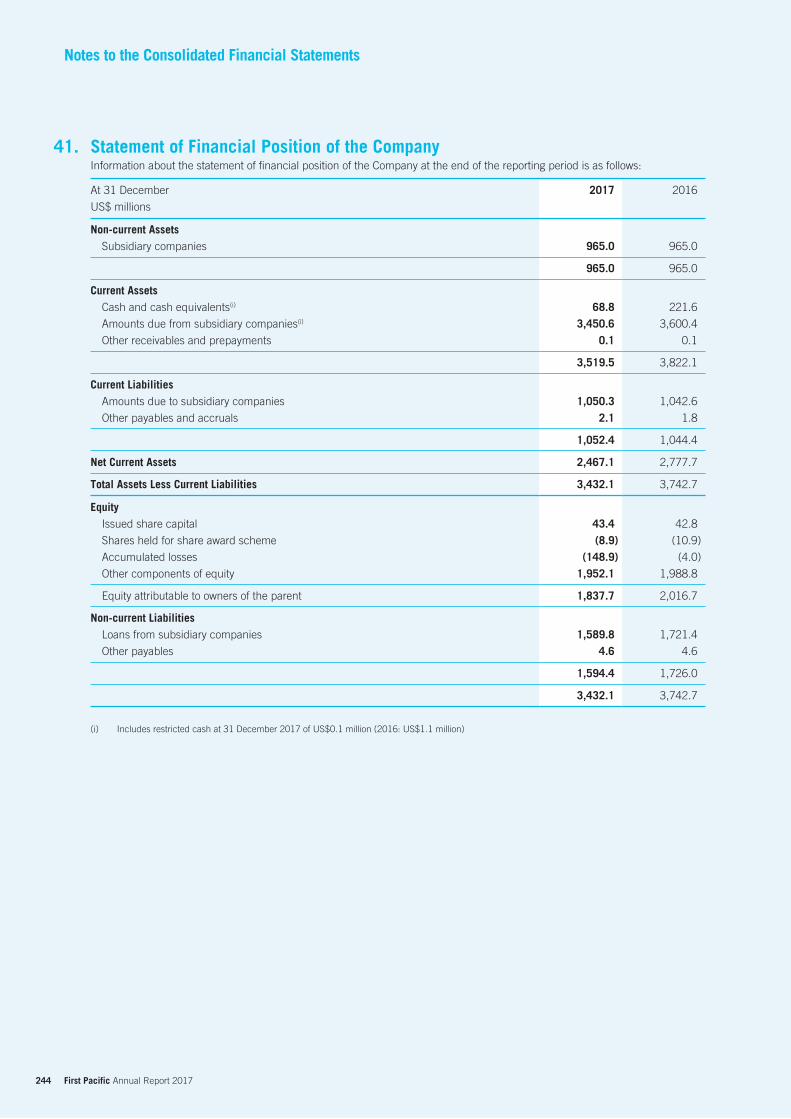
244 First Pacific Annual Report 2017
Notes to the Consolidated Financial Statements
Statement of Financial Position of the CompanyInformation about the statement of financial position of the Company at the end of the reporting period is as follows:
At 31 December
US$ millions
2017 2016
Non-current AssetsSubsidiary companies 965.0 965.0
965.0 965.0
Current AssetsCash and cash equivalents(i) 68.8 221.6
Amounts due from subsidiary companies(i) 3,450.6 3,600.4
Other receivables and prepayments 0.1 0.1
3,519.5 3,822.1
Current LiabilitiesAmounts due to subsidiary companies 1,050.3 1,042.6
Other payables and accruals 2.1 1.8
1,052.4 1,044.4
Net Current Assets 2,467.1 2,777.7
Total Assets Less Current Liabilities 3,432.1 3,742.7
Equity Issued share capital 43.4 42.8
Shares held for share award scheme (8.9) (10.9)
Accumulated losses (148.9) (4.0)
Other components of equity 1,952.1 1,988.8
Equity attributable to owners of the parent 1,837.7 2,016.7
Non-current LiabilitiesLoans from subsidiary companies 1,589.8 1,721.4
Other payables 4.6 4.6
1,594.4 1,726.0
3,432.1 3,742.7
(i) Includes restricted cash at 31 December 2017 of US$0.1 million (2016: US$1.1 million)
41.
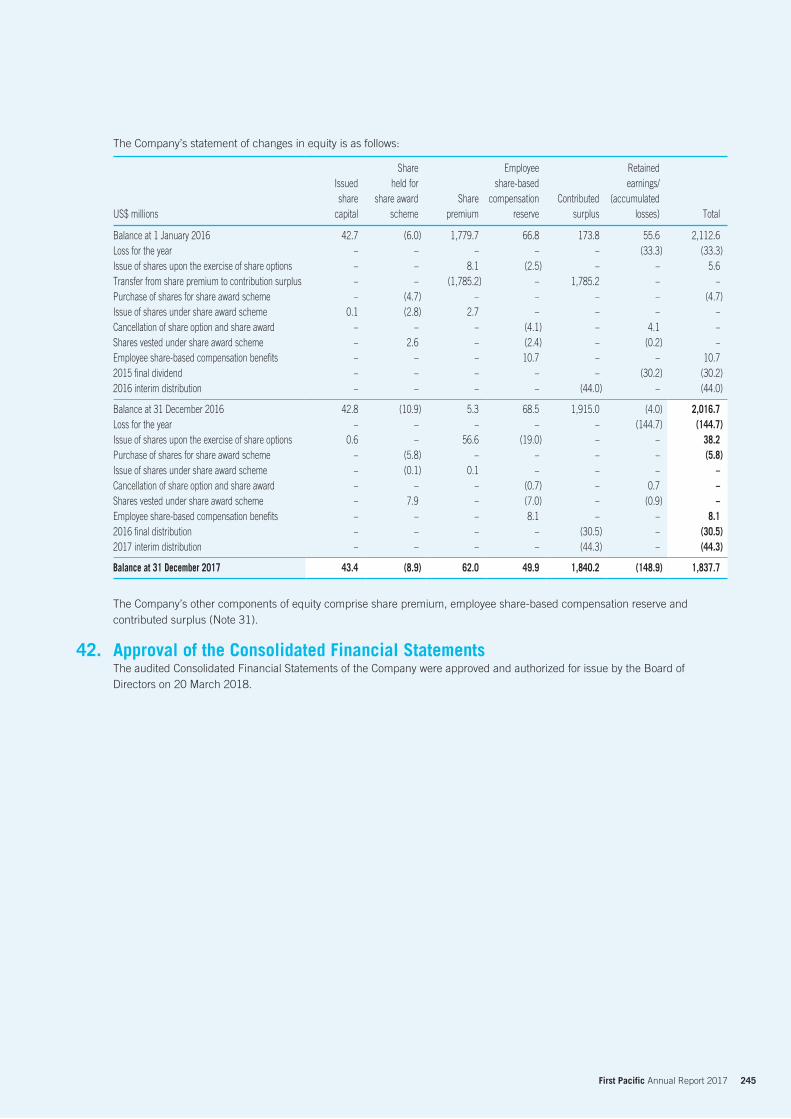
245 First Pacific Annual Report 2017
The Company’s statement of changes in equity is as follows:
US$ millions
Issued share
capital
Shareheld for
share award scheme
Share premium
Employee share-based
compensation reserve
Contributed surplus
Retained earnings/
(accumulated losses) Total
Balance at 1 January 2016 42.7 (6.0) 1,779.7 66.8 173.8 55.6 2,112.6Loss for the year – – – – – (33.3) (33.3)Issue of shares upon the exercise of share options – – 8.1 (2.5) – – 5.6Transfer from share premium to contribution surplus – – (1,785.2) – 1,785.2 – –Purchase of shares for share award scheme – (4.7) – – – – (4.7)Issue of shares under share award scheme 0.1 (2.8) 2.7 – – – –Cancellation of share option and share award – – – (4.1) – 4.1 –Shares vested under share award scheme – 2.6 – (2.4) – (0.2) –Employee share-based compensation benefits – – – 10.7 – – 10.72015 final dividend – – – – – (30.2) (30.2)2016 interim distribution – – – – (44.0) – (44.0) Balance at 31 December 2016 42.8 (10.9) 5.3 68.5 1,915.0 (4.0) 2,016.7Loss for the year – – – – – (144.7) (144.7)Issue of shares upon the exercise of share options 0.6 – 56.6 (19.0) – – 38.2Purchase of shares for share award scheme – (5.8) – – – – (5.8)Issue of shares under share award scheme – (0.1) 0.1 – – – –Cancellation of share option and share award – – – (0.7) – 0.7 –Shares vested under share award scheme – 7.9 – (7.0) – (0.9) –Employee share-based compensation benefits – – – 8.1 – – 8.12016 final distribution – – – – (30.5) – (30.5)2017 interim distribution – – – – (44.3) – (44.3) Balance at 31 December 2017 43.4 (8.9) 62.0 49.9 1,840.2 (148.9) 1,837.7
The Company’s other components of equity comprise share premium, employee share-based compensation reserve and contributed surplus (Note 31).
Approval of the Consolidated Financial StatementsThe audited Consolidated Financial Statements of the Company were approved and authorized for issue by the Board of Directors on 20 March 2018.
42.
246 First Pacific Annual Report 2017
Glossary of Terms
Financial TermsCONCESSION ASSETS Value of concessions of right granted by governments under service concession arrangements to charge users of
public service provided
DEFINED BENEFIT SCHEME A retirement scheme in which the rules specify the benefits to be paid and the scheme is financed
accordingly. Generally, benefits are determined using actuarial valuations that takes into account of the final salary and the number of
years of service of each member
DEFINED CONTRIBUTION SCHEME A retirement scheme under which the benefits are directly determined by the value of contributions
paid in respect of each member
EBIT Earnings Before Interest and Tax
EBITDA Earnings Before Interest, Tax, Depreciation and Amortization
GAV Gross Asset Value, which represents the total market value of listed investments, investment costs or carrying amounts of unlisted
investments and other assets of First Pacific Head Office
IMPAIRMENT PROVISION Provision made to reduce the carrying amount of an asset to its recoverable amount
NAV Net Asset Value
NET ASSETS Total assets less total liabilities, equivalent to total equity
NET CURRENT ASSETS Current assets less current liabilities
NET DEBT Total of short-term and long-term borrowings, net of cash and cash equivalents and short-term deposits and pledged
deposits and restricted cash
NON-RECURRING ITEMS Certain items, through occurrence or size, are not considered usual operating items
RECURRING PROFIT Profit attributable to owners of the parent excluding foreign exchange and derivative gains/losses, gain/loss on
changes in fair value of biological assets and non-recurring items
TOTAL EQUITY Equity attributable to owners of the parent and non-controlling interests
247 First Pacific Annual Report 2017
Financial RatiosADJUSTED NAV PER SHARE Total valuation calculated based on quoted share prices of listed investments and book values of unlisted
investments and Head Office assets and liabilities divided by the number of shares in issue
BASIC EARNINGS PER SHARE Profit attributable to owners of the parent divided by the weighted average number of shares in issue
during the year
CASH INTEREST COVER Dividend and fee income less overhead expense divided by net cash interest expense
CURRENT RATIO Current assets divided by current liabilities
DILUTED EARNINGS PER SHARE Profit attributable to owners of the parent adjusted for the effect of assumed conversion of all dilutive
potential ordinary shares divided by the weighted average number of shares in issue during the year plus the weighted average
number of ordinary shares which would be issued on the assumed conversion of all dilutive potential ordinary shares
DISTRIBUTION/DIVIDEND COVER Recurring profit divided by ordinary share distributions/dividends paid and recommended
DISTRIBUTION/DIVIDEND PAYOUT RATIO Ordinary share distributions/dividends paid and recommended divided by recurring profit
DISTRIBUTION/DIVIDEND YIELD Distributions/dividends per share divided by share price
EBIT MARGIN EBIT divided by turnover
EBITDA MARGIN EBITDA divided by turnover
GEARING RATIO Net debt divided by total equity
GROSS MARGIN Gross profit divided by turnover
INTEREST COVER Profit before taxation (excluding foreign exchange and derivative gains/losses, gain/loss on changes in fair value of
biological assets and non-recurring items) and net finance costs divided by net finance costs
NET CASH FLOWS FROM OPERATING ACTIVITIES PER ORDINARY SHARE Net cash flows from operating activities divided by the weighted
average number of shares in issue during the year
NET TANGIBLE ASSETS PER ORDINARY SHARE Total assets (excluding goodwill and other intangible assets) divided by the number of
shares in issue
RECURRING RETURN ON AVERAGE EQUITY ATTRIBUTABLE TO OWNERS OF THE PARENT Recurring profit divided by average equity
attributable to owners of the parent
RECURRING RETURN ON AVERAGE NET ASSETS Recurring profit divided by average net assets
SHARE PRICE DISCOUNT TO ADJUSTED NAV PER SHARE Shortfall between share price and adjusted NAV per share divided by adjusted
NAV per share
TOTAL ASSETS PER ORDINARY SHARE Total assets divided by the number of ordinary shares in issue
248 First Pacific Annual Report 2017
Glossary of Terms
OtherADR American Depositary Receipts
AGM Annual General Meeting
AUSTRALASIA A region of Oceania, comprises Australia, New Zealand, the island of New Guinea, and neighbouring islands in the
Pacific Ocean
CPO Crude Palm Oil
FFB Fresh Fruit Bunches
GAAP Generally Accepted Accounting Principles
HKAS Hong Kong Accounting Standards
HKFRSs Hong Kong Financial Reporting Standards
HKICPA Hong Kong Institute of Certified Public Accountants
HK(IFRIC)-Int Hong Kong (International Financial Reporting Interpretations Committee) – Interpretation
IDX Indonesia Stock Exchange
IFRS International Financial Reporting Standards
ISO International Organization for Standardization
LISTING RULES The Rules Governing the Listing of Securities on SEHK
LTE Long Term Evolution high speed wireless phone technology
NYSE The New York Stock Exchange
PSE The Philippine Stock Exchange, Inc.
RSS1 Rubber Smoke Sheet 1
SEHK The Stock Exchange of Hong Kong Limited
SGM Special General Meeting
SMS Short Message Service
UHT Ultra High Temperature processing
3D 3 Dimensions
3G The third generation of mobile phone technology
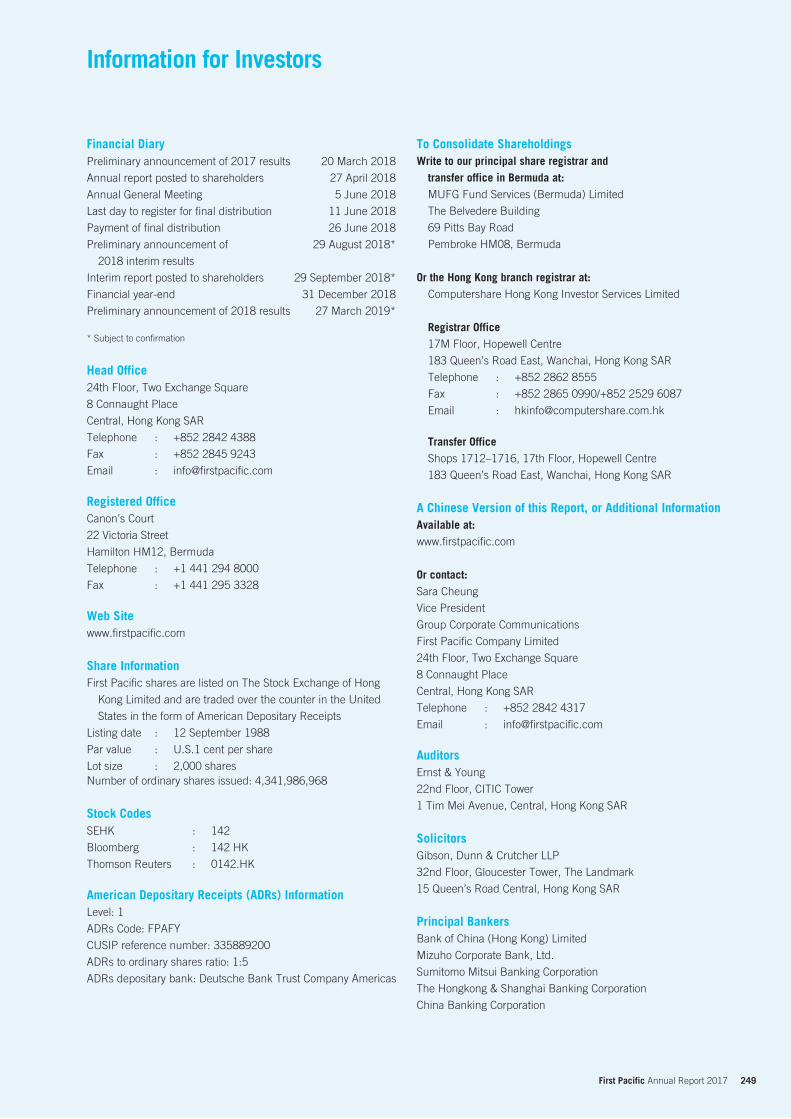
249 First Pacific Annual Report 2017
Information for Investors
Financial DiaryPreliminary announcement of 2017 results 20 March 2018
Annual report posted to shareholders 27 April 2018
Annual General Meeting 5 June 2018
Last day to register for final distribution 11 June 2018
Payment of final distribution 26 June 2018
Preliminary announcement of
2018 interim results
29 August 2018*
Interim report posted to shareholders 29 September 2018*
Financial year-end 31 December 2018
Preliminary announcement of 2018 results 27 March 2019*
* Subject to confirmation
Head Office24th Floor, Two Exchange Square
8 Connaught Place
Central, Hong Kong SAR
Telephone : +852 2842 4388
Fax : +852 2845 9243
Email : [email protected]
Registered OfficeCanon’s Court
22 Victoria Street
Hamilton HM12, Bermuda
Telephone : +1 441 294 8000
Fax : +1 441 295 3328
Web Sitewww.firstpacific.com
Share InformationFirst Pacific shares are listed on The Stock Exchange of Hong
Kong Limited and are traded over the counter in the United
States in the form of American Depositary Receipts
Listing date : 12 September 1988
Par value : U.S.1 cent per share
Lot size : 2,000 sharesNumber of ordinary shares issued: 4,341,986,968
Stock CodesSEHK : 142
Bloomberg : 142 HK
Thomson Reuters : 0142.HK
American Depositary Receipts (ADRs) InformationLevel: 1
ADRs Code: FPAFY
CUSIP reference number: 335889200
ADRs to ordinary shares ratio: 1:5
ADRs depositary bank: Deutsche Bank Trust Company Americas
To Consolidate ShareholdingsWrite to our principal share registrar and
transfer office in Bermuda at:MUFG Fund Services (Bermuda) Limited
The Belvedere Building
69 Pitts Bay Road
Pembroke HM08, Bermuda
Or the Hong Kong branch registrar at:Computershare Hong Kong Investor Services Limited
Registrar Office17M Floor, Hopewell Centre
183 Queen’s Road East, Wanchai, Hong Kong SAR
Telephone : +852 2862 8555
Fax : +852 2865 0990/+852 2529 6087
Email : [email protected]
Transfer OfficeShops 1712–1716, 17th Floor, Hopewell Centre
183 Queen’s Road East, Wanchai, Hong Kong SAR
A Chinese Version of this Report, or Additional InformationAvailable at:www.firstpacific.com
Or contact:Sara Cheung
Vice President
Group Corporate Communications
First Pacific Company Limited
24th Floor, Two Exchange Square
8 Connaught Place
Central, Hong Kong SAR
Telephone : +852 2842 4317
Email : [email protected]
AuditorsErnst & Young
22nd Floor, CITIC Tower
1 Tim Mei Avenue, Central, Hong Kong SAR
SolicitorsGibson, Dunn & Crutcher LLP
32nd Floor, Gloucester Tower, The Landmark
15 Queen’s Road Central, Hong Kong SAR
Principal BankersBank of China (Hong Kong) Limited
Mizuho Corporate Bank, Ltd.
Sumitomo Mitsui Banking Corporation
The Hongkong & Shanghai Banking Corporation
China Banking Corporation
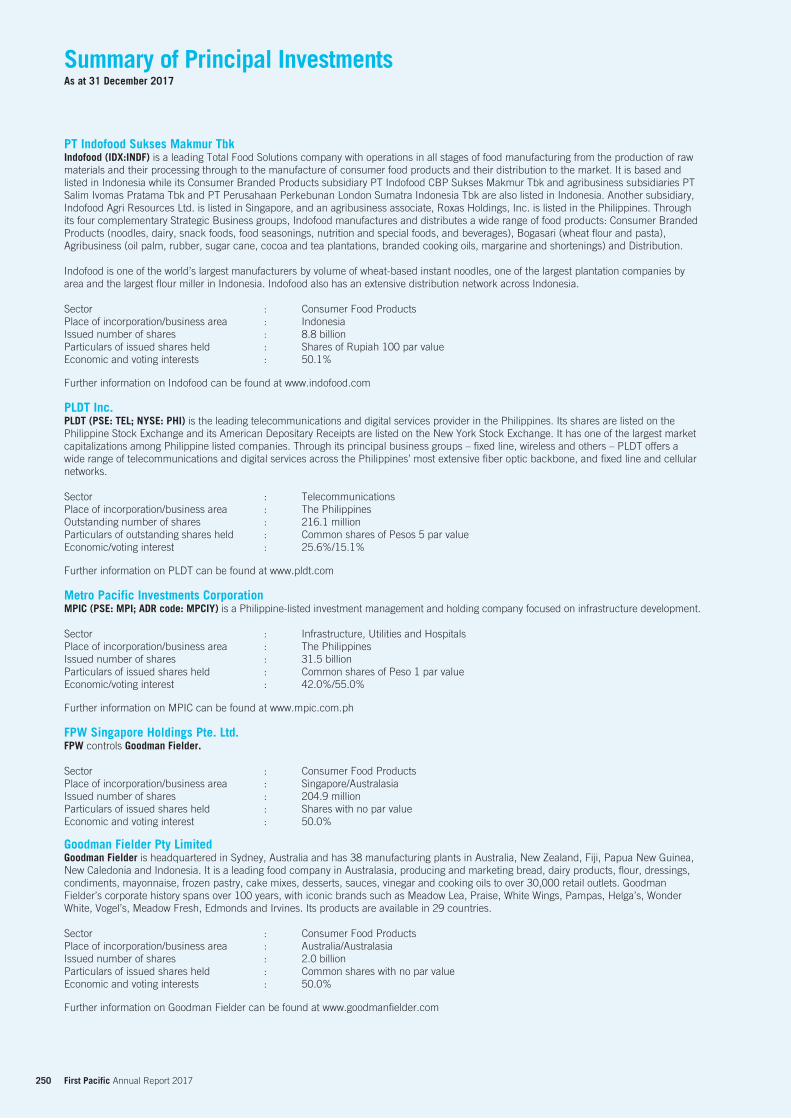
250 First Pacific Annual Report 2017
Summary of Principal InvestmentsAs at 31 December 2017
PT Indofood Sukses Makmur TbkIndofood (IDX:INDF) is a leading Total Food Solutions company with operations in all stages of food manufacturing from the production of raw materials and their processing through to the manufacture of consumer food products and their distribution to the market. It is based and listed in Indonesia while its Consumer Branded Products subsidiary PT Indofood CBP Sukses Makmur Tbk and agribusiness subsidiaries PT Salim Ivomas Pratama Tbk and PT Perusahaan Perkebunan London Sumatra Indonesia Tbk are also listed in Indonesia. Another subsidiary, Indofood Agri Resources Ltd. is listed in Singapore, and an agribusiness associate, Roxas Holdings, Inc. is listed in the Philippines. Through its four complementary Strategic Business groups, Indofood manufactures and distributes a wide range of food products: Consumer Branded Products (noodles, dairy, snack foods, food seasonings, nutrition and special foods, and beverages), Bogasari (wheat flour and pasta), Agribusiness (oil palm, rubber, sugar cane, cocoa and tea plantations, branded cooking oils, margarine and shortenings) and Distribution.
Indofood is one of the world’s largest manufacturers by volume of wheat-based instant noodles, one of the largest plantation companies by area and the largest flour miller in Indonesia. Indofood also has an extensive distribution network across Indonesia.
Sector : Consumer Food ProductsPlace of incorporation/business area : IndonesiaIssued number of shares : 8.8 billionParticulars of issued shares held : Shares of Rupiah 100 par valueEconomic and voting interests : 50.1%
Further information on Indofood can be found at www.indofood.com
PLDT Inc.PLDT (PSE: TEL; NYSE: PHI) is the leading telecommunications and digital services provider in the Philippines. Its shares are listed on the Philippine Stock Exchange and its American Depositary Receipts are listed on the New York Stock Exchange. It has one of the largest market capitalizations among Philippine listed companies. Through its principal business groups – fixed line, wireless and others – PLDT offers a wide range of telecommunications and digital services across the Philippines’ most extensive fiber optic backbone, and fixed line and cellular networks.
Sector : TelecommunicationsPlace of incorporation/business area : The PhilippinesOutstanding number of shares : 216.1 millionParticulars of outstanding shares held : Common shares of Pesos 5 par valueEconomic/voting interest : 25.6%/15.1%
Further information on PLDT can be found at www.pldt.com
Metro Pacific Investments CorporationMPIC (PSE: MPI; ADR code: MPCIY) is a Philippine-listed investment management and holding company focused on infrastructure development.
Sector : Infrastructure, Utilities and HospitalsPlace of incorporation/business area : The PhilippinesIssued number of shares : 31.5 billionParticulars of issued shares held : Common shares of Peso 1 par valueEconomic/voting interest : 42.0%/55.0%
Further information on MPIC can be found at www.mpic.com.ph
FPW Singapore Holdings Pte. Ltd.FPW controls Goodman Fielder.
Sector : Consumer Food ProductsPlace of incorporation/business area : Singapore/AustralasiaIssued number of shares : 204.9 millionParticulars of issued shares held : Shares with no par valueEconomic and voting interest : 50.0%
Goodman Fielder Pty LimitedGoodman Fielder is headquartered in Sydney, Australia and has 38 manufacturing plants in Australia, New Zealand, Fiji, Papua New Guinea, New Caledonia and Indonesia. It is a leading food company in Australasia, producing and marketing bread, dairy products, flour, dressings, condiments, mayonnaise, frozen pastry, cake mixes, desserts, sauces, vinegar and cooking oils to over 30,000 retail outlets. Goodman Fielder’s corporate history spans over 100 years, with iconic brands such as Meadow Lea, Praise, White Wings, Pampas, Helga’s, Wonder White, Vogel’s, Meadow Fresh, Edmonds and Irvines. Its products are available in 29 countries.
Sector : Consumer Food ProductsPlace of incorporation/business area : Australia/AustralasiaIssued number of shares : 2.0 billionParticulars of issued shares held : Common shares with no par valueEconomic and voting interests : 50.0%
Further information on Goodman Fielder can be found at www.goodmanfielder.com
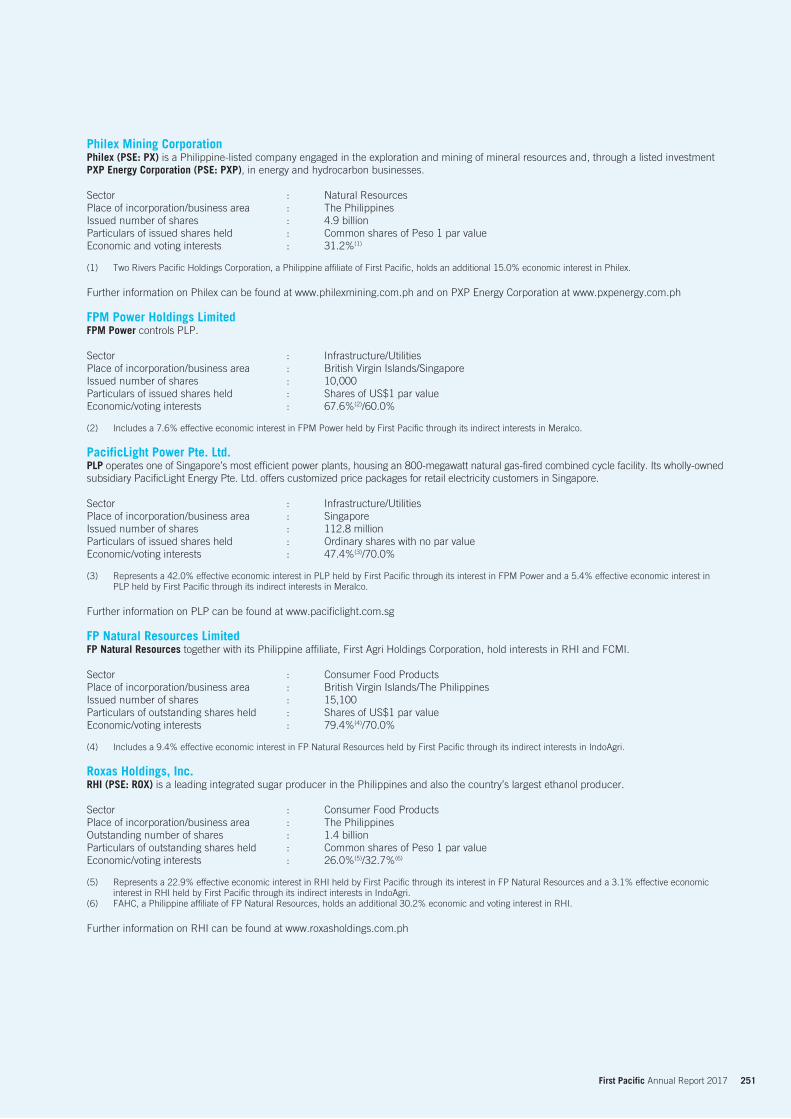
251 First Pacific Annual Report 2017
Philex Mining CorporationPhilex (PSE: PX) is a Philippine-listed company engaged in the exploration and mining of mineral resources and, through a listed investment PXP Energy Corporation (PSE: PXP), in energy and hydrocarbon businesses.
Sector : Natural ResourcesPlace of incorporation/business area : The PhilippinesIssued number of shares : 4.9 billionParticulars of issued shares held : Common shares of Peso 1 par valueEconomic and voting interests : 31.2%(1)
(1) Two Rivers Pacific Holdings Corporation, a Philippine affiliate of First Pacific, holds an additional 15.0% economic interest in Philex.
Further information on Philex can be found at www.philexmining.com.ph and on PXP Energy Corporation at www.pxpenergy.com.ph
FPM Power Holdings LimitedFPM Power controls PLP.
Sector : Infrastructure/UtilitiesPlace of incorporation/business area : British Virgin Islands/SingaporeIssued number of shares : 10,000Particulars of issued shares held : Shares of US$1 par valueEconomic/voting interests : 67.6%(2)/60.0%
(2) Includes a 7.6% effective economic interest in FPM Power held by First Pacific through its indirect interests in Meralco.
PacificLight Power Pte. Ltd.PLP operates one of Singapore’s most efficient power plants, housing an 800-megawatt natural gas-fired combined cycle facility. Its wholly-owned subsidiary PacificLight Energy Pte. Ltd. offers customized price packages for retail electricity customers in Singapore.
Sector : Infrastructure/UtilitiesPlace of incorporation/business area : SingaporeIssued number of shares : 112.8 millionParticulars of issued shares held : Ordinary shares with no par valueEconomic/voting interests : 47.4%(3)/70.0%
(3) Represents a 42.0% effective economic interest in PLP held by First Pacific through its interest in FPM Power and a 5.4% effective economic interest in PLP held by First Pacific through its indirect interests in Meralco.
Further information on PLP can be found at www.pacificlight.com.sg
FP Natural Resources LimitedFP Natural Resources together with its Philippine affiliate, First Agri Holdings Corporation, hold interests in RHI and FCMI.
Sector : Consumer Food ProductsPlace of incorporation/business area : British Virgin Islands/The PhilippinesIssued number of shares : 15,100Particulars of outstanding shares held : Shares of US$1 par valueEconomic/voting interests : 79.4%(4)/70.0%
(4) Includes a 9.4% effective economic interest in FP Natural Resources held by First Pacific through its indirect interests in IndoAgri.
Roxas Holdings, Inc.RHI (PSE: ROX) is a leading integrated sugar producer in the Philippines and also the country’s largest ethanol producer.
Sector : Consumer Food ProductsPlace of incorporation/business area : The PhilippinesOutstanding number of shares : 1.4 billionParticulars of outstanding shares held : Common shares of Peso 1 par valueEconomic/voting interests : 26.0%(5)/32.7%(6)
(5) Represents a 22.9% effective economic interest in RHI held by First Pacific through its interest in FP Natural Resources and a 3.1% effective economic interest in RHI held by First Pacific through its indirect interests in IndoAgri.
(6) FAHC, a Philippine affiliate of FP Natural Resources, holds an additional 30.2% economic and voting interest in RHI.
Further information on RHI can be found at www.roxasholdings.com.ph
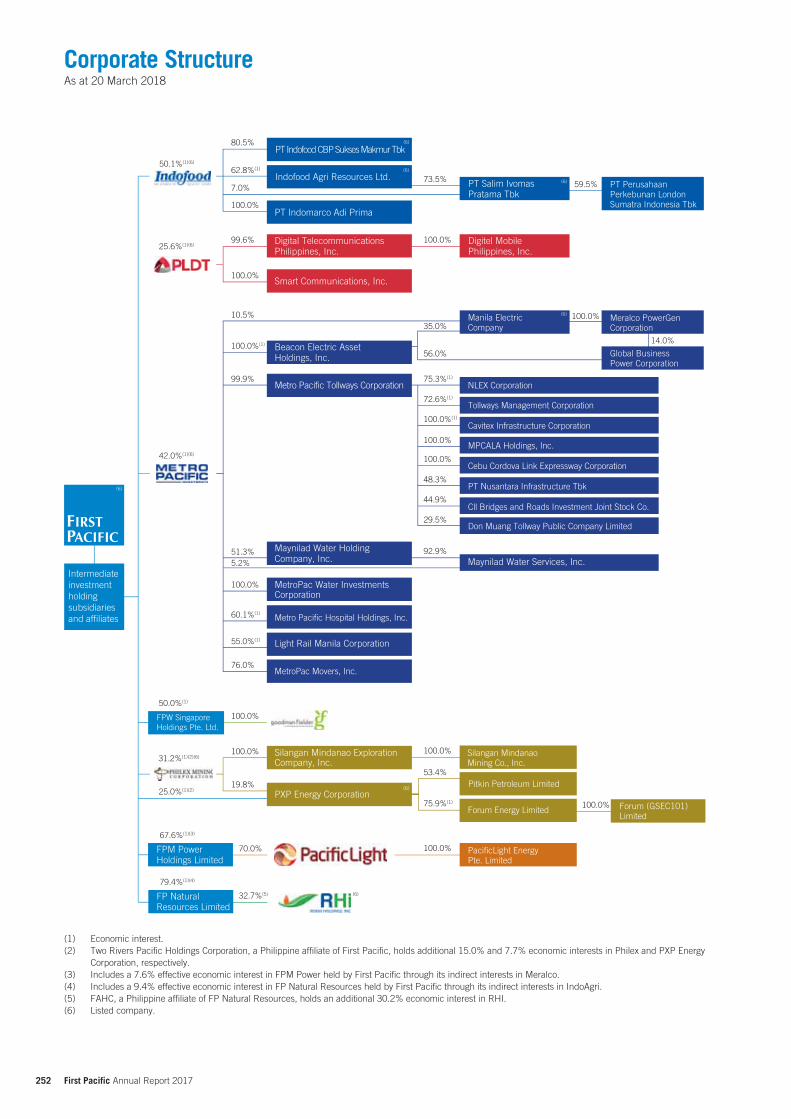
Corporate StructureAs at 20 March 2018
252 First Pacific Annual Report 2017
Intermediate investment holding subsidiaries and affiliates
35.0%
56.0%
100.0%
14.0%
Smart Communications, Inc.
Digital Telecommunications Philippines, Inc.
100.0%
Beacon Electric Asset Holdings, Inc.
Metro Pacific Hospital Holdings, Inc.
Manila Electric Company
25.6%(1)(6)
42.0%(1)(6)
99.6%
100.0%
100.0%(1)
10.5%
Metro Pacific Tollways Corporation99.9%
60.1%(1)
55.0%(1)
76.0%
Light Rail Manila Corporation
MetroPac Movers, Inc.
Global Business Power Corporation
Meralco PowerGen Corporation
73.5%
PT Indomarco Adi Prima
59.5%
50.0%(1)
80.5%
62.8%(1)
7.0%
100.0%
PT Perusahaan Perkebunan London Sumatra Indonesia Tbk
PT Salim Ivomas Pratama Tbk
Digitel Mobile Philippines, Inc.
50.1%(1)(6)
79.4%(1)(4)
FP Natural Resources Limited
PXP Energy Corporation
67.6%(1)(3)
31.2%(1)(2)(6)
PacificLight Energy Pte. Limited
FPM Power Holdings Limited
100.0%
100.0%
19.8%
32.7%(5)
70.0% 100.0%
Silangan Mindanao Mining Co., Inc.
100.0%
100.0%
53.4%
75.9%(1)Forum (GSEC101) Limited
Pitkin Petroleum Limited
Forum Energy Limited
(6)
FPW Singapore Holdings Pte. Ltd.
Silangan Mindanao Exploration Company, Inc.
PT Indofood CBP Sukses Makmur Tbk
Indofood Agri Resources Ltd.
75.3%(1)
100.0%
100.0%
44.9%
29.5%
72.6%(1)
100.0%(1)
Cavitex Infrastructure Corporation
Cebu Cordova Link Expressway Corporation
Don Muang Tollway Public Company Limited
Cll Bridges and Roads Investment Joint Stock Co.
25.0%(1)(2)
48.3%PT Nusantara Infrastructure Tbk
NLEX Corporation
MPCALA Holdings, Inc.
Tollways Management Corporation
Maynilad Water Holding Company, Inc. Maynilad Water Services, Inc.
51.3%
MetroPac Water Investments Corporation
100.0%
5.2%
92.9%
(6)
(6)
(6)
(6)
(6)
(6)
(1) Economic interest.(2) Two Rivers Pacific Holdings Corporation, a Philippine affiliate of First Pacific, holds additional 15.0% and 7.7% economic interests in Philex and PXP Energy
Corporation, respectively.(3) Includes a 7.6% effective economic interest in FPM Power held by First Pacific through its indirect interests in Meralco.(4) Includes a 9.4% effective economic interest in FP Natural Resources held by First Pacific through its indirect interests in IndoAgri.(5) FAHC, a Philippine affiliate of FP Natural Resources, holds an additional 30.2% economic interest in RHI.(6) Listed company.
(Incorporated with limited liability under the laws of Bermuda)
A Chinese version of this report is available at www.firstpacific.com or from the Company on request.本報告之中文版可瀏覽 www.firstpacific.com 或向本公司索取。
This report is printed on environmentally friendly paper.Concept and design: iOne Financial Press Limited
24/F, Two Exchange Square8 Connaught PlaceCentral, Hong Kong SARTelephone: +852 2842 4388Email: [email protected]: www.firstpacific.com


![Company Presentation [Company Update]](https://img.pdfslide.tips/doc/110x75/577cb1c71a28aba7118bdd5f/company-presentation-company-update.jpg)