Embed Size (px)
Citation preview

NEW YORK CITY WATER BOARD
PUBLIC INFORMATION REGARDING WATER AND WASTEWATER RATES
APRIL 2009

1
Table of Contents
INTRODUCTION Introductory Statement……………………………………………………………… pg. 2 DEP Capital Program Overview…………………………………………………… pg. 5 Schedule of Borough Rate Hearings……………………………………………. pg. 8 Program Summary……………………………………………………………………… pg. 9 Rate Advisor’s Conclusions………………………………………………………… pg. 10 Rate Adoption Process……………………………………………………………….. pg. 11 Water Board Rate Objectives……………………………………………………… pg. 12 APPENDIX Description of Water System……………………………………………………… pg. 14 Description of Wastewater System……………………………………………. pg. 15 Operating Relationships of Water/Wastewater System……………… pg. 16 Federal & State Water/Wastewater Aid (1982-2008)…………………. pg. 17 New York City Water/Wastewater Rate History…………………………. pg. 18 Anticipated System Costs: FY2009 vs. FY2010…………………………….. pg. 19 Anticipated System Costs and Expenditures (FY2010)………………… pg. 20 Capital Improvement Program by Project Type…………………………. pg. 21 Capital Improvement Program by Project Category……………………. pg. 23 Typical New York City Charges……………………………………………………. pg. 25 Annual Residential Charges (2009)…………………………………………….. pg. 26 Annual Commercial Charges (2009)……………………………………………. pg. 27 Annual Industrial Charges (2009)……………………………………………….. pg. 28
2
Introductory Statement The New York City Water Board ("the Board") has prepared this information booklet to acquaint the public with its rate proposals for Fiscal Year 2010 (“FY2010”) and with the financial condition of the water and wastewater system (the “System”) and its budget for the upcoming year. Public hearings concerning the rate proposal set forth herein will be held in each borough of the City. The schedule of the dates, times and locations for these hearings, the purpose of which is to present and explain the Board’s proposal and provide an opportunity for public comment, is included in this information booklet. New York City has one of the best water and wastewater systems in the world. Each day, it delivers more than 1 billion gallons of fresh, clean, high-quality drinking water to more than 8 million city residents and conveys 1.3 billion gallons of wastewater and stormwater to 14 in-city water pollution control plants with treatment processes so rigorous that New York Harbor is now cleaner than it has been in a century. Much of this system was built decades ago and to such high standards that it has performed without interruption ever since. Nevertheless, our historic infrastructure is aging, and as New York looks to the future, a renewed era of capital investment is necessary to ensure that these systems can support an additional population of 1 million people by 2030 and that they remain viable for generations to come. Sustaining this new era of investment is particularly important as fiscal pressures increase, so that we can assure there is no interruption in the quality of the services we provide. Though these investments are critical to the long-term viability of our system, the way we pay for these investments has changed dramatically over time. In particular, over the last decade unfunded federal and state mandates have become the single largest driver of our capital budget and therefore the rate. During the 1970s and 1980s, when the city was upgrading our wastewater treatment plants to meet rigorous new water quality standards, the same regulatory agencies mandating this multi-billion dollar work were also helping to pay for it. Since then, mandates have only become more stringent and projects more costly, but federal and state aid has all but disappeared. New York City is now left to finance its critical water and sewer projects almost entirely through water and sewer fees paid by 833,000 customers citywide. For example, the upgrade of Newtown Creek, one of the largest capital projects in the city’s history, is a mandated project. During the last significant period of wastewater investment, approximately 90% of this project's cost would have been borne by the federal and State governments, but instead it has been almost entirely funded by ratepayers.

3
As a result, we have had to take on increasing amounts of debt to finance new projects like the upgrade of the Newtown Creek Wastewater Treatment Plant. Debt service on our capital program is now the single largest driver of water and sewer rates, and recent rate increases are a direct result of debt service from the period between 2000 and 2008, when approximately 75% of DEP’s capital spending was driven by federal and State mandates. Over the 5 years from FY2008 to FY2012, spending on mandated projects will diminish, but will still account for almost half of DEP’s capital budget. The mandated projects being undertaken will ultimately be critical components of our water and wastewater system, but the costs of these projects are enormous. Largely as a result of these continuing trends, water and sewer rates have risen consistently in recent years. Similarly, this year the Water Board is proposing a 14% increase in water and sewer rates, which is consistent with what we projected last year at this time. In addition to debt service from our capital program, this rate increase is also due in part to unforeseen increases in our operating budget, approximately 75% of which is non-discretionary, as well as a dramatic 6% decline in consumption that may be the result of the current economic downturn. If this trend continues, consumption in FY2009 will be the lowest in 25 years, and already this decline has had a substantial impact on revenues. The Water Board and the Department of Environmental Protection (DEP) have always worked to mitigate these increases whenever possible, recognizing the financial pressures that all city residents face. As such, despite increasing system costs and rates, water rates in New York City are still near the national average. In addition, over the past two years DEP has worked to transform and improve its Bureau of Customer Service, in order to target delinquent customers, collect long overdue revenue and provide customers with more reliable and accurate billing information. Many of these initiatives are ongoing, but serious delinquencies have declined by nearly 15% since 2008, and we are considering a rate increase that is consistent with what was projected more than a year ago – prior to any indications of an economic recession. This decline in delinquencies is largely attributable to the effectiveness of DEP’s new enforcement techniques, including stand-alone lien sales – which last year, combined with a Payment Incentive Program, brought in $98.6 million in revenue – service shut-offs and automated outbound calling. DEP is also currently installing Automated Meter Reading (AMR) technology citywide, which will provide accurate billing information and reduce the likelihood and frequency of customer disputes. In other cities that have implemented AMR in conjunction with robust enforcement tools, collection rates have surged as high as 99%. A similar increase in New York City could increase revenues substantially.

4
This year’s proposed 14% increase is necessary to cover the costs of operating the city’s world class water and wastewater systems. Particularly in a time of economic downturn, it is important to keep this system fully funded, both to maintain the system in good repair, and to avoid even greater rehabilitation costs in the future. The Water Board has worked with DEP to diligently scrutinize all agency costs and increase efficiency wherever possible – the current anticipated costs are necessary to keep our system operating at the standards expected by our regulators and by our customers.
5
DEP Capital Program Overview Since 2002, DEP’s capital program has totaled $21 billion and provided for key water quality and water supply projects. As a result of this investment, in 2007 the City was granted an historic ten-year Filtration Avoidance Determination, or FAD, for 90% of its water supply and harbor water quality is now at its best in over 100 years, based on 100 years of scientific sampling data. The $17.5 billion in funding outlined in the agency’s current 11-year capital plan (FY2010 – FY2019) will only continue these successes. The Third Water Tunnel, the Croton Water Filtration Plant, the Ultra Violet Treatment Plant, land acquisition and infrastructure support for the FAD, sweeping changes to the Newtown Creek Waste Water Treatment Plant, and preparation to fix the Delaware Aqueduct are just a few of the agency’s significant on-going projects. These projects will ensure that the city’s water and sewer system can support an additional population of one million people by 2030 and remain viable for generations to come. $4.3 billion to Ensure the Integrity of the Wastewater Treatment Plants (WWTPs) in the City (less CSOs) DEP’s fourteen wastewater treatment plants each day treat a combined 1.3 billion gallons of wastewater, safely removing pathogens to protect the health of millions of New Yorkers. The effectiveness of these plants is evidenced by the fact that New York Harbor is now at its cleanest level in a century. As with most of our infrastructure, DEP has had to invest in these aging treatment plants to ensure that they continue to provide a high level of service. The majority of the funds in the current plan are necessary to maintain these facilities in a state of good repair, and to maintain compliance with all state and federal water quality standards and environmental health and safety regulations. $2.2 billion for Dependability/Alternative Sources Program Every day, the New York City water supply system conveys approximately one billion gallons of water to eight million New Yorkers and an additional one million customers in Westchester, Putnam, Ulster and Orange counties. This system has served New York City for generations: the infrastructure that conveys drinking water from the Catskill and Delaware watersheds to New York City has been in continuous operation since they were activated in 1915 and 1944, respectively. Nevertheless, our historic infrastructure is aging, and as New York looks to the future, a renewed era of capital investment is necessary to ensure that these systems can support an additional population of 1 million people by 2030 and that they remain viable for generations to come. To develop a strategic plan for the future of New York City’s water supply infrastructure, DEP has initiated a comprehensive Dependability Study. A critical component of

6
this work will involve repairs to the 85-mile long Delaware Aqueduct, the longest continuous tunnel in the world, which has had a stable leak since the 1980s. DEP has already taken preliminary steps to plan for the repair of the tunnel, and the current plan provides funding for additional work that will inform this repair. $1.9 billion to Protect Upstate Watersheds (less the Catskill/Delaware UV Facility) New York City drinking water is among the best in the world, and DEP invests a considerable amount to protect it at its source. These efforts include rehabilitating old infrastructure, working with local farmers to reduce pollution, and acquiring watershed land to act as an ecological buffer against potential contamination, and together they ensure that New York City’s water remains among the best in the world. In 2007, this work was recognized at the federal level when the Environmental Protection Agency (EPA) granted the city a 10-year Filtration Avoidance Determination (FAD) for the Catskill and Delaware water supply systems. This FAD, double the length of the previous one the city had received, acknowledged that New York has one of the most comprehensive urban watershed protection programs in the world. New York remains one of only five large cities in the United States that does not have to filter the majority of its drinking water. $1.3 billion to Decrease the Amount of Untreated Sewage Released into the Harbor from Combined Sewer Overflows (CSOs) To enhance the quality of the city’s waterways and advance the PlaNYC goal of opening 90% of these waterways to recreation by 2030, New York City is building facilities to control and capture combined sewer overflows (CSOs). CSOs occur during wet weather, when the city’s water pollution control plants cannot treat all of the combined stormwater and sanitary waste flowing through the sewer system, causing the discharge of a portion of the untreated flow into open waters. CSOs contribute to the floatable trash, debris, oils, grease, and bacteria in the waterways of New York Harbor. To better control this problem, DEP is implementing large infrastructure solutions, such as CSO retention tanks, sewer modifications and treatment plant upgrades, as well as sustainable stormwater management practices, such as tree pits, rain barrels and permeable pavements, all of which capture and divert stormwater before it overwhelms the sewers. $640 million to Complete Stage II of the Third Water Tunnel The Third Water Tunnel is one of the largest civil engineering projects in the Western Hemisphere and when complete, it will afford the City a critical redundancy that it does not now enjoy: the ability to close down and inspect City Tunnels 1 and 2, which have been in continuous operation since they were activated in 1917 and 1935, respectively. The current capital plan provides funding for the supply shafts of the Manhattan section of City Tunnel Three Stage 2 to be integrated with the city’s existing distribution system.

7
$538 million for the continued construction of a Filtration Plant for the Croton Water System Ten percent of the City’s water comes from the Croton reservoir system, which is located in Westchester, Putnam, and Dutchess counties. To ensure that Croton system water is at all times protected against microbiological contamination and meets all drinking water quality standards, the City is constructing a filtration plant beneath Van Cortland Park in the Bronx. New York City is not required to filter water from its Catskill and Delaware watersheds, which operate under a Filtration Avoidance Determination from EPA. Site preparation for the Croton plant began in 2004, and there are now more than 1,000 construction personnel onsite working to complete construction by October of 2011. Once complete, the filtration plant will enable the City to receive as much as 30% of its water from the Croton watershed, and will ensure the long-term viability of this critical water supply system. $433 million for the continued construction of an Ultraviolet (UV) Light Disinfection Facility for the Catskill and Delaware Water Supplies (part of the cost is for the CAT/DEL Pressurization & Bypass Chambers) The City has begun construction of an ultraviolet (UV) light disinfection facility for the Catskill and Delaware water supplies. This facility, located in Westchester County, is being built in accordance with the City’s 10-year Filtration Avoidance Determination (FAD) and will meet or exceed the goals of the Safe Drinking Water Act. Once operational, this facility will be able to disinfect as much as 2.4 billion gallons of water per day and provide an additional barrier of microbiological protection by inactivating potentially harmful organisms, such as Cryptosporidium and Giardia. Site preparation for this facility began in 2006, and facility construction started in January 2008. $207 million to Build the Staten Island Bluebelt System and the Connecting New Storm Sewers “Bluebelts” are streams, ponds and other wetland areas that are preserved so they can naturally convey, store and filter storm water. They also provide flood protection, important community spaces and wildlife habitats. New York City’s Bluebelt system drains 10,000 acres of land on Staten Island, and eliminates the need for more expensive storm sewer networks. In August 2003, Mayor Bloomberg announced an expansion in the program to include the mid-Island watersheds of New Creek, South Beach and Oakwood Beach. DEP has acquired 47 of the 70 privately owned acres needed for the New Creek Bluebelt. The New Creek Bluebelt system will provide improved drainage for approximately 2,100 acres of tributary area, serving the neighborhoods of Midland Beach, Grant City and Todt Hill. Phase 1 of the South Beach Bluebelt was acquired in May of 2008. Seven acres were acquired in that phase, leaving 33 acres remaining to be acquired. The South Beach Bluebelt serves a watershed area of about 1,400 acres. The first phase of acquisition for the Oakwood Beach Bluebelt is scheduled for May 2009.

8
Schedule for Water Board Rate Adoption April 3, 2009: Water Board meeting to approve Public Notice of FY10 14% rate increase
Rate Hearing Dates and Locations
Borough
Location
Date/Time
Queens
Department of Environmental Protection Lecture Room, 6th Floor 59-17 Junction Boulevard Flushing, NY 11373
Monday April 27, 2009 10:00 AM
Staten Island
College of Staten Island Center for the Arts, Recital Hall 2800 Victory Boulevard Staten Island, NY 10314
Monday April 27, 2009 7:00 PM
Bronx Bronx Library Center 310 East Kingsbridge Road Bronx, NY 10458
Tuesday April 28, 2009 2:00 PM
Brooklyn
Brooklyn College Student Center-Alumni Lounge (opposite Whitehead Hall) East 27th Street and Campus Road Brooklyn, NY 11210
Wednesday April 29, 2009 6:00 PM
Manhattan
St. John’s University - Manhattan Auditorium 101 Murray Street New York, NY 10007
Thursday April 30, 2009 5:30 PM
May 15, 2009: Water Board Meeting to adopt rates for Fiscal Year 2010
22 Reade Street Spector Hall NY, NY 10007 8:30 AM
June 2009: Flat-Rate Bills are mailed July 1, 2009: Fiscal Year 2010 rates become effective

9
Program Summary FY 2010 Rate Proposal Increase in-City water rates by 14% for all customers, flat-rate and metered, and for
billing programs Maintain in-City wastewater rates at 159% of water charges
FY 2010 Billing Policy Proposals and Changes to Miscellaneous Fees Extension of Frontage Transition Program The Frontage Transition Program for Residential Premises with Six or More Dwelling Units will be extended through the end of FY2012. Modifications to Denial of Access Regulations The Board’s existing Regulation No. 3, Discontinuance of Water Supply and/or Sewer Service for Denial of Access, will be amended to conform to changes made last year in the Board’s Regulation No. 2, Discontinuance of Water Supply and/or Sewer Service Because of Non-Payment, including among other matters, reducing the notice period from 45 days to 15 days. As part of these modifications, new charges will be added to the Rate Schedule to be assessed on properties where customers fail to provide or facilitate access to their premises to enable DEP to inspect, test, repair or replace a property’s connections to the water system, water meters, water consumption measurement devices and appurtenant equipment. New charges will consist of a $250 account administration fee and water/sewer consumption charges based on an attributed consumption formula related to property class and meter size. Consideration of a New Regulation Regarding Theft of Services A new Regulation No. 4, Theft of Services, will be considered. Under this proposed regulation, new charges will be added to the Rate Schedule to be assessed on properties where DEP makes a theft of services determination. New charges will consist of a $650 account administration fee and water/sewer consumption charges based on an attributed consumption formula related to property class and meter size.

10
Rate Advisor’s Conclusions
• The 14% increase in water rates and charges proposed by the Board will yield anticipated revenues for Fiscal Year 2010 that are sufficient to cover the expected costs of providing water service and wastewater service.
• Though the ratio of wastewater system costs to water system costs has declined somewhat in recent years due to ongoing investments to protect the quality of the City’s water supply, scheduled investments in the capital improvement program for rehabilitation and construction of wastewater treatment facilities and other projects will cause the ratio of wastewater system costs to increase in the future. Accordingly, the long-term ratio of wastewater system costs to water system costs is reasonable compared to the current ratio of wastewater charges to water charges.
• The billing policy and regulatory proposals advanced by the Board, including the imposition of new charges for Theft of Services and Denial of Access, are reasonable and are not inconsistent with practices in other jurisdictions.

11
Process for Water Board Rate Adoption
The Board must adopt rates which will satisfy the revenue requirements of the System
The Water Finance Authority projects revenue bond debt service on bonds issued after
1986 to finance water and wastewater capital projects and certifies the FY2010 amount to the Water Board
The City Office of Management and Budget projects the Water and Wastewater
Systems’ operating and maintenance expenses and certifies the FY2010 amount to the Water Board based on the Mayor’s Executive Budget
The System’s consulting engineer must certify that expenses are reasonable and
appropriate The Board must hold a public hearing in each borough of New York City
At its Annual Meeting in May, the Board adopts an Annual Budget based on the system
expenses that have been certified to it and adopts a rate which will produce sufficient revenues to meet those expenses

12
Objectives of the Water Board in Establishing Rates and Charges
Sufficient revenues must be raised by rates and charges and other sources of revenue in
order to satisfy the revenue requirements of the Water System and the Wastewater System
Rates and charges should be equitable and fair, in the sense that charges levied on
different users reflect, as closely as practicable, the costs incurred in providing water and wastewater services.
The rate structure, both present and long term, should provide a reasonably stable and
predictable flow of revenue The rate structure should be relatively simple and easy to administer
The rate structure should be understandable to the customer

13
APPENDICES

14
Description of the Water and Wastewater Systems
The Water System DEP supplies water to over eight million people in New York City in an area of over 300 square miles. The City also provides water to approximately one million additional residents of four upstate counties. Water for the system is derived from three upstate watersheds (the Croton, Catskill and Delaware). These three upstate systems include 19 reservoirs and three controlled lakes with a storage capacity of approximately 550 billion gallons. In Fiscal Year 2009, the water system provided an average of 1.08 billion gallons per day to in-City and upstate customers. On summer days when demand is at its highest, the surface water system has provided over 1.5 billion gallons per day. Water is conveyed to the City through large aqueducts and balancing reservoirs, and is delivered to the city almost entirely by gravity. Within the City, water is distributed through two major tunnels – Tunnel Nos. 1 and 2. A third tunnel is now under construction and is being built in phases. The first stage went into operation in July 1998. Tunneling on the Manhattan portions of Stage II was finished in 2006, with activation expected in 2013. Once it is fully operational, Tunnel No. 3 will allow for the first-ever shut down, inspection and repair of City Water Tunnels No. 1 and 2. The in-city water distribution system consists of a grid network of over 6,000 miles of pipe, as well as valves, fire hydrants, distribution facilities, gatehouses, pump stations and maintenance and repair yards. Various facilities provide storage to meet the hourly fluctuations in demand for water throughout the City, as well as any sudden increase in demand that might arise from fire or other emergencies.

15
The Wastewater System The Wastewater System consists of 6,600 miles of sewers that convey wastewater and stormwater to 14 in-city treatment plants. Sewers in New York City are classified as one of three types: sanitary, storm or combined. Sanitary sewers accommodate household and industrial waste; storm sewers carry rainwater and surface water runoff; and combined sewers carry both types of waste. Approximately 70% of the City’s sewers are classified as the combined type. In addition to sewers, the wastewater collection system includes catch basins and seepage basins, which prevent flooding and sewer backups. The 14 treatment plants have the capacity to treat approximately 1.8 billion gallons of wastewater per day. Typically, the city produces 1.3 billion gallons per day of dry-weather sewage. During periods of heavy rainfall, however, a combination of stormwater and sewage might bypass treatment and be released into the surrounding waterways since there may not be sufficient capacity to treat or retain all of the wastewater carried by the sewer system. Other facilities related to the treatment of sewage include combined sewer overflow retention facilities, wastewater pump stations, sewer regulators and tide gates, laboratories, sludge dewatering facilities and inner-harbor vessels which transport sludge between facilities.

16
SETS RATES
WATER & SEWER SYSTEM CUSTOMERS
NYC WATER BOARD
BONDHOLDERS
FEES &
CHA
RGES
CIPPAYMENTS*
BON
DPRO
CEEDS
DEBT
SERVICE
213
WATER FINANCE AUTHORITY NEW YORK CITY
DEPARTMENT OFENVIRONMENTAL
PROTECTION
2
1
3
Payments for Debt Service & Reserve Requirements
Costs of System Operations & Maintenance
Rental Payment
*CIP = Capital Improvement Plan

17
0
50
100
150
200
250
300
350
1982
1984
1986
1988
1990
1992
1994
1996
1998
2000
2002
2004
2006
2008
$ in
Mill
ions
Year
Total Water & Wastewater Federal and State Grants Received (1982-2008)

18
New York City Water/Wastewater Rate History
0
5
10
15
20
25
30
19881989
19901991
19921993
19941995
19961997
19981999
20002001
20022003
20042005
20062007
20082009
2010
Year
Perc
ent I
ncre
ase
(Yea
r to
Yea
r)
New York City Water/Wastewater Rate History
0
5
10
15
20
25
30
19881989
19901991
19921993
19941995
19961997
19981999
20002001
20022003
20042005
20062007
20082009
2010
Year
Perc
ent I
ncre
ase
(Yea
r to
Yea
r)

19
$0
$500
$1,000
$1,500
$2,000
$2,500
$3,000
Current FY2009 FY2010
Revenue Bond Debt Service Board/Authority Expenses NYC O&M
Rental Payment Current Capital Contribution
$0
$500
$1,000
$1,500
$2,000
$2,500
$3,000
Current FY2009 FY2010
Revenue Bond Debt Service Board/Authority Expenses NYC O&M
Rental Payment Current Capital Contribution
Total Cost:$2,180 Billion
Total Cost:$2,623 Billion
Projected Water/Wastewater System Costs($s in millions)
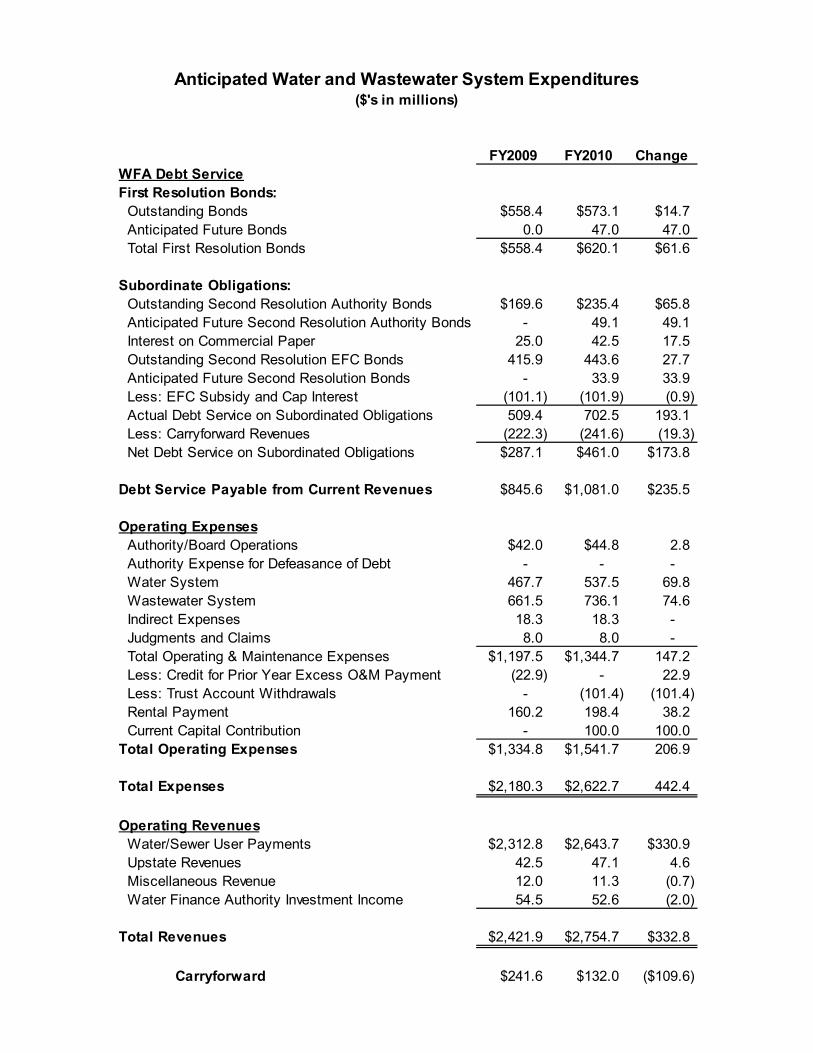
FY2009 FY2010 ChangeWFA Debt ServiceFirst Resolution Bonds: Outstanding Bonds $558.4 $573.1 $14.7 Anticipated Future Bonds 0.0 47.0 47.0 Total First Resolution Bonds $558.4 $620.1 $61.6
Subordinate Obligations: Outstanding Second Resolution Authority Bonds $169.6 $235.4 $65.8 Anticipated Future Second Resolution Authority Bonds - 49.1 49.1 Interest on Commercial Paper 25.0 42.5 17.5 Outstanding Second Resolution EFC Bonds 415.9 443.6 27.7 Anticipated Future Second Resolution Bonds - 33.9 33.9 Less: EFC Subsidy and Cap Interest (101.1) (101.9) (0.9) Actual Debt Service on Subordinated Obligations 509.4 702.5 193.1 Less: Carryforward Revenues (222.3) (241.6) (19.3) Net Debt Service on Subordinated Obligations $287.1 $461.0 $173.8
Debt Service Payable from Current Revenues $845.6 $1,081.0 $235.5
Operating Expenses Authority/Board Operations $42.0 $44.8 2.8 Authority Expense for Defeasance of Debt - - - Water System 467.7 537.5 69.8 Wastewater System 661.5 736.1 74.6 Indirect Expenses 18.3 18.3 - Judgments and Claims 8.0 8.0 - Total Operating & Maintenance Expenses $1,197.5 $1,344.7 147.2 Less: Credit for Prior Year Excess O&M Payment (22.9) - 22.9 Less: Trust Account Withdrawals - (101.4) (101.4) Rental Payment 160.2 198.4 38.2 Current Capital Contribution - 100.0 100.0 Total Operating Expenses $1,334.8 $1,541.7 206.9
Total Expenses $2,180.3 $2,622.7 442.4
Operating Revenues Water/Sewer User Payments $2,312.8 $2,643.7 $330.9 Upstate Revenues 42.5 47.1 4.6 Miscellaneous Revenue 12.0 11.3 (0.7) Water Finance Authority Investment Income 54.5 52.6 (2.0)
Total Revenues $2,421.9 $2,754.7 $332.8
Surplus Carryforward $241.6 $132.0 ($109.6)
Anticipated Water and Wastewater System Expenditures($'s in millions)

21
2009 2010 2011 2012 2013 2009-2013Water Pollution Control 1,535,757 815,049 314,571 442,159 383,695 3,491,231Water Supply 358,984 95,975 190,690 185,754 432,168 1,263,571Water Mains 917,727 530,876 1,045,375 431,782 474,101 3,399,861Sewers 208,214 142,357 272,211 192,476 279,241 1,094,499Equipment 220,967 59,021 73,070 77,881 68,969 499,908
TOTAL 3,241,649 1,643,278 1,895,917 1,330,052 1,638,174 9,749,070
2014 2015 2016 2017 2018 2019 2010-2019 2009-2019Water Pollution Control 352,172 369,332 482,865 197,140 417,790 247,457 4,022,230 5,557,987Water Supply 611,789 221,128 136,007 828,388 351,475 644,080 3,697,454 4,056,438Water Mains 192,169 290,790 392,886 132,609 107,719 117,809 3,716,116 4,633,843Sewers 311,255 269,590 257,541 257,857 166,820 144,044 2,293,392 2,501,606Equipment 64,810 18,662 35,967 95,810 113 15,838 510,141 731,108
TOTAL 1,532,195 1,169,502 1,305,266 1,511,804 1,043,917 1,169,228 14,239,333 17,480,982
Capital Improvement Program: FY09-19Investment Allocation by Project Type

22
0
500,000
1,000,000
1,500,000
2,000,000
2,500,000
3,000,000
3,500,000
2009 2010 2011 2012 2013 2014 2015 2016 2017 2018 2019
Water Pollution Control Water Supply Water Mains Sewers Equipment
Capital Improvement Program: FY09-19Investment Allocation by Project Type
0
500,000
1,000,000
1,500,000
2,000,000
2,500,000
3,000,000
3,500,000
2009 2010 2011 2012 2013 2014 2015 2016 2017 2018 2019
Water Pollution Control Water Supply Water Mains Sewers Equipment
Capital Improvement Program: FY09-19Investment Allocation by Project Type

23
2009 2010 2011 2012 2013 2009-2013Mandated Projects 1,491,066 871,676 396,538 251,212 239,727 3,250,219Safety Compliance 288,867 164,873 515,291 297,780 215,402 1,482,213Dependability 464,892 171,382 295,598 240,571 435,652 1,608,095Operations 950,591 380,667 643,247 517,055 715,599 3,207,159Other 46,233 54,680 45,243 23,434 31,794 201,384
TOTAL 3,241,649 1,643,278 1,895,917 1,330,052 1,638,174 9,749,070
2014 2015 2016 2017 2018 2019 2010-2019 2009-2019Mandated Projects 249,031 116,135 429,064 49,504 260,714 146,966 3,010,567 4,501,633Safety Compliance 268,918 0 1,586 77,000 250,000 0 1,790,850 2,079,717Dependability 377,045 373,544 246,815 828,416 109,663 643,598 3,722,284 4,187,176Operations 610,645 678,989 611,917 555,950 422,590 377,700 5,514,359 6,464,950Other 26,556 834 15,884 934 950 964 201,273 247,506
TOTAL 1,532,195 1,169,502 1,305,266 1,511,804 1,043,917 1,169,228 14,239,333 17,480,982
Capital Improvement Program: FY09-19Investment Allocation by Project Category

24
0
500,000
1,000,000
1,500,000
2,000,000
2,500,000
3,000,000
3,500,000
2009 2010 2011 2012 2013 2014 2015 2016 2017 2018 2019
Mandated Projects Safety Compliance Dependability Operations Other
Capital Improvement Program: FY09-19Investment Allocation by Project Category
0
500,000
1,000,000
1,500,000
2,000,000
2,500,000
3,000,000
3,500,000
2009 2010 2011 2012 2013 2014 2015 2016 2017 2018 2019
Mandated Projects Safety Compliance Dependability Operations Other
Capital Improvement Program: FY09-19Investment Allocation by Project Category

25
$94.18 $774 $680 Multifamily Unit (85,000 gallons)
$110.80 $911 $800 Single Family (100,000 gallons)
Average Annual Charges Typical Metered Charges
$0.83 $6.81 $5.98 Combined
$0.51 $4.18 $3.67 Wastewater
$0.32 $2.63 $2.31 Water
Rates Per 100 Cubic Feet Metered Customers
$102 $831 $729 Charge Per Dwelling Unit
$6,740 $54,883 $48,143 Elevator Apartments
$90 $734 $643 Charge Per Dwelling Unit
$599 $4,877 $4,278 Walk-Up Apartments
Unmetered Transition Accounts
Change FY2010 Average FY2009 Average
Typical New York City Charges FY 2010 (with Proposed 14% Rate Increase)

26
= 2009 24 city average ($889)
Annual Water/Wastewater Charges2009 Residential
Annual charges for all cities based on consumption of 100,000 gallons.
$0$200$400$600$800
$1,000$1,200$1,400$1,600$1,800$2,000
Chicago
Milw
auke
e
San Anto
nio
Newark
Indianapolis
Detroit
St. Lo
uis
Houston
Dallas
Baltim
ore
San Jo
se
New York
Jackso
nville
Los A
ngeles
Wash
ington, D
.C.
New Orle
ans
Columbus
Cleveland
Honolulu
San D
iego
Boston
Philadelphia
San Fr
ancisco
Atlanta
Dol
lars
per
yea
r
NYC Charge w/ Increase = $911

27
Annual Water/Wastewater Charges2009 Commercial
Annual charges for all cities based on consumption of 1 million gallons. = 2009 24 city average ($8,298)
$0$2,000$4,000$6,000$8,000
$10,000$12,000$14,000$16,000$18,000$20,000$22,000
Chicago
Dallas
Indianapolis
St. Lo
uis
Milw
auke
e
San Anto
nio
Newark
Detroit
Baltim
ore
San Jo
se
Jackso
nville
Houston
Los A
ngeles
New York
New Orle
ans
Columbus
Philadelphia
Wash
ington, D
.C.
San D
iego
Cleveland
Honolulu
Boston
San Fr
ancisco
Atlanta
Dol
lars
per
yea
r
NYC Charge w/Increase = $9,119
28
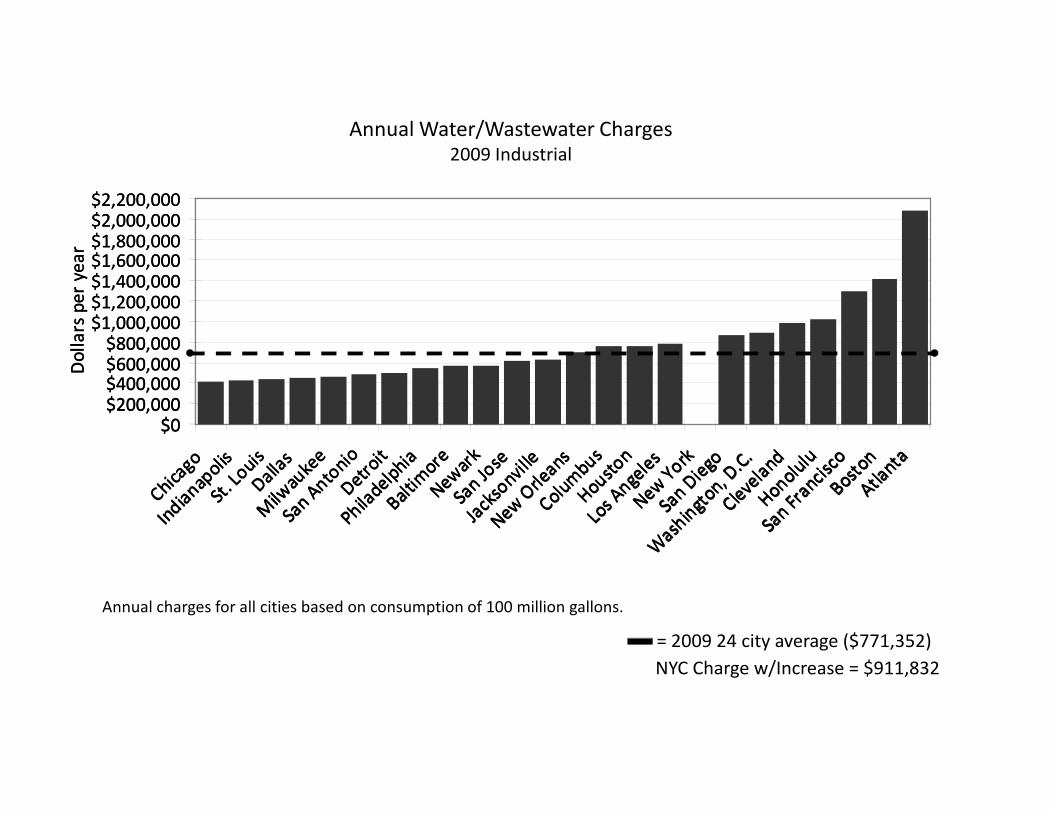
Annual Water/Wastewater Charges2009 Industrial
Annual charges for all cities based on consumption of 100 million gallons.
$0$200,000$400,000$600,000$800,000
$1,000,000$1,200,000$1,400,000$1,600,000$1,800,000$2,000,000$2,200,000
Chicago
Indianapolis
St. Lo
uis
Dallas
Milw
auke
e
San Anto
nio
Detroit
Philadelphia
Baltim
ore
Newark
San Jo
se
Jackso
nville
New Orle
ans
Columbus
Houston
Los A
ngeles
New York
San D
iego
Wash
ington, D
.C.
Cleveland
Honolulu
San Fr
ancisco
Boston
Atlanta
Dol
lars
per
yea
r
= 2009 24 city average ($771,352)NYC Charge w/Increase = $911,832