Embed Size (px)
Citation preview

8/6/2019 fma Aayush (1)
http://slidepdf.com/reader/full/fma-aayush-1 1/29

8/6/2019 fma Aayush (1)
http://slidepdf.com/reader/full/fma-aayush-1 2/29

8/6/2019 fma Aayush (1)
http://slidepdf.com/reader/full/fma-aayush-1 3/29

8/6/2019 fma Aayush (1)
http://slidepdf.com/reader/full/fma-aayush-1 4/29
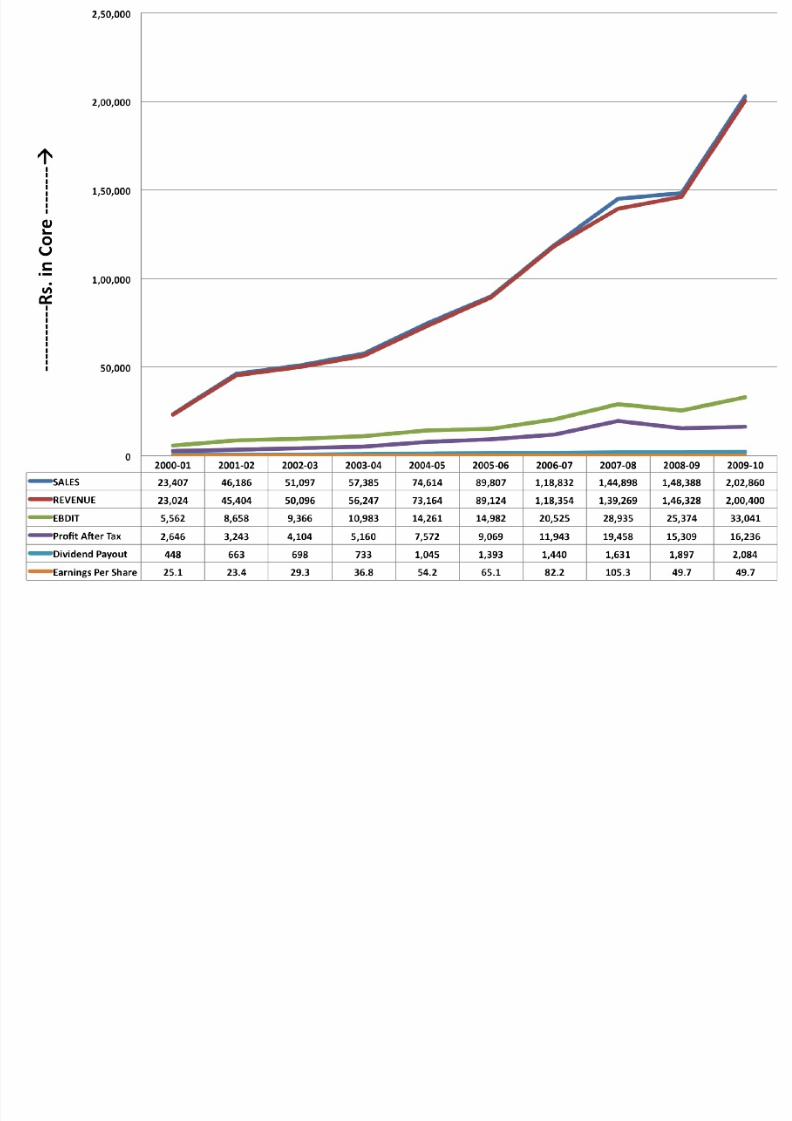
• Since there IPO(Initial publicOffering) 32 years back.
• They have grown revenuesand net profit by aCompounded Annual Growth
Rate (CAGR) of 28.42% and30.91% respectively.

8/6/2019 fma Aayush (1)
http://slidepdf.com/reader/full/fma-aayush-1 5/29
• The Board consists of 13 directors, outof which 7 are independent Directors.
• The categories of the Board are as
follows;
–Promoter Director
–Executive Directors
– Independent Directors

8/6/2019 fma Aayush (1)
http://slidepdf.com/reader/full/fma-aayush-1 6/29
• Asaleis the act ofsellingof products orservices in return for money or other
compensation. It is an act of completion of acommercial activity.
• SALES = No. unit sold * Selling Price

8/6/2019 fma Aayush (1)
http://slidepdf.com/reader/full/fma-aayush-1 7/29

8/6/2019 fma Aayush (1)
http://slidepdf.com/reader/full/fma-aayush-1 8/29
The amount of money that a company actually
receives during a specific period, including discounts and
deductions for returned merchandise. It is the "top
line" or "gross income" figure from which costs are
subtracted to determine net income.
Revenue is calculated by multiplying the price at which
goods or services are sold by the number of units or
amount sold.
Revenue is also known as "REVs".

8/6/2019 fma Aayush (1)
http://slidepdf.com/reader/full/fma-aayush-1 9/29
Revenue is used as an indication of earnings quality. Thereare severalfinancial ratioattached to it, the most importantbeinggross marginand profit margin. Also, companies userevenue to determinebad debt expenseusing the incomestatement method.
Price / Sales is sometimes used as a substitute for aPriceto earnings ratiowhen earnings are negative and the P/E ismeaningless. Though a company may have negativeearnings, it almost always has positive revenue.
Gross Marginis a calculation of revenue lesscost of goodssold, and is used to determine how well sales cover directvariable costs relating to the production of goods.
Net income/sales, orprofit margin, is calculated by investorsto determine how efficiently a company turns revenues intoprofits.

8/6/2019 fma Aayush (1)
http://slidepdf.com/reader/full/fma-aayush-1 10/29

8/6/2019 fma Aayush (1)
http://slidepdf.com/reader/full/fma-aayush-1 11/29

8/6/2019 fma Aayush (1)
http://slidepdf.com/reader/full/fma-aayush-1 12/29

8/6/2019 fma Aayush (1)
http://slidepdf.com/reader/full/fma-aayush-1 13/29
• A distribution of a portion of a company's earnings,
decided by the board of directors, to a class of its
shareholders. The dividend is most often quoted in
terms of the dollar amount each share receives
(dividends per share). It can also be quoted interms of a percent of the current market price,
referred to as dividend yield.
Also referred to as "Dividend Per Share (DPS).”
.

8/6/2019 fma Aayush (1)
http://slidepdf.com/reader/full/fma-aayush-1 14/29
• Dividends may be in the form of cash, stock or property.
• Most secure and stable companies offer
dividends to their stockholders. Their shareprices might not move much, but the dividend
attempts to make up for this.
High-growth companies rarely offer dividends
because all of their profits are reinvested to help
sustain higher-than-average growth.
•

8/6/2019 fma Aayush (1)
http://slidepdf.com/reader/full/fma-aayush-1 15/29
Dividend Payout Ratio
The percentage of earnings paid to shareholders individends.
Dividend Payout = Yearly Dividend per Share
Earnings per Share
= Dividends
Net Income
More mature companies tend to have a higher payout ratio.

8/6/2019 fma Aayush (1)
http://slidepdf.com/reader/full/fma-aayush-1 16/29

8/6/2019 fma Aayush (1)
http://slidepdf.com/reader/full/fma-aayush-1 17/29
the profitability ratios give the various scales to measure
the success of the firm.
The profitability ratios defined as the financial
measurement that evaluates the capacity of a business
to produce yield against the expenses and costs of business over a particular time period.
If a company is having a higher profitability ratio
compared to its competitor or higher or same
profitability ratio of a company compared to its previousperiod it can be inferred that the company is doing well.
The return on assets, profit margin and return on equity
are the examples of profitability ratios.

8/6/2019 fma Aayush (1)
http://slidepdf.com/reader/full/fma-aayush-1 18/29
The measures of profitability ratios are:
Gross Profit Margin - It gives the value of gross profit earned by
the company over sale.
Gross Profit Margin = (Total sales - Cost of sold goods)/ Sales
Return on Equity - It gives the value of profit that is earned
against every invested dollar/Rs in the stock of the firm.
Return on Equity = Net Income / Shareholder Equity
Return on Assets - It tells how the assets of the firm are usedmost effectively to earn profit.
Return on Assets = Net Income / Total assets

8/6/2019 fma Aayush (1)
http://slidepdf.com/reader/full/fma-aayush-1 19/29

8/6/2019 fma Aayush (1)
http://slidepdf.com/reader/full/fma-aayush-1 20/29
The portion of a company's profit allocated to each
outstanding share of common stock. Earnings per share serves
as an indicator of a company's profitability.
EPS =( Net Income minus Dividends in Preferred Stock)
Avg. outstanding Shares
It is more accurate to use a weighted average number of
shares outstanding over the reporting term, because
the number of shares outstanding can change over time.
However, data sources sometimes simplify the calculation by
using the number of shares outstanding at the end of theperiod.
Diluted EPS expands on basic EPS by including the shares
of convertibles or warrants outstanding in the outstanding
shares number.

8/6/2019 fma Aayush (1)
http://slidepdf.com/reader/full/fma-aayush-1 21/29

8/6/2019 fma Aayush (1)
http://slidepdf.com/reader/full/fma-aayush-1 22/29
8/6/2019 fma Aayush (1)
http://slidepdf.com/reader/full/fma-aayush-1 23/29

8/6/2019 fma Aayush (1)
http://slidepdf.com/reader/full/fma-aayush-1 24/29
• Company issued bonus shares manyof times in its history.
• Recently it issued bonus shares in FY
09-10.• The issue of bonus shares is subject to
the shareholders' approval
• And the issuance of bonus shares is inthe ratio of one equity share of Rs 10each for each share held.

8/6/2019 fma Aayush (1)
http://slidepdf.com/reader/full/fma-aayush-1 25/29
•Company issue its dividend every year on the face value of its share i.e.10 Rs for RIL
•And dividend is to be paid only to those shares which are fully paid- upof 10 Rs.
•Company secures a certain part of its profit to be distributed as dividendaccording to the earnings of the year which can be shown in the table.

8/6/2019 fma Aayush (1)
http://slidepdf.com/reader/full/fma-aayush-1 26/29
Year Month Dividend (%)
2010 Apr 70
2009 Oct 130
2008 Apr 130
2007 Mar 110
2006 Apr 100
2005 Apr 75
2004 Apr 53
2003 Apr 50
2002 Sep 48
2001 Apr 43
8/6/2019 fma Aayush (1)
http://slidepdf.com/reader/full/fma-aayush-1 27/29

8/6/2019 fma Aayush (1)
http://slidepdf.com/reader/full/fma-aayush-1 28/29
• Reliance was founded by the Indianindustrialist Dhirubhai Ambani in1966. Ambani has been a pioneer in
introducing financial instruments likefully convertible debentures to theIndian stock markets. Ambani was
one of the first entrepreneurs todraw retail investors to the stockmarkets.

8/6/2019 fma Aayush (1)
http://slidepdf.com/reader/full/fma-aayush-1 29/29