Embed Size (px)
Citation preview

@physical Chemistry, 45 (1993) 235-244 Elsevier Science Publishers B.V., Amsterdam
235
BIOCHE 01715
Fourier transform infrared studies on charge-transfer interactions of plastoquinones and ar-tocopherol quinone with their hydroquinone forms and monogalactosyldiacylglycerol
Jerzy Kruk a, Kazimierz Strzalka a and Roger M. Leblanc b
’ Department of Physiology and Biochemistry of Plants, The Jan Zurzycki Institute of Molecular Biology, Jagiellonian Clniuersity, Al. Mickiewicza 3, 31-120 Krak6w (Pokmd) ’ Centre de Recherche en Photobiophysique, Utziuersite’ du Quebec d Troti-Riuikes, Trois RiuiSres, Quebec G9A 5H7 (Canada)
(Received 1 April 1992; accepted in revised form 17 July 1992)
Abstract
Fourier transform infrared (FTIR) spectra of plastoquinone-9 (PQ-9), plastoquinone-3 (PO-3), a-tocopherol quinone ((r-TQ), their reduced forms, monogalactosyldiacylglycerol (MGDG), quinone-hydroquinone (Q- QH,) and Q-QHz-MGDG mixtures in thin films have been measured. The spectra were recorded directly on samples evaporated from hexane and after precooling at liquid nitrogen temperature. It was found that pure QH, molecules are hydrogen bonded and occur mainly in polymeric forms, but in mixtures with corresponding quinones, they show only the presence of dimers. The quinones in Q-QH, mixtures in a liquid state do not form hydrogen bonds, but after solidification most of their carbonyl groups are hydrogen bound IO hydro- quinones, which facilitates the formation of charge-transfer (CT) complexes. Hydrogen bonds in CT complexes between PQ-9 and PQH2-9 were found to occur also in MGDG matrix. There were also some indications found on Q-QH, interactions in a liquid state. The peak responsible for C-O stretching vibrations of hydroxyl groups in liquid Q-QH, mixtures is strongly reduced, and after solidification there appeared two new peaks due to stretching vibrations as a result of hydrogen bonding. Only for PQ-9 and PQH,-9 in solid state did crystallization bands appear below 900 cm-‘, which originate from skeletal vibrations of the isoprenoid side chain of both compounds. The possibility of the existence of CT complexes of different stoichiometry in apolar solutions is also considered.
Keywords: Plastoquinone; cY-Tocopherol quinone; Hydroquinone; Monogalactosyldiacylglycerol; Charge-transfer complex; FTIR spectroscopy
1. Introduction Correspondence to: J. Kruk, Department of Physiology and Biochemistry of Plants, The Jan Zurzycki Institute of Molecu- lar Biology, Jagiellonian University, Al. Mickiewicza 3, 31-120 Krakhw, Poland.
Plastoquinone-9 (PQ-91, ru-tocopherol quinone (CCTQ) and their reduced forms (PQH,-9 and
0301-4622/93/$06.00 0 1993 - Elsevier Science Publishers B.V. All rights reserved
236 J. Kruk et al. / Biophys. Chem. 45 (1993) 235-244
a-TQH,, respectively) are constituents of th- ylakoid membranes of chloroplasts [l]. PQ-9 and its hydroquinone form, which occur in the lipid part of the membrane, are hydrogen carriers in the photosynthetic electron transport system [2]. The hydrophobic core of the thylakoid membrane in which PO-9 and PQH,-9 move is highly fluid because of the high degree of unsaturation of acyl chains of monogalactosyldiacylglycerol (MGDG), which is the most abundant lipid of the thylakoid membrane [3].
Experiments on model systems showed that PQ-9 and a-TQ in organic solvents [41 and unsat- urated fatty acids [5] form charge-transfer (CT) complexes with their reduced forms. As was found based on infrared measurements, carbonyl groups of PQ-9 and (u-TQ in apolar solvents in CT complexes do not form hydrogen bonds with hy- droxyl groups of hydroquinone rings (41. CT spec- tra of the investigated prenylquinones consist of two bands, one short-wavelength band (350-380 nm) which dominates in solution [4,51 and a long-wavelength band (500-600 nm) which domi- nates in solid state 1.51. There is also some evi- dence on CT interactions between PQ-9 and its hydroquinone in MGDG monolayers [6], which may indicate the possibility of the formation of CT complexes also in native biological mem- branes. So far, only a few prenylquinones were examined by infrared spectroscopy and mainly in KBr discs [7,8]. This technique was already ap- plied to the analysis of CT complexes formed between simple quinones and hydroquinone in solid state [9]. In all such complexes a new hydro- gen bound carbonyl band at about 1633 cm- 1 was observed. The principal bonding force in Q-QH, systems is r-r interaction, however, hydrogen bridges between the carbonyl group of Q and hydroxyl group of the QH, molecule pro- vide an additional stabilizing force in such com- plexes.
Important information about interactions be- tween different molecules can be obtained from FTIR spectra. Change in a particular interaction manifests as a shift in frequency for specific vi- brational mode or as a lineshape change, and the discrete frequency ranges can be attributed to different groups of atoms in the investigated
molecules. The method is very sensitive and de- tects even small changes in bond energies against high background absorption.
In recent years the FTIR technique has been successfully applied for studies of such problems as orientation of lipids [lO,lll, properties of dif- ferent lipid phases and their transitions 112-141, lipid-protein interactions [15], and others. Usiug this method, light-induced changes in properties of quinones associated with photochemical reac- tions in bacterial reaction centers [16] and plant photosynthesis 1171 have been recently investi- gated.
In the present studies, we applied FTIR spec- troscopy to examine in more detail the specific molecular interactions between PQ-9, PQ-3, LY-TQ and their reduced forms in solid, liquid state and in mixture with MGDG, with special emphasis on modes of interaction occurring in CT complexes.
2. Materials and methods
PQ-9 and PQ-3 were obtained as a gift from Hoffman-La Roche (Basle, Switzerland) and a-TQ was purchased from Eastman Kodak Co. (Rochester, New York) All three quinones were purified by TLC as described in ref. (181. Natural MGDG was from Lipid Products (Nutfield, Sur- rey) and was used without further purification. The solutions of all compounds investigated were prepared in hexane. Samples for measurements were prepared by evaporating small amounts of appropriate compounds or their mixtures on sil- ica plates under nitrogen in the form of a thin layer and then removing traces of the solvent under a vacuum in the sample chamber of the spectrometer. Since hydroquinones easily oxidize to quinones upon contact with oxygen, the sample chamber was filled with nitrogen before placing the samples there. The spectra were taken in the range of 4000-400 cm- ’ on a Bomem FTIR spectrometer and were an average of 100 scans. Since it is difficult to remove traces of organic solvents from the investigated hydroquinones and MGDG, spectra of the same sample were recorded several times to check if there are any

J. Kruk et al. /Biophys. Chem. 45 (1993) 235-244
changes in their shape in the course of measure- ment time.
After recording of spectra at room tempera- ture, samples were cooled in liquid nitrogen for a while and then warmed back to room tempera- ture in a stream of nitrogen and the spectra were recorded again. FTIR spectra were taken for all pure compounds, Q-QH, mixtures (1: 1 molar ratio), Q(H,)-MGDG (1: 5 and 1: 10 molar ra- tios) and Q-QH,-MGDG mixtures (1: 1: 5 and 1: 1 : 10 molar ratios).
3. Results
In Table 1 are shown peaks of all pure compo- nents investigated in the range of 4000-1600 cm-’ and in Figs. 1 and 2 spectra of PQH,-9 and MGDG, respectively, in the range of 3500-600 cm-‘. PQ-9 evaporated from apolar solvents re- mains as an oily liquid, and after low temperature treatment it solidifies showing a supercooling ef- fect (m-p. 46°C). Its solidification occurs even above 0°C but requires a longer time. Crystalliza- tion of PQ-9 causes refinement of its spectrum in the C-H stretching region and long-wavelength shifts of bands responsible for v(C=O) and v(C=C) of the ring. In spectra of hydroquinones, marked changes are observed in the OH stretching re- gion. Both PQH,-9 (Figs. 1 and 3) and (r-TQH, show in this region the presence of a shoulder and a broad band. The long-wavelength shoulder
1
WAVELENGTH (cm-11
Fig. 1. FTIR absorption spectrum of PQH,-9 in the range 3800-600 cm-‘.
,,. 0 3050 2300 1550 800
WAVELENGTH (cm-‘1
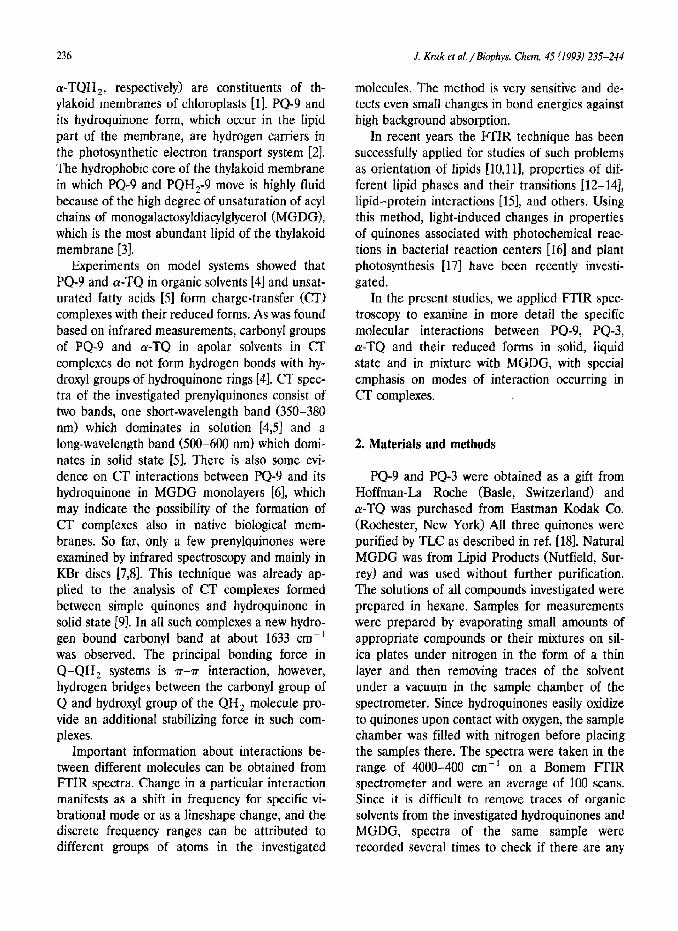
Fig. 2. FTIR absorption spectrum of MGDG in the range 3800-600 cm-‘.
originates from dimers of QH, molecules bound by hydrogen bonds, and the main band represents these molecules bound in polymeric chains by the same type of bonds [19]. Only this kind of hydro- gen bonding is observed for crystal structures of PQH,-3. Cooling of PQH,-9 (contraction of crystals) causes permanent association of dimers into polymers. On the other hand, the position of the band corresponding to hydroxyl groups of galactose moiety of MGDG suggests that these groups occur in dimeric state [19]. Presence of very weak C=O peaks in PQH,-3 and a-TQH, spectra indicates trace amounts of their oxidized forms.
Mixtures of all three investigated quinones with their reduced forms show a colour change (pres- ence of new electronic absorption bands) in com- parison with that of individual components in the liquid, and especially in the solid state, which is caused by the formation of CT complexes (for their electronic CT spectra see [4,51). Their in- frared spectra show some changes as compared with the spectra of their components (Table 2). In the liquid state, most of the polymeric hydrogen bonds are broken and dimers of hydroquinones mainly occur. The absence of a carbonyl group shift suggests that it does not take part in hydro- gen bond formation in the liquid state. After solidification, further changes in PQ-3-PQH ,-3 and PQ-9-PQH,-9 spectra occur. The OH dimeric peak becomes sharper and more intense

238 J. Kruk et al. /Biophys. Chem. 45 (1593) 235-244
Table 1
Absorption bands in the range 4000-1600 cm-’ of PQ.9, PQ-3, wTQ, corresponding hydroquinones and MGDG before and after low temperature pretreatment Intensity: w (weak), m (medium), s (strong); vibrations: Y (stretch), as (asymmetric), sym (symmetric); other abbreviations: dim (dimeric), polym (polymeric), sh (shoulder), v (very)
Position (cm-‘) Assignment Change after precooling
PQ-9
(yellow liquid) 2967 s 2918-2921 s 2852.5 s 1652 s 1617 m
PQ-3 (yellow liquid)
2969 s 2923 s 2856 s 1652 s 1617 m
a-TQ (yellow liquid) - 3550 w
2953 s 2927 s 2867-2870 s
- 2853.5 s 1645 s 1623.5 w, sh
PQH,-9 (white solid) - 3477 m, sh - 3299-3306 m, broad
2965 s 2919 s 2854 s 1666 w
PQHJ -3 (white solid) - 3275 s, broad
2964 s 2924 s 2854 s 1664.5 w 1651 w
(Y - TQH2 (white solid) - 3380 m, sh
3257-3270 m, broad 2953 s 2925 s 2869 s
- 2855 s, sh 1643w
V&H,) v,,(CHJ v,,(CH,) V(C=O) v(C=C) ring
(yellow solid) 2964 2942, 2913.5,2906 2855-2846 1645 1614
v,,(CHJ V&H,) u,,(CH,) v(C=O) v(C=C) ring
2852 1651
v(O-H) dim v,,KHJ u,,(CH2)
v,,,JCH 3) s,,(CHJ V(C=O) v(C=C) ring
v(O-H) dim v(O-H) polym V,JCIIJ v,,(CH,) v,,(CH,) v(C=C) chain
2950 2927.5 2870
disappears - 3250
2914
1664.5
v(O-H) polym V&H,) V&H,)
~rnl(CHz) LX) chain v(C=O) of PQ-3 traces
v(O-H) dim v(O-HI polym vJCH,) vJCH,)
%JCH,) vsym(CH 2) dG0) of wTQ traces
2951

J. Kruk et al. /Biophys. Chem. 45 (1993) 235-244
Table 1 (continued)
239
Position (cm - t)
MGDG (white solid)
3430-3440 s 3011 s 2961.5 s 2930 s
- 2873 s, sh
Assignment
v(O-H) dim v(=C-H) cis U&H s) v,,(CH 1 2
v,,,(CH 3)
Change after precooling
2855 s %ln(~ 2) 1740.5 s v(C=O) ester 1653-1657 w v(C==C) 1656
and the OH polymeric band disappears, despite the fact that the mixture (and also hydro- quinones) solidifies. But now hydrogen bound dimers are formed by hydroquinone OH groups and C=Q groups of quinones, which is evident by the appearance of a new peak at 1627 cm-’ and decrease of the free C=O peak intensity (Fig. 4). The new peak corresponds to a hydrogen bonded carbonyl group in the CT complex 191. A band corresponding to PQ-9 carbonyl groups which are not hydrogen bound (C=O free band) in solid mixture with PQH,-9 does not show spectral shifts as in the pure solid state, indicating that even not hydrogen bound PQ-9 molecules interact with PQH,-9. On the other hand, PQ-9 mixed with
I ” ” I ” ”
MGDG (1: 5 molar ratio) shows the same band positions before and shifts after precooling as in the case of pure PQ-9. This indicates that PQ-9 in mixture with MGDG crystallizes as in a pure form. PQ-3 and cx-TQ in Q-MGDG and Q- QH,-MGDG systems show the same band posi- tions as in the pure state. As in the PQ-9-PQH,-9 mixture so in the mixture of these compounds with MGDG (1: 1:5 molar ratio), after precool- ing, does a band of hydrogen bonded carbonyl group of PQ-9 appear and the intensity of free carbonyl band decreases. This mixture, after pre- cooling, shows a characteristic colour change (Ta- ble 2) connected with the appearance of an elec- tronic CT band. When the molar proportion of MGDG in such a mixture is raised to 10, then the hydrogen bonded C=O groups are no longer de-
3650 3450 3250 3050 WAVELENGTH (cm-i1 WAVELENGTH [cm-‘1
Fig. 3. FTIR absorption spectra of: PQHZ-9 before (a) and Fig. 4. FTIR absorption spectra of PQ-9-PQH,-9 mixture after (b) precooling, PQ-9-PQHs-9 mixture before (c) and before (- - - ) and after (-) precooling in the range 1700-1600
after (d) precooling in the range 3650-3050 cm-‘. cm-i.

240 J. Kruk et al. / Biophys. Chern. 45 (1993) 235-244
tectable, probably because of their low intensity as compared to MGDG background. Hydrogen bound carbonyl groups are also not observed in precooled mixtures of PQ-3-PQH,3-MGDG (1: 1: 5 molar ratio). Most probably this results from the localization of the former two com- pounds in the more polar regions of MGDG matrix, i.e., in conditions unfavorable for CT complex formation [6].
In the 1600-400 cm-’ spectral region of solid PQ-9, three new bands appear (Table 3) which
are absent in its liquid state spectrum and are assigned as crystallization bands [8]. Similar to PQ-9, in the PQH,-9 spectrum, after precooling, crystallization bands appear (Table 41, although of a lower intensity, which are not present in PQH *-9 spectrum directly after evaporation from hexane solution. The most apparent changes in the 1600-400 cm-’ spectral range of Q-QH, mixtures occur in the C-O stretching region (Ta- ble 5). The strong v(C-0) bands of PQH,-9 and PQH,-3 (Fig. 5) in Iiquid Q-QH, mixtures un-
Table 2
Absorption bands in the range 4000-1600 cm-’ of Q-QH,, Q-MGDG and Q-QH, -MGDG mixtures before and after precooling. Numbers in brackets are the molar ratios of the mixture components; hb-hydrogen bound. Other abbreviations as in Table 1
Position (cm-’ ) Assignment
PQ-9-PQH,-9 (I:I) (orange liquid)
3492 m, broad v(O-H) dim _ 3305 w, sh v(O-HI polym
2967 s v&H,) 2919 s V&H,) 2854 s v~,(CH 2) 1650.5 s v(C=O) 1617 m v(C=C) of Q ring
v(C=O) hb
PQ-3 - PQH2 -3 (I : I) (orange liquid)
3487 m, broad v(O-H) dim _ 3300 w, sh v(O-H) polym
2966 s V&H,) 2923.5 s v,,(CH 2) 2855 s v,,(CH J 1650 s V(C=O) 1617 m u(C=C) of Q ring
Y(C=O) hb
a-TQ-a-TQH? (l:l) (brown liquid)
3410 m, broad v(O-HI dim 3270 w, sh v(O-HI polym 2953.5 s v,,(CH,) 2927 s v&H,) 2869 s sS,,(CH 3) 1644 s V((J=O)
PQ-9 bands in mirture with PQH,-9 and MGDC (1: I :5) (pale yellow solid) as PQ-9 dG0)
v(C==O) hb v(W) ring
Change after precooling
(purple solid) _ 3488 sharp disappears
2961 2914 2851
S’W
1618 new 1621 m
(purple solid) 3473-3493 sharp disappears
2852.5 S--‘W
1618.5 new 1627 m
peak --) sh sh + peak 3265
2955
(pink solid) 1652
new 1627 1617

J. Kruk et al. /Biophys. Chem. 45 (1993) 235-244 241
Table 3 Table 4
Absorption bands in the range 1600-400 cm-’ of PQ-9, PQ-3, a-TQ and MGDG before and after precooling. Vibra- tions: fi (bend), p (in-plane bend), y (out-of-plane bend), p (rock); tryst. (crystallization bands). Other abbreviations as in
Table 1
Absorption bands in the range 1600-400 cm-’ of PQH,-9, PQH,-3 and ar-TQH 2 before and after precoaling. Abbrevia- tions as in Tables 1 and 3
Position (cm-‘) Assignment Change after precooling
Position (cm-‘) Assignment Change after precooling
PQ-9
1445.5 s 1380.5 s 1316 m 1263 vw 1238.5 w
1163.5 w 1101 m 983.5 w
881.5-884 w
840.5 m
PQ-3 1446 s 1378.5-1380 s 1316 s 1266 w 1238.5 m 1165.5 m 1100 m
983.5 m 883.5-885.5 m 830-854 w
cr-TQ 1463.5 s 1375.5 s 1306 m 1067 w 932 w 714 m
MGDG 1463 m 1393 w, 1378 w
1247-1267 w 1167m 1143 sh 1072 s 708 m
6,&H,), S(CH,) 6,,(CH,)
/3(=C-HI ring
-y&C-H) ring clyst.
y(=C-H) chain
clyst. tryst.
6,&H,), 6(CH>) &n(CH,)
1382.5 1318 1265 vw --t m disappears new 1212 w new 1184 w disappears 1104 m
new 962 w
new 814 s
new 795 s new 752 m
1443 s
1263-1265 w -) vw
P(=C-H) ring
y(=C-H) ring y(=C-HI chain
S&H& S(CH,) 6,&H,)
6(CH,), 6,&H,) /3(0-H), /3(C-H) ring,
&,JCH,)
v(C-0) ester v(C-0) ether v(C-0) OH p(CH,) chain, y(=C-H) cis y(O-H)
1461.5
1069 926-952 711
705
PQH,-9 1594 w 1449 s 1383 m
1214 s 1076 s
837 m
708 w
PQH, - 3 1594 w 1452.5 s 1382 m
1356 w 1214 s 1077 s 851 w, 834 w 802 m
706 w
a-TPH, 1463 s 1377 m
1320 m 1247 s 1082 m 912m 840 w
v(C=C) ring 6&H,), 60X,) &JCHJ V(C-0) &C-H) ring? clyst. y(=C-H) chain tryst. cry&.
v(C=CI ring S,,KH,), 6KHJ
%n(CH3)
u(c=O)
/3(=C-H) ring? y(=C-H) chain
6&H,), SCH *)
&r&H,)
v(C-0) ring
1384 m 1215
875 m 835,851 m 796 m 752 w 706 m
1462
1317
1080
I
1600 I I,, c, I I I
1350 1100 850 60 WAVELENGTH (cm-1)
Fig. 5. FTIR absorption spectra of PQ-3-PQH,-3 mixture before (- - -1 and after (-_) precooling in the range 1600-600 cm-’ and a fragment of PQH,-3 spectrum (.. .) in the
AC-01 region.

242 J. Kruk et al. / Biophys. Chem. 45 (1993) 235-244
Table 5
Absorption bands in the range 1600-400 cm-’ of Q-QH1 mixtures, Q-MGDG and Q-QH,-MGDG mixtures before and after precooling. Abbreviations as before
Position (cm-‘) Assignment Change after precooling
PQ-9-PQHz-9
1448 s &JCHJ, 6KHJ 1447 s 1383 s %JCHJ 1382
new 1327 m 1319.5 m 0 (1316 m) disappears
new 1287 m 1245 m Q (1238.5 w) sh 1215 w v(C-O),QH, (1214 s) 1212.5 sh
v&z-0) CT new 1195 m v,,,,&-0) CT new 1161 m
1096 sh Q (1101 m) 1080 m QH, (1076 s) 1077 m 984 w Q
new 942.5 w clyst. new 872 w
842 m y(=C-H) chain 843 clyst. new 191 m, 755 w
710 w QH, 700 s
PQ-3 - PQH2 -3
1451 s S,,(CH3), 6KH,) 1445 1380 s 6,,KH J 1377
new 1327 m 1319.5 m Q (1316 m) disappears
new 1288 m 1244 m Q (1239 m) 1241 w 1214 w v(C-01, QH,(1214 s) sh
v&J-0) CT new 1195 m v,,,(C-0) CT new 1162 s
1080 s QH, (1077 s) 1079 837~ y(=C-H) chain 840 s 801 m QH, 799 s 709 w QHz 700 m
(Y-TQ-LY-TQH~
1463 s 6,,(CH& S(CHJ 1377 s WCHJ 1309 w Q (1306 w) 1308 1254 m v(C-01, QH2 (1247 m) 1253 m 1211 w 1214 w 1083 m QHz 1081 w 10.50 w QH, (sh) 917-932 m Q (932 w) 843 vw QH, (840 w) 843 w 715 m Q 713.5 m
PQ-9 - PQH,.9 bands in mixture with MGDG (1: I : 5)
1319 w Q 1324 new w 1287 sh
v,,(C-0) CT new * 1200 sh clyst. new 873 w, 796 w
dergo strong reduction in intensity as compared to the spectra of individual hydroquinones. After solidification, new strong peaks appear at 1195 cfT1-’ and at 1161-1162 cm-‘, which correspond to v,,(C-0) and v&C-0) vibrations of hydro- quinone OH groups hydrogen bonded to CO groups of quinone in (3T complex. Simultane- ously, &C-O) peak of OH groups bound with each other nearly completely disappears.
A spectrum of PQ-9-PQH,-9 with MGDG mixture (1: 1: 5 molar ratio) shows characteristic peaks or shoulders (Table 5) indicating on CT interaction between PQ-9 and PQH,-9 also in the presence of MGDG.
4. Discussion
The above-presented results give evidence that in the solid mixtures of PQ-9-PQH,-9 and PQ- 3-PQH,-3 mixtures CT complexes stabilized by hydrogen bonds between components of the com- plex are formed. Such compIexes can also occur in MGDG matrix as shown for the PQ-9-PQH,-9 system. Since in all cases where hydrogen bound quinone groups are formed, a small peak for free carbonyl group is also observed, the question arises as to what the proportion of the unbound carbonyl groups and the hydrogen bonded is. As calculated from Fig. 4, taking into account that the intensity of v(C=C> peak does not change after solidification, we can calculate that about 20% of all Q carbonyl groups remain in a free state. It is also evident that an increase in the intensity of the hydrogen bound carbonyl group is much less than the decrease in intensity of the free carbonyl group. This is probably caused by a lower extinction coefficient of the hydrogen bound C=O group. Analogical calculations for PQ-3- PQH,-3 and PQ-9-PQH,-9-MGDG mixtures give values about 25% and 30%, respectively. In solid Q-QH, mixtures, where OH groups of hy- droquinones are nearly exclusively hydrogen bound in dimers with both carbonyl groups of a Q molecule or with OH groups of other QH, molecules, some free Q molecules, or more prob- ably complexes in which one C=O group is hydro- gcn bound and the other is free, may also be

.I. Kruk et al. /Biophys. Chem. 45 (1993) 235-244 243
present. Since there is no peak for free OH groups observed (at IV 3610 cm-‘) in any of the mixtures, there cannot be formed complexes of the above type of 1: 1 stoichiometry; however, complexes of Q/QH, ratio of 2 : 1 or 2 : 2 could explain the observed results as presented below:
O=C-R-C+0 * I. (HO-R-OH). . . a
O=C-R-GO
where R is either the Q or QHZ ring, n is 1 or 2 and dotted lines represent hydrogen bonds. Here the molecules are shown in linear array but CT interactions would be most effective in a parallel arrangement of ring planes of all three compo- nents.
In the liquid state of Q-QH, mixtures, there are neither hydrogen bound C=O groups formed nor do free OH groups exist. Apart from free Q molecules, some of them are bound to QH, dimers (or small amounts of polymers) by V-V CT interactions. This view is supported by some changes in the 1600-400 cm-’ region of Q-QH, mixtures as compared to the superposition of the individual component spectra and also by the colour change of these mixtures.
In apolar solvents where the investigated prenylquinones form CT complexes with their reduced forms, it was also found that carbonyl groups do not form hydrogen bonds [4]. It is also known that phenols in concentrated solutions oc- cur as dimers, whereas during diluting of such solutions, phenol dimers gradually dissociate into monomeric forms [20,211. It means that Q-QH, CT complexes at high concentrations in apolar solvents occur in Q:QH, ..kQH, or Q:QH, * * * QH, : Q forms, where the colon stands for ~T-T CT interaction and the dotted lines for hydrogen bonds. On diluting they would dissoci- ate into Q : QH, and free monomeric QH,. It was found that in apolar solvents, a v(C=O) band of PQ-9 occurs in a doublet form, whereas upon addition of PQH,-9 this splitting disappears [4], which is explained in terms of CT interaction. Splitting of the C=O band has been already re- ported for asymmetrically substituted quinones [22] and it may arise from the non-equivalent influence of other ring substituents on the two
carbonyl groups, which can be further enhanced by the anisotropy of the immediate surroundings of the Q molecule. Absence of splitting of the C=O band was observed for all three pure quinones investigated in the present study and also for their solutions in nujol and n-octanol (data not shown). However, the increased tem- perature of PQ-9 solution in n-octanol induced reversible splitting of the carbonyl peak (data not shown). These facts suggest that the splitting oc- curs in media of low viscosity (hexane Ccl,, warmed n-octanol) and disappears at high viscos- ity (nujol, pure Q). This indicates that the mobil- ity of PQ-9 molecules in apolar solvents on con- tact with PQH,-9 in the form of a CT complex undergo high deceleration, which can be easily explained if the PQ-9 molecule would be bound to PQH,-9 dimers.
The presence of crystallization bands in pre- cooled PQ-9 and PQH,-9 is probably due to skeletal vibrations of the side chain of these molecules in solid state and they are not influ- enced by PQ-9-PQH,-9 interaction or MGDG matrix. On the other hand, long-wavelength shift of PQ-9 v(C=O> and u(C=C) ring vibrations which also occur after solidification of pure PQ-9, are not found in PQ-9-PQH,-9 alone, or in a mix-
ture of these compounds with MGDG, because of the interaction of the PQ-9 ring with the PQH *-9 ring.
The results presented here show that FTIR spectroscopy can be applied to the investigation of CT complexes, especially for those that are associated with hydrogen bonds formation.
Acknowledgement
This work was supported by KBN Research Grant No. 6 6075 92 03.
References
1 R. Barr and F.L. Crane, Methods Enzymol. 23A (1971) 372.
2 R. Tiemann, G. Renger, P. GrHber, and H.T. Witt, Biochim. Biophys. Acta 546 (1979) 498.

244 J. Kmk et al. /Biophys. Chem. 45 (1993) 235-244
3 D.J. Murphy, Biochim. Biophys. Acta 846 (1986) 33. 4 J. Kruk, Biophys. Chem. 30 (1988) 143. 5 J. Kruk and K. Strzafka, Chem. Phys. Lipids 58 (1991) 27. 6 J. Kruk., K. Strzaika and R.M. Leblanc, Biochim. Biophys.
Acta (in press). 7 M. Kofler, A. Langemann, R. Riiegg, L.H. Chopard-dit-
Jean, A. Rayroud and 0. Jsler, Helv. Chim. Acta 42 (1959) 1283.
8 J.F. Pennock, in: Biochemistry of quinones, ed. R.A. Mor- ton, (Academic Press, New York, 1965) p. 67.
9 M.A. St&in and R.H. Wafmsley, Spectrochim. Acta 26A (1970) 1237.
10 L. Ter-Minassian-Saraga, R. Okamura, J. Umemura and T. Takenaka, Biochim. Biophys. Acta 946 (1988) 417.
11 E. Okamura, J. Umemura and T. Takenaka, Biochim. Biophys. Acta 1025 (1990) 94.
12 A. Nilsson, A. Holmgren and G. Lindblom, Biochemistry 30 (1991) 2126.
13 R.N.A.H. Lewis and R.N. McElhaney, Biochemistry 29 (1990) 7946.
14 H.H. Man&h and R.N. McElhaney, Chem. Phys. Lipids 57 (1991) 213.
15 A. Bhushan and M.G. McNamee, Biochim. Biophys. Acta 1027 (1990) 93.
16 D.L. Thibodeau, E. Nabedryk, R. Hienenvadel, F. Lenz, W. Mintele and J. Breton, Biochim. Biophys. Acta 1020 (1990) 253.
17 C. Berthomieu, E. Nabedryk, W. Mantele and I. Breton, FEBS Lett. 269 (1990) 363.
18 D. Guay and R.M. Leblanc, Langmuir 3 (1987) 575. 19 S. Holly and P. Sohar, Absorption spectra in the infrared
region, theoretical and technical introduction (Akademiai Kiado, Budapest, 1975).
20 J.C. Dearden and W.F. Forbes, Can. J. Chem. 38 (1960) 896.
21 M. Ito, J. Mol. Spectrosc. 4 (1960) 125. 22 F.J. Aranda, J. Villalain and J.C. Gomez-Fernandez,
Biochim. Biophys. Acta 861 (1986) 25.