Embed Size (px)
Citation preview
Fourth-Quarter 2014Earnings PresentationUrsula Burns
Chairman & CEO
Kathy Mikells
Chief Financial Officer
January 30, 2015

Forward-Looking StatementsThis presentation contains "forward-looking statements" as defined in the Private Securities Litigation Reform Act of 1995.
The words “anticipate,” “believe,” “estimate,” “expect,” “intend,” “will,” “should” and similar expressions, as they relate to us,
are intended to identify forward-looking statements. These statements reflect management’s current beliefs, assumptions
and expectations and are subject to a number of factors that may cause actual results to differ materially. These factors
include but are not limited to: changes in economic conditions, political conditions, trade protection measures, licensing
requirements and tax matters in the United States and in the foreign countries in which we do business; changes in foreign
currency exchange rates; actions of competitors; our ability to obtain adequate pricing for our products and services and to
maintain and improve cost efficiency of operations, including savings from restructuring actions and the relocation of our
service delivery centers; the risk that multi-year contracts with governmental entities could be terminated prior to the end of
the contract term; the risk in the hiring and retention of qualified personnel; the risk that unexpected costs will be incurred; the
risk that subcontractors, software vendors and utility and network providers will not perform in a timely, quality manner; our
ability to recover capital investments; the risk that our Services business could be adversely affected if we are unsuccessful
in managing the start-up of new contracts; development of new products and services; our ability to protect our intellectual
property rights; our ability to expand equipment placements; the risk that individually identifiable information of customers,
clients and employees could be inadvertently disclosed or disclosed as a result of a breach of our security; service
interruptions; interest rates, cost of borrowing and access to credit markets; reliance on third parties, including
subcontractors, for manufacturing of products and provision of services; our ability to drive the expanded use of color in
printing and copying; the outcome of litigation and regulatory proceedings to which we may be a party; and other factors that
are set forth in the “Risk Factors” section, the “Legal Proceedings” section, the “Management’s Discussion and Analysis of
Financial Condition and Results of Operations” section and other sections of our Quarterly Reports on Form 10-Q for the
quarters ended March 31, 2014, June 30, 2014, and September 30, 2014 and our 2013 Annual Report on Form 10-K filed
with the Securities and Exchange Commission. The Company assumes no obligation to update any forward-looking
statements as a result of new information or future events or developments, except as required by law.
On December 18, 2014, Xerox Corporation announced that it had entered into an agreement to sell its Information
Technology Outsourcing (ITO) business to Atos S.E. The transaction is subject to customary closing conditions and
regulatory approval and is expected to close in the first half of 2015. As a result of the pending sale of the ITO business, and
having met applicable accounting requirements, Xerox will report the ITO business as a discontinued operation. The forward
looking statements contained in this presentation are subject to the risk that the sale of the ITO business may not occur on
the terms, within the time and/or in the manner as previously disclosed, if at all.
2

Xerox Direction
Annuity 83% of Total Revenue
Services 54% of Total Revenue
• Grow revenue
• Generate profits in line with industry’s best
• Strengthen and differentiate the portfolio
• Lead in Document Technology
• Support customers and our people
• Allocate capital to enhance shareholder
returns
3

Fourth-Quarter Overview
Adjusted EPS1 of 31 cents, GAAP EPS2 of 26 cents
Total revenue of $5.0B, down 3% or down 1% CC1
Services revenue up 1% or up 3% CC1; margin of 9.8%
• Revenue growth driven by BPO; demonstrating progress on margin
Document Technology revenue down 8% or down 6% CC1; margin of 14.4%
• Profit expansion driven by continued productivity and currency benefits as well as lower bad
debt and pension expense
Operating margin1 of 10.4%, up 100 bps YOY
Cash from operations of $857M in Q4, $2.06B FY
• Share repurchase of $341M in Q4, $1.07B FY
• Acquisitions of $34M in Q4, $340M FY
1Adjusted EPS, Constant Currency (CC) and Operating Margin: see slide 23 for explanation of non-GAAP measures
2GAAP EPS from Continuing Operations4

Earnings(in millions, except per share data) Q4 2014 FY 2014 Comments
Revenue $ 5,033 $ 19,540 Translation currency impact: (2) pts on Q4, neutral
for the full-yearCC1 Growth (1)% (2)%
Gross Margin 32.1% 32.0%
RD&E $ 150 $ 577
SAG $ 942 $ 3,788
SAG % of Revenue 18.7% 19.4%
Adjusted Operating Income1 $ 524 $ 1,881 Q4 operating profit grew in both Services and
Document TechnologyB/(W) YOY $ 34 $ 72
Operating Income % of Revenue 10.4% 9.6%
B/(W) YOY 1.0 pt 0.6 pts
Adjusted Other, net1 $ 99 $ 383Adjusted Other $6M unfavorable YOY in Q4 and
$102M unfavorable YOY for the full-year
Equity Income $ 41 $ 160
Adjusted Tax Rate1 25.3% 24.9%Above 2013 tax rate of 23.9% in Q4 and 23.8%
full-year
Adjusted Net Income – Xerox1 $ 357 $ 1,280
Adjusted EPS1 $ 0.31 $ 1.07Q4 guidance of 28 to 30 cents,
2013 actual: 27 cents in Q4 and $1.04 full-year
Amortization of intangible assets 0.05 0.17
GAAP EPS2 $ 0.26 $ 0.90
1Constant currency (CC), Adjusted Operating Income, Adjusted Other, net, Adjusted Tax Rate, Adjusted Net Income – Xerox and Adjusted
EPS: see slide 23 for explanation of non-GAAP measures2GAAP EPS from Continuing Operations
5

Services Segment1
BPO revenue up 4% and DO up 1% at CC
• BPO driving Services growth improvement
Margin of 9.8%, improvement driven by BPO
with continued strong DO margin
• Sequential improvement across most BPO lines of
business including Government Healthcare
Signings
• Strong renewal quarter, BPO renewal rate of 93%
• New business signings4 (27)% in Q4 and (13)% TTM
• Significant new business deals awarded, not yet
signed
Segment Margin Trend
Revenue Growth Trend (CC2,3)
Signings (TCV) Q4
Business Process Outsourcing $2.2
Document Outsourcing $1.0
Total $3.2B
YOY Growth 20%
TTM Growth (13)%
6
1Services results and historical data exclude ITO which was moved to discontinued operations following announcement of planned sale to Atos 2Constant currency (CC): see slide 23 for explanation of non-GAAP measures32013 growth rates reflect reported growth as revised growth rates excluding ITO are not available at this time4New Business Signings = ARR (Annual Recurring Revenue) + NRR (Non-Recurring Revenue)
Q4 % B/(W) YOY FY % B/(W) YOY
(in millions) 2014 Act Cur CC2 2014 Act Cur CC2
Total Revenue $2,725 1% 3% $10,584 1% 1%
Segment Profit $268 3% $956 (9)%
Segment Margin 9.8% 0.1 pt 9.0% (1.1) pt
9.7% 10.6% 10.3%9.7%
8.6% 8.5%9.1%
9.8%
5%
7%
9%
11%
Q1 '13 Q2 '13 Q3 '13 Q4 '13 Q1 '14 Q2 '14 Q3 '14 Q4 '14
4%
6%
3%
(2)%0% 1% 1%
3%
(4)%
0%
4%
8%
Q1 '13 Q2 '13 Q3 '13 Q4 '13 Q1 '14 Q2 '14 Q3 '14 Q4 '14

Document Technology Segment
Segment Margin Trend
Revenue Growth Trend (CC1)
Strong segment profit growth and margin
• Continue to benefit from significant productivity
actions, favorable bad debt, pension and currency
Consistent overall revenue trend
• Currency and Eurasia weakness pressured growth
• Prior year finance receivable sale impacted
revenue decline by almost one point
Announced 20 new products in second half
• Good market reception for new products; well
positioned entering 2015
Entry Installs Q4
A4 Mono MFDs (25)%
A4 Color MFDs (9)%
Color Printers 9%
Mid-Range Installs
Mid-Range B&W MFDs (8)%
Mid-Range Color MFDs (1)%
High-End Installs
High-End B&W (19)%
High-End Color2 12%
71Constant currency (CC): see slide 23 for explanation of non-GAAP measures2High-end color install growth impacted by digital front end (DFE) sales to Fuji Xerox, High-end up 7% in Q4 excluding DFE’s.
Q4 % B/(W) YOY FY % B/(W) YOY
(in millions) 2014 Act Cur CC1 2014 Act Cur CC1
Total Revenue $2,159 (8)% (6)% $8,358 (6)% (6)%
Segment Profit $310 14% $1,149 19%
Segment Margin 14.4% 2.8 pts 13.7% 2.9 pts
8.7%
10.8%
12.0%
11.6%
12.2%
14.4% 14.0% 14.4%
5%
7%
9%
11%
13%
15%
Q1 '13 Q2 '13 Q3 '13 Q4 '13 Q1 '14 Q2 '14 Q3 '14 Q4 '14
(9)%
(5)% (5)%(6)%
(5)%
(7)%(6)% (6)%
(10)%
(8)%
(6)%
(4)%
(2)%
0%Q1 '13 Q2 '13 Q3 '13 Q4 '13 Q1 '14 Q2 '14 Q3 '14 Q4 '14

Cash Flow
8
(in millions) Q4 2014 FY 2014
Net Income $ 162 $ 992
Depreciation and amortization 356 1,426
Restructuring and asset impairment charges 37 130
Restructuring payments (30) (133)
Contributions to defined benefit pension plans (78) (284)
Inventories 115 (22)
Accounts receivable and Billed portion of finance receivables1 151 (2)
Accounts payable and Accrued compensation 90 128
Net loss on sales of businesses and assets 172 134
Equipment on operating leases (79) (283)
Finance receivables1 (75) 69
Other 36 (92)
Cash from Operations $ 857 $ 2,063
Cash from Investing $ (129) $ (703)
Cash from Financing $ (297) $ (1,624)
Change in Cash and Cash Equivalents 396 (353)
Ending Cash and Cash Equivalents $ 1,411 $ 1,411
Cash From Ops $857M, $2.06B FY
• Underlying Cash from Ops2 $953M in
Q4, $2.5B FY
Net income includes non-cash loss
on pending sale of ITO business
Working capital seasonally a source
in Q4, modestly positive FY
CAPEX $114M, $452M FY
Acquisitions $34M, $340M FY
FY Share Repurchase of $1.07B and
$289M of Common Stock Dividends
2015 Cash From Ops guidance of
$1.7 to $1.9B, FCF3 of $1.3 to $1.5B
• Reflects ITO divestiture timing and
negative currency
1Accounts receivable includes collections of deferred proceeds from sales of receivables and finance receivables includes collections on
beneficial interest from sales of finance receivables
2See Underlying Cash Flow slide in Appendix
3Free Cash Flow (FCF): see slide 23 for explanation of non-GAAP measures

Capital Structure
Core debt level managed to
maintain investment grade
Over half of Xerox debt supports
finance assets
$1B of debt due in February and
$250M in June 2015
– Expect to re-finance during the year
and end 2015 with ~$7.7B of debt
9
Financing and Leverage
• Xerox’s value proposition includes leasing of Xerox equipment
• Maintain 7:1 leverage ratio of debt to equity on these finance assets
Debt and Finance Asset Trend(in millions)
Q4 2014
(in billions) Fin. Assets Debt1
Financing $4.8 $ 4.2
Core - $ 3.5
Total Xerox $ 4.8 $ 7.7
$
0
2,000
4,000
6,000
8,000
10,000
2011 2012 2013 2014
Finance Debt Core Debt Finance Assets
1Debt excludes $75M in Capital Leases related to our ITO business, which were reclassified to a discontinued operations liability
account as a result of the move of ITO to discontinued operations
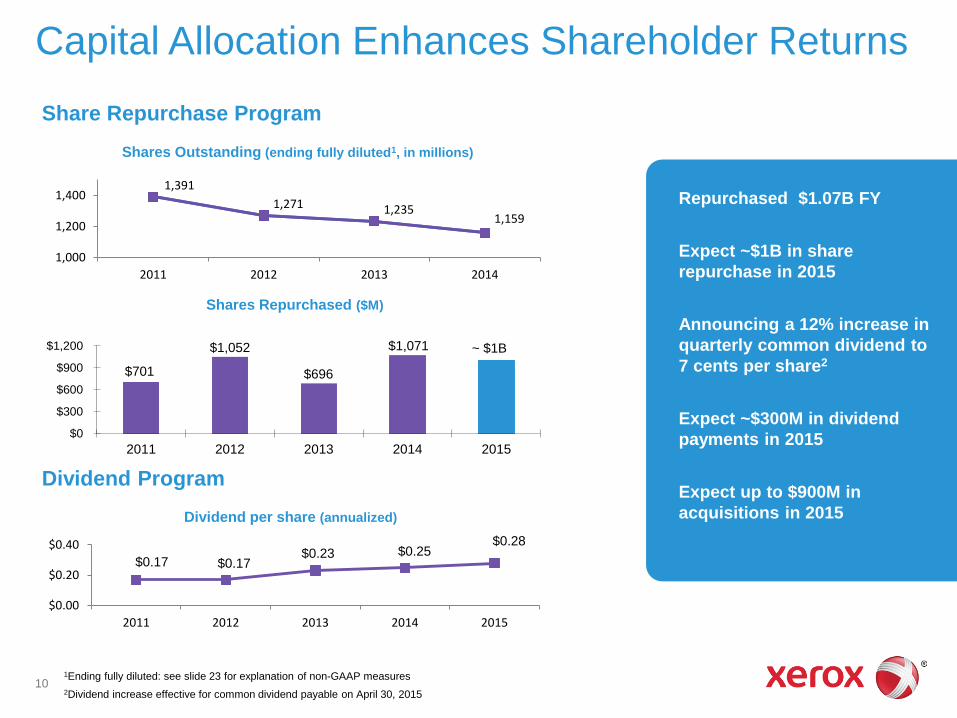
Capital Allocation Enhances Shareholder Returns
Repurchased $1.07B FY
Expect ~$1B in share
repurchase in 2015
Announcing a 12% increase in
quarterly common dividend to
7 cents per share2
Expect ~$300M in dividend
payments in 2015
Expect up to $900M in
acquisitions in 2015
10
Share Repurchase Program
Dividend Program
1Ending fully diluted: see slide 23 for explanation of non-GAAP measures
2Dividend increase effective for common dividend payable on April 30, 2015
Shares Repurchased ($M)
Shares Outstanding (ending fully diluted1, in millions)
Dividend per share (annualized)
$701
$1,052
$696
$1,071 ~ $1B
$0
$300
$600
$900
$1,200
2011 2012 2013 2014 2015
$0.17 $0.17$0.23 $0.25
$0.28
$0.00
$0.20
$0.40
2011 2012 2013 2014 2015
1,391
1,271 1,2351,159
1,000
1,200
1,400
2011 2012 2013 2014

2015 Guidance
2015
Revenue Growth @ CC Flat
Services Up 2 to 4%
Document Technology Down 4 to 5%
Adjusted EPS1 (incl restructuring) $1.00 - $1.06
GAAP EPS2 $0.83 - $0.89
Cash From Operations $1.7 - $1.9B
CAPEX $ 0.4B
Free Cash Flow $1.3 - $1.5B
Share Repurchase ~$1B
Acquisitions <$900M
Dividend ~$300M
Note: Revenue growth guidance excluding potential divestitures
Constant Currency (CC), Adjusted EPS and Free Cash Flow: see slide 23 for explanation of non-GAAP measures1Adjusted for amortization of intangible assets2GAAP EPS from Continuing Operations3 Excludes ITO which was moved to discontinued operations following announcement of planned sale to Atos
Revenue
• Services revenue growth driven by BPO
• Document Tech CC declines moderate
– Lower impact from prior Finance Receivable sales
• Expect (3) to (4) pts negative currency impact
Earnings3
• FY EPS range $1.00 - $1.06, reflects a 5 cent
negative impact from recent currency shifts
• YOY Earnings Drivers
– Improving margin in Services
– Continued strong Doc Tech margin but lower YOY
from higher pension expense and currency
– FY Tax Rate of 25% to 27%
– Fewer shares
Cash flow guidance of $1.7 - $1.9B
– Reflects expected timing of the sale of the ITO
business and currency impact
– Expect to offset the impact of ITO sale by 2016
11

Summary
Progressing on Services profitability and growth initiatives• Positive BPO revenue trend; managing portfolio and investments to drive better growth
• Made progress on Services margin in Q4, continuing to execute on margin expansion
initiatives for sustainable margin improvement
Continued strong profitability and execution in Document Technology • Leader in attractive segments; well positioned entering 2015
• Focused on maintaining strong profitability through ongoing productivity initiatives
Strong annuity driven Cash Flow supports share repurchase, acquisitions
and dividend expansion• Announcing a 12% increase in the quarterly common dividend
Q1 and FY EPS guidance• Q1 Adjusted EPS1 $0.20 - $0.22, GAAP EPS2 $0.16 - $0.18
– Includes approximately 2 cents restructuring
• FY Adjusted EPS1 revised to $1.00 - $1.06, GAAP EPS2 to $0.83 - $0.89
– Reflects approximately 5 cents of negative currency
12
1Guidance - Adjusted EPS: see slide 23 for explanation of non-GAAP measures
2GAAP EPS from Continuing Operations

Appendix

ITO Divestiture SummaryAnnounced planned sale of ITO business to Atos on December 18, 2014
• Cash consideration of $1.05B prior to closing adjustments, potential for incremental $50M at
closing
• Transaction expected to close in the first half of 2015
• Worldwide strategic collaboration between Xerox and Atos - mutually beneficial to Xerox, Atos, our
employees and our customers
Significant milestone in Xerox’s ongoing portfolio management strategy
• Enables greater focus on expanding BPO and DO businesses where we have scale and
differentiation
• Supports objective to grow our BPO business internationally
Impact to Earnings and use of Proceeds
• ITO moved to discontinued operations - ITO net revenue of $1.3B and operating profit of $107M in
2014
• Expect after-tax proceeds of approximately $850M, as a result, expect ~$1B in share repurchase
and up to $900M in acquisitions in 2015
• As previously communicated, expect ~6 cents of dilution in 2015 and neutral by 2016, reflecting
timing of use of proceeds
14

Metrics Reference – FY 2014
Entry Installs FY
A4 Mono MFDs (23)%
A4 Color MFDs (7)%
Color Printers Flat
Mid-Range Installs
Mid-Range B&W MFDs (13)%
Mid-Range Color MFDs 1%
High-End Installs
High-End B&W (13)%
High-End Color1 (7)%
FY
Business Process Outsourcing $7.6
Document Outsourcing $3.0
Total $10.6B
Signings Growth TTM (13)%
FY
Digital MIF 2%
Color MIF 12%
Digital Pages (4)%
Color Pages 4%
Color Revenue (CC2) (2)%
FY
Renewal Rate (BPO) 82%
Signings and Renewal Rate Install, MIF and Page Growth
Installs, color revenue, pages and MIF include both the Document Technology and Services segments. Color revenue and color pages reflect
revenue and pages from color capable devices. 1High-end color install growth impacted by digital front end (DFE) sales to Fuji Xerox, High-end up 6% FY excluding DFE’s.152Constant currency: see slide 23 for explanation of non-GAAP measures

Revenue Trend
(in millions) Q1 Q2 Q3 Q4 FY Q1 Q2 Q3 Q4 FY
Total Revenue
$4,857 $5,042 $4,900 $5,207 $20,006 $4,771 $4,941 $4,795 $5,033 $19,540
Growth (2)% (2)% (2)% (3)% (2)%
CC1 Growth (2)% (3)% (2)% (1)% (2)%
Annuity $ 4,133 $4,187 $4,090 $4,238 $16,648 $4,056 $4,160 $4,047 $4,173 $16,436
Growth (2)% (1)% (1)% (2)% (1)%
CC1 Growth (2)% (2)% (1)% Flat (1)%
Annuity % Revenue
85% 83% 83% 81% 83% 85% 84% 84% 83% 84%
Equipment $724 $855 $810 $969 $3,358 $715 $781 $748 $860 $3,104
Growth (1)% (9)% (8)% (11)% (8)%
CC1 Growth (2)% (9)% (8)% (9)% (7)%
2013
161Constant currency: see slide 23 for explanation of non-GAAP measures
2014
Note: 2013, Q1 2014, Q2 2014 and Q3 2014 are revised to remove business revenues that were reclassified to discontinued operations.
2013 quarterly growth are figures not available on a revised basis at this time.

Segment Revenue Trend
(in millions) Q1 Q2 Q3 Q4 FY Q1 Q2 Q3 Q4 FY
Services $2,584 $2,613 $2,596 $2,686 $10,479 $2,585 $2,651 $2,623 $2,725 $10,584
Growth Flat 1% 1% 1% 1%
CC1 Growth Flat 1% 1% 3% 1%
Document Technology $2,135 $2,263 $2,159 $2,351 $8,908 $2,044 $2,126 $2,029 $2,159 $8,358
Growth (4)% (6)% (6)% (8)% (6)%
CC1 Growth (5)% (7)% (6)% (6)% (6)%
Other $138 $166 $145 $170 $619 $142 $164 $143 $149 $598
Growth 3% (1)% (1)% (12)% (3)%
CC1 Growth 3% (2)% (2)% (11)% (3)%
2013
17
2014
1Constant currency: see slide 23 for explanation of non-GAAP measures
Note: 2013, Q1 2014, Q2 2014 and Q3 2014 are revised to remove business revenues that were reclassified to discontinued operations.
2013 quarterly growth are figures not available on a revised basis at this time.

Underlying Cash Flow
18
1Represents cash that would have been collected had we not sold finance receivables. Net of collections on beneficial interest.
2Underlying OCF is reported OCF adjusted for the impacts of Finance Receivable sales: see slide 23 for explanation of non-GAAP measures
(in millions) Q1 Q2 Q3 Q4 FY Q1 Q2 Q3 Q4 FY
Operating Cash Flow (OCF) $286 $325 $595 $857 $2,063 ($87) $533 $961 $968 $2,375
Adjustments:
Cash From F/R Sales - - - - - - - ($384) ($247) ($631)
Impact from prior F/R Sales1 $123 $112 $102 $96 $433 $89 $58 $68 $119 $334
Underlying OCF2$409 $437 $697 $953 $2,496 $2 $591 $645 $840 $2,078
2014 2013

Discontinued Operations Summary – Q4
19
1ITO Income from operations for both the 2014 and 2013 fourth quarters includes intangible amortization and other expenses of
approximately $9 million.
(in millions) ITO Other Total ITO Other Total
Revenues 327$ -$ 327$ 341$ 55$ 396$
Income (loss) from operations (1) 16$ -$ 16$ 21$ (2)$ 19$
Loss on disposal (181) - (181) - (2) (2)
Net (loss) income before income
taxes (165) - (165) 21 (4) 17
Income tax benefit (expense) 16 - 16 (7) (1) (8)
(Loss) income from discontinued
operations, net of tax (149)$ -$ (149)$ 14$ (5)$ 9$
Diluted (loss) earnings per share
from discontinued operations (0.13)$ 0.01$
Total diluted earnings per share,
inclusive of discontinued operations 0.13$ 0.24$
Three Months Ended December 31,
2014 2013
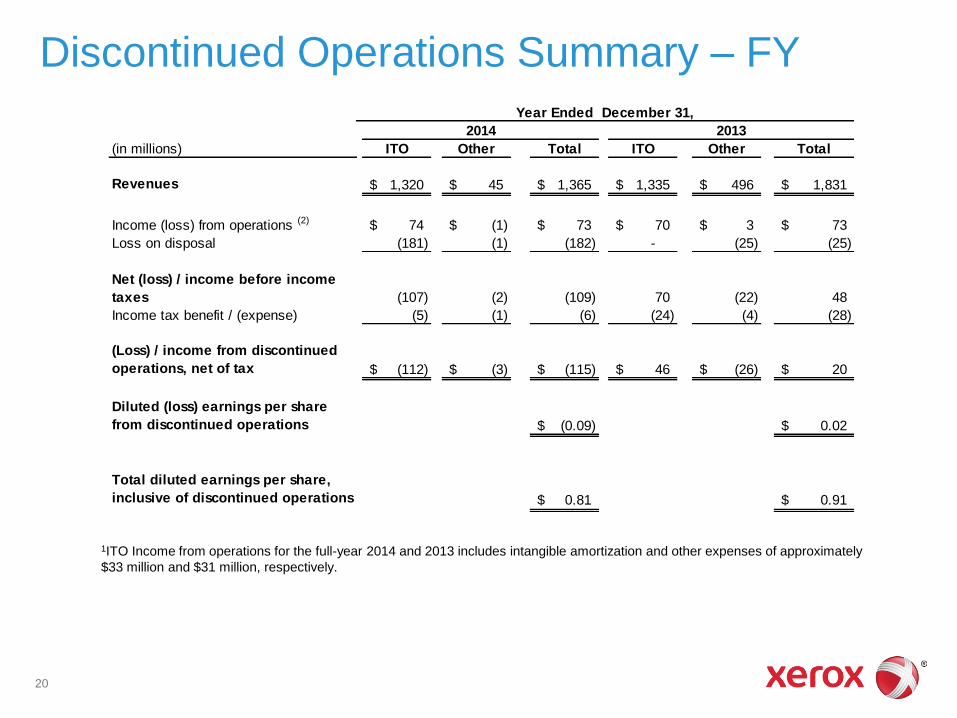
Discontinued Operations Summary – FY
20
1ITO Income from operations for the full-year 2014 and 2013 includes intangible amortization and other expenses of approximately
$33 million and $31 million, respectively.
(in millions) ITO Other Total ITO Other Total
Revenues 1,320$ 45$ 1,365$ 1,335$ 496$ 1,831$
Income (loss) from operations (2) 74$ (1)$ 73$ 70$ 3$ 73$
Loss on disposal (181) (1) (182) - (25) (25)
Net (loss) / income before income
taxes (107) (2) (109) 70 (22) 48
Income tax benefit / (expense) (5) (1) (6) (24) (4) (28)
(Loss) / income from discontinued
operations, net of tax (112)$ (3)$ (115)$ 46$ (26)$ 20$
Diluted (loss) earnings per share
from discontinued operations (0.09)$ 0.02$
Total diluted earnings per share,
inclusive of discontinued operations 0.81$ 0.91$
Year Ended December 31,
2014 2013

Discontinued Operations Revision Summary
21
Revised for the reclassification of the ITO business from Services segment to discontinued operations. Segment
profit for our other segments, Document Technology and Other, were impacted by minor reallocation of expenses
as well as rounding.
(in millions)
Q1 Q2 Q3 Q4 FY Q1 Q2 Q3 Q3 YTD
Revenues
Services 2,584$ 2,613$ 2,596$ 2,686$ 10,479$ 2,585$ 2,651$ 2,623$ 7,859$
Document Technology 2,135 2,263 2,159 2,351 8,908 2,044 2,126 2,029 6,199
Other 138 166 145 170 619 142 164 143 449
Total Revenues 4,857$ 5,042$ 4,900$ 5,207$ 20,006$ 4,771$ 4,941$ 4,795$ 14,507$
Segment Profit (Loss)
Services 250$ 276$ 268$ 261$ 1,055$ 222$ 226$ 240$ 688$
Document Technology 186 245 260 273 964 249 306 284 839
Other (68) (61) (54) (34) (217) (50) (75) (82) (207)
Segment Profit (Loss) 368$ 460$ 474$ 500$ 1,802$ 421$ 457$ 442$ 1,320$
Segment Margin
Services 9.7% 10.6% 10.3% 9.7% 10.1% 8.6% 8.5% 9.1% 8.8%
Document Technology 8.7% 10.8% 12.0% 11.6% 10.8% 12.2% 14.4% 14.0% 13.5%
Other (49.3%) (36.7%) (37.2%) (20.0%) (35.1%) (35.2%) (45.7%) (57.3%) (46.1%)
Segment Margin 7.6% 9.1% 9.7% 9.6% 9.0% 8.8% 9.2% 9.2% 9.1%
2013 2014

Non-GAAP Measures

23
“Adjusted Earnings Measures”: To better understand the trends in our business, we believe it is necessary to adjust the following
amounts determined in accordance with GAAP to exclude the effects of certain items as well as their related income tax effects.
• Net income and Earnings per share (“EPS”)
• Effective tax rate
In 2014 and 2013, we adjusted for the amortization of intangible assets. The amortization of intangible assets is driven by our acquisition
activity which can vary in size, nature and timing as compared to other companies within our industry and from period to period.
Accordingly, due to the incomparability of acquisition activity among companies and from period to period, we believe exclusion of the
amortization associated with intangible assets acquired through our acquisitions allows investors to better compare and understand our
results. The use of intangible assets contributed to our revenues earned during the periods presented and will contribute to our future
period revenues as well. Amortization of intangible assets will recur in future periods.
We also calculate and utilize an Operating income and margin earnings measure by adjusting our pre-tax income and margin amounts to
exclude certain items. In addition to the amortization of intangible assets, operating income and margin also exclude Other expenses, net
as well as Restructuring and asset impairment charges. Other expenses, net is primarily comprised of non-financing interest expense and
also includes certain other non-operating costs and expenses. Restructuring and asset impairment charges consist of costs primarily
related to severance and benefits for employees pursuant to formal restructuring and workforce reduction plans. Such charges are
expected to yield future benefits and savings with respect to our operational performance. We exclude these amounts in order to evaluate
our current and past operating performance and to better understand the expected future trends in our business.
“Constant Currency”: To better understand trends in our business, we believe that it is helpful to adjust revenue to exclude the impact
of changes in the translation of foreign currencies into U.S. dollars. We refer to this adjusted revenue as “constant currency.” Currencies
for developing market countries (Latin America, Brazil, Middle East, India, Eurasia and Central-Eastern Europe) that we operate in are
reported at actual exchange rates for both actual and constant revenue growth rates because (1) these countries historically have had
volatile currency and inflationary environments and (2) our subsidiaries in these countries have historically taken pricing actions to mitigate
the impact of inflation and devaluation. Management believes the constant currency measure provides investors an additional perspective
on revenue trends. Currency impact can be determined as the difference between actual growth rates and constant currency growth
rates.
Non-GAAP Financial Measures

24
“Free Cash Flow”: To better understand the trends in our business, we believe that it is helpful to adjust cash flows from operations to
exclude amounts for capital expenditures including internal use software. Management believes this measure gives investors an additional
perspective on cash flow from operating activities in excess of amounts required for reinvestment. It provides a measure of our ability to
fund acquisitions, dividends and share repurchase. It also is used to measure our yield on market capitalization. A reconciliation of this
non-GAAP financial measure and the most directly comparable measure calculated and presented in accordance with GAAP is set forth in
the slide entitled “2015 Guidance”.
“Underlying Cash Flow”: To better understand the trends in our business, we believe that it is helpful to adjust cash flows from
operations for the cash flow impacts from our sales of finance receivables. The sale of finance receivables has a significant impact on
operating cash flows in the period of sale as well as on collections in subsequent periods due to the long term nature of these receivables.
In addition to providing a better understanding of the underlying trends in cash flows from operations, management believes this measure
gives investors an additional perspective on comparing and analyzing the year-over-year changes in our cash flows as well as the impacts
of these sales on cash flows in the period. A reconciliation of this non-GAAP financial measure and the most directly comparable measure
calculated and presented in accordance with GAAP is set forth in the slide entitled “Underlying Cash Flows”.
Management believes that these non-GAAP financial measures provide an additional means of analyzing the current periods’ results
against the corresponding prior periods’ results. However, these non-GAAP financial measures should be viewed in addition to, and not
as a substitute for, the Company’s reported results prepared in accordance with GAAP. Our non-GAAP financial measures are not meant
to be considered in isolation or as a substitute for comparable GAAP measures and should be read only in conjunction with our
consolidated financial statements prepared in accordance with GAAP. Our management regularly uses our supplemental non-GAAP
financial measures internally to understand, manage and evaluate our business and make operating decisions. These non-GAAP
measures are among the primary factors management uses in planning for and forecasting future periods. Compensation of our
executives is based in part on the performance of our business based on these non-GAAP measures.
Unless otherwise noted, reconciliations of these non-GAAP financial measures and the most directly comparable measures calculated and
presented in accordance with GAAP are set forth on the following slides.
Non-GAAP Financial Measures

25
Q4 GAAP EPS to Adjusted EPS Track
(in millions; except per share amounts) Net Income EPS Net Income EPS
Reported(1)305$ 0.26$ 297$ 0.23$
Adjustments:
Amortization of intangible assets 52 0.05 47 0.04
Adjusted 357$ 0.31$ 344$ 0.27$
Weighted average shares for adjusted EPS(2) 1,171 1,261
Fully diluted shares at end of period(3) 1,159
Three Months Ended
December 31, 2014
Three Months Ended
December 31, 2013
(2) Average shares for the calculation of adjusted EPS include 27 million of shares associated with the Series A
convertib le preferred stock and therefore the related quarterly dividend was excluded.
(3) Represents common shares outstanding at December 31, 2014 as well as shares associated with our
Series A convertib le preferred stock plus dilutive potential common shares as used for the calculation of diluted
earnings per share in the fourth quarter 2014.
(1) Net Income and EPS from continuing operations attributable to Xerox.

26
FY GAAP EPS to Adjusted EPS Track
(in millions; except per share amounts) Net Income EPS Net Income EPS
Reported(1)1,084$ 0.90$ 1,139$ 0.89$
Adjustments:
Amortization of intangible assets 196 0.17 189 0.15
Adjusted 1,280$ 1.07$ 1,328$ 1.04$
Weighted average shares for adjusted EPS(2) 1,199 1,274
Fully diluted shares at end of period(3) 1,159__________
December 31, 2014
Year Ended Year Ended
(2) Average shares for the calculation of adjusted EPS include 27 million of shares associated with the Series A
convertib le preferred stock and therefore the related quarterly dividend was excluded.
(3) Represents common shares outstanding at December 31, 2014 as well as shares associated with our
Series A convertib le preferred stock plus dilutive potential common shares as used for the calculation of diluted
earnings per share in the fourth quarter 2014.
December 31, 2013
(1) Net Income and EPS from continuing operations attributable to Xerox.

27
GAAP EPS to Adjusted EPS Guidance Track
Q1 2015 FY 2015
GAAP EPS from Continuing Operations $0.16 - $0.18 $0.83 - $0.89
Adjustments:
Amortization of intangible assets 0.04 0.17
Adjusted EPS $0.20 - $0.22 $1.00 - $1.06
Note: GAAP and Adjusted EPS guidance includes anticipated restructuring
Earnings Per Share Guidance

28
Q4 Adjusted Operating Income/Margin
(in millions) Profit Revenue Margin Profit Revenue Margin
Reported pre-tax income (1)348$ 5,033$ 6.9% 326$ 5,207$ 6.3%
Adjustments:
Amortization of intangible assets 83 76
Xerox restructuring charge 36 55
Other expenses, net 57 33
Adjusted Operating 524$ 5,033$ 10.4% 490$ 5,207$ 9.4%
Three Months Ended Three Months Ended
December 31, 2014 December 31, 2013
(1) Profit and Revenue from continuing operations attributable to Xerox.

29
FY Adjusted Operating Income/Margin
(in millions) Profit Revenue Margin Profit Revenue Margin
Reported pre-tax income (1)1,206$ 19,540$ 6.2% 1,243$ 20,006$ 6.2%
Adjustments:
Amortization of intangible assets 315 305
Xerox restructuring charge 128 115
Other expenses, net 232 146
Adjusted Operating 1,881$ 19,540$ 9.6% 1,809$ 20,006$ 9.0%
December 31, 2014 December 31, 2013
Year Ended Year Ended
(1) Profit and Revenue from continuing operations attributable to Xerox.

30
Q4 and FY Adjusted Other, net
Three Months Ended Three Months Ended
(in millions) December 31, 2014 December 31, 2013
Other expenses, net - Reported 57$ 33$
Adjustments:
Xerox restructuring charge 36 55
Net income attributable to noncontrolling interests 6 5
Other expenses, net - Adjusted 99$ 93$
Year Ended Year Ended
(in millions) December 31, 2014 December 31, 2013
Other expenses, net - Reported 232$ 146$
Adjustments:
Xerox restructuring charge 128 115
Net income attributable to noncontrolling interests 23 20
Other expenses, net - Adjusted 383$ 281$

31
Q4 and FY Adjusted Effective Tax Rate
(in millions)
Pre-Tax
Income
Income
Tax
Expense
Effective
Tax
Rate
Pre-Tax
Income
Income
Tax
Expense
Effective
Tax Rate
Reported(1) 348$ 78$ 22.4% 326$ 67$ 20.6%
Adjustments:
Amortization of intangible assets 83 31 76 29
Adjusted 431$ 109$ 25.3% 402$ 96$ 23.9%
(in millions)
Pre-Tax
Income
Income
Tax
Expense
Effective
Tax
Rate
Pre-Tax
Income
Income
Tax
Expense
Effective
Tax Rate
Reported(1) 1,206$ 259$ 21.5% 1,243$ 253$ 20.4%
Adjustments:
Amortization of intangible assets 315 119 305 116
Adjusted 1,521$ 378$ 24.9% 1,548$ 369$ 23.8%
(1) Pre-Tax Income and Income Tax Expense from continuing operations attributable to Xerox.
Three Months Ended Three Months Ended
December 31, 2014 December 31, 2013
Year Ended Year Ended
December 31, 2014 December 31, 2013

32
Q4 and FY Services Revenue Breakdown
Note: The above table has been revised to reflect the reclassification of the ITO business to discontinued operations. Additionally,
2013 Business Process Outsourcing (BPO) revenues have been revised to conform to the 2014 presentation of revenues.
(in millions) 2014 2013 Change
Revenue
CC
Change 2014 2013 Change
Revenue
CC
Change
Business Processing Outsourcing 1,877$ 1,824$ 3% 4% 7,304$ 7,244$ 1% 1%
Document Outsourcing 874 889 (2%) 1% 3,388 3,337 2% 2%
Less: Intra-Segment Eliminations (26) (27) (4%) (4%) (108) (102) 6% 6%
Total Revenue - Services 2,725$ 2,686$ 1% 3% 10,584$ 10,479$ 1% 1%
2,725 2,686 10,584 10,479
Three Months Ended December 31, Year Ended December 31,