Embed Size (px)
DESCRIPTION
Quantitative variability of the copepod assemblages in the northern Adriatic Sea from 1993 to 1997 在 1993~1997 年間北亞德里亞海橈足類群聚數量的變動. Frano Kr šinićª , * , Dubravka Bojanić b , Robert Precali c , Robert Kraus c Estuarine, Coastal and Shelf Science(2007),74:528-538 Reporter: Meng-Yau Li. - PowerPoint PPT Presentation
Citation preview

1
Quantitative variability of the copepod assemblages in the northern Adriatic Sea fr
om 1993 to 1997在 1993~1997 年間北亞德里亞海橈足類群聚數量的變動
Frano Kršinićª,* , Dubravka Bojanić b ,Robert Precali c , Robert Kraus c
Estuarine, Coastal and Shelf Science(2007),74:528-538
Reporter: Meng-Yau Li

2
Introduction The western part of this
area is higher productivity than eastern.
Comparison of these result ,total copepod population and phytoplankton blooms in past and present.

3

4
Micro-phytoplankton (cells >20μm)
Calanoida 哲水蚤 Oithonids長腹劍水蚤
Oncaeid大眼劍水蚤
Nauplii 橈足類幼生
Ciliate 纖毛蟲
Nano-phytoplankton (cells 2-20μm)
Tintinnid水母類

5
Objective Two characteristic stations in the northern Adriat
ic Sea between 1993 and 1997. It determine the quantitative aspect of the popul
ation structure , seasonal abundance and vertical variability of all copepod assemblages .
Significantly influence changes in the ecosystem of this sensitive region.

6
Materials and methods
Vessel : Vila Velebita ,43 Cruises Station: SJ107Eastern and SJ108Western Period : January 1993 to October 1997 Depth : 0.5m 、 10m 、 20m and near botto
m

7
Fig.1. Map of the northern Adriatic Sea with location of sampling stations.

8
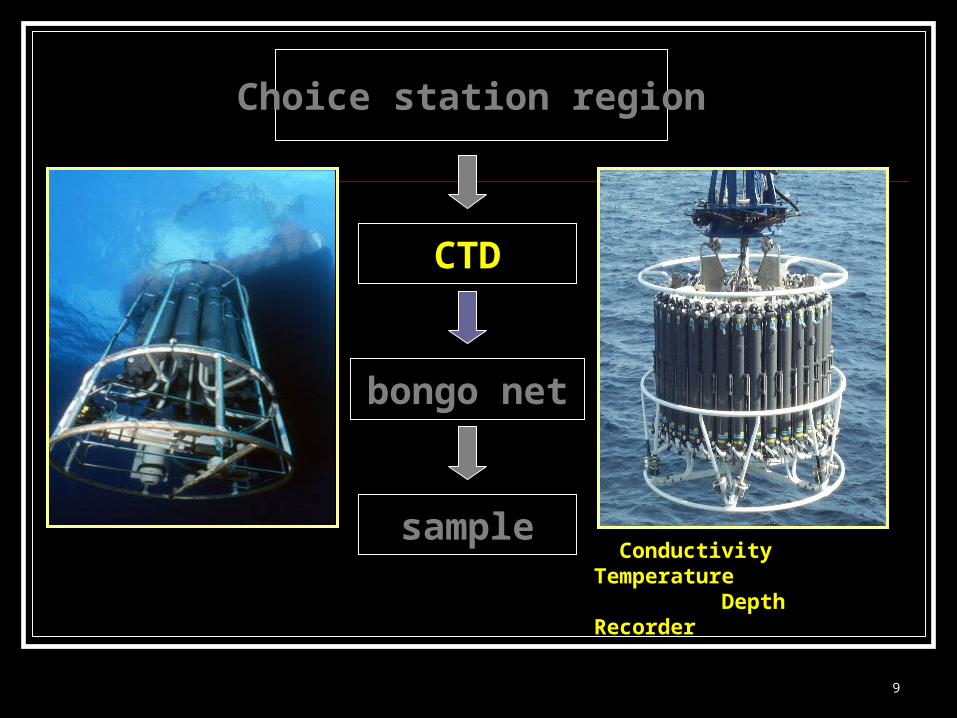
Choice station region
CTD
bongo net
sample
9
Choice station region
CTD
bongo net
sample Conductivity Temperature Depth Recorder

10
Choice station region
CTD
bongo net
sample

11
Choice station region
CTD
bongo net
sampling
2.5 formaldehyde﹪ 2 lugol’s solution﹪

12
Multivariate analysis (perform)
multi-dimensional Scaling (MDS)
Bray-Curtis similarity (classification)
Similarity percentage Analysis (SIMPER)
Log(n+1)

13
Result

14
Result
2.Phytoplankton1.Hydrography3.Ciliated pr
otozoans
Abundance and
variable
4.Copepod assemblages
Oithonid and
OncaeidcalanoidaNuplii
Predominance and Significant species

15
Result
2.Phytoplankton1.Hydrography3.Ciliated pr
otozoans
Abundance and
variable
4.Copepod assemblages
Oithonid and
OncaeidcalanoidaNuplii
Predominance and Significant species

16
1. Hydrography
1. tMin(7.40 ) ,tMax(29.83 )℃ ℃ ; sMin(21),sMax(38.77)2. tMax(29.83 ) and sMin(21) in SJ108℃
3.But , sMax(38.77) in SJ107 Southern current
1.Pronunced saltier and warmer water intrusion area.2.Lack of circulation.

17
Result
2.Phytoplankton1.Hydrography3.Ciliated pr
otozoans
Abundance and
variable
4.Copepod assemblages
Oithonid and
OncaeidcalanoidaNuplii
Predominance and Significant species

18
2.Phytoplankton----compare SJ107E and SJ108W abundance
a. 40-70% b. 10-30%

19
Result
2.Phytoplankton1.Hydrography3.Ciliated pr
otozoans
Abundance and
variable
4.Copepod assemblages
Oithonid and
OncaeidcalanoidaNuplii
Predominance and Significant species

20
3.Ciliated protozoans
2. Max SJ108W1. Max SJ107E Min SJ107E
3. Max SJ108Tintinnopsis minuta =97%

21
Result
2.Phytoplankton1.Hydrography3.Ciliated pr
otozoans
Abundance and
variable
4.Copepod assemblages
Oithonid and
OncaeidcalanoidaNuplii
Predominance and Significant species

22
4.Copepod assemblages-Nauplii
2. MaxD,20m1.MaxD,10m 3.SJ107E 10m and SJ108W MinD at the same time

23
Nauplii total number of copepods
Year StationPercentage
(%)
1995 SJ107 67
1996 SJ107 55-67
1997 SJ107 84
1993 SJ108 74
1994~1995
SJ108 63
1997 SJ108 80

24
Result
2.Phytoplankton1.Hydrography3.Ciliated pr
otozoans
Abundance and
variable
4.Copepod assemblages
Oithonid and
OncaeidcalanoidaNuplii
Predominance and Significant species

25
4.Copepod assemblages-Calanoida
3.SJ108W33-50% >SJ107E2.June to August 1.Surface 10m , Population Variation
SJ107E
SJ108W

26
Predominance species August- Paracalanus parvus ( 小擬哲水蚤 )
November- Acartia clausi
( 刺尾紡錘水蚤 )
Average18~38%

27
Significant species Ctenocalanus vanus
Temora longicornis( 寬水蚤 )
Centropages typicus( 刺水蚤 )

28
Result
2.Phytoplankton1.Hydrography3.Ciliated pr
otozoans
Abundance and
variable
4.Copepod assemblages
Oithonid and
OncaeidcalanoidaNuplii
Predominance and Significant species

29
4.Copepod assemblages-Oithnid
1.SJ108W>SJ107E 3.1993 and 1994,50-64%2.MaxD,10m-20m
4.Oithona nana and oithona similis,20-47%
SJ107E
SJ108W

30
4.Copepod assemblages-Oncaeids
1.Max value Autumn/Winter, except summer of 1997
24-40%
18-53%
SJ107E
SJ108W
2. 20m,1994Dec. SJ108W-Oncaea waldemari 1997Sep. SJ108W-Monothula subtilis bottom,Oncaea media and Oncaea zernovi

31

32
Statistical analysis
SJ107 E
SJ107 E
1.In 1994 and 1995,Non-loricates(無甲殼類 ) from group C was high value.
2.Oncaeid(大眼劍水蚤 ) from group A2 at 1993.1994.1995
3.Nuplii(橈足類幼生 ) and Tintinnid(水母類 ) belong group B
4.Group D was Tintinnids in 1997.

33
SJ108 W
1. Oncaeid (大眼劍水蚤 ) from group A2 at 1994 and 1995.
2. In 1994 and 1995,Nuaplii (橈足類幼生 )from group C was high value.

34
Use SIMPER Analysis
Species group
variable
Percentage
(% )
Nauplii 33
Oncaeids 24.3
Oithonids 22.9
Calanoids 19.8

35
Fig.7. Average Max value SJ108 ; 5.8×10⁶
Average Max value SJ107 ; 5.2×10⁶
36
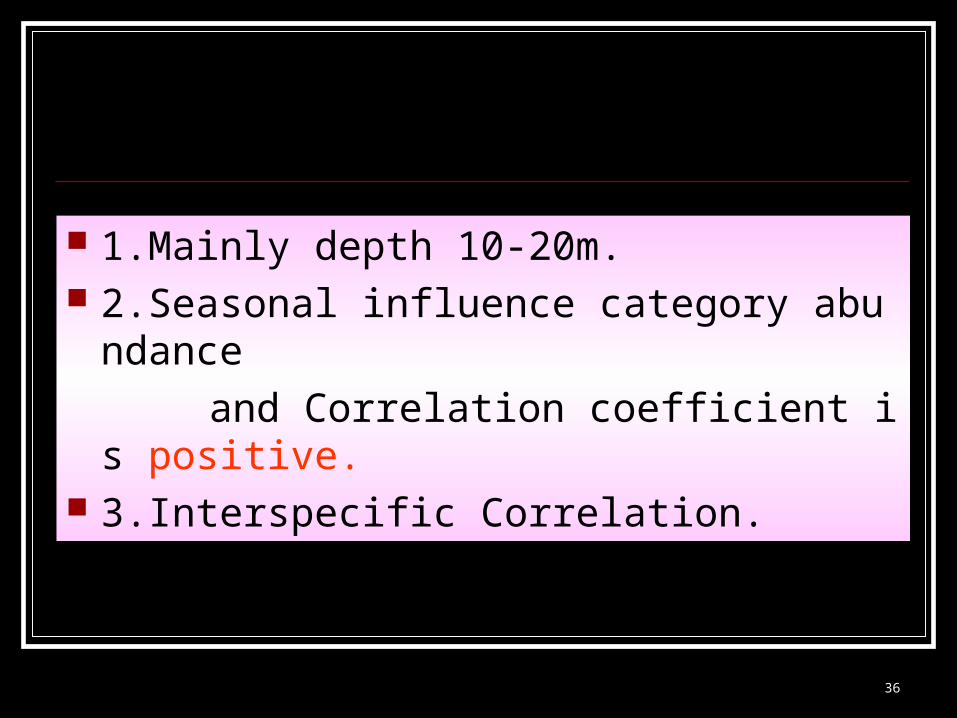
1.Mainly depth 10-20m. 2.Seasonal influence category abundance
and Correlation coefficient is positive. 3.Interspecific Correlation.

37
Conclusion The structure and variability of major group of
copepod population in northern Adriatic. Complex processes and regulation of
phytoplankton production levels during the warmer months.
Combine all methods in determine patterns in vertical distributeions,and during the stratification period.

38
The End~
Thank you !!