Embed Size (px)
Citation preview

8/3/2019 Furlan, 2005
http://slidepdf.com/reader/full/furlan-2005 1/12
Hyaluronan chain conformation and dynamics
Sara Furlan,a, Giovanni La Penna,b,à Angelo Pericob and Attilio Cesaroa,*
aDepartment of Biochemistry, Biophysics and Macromolecular Chemistry, UdR INSTM, University of Trieste, I-34127 Trieste, ItalybInstitute for Macromolecular Studies, Section of Genova, National Research Council, via De Marini 6, I-16149 Genova, Italy
Received 13 October 2004; accepted 25 January 2005
Dedicated to Professor David A. Brant
Abstract— An overview of the present state of research in the field of hyaluronan chain conformational aspects is presented. Therelationship between structure and dynamics are illustrated for a series of hyaluronan oligomers. Conformational characteristics
of hyaluronan chains are discussed, together with the dynamic chain patterns, evaluated by using a theoretical approach to diffusive
polymer dynamics. The dependence of correlation times and NMR relaxation parameters from the chain dimension are investigated.
Topological features and dimensional properties are related to the structural determinants by using classical computational methods
of molecular mechanics and Monte Carlo simulation.Ó 2005 Elsevier Ltd. All rights reserved.
Keywords: Hyaluronan; HA oligomers; Monte Carlo; Conformational energy; Local dynamics; Chain conformation
1. Introduction
In recent years, significant progress has been made in
both the experimental and theoretical research tools
needed to study the conformational complexity of car-
bohydrate polymers in solution,1 using such methods
as X-ray and neutron-scattering techniques (SAXS and
SANS), atomic-force microscopy (AFM), high-resolu-
tion NMR spectroscopy and relaxation techniques,
and computational methods. The prediction of conform-
ational features has always been the main aim of mole-
cular mechanics (MM) since the beginning.2,3 Unrefined
or semi-empirical force-fields have been used by several
authors with the implicit assumption of possessing themost appropriate tool for this purpose. Leaving aside
the ordered conformations of the secondary structures
deduced by diffraction studies, several experimental
(thermodynamic) averages have been, from time to time,proposed as suitable for comparison with models con-
structed by computational procedures. All experimental
and computational methods unequivocally indicate the
relevance of the monomer structure and linkage of envi-
ronmental effects (such as, solvent composition, pH and
salt conditions, and temperature) on the topological
shape and properties of carbohydrate polymers.4 The
general problem of the solvent effect on conformational
states, and preferential solvation of oligo- and poly-sac-
charides has been tackled mainly to validate detailed
molecular models that were developed for relating the
structural characteristics of these macromolecules totheir chemical, physical, and biological properties in
solution.5 Even recently, however, semi-empirical meth-
ods have been shown very useful and are generally appli-
cable to diff erent chain linkages and monomer
composition.6,7
In this paper we follow a protocol well established for
the quantitative description of the size and shape of bio-
polymer chains (here, specifically hyaluronan, HA). This
implies the construction of chain models by numerical
0008-6215/$ - see front matter Ó 2005 Elsevier Ltd. All rights reserved.
doi:10.1016/j.carres.2005.01.030
* Corresponding author. Fax: +39 040 558 3684; e-mail: cesaro@
units.itOn temporarily leave at Institute for Macromolecular Studies,
Genova.àAffiliated to the Magnetic Resonance Center, University of Firenze,
Italy.
Carbohydrate
RESEARCH
Carbohydrate Research 340 (2005) 959–970

8/3/2019 Furlan, 2005
http://slidepdf.com/reader/full/furlan-2005 2/12
Monte Carlo simulation8 on the basis of conformational
statistical weights of representative dimeric units. How-
ever, for the first time (to the best of our knowledge) the
force field used for the conformational energy landscape
has been carefully calibrated and tested to fit the local
dynamics of oligomeric chain segments.9 In doing that,
many approximations necessarily made within the dimer
statistics are removed. To some extent, however, this
approach is similar to other attempts that used different
statistical equilibrium properties (like SAXS data in the
case of pullulan6,10).
The paper is organized as follows. The next part pro-
vides a brief but essential summary of literature results
on HA conformation, in order to establish the relevant
background (more details are given in the review by
Cowman in this issue11). The ÔComputational MethodsÕ
section summarizes the methods to obtain the maps of
glycosidic linkages, the statistical chains, and NMR
relaxivities. A summary of the definitions of the para-
meters describing the conformations of HA oligomersand polymers is also included there. In the ÔResults
and DiscussionÕ section, firstly the conformation of
short UA oligomers is analyzed, then, the 13C NMR
relaxivities of (UA)n oligomers, with n < 7, are discussed
in terms of conformational and frictional properties;
and finally, the average chain parameters such as persis-
tence length and radius of gyration are calculated and
compared with literature data. In the ÔConclusionsÕ sec-
tion, implications and perspectives of this approach in
the frame of the HA polymer are given.
2. A brief outlook on the conformational properties of
hyaluronan
The relevance of hyaluronan (HA) in living organisms
and in artificial biological systems has been emphasized
and reported in many occasions.12,13 This polysaccha-
ride displays intriguing viscoelastic and conformational
features, although it has a relatively simple regular
structure, being an alternating copolymer with a disac-
charide (U,A) repeat unit, {!4)-b-DD-glucuronate-
(1!3)-2-deoxy-2-acetamido-b-DD-glucose-(1!}, as illus-
trated in Figure 1. There are several aspects of HA that
make this molecule an interesting subject for investiga-
tion. The macromolecular properties of high molecular
weight hyaluronan in dilute solution have been consist-
ently interpreted11 on the basis of a worm-like coil with
moderate stiffness,14 and more recently of a ÔstiffishÕ
coil15 but an atomistic description of these properties
has been elusive.
Although the present study does not deal with concen-
trated interacting chains, it is relevant to the discordant
interpretation that has been given for the ÔstickinessÕ of
HA chains observed in solution (network-forming and
laterally-aggregating behavior). Rheological proper-
ties16,17 of hyaluronan solutions in several conditions
of concentration, pH, ionic strength, and molecular
weight, have been investigated in order to shed light
onto the effects that might arise from conformational
ordering. Several studies have suggested that the deter-
mining factors for conformation and packing in thesolid state18 also influence the hyaluronan chain in
solution. In particular, the tendency to aggregation has
been ascribed by some authors19,20 to in-registry inter-
molecular and intramolecular interactions between the
polysaccharide chains, but the f ormation of stable
aggregates has been questioned.21 In solution free of
added electrolyte, HA forms polydisperse, entangled
aggregates, which remain stable for weeks at a time,
while in solutions of medium to high ionic strength,
most of these aggregates disentangle within days.22
An extensive hydrogen-bonding network has been
claimed by several authors for the secondary structureof hyaluronan in aqueous solution, which would give
the polymer an overall expanded-coil structure. How-
ever, the actual effect of these interactions on the chain
conformation has not been extended to more than short
oligosaccharides, in a solid-like crystalline conforma-
tion. Another recent paper17 suggested a detailed topo-
logical structure for the high molecular weight HA
and unfractionated low molecular weight HA fragments
in aqueous solution, on the basis of local structural
information gained by 13C NMR and X-ray fiber-
Figure 1. Schematic drawing of the tetrasaccharide (U(i )–A(i )–U(i + 1)–A(i + 1)) in HA chain. Main atomic position and torsion angles at the
glycosidic linkages and C-6 atom are labeled.
960 S. Furlan et al. / Carbohydrate Research 340 (2005) 959–970
8/3/2019 Furlan, 2005
http://slidepdf.com/reader/full/furlan-2005 3/12
diffraction data. This picture is in conflict with the old
experimental data of scattering and intrinsic viscosity
that suggest a moderate stiffness, namely, a persistence
length Lp of about 5 nm.14 Other authors22 found that
the total apparent persistence length varied from about
8.7 nm at the high ionic-strength limit to nearly 40 nm
at 1 mM added NaCl, and this was considered to be
consistent with the earlier knowledge of local stiffening.
Almost similar conclusions were reached by recent
investigations on fractionated samples of HA over a
wide range of molecular weights (104 –107), suggesting
that the worm-like chain model with unmistakable
semi-flexibility can be applied to this polymer. However,
by using different theoretical models, slightly discordant
values of Lp have been extracted, ranging from 4.2
to 10 nm.11,23–28 Besides the lower values found
by Hayashi et al.23 and by Takahashi et al.24 (4.2–
4.5 nm, in 0.2 M NaCl) most of the other literature re-
sults show higher values. A persistence length of
8.5 nm was calculated by Fouissac et al.25 in 0.3 MNaCl, while a value of 9–15 nm was reported in
0.15 M by Gamini et al.26 More recently, Mendichi et al.27
reported Lp = 9.5–9.8 nm for ultra-high molecular
weight HA samples in 0.5 M NaCl and a smaller value
(6.8–7.5 nm) for another set of samples with lower
molecular weights (104 –106). The dependence of Lp of
worm-like polyelectrolytes on the salt concentration is
well known, and may in part justify these differences.
The most recent investigation28 by static, dynamic,
and small-angle neutron-scattering confirms the values
for the intrinsic persistence length of the chain (i.e.,
Lpo % 9 nm), and suggests that the total persistencelength, LpT = Lpo + Lpe, is almost doubled in conditions
of low ionic strength due to the electrostatic contribu-
tion to the Lpe term.
However, identification of the physical reasons for the
conformational versatility of HA still elude a full mole-
cular understanding. To this end both MD and NMR
studies (or a combination of them) have recently been
carried out.29–40 Among experimental investigations,
an NMR study29 of the effects of various environmental
conditions on the conformation of oligomeric and poly-
meric HA suggested that the conformational versatility
of HA is related mainly to the averaging of conforma-
tional states at the glycosidic linkages. Other morerecent MD and NMR studies have been mostly
restricted to small oligomers, leaving out any flexibility
and claiming a strict rigidity for both (1!3) and
(1!4) linkages, Ôdue to direct and/or water mediated in-
ter-residue hydrogen bondingÕ.30 Whether this rigidity
can be extended to the description of high molecular
weight chains is undoubtedly questionable. Several
other MD and NMR data suggest a dynamic stiffness
modulated along the chain, because Ôno one hydrogen
bond exists for an extended period of timeÕ.31 Indeed,
some other recent NMR investigations32,33 addressed
their attention specifically on dynamic parameters
(relaxivities), providing a good comparison between
experimental results and the simulations34 discussed
later.
As far as the computational studies are concerned,
several MD simulation studies have been confined to
very short oligomers (from disaccharides to tetrasaccha-
rides).30–32,34 The conformational freedom of hyaluro-
nan di- and tetra-saccharides has been compared with
available NMR data, stressing the importance of the
hydrogen-bonding network, based both on direct intra-
molecular hydrogen-bonding and through water caging
around the glycosidic linkage.31 The combination of
computer simulations with diffusion theory gives a
microscopic description of the NMR relaxivities for bio-
polymers, without any approximations concerning the
separation35 or coupling between time scales.36 Never-
theless, most of the MD applications to HA oligo-
mers30,32,37–40 did not involve a quantitative derivation
of NMR parameters from MD trajectories, mainly be-cause of the large errors in simulated time-correlation
functions. Calculation of NMR relaxation parameters
based on diffusion theory and mode-coupling approach
(MCD theory, hereafter) were performed on HA oligo-
mers.34 The results showed that the method permits cal-
culation, on a microscopic basis, of every 2nd-rank TCF
in the molecule, once the configurational statistics have
been modeled. Still more recently, the effects of hydro-
gen-bond networks, electrostatic interactions, and solva-
tion effects combined with short-range torsional
potential, have been taken into account by using numeri-
cal techniques to obtain the configurational statistics.
9,34
MD simulations provided both the dynamics of the
variables and their statistical averages and distributions,
by acquiring deterministic trajectories of every configu-
rational variable in the canonical ensemble.
However, none of these MD simulations have been
fully exploited to predict the conformational features
of HA polymer. In other words, where quantitative data
were available on a macromolecular scale no atomistic
description was possible, and Ôvice versaÕ. Most often,
the bridging between results obtained either on small
HA oligomers or on statistical (thermodynamic) aver-
ages has been ambiguously interpreted, as already men-
tioned, in terms of chain Ôsemi-flexibilityÕ, ÔstiffnessÕ,ÔrigidityÕ, and ÔstickinessÕ.
The foregoing summary was considered necessary in
order to stress the importance of those studies that have
provided the intrinsic key to reveal the molecular proper-
ties and the unique versatility of HA. This overview of
the concepts on which present knowledge of the HA con-
formation is based leaves the impression that the gap
between the local intra-residue conformational dynamics
and the overall chain conformational shape has not yet
been filled. Based on simplistic statistical considerations,
the persistence of connecting inter-residue bridges
S. Furlan et al. / Carbohydrate Research 340 (2005) 959–970 961
8/3/2019 Furlan, 2005
http://slidepdf.com/reader/full/furlan-2005 4/12
(as proposed on the basis of the recent studies) up to rather
long oligomers does not appear to be straightforward,
unless highly cooperative interactions are claimed. The
main difficulty is the availability of both experimental
dynamic data on suitable oligomers (longer than a tetra-
saccharide) and dynamic simulation data on the whole
series of homologues, from the short tetrasaccharide to
the high molecular weight chains.
3. Computational methods
3.1. Nomenclature
Hyaluronan (HA) is made up of repeating disaccharide
units each constituting b-DD-glucuronic acid (GlcA) and
2-acetamido-2-deoxy-b-DD-glucose (GlcNAc) linked (1!3)
and (1!4), respectively (see Fig. 1). In this paper, these
residues are labeled as U and A, respectively. Thus, the
HA chains are indicated with (UA)n where n is thenumber of disaccharide units. In the calculation of
dimensional properties (such as, the characteristic ratio
C n = hr02i/Nl 2), however, the usual convention for
copolymers has been used, with N = 2n and the virtual
bond l is given by the relation l 2 = (l U2 + l A
2)/2.
The U and W dihedral angles in the glycosidic linkages
are defined as the dihedral angles between the bonds
H-1(U)–C-1(U)–O-1(U)–C-3(A) and C-1(U)–O-1(U)–C-
3(A)–H-3(A) for UA and H-1(A)–C-1(A)–O-1(A)–C-
4(U) and C-1(A)–O-1(A)–C-4(U)–H-4(U) for AU,
respectively, where the dihedral angle is 180° in the trans
conformation.
2
3.2. Choice of the force field
In our previous reports9,34 the CHARMm force-field
developed for saccharides was always used. In Ref. 9
the conformational maps of UA and AU dimers were
reported, and from those maps statistical chains were
generated, with average persistence length of about
20 nm (data not shown) using the same method de-
scribed later. This value does not agree with the ac-
cepted experimentally estimated persistence length of
about 9 nm. As observed in our previous paper, the high
rigidity of this model for the HA chain is due to the inac-cessibility of minima far from the absolute minimum in
the conformational map. These energy minima are
accessible at high temperature, and are expected to sta-
tistically increase the flexibility of the HA chain, inas-
much they provide more compact conformations.
Therefore, the version of the CHARMm force-field used
describes well the conformational wobbling around the
conformations of larger stability (the global minimum),
and is suitable for local dynamics and molecular-dynam-
ics simulations. Nevertheless, a different force-field must
be chosen when describing statistical properties that are
sensitive to the presence of different minima in the con-
formational energy-map. A suitable test for the choice
of such a force field is the construction of molecular
chains according to the conformational maps of oligo-
mers. Among the sets of parameters mentioned in the lit-
erature, and for the reasons outlined in the results, we
have chosen to use the OPLS all-atom (OPLS-AA)
force-field, whose parameters are available41 and
reported in published tables when used on
carbohydrates.42
3.3. Generation of conformational maps
Energy maps of UA and AU dimers as functions of the
U and W dihedral angles of the glycosidic linkages were
obtained through Monte Carlo (MC) simulated anneal-
ing (SA) trajectories of the all-atom OPLS models in
vacuum of AUAU and UAUA tetrasaccharides, respec-
tively. Description of simulations9 and the program43
used has already been reported.Both UAUA and AUAU are composed of 95 atoms
(all the atoms in the molecule). The dihedral angles in
the pyranose rings were kept constant at their values ini-
tially set. For each set of U, W dihedral angles in the gly-
cosidic linkages, the other 24 dihedral angles were used
as degrees of freedom. The carboxylate groups are all
neutral in the adopted force field like in our previous
papers.9,34
The electrostatic interactions were damped and
shifted by using the charge neutralization approach,44
so as to allow the use of a distance cut-off to speed-up
simulations and to avoid the usual dependence of elec-trostatic potential-energy from the cut-off. Both Len-
nard–Jones and damped electrostatic interactions were
smoothly switched off between 0.9 and 1.0 nm and the
damping constant for electrostatic interactions was
2 nmÀ1.9 A dielectric constant of 1 was used in the
calculations.
The MC algorithm extracts the statistics from sug-
gested configurational moves. These moves were ob-
tained, as usual, in the torsional space by randomly
modifying dihedral angles and keeping bond distances
and angles constant, including the dihedral angles of
pyranose rings. The bond distances and angles are kept
fixed to equilibrium values, except for the glycosidicbending angle, which was fixed at 117°. The pyranose
rings were always in the 4C 1 conformation.
One dihedral angle is randomly chosen within the set
of variables and modified by applying a random dis-
placement in the range [0,±p]. A MC sweep corresponds
to the tentative modification of the entire set of vari-
ables. A Monte Carlo trajectory of 100,000 sweeps was
performed for each pair of fixed U and W glycosidic
dihedral angles in the central linkage. The pair of
dihedral angles was modified in steps of 10°. The tem-
perature of the MC trajectory was exponentially
962 S. Furlan et al. / Carbohydrate Research 340 (2005) 959–970

8/3/2019 Furlan, 2005
http://slidepdf.com/reader/full/furlan-2005 5/12
decreased according to rule b = b0(b1/b0)(i À1)/(N À1) with
b = 1/k BT , i the current MC sweep, N the total number
of MC sweeps, the initial temperature T 0 = 1000 K and
the final temperature T 1 = 100 K. The potential-energy
U corresponding to the minimum explored during the
annealing was assigned to the corresponding point in
the conformational map U (U,W).
3.4. Generation of statistical chains
In order to evaluate the behavior and the dimensions of
HA polymer chains in solution, in H conditions, sam-
ples of chains with n up to 500, that is, (UA)500, were
generated by using the Monte Carlo technique. In this
calculation, the polymer chain is assembled residue by
residue. The conformation of each glycosidic linkage
along the chain is selected using the Metropolis algo-
rithm from (U,W,U) triads of UA and AU maps. This
construction does not take into account interactions be-
tween atoms farther than four monosaccharides alongthe chain. Thus the excluded volume is not taken into
account. Statistical Monte Carlo sampling of 20,000
chain conformation was performed at the temperature
of 300 K by a program implemented in our laboratory.
The topological properties, such as the unperturbed
dimension and the stiffness of the oligomer and polymer
chains, are described by quantities such as the mean
end-to-end distance (h), the limiting value of the charac-
teristic ratio (C 1
) and the persistence length (Lp):3
hðnÞ ¼ ðhjr ðnÞ0j2iÞ
1=2; ð1Þ
where r(n) is the distance in space between C-4(U) andC-1(A) atoms, n is the number of disaccharide residues,
the angular brackets indicate an average ensemble over
all the polymer chains, and the subscript Ô0Õ denotes
the unperturbed conditions; the persistence length is de-
fined as the projection of the end-to-end distance vector
r(n) on the first residue UA, distance vector of the chain
(l1):
LpðnÞ ¼ hðl1 Á rðnÞÞi=l1; ð2Þ
finally,
C n ¼ h2ðnÞ=nl2: ð3Þ
where l is the virtual bond length averaged over the resi-dues U and A. Lp and C 1 are the asymptotic values of
Lp(n) and C (n), respectively, when n approaches infinity.
3.5. Calculation of NMR relaxivities
In this subsection we summarize the diffusion-approach
theory9,32,45 to be applied to the calculation of the NMR
relaxivities.
Assuming that the 13C nuclear spin relaxation is gov-
erned by the dipolar and chemical shift anisotropy
mechanisms induced by the hydrogen atom bonded to
13C, the relationships between the R(C z) relaxivities
and spectral densities are:46,47
RðC z Þ ¼ dJ ðxH À xCÞ þ ð3d þ cÞ J ðxCÞ
þ 6dJ ðxH þ xCÞ; ð4Þ
with
d ¼c2
Cc2Hh2
20; c ¼
ðxCdÞ2
15ð5Þ
ci is the gyromagnetic ratio of nucleus i , and d is the
(dimensionless) chemical shift anisotropy (CSA) of each
C nucleus. In this work we have assumed that the CSA is
À40 ppm for all the monitored C–H bonds.
The spectral densities J are the Fourier transform:
J ðxÞ ¼ 2
Z 1
0
cosðxt ÞTCFðt Þ dt ð6Þ
of the time-correlation function (TCF) of 2nd-rank ten-
sor components of the vector r joining the monitored13C nucleus with the bonded protons.
This TCF has the following form47
TCFðt Þ ¼1
r 6
P 2ðcos½hðt ÞÞ; ð7Þ
with h(t) is the angle spanned by the C–H vector in
time t.
Integrating the orientational part of the TCF, the cor-
relation time s is obtained:
s ¼
Z 1
0
P 2ðcos hðt ÞÞ dt : ð8Þ
The mode-coupling diffusion (MCD) theory of thedynamics of a biological macromolecule in solution
was adopted for the computation of the above TCF of
Eq. 7. The approximations in the mode-coupling expan-
sion solution of the Smoluchovski diffusion equation are
the same as in the previous application to HA oligomers
in Refs. 9 and 34.
For time-correlation functions of 2nd-rank tensor
components, such as those necessary to calculate
NMR relaxation (see Eq. 4) the reduced 2nd-order basis
set RM2-II48 is generated coupling the 1st-order/1st-
rank modes in the proper irreducible tensorial form up
to the fourth power. Let e be the number of the low-
est-rate 1st-order/1st-rank modes that we choose. TheRM2-II basis set contains e(e + 1)/2 second powers
and [e(e + 1)/2]2 fourth powers of these e 1st-rank/1st-
order modes. Once the 2nd-rank TCFs have been gener-
ated, they can be Fourier transformed to obtain the
spectral densities, which turn out to be sums of Lorentz-
ian functions.
The diffusion theory treats the solvent hydrodynami-
cally and uses a detailed molecular model for the poly-
mer in terms of beads (atoms or groups of atoms)
connected by real or effective bonds diffusing in
an atomistic potential (the same potential used in the
S. Furlan et al. / Carbohydrate Research 340 (2005) 959–970 963
8/3/2019 Furlan, 2005
http://slidepdf.com/reader/full/furlan-2005 6/12
simulation). The beads are represented as points of
coordinates ri with friction coefficients fi = 6pgai , where
g is the solvent viscosity. In this work, the choice of
hydrodynamic parameters (Stokes radii, friction loca-
tion, and hydrodynamic screening constant a) are iden-
tical to the previous application of MCD theory to the
(UA)4
HA oligomer.9,34 Summarizing, the friction
points are located on most of the heavy atoms in each
monomer for a total amount of 22 friction points for
each UA dimer. Each bead represents isotropically the
friction of the heavy atom together with the bonded
hydrogen atoms. The Stokes radii of the beads are de-
rived by the zero-probe accessible surface area (ASA)
of the group of atoms centered on each bead. The radii
are within 0.073 nm (the single O-1 atom) and 0.185 nm
(the methyl group of residue A). The screening constant
a in Eq. A7 in Ref. 9 is 0.25.
In the RM2-II basis-set, values up to e = 10 were
used, in order to test the convergence of dynamical
quantities. The values of e = 5, 7, 9, 10 were used for(UA)2, (UA)3, (UA)4, (UA)7, respectively.
4. Results and discussion
4.1. Conformational maps and residue conformations
The first step in the computational work is the evalua-
tion of the conformational energy maps for the rotations
U and W for the two glycosidic linkages UA and AU.
This goal has been done by using the two tetrasaccha-
rides (i.e., AUAU and UAUA segments, respectively).Such a choice was indicated by the observation that
the addition of next neighbors to the disaccharides in-
volved in the glycosidic linkage leads to a significant ef-
fect of long-range interactions.49 Based on our previous
work on the octasaccharide (UA)4,9 the configurational
statistics and the dynamical relaxivities of this short oli-
gomer were nicely matched both by MD simulation and
by the ÔrefinedÕ force field used here. This force field
compensates medium-range and solvent interactions,
providing a good approximation to experimental
dynamical results. Moreover, the net charge of carboxyl-
ate groups has been assumed to be zero. Under such cir-
cumstances, the resulting chain model is in theunperturbed conditions (H-solvent), inasmuch as only
short-range interactions are included, without any
account for excluded volume effect.
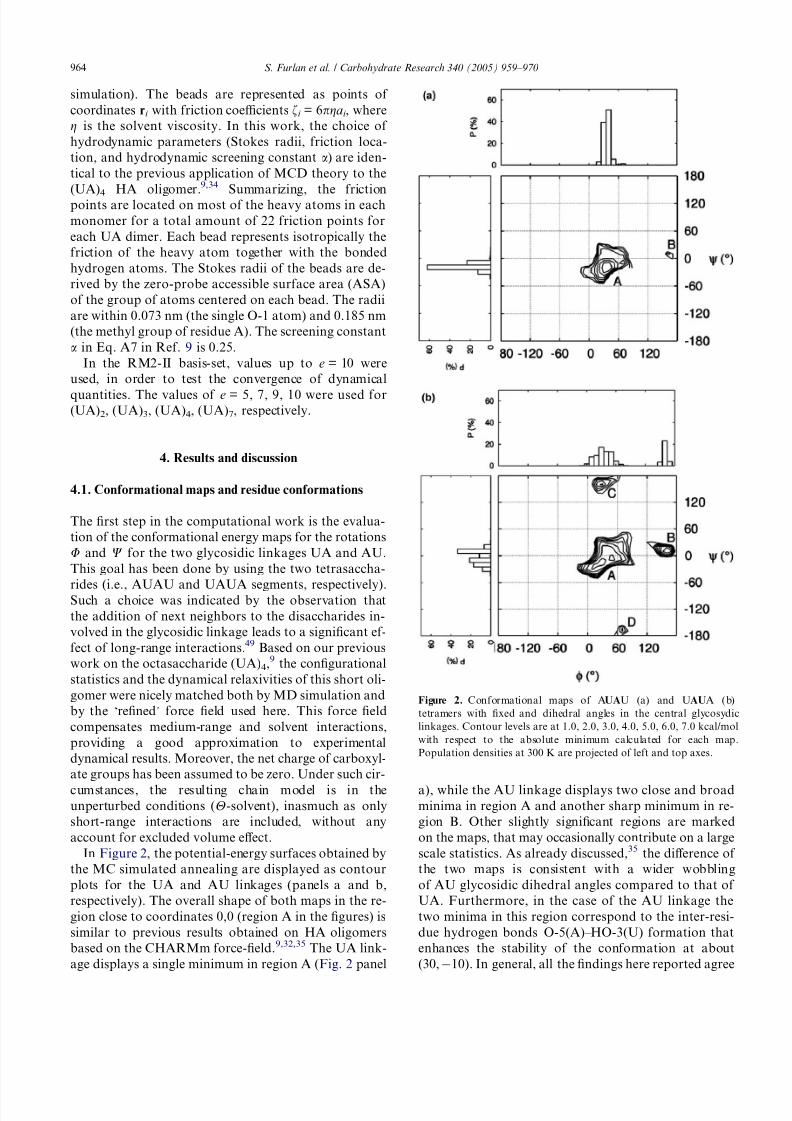
In Figure 2, the potential-energy surfaces obtained by
the MC simulated annealing are displayed as contour
plots for the UA and AU linkages (panels a and b,
respectively). The overall shape of both maps in the re-
gion close to coordinates 0,0 (region A in the figures) is
similar to previous results obtained on HA oligomers
based on the CHARMm force-field.9,32,35 The UA link-
age displays a single minimum in region A (Fig. 2 panel
a), while the AU linkage displays two close and broadminima in region A and another sharp minimum in re-
gion B. Other slightly significant regions are marked
on the maps, that may occasionally contribute on a large
scale statistics. As already discussed,35 the difference of
the two maps is consistent with a wider wobbling
of AU glycosidic dihedral angles compared to that of
UA. Furthermore, in the case of the AU linkage the
two minima in this region correspond to the inter-resi-
due hydrogen bonds O-5(A)–HO-3(U) formation that
enhances the stability of the conformation at about
(30, À10). In general, all the findings here reported agree
Figure 2. Conformational maps of AUAU (a) and UAUA (b)
tetramers with fixed and dihedral angles in the central glycosydic
linkages. Contour levels are at 1.0, 2.0, 3.0, 4.0, 5.0, 6.0, 7.0 kcal/mol
with respect to the absolute minimum calculated for each map.
Population densities at 300 K are projected of left and top axes.
964 S. Furlan et al. / Carbohydrate Research 340 (2005) 959–970

8/3/2019 Furlan, 2005
http://slidepdf.com/reader/full/furlan-2005 7/12
fairly well with the computational results of recent
literature.
In order to provide a quantitative estimation of the
inherent flexibility of glycosidic linkages, the angular dis-
tribution of population (at 300 K) for each glycosidic an-
gle is projected on top and left axes (Fig. 2). Comparison
of the angular distribution provides a further (if neces-
sary) indication of the difference above discussed and
of its effect on the dynamical wobbling properties (see
later). The most striking difference in conformational
maps, that is observed by using the OPLS-AA force-field
compared to the previous results, is the presence, in the
AU linkage, of several low-energy minima that contrib-
ute to more compact oligomer structures.9 The poten-
tial-energy minima are identified and labeled in Tables
1 and 2. The global (although less populated) minimum
of the AU conformational map is now displaced in a re-
gion withU close to 180° and a further minimum with en-
ergy of about 3 kcal/mol higher than the global minimum
is also present. Minima were found in these regions forthe AU linkage also by using the CHARMm force-field,
but in this latter case the energy differences between these
minima and the global one were of the order of 9 kcal/
mol. Therefore, compact structures were accessible only
at very high temperature (1000 K).
Figure 3 shows some snapshots of segments AUAU
and UAUA taken as representatives of the conforma-
tions of the central linkages (UA and AU, respectively)
populating the most relevant minima (see Fig. 2 and
Tables 1 and 2). In general, as it has been already found
in the detailed modeling of the conformational wobbling
in the regions A of both type of linkages, the energylandscape is strongly influenced by hydrogen bonds,
and these hydrogen bonds play a major role in the topo-
logical definition of AU and UA linkages. Focusing on
the central linkage in the two tetrasaccharides, the first
panel (Fig. 3a) shows the molecular topology of the tetra-
saccharide AUAU, putting in evidence the inter-residue
hydrogen bond between atoms O-5(U) and HO-4(A).
This interaction is likely to occur for most of conforma-tional states of region A, as it can be observed also in the
other snapshots (Fig. 3b, c, and d) where the linkage UA
is at both ends of the tetrasaccharide UAUA.
The situation is rather more flexible for the linkage
AU. The three snapshots (Fig. 3b, c, and d) have beentaken with the local conformation of the central residue
AU exploring the three minima identified in Figure 2b as
A, B, and C, respectively (minimum D has not been
given any significance in this context). Only for the
AU linkage populating minimum A, a hydrogen bond
between atoms O-5(A) and HO-3(U) is formed, thus sta-
bilizing this conformation. The secondary region B is
also highly populated, despite the absence of hydrogen
bonds and a linkage conformation, that is, generally
considered less favorable. The occasional formation of
a hydrogen bond involving HO-2(U) and the carbonyl
Table 1. Minima of the potential-energy surface of the linkage UA in
the tetrasaccharide AUAU
A B
/ (deg) 40 160
w (deg) À20 10
(kcal/mol) 0.00 5.19
Population of region (%) 99.99 0.01
Table 2. Minima of the potential-energy surface of the linkage AU in
the tetrasaccharide UAUA
A B C D
/ (deg) 30 160 30 70
w (deg) À10 10 160 À170
(kcal/mol) 0.00 À0.60 2.25 4.26
Population of region (%) 69.05 30.63 0.31 0.01
Figure 3. Representative snapshot of tetramer conformational features
in the minima defined in Figure 2; (a) conformation of tetramer
AUAU in the minimum A; (b), (c), and (d) conformations of tetramer
UAUA in the minima A, B, and C, respectively. The snapshots have
been printed with the program MOLMOLMOLMOL.50
S. Furlan et al. / Carbohydrate Research 340 (2005) 959–970 965
8/3/2019 Furlan, 2005
http://slidepdf.com/reader/full/furlan-2005 8/12
oxygen in the amide group of the residue A surely
provides an additional stability to the conformations de-
picted in Figure 3c and d. This hydrogen bond, that was
already reported in all-atom MD simulations,37 is for-
bidden in the A region because the methyl group in
the A side chain clashes with the U residue.
Whether the stability of conformational region B in
the tetrasaccharide arises from the contribution of more
favorable interactions of the nearest residues alone, or
by other less clear topological effects, is matter for fur-
ther investigation. In any case, however, this has been
the main reason for using the tetrasaccharide segments
to model HA chains.
4.2. NMR relaxation
The configuration statistics allows computation of the
statistical averages in the MCD theory and, therefore,
the numerical computation of the NMR parameters.
Therefore, the combination of conformational mapsand diffusion theory offers a very valuable tool to com-
pare the essential features of the force field with experi-
mental data routinely measured by NMR for
carbohydrate oligomers and polymers. At variance with
the previous applications of the diffusion theory, we
have computed here the R(C z) relaxivities on the basis
of the statistics derived by the (UA)500 chains, generated
by MC according to the conformational maps. There-
fore, within the assumptions of these statistics, it is pos-
sible to monitor NMR relaxivities as functions of the
position of C nuclei in the chain as well as of the number
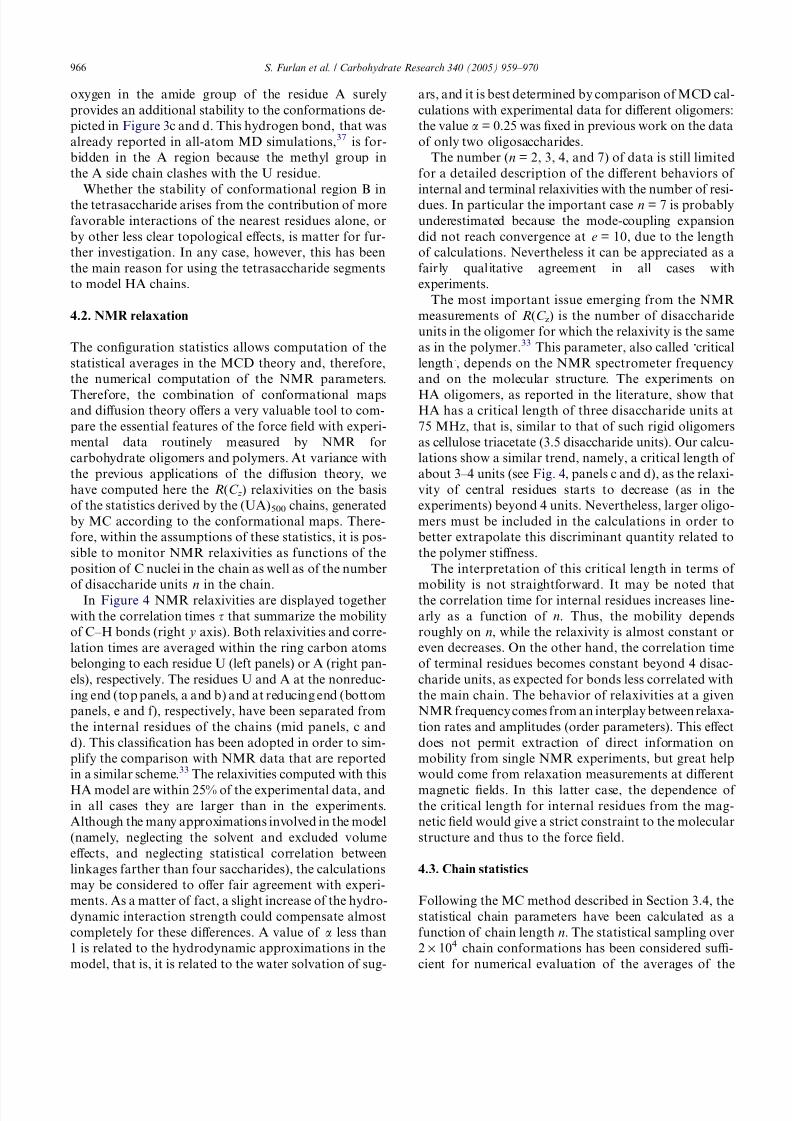
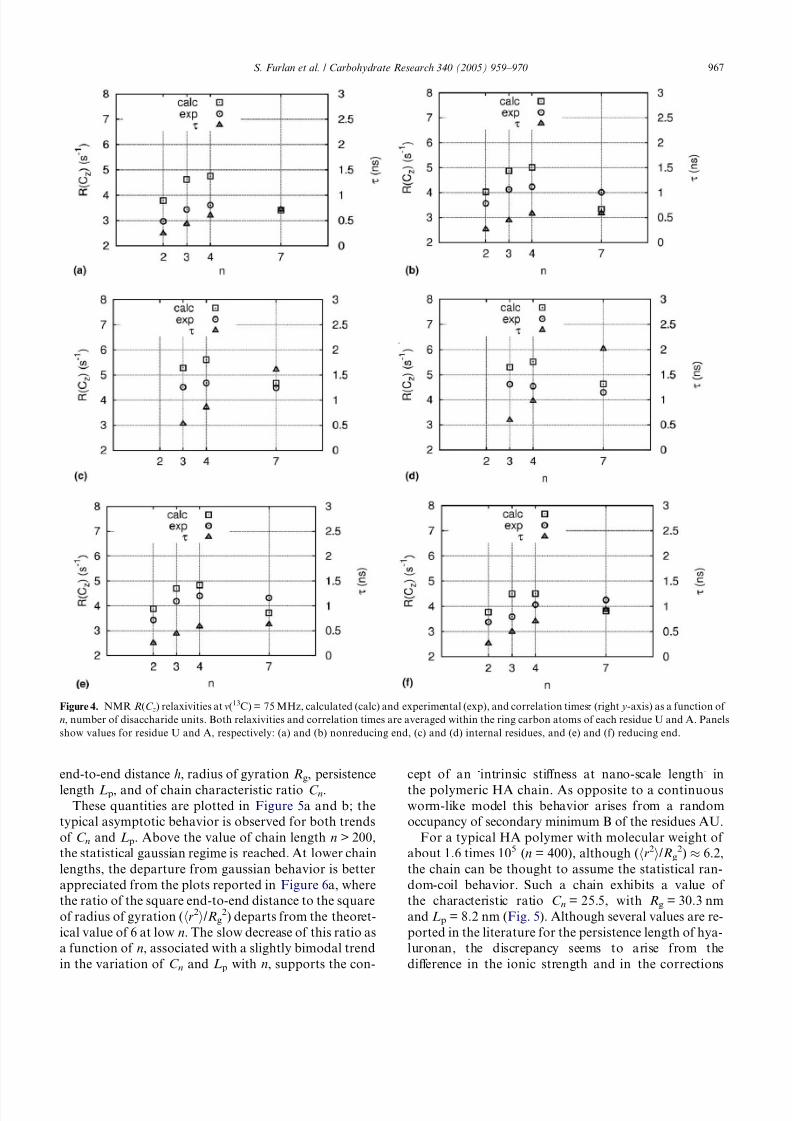
of disaccharide units n in the chain.In Figure 4 NMR relaxivities are displayed together
with the correlation times s that summarize the mobility
of C–H bonds (right y axis). Both relaxivities and corre-
lation times are averaged within the ring carbon atoms
belonging to each residue U (left panels) or A (right pan-
els), respectively. The residues U and A at the nonreduc-
ing end (top panels, a and b) and at reducing end (bottom
panels, e and f), respectively, have been separated from
the internal residues of the chains (mid panels, c and
d). This classification has been adopted in order to sim-
plify the comparison with NMR data that are reported
in a similar scheme.33 The relaxivities computed with this
HA model are within 25% of the experimental data, andin all cases they are larger than in the experiments.
Although the many approximations involved in the model
(namely, neglecting the solvent and excluded volume
effects, and neglecting statistical correlation between
linkages farther than four saccharides), the calculations
may be considered to offer fair agreement with experi-
ments. As a matter of fact, a slight increase of the hydro-
dynamic interaction strength could compensate almost
completely for these differences. A value of a less than
1 is related to the hydrodynamic approximations in the
model, that is, it is related to the water solvation of sug-
ars, and it is best determined by comparison of MCD cal-
culations with experimental data for different oligomers:
the value a = 0.25 was fixed in previous work on the data
of only two oligosaccharides.
The number (n = 2, 3, 4, and 7) of data is still limited
for a detailed description of the different behaviors of
internal and terminal relaxivities with the number of resi-
dues. In particular the important case n = 7 is probably
underestimated because the mode-coupling expansion
did not reach convergence at e = 10, due to the length
of calculations. Nevertheless it can be appreciated as a
fairly qualitative agreement in all cases with
experiments.
The most important issue emerging from the NMR
measurements of R(C z) is the number of disaccharide
units in the oligomer for which the relaxivity is the same
as in the polymer.33 This parameter, also called Ôcritical
lengthÕ, depends on the NMR spectrometer frequency
and on the molecular structure. The experiments on
HA oligomers, as reported in the literature, show thatHA has a critical length of three disaccharide units at
75 MHz, that is, similar to that of such rigid oligomers
as cellulose triacetate (3.5 disaccharide units). Our calcu-
lations show a similar trend, namely, a critical length of
about 3–4 units (see Fig. 4, panels c and d), as the relaxi-
vity of central residues starts to decrease (as in the
experiments) beyond 4 units. Nevertheless, larger oligo-
mers must be included in the calculations in order to
better extrapolate this discriminant quantity related to
the polymer stiffness.
The interpretation of this critical length in terms of
mobility is not straightforward. It may be noted thatthe correlation time for internal residues increases line-
arly as a function of n. Thus, the mobility depends
roughly on n, while the relaxivity is almost constant or
even decreases. On the other hand, the correlation time
of terminal residues becomes constant beyond 4 disac-
charide units, as expected for bonds less correlated with
the main chain. The behavior of relaxivities at a given
NMR frequency comes from an interplay between relaxa-
tion rates and amplitudes (order parameters). This effect
does not permit extraction of direct information on
mobility from single NMR experiments, but great help
would come from relaxation measurements at different
magnetic fields. In this latter case, the dependence of the critical length for internal residues from the mag-
netic field would give a strict constraint to the molecular
structure and thus to the force field.
4.3. Chain statistics
Following the MC method described in Section 3.4, the
statistical chain parameters have been calculated as a
function of chain length n. The statistical sampling over
2 · 104 chain conformations has been considered suffi-
cient for numerical evaluation of the averages of the
966 S. Furlan et al. / Carbohydrate Research 340 (2005) 959–970
8/3/2019 Furlan, 2005
http://slidepdf.com/reader/full/furlan-2005 9/12
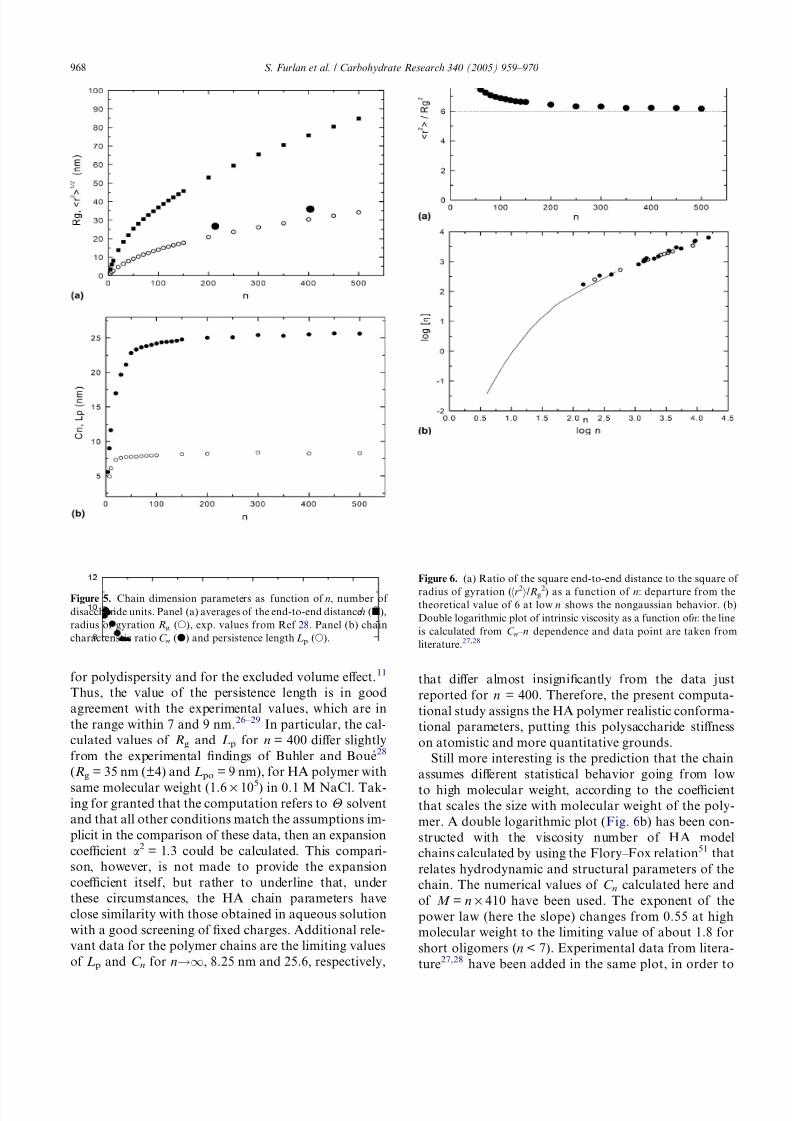
end-to-end distance h, radius of gyration Rg, persistence
length Lp, and of chain characteristic ratio C n.These quantities are plotted in Figure 5a and b; the
typical asymptotic behavior is observed for both trends
of C n and Lp. Above the value of chain length n > 200,
the statistical gaussian regime is reached. At lower chain
lengths, the departure from gaussian behavior is better
appreciated from the plots reported in Figure 6a, where
the ratio of the square end-to-end distance to the square
of radius of gyration (hr2i/Rg2) departs from the theoret-
ical value of 6 at low n. The slow decrease of this ratio as
a function of n, associated with a slightly bimodal trend
in the variation of C n and Lp with n, supports the con-
cept of an Ôintrinsic stiffness at nano-scale lengthÕ in
the polymeric HA chain. As opposite to a continuousworm-like model this behavior arises from a random
occupancy of secondary minimum B of the residues AU.
For a typical HA polymer with molecular weight of
about 1.6 times 105 (n = 400), although (hr2i/Rg2) % 6.2,
the chain can be thought to assume the statistical ran-
dom-coil behavior. Such a chain exhibits a value of
the characteristic ratio C n = 25.5, with Rg = 30.3 nm
and Lp = 8.2 nm (Fig. 5). Although several values are re-
ported in the literature for the persistence length of hya-
luronan, the discrepancy seems to arise from the
difference in the ionic strength and in the corrections
Figure 4. NMR R(C z) relaxivities at m(13C) = 75 MHz, calculated (calc) and experimental (exp), and correlation timess (right y-axis) as a function of
n, number of disaccharide units. Both relaxivities and correlation times are averaged within the ring carbon atoms of each residue U and A. Panels
show values for residue U and A, respectively: (a) and (b) nonreducing end, (c) and (d) internal residues, and (e) and (f) reducing end.
S. Furlan et al. / Carbohydrate Research 340 (2005) 959–970 967
8/3/2019 Furlan, 2005
http://slidepdf.com/reader/full/furlan-2005 10/12
for polydispersity and for the excluded volume effect.11
Thus, the value of the persistence length is in good
agreement with the experimental values, which are in
the range within 7 and 9 nm.26–29 In particular, the cal-
culated values of Rg and Lp for n = 400 differ slightly
from the experimental findings of Buhler and Boue28
(Rg = 35 nm (±4) and Lpo = 9 nm), for HA polymer with
same molecular weight (1.6 · 105) in 0.1 M NaCl. Tak-ing for granted that the computation refers to H solvent
and that all other conditions match the assumptions im-
plicit in the comparison of these data, then an expansion
coefficient a2 = 1.3 could be calculated. This compari-
son, however, is not made to provide the expansion
coefficient itself, but rather to underline that, under
these circumstances, the HA chain parameters have
close similarity with those obtained in aqueous solution
with a good screening of fixed charges. Additional rele-
vant data for the polymer chains are the limiting values
of Lp and C n for n!1, 8.25 nm and 25.6, respectively,
that differ almost insignificantly from the data just
reported for n = 400. Therefore, the present computa-
tional study assigns the HA polymer realistic conforma-
tional parameters, putting this polysaccharide stiffness
on atomistic and more quantitative grounds.
Still more interesting is the prediction that the chain
assumes different statistical behavior going from low
to high molecular weight, according to the coefficientthat scales the size with molecular weight of the poly-
mer. A double logarithmic plot (Fig. 6b) has been con-
structed with the viscosity number of HA model
chains calculated by using the Flory–Fox relation51 that
relates hydrodynamic and structural parameters of the
chain. The numerical values of C n calculated here and
of M = n · 410 have been used. The exponent of the
power law (here the slope) changes from 0.55 at high
molecular weight to the limiting value of about 1.8 for
short oligomers (n < 7). Experimental data from litera-
ture27,28 have been added in the same plot, in order to
Figure 6. (a) Ratio of the square end-to-end distance to the square of
radius of gyration (hr2i/Rg2) as a function of n: departure from thetheoretical value of 6 at low n shows the nongaussian behavior. (b)
Double logarithmic plot of intrinsic viscosity as a function of n: the line
is calculated from C n – n dependence and data point are taken from
literature.27,28
Figure 5. Chain dimension parameters as function of n, number of
disaccharide units. Panel (a) averages of the end-to-end distanceh (j),
radius of gyration Rg (s), exp. values from Ref 28. Panel (b) chain
characteristic ratio C n (d) and persistence length Lp (s).
968 S. Furlan et al. / Carbohydrate Research 340 (2005) 959–970
8/3/2019 Furlan, 2005
http://slidepdf.com/reader/full/furlan-2005 11/12
scale the two trends and give significance to the calcu-
lated data.
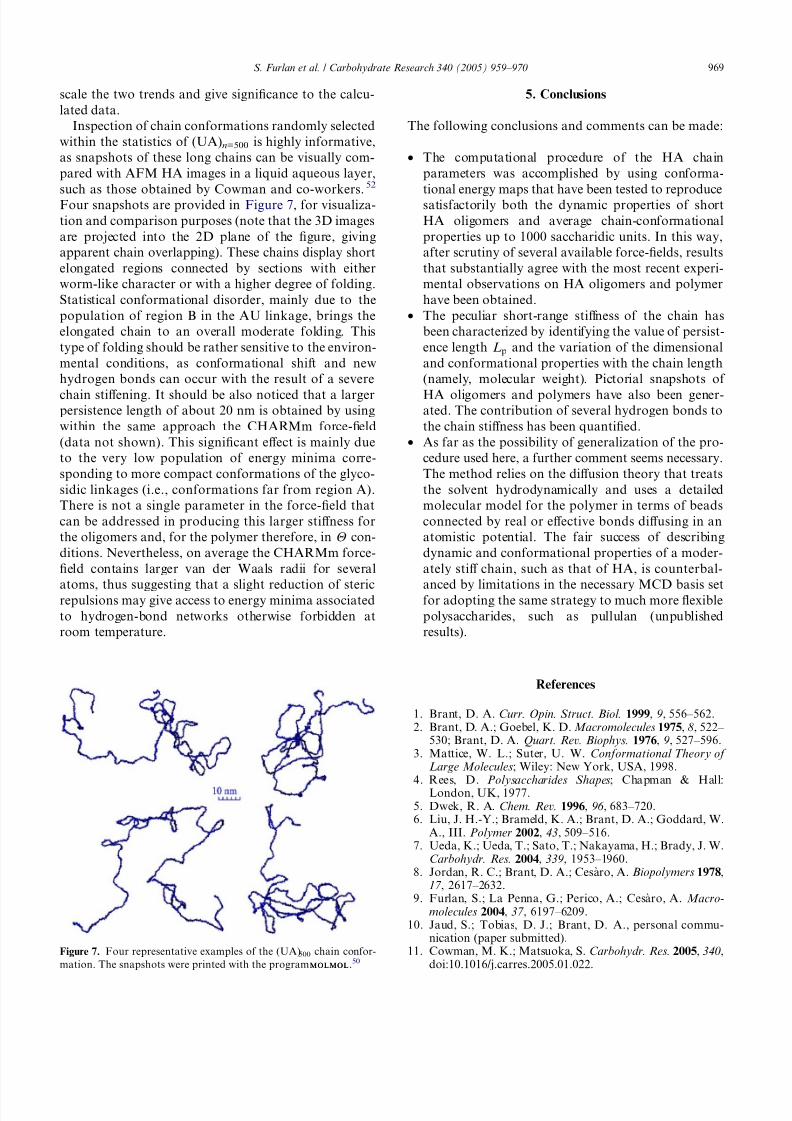
Inspection of chain conformations randomly selected
within the statistics of (UA)n=500 is highly informative,
as snapshots of these long chains can be visually com-
pared with AFM HA images in a liquid aqueous layer,
such as those obtained by Cowman and co-workers.52
Four snapshots are provided in Figure 7, for visualiza-
tion and comparison purposes (note that the 3D images
are projected into the 2D plane of the figure, giving
apparent chain overlapping). These chains display short
elongated regions connected by sections with either
worm-like character or with a higher degree of folding.
Statistical conformational disorder, mainly due to the
population of region B in the AU linkage, brings the
elongated chain to an overall moderate folding. This
type of folding should be rather sensitive to the environ-
mental conditions, as conformational shift and new
hydrogen bonds can occur with the result of a severe
chain stiffening. It should be also noticed that a largerpersistence length of about 20 nm is obtained by using
within the same approach the CHARMm force-field
(data not shown). This significant effect is mainly due
to the very low population of energy minima corre-
sponding to more compact conformations of the glyco-
sidic linkages (i.e., conformations far from region A).
There is not a single parameter in the force-field that
can be addressed in producing this larger stiffness for
the oligomers and, for the polymer therefore, in H con-
ditions. Nevertheless, on average the CHARMm force-
field contains larger van der Waals radii for several
atoms, thus suggesting that a slight reduction of stericrepulsions may give access to energy minima associated
to hydrogen-bond networks otherwise forbidden at
room temperature.
5. Conclusions
The following conclusions and comments can be made:
• The computational procedure of the HA chain
parameters was accomplished by using conforma-
tional energy maps that have been tested to reproduce
satisfactorily both the dynamic properties of short
HA oligomers and average chain-conformational
properties up to 1000 saccharidic units. In this way,
after scrutiny of several available force-fields, results
that substantially agree with the most recent experi-
mental observations on HA oligomers and polymer
have been obtained.
• The peculiar short-range stiffness of the chain has
been characterized by identifying the value of persist-
ence length Lp and the variation of the dimensional
and conformational properties with the chain length
(namely, molecular weight). Pictorial snapshots of
HA oligomers and polymers have also been gener-ated. The contribution of several hydrogen bonds to
the chain stiffness has been quantified.
• As far as the possibility of generalization of the pro-
cedure used here, a further comment seems necessary.
The method relies on the diffusion theory that treats
the solvent hydrodynamically and uses a detailed
molecular model for the polymer in terms of beads
connected by real or effective bonds diffusing in an
atomistic potential. The fair success of describing
dynamic and conformational properties of a moder-
ately stiff chain, such as that of HA, is counterbal-
anced by limitations in the necessary MCD basis setfor adopting the same strategy to much more flexible
polysaccharides, such as pullulan (unpublished
results).
References
1. Brant, D. A. Curr. Opin. Struct. Biol. 1999, 9, 556–562.2. Brant, D. A.; Goebel, K. D. Macromolecules 1975, 8, 522–
530; Brant, D. A. Quart. Rev. Biophys. 1976, 9, 527–596.3. Mattice, W. L.; Suter, U. W. Conformational Theory of
Large Molecules; Wiley: New York, USA, 1998.
4. Rees, D. Polysaccharides Shapes; Chapman & Hall:London, UK, 1977.5. Dwek, R. A. Chem. Rev. 1996, 96 , 683–720.6. Liu, J. H.-Y.; Brameld, K. A.; Brant, D. A.; Goddard, W.
A., III. Polymer 2002, 43, 509–516.7. Ueda, K.; Ueda, T.; Sato, T.; Nakayama, H.; Brady, J. W.
Carbohydr. Res. 2004, 339, 1953–1960.8. Jordan, R. C.; Brant, D. A.; Cesaro, A. Biopolymers 1978,
17 , 2617–2632.9. Furlan, S.; La Penna, G.; Perico, A.; Cesaro, A. Macro-
molecules 2004, 37 , 6197–6209.10. Jaud, S.; Tobias, D. J.; Brant, D. A., personal commu-
nication (paper submitted).11. Cowman, M. K.; Matsuoka, S. Carbohydr. Res. 2005, 340,
doi:10.1016/j.carres.2005.01.022.Figure 7. Four representative examples of the (UA)500 chain confor-
mation. The snapshots were printed with the program MOLMOLMOLMOL.50
S. Furlan et al. / Carbohydrate Research 340 (2005) 959–970 969

8/3/2019 Furlan, 2005
http://slidepdf.com/reader/full/furlan-2005 12/12
12. Lapacik, L. J.; Lapacik, L.; Smedt, S. D.; Demeester, J.Chem. Rev. 1998, 98, 2663–2684.
13. Hyaluronan 2003 Conference, (Cleveland, OH), Proceed-ings available at http://matrixbiologyinstitute.org/ha03/toc.htm.
14. Cleland, R. L. Biopolymers 1984, 23, 647–666, andreferences cited therein.
15. Hokputsa, S.; Jumel, K.; Alexander, C.; Harding, S. E.
Carbohydr. Polym. 2003, 52, 111–117.16. Morris, E. R.; Rees, D. A.; Welsh, E. J. J. Mol. Biol. 1980,
138, 383–400.17. Scott, J. E.; Heatley, F. Proc. Natl. Acad. Sci. U.S.A. 1999,
96 , 4850–4855.18. Rao, V. S. R.; Qasba, P. K.; Balaji, P. V.; Chandrasek-
aran, R. Conformation of Carbohydrates; Harwood Aca-demic: Amsterdam, The Netherlands, 1998.
19. Scott, J. E. The Biology of Hyaluronan; Ciba FoundationSymposium 143; Wiley: Chichester, UK, 1998.
20. Turner, L. R.; Lin, P.; Cowman, M. K. Arch. Biochem.Biophys. 1988, 265, 484–495.
21. Gribbon, P.; Heng, B. C.; Hardingham, T. E. Biochem. J.2000, 350, 329–335.
22. Reed, C. E.; Li, X.; Reed, W. F. Biopolymers 1989, 28,
1981–2000; Ghosh, S.; Li, X.; Reed, C. E.; Reed, W. F.Biopolymers 1990, 30, 1101–1112.
23. Hayashi, K.; Tsutsumi, K.; Nakajima, F.; Norisuye, T.;Teramoto, A. Macromolecules 1995, 28, 3824–3830.
24. Takahashi, R.; Kubota, K.; Kawada, M.; Okamoto, A.Biopolymers 1999, 50, 87–98.
25. Fouissac, E.; Milas, M.; Rinaudo, M.; Borsali, R. Mac-romolecules 1992, 25, 5613–5617.
26. Gamini, A.; Paoletti, S.; Zanetti, F. In Laser LightScattering in Biochemistry; Harding, S. E., Sattelle, D.B., Bloomfield, V. A., Eds.; The Royal Society of Chemistry: Cambridge, 1992; pp 294–311.
27. Mendichi, R.; Schieroni, A. G.; Grassi, C.; Re, A. Polymer1998, 39, 6611–6620; Mendichi, R.; Soltes, L.; Schieroni,A. G. Biomacromolecules 2003, 4, 1805–1810.
28. Buhler, E.; Boue, F. Eur. Phys. J. E 2003, 10, 89–92;Buhler, E.; Boue, F. Macromolecules 2004, 37 , 1600–1610.
29. Cowman, M. K.; Hittner, D. M.; Feder-Davis, J. Macro-molecules 1996, 29, 2894–2902.
30. Donati, A.; Magnani, A.; Bonechi, C.; Barbucci, R.;Rossi, C. Biopolymers 2001, 59, 434–445.
31. Almond, A.; Brass, A.; Sheehan, J. K. Glycobiology 1998,8, 973–980; Almond, A.; Brass, A.; Sheehan, J. K. J. Mol.
Biol. 1998, 284, 1425–1437; Almond, A.; Sheehan, J. K.Glycobiology 2003, 13, 255–264.
32. Cavalieri, F.; Chiessi, E.; Paci, M.; Paradossi, G.;Flaibani, A.; Cesaro, A. Macromolecules 2001, 34, 99– 109.
33. Cowman, M. K.; Feder-Davis, J.; Hittner, D. M. Macro-molecules 2001, 34, 110–115.
34. Letardi, S.; La Penna, G.; Chiessi, E.; Perico, A.; Cesaro,
A. Macromolecules 2002, 35, 286–300.35. Holmbeck, S. M. A.; Petillo, P. A.; Lerner, L. E.
Biochemistry 1994, 33(3), 14246–14255.36. Kaufmann, J.; Mohle, K.; Hofmann, H.-J.; Arnlod, K. J.
Mol. Struct. 1998, 422, 109–121.37. Almond, A.; Brass, A.; Sheehan, J. K. J. Phys. Chem. B
2000, 104, 5634–5640.38. Tafi, A.; Manetti, F.; Corelli, F.; Alcaro, S.; Botta, M.
Pure Appl. Chem. 2003, 75, 359–366.39. Prompers, J. J.; Scheurer, C.; Bruschweiler, R. J. Mol.
Biol. 2001, 305, 1085–1097.40. Tugarinov, V.; Liang, Z.; Shapiro, Y. E.; Freed, J. H.;
Meirovitch, E. J. Am. Chem. Soc. 2001, 123, 3055– 3063.
41. The OPLS parameters are available on request from Prof.
W. L. Jorgensen at [email protected]. Damm, W.; Frontera, A.; Tirado-Rives, J.; Jorgensen, W.
L. J. Comput. Chem. 1997, 18, 1955–1970.43. La Penna, G. J. Chem. Phys. 2003, 119, 8162–8174.44. Wolf, D.; Keblinski, P.; Phillpot, S. R.; Eggebrecht, J. J.
Chem. Phys. 1999, 110, 8254–8282.45. La Penna, G.; Genest, D.; Perico, A. Biopolymers 2003,
69, 1–14.46. Peng, J.; Wagner, G. J. Magn. Res. 1992, 98, 308–332.47. Cavanagh, J.; Fairbrother, W. J.; Palmer, A. G., III;
Skelton, N. J. Protein NMR Spectroscopy; Academic: SanDiego, USA, 1996.
48. La Penna, G.; Pratolongo, R.; Perico, A. Macromolecules1999, 32, 506–513.
49. Haxaire, K.; Braccini, I.; Milas, M.; Rinaudo, M.; Perez,S. Glycobiology 2000, 10, 587–594.
50. Koradi, R.; Billeter, M.; Wuthrich, K. J. Mol. Graph.1996, 14, 51–55, http://www.mol.biol.ethz.ch/wuthrich/software/molmol.
51. Flory, P. J.; Fox, T. G. J. Am. Chem. Soc. 1951, 73, 1904.52. Cowman, M. K.; Li, M.; Balazs, E. A. Biophys. J. 1998,
75, 2030–2037; Cowman, M. K.; Li, M.; Dyal, A.; Balazs,E. A. Carbohydr. Polym. 2000, 41, 229–235.
970 S. Furlan et al. / Carbohydrate Research 340 (2005) 959–970