Embed Size (px)
Citation preview
1
C-MAP 4D Customizing the way you navigate.
Quick Start Guide
Furuno 1670F / 1870F
2
CONTENTS
INTRODUCTION ..........................................................................3
MEDIA ..................................................................................................... 3
COVERAGE AND PRICING ............................................................ 3
C-MAP 4D CONTENT AND FEATURES ....................................4
4D MAX .................................................................................................... 4
FULL 4D ................................................................................................... 5
VALUE ADDED DATA4D ................................................................ 6
PLOTTER CONTROL OPTIONS .................................................7
CUSTOMIZE CHART PRESENTATION ...................................... 8
MAKE THE MOST OF FULL 4D (QUICK SETUP) ....................9
3D-VIEW .................................................................................................. 9
HIGH-RES SATELLITE IMAGERY .............................................. 10
DYNAMIC RASTER CHARTS ........................................................ 11
EASY ROUTING ................................................................................. 12
VALUE ADDED DATA ............................................................... 14
MANAGING VALUE ADDED DATA ......................................... 14
UNLOCK VALUE ADDED DATA ............................................... 15
3
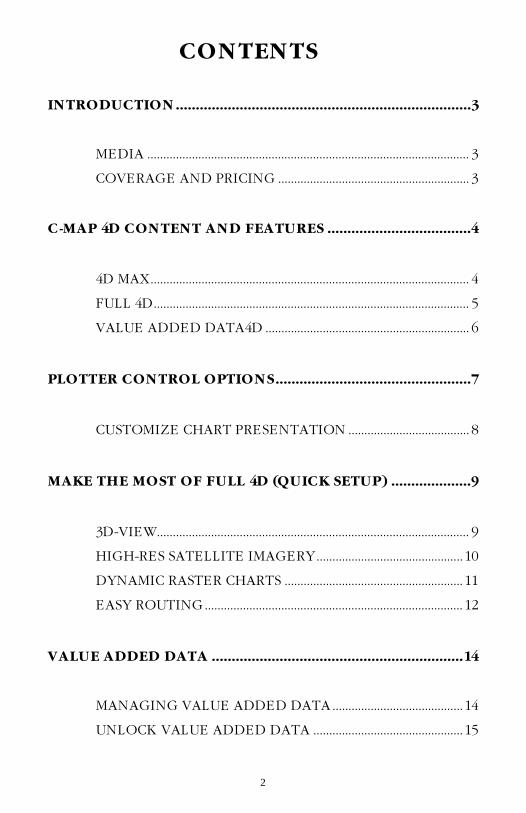
INTRODUCTION
C-MAP 4D is an all-in-one charting solution offering standard vector chart features you have come to expect from C-MAP MAX plus Raster Charts, 3D views, Satellite Imagery, Easy Routing and Value Added Data, all easily customized to your boating needs. C-MAP 4D also delivers continuous updates that can be unlocked online, providing another way to customize navigation data to enhance your boating experience.
C-MAP 4D is composed of separate content layers that can either be “locked” - not visible by the chart plotter or “unlocked”- visible.
MEDIA
All C-MAP 4D cards are Secure Digital (SD) format with BLUE stickers.
COVERAGE AND PRICING
C-MAP 4D Wide coverage areas offer the best value and C-MAP 4D features and content can easily be managed online.
For a complete list of C-MAP 4D coverage areas, click here to visit our online chart catalog.
4D MAX FULL 4D VAD
Bathymetric VAD
Sport Fishing $199 $299 $149 $19 - $49
4
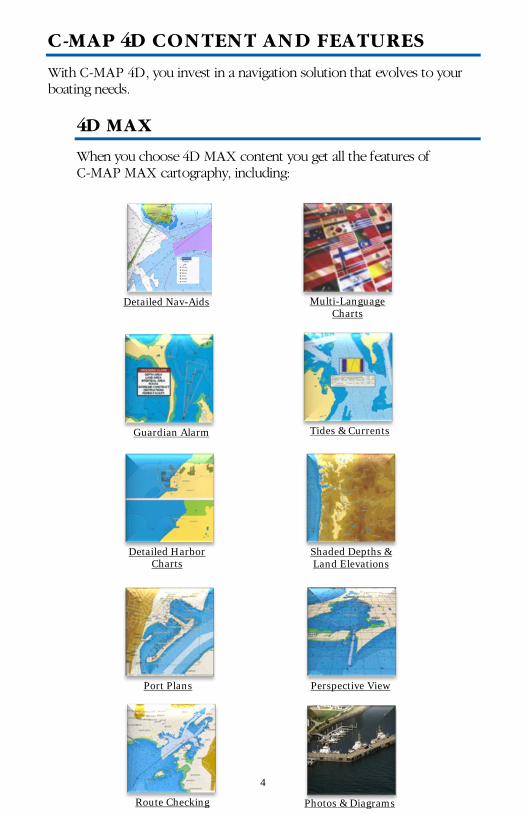
Detailed Nav-Aids
C-MAP 4D CONTENT AND FEATURES
With C-MAP 4D, you invest in a navigation solution that evolves to your boating needs.
4D MAX
When you choose 4D MAX content you get all the features of C-MAP MAX cartography, including:
Guardian Alarm
Multi-Language
Charts
Port Plans
Detailed Harbor
Charts
Perspective View
Shaded Depths & Land Elevations
Tides & Currents
Route Checking
Photos & Diagrams
5
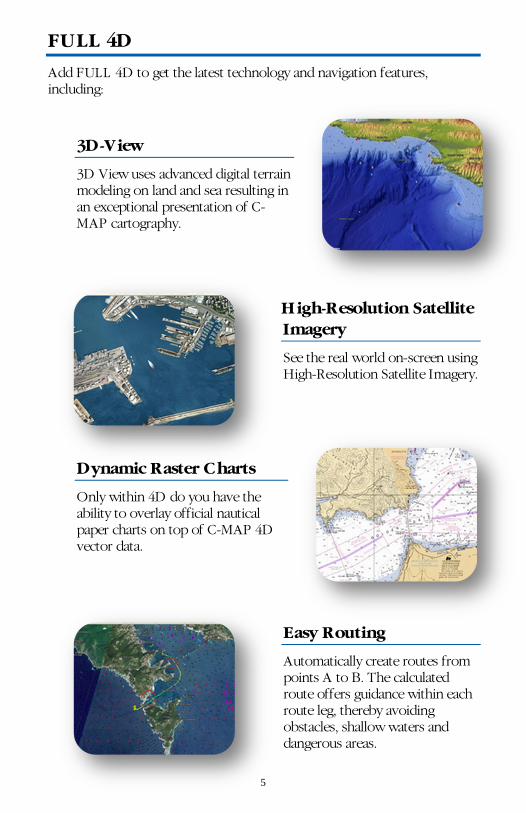
FULL 4D
Add FULL 4D to get the latest technology and navigation features, including:
3D-View
3D View uses advanced digital terrain modeling on land and sea resulting in an exceptional presentation of C-MAP cartography.
High-Resolution Satellite Imagery
See the real world on-screen using High-Resolution Satellite Imagery.
Dynamic Raster Charts
Only within 4D do you have the ability to overlay official nautical paper charts on top of C-MAP 4D vector data.
Easy Routing
Automatically create routes from points A to B. The calculated route offers guidance within each route leg, thereby avoiding obstacles, shallow waters and dangerous areas.
6
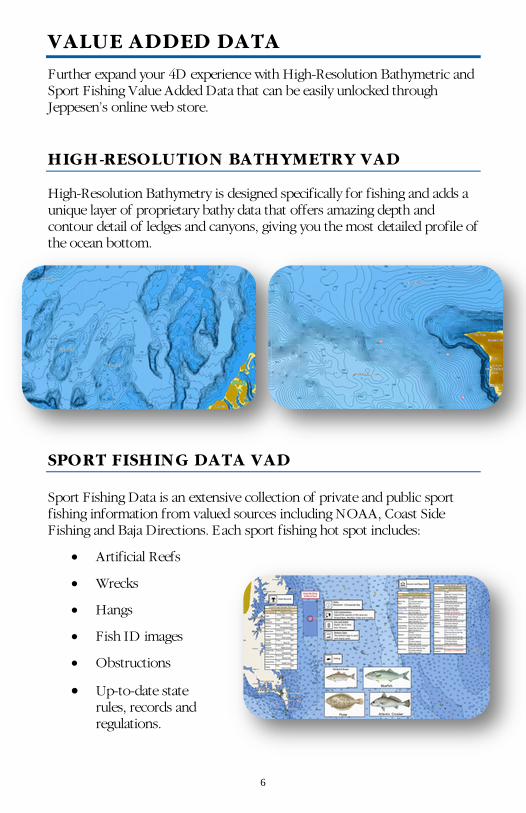
VALUE ADDED DATA
Further expand your 4D experience with High-Resolution Bathymetric and Sport Fishing Value Added Data that can be easily unlocked through Jeppesen’s online web store.
HIGH-RESOLUTION BATHYMETRY VAD High-Resolution Bathymetry is designed specifically for fishing and adds a unique layer of proprietary bathy data that offers amazing depth and contour detail of ledges and canyons, giving you the most detailed profile of the ocean bottom.
SPORT FISHING DATA VAD
Sport Fishing Data is an extensive collection of private and public sport fishing information from valued sources including NOAA, Coast Side Fishing and Baja Directions. Each sport fishing hot spot includes:
• Artificial Reefs
• Wrecks
• Hangs
• Fish ID images
• Obstructions
• Up-to-date state rules, records and regulations.
7
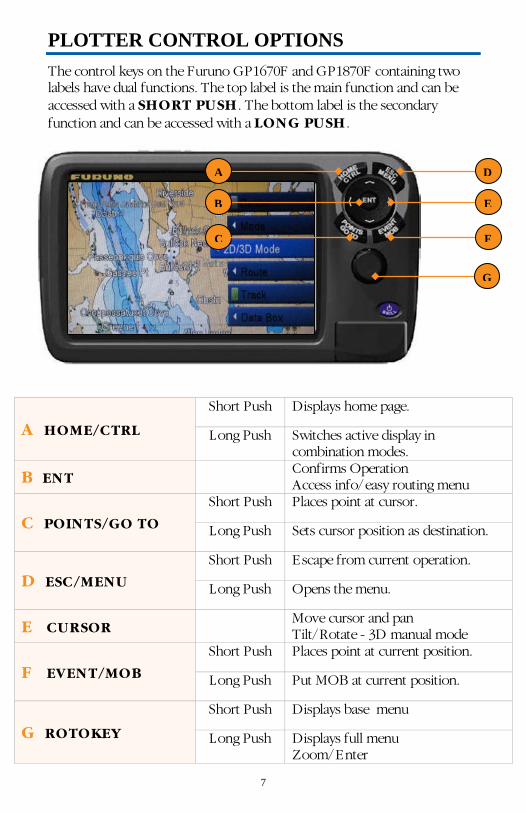
PLOTTER CONTROL OPTIONS The control keys on the Furuno GP1670F and GP1870F containing two labels have dual functions. The top label is the main function and can be accessed with a SHORT PUSH . The bottom label is the secondary function and can be accessed with a LONG PUSH .
A HOME/CTRL
Short Push Displays home page.
Long Push Switches active display in combination modes.
B ENT Confirms Operation
Access info/easy routing menu
C POINTS/GO TO Short Push Places point at cursor.
Long Push Sets cursor position as destination.
D ESC/MENU Short Push Escape from current operation.
Long Push Opens the menu.
E CURSOR Move cursor and pan
Tilt/Rotate - 3D manual mode
F EVENT/MOB Short Push Places point at current position.
Long Push Put MOB at current position.
G ROTOKEY
Short Push Displays base menu
Long Push Displays full menu Zoom/Enter
A D
E
F
G
B
C
8
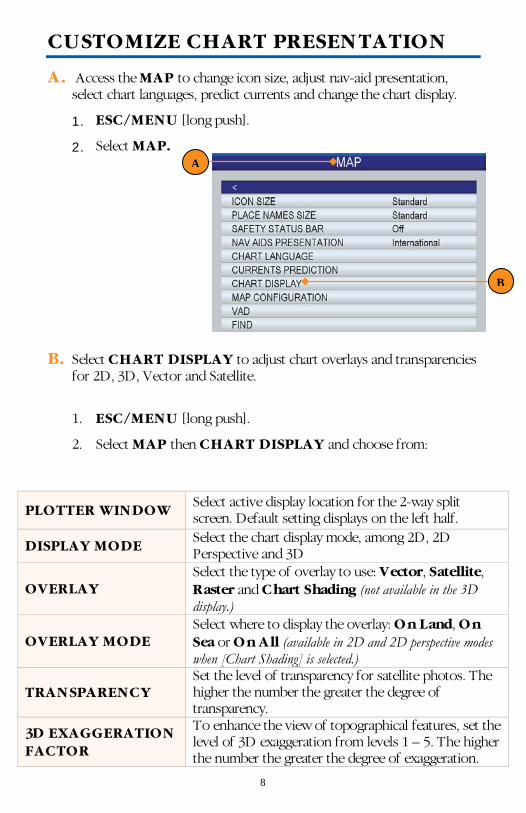
CUSTOMIZE CHART PRESENTATION
A. Access the MAP to change icon size, adjust nav-aid presentation, select chart languages, predict currents and change the chart display.
1. ESC/MENU [long push].
2. Select MAP.
B. Select CHART DISPLAY to adjust chart overlays and transparencies
for 2D, 3D, Vector and Satellite.
1. ESC/MENU [long push].
2. Select MAP then CHART DISPLAY and choose from:
PLOTTER WINDOW Select active display location for the 2-way split screen. Default setting displays on the left half.
DISPLAY MODE Select the chart display mode, among 2D, 2D Perspective and 3D
OVERLAY Select the type of overlay to use: Vector, Satellite, Raster and Chart Shading (not available in the 3D display.)
OVERLAY MODE Select where to display the overlay: On Land, On Sea or On All (available in 2D and 2D perspective modes when [Chart Shading] is selected.)
TRANSPARENCY Set the level of transparency for satellite photos. The higher the number the greater the degree of transparency.
3D EXAGGERATION FACTOR
To enhance the view of topographical features, set the level of 3D exaggeration from levels 1 – 5. The higher the number the greater the degree of exaggeration.
A
B
9
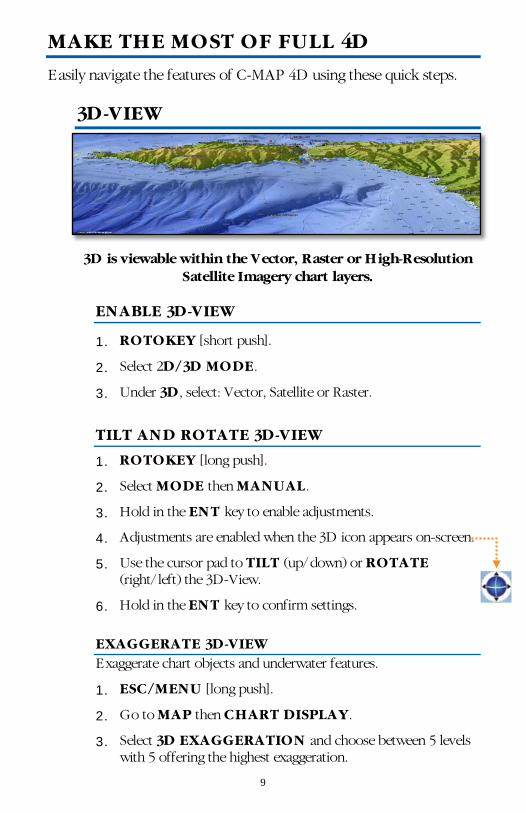
MAKE THE MOST OF FULL 4D
Easily navigate the features of C-MAP 4D using these quick steps.
3D-VIEW
3D is viewable within the Vector, Raster or High-Resolution Satellite Imagery chart layers.
ENABLE 3D-VIEW
1. ROTOKEY [short push].
2. Select 2D/3D MODE.
3. Under 3D, select: Vector, Satellite or Raster.
TILT AND ROTATE 3D-VIEW
1. ROTOKEY [long push].
2. Select MODE then MANUAL.
3. Hold in the ENT key to enable adjustments.
4. Adjustments are enabled when the 3D icon appears on-screen.
5. Use the cursor pad to TILT (up/down) or ROTATE (right/ left) the 3D-View.
6. Hold in the ENT key to confirm settings.
EXAGGERATE 3D-VIEW Exaggerate chart objects and underwater features.
1. ESC/MENU [long push].
2. Go to MAP then CHART DISPLAY.
3. Select 3D EXAGGERATION and choose between 5 levels with 5 offering the highest exaggeration.
10
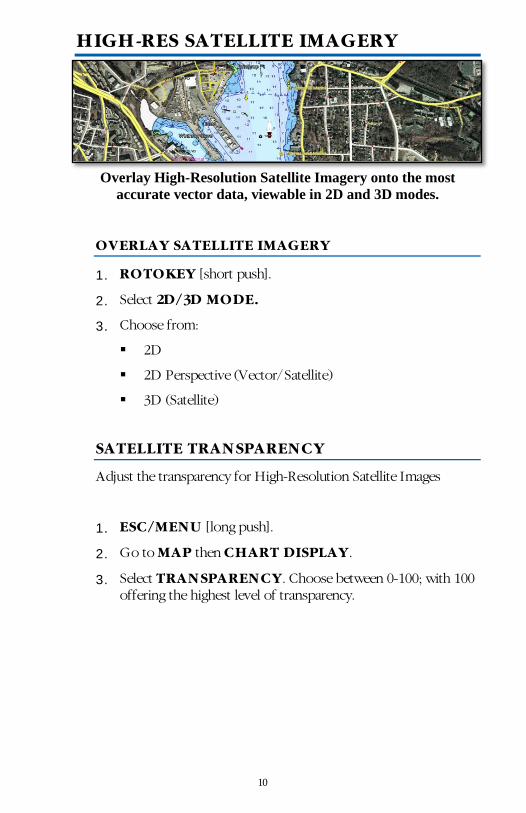
HIGH-RES SATELLITE IMAGERY
Overlay High-Resolution Satellite Imagery onto the most accurate vector data, viewable in 2D and 3D modes.
OVERLAY SATELLITE IMAGERY
1. ROTOKEY [short push].
2. Select 2D/3D MODE.
3. Choose from:
2D
2D Perspective (Vector/Satellite)
3D (Satellite)
SATELLITE TRANSPARENCY
Adjust the transparency for High-Resolution Satellite Images
1. ESC/MENU [long push].
2. Go to MAP then CHART DISPLAY.
3. Select TRANSPARENCY. Choose between 0-100; with 100 offering the highest level of transparency.
11
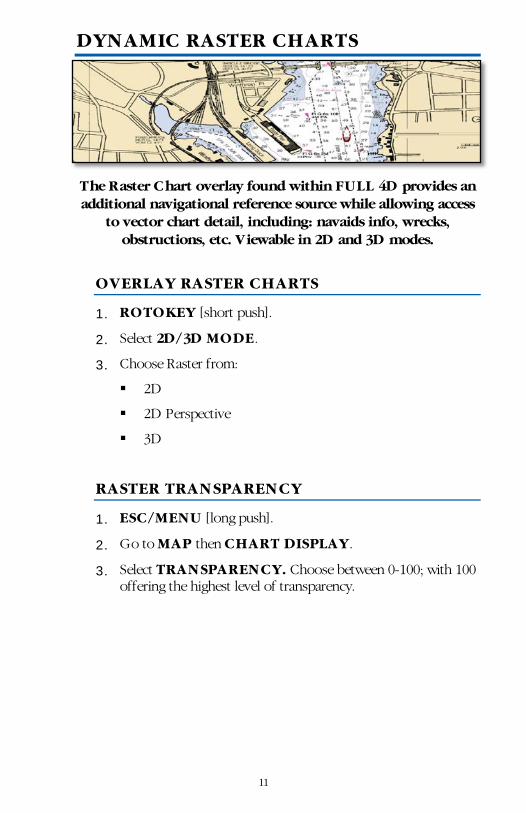
DYNAMIC RASTER CHARTS
The Raster Chart overlay found within FULL 4D provides an additional navigational reference source while allowing access
to vector chart detail, including: navaids info, wrecks, obstructions, etc. Viewable in 2D and 3D modes.
OVERLAY RASTER CHARTS
1. ROTOKEY [short push].
2. Select 2D/3D MODE.
3. Choose Raster from:
2D
2D Perspective
3D
RASTER TRANSPARENCY
1. ESC/MENU [long push].
2. Go to MAP then CHART DISPLAY.
3. Select TRANSPARENCY. Choose between 0-100; with 100 offering the highest level of transparency.
12
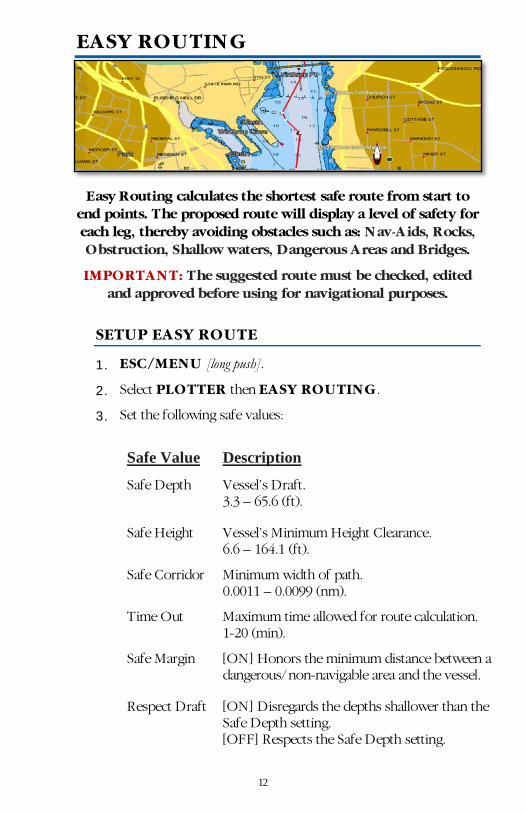
EASY ROUTING
Easy Routing calculates the shortest safe route from start to end points. The proposed route will display a level of safety for each leg, thereby avoiding obstacles such as: Nav-Aids, Rocks, Obstruction, Shallow waters, Dangerous Areas and Bridges.
IMPORTANT: The suggested route must be checked, edited and approved before using for navigational purposes.
SETUP EASY ROUTE
1. ESC/MENU [long push].
2. Select PLOTTER then EASY ROUTING .
3. Set the following safe values:
Safe Value Description
Safe Depth Vessel’s Draft. 3.3 – 65.6 (ft).
Safe Height Vessel’s Minimum Height Clearance. 6.6 – 164.1 (ft).
Safe Corridor Minimum width of path. 0.0011 – 0.0099 (nm).
Time Out Maximum time allowed for route calculation. 1-20 (min).
Safe Margin [ON] Honors the minimum distance between a dangerous/non-navigable area and the vessel.
Respect Draft [ON] Disregards the depths shallower than the Safe Depth setting. [OFF] Respects the Safe Depth setting.
13
CALCULATE EASY ROUTE
1. Place cursor on start point and press ENT.
2. Select EASY ROUTING > START
3. Move cursor to end point and press ENT.
4. Select EASY ROUTING > DESTINATION .
5. Select ENT > EASY ROUTING > CALCULATE. Review warnings, check route and click OK to proceed/confirm.
6. Select OK to finish or DETAILS to view results.
7. ENT to save route (route must be saved before changes can be made). ESC/MENU to exit without saving.
8. Start and end points stay on screen until deleted (for routes that are not saved and/or completed.)
Route Leg Description
Red Condition is unsafe for navigation, crossing dangerous areas or objects.
Yellow Requires maximum attention. Leg crosses potentially dangerous areas/objects.
Green No Hazards detected.
Gray Start/End point moved to safer area.
14
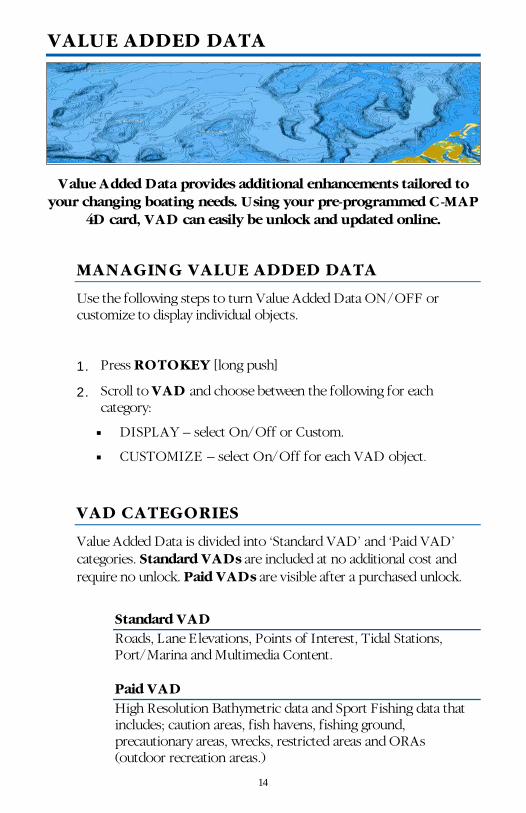
VALUE ADDED DATA
Value Added Data provides additional enhancements tailored to your changing boating needs. Using your pre-programmed C-MAP
4D card, VAD can easily be unlock and updated online.
MANAGING VALUE ADDED DATA
Use the following steps to turn Value Added Data ON/OFF or customize to display individual objects.
1. Press ROTOKEY [long push]
2. Scroll to VAD and choose between the following for each category:
DISPLAY – select On/Off or Custom.
CUSTOMIZE – select On/Off for each VAD object.
VAD CATEGORIES
Value Added Data is divided into ‘Standard VAD’ and ‘Paid VAD’ categories. Standard VADs are included at no additional cost and require no unlock. Paid VADs are visible after a purchased unlock.
Standard VAD Roads, Lane Elevations, Points of Interest, Tidal Stations, Port/Marina and Multimedia Content.
Paid VAD High Resolution Bathymetric data and Sport Fishing data that includes; caution areas, fish havens, fishing ground, precautionary areas, wrecks, restricted areas and ORAs (outdoor recreation areas.)
15
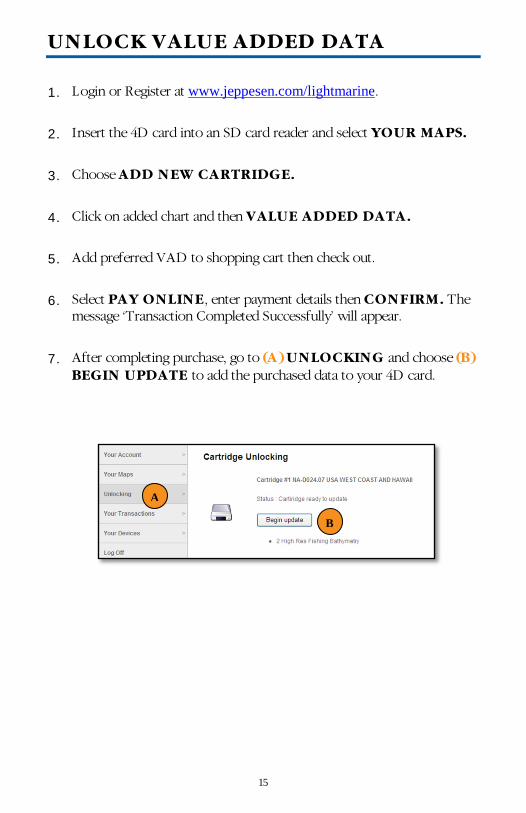
UNLOCK VALUE ADDED DATA
1. Login or Register at www.jeppesen.com/lightmarine.
2. Insert the 4D card into an SD card reader and select YOUR MAPS.
3. Choose ADD NEW CARTRIDGE.
4. Click on added chart and then VALUE ADDED DATA.
5. Add preferred VAD to shopping cart then check out.
6. Select PAY ONLINE, enter payment details then CONFIRM. The message ‘Transaction Completed Successfully’ will appear.
7. After completing purchase, go to (A) UNLOCKING and choose (B) BEGIN UPDATE to add the purchased data to your 4D card.
A
B

16
133 FALMOUTH ROAD • MASHPEE • MA 02649
800.424.2627 • US-CUSTOMERSUPPORT@ JEPPESEN.COM


![[XX] FURUNO FS-1570 = TECHNICAL DRAWINGS.PDF](https://img.pdfslide.tips/doc/110x75/577cc3071a28aba71194fe06/xx-furuno-fs-1570-technical-drawingspdf.jpg)