Embed Size (px)
Citation preview

FYE March 31,2017Second Quarter Results
November 4, 2016
2
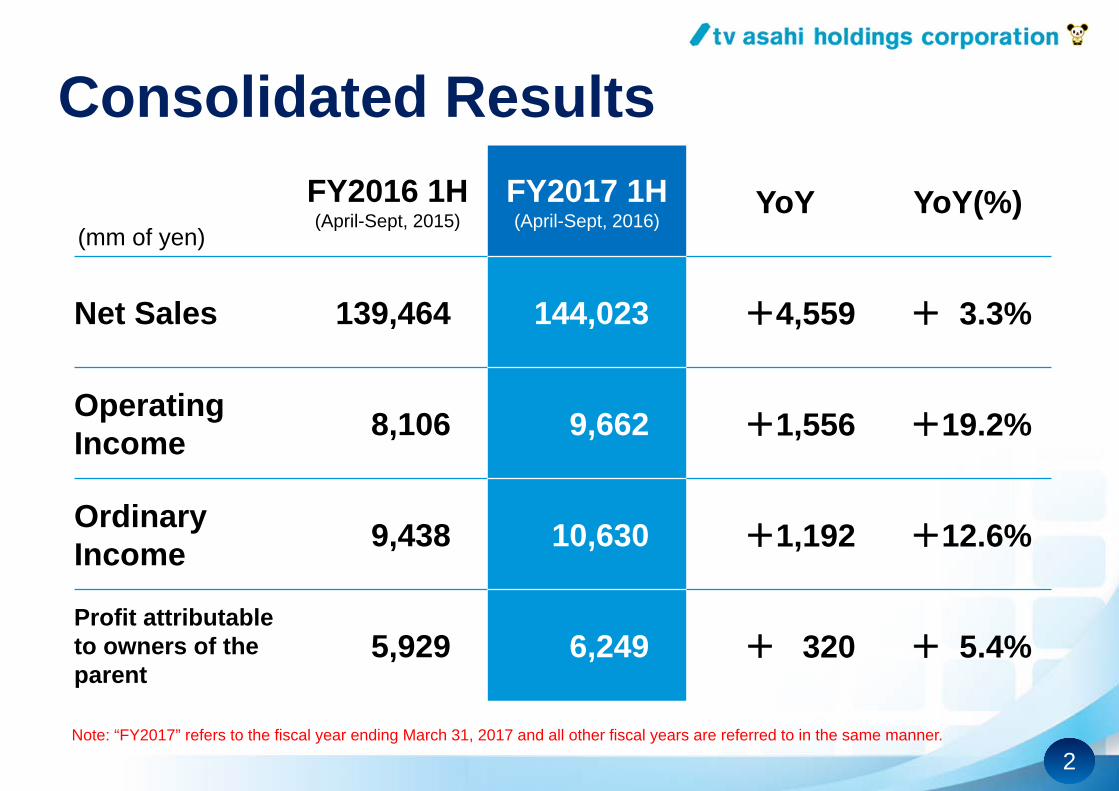
FY2016 1H(April-Sept, 2015)
FY2017 1H(April-Sept, 2016)
YoY YoY(%)
Net Sales 139,464 144,023 +4,559 + 3.3%
Operating Income 8,106 9,662 +1,556 +19.2%
Ordinary Income 9,438 10,630 +1,192 +12.6%
Profit attributable to owners of the parent
5,929 6,249 + 320 + 5.4%
Consolidated Results
(mm of yen)
Note: “FY2017” refers to the fiscal year ending March 31, 2017 and all other fiscal years are referred to in the same manner.
3
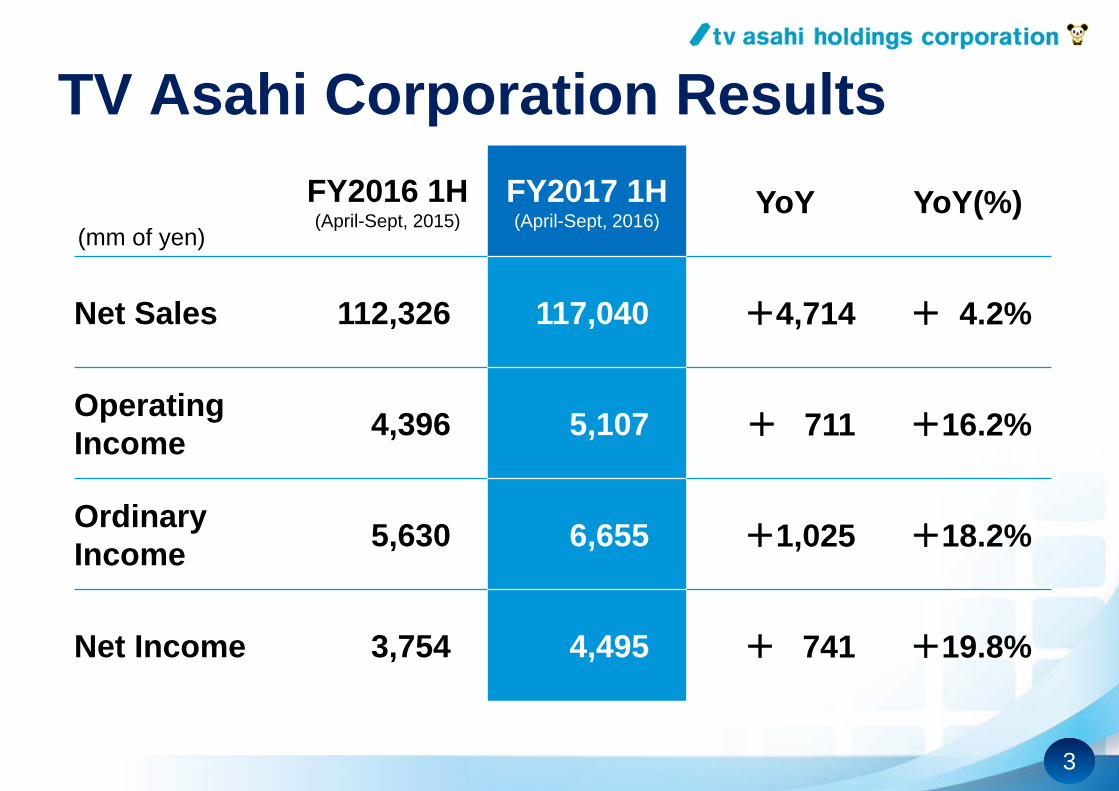
FY2016 1H(April-Sept, 2015)
FY2017 1H(April-Sept, 2016)
YoY YoY(%)
Net Sales 112,326 117,040 +4,714 + 4.2%
Operating Income 4,396 5,107 + 711 +16.2%
Ordinary Income 5,630 6,655 +1,025 +18.2%
Net Income 3,754 4,495 + 741 +19.8%
TV Asahi Corporation Results
(mm of yen)
4
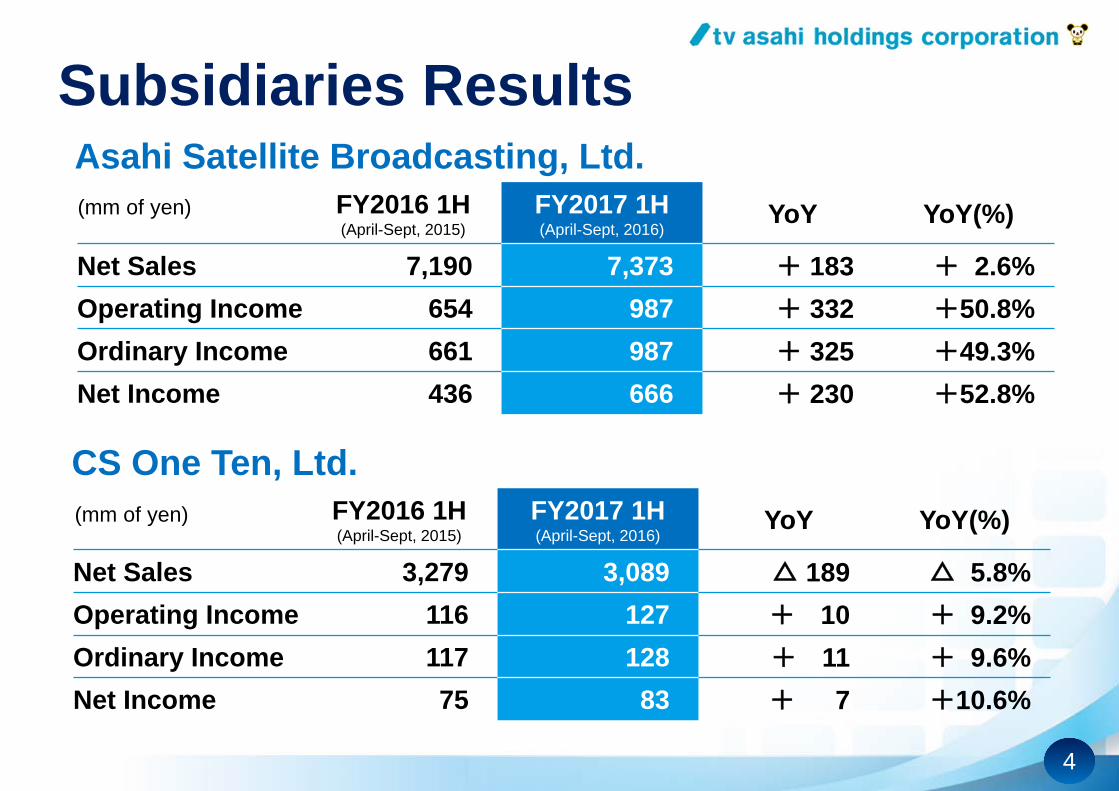
FY2016 1H(April-Sept, 2015)
FY2017 1H(April-Sept, 2016)
YoY YoY(%)
Net Sales 3,279 3,089 △ 189 △ 5.8%Operating Income 116 127 + 10 + 9.2%Ordinary Income 117 128 + 11 + 9.6%Net Income 75 83 + 7 +10.6%
FY2016 1H(April-Sept, 2015)
FY2017 1H(April-Sept, 2016)
YoY YoY(%)
Net Sales 7,190 7,373 + 183 + 2.6%Operating Income 654 987 + 332 +50.8%Ordinary Income 661 987 + 325 +49.3%Net Income 436 666 + 230 +52.8%
Asahi Satellite Broadcasting, Ltd.
CS One Ten, Ltd.
Subsidiaries Results
(mm of yen)
(mm of yen)
5
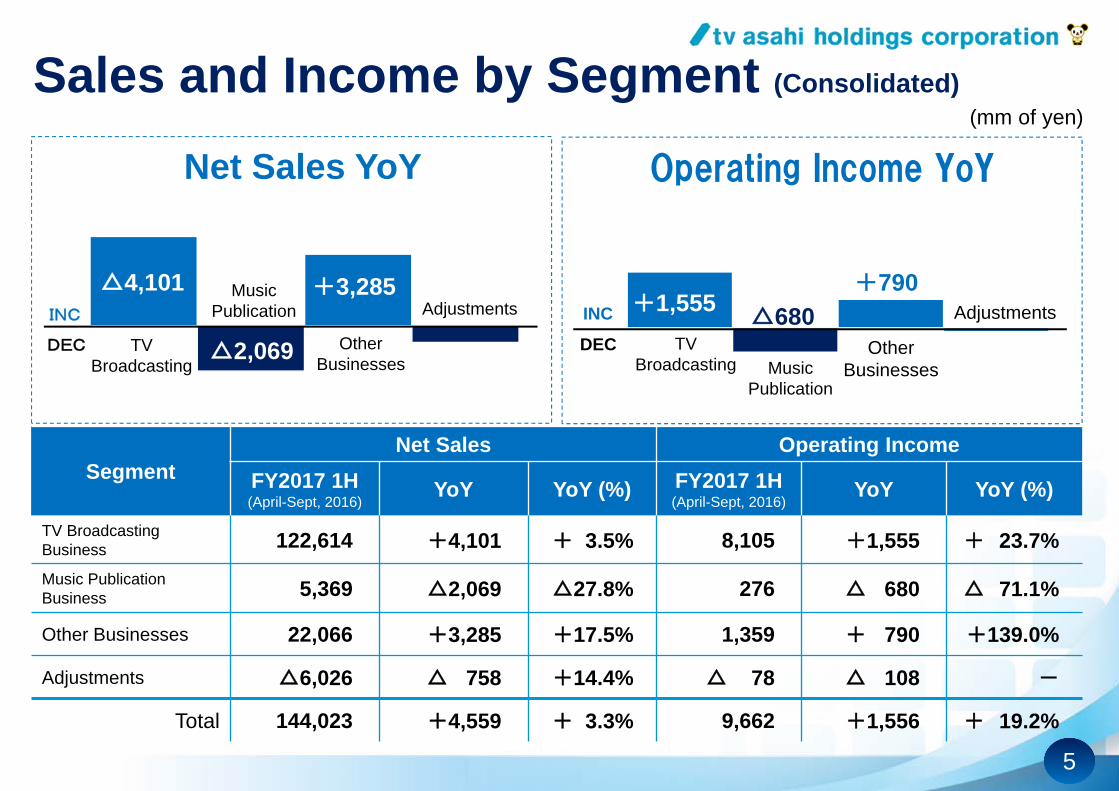
Sales and Income by Segment (Consolidated)
SegmentNet Sales Operating Income
FY2017 1H(April-Sept, 2016)
YoY YoY (%) FY2017 1H(April-Sept, 2016)
YoY YoY (%)
TV Broadcasting Business 122,614 +4,101 + 3.5% 8,105 +1,555 + 23.7%Music Publication Business 5,369 △2,069 △27.8% 276 △ 680 △ 71.1%
Other Businesses 22,066 +3,285 +17.5% 1,359 + 790 +139.0%
Adjustments △6,026 △ 758 +14.4% △ 78 △ 108 -
Total 144,023 +4,559 + 3.3% 9,662 +1,556 + 19.2%
(mm of yen)
TV Broadcasting
MusicPublication
Other Businesses
AdjustmentsINC
DEC
Net Sales YoY
△4,101 +3,285
△2,069 TV Broadcasting Music
Publication
Other Businesses
AdjustmentsINC
DEC
Operating Income YoY
+1,555△680
+790
6
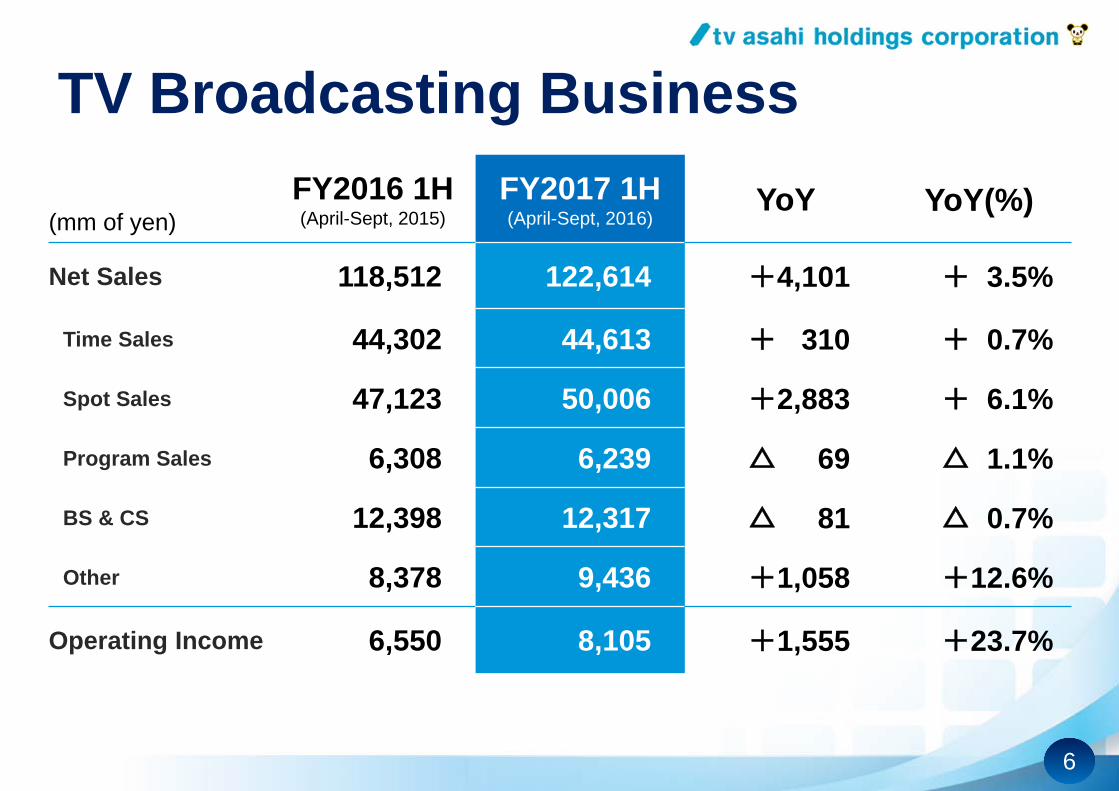
FY2016 1H(April-Sept, 2015)
FY2017 1H(April-Sept, 2016)
YoY YoY(%)
Net Sales 118,512 122,614 +4,101 + 3.5%
Time Sales 44,302 44,613 + 310 + 0.7%
Spot Sales 47,123 50,006 +2,883 + 6.1%
Program Sales 6,308 6,239 △ 69 △ 1.1%
BS & CS 12,398 12,317 △ 81 △ 0.7%
Other 8,378 9,436 +1,058 +12.6%
Operating Income 6,550 8,105 +1,555 +23.7%
TV Broadcasting Business
(mm of yen)
7
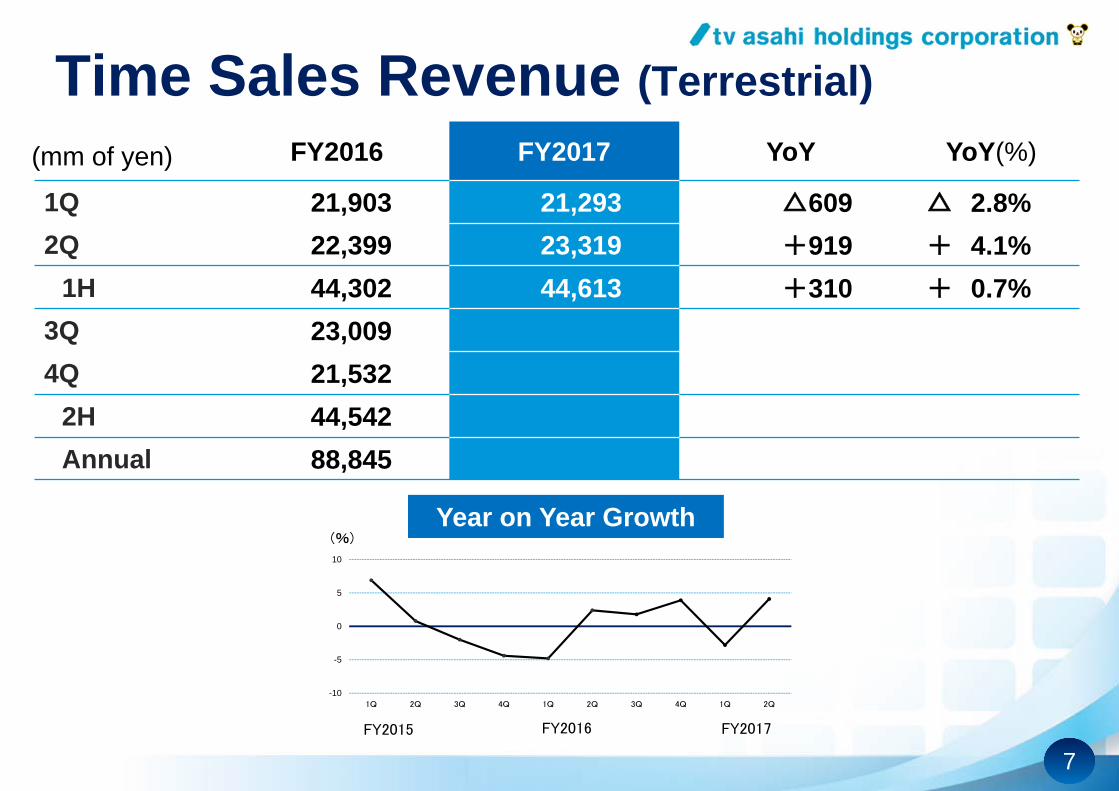
FY2016 FY2017 YoY YoY(%)
1Q 21,903 21,293 △609 △ 2.8%2Q 22,399 23,319 +919 + 4.1%
1H 44,302 44,613 +310 + 0.7%3Q 23,0094Q 21,532
2H 44,542Annual 88,845
Time Sales Revenue (Terrestrial)
FY2015 FY2016
(mm of yen)
Year on Year Growth(%)
FY2017
-10
-5
0
5
10
1Q 2Q 3Q 4Q 1Q 2Q 3Q 4Q 1Q 2Q
8
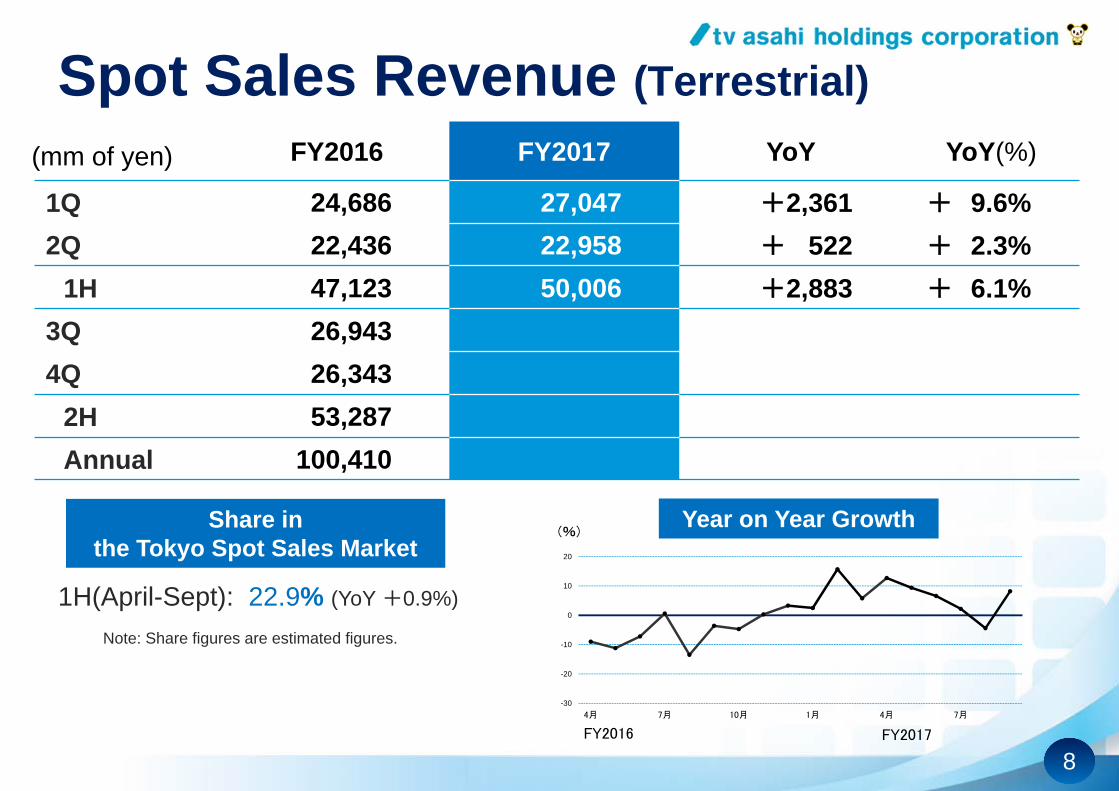
FY2016 FY2017 YoY YoY(%)
1Q 24,686 27,047 +2,361 + 9.6%2Q 22,436 22,958 + 522 + 2.3%
1H 47,123 50,006 +2,883 + 6.1%3Q 26,9434Q 26,343
2H 53,287Annual 100,410
Spot Sales Revenue (Terrestrial)
FY2016 FY2017
(mm of yen)
Year on Year GrowthShare in the Tokyo Spot Sales Market
1H(April-Sept): 22.9% (YoY +0.9%)
Note: Share figures are estimated figures.
(%)
-30
-20
-10
0
10
20
4月 7月 10月 1月 4月 7月
9
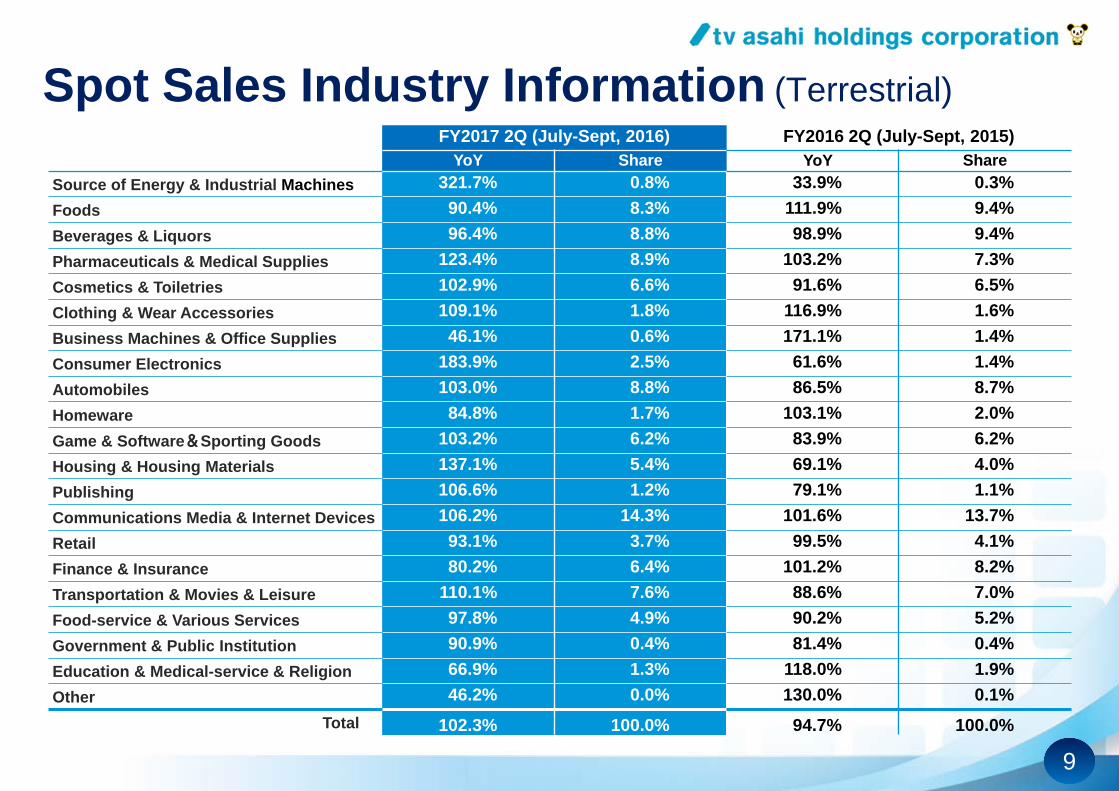
Spot Sales Industry Information (Terrestrial)FY2017 2Q (July-Sept, 2016) FY2016 2Q (July-Sept, 2015)
YoY Share YoY ShareSource of Energy & Industrial Machines 321.7% 0.8% 33.9% 0.3%Foods 90.4% 8.3% 111.9% 9.4%Beverages & Liquors 96.4% 8.8% 98.9% 9.4%Pharmaceuticals & Medical Supplies 123.4% 8.9% 103.2% 7.3%Cosmetics & Toiletries 102.9% 6.6% 91.6% 6.5%Clothing & Wear Accessories 109.1% 1.8% 116.9% 1.6%Business Machines & Office Supplies 46.1% 0.6% 171.1% 1.4%Consumer Electronics 183.9% 2.5% 61.6% 1.4%Automobiles 103.0% 8.8% 86.5% 8.7%Homeware 84.8% 1.7% 103.1% 2.0%Game & Software&Sporting Goods 103.2% 6.2% 83.9% 6.2%Housing & Housing Materials 137.1% 5.4% 69.1% 4.0%Publishing 106.6% 1.2% 79.1% 1.1%Communications Media & Internet Devices 106.2% 14.3% 101.6% 13.7%Retail 93.1% 3.7% 99.5% 4.1%Finance & Insurance 80.2% 6.4% 101.2% 8.2%Transportation & Movies & Leisure 110.1% 7.6% 88.6% 7.0%Food-service & Various Services 97.8% 4.9% 90.2% 5.2%Government & Public Institution 90.9% 0.4% 81.4% 0.4%Education & Medical-service & Religion 66.9% 1.3% 118.0% 1.9%Other 46.2% 0.0% 130.0% 0.1%
Total 102.3% 100.0% 94.7% 100.0%
10
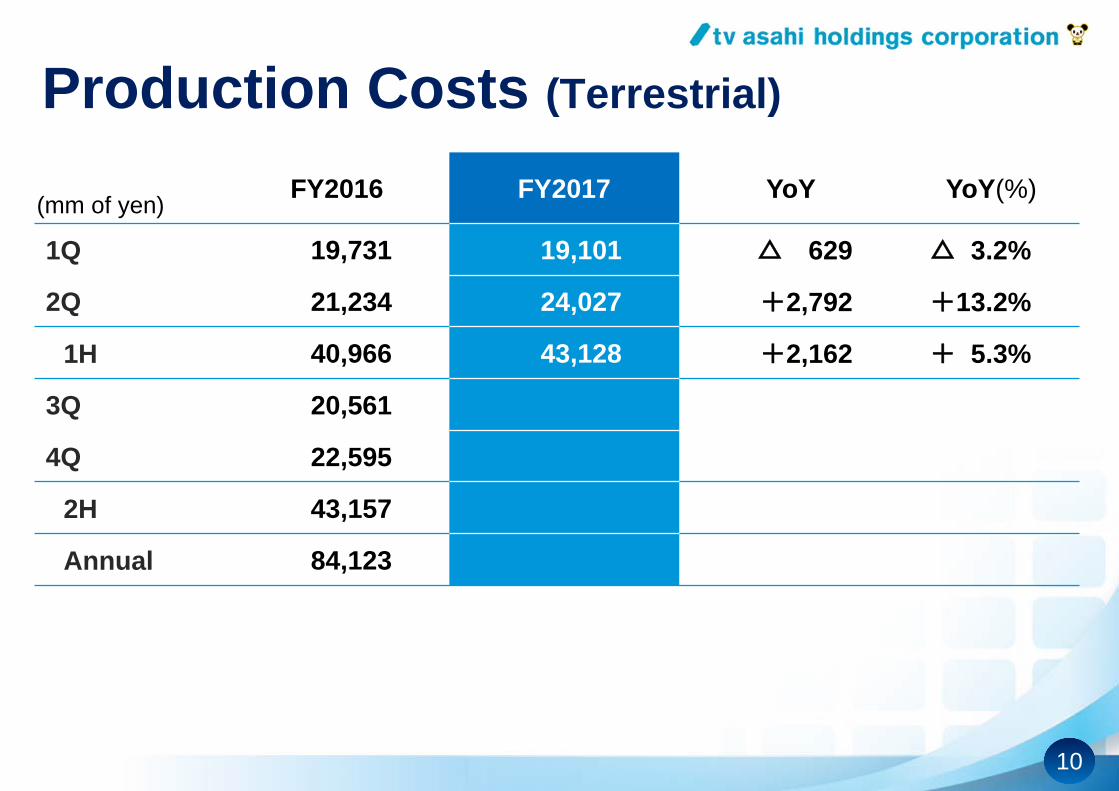
Production Costs (Terrestrial)
FY2016 FY2017 YoY YoY(%)
1Q 19,731 19,101 △ 629 △ 3.2%
2Q 21,234 24,027 +2,792 +13.2%
1H 40,966 43,128 +2,162 + 5.3%
3Q 20,561
4Q 22,595
2H 43,157
Annual 84,123
(mm of yen)
11
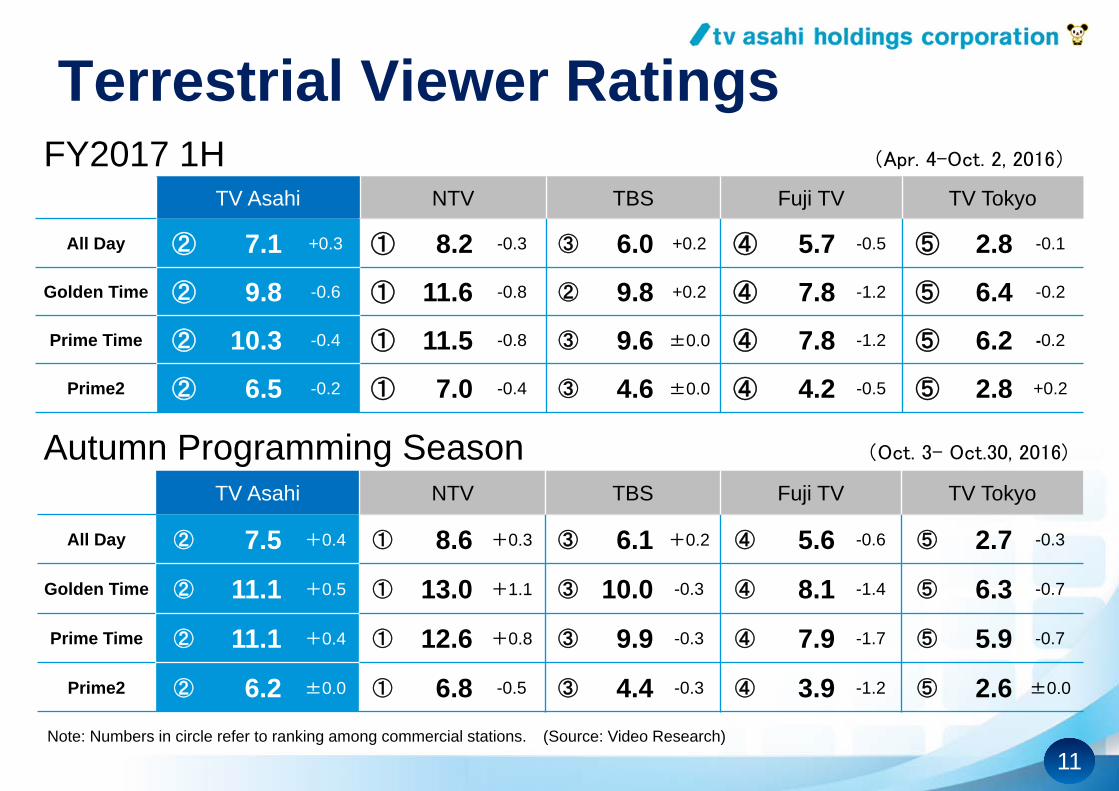
TV Asahi NTV TBS Fuji TV TV Tokyo
All Day ② 7.5 +0.4 ① 8.6 +0.3 ③ 6.1 +0.2 ④ 5.6 -0.6 ⑤ 2.7 -0.3
Golden Time ② 11.1 +0.5 ① 13.0 +1.1 ③ 10.0 -0.3 ④ 8.1 -1.4 ⑤ 6.3 -0.7
Prime Time ② 11.1 +0.4 ① 12.6 +0.8 ③ 9.9 -0.3 ④ 7.9 -1.7 ⑤ 5.9 -0.7
Prime2 ② 6.2 ±0.0 ① 6.8 -0.5 ③ 4.4 -0.3 ④ 3.9 -1.2 ⑤ 2.6 ±0.0
Autumn Programming Season (Oct. 3- Oct.30, 2016)
FY2017 1H (Apr. 4-Oct. 2, 2016)
TV Asahi NTV TBS Fuji TV TV Tokyo
All Day ② 7.1 +0.3 ① 8.2 -0.3 ③ 6.0 +0.2 ④ 5.7 -0.5 ⑤ 2.8 -0.1
Golden Time ② 9.8 -0.6 ① 11.6 -0.8 ② 9.8 +0.2 ④ 7.8 -1.2 ⑤ 6.4 -0.2
Prime Time ② 10.3 -0.4 ① 11.5 -0.8 ③ 9.6 ±0.0 ④ 7.8 -1.2 ⑤ 6.2 -0.2
Prime2 ② 6.5 -0.2 ① 7.0 -0.4 ③ 4.6 ±0.0 ④ 4.2 -0.5 ⑤ 2.8 +0.2
Note: Numbers in circle refer to ranking among commercial stations. (Source: Video Research)
Terrestrial Viewer Ratings
12
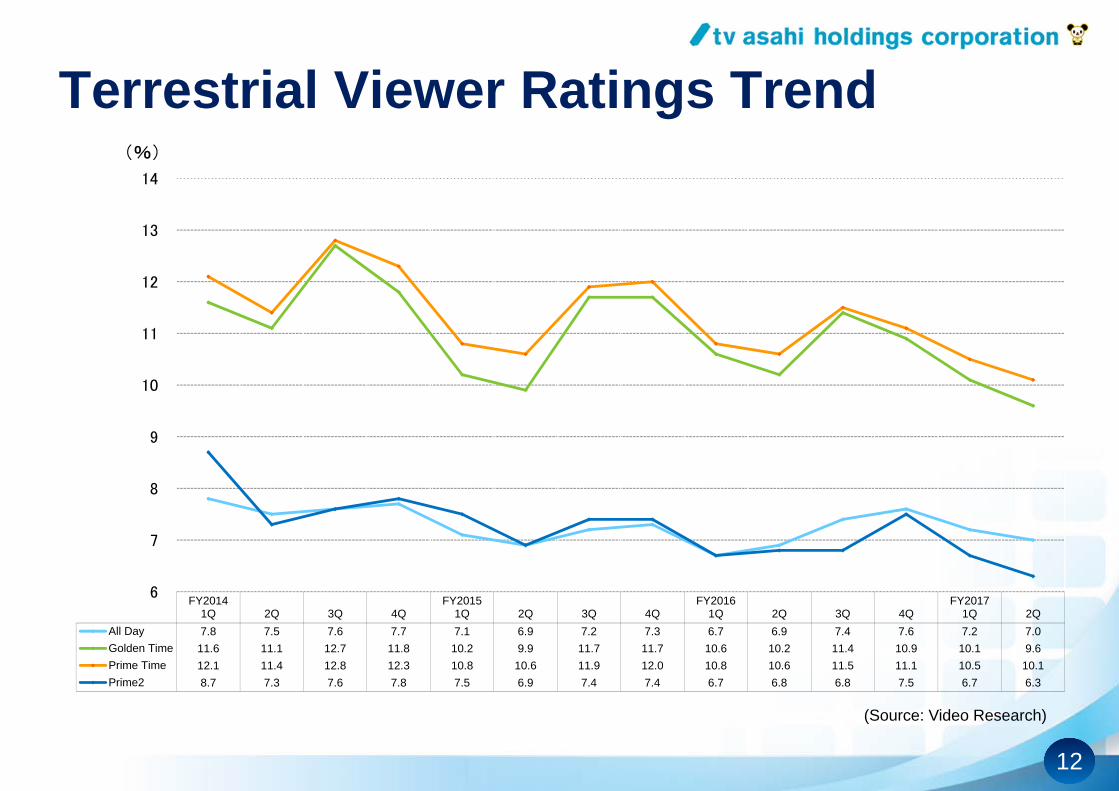
Terrestrial Viewer Ratings Trend
(Source: Video Research)
FY20141Q 2Q 3Q 4Q
FY20151Q 2Q 3Q 4Q
FY20161Q 2Q 3Q 4Q
FY20171Q 2Q
All Day 7.8 7.5 7.6 7.7 7.1 6.9 7.2 7.3 6.7 6.9 7.4 7.6 7.2 7.0Golden Time 11.6 11.1 12.7 11.8 10.2 9.9 11.7 11.7 10.6 10.2 11.4 10.9 10.1 9.6Prime Time 12.1 11.4 12.8 12.3 10.8 10.6 11.9 12.0 10.8 10.6 11.5 11.1 10.5 10.1Prime2 8.7 7.3 7.6 7.8 7.5 6.9 7.4 7.4 6.7 6.8 6.8 7.5 6.7 6.3
6
7
8
9
10
11
12
13
14
(%)
13
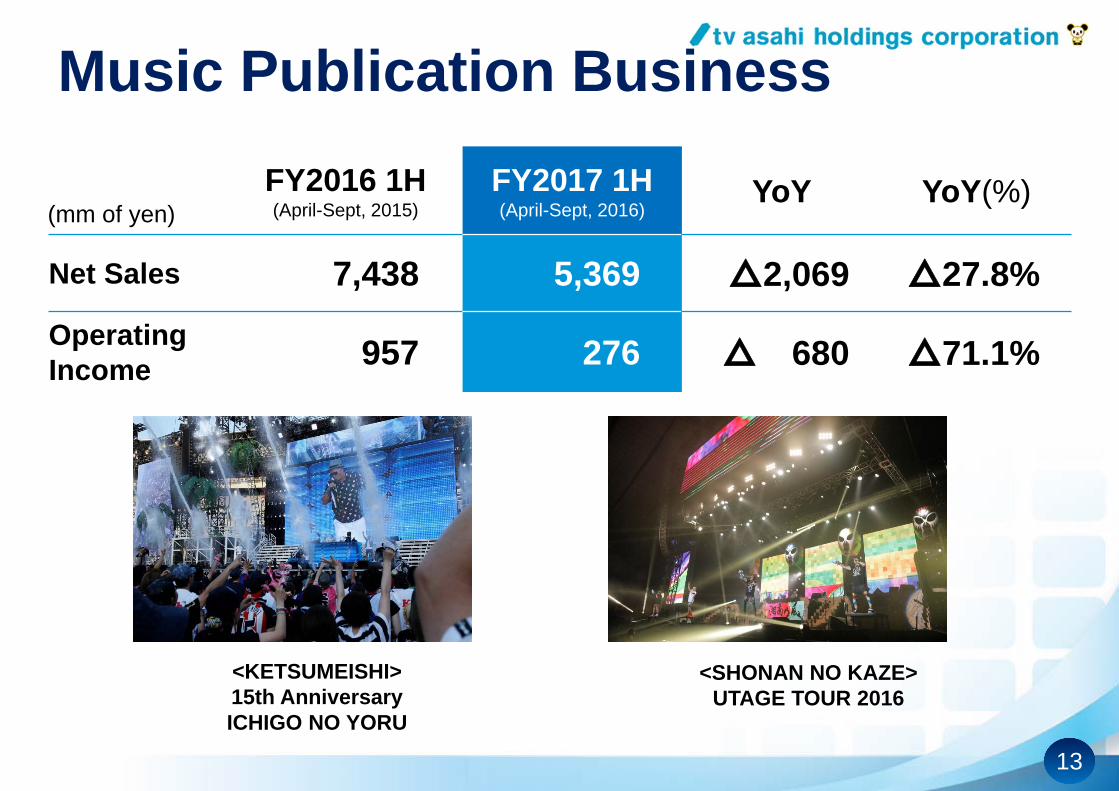
Music Publication BusinessFY2016 1H(April-Sept, 2015)
FY2017 1H(April-Sept, 2016)
YoY YoY(%)
Net Sales 7,438 5,369 △2,069 △27.8%Operating Income 957 276 △ 680 △71.1%
<SHONAN NO KAZE>UTAGE TOUR 2016
<KETSUMEISHI> 15th AnniversaryICHIGO NO YORU
(mm of yen)
14
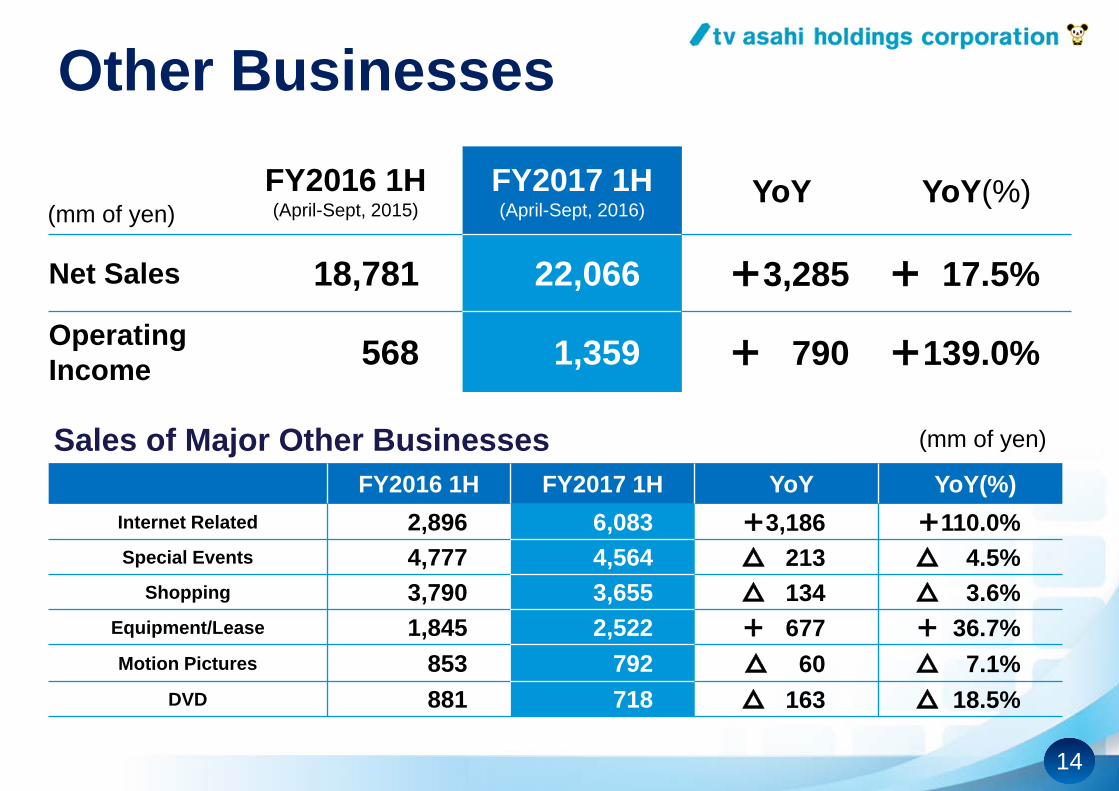
Other Businesses
Sales of Major Other Businesses>FY2016 1H FY2017 1H YoY YoY(%)
Internet Related 2,896 6,083 +3,186 +110.0%Special Events 4,777 4,564 △ 213 △ 4.5%
Shopping 3,790 3,655 △ 134 △ 3.6%Equipment/Lease 1,845 2,522 + 677 + 36.7%Motion Pictures 853 792 △ 60 △ 7.1%
DVD 881 718 △ 163 △ 18.5%
FY2016 1H(April-Sept, 2015)
FY2017 1H(April-Sept, 2016)
YoY YoY(%)
Net Sales 18,781 22,066 +3,285 + 17.5%Operating Income 568 1,359 + 790 +139.0%
(mm of yen)
(mm of yen)
15
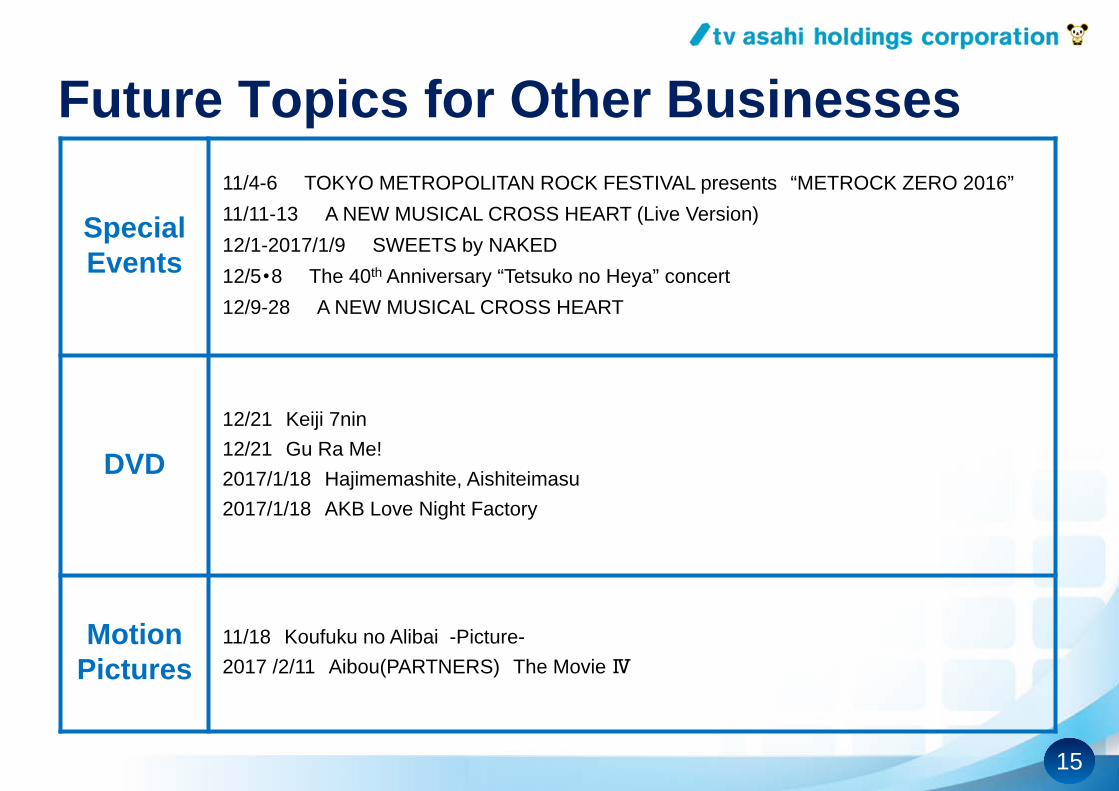
Future Topics for Other Businesses
Special Events
11/4-6 TOKYO METROPOLITAN ROCK FESTIVAL presents “METROCK ZERO 2016”11/11-13 A NEW MUSICAL CROSS HEART (Live Version)12/1-2017/1/9 SWEETS by NAKED12/5・8 The 40th Anniversary “Tetsuko no Heya” concert12/9-28 A NEW MUSICAL CROSS HEART
DVD12/21 Keiji 7nin12/21 Gu Ra Me!2017/1/18 Hajimemashite, Aishiteimasu2017/1/18 AKB Love Night Factory
Motion Pictures
11/18 Koufuku no Alibai -Picture-2017 /2/11 Aibou(PARTNERS) The Movie Ⅳ
16
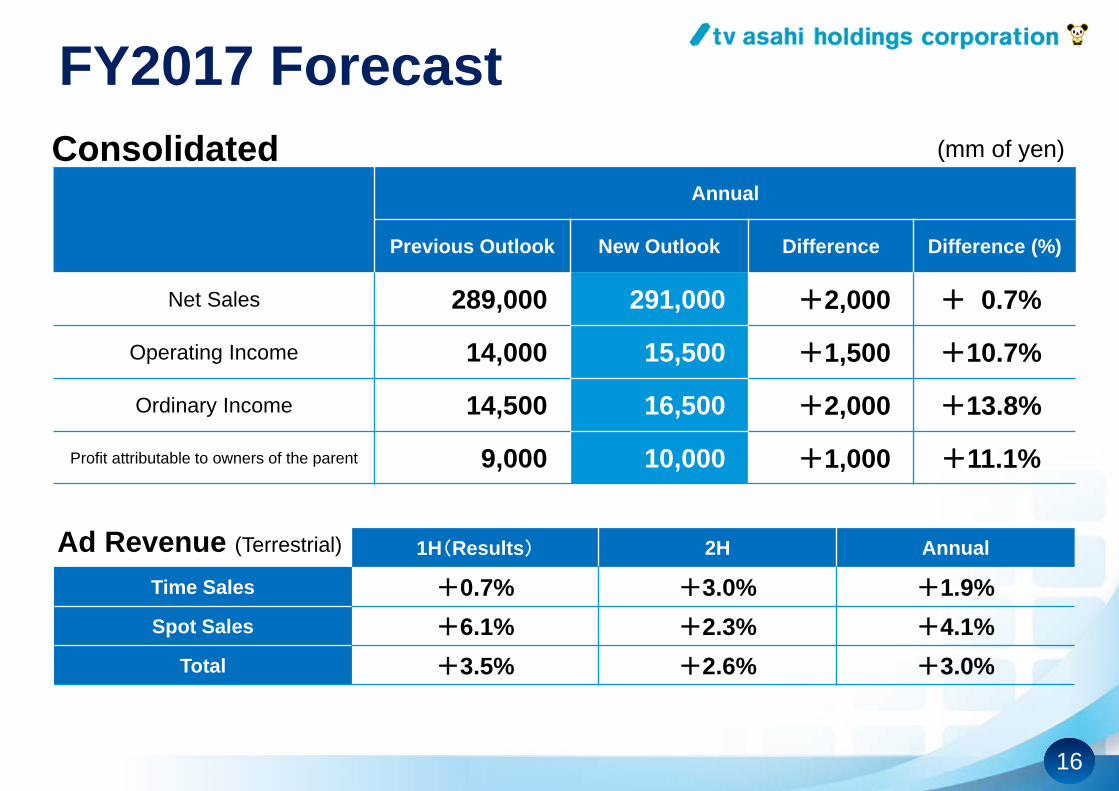
1H(Results) 2H Annual
Time Sales +0.7% +3.0% +1.9%Spot Sales +6.1% +2.3% +4.1%
Total +3.5% +2.6% +3.0%
FY2017 Forecast(mm of yen)Consolidated
Ad Revenue (Terrestrial)
Annual
Previous Outlook New Outlook Difference Difference (%)
Net Sales 289,000 291,000 +2,000 + 0.7%
Operating Income 14,000 15,500 +1,500 +10.7%
Ordinary Income 14,500 16,500 +2,000 +13.8%
Profit attributable to owners of the parent 9,000 10,000 +1,000 +11.1%
17
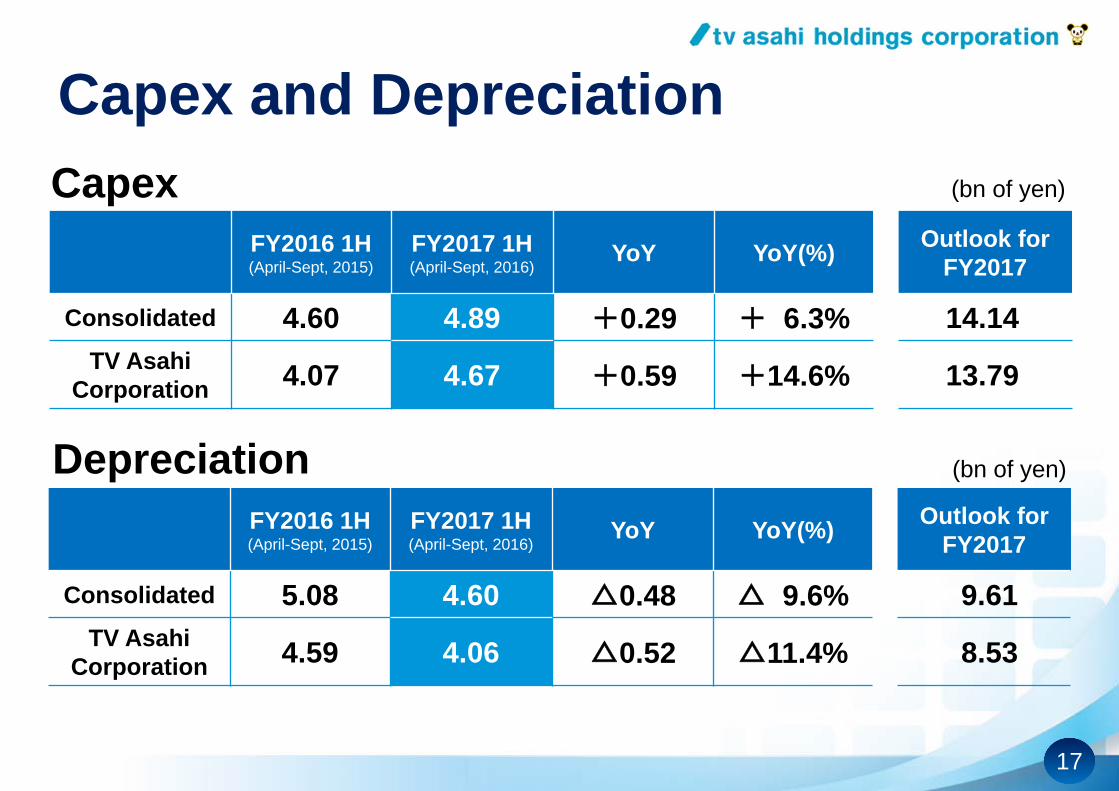
Capex and DepreciationCapex
Depreciation
FY2016 1H(April-Sept, 2015)
FY2017 1H(April-Sept, 2016)
YoY YoY(%) Outlook for FY2017
Consolidated 4.60 4.89 +0.29 + 6.3% 14.14TV Asahi
Corporation 4.07 4.67 +0.59 +14.6% 13.79
FY2016 1H(April-Sept, 2015)
FY2017 1H(April-Sept, 2016)
YoY YoY(%) Outlook for FY2017
Consolidated 5.08 4.60 △0.48 △ 9.6% 9.61TV Asahi
Corporation 4.59 4.06 △0.52 △11.4% 8.53
(bn of yen)
(bn of yen)
18
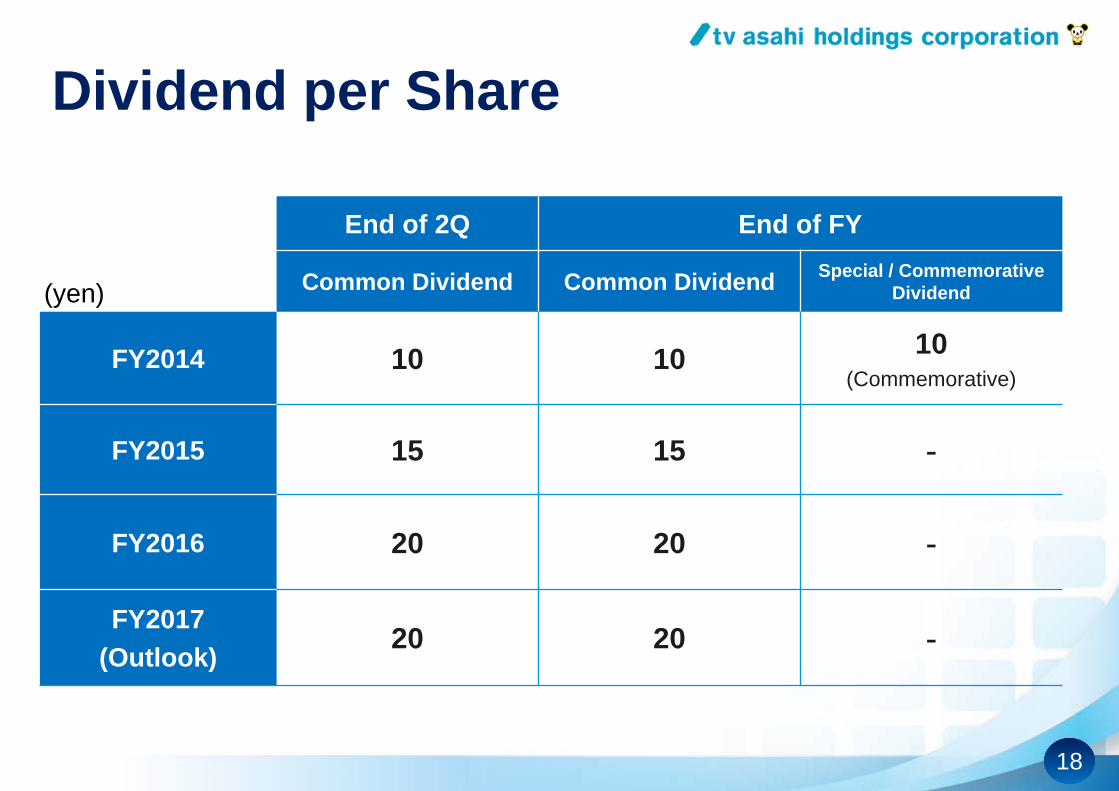
Dividend per Share
End of 2Q End of FY
Common Dividend Common Dividend Special / Commemorative Dividend
FY2014 10 10 10(Commemorative)
FY2015 15 15 -
FY2016 20 20 -
FY2017(Outlook) 20 20 -
(yen)
19
Financial outlooks and other figures that are not historical facts are based on information available at the time of announcement. Please be informed that actual
results may differ due to various factors in the business environment. As such, actual results may differ from the forecasts given in this document and guarantees are not
made to achieving the announced results.
For further information regarding this document, please contact:Investor Relations, Corporate Strategy Department
TV Asahi Holdings CorporationTel: +81-3-6406-1115
Homepage Address: http://www.tv-asahihd.co.jp/e/contents/IR/index.html
![요약재무제표휴온스] IR BOOK_2020 2Q... · 2020. 9. 25. · 20년2분기연결기준매출1,036억원(YoY 17.6%), 영업이익132억원(YoY 57.3%), 순이익106억원(YoY](https://img.pdfslide.tips/doc/110x75/60bfc29efa74e272a77e4410/eoeoe-oe-ir-book2020-2q-2020-9-25-20e2eeeeeoe1036yoy.jpg)