Embed Size (px)
Citation preview
Gas-Phase Epoxidation of Ethylene and Propylene
Jason Gaudet
Dissertation submitted to the faculty of Virginia Polytechnic Institute and
State University in partial fulfillment of the requirements for the degree of
Doctor of Philosophy
In
Chemical Engineering
S. Ted Oyama, Chairman
David F. Cox
Rick M. Davis
Brian E. Hanson
October 21, 2010
Blacksburg, Virginia
Keywords: Ethylene oxidation, Silver, Alumina, Silicon Carbide, Ethylene; Ethylene
oxide, Propylene, Catalyst, TS-1, Au/TS-1, XANES, EXAFS, Raman
Gas-Phase Epoxidation of Ethylene and Propylene
Jason Gaudet
Abstract
Catalysts consisting of silver on α-Al2O3, α -SiC, and β-SiC supports were
synthesized and tested for catalytic performance in the gas-phase direct oxidation of
ethylene to ethylene oxide. For this study, which used no promoters, ethylene oxidation
selectivity of SiC-supported catalysts ranged from 10 to 60% and conversion from 0-
4.5%. Silicon carbide supported catalysts exhibited poor performance except for a
surface-modified β-SiC-supported catalyst, which demonstrated conversion and
selectivity similar to that of an α-Al2O3-supported catalyst. This Ag/β-SiC catalyst was
further investigated with a kinetic study, and the reaction orders were found to be 0.18
with respect to ethylene and 0.34 with respect to oxygen. The kinetic results were
consistent with Langmuir-Hinshelwood rate expressions developed from single-site and
dual-site reaction mechanisms.
Gold nanoparticles on titanium oxide and titania-silica supports are active for the
formation of propylene oxide by the oxidation of propylene with hydrogen and oxygen
mixtures. This study investigates the effect of cyanide treatment on gold supported on
titanosilicate zeolite supports (Au/TS-1). Catalysts treated with weak solutions of sodium
cyanide resulted in preferential removal of small gold particles, while catalysts treated
with strong solutions resulted in dissolution of the gold and re-precipitation as gold (+1)
iii
cyanide. X-ray absorption spectroscopy demonstrated that catalysts which produce
propylene oxide in the presence of hydrogen and oxygen mixtures had supported gold
(+3) oxide nanoparticles of 3 nm size after synthesis, which were reduced to gold metal at
reaction conditions. Samples treated with strong solutions of sodium cyanide resulted in
supported gold (+1) cyanide particles of large size, 9-11 nm. These particles did not
produce propylene oxide but, surprisingly, showed high selectivity toward propylene
hydrogenation. Increasing gold (+1) cyanide particle size resulted in a decrease in
hydrogenation activity.
TS-1 and Au/TS-1 surfaces were studied with laser Raman spectroscopy. Surface
fluorescence was substantially reduced with a low-temperature ozone treatment, allowing
observation of titanosilicate framework bands. Hydrocarbon vibrations are observed for
TS-1 and Au/TS-1 under propylene. Density functional theory models indicated that
propylene adsorbed to a metal site along the π bond would show a Raman spectrum very
similar to gas-phase propylene except for out-of-plane C-H vibrations, which would be
moved to higher energy. This adsorption spectrum, with out-of-plane vibrations shifted
to higher energy, was observed for both TS-1 and Au/TS-1. Langmuir adsorption
isotherms were generated for both TS-1 and Au/TS-1, and a scaling factor derived from
propylene uptake experiments allowed these isotherms to be scaled to propylene
coverage of titanium.

iv
Lovingly dedicated to
Arthur F. and Yvonne Gaudet
v
Acknowledgments
I am very fortunate for the direction of my advisor, Dr. S. Ted Oyama, who has
offered me invaluable guidance throughout my time at Virginia Tech, and given me
opportunities both here and abroad to expand my understanding of oxidative catalysis and
scientific research in general. I would also like to thank my committee members Dr.
David Cox, Dr. Richey Davis, and Dr. Brian Hanson for their help throughout my
graduate career.
I would also like to thank the many students and postdoctoral researchers in our
lab, who have expanded my understanding and appreciation of the world and who have
made my time at Virginia Tech both scientifically and culturally fulfilling, Specifically, I
thank Corey Reed, Yong-Kul Lee, Yan Xi, Yunfeng Gu, Hankwon Lim, Travis Gott,
Pelin Hacarlioglu, Haiyan Zhao, Phuong Bui, Samhun Yun, Dan Li, Dmitri Iarkov, and
Sheima Jatib Khatib. Much of my work would not have been possible except for the
administrative assistance of Diane Cannaday, and in the lab, critical electrical equipment
design by Riley Chan and fantastic metal fabrication work by Michael Vaught.
I would also like to thank my colleagues Kyoko K. Bando, Juan Bravo, and Jiqing
Lu, who were kind enough to guide me during my work at the National Institute of
Advanced Industrial Science and Technology in Tsukuba, Japan.
Finally, I would like to thank my family, who have been a source of unwavering
support, with most sincere gratitude to my parents, Tom and Kellie Gaudet, and my sister
Caitlyn. Most of all, I thank my wife Laura, whose faith in me is my greatest source of
strength.
vi
Table of Contents
Chapter 1
Gas-phase partial oxidation of ethylene on a
surface-modified Ag/β-SiC catalyst
1.1 Introduction 1
1.2 Experimental 3
1.3 Results 8
1.4 Discussion 19
1.5 Conclusions 26
1.6 Appendix 27
1.7 References 29
Chapter 2
Effect of gold oxidation state on the epoxidation
and hydrogenation of propylene on Au/TS-1
2.1 Introduction 34
2.2 Experimental 35
2.2.1 Synthesis of samples 35
2.2.2 Cyanide treatment 36
vii
2.2.3 Transmission electron microscopy 37
2.2.4 Reactivity testing 37
2.2.5 X-ray absorption spectroscopy 38
2.3 Results 41
2.3.1 Catalyst characterization 41
2.3.2 Reactivity testing 45
2.3.3 X-ray absorption near edge structure 49
2.3.4 Extended x-ray absorption fine structure 56
2.4 Discussion 57
2.5 Conclusions 66
2.6 References 66
Chapter 3
Raman spectroscopic adsorption study
of TS-1 and Au/TS-1 under propylene
3.1 Introduction 71
3.2 Experimental 72
3.2.1 Synthesis and preparation 72
3.2.2 Laser Raman spectroscopy 73
3.2.3 Computational molecular modeling 76
3.2.4 Temperature programmed desorption 76
3.2.5 Propylene uptake 77
viii
3.3 Results and discussion 78
3.3.1 Initial Raman spectroscopy 78
3.3.2 Density functional theory 84
3.3.3 Temperature programmed desoroption and C3H6 uptake 88
3.3.4 Adsorption isotherms calculated by Raman spectroscopy 92
3.4 Conclusions 95
3.5 Appendix 96
3.6 References 104
Chapter 4
Conclusions
Conclusions 106
List of Tables
Table 1.1. Calculated dispersion for samples 10
Table 1.2. 36% Ag/β-SiC-mod kinetic study conditions. All runs using 0.5 g catalyst,
30 cm3NTP min-1 total flow rate (balance Ar), 101 kPa. 15
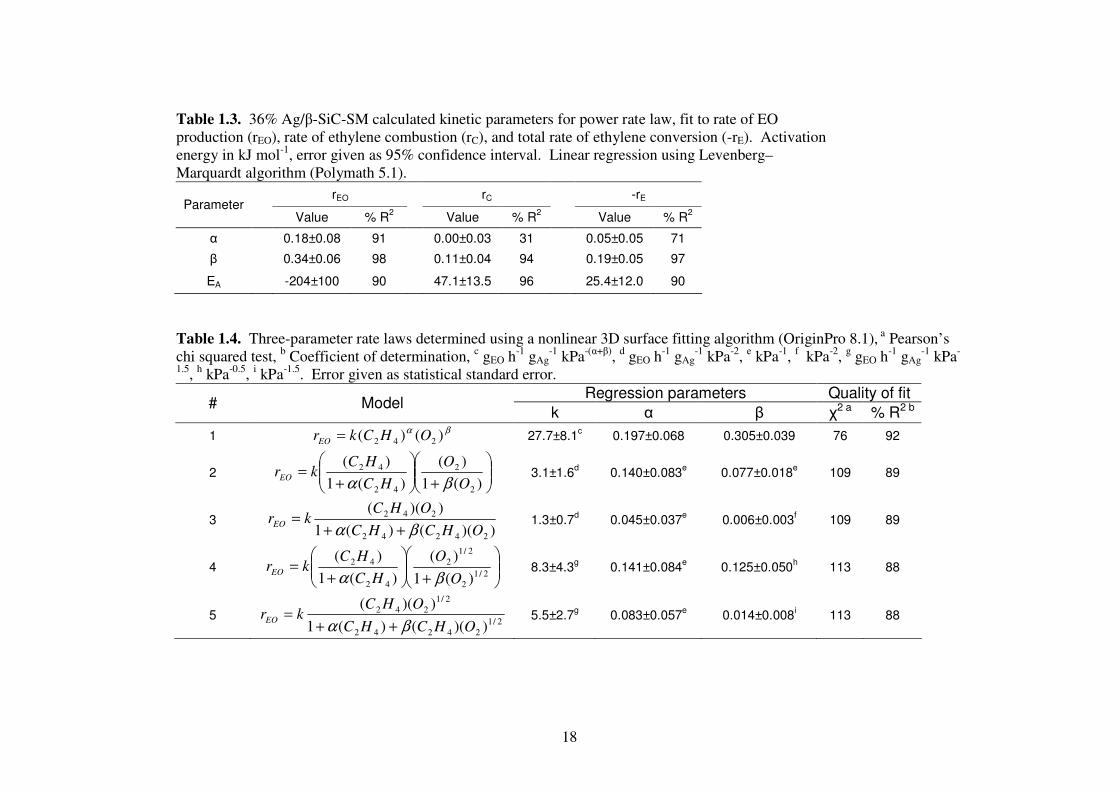
Table 1.3. 36% Ag/β-SiC-SM calculated kinetic parameters for power rate law, fit to
rate of EO production (rEO), rate of ethylene combustion (rC), and total rate
of ethylene conversion (-rE). Activation energy in kJ mol-1, error given as
ix
95% confidence interval. Linear regression using Levenberg–Marquardt
algorithm (Polymath 5.1). 18
Table 1.4. Three-parameter rate laws determined using a nonlinear 3D surface fitting
algorithm (OriginPro 8.1), a Pearson’s chi squared test, b Coefficient of
determination, c gEO h-1 gAg-1 kPa-(α+β), d gEO h-1 gAg
-1 kPa-2, e kPa-1, f kPa-2,
g gEO h-1 gAg-1 kPa-1.5, h kPa-0.5, i kPa-1.5. Error given as statistical standard
error. 18
Table 2.1. Gold content determined by x-ray fluorescence and gold particle diameter
determined by transmission electron microscopy. 42
Table 2.2. X-ray photoelectron spectroscopy characterization of samples after
reaction 42
Table 2.3. Extended x-ray absorption fine structure regression parameters for gold
standard and samples 55
Table 3.1. The adsorption of hydrogen, oxygen, and propylene determined by
temperature programmed desorption (TPD) and propylene uptake 91
List of figures
Figure 1.1. Ag spheres of radius r, spaced 2R apart on support surface. 9
Figure 1.2. Correlation of Eqn. 1.7 to reference data 9
Figure 1.3. Ethylene turnover frequencies (TOF) of samples. Conditions are 10/5/15
cm3NTP min-1 C2H4/O2/Ar, 101 kPa, 0.5 g catalyst. Samples are 6% Ag/α-
Al2O3 (○),12% Ag/α-Al2O3 (●), 56% Ag/α-SiC-std (Strem standard) (▲),
x
56% Ag/β-SiC-std (Wako standard) (▼), 36% Ag/β-SiC-high (high
porosity SICAT) (□), 36% Ag/β-SiC-low (low porosity SICAT) (■), 36%
Ag/β-SiC-mod (surface modified SICAT) (♦). 12
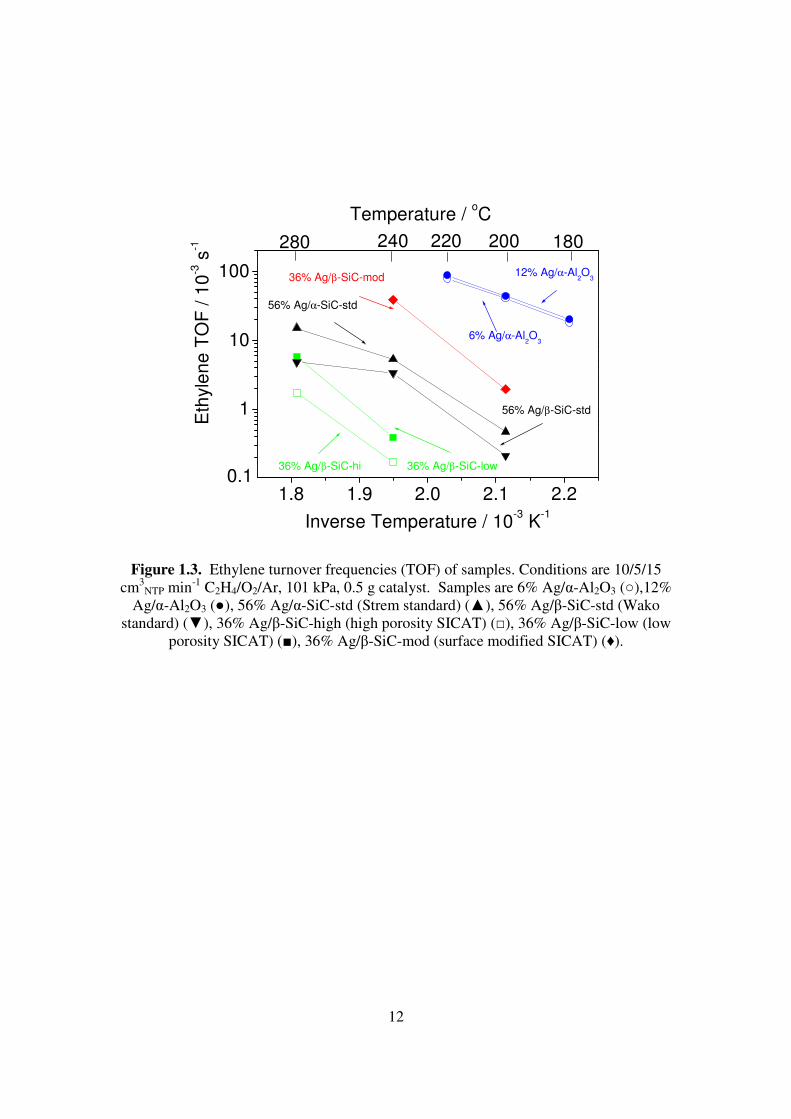
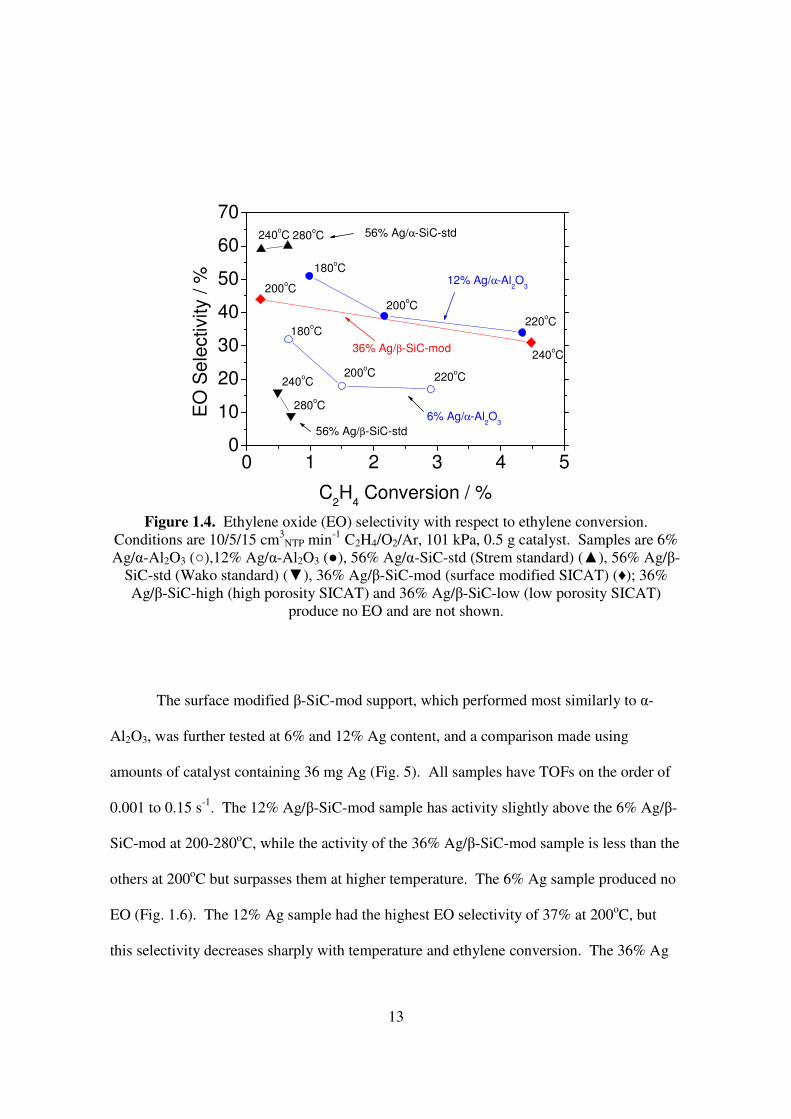
Figure 1.4. Ethylene oxide (EO) selectivity with respect to ethylene conversion.
Conditions are 10/5/15 cm3NTP min-1 C2H4/O2/Ar, 101 kPa, 0.5 g catalyst.
Samples are 6% Ag/α-Al2O3 (○),12% Ag/α-Al2O3 (●), 56% Ag/α-SiC-std
(Strem standard) (▲), 56% Ag/β-SiC-std (Wako standard) (▼), 36%
Ag/β-SiC-mod (surface modified SICAT) (♦); 36% Ag/β-SiC-high (high
porosity SICAT) and 36% Ag/β-SiC-low (low porosity SICAT) produce
no EO and are not shown. 13
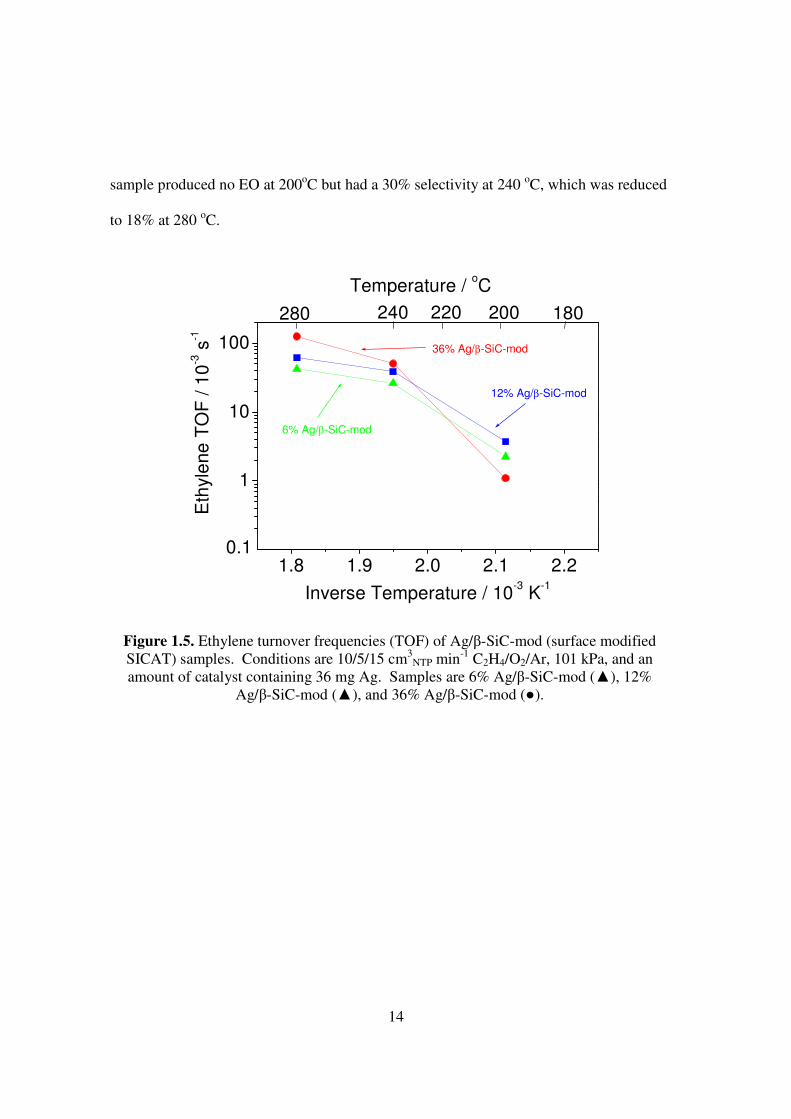
Figure 1.5. Ethylene turnover frequencies (TOF) of Ag/β-SiC-mod (surface modified
SICAT) samples. Conditions are 10/5/15 cm3NTP min-1 C2H4/O2/Ar, 101
kPa, and an amount of catalyst containing 36 mg Ag. Samples are 6%
Ag/β-SiC-mod (▲), 12% Ag/β-SiC-mod (▲), and 36% Ag/β-SiC-mod
(●).
14
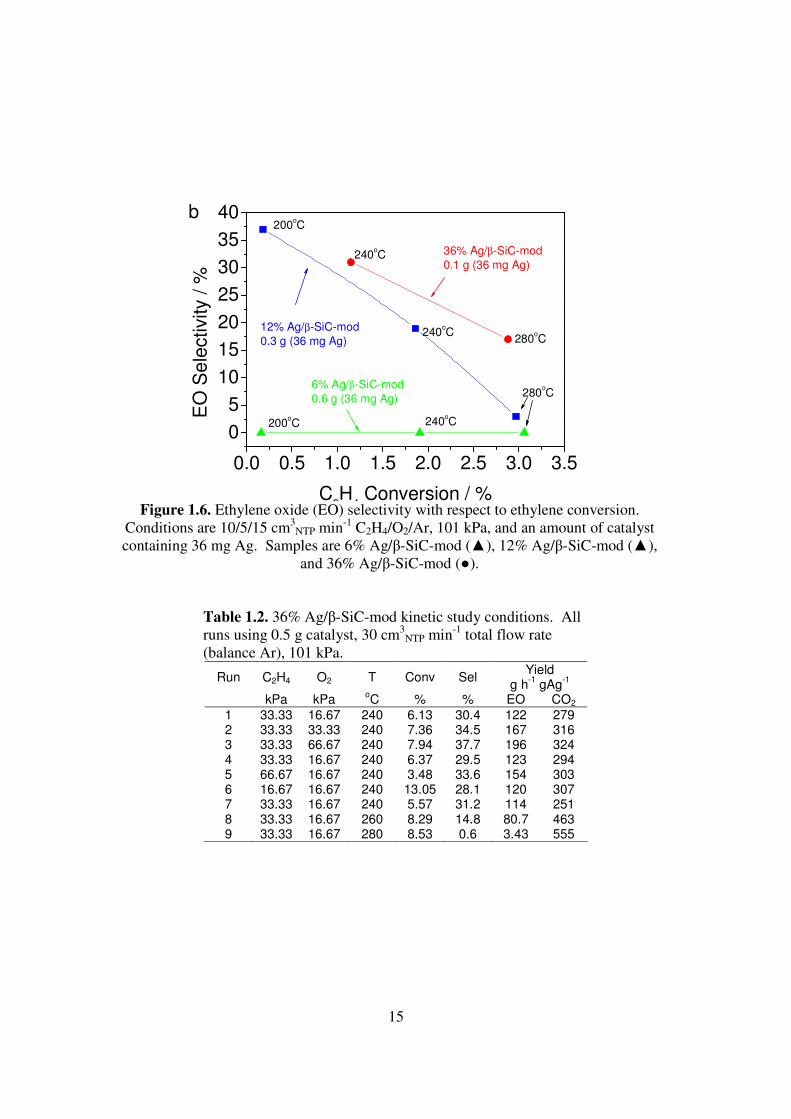
Figure 1.6. Ethylene oxide (EO) selectivity with respect to ethylene conversion.
Conditions are 10/5/15 cm3NTP min-1 C2H4/O2/Ar, 101 kPa, and an amount
of catalyst containing 36 mg Ag. Samples are 6% Ag/β-SiC-mod (▲),
12% Ag/β-SiC-mod (▲), and 36% Ag/β-SiC-mod (●). 15
Figure 2.1. Transmission electron micrographs of Au/TS-1 catalysts after reaction
(left) and calculated Au particle size distribution (right). a) Au-0.0, b) Au-
0.05, c) AuCN-1.0, d) AuCN-2.0 43
xi
Figure 2.2. High resolution transmission electron micrographs of a)-c) Au-0.0, d) Au-
0.05, e) AuCN-1.0, f) AuCN-2.0 44
Figure 2.3. Interplanar distances and angles of gold metal and gold (+1) cyanide for
Au-0.0 and AuCN-1.0 samples. 45
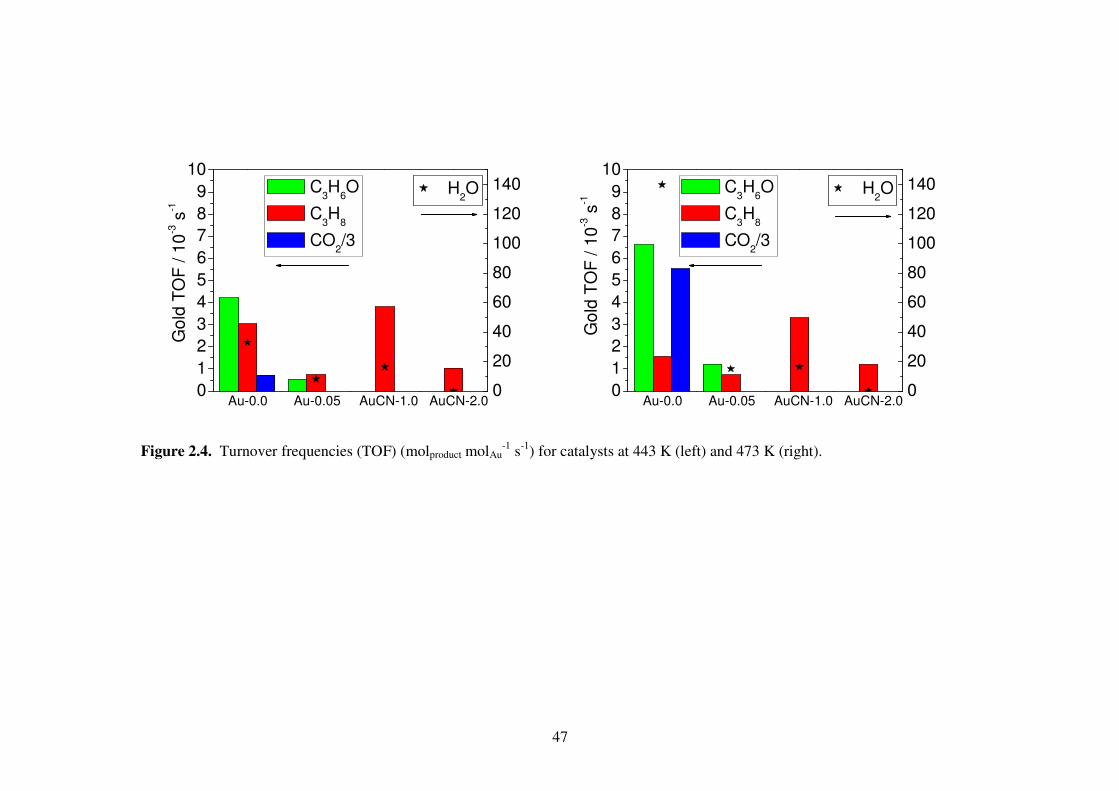
Figure 2.4. Turnover frequencies (TOF) (molproduct molAu-1 s-1) for catalysts at 443 K
(left) and 473 K (right). 47
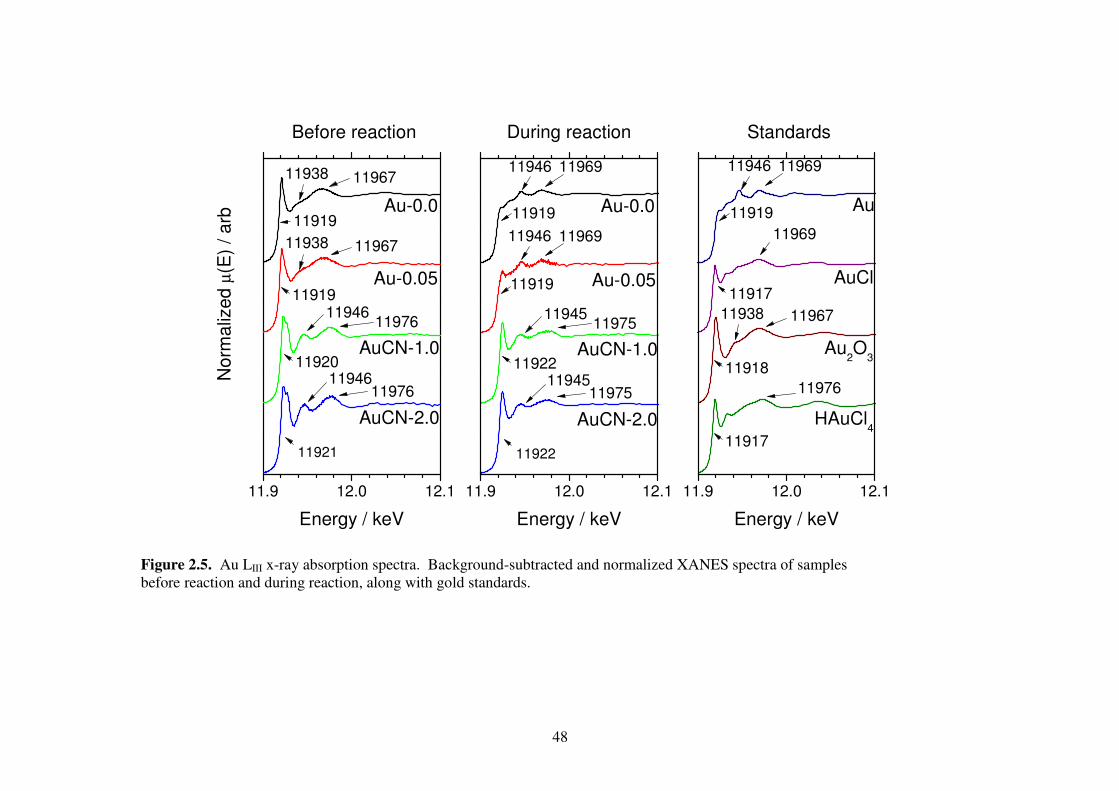
Figure 2.5. Au LIII x-ray absorption spectra. Background-subtracted and normalized
XANES spectra of samples before reaction and during reaction, along
with gold standards. 48
Figure 2.6. White line intensity of samples and standards. KAu(CN)2 calculated from
S.G. Kim, Y.-F. Hu, Y.M. Yiu, T.K. Sham, J. Electron. Spectrosc. Relat.
Phenom. 144-147 (2005) 811-815. 51
Figure 2.7. X-ray absorption spectra near edge detail for AuCN-1.0 (left) and AuCN-
2.0 (center) before and during reaction, with comparison to gold (+1)
chloride and gold (+3) chloride (right). 52
Figure 2.8. Gold 5d splitting for Au(CN)4-, Au(CN)2
-, and AuCl4- determined by
density functional theory. 53
Figure 2.9. Phase-corrected |χ(R)| spectra of standards and Au/TS-1 catalysts.
Samples are (a) Au-0.0, (b) Au-0.05, (c) AuCN-1.0, and (d) AuCN-2.0 at
298 K before reaction (dashed line) and 443 K during reaction (solid line).
Standards are (e) gold foil (solid line) and Au2O3 (dashed line); (f) AuCl
(solid line) and HAuCl4 (dashed line). 54
Figure 3.1. Laser Raman spectrometer diagram. 79
xii
Figure 3.2. Au/TS-1 surface fluorescence at 200 mW laser intensity before before and
after ozone treatment. 80
Figure 3.3. TS-1 and Au/TS-1 surfaces at 298 K, both without surface treatment
(untreated) and with ozone treatment (1.5/8/40 cm3NTP min-1 O3/O2/He,
473 K). TS-1 was also exposed to high temperature oxygen treatment
(10/40 cm3NTP min-1 O2/He,773 K) which revealed the same surface
features as ozone treatment. All spectra are given without background
correction, to illustrate fluorescence of the untreated surfaces. 80
Figure 3.4. TS-1 surface at 298 K under air and propylene. Spectra are propylene
features except where indicated as silicalite features (TS-1, S-1) and
titanium features (Ti). 82
Figure 3.5. Background-subtracted Raman spectra presents stronger propylene signals
under 10% C3H6 than 10% each H2, O2, and C3H6, on both TS-1 and
Au/TS-1. 83
Figure 3.6: Propylene in gas phase ([gas]) and dissociated propylene (C3H5-) adsorbed
to Ti(OH)4 at C1,C2,C3 and at π bond, determined by density functional
theory. Raman spectra determined experimentally (Ads-C3H6 [TS-1]) is
most similar to π-adsorbed propylene. 87
Figure 3.7. Temperature programmed desorption of TS-1 and Au/TS-1 samples at 5 K
min-1. 90
Figure 3.8. Langmuir adsorption isotherms of TS-1 (left panel) and Au/TS-1 (right
panel) at 298 K and 343 K. 94
1
Chapter 1
Gas-phase partial oxidation of ethylene on a
surface-modified Ag/β-SiC catalyst
1.1 Introduction
Ethylene oxide (EO) is an important commodity chemical that is primarily used to
produce ethylene glycol (EG) and surface active agents such as nonionic alkylphenol
ethoxylates and detergent alcohol ethoxylates [1]. Several dozen important fine petroleum
and chemical intermediates are derivatives of EO, and it is therefore extensively used in
applications such as washing/drying, electronics, pharmaceuticals, pesticides, textiles,
papermaking, automobiles, oil recovery and oil refining. The worldwide consumption of
EO in 2002 was 1.47 x 10⁷ metric tons per year, making it the most utilized epoxide
species. Usage was divided among North America, 10%; Western Europe, 27%; Japan,
20%; other Asia, 6%; and other regions, 3% [2].
EO is mainly produced by the direct oxidation of ethylene with air or oxygen in
packed-bed, multitubular reactors with recycle [3]. Catalysts for EO production are
generally composed of silver (10-20 wt%) supported on a low surface area (1-2 m2 g-1) α-
Al2O3 support with alkali metal (500-1200 wppm) promoters [4,5,6], especially cesium
[7,8,9] and sodium [7,10]. Fluoride [11], rhenium [12], and chlorine [13,14] are also used
as promoters. Chlorine is commonly introduced by injecting ppm levels of dichloroethane
or vinyl chloride to the reactant stream, which inhibits total oxidation of ethylene
2
[8,15,16,17,18,19,20]. An Ag/α-Al2O3 catalyst might be improved from 37% selectivity to
80% selectivity using a 2 ppm feed of 1,2-dichloroethane [21]. Selectivity is also improved
with the introduction of carbon dioxide [22,23] or methane [24].
Low surface area aluminas are typical support materials, as performance is poor
with high surface area [25]. Typical reaction conditions [4,26] are 10-35 atm, 230-280 oC
with GHSV 1500-10000 h-1 and contact time 0.1-5 s. Conversion is typically 10% and
selectivity about 85%. The space time yield of industrial EO production is given as 0.032-
0.32 gEO h-1 (cm3 cat)-1 [26], 330 kgEO m-3h-1 [11], 2-25 lbsEO ft-3h-1 [27]. Given that the
density of typical EO catalysts is about 45 lb ft-3 (0.72 g cm-3) [4,Error! Bookmark not
defined.], these values translate to a space time yield of about 44-440 gEO kgcat-1 h-1.
Assuming full coverage of the support with silver with a site density of 1019 m-2, a turnover
frequency (TOF) of 0.014-0.15 s-1 can be calculated. The development of new catalysts for
ethylene oxide production is an important area of research [28]. Approaches taken include
the investigation of silver alloys [27], the addition of promoters [29], and the use of new
supports.
Silicon carbide is a desirable support due to its wear resistance and heat dissipation
qualities. The formation of EO is slightly exothermic (25 kcal/mol), while the total
combustion of ethylene and EO are highly exothermic (>300 kcal/mol). Catalysts with
high thermal conductivity are preferred, as they limit undesired temperature gradients
within the reactor bed [30] or, alternatively, permit the use of larger diameter reactor tubes.
Silicon carbide has a nominal thermal conductivity of 490 W m-1 K-1 and thermal
diffusivity of 230 m2 s-1 10-6, while α-Al2O3 has a thermal conductivity of 36 W m-1 K-1 and
3
thermal diffusivity of 12 m2 s-1 10-6 [31]. The desirable heat transport properties of silicon
carbide have spurred the development of silicon carbide supports.
Silicon carbide exists in two common morphologies. The high temperature
hexagonal α structure forms large particles with low surface area (~1 m2 g-1) and sharp,
sheared edges. When exposed to air, the surface of α-SiC forms a passivation layer of up to
14 mol% SiO2. The low temperature cubic β structure forms small, rounded particles with
high surface area (10-20 m2 g-1) and its surface does not form an oxide layer [32]. The high
surface area β-SiC form is of particular interest. It is understood that high surface area α-
Al2O3 is a poor support, but if this does not necessarily hold for silicon carbide, so very
high silver loadings may be possible.
To investigate the suitability of β-SiC as an ethylene oxidation support, silver
catalysts were synthesized using supports of α-Al2O3, α-SiC, and β-SiC and tested for
catalytic performance. The activity and selectivity of these catalysts were compared, and a
β-SiC supported catalyst with a surface modification treatment (Ag/β-SiC-mod), the most
active SiC supported catalyst, was selected for study at different gold loadings.
Subsequently, a kinetic study was made on the most effective SiC-supported catalyst (36%
Ag/β-SiC-mod) which produced parameters for orders of reaction and mechanistic rate
laws.
1.2 Experimental
Catalysts were prepared by loading supports to 6, 12, 36, and 56 wt% Ag using a
wet impregnation method at room temperature. Ethylene diamine, 11.7 g, (Wako Pure
4
Chemical Industry, Ltd, 99.0%) was dissolved in distilled/deionized water and stirred for 5
minutes, followed by 0.47 g anhydrous oxalic acid (Wako, 98.0%) and silver (I) oxide
(Wako, 99.0%) (0.686 g Ag2O for 6% Ag/support, 1.465 g Ag2O for 12% Ag/support,
6.042 g Ag2O for 36% Ag/support, and 13.671 g Ag2O for 56% Ag/support). Following
the complete dissolution of the silver (I) oxide, the solution was stirred for 1 h and 2.8 g
ethanolamine (Wako, 99.0%) was added. The solution was stirred for another 1 h and 10 g
support material was introduced, forming a thin slurry. After 3 h the slurry was dried in an
oven at 120 oC for 3 h, and subsequently calcined in air at 360 oC for 3 h. The resulting
material was ground to 22/44 mesh (0.36-0.68 mm) particles.
Supports used were α-Al2O3 (Sumitomo AKP-3000, 5 m2 g-1), a commercially
available α-SiC standard (Strem, 2 m2 g-1, α-SiC-std), a commercially available β-SiC
standard (Wako, 20 m2 g-1, β-SiC-std), and two low-oxidation 30 m2 g-1 β-SiC supports
developed by SICAT: a low porosity β-SiC (SB0403A, β-SiC-low) and a high porosity β-
SiC (SB0403B, β-SiC-high). In addition, 6%, 12%, and 36% Ag on surface-modified β-
SiC (30 m2 g-1, β-SiC-mod) were provided by SICAT and used as received.
Catalytic activity was measured in a differential flow reactor consisting of a 5 mm
diameter quartz tube placed vertically in a furnace assembly. Temperature monitoring and
control was through a RKC REX-P24 temperature controller, using a thermocouple
centered within the catalyst bed. Feed gases used were ethylene (Takachiho Chemical,
>99.8%), oxygen (Tomoe Shokai, >99.5%) and argon (Suzuki Shokan, >99.9997%), which
were dried and regulated by mass flow controllers.
5
Each catalyst was pretreated in 30 cm3 min-1 Ar for 0.5 h at 200 oC to remove water
before the introduction of the reaction gases. Reaction temperatures from 200oC to 280oC
were investigated. Testing conditions were 0.1-0.5 g catalyst and multiple C2H4/O2/Ar
flowrates so as to maintain 30 cm3NTP min-1 total flowrate (gas hourly space velocity 1800
h-1) at 101 kPa.
Products were analyzed using a dual-column gas chromatograph (Shimazu GC-14).
Ethylene and EO were separated from the reactant stream using an Aligent FPAP column
and quantified using a flame ionization detector (FID) while carbon dioxide and water were
separated using an Aligent Porapak Q column and quantified using a thermal conductivity
detector (TCD). Carbon monoxide and acetaldehyde were not detected under any
conditions. Effluent was sampled every 0.5 h and it was determined that 1.5 h was
sufficient to establish steady state. All reported data were taken at 2 h after setting test
conditions. The carbon mass balance was checked periodically and all material was
accounted for to within 3% after steady-state.
Results were calculated in terms of ethylene turnover frequency (TOF), conversion
of ethylene (XE), and selectivity toward ethylene oxide (SEO), which were calculated as
indicated in Eqns. 1.1-3 using the molar flowrate of ethylene in the feed (FE,0), the molar
flowrate of ethylene in the effluent (FE), the molar loading of silver in the catalyst (yAg), the
dispersion of silver (D), and the molar concentration in the effluent of EO (cEO) and of CO2
(cCO2). The dispersion (Eqn. 1.4) was determined using Ag loading (x, wt%) and support
surface area (A, m2 g-1), the derivation of which will be explained in the following sections.
6
Oxygen chemisorption was determined for the 36% Ag/β-SiC-mod sample by
heating in flowing O2 to 170oC and holding 1 h, followed by purging with He for 0.5 h and
reduction in flowing H2 for 1 h. The sample was again purged with He for 0.5 and dosed
with oxygen.
Dy
FFTOF
Ag
EE
E
−=
0, ( 1.1 )
0,
0,
E
EE
EF
FFX
−= ( 1.2 )
221
COEO
EO
EO
cc
cS
+= ( 1.3 )
53.05583
100086.0
−
×
−=
Ax
xD ( 1.4 )
Initial screening of catalyst supports was completed using 0.5 g catalyst at
conditions of 10/5/15 cm3NTP min-1 C2H4/O2/Ar, 101 kPa (33.7 kPa C2H4, 16.8 kPa O2) and
reaction temperatures from 180oC to 280oC. Subsequent testing of catalysts supported on a
surface-modified β-SiC (β-SiC-mod) was made at the same flowrate and pressure,
temperatures of 200-280oC, and amounts loaded in the reactor of 0.6 g 6% Ag/β-SiC-mod,
0.3 g 12% Ag/β-SiC-mod, and 0.1 g 36% Ag/β-SiC-mod, so that all tests were made on
catalysts containing a total of 36 mg Ag. Finally, kinetic testing of 36% Ag/β-SiC-mod
catalyst was performed on 0.5 g catalyst by varying the partial pressure of feed gases from
17 to 67 KPa and temperature from 240oC to 280oC, while maintaining total flowrate of 30
7
cm3NTP min-1 and pressure 101 kPa, for a total of nine separate combinations of reactants
and temperature. Testing order was randomized, except for one data point that was
repeated to test for catalyst deactivation. Throughout the course of the kinetic test the
percent error for EO formation rate was approximately 6%.
Kinetic model parameters were based on the concentration of reactants (kPa) and
formation rate of products (g h-1 gAg-1). The formation rate of EO, combustion rate of
ethylene, and the sum of these reactions were each independently fitted to linear
approximations to determine rate order and activation energy. Single-site and dual-site
Langmuir-Hinshelwood models were fit to the six data points at 240oC using a nonlinear
Levenberg-Marquardt least-squares algorithm (OriginPro 8.1). Parameters were
constrained to the range 0-1000 and initialized by values of 0.1-10.0, and fitting was
accomplished by optimizing parameters such that the sum of squares ( χ2) value, defined in
Eqn. 4 as the sum of squared error between the data and theory, reached a minimum. For
each model, a variety of parameter initialization values was used to thoroughly explore the
χ2 =f(k, α, β) function and increase the likelihood of finding a global χ2 minimum. The
quality of each fit could then be considered by the final value of χ2 (Eqn. 1.5) and the
coefficient of determination (R2) (Eqn. 1.6). The sum of squared error χ2 indicates the
deviation of the model from the data, and decreases as the model and data more closely
coincide. The coefficient of determination R2 indicates the deviation of the model from the
data, scaled by the total sum of squares, or alternatively, the χ2 divided by the number of
data points and the data variance. This deviation is expressed as the difference from 1, such
that the model more closely fits the data as R2 approaches 1.
8
( )∑=
−=n
i
i
theory
i
data
i xyy1
22 )(χ ( 1.5 )
( )data
n
i
n
i
data
i
data
i
n
i
i
theory
i
data
i
Ny
ny
xyy
R,2
2
1
2
1
1
2
2 11
)(1
σ
χ−=
−
−
−=
∑ ∑
∑
= =
= ( 1.6 )
Under the parameter restrictions already mentioned, all nonlinear models which
converged presented R2 values (88-92%) and χ2 values (76-113) such that, mathematically,
all models appear equally valid for the conditions tested.
1.3 Results
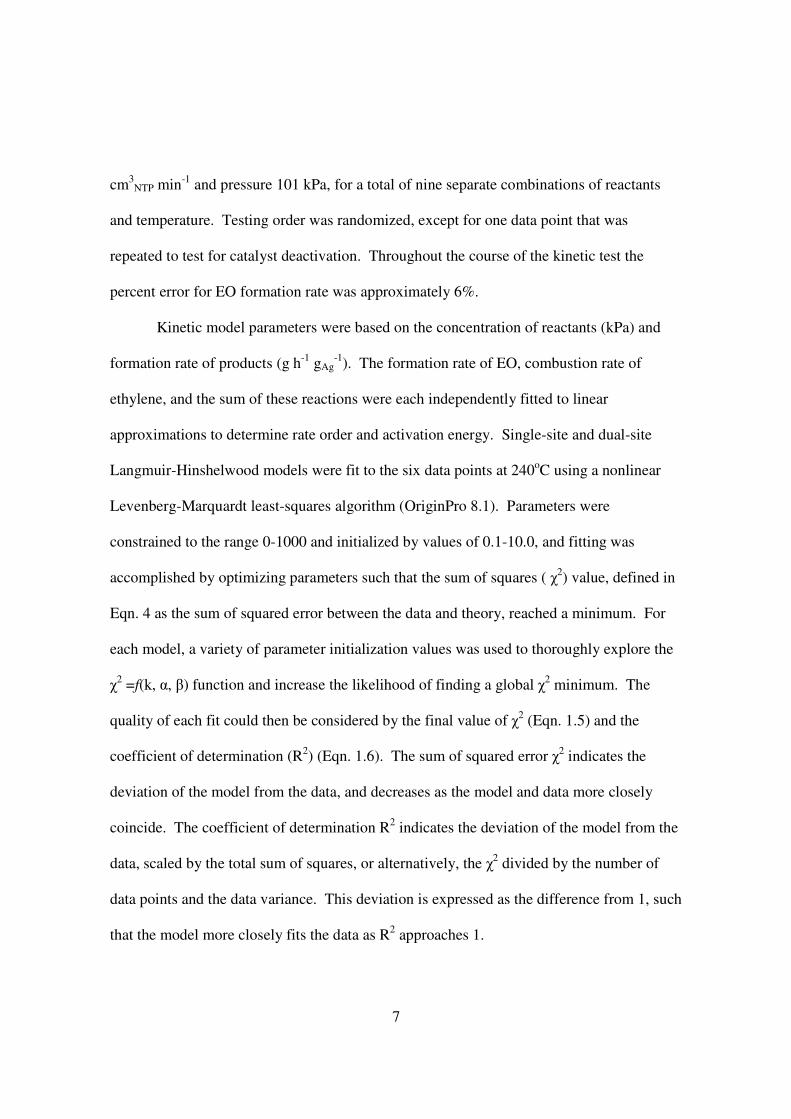
Ag dispersion was estimated by determining the surface density of Ag on the
support and calibrating this with the surface density and dispersion of similar supported Ag
catalysts. Ag atoms were assumed to form spheres of average radius r on the support, such
that the average center-to-center distance between adjacent spheres was R (Fig. 1.1). Using
this assumption, Eqn. 1.7 can be determined, which will be derived in detail in the next
section.
2
3
)(34
Lr
rf packspheresurf
+= ρρ ( 1.7 )
9
Figure 1.1. Ag spheres of radius r, spaced 2R apart on support surface.
0 50 100 150 200 250 300 350
0
200
400
600
800
1000
1200
1400
1600
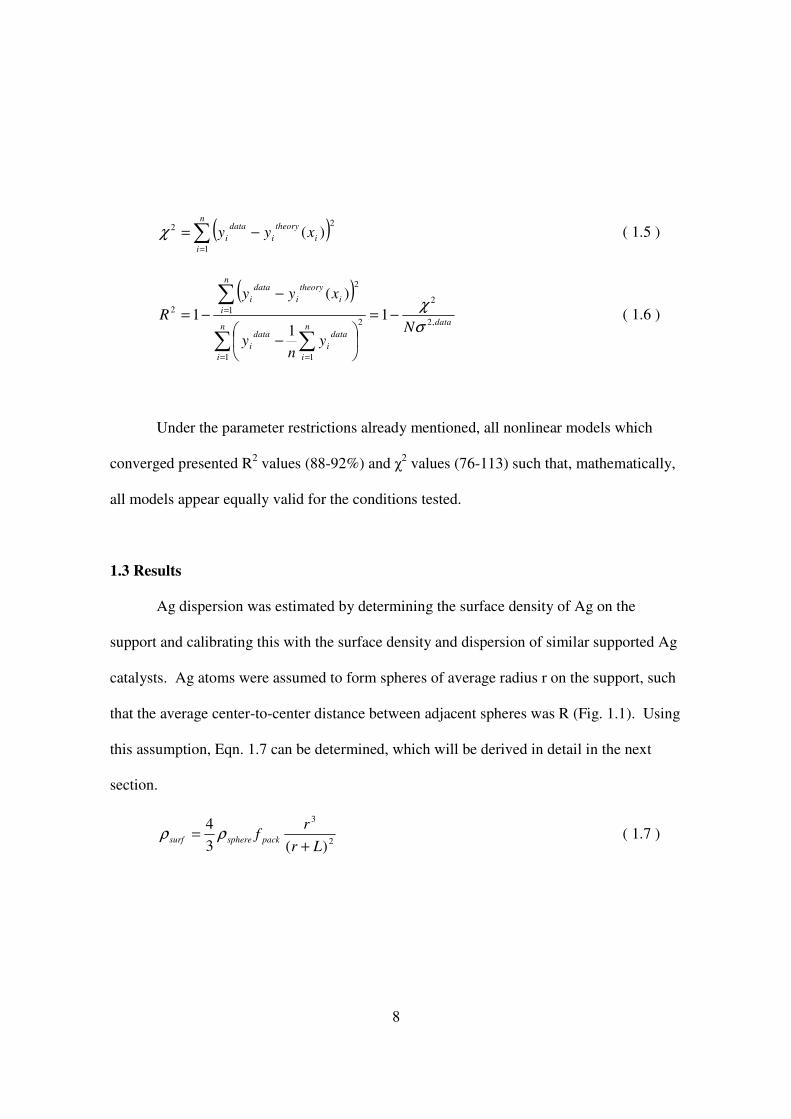
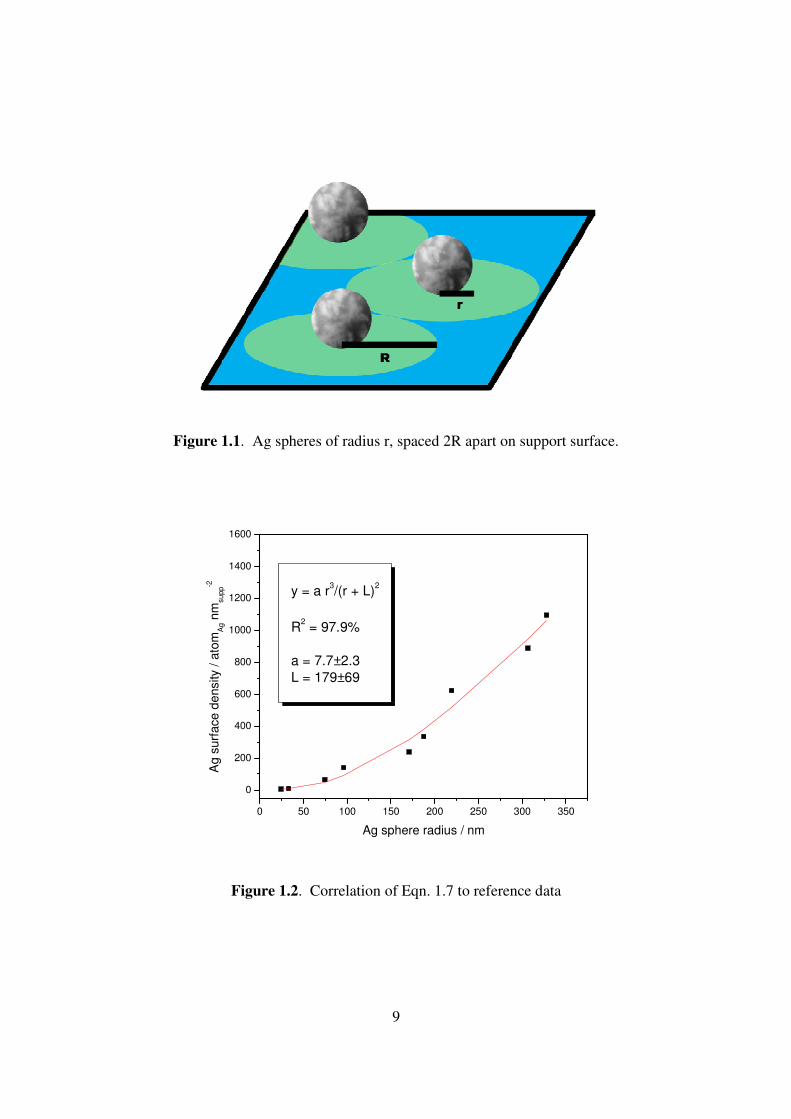
y = a r3/(r + L)
2
R2 = 97.9%
a = 7.7±2.3
L = 179±69
Ag s
urf
ace
de
nsity / a
tom
Ag n
msupp
-2
Ag sphere radius / nm
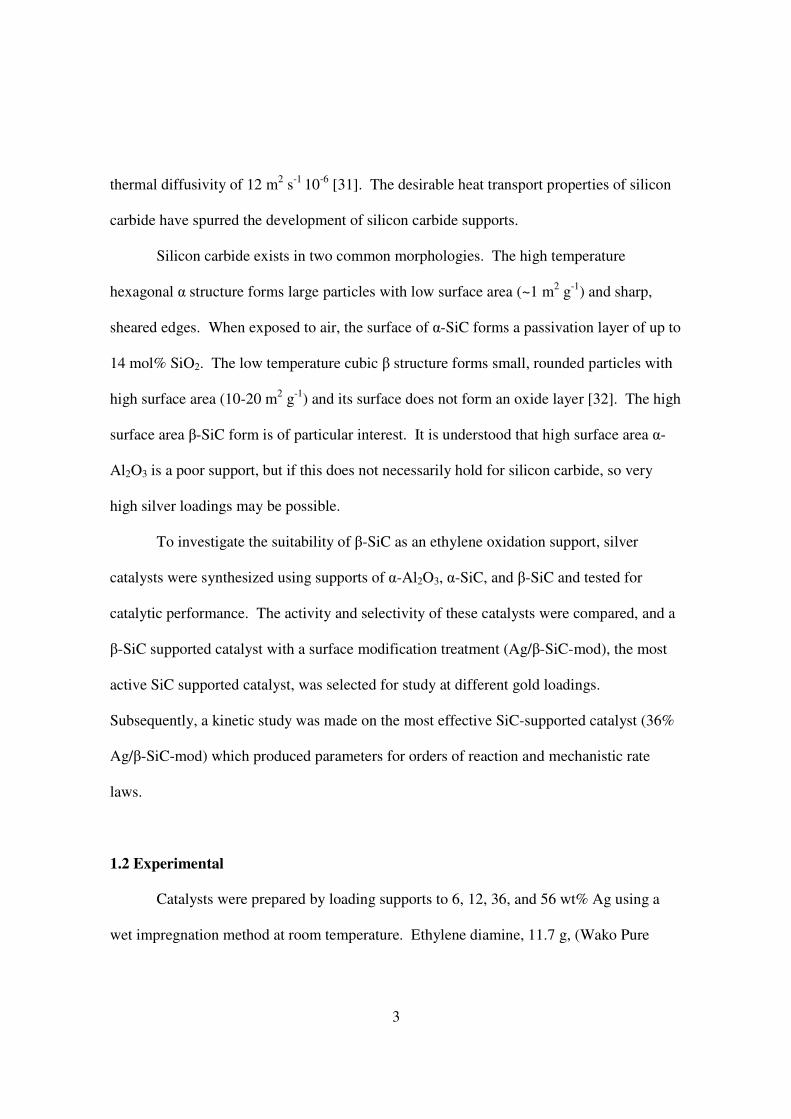
Figure 1.2. Correlation of Eqn. 1.7 to reference data
10
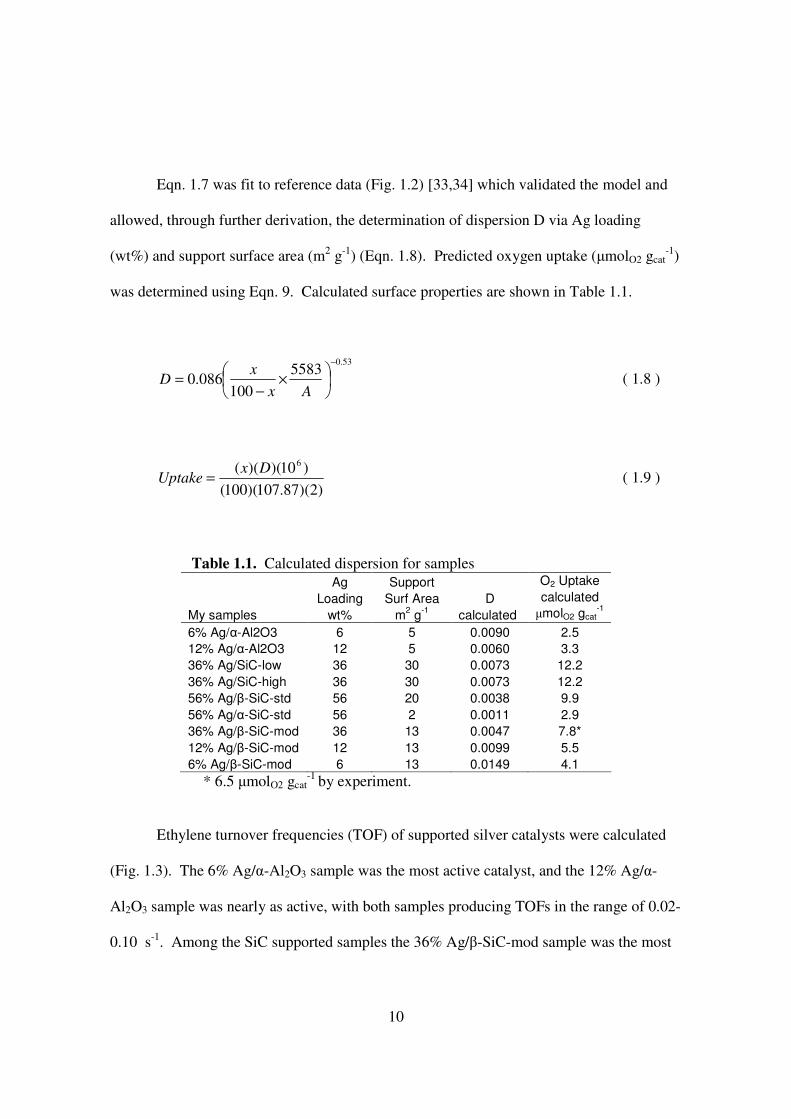
Eqn. 1.7 was fit to reference data (Fig. 1.2) [33,34] which validated the model and
allowed, through further derivation, the determination of dispersion D via Ag loading
(wt%) and support surface area (m2 g-1) (Eqn. 1.8). Predicted oxygen uptake (µmolO2 gcat-1)
was determined using Eqn. 9. Calculated surface properties are shown in Table 1.1.
53.05583
100086.0
−
×
−=
Ax
xD ( 1.8 )
)2)(87.107)(100()10)()(( 6Dx
Uptake = ( 1.9 )
Table 1.1. Calculated dispersion for samples Ag Support O2 Uptake
Loading Surf Area D calculated
My samples wt% m2 g
-1 calculated µmolO2 gcat
-1
6% Ag/α-Al2O3 6 5 0.0090 2.5
12% Ag/α-Al2O3 12 5 0.0060 3.3
36% Ag/SiC-low 36 30 0.0073 12.2
36% Ag/SiC-high 36 30 0.0073 12.2
56% Ag/β-SiC-std 56 20 0.0038 9.9
56% Ag/α-SiC-std 56 2 0.0011 2.9
36% Ag/β-SiC-mod 36 13 0.0047 7.8*
12% Ag/β-SiC-mod 12 13 0.0099 5.5
6% Ag/β-SiC-mod 6 13 0.0149 4.1
* 6.5 µmolO2 gcat-1 by experiment.
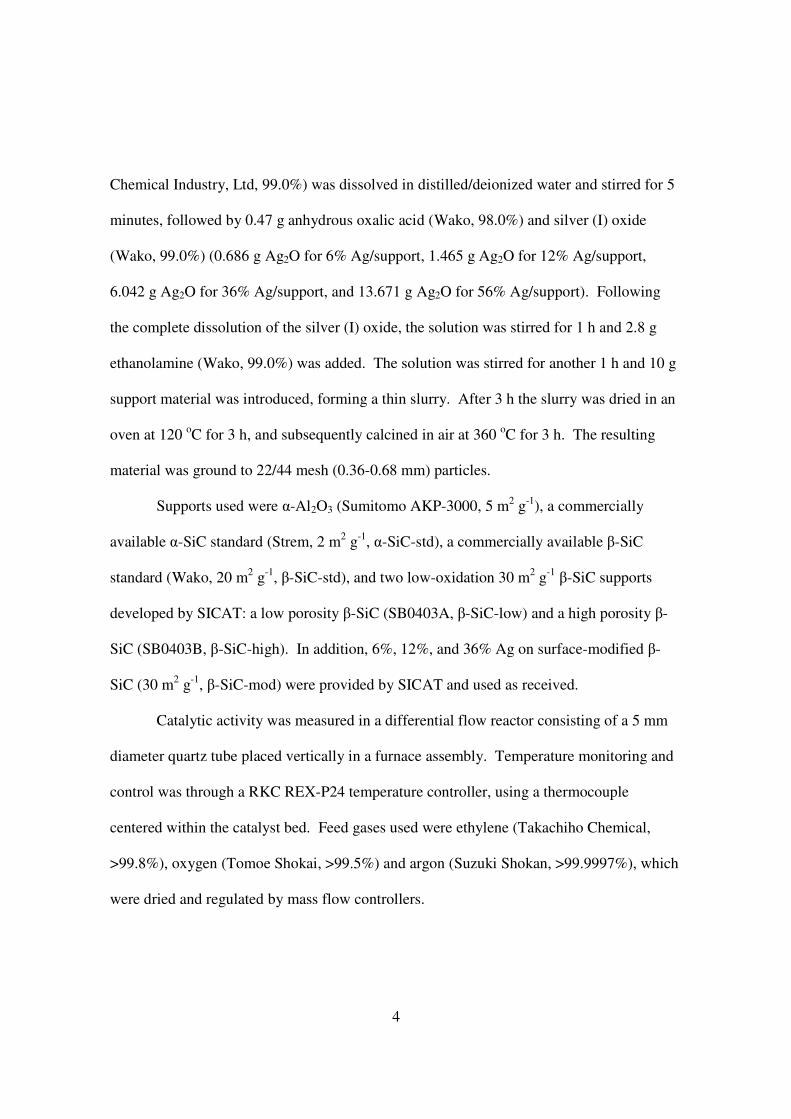
Ethylene turnover frequencies (TOF) of supported silver catalysts were calculated
(Fig. 1.3). The 6% Ag/α-Al2O3 sample was the most active catalyst, and the 12% Ag/α-
Al2O3 sample was nearly as active, with both samples producing TOFs in the range of 0.02-
0.10 s-1. Among the SiC supported samples the 36% Ag/β-SiC-mod sample was the most
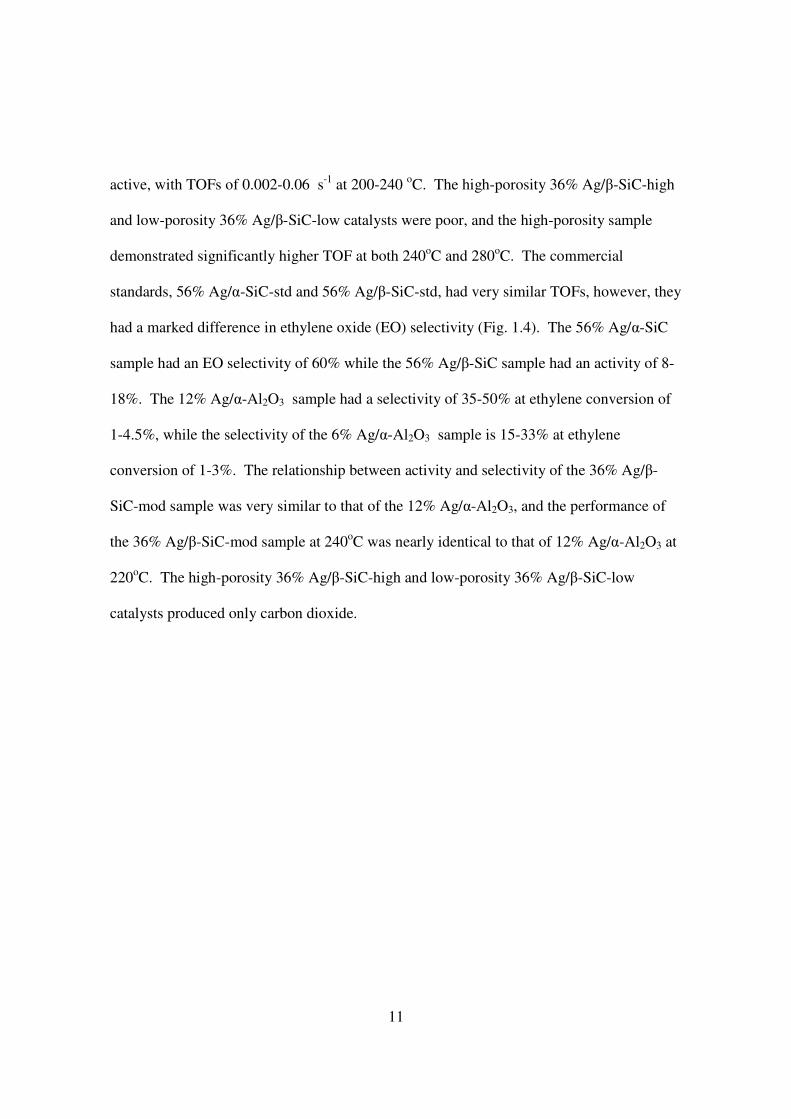
11
active, with TOFs of 0.002-0.06 s-1 at 200-240 oC. The high-porosity 36% Ag/β-SiC-high
and low-porosity 36% Ag/β-SiC-low catalysts were poor, and the high-porosity sample
demonstrated significantly higher TOF at both 240oC and 280oC. The commercial
standards, 56% Ag/α-SiC-std and 56% Ag/β-SiC-std, had very similar TOFs, however, they
had a marked difference in ethylene oxide (EO) selectivity (Fig. 1.4). The 56% Ag/α-SiC
sample had an EO selectivity of 60% while the 56% Ag/β-SiC sample had an activity of 8-
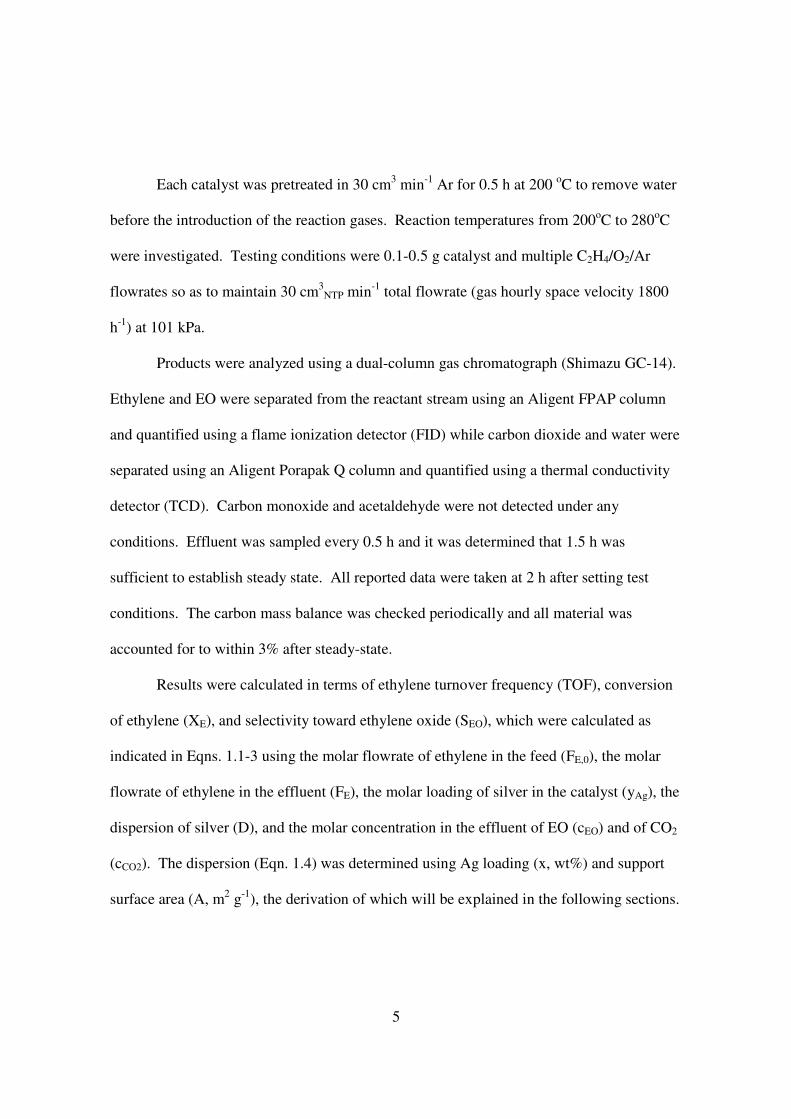
18%. The 12% Ag/α-Al2O3 sample had a selectivity of 35-50% at ethylene conversion of
1-4.5%, while the selectivity of the 6% Ag/α-Al2O3 sample is 15-33% at ethylene
conversion of 1-3%. The relationship between activity and selectivity of the 36% Ag/β-
SiC-mod sample was very similar to that of the 12% Ag/α-Al2O3, and the performance of
the 36% Ag/β-SiC-mod sample at 240oC was nearly identical to that of 12% Ag/α-Al2O3 at
220oC. The high-porosity 36% Ag/β-SiC-high and low-porosity 36% Ag/β-SiC-low
catalysts produced only carbon dioxide.
12
1.8 1.9 2.0 2.1 2.2
1
10
100
0.1
56% Ag/α-SiC-std
56% Ag/β-SiC-std
36% Ag/β-SiC-mod
36% Ag/β-SiC-hi 36% Ag/β-SiC-low
6% Ag/α-Al2O
3
12% Ag/α-Al2O
3
280 240 220 180200
Temperature / oC
Eth
yle
ne
TO
F /
10
-3 s
-1
Inverse Temperature / 10-3 K
-1
Figure 1.3. Ethylene turnover frequencies (TOF) of samples. Conditions are 10/5/15
cm3NTP min-1 C2H4/O2/Ar, 101 kPa, 0.5 g catalyst. Samples are 6% Ag/α-Al2O3 (○),12%
Ag/α-Al2O3 (●), 56% Ag/α-SiC-std (Strem standard) (▲), 56% Ag/β-SiC-std (Wako standard) (▼), 36% Ag/β-SiC-high (high porosity SICAT) (□), 36% Ag/β-SiC-low (low
porosity SICAT) (■), 36% Ag/β-SiC-mod (surface modified SICAT) (♦).
13
0 1 2 3 4 50
10
20
30
40
50
60
70
6% Ag/α-Al2O
3
12% Ag/α-Al2O
3
36% Ag/β-SiC-mod
56% Ag/β-SiC-std
56% Ag/α-SiC-std
240oC
220oC
180oC
200oC
240oC
240oC
280oC
200oC
180oC
280oC
200oC
220oC
E
O S
ele
ctivity /
%
C2H
4 Conversion / %
Figure 1.4. Ethylene oxide (EO) selectivity with respect to ethylene conversion.
Conditions are 10/5/15 cm3NTP min-1 C2H4/O2/Ar, 101 kPa, 0.5 g catalyst. Samples are 6%
Ag/α-Al2O3 (○),12% Ag/α-Al2O3 (●), 56% Ag/α-SiC-std (Strem standard) (▲), 56% Ag/β-SiC-std (Wako standard) (▼), 36% Ag/β-SiC-mod (surface modified SICAT) (♦); 36% Ag/β-SiC-high (high porosity SICAT) and 36% Ag/β-SiC-low (low porosity SICAT)
produce no EO and are not shown.
The surface modified β-SiC-mod support, which performed most similarly to α-
Al2O3, was further tested at 6% and 12% Ag content, and a comparison made using
amounts of catalyst containing 36 mg Ag (Fig. 5). All samples have TOFs on the order of
0.001 to 0.15 s-1. The 12% Ag/β-SiC-mod sample has activity slightly above the 6% Ag/β-
SiC-mod at 200-280oC, while the activity of the 36% Ag/β-SiC-mod sample is less than the
others at 200oC but surpasses them at higher temperature. The 6% Ag sample produced no
EO (Fig. 1.6). The 12% Ag sample had the highest EO selectivity of 37% at 200oC, but
this selectivity decreases sharply with temperature and ethylene conversion. The 36% Ag
14
sample produced no EO at 200oC but had a 30% selectivity at 240 oC, which was reduced
to 18% at 280 oC.
1.8 1.9 2.0 2.1 2.2
1
10
100
0.1
6% Ag/β-SiC-mod
12% Ag/β-SiC-mod
36% Ag/β-SiC-mod
280 240 220 180200
Temperature / oC
Eth
yle
ne
TO
F /
10
-3 s
-1
Inverse Temperature / 10-3 K
-1
Figure 1.5. Ethylene turnover frequencies (TOF) of Ag/β-SiC-mod (surface modified SICAT) samples. Conditions are 10/5/15 cm3
NTP min-1 C2H4/O2/Ar, 101 kPa, and an amount of catalyst containing 36 mg Ag. Samples are 6% Ag/β-SiC-mod (▲), 12%
Ag/β-SiC-mod (▲), and 36% Ag/β-SiC-mod (●).
15
0.0 0.5 1.0 1.5 2.0 2.5 3.0 3.5
0
5
10
15
20
25
30
35
40
6% Ag/β-SiC-mod
0.6 g (36 mg Ag)
36% Ag/β-SiC-mod
0.1 g (36 mg Ag)
12% Ag/β-SiC-mod
0.3 g (36 mg Ag)
b200
oC
240oC
240oC
280oC
240oC
200oC
280oC
E
O S
ele
ctivity / %
C2H
4 Conversion / %
Figure 1.6. Ethylene oxide (EO) selectivity with respect to ethylene conversion. Conditions are 10/5/15 cm3
NTP min-1 C2H4/O2/Ar, 101 kPa, and an amount of catalyst containing 36 mg Ag. Samples are 6% Ag/β-SiC-mod (▲), 12% Ag/β-SiC-mod (▲),
and 36% Ag/β-SiC-mod (●).
Table 1.2. 36% Ag/β-SiC-mod kinetic study conditions. All runs using 0.5 g catalyst, 30 cm3
NTP min-1 total flow rate (balance Ar), 101 kPa.
Run C2H4 O2 T Conv Sel Yield
g h-1
gAg-1
kPa kPa
oC % % EO CO2
1 33.33 16.67 240 6.13 30.4 122 279 2 33.33 33.33 240 7.36 34.5 167 316 3 33.33 66.67 240 7.94 37.7 196 324 4 33.33 16.67 240 6.37 29.5 123 294 5 66.67 16.67 240 3.48 33.6 154 303 6 16.67 16.67 240 13.05 28.1 120 307 7 33.33 16.67 240 5.57 31.2 114 251 8 33.33 16.67 260 8.29 14.8 80.7 463 9 33.33 16.67 280 8.53 0.6 3.43 555
16
To help investigate the nature of ethylene oxidation on β-SiC, a simple kinetic study
of the 36% Ag/β-SiC-mod catalyst was performed (Table 1.2). The partial pressure of
ethylene and oxygen were each varied from 17 to 67 kPa, and temperature was varied from
240oC to 280oC. The overall reactions considered were
C2H4 + ½ O2 → C2H4O ( 1.10 )
C2H4 + 3 O2 → 2 CO2 + 2 H2O ( 1.11 )
The reaction rates considered were the rate of EO formation rEO (Eqn. 1.10), the rate
of ethylene combustion rC (Eqn. 1.11), and the sum of the two reactions (total ethylene
consumption) -rE) . All three reactions were approximated by a power rate law (Eqn. 1.12)
which defines the rate as a function of activation energy EA and some power of the inlet
concentration of each reactant (all EA and α, β different). The power rate law could be
presented in a linear form (Eqn. 13) such that a linear least squares fit can be made.
βα )()( 242 OHCekr RT
E
o
A
=
−
( 1.12 )
[ ] [ ])(ln)(ln1
)ln()ln( 242 OHCTR
Ekr A
o βα ++
−+= ( 1.13 )
The reaction order with respect to ethylene (α) was 0.18 for ethylene oxidation,
while combustion was zero order under these conditions (Table 1.3). The reaction order
with respect to oxygen (β) was 0.34 for ethylene oxidation and 0.11 for combustion.
17
Overall ethylene conversion order was 0.19 with respect to oxygen, with a weak ethylene
contribution. The apparent activation energy of total combustion was 47 kJ mol-1 but the
apparent activation energy of EO was negative, as total oxidation was preferred with
increasing temperature. The activation energy of 25 kJ mol-1 for ethylene conversion is
consistent with similar work [35].
A series of mechanistic rate laws were fit to the same data using a three-dimensional
surface fitting algorithm suitable for nonlinear equations. Five rate law models, including a
power rate law, led to convergence (Table 4). The rate models in Table 1.3 will be
discussed in detail in the following section.
18
Table 1.3. 36% Ag/β-SiC-SM calculated kinetic parameters for power rate law, fit to rate of EO production (rEO), rate of ethylene combustion (rC), and total rate of ethylene conversion (-rE). Activation energy in kJ mol-1, error given as 95% confidence interval. Linear regression using Levenberg–Marquardt algorithm (Polymath 5.1).
rEO rC -rE Parameter
Value % R2 Value % R
2 Value % R
2
α 0.18±0.08 91 0.00±0.03 31 0.05±0.05 71
β 0.34±0.06 98 0.11±0.04 94 0.19±0.05 97
EA -204±100 90 47.1±13.5 96 25.4±12.0 90
Table 1.4. Three-parameter rate laws determined using a nonlinear 3D surface fitting algorithm (OriginPro 8.1), a Pearson’s chi squared test, b Coefficient of determination, c gEO h-1 gAg
-1 kPa-(α+β), d gEO h-1 gAg-1 kPa-2, e kPa-1, f kPa-2, g gEO h-1 gAg
-1 kPa-
1.5, h kPa-0.5, i kPa-1.5. Error given as statistical standard error. Regression parameters Quality of fit
# Model k α β χ2 a % R2 b
1 βα )()( 242 OHCkrEO = 27.7±8.1
c 0.197±0.068 0.305±0.039 76 92
2
+
+=
)(1
)(
)(1
)(
2
2
42
42
O
O
HC
HCkrEO
βα 3.1±1.6
d 0.140±0.083
e 0.077±0.018
e 109 89
3 ))(()(1
))((
24242
242
OHCHC
OHCkrEO
βα ++= 1.3±0.7
d 0.045±0.037
e 0.006±0.003
f 109 89
4
+
+=
2/12
2/12
42
42
)(1
)(
)(1
)(
O
O
HC
HCkrEO
βα 8.3±4.3
g 0.141±0.084
e 0.125±0.050
h 113 88
5 2/124242
2/1242
))(()(1
))((
OHCHC
OHCkrEO
βα ++= 5.5±2.7
g 0.083±0.057
e 0.014±0.008
i 113 88
19
1.4 Discussion
The mechanical and heat transport properties of silicon carbide make this material a
desirable support for supported silver ethylene oxidation catalysts when compared to α-
Al2O3. Although high surface area α-Al2O3 is a poor support for ethylene oxidation, there
is potential that the high surface area β-SiC phase may perform well, allowing higher silver
dispersion and higher activity without loss of ethylene oxide (EO) selectivity. As will be
discussed, while most Ag/SiC catalysts tested were poor, a catalyst of silver on surface-
modified β-SiC (36% Ag/β-SiC-mod) exhibited performance similar to an α-Al2O3
supported catalyst. This Ag/β-SiC-mod catalyst was further studied at different silver
loadings, and kinetic testing was used to determine reaction orders and rate laws.
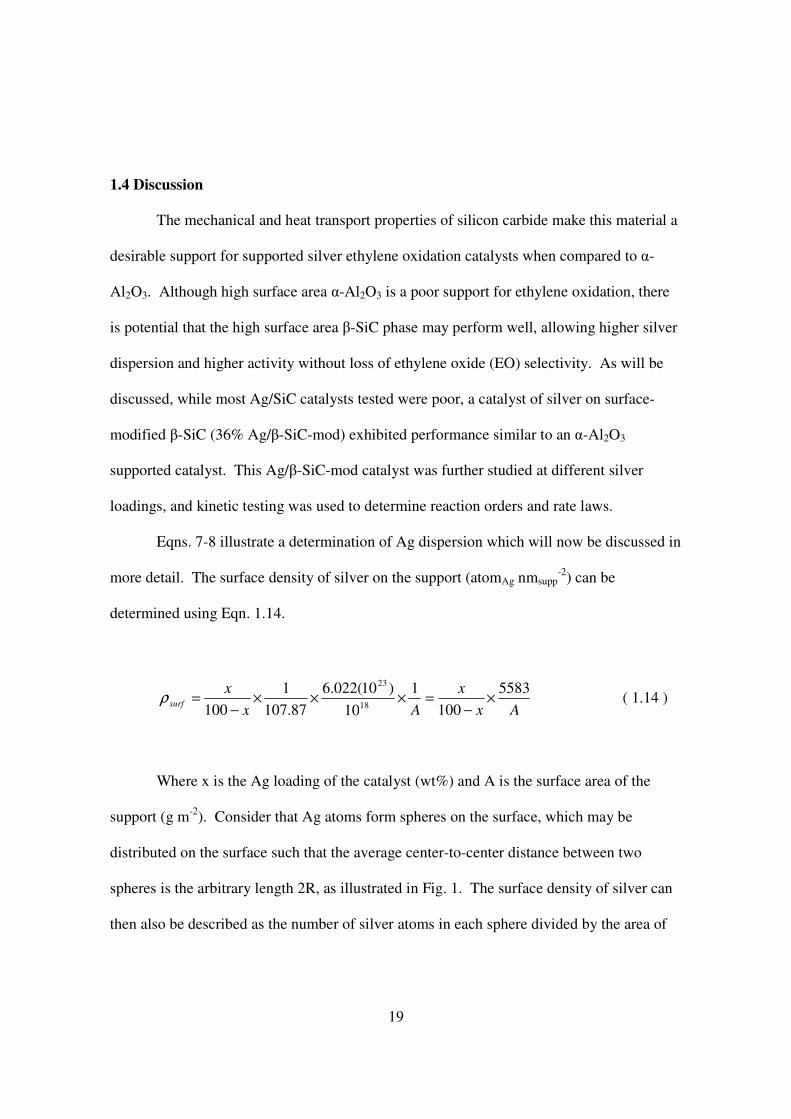
Eqns. 7-8 illustrate a determination of Ag dispersion which will now be discussed in
more detail. The surface density of silver on the support (atomAg nmsupp-2) can be
determined using Eqn. 1.14.
Ax
x
Ax
xsurf
5583100
1
10
)10(022.687.107
1100 18
23
×−
=×××−
=ρ ( 1.14 )
Where x is the Ag loading of the catalyst (wt%) and A is the surface area of the
support (g m-2). Consider that Ag atoms form spheres on the surface, which may be
distributed on the surface such that the average center-to-center distance between two
spheres is the arbitrary length 2R, as illustrated in Fig. 1. The surface density of silver can
then also be described as the number of silver atoms in each sphere divided by the area of
20
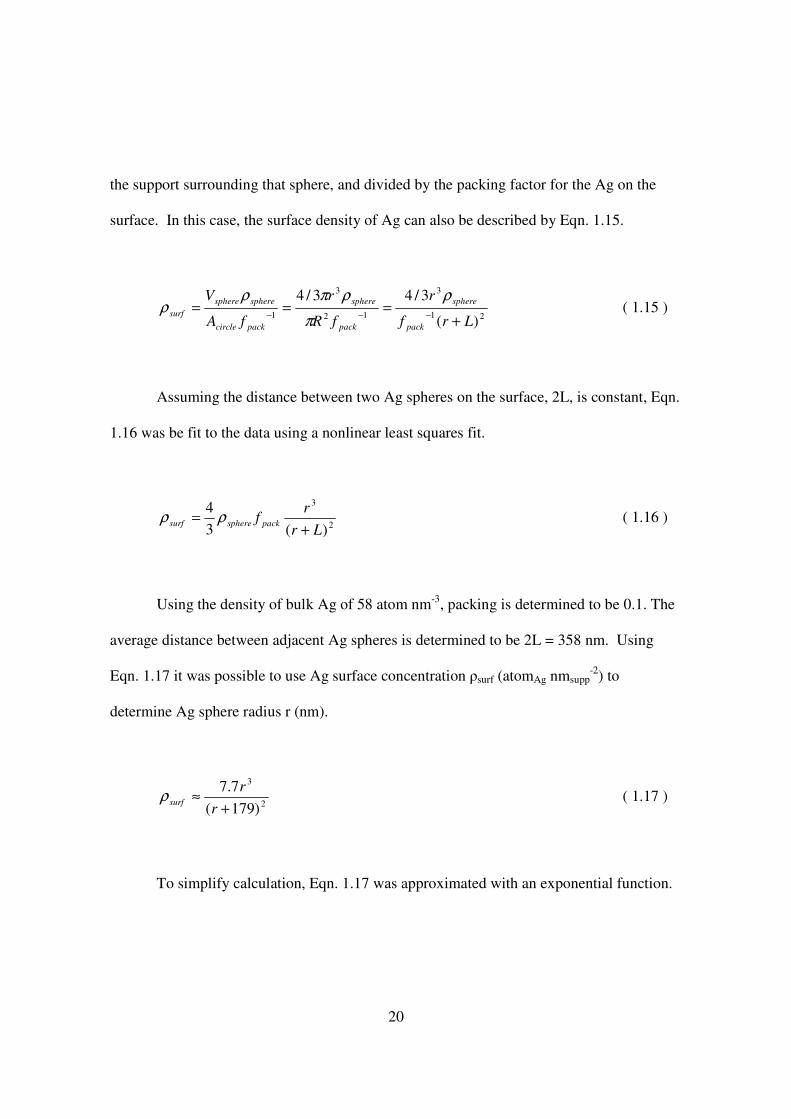
the support surrounding that sphere, and divided by the packing factor for the Ag on the
surface. In this case, the surface density of Ag can also be described by Eqn. 1.15.
21
3
12
3
1 )(
3/43/4
Lrf
r
fR
r
fA
V
pack
sphere
pack
sphere
packcircle
spheresphere
surf+
===−−−
ρ
π
ρπρρ ( 1.15 )
Assuming the distance between two Ag spheres on the surface, 2L, is constant, Eqn.
1.16 was be fit to the data using a nonlinear least squares fit.
2
3
)(34
Lr
rf packspheresurf
+= ρρ ( 1.16 )
Using the density of bulk Ag of 58 atom nm-3, packing is determined to be 0.1. The
average distance between adjacent Ag spheres is determined to be 2L = 358 nm. Using
Eqn. 1.17 it was possible to use Ag surface concentration ρsurf (atomAg nmsupp-2) to
determine Ag sphere radius r (nm).
2
3
)179(
7.7
+≈
r
rsurfρ ( 1.17 )
To simplify calculation, Eqn. 1.17 was approximated with an exponential function.
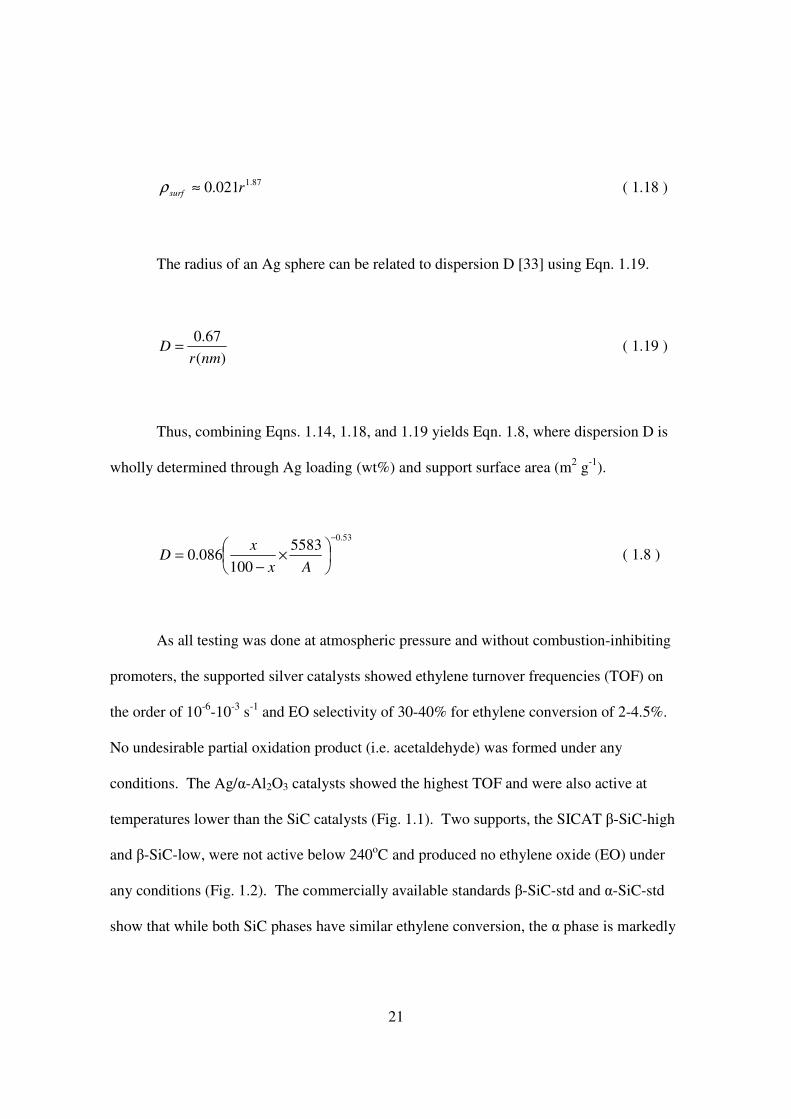
21
87.1021.0 rsurf ≈ρ ( 1.18 )
The radius of an Ag sphere can be related to dispersion D [33] using Eqn. 1.19.
)(67.0nmr
D = ( 1.19 )
Thus, combining Eqns. 1.14, 1.18, and 1.19 yields Eqn. 1.8, where dispersion D is
wholly determined through Ag loading (wt%) and support surface area (m2 g-1).
53.05583
100086.0
−
×
−=
Ax
xD ( 1.8 )
As all testing was done at atmospheric pressure and without combustion-inhibiting
promoters, the supported silver catalysts showed ethylene turnover frequencies (TOF) on
the order of 10-6-10-3 s-1 and EO selectivity of 30-40% for ethylene conversion of 2-4.5%.
No undesirable partial oxidation product (i.e. acetaldehyde) was formed under any
conditions. The Ag/α-Al2O3 catalysts showed the highest TOF and were also active at
temperatures lower than the SiC catalysts (Fig. 1.1). Two supports, the SICAT β-SiC-high
and β-SiC-low, were not active below 240oC and produced no ethylene oxide (EO) under
any conditions (Fig. 1.2). The commercially available standards β-SiC-std and α-SiC-std
show that while both SiC phases have similar ethylene conversion, the α phase is markedly
22
more selective toward EO. The surface-modified 36% Ag/β-SiC-mod catalyst has an
ethylene conversion and EO selectivity most similar to 12% Ag/α-Al2O3, although the TOF
of α-Al2O3 remained much higher. Reducing the silver loading of the Ag/β-SiC-mod
catalyst to 12% increased the ethylene TOF (Fig. 3) but further reducing silver loading to
6% did not increase TOF further. Reducing silver loading to 6% also deactivated the
catalyst for EO production (Fig. 4). Additionally, the 12% Ag/β-SiC-mod sample was less
selective to EO than the 36% sample at the same temperature.
For the α-Al2O3 and β-SiC-mod samples decreasing gold loading increases TOF and
decreases EO selectivity. For the commercial standards α-SiC-std and β-SiC-std the low
surface area α-SiC-std support had the highest EO selectivity of all samples tested; this
support also had the lowest surface area (2 m2 g-1) and highest silver loading per area.
The α-SiC-std, β-SiC-std, and β-SiC-mod supports had a TOF temperature
dependence indicating a reduction of activation energy with increasing temperature in the
range of 200-280oC. This decrease in apparent activation energy was consistent with a
Langmuir-Hinshelwood model, where the overall rate, and subsequently the apparent
activation energy, is a combination of the kinetics of a rate-limiting surface reaction and the
equilibrium between adsorbed species and the gas phase. At lower temperature, the overall
rate was dominated by the surface reaction while at higher temperature the overall rate was
primarily influenced by the adsorption of species to the catalyst. Conversely, the Ag/α-
Al2O3 catalysts, which were tested at 180-220oC, had a single activation energy in this
range.
23
The highest EO production of all SiC catalysts were 36% Ag/β-SiC-mod and 12%
Ag/β-SiC-mod. Although β-SiC-mod performed poorly compared to the alumina catalysts
on a per-Ag basis, the performance of β-SiC-mod over all the other SiC catalysts was
notable and prompted further investigation with a kinetic study of 36% Ag/β-SiC-mod
(Table 1.1). The overall reactions considered were indicated previously as Eqns. 1.10-11.
A linear regression (Table 3) yielded rate constants given in Eqns. 1.5-7, with
activation energies of -204 kJ mol-1 for ethylene oxidation, 47.1 kJ mol-1 for ethylene
combustion, and 25.4 kJ mol-1 for the overall rate of ethylene consumption.
34.02
18.042 )()( OHCkr EOEO = ( 1.20 )
11.02 )(Okr CC = ( 1.21 )
19.02 )(Okrrr ECEOE =+= ( 1.22 )
The combustion of ethylene and the conversion of ethylene were both zero order
with respect to ethylene under these conditions. The formation of EO had a reaction order
of 0.18 with respect to ethylene and 0.34 with respect to oxygen. A review of similar
studies [36] indicated no consensus on rate orders; for both epoxidation and combustion the
reaction order varied from 0-0.7 for ethylene and 0-1.5 for oxygen. This is consistent with
a Langmuir-Hinshelwood model, as the mechanistic rate law is a rational function and the
power rate law is an approximation as given in Eqn. 1.23.
24
mx
xx n
+≈
1 ( 1.23 )
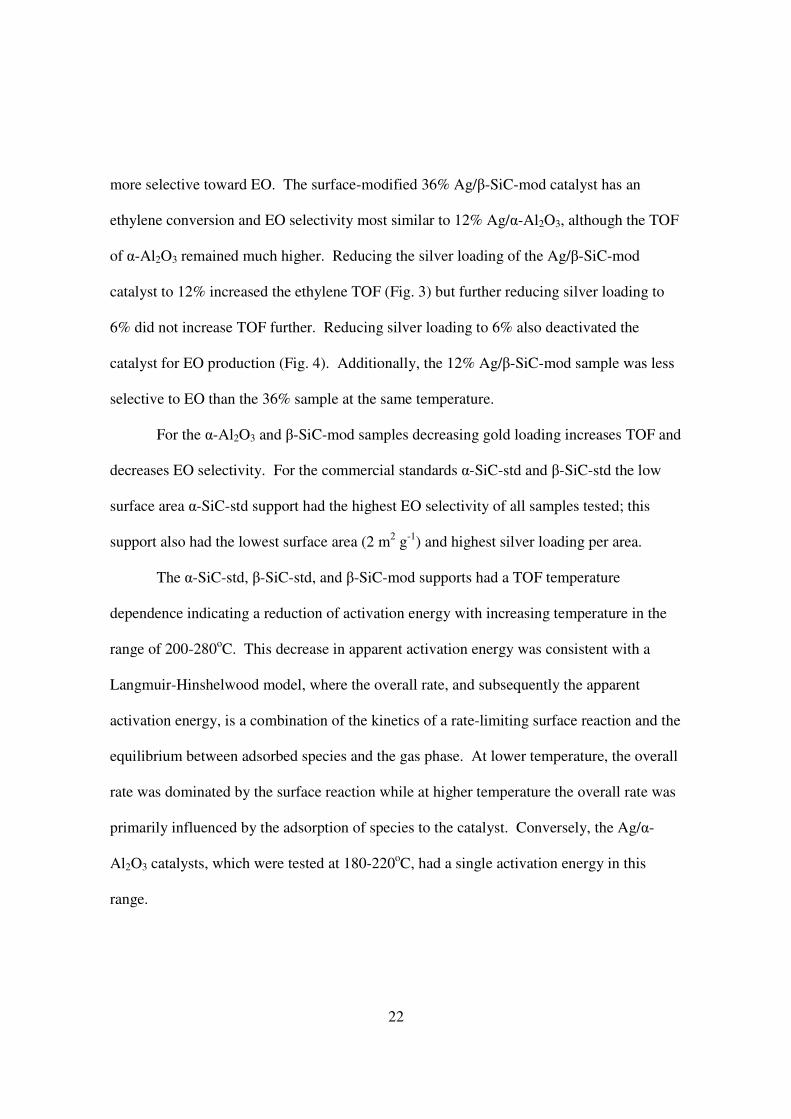
Applying Eqn. 1.23 to the rate law for EO formation yields Eqn. 1.24.
+
+=
)(1
)(
)(1
)(
2
2
42
42
O
O
HC
HCkrEO
βα ( 1.24 )
Eqn. 1.24 corresponds with a reaction sequence where the catalyst consists of two
unique types of active sites, one which adsorbs only ethylene and one which adsorbs only
oxygen. In this sequence, ethylene and oxygen each molecularly adsorb onto their active
site, and the overall rate is commanded by the surface reaction of these intermediates. This
dual-site mechanism, which assumes molecular adsorption of oxygen, is mathematically
plausible but not necessarily physically plausible.
Many gases, including ethylene, do not adsorb onto clean silver, but will do so after
silver has adsorbed oxygen [37], indicating that the EO reaction proceeds by oxygen
adsorbing onto Ag, which activates adjacent Ag sites for ethylene adsorption. The
adsorbed ethylene subsequently forms an oxametallacycle (-O-CH2-CH2-) on Ag [38,39]
which is most likely anchored to a single Ag atom [9].
A likely mechanism [40] involves the dissociative adsorption of oxygen on a pair of
vacant Ag sites (*), followed by ethylene adsorption and formation of an oxametallacycle,
and then desorption of EO. A simple mechanism is given in Eqns 1.25-28.
25
O2 + 2 * ↔ 2 O* ( 1.25 )
C2H4 + * ↔ C2H4* ( 1.26 )
C2H4* + O* ↔ C2H4O* + * ( 1.27 )
C2H4O* ↔ C2H4O + * ( 1.28 )
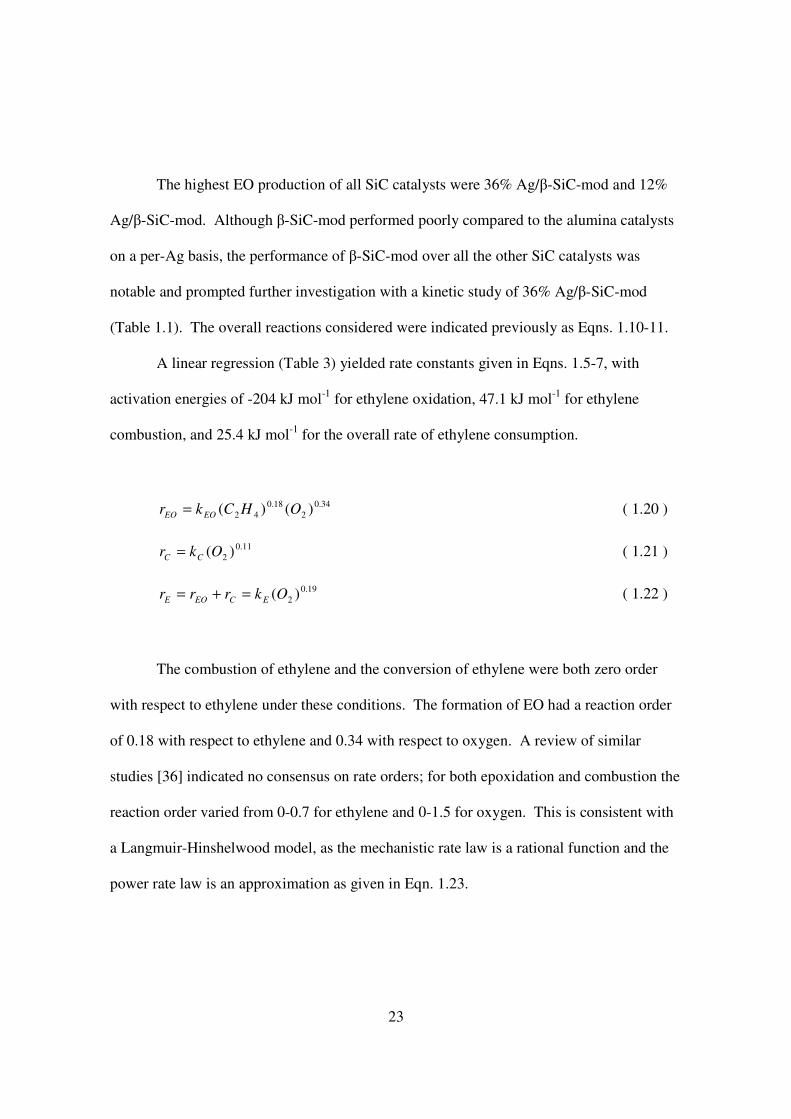
A rate law can be developed from Eqns. 1.25-28 if it can be assumed that Eqn. 28 is
a rate-determining step and Eqns. 1.10-12 are equilibrium-limited steps. A derivation
presented in the appendix results in Eqn. 1.29.
2/12/14242
2/142
)())(()(1
))((
OOHCHC
OHCkrEO
γβα +++= ( 1.29 )
Eqn. 1.29 is a Langmuir-Hinshelwood rate law, where the terms in the numerator
are the contribution of reactants in forming the reaction intermediate in the rate limiting
step, and the terms in the denominator are the contribution of adsorbed species on the
surface. The rate k and equilibrium constants α, β, and γ each have unique Arrhenius
temperature dependencies, due to the activation energy of the rate determining step and the
enthalpy of adsorption of the adsorbed species.
A nonlinear surface fitting algorithm was used to fit the kinetic data at 240oC to the
power rate law (Eqn. 1.8) and Eqns. 1.24 and 1.29, as well as alternate versions of these
latter equations so that both dissociative and molecular oxygen adsorption are considered
(Table 4). A model based on Eqn. 1.29 converged only when γ=0, yielding models 3 and 5.
26
All models have essentially equal qualities of fit. The equations for the single site and two
site model, and the dissociated and non-dissociated oxygen, were similar enough that are
not mathematically distinguishable for this amount of data.
The power rate law model had the highest R2 at 92% and lowest χ2 at 76. The
increased R2 and decreased χ2 are both expected, as the power rate law was the only model
presented here that can be expressed as a linear function, with each dependent variable
paired with its associated parameter. The four Langmuir-Hinshelwood rate laws, which are
rational equations that cannot be linearized in such a way to isolate variable-parameter
terms, all have R2 values of 88-89% and χ2 values of 109-113, indicating all four models
have mathematically indistinguishable fit quality. Model 4, derived from Eqn. 1.19, is the
model corresponding to the most likely mechanism, but the additional models which do not
correspond to physically reasonable mechanisms are nonetheless good predictors of the
data. The difference between molecular and dissociative adsorption of species may be
especially difficult to identify through a reaction model, as the approximation noted in Eqn.
1.23 can be written in the form of Eqn. 1.30.
2/1
2/1)2/1(
1 mx
xx
n
+≈ ( 1.30 )
1.5 Conclusions
Catalysts consisting of Ag on surface-modified β-SiC were studied alongside
several α-SiC, β-SiC, and α-Al2O3 supports. A catalyst consisting of 36% Ag on β-SiC-
mod outperformed all other SiC catalysts. A kinetic study was able to determine rate laws
27
for the formation of EO using power-law and Langmuir-Hinshelwood forms, finding the
formation of ethylene 0.2 order with respect to ethylene and 0.3 order with respect to
oxygen.
1.6 Appendix
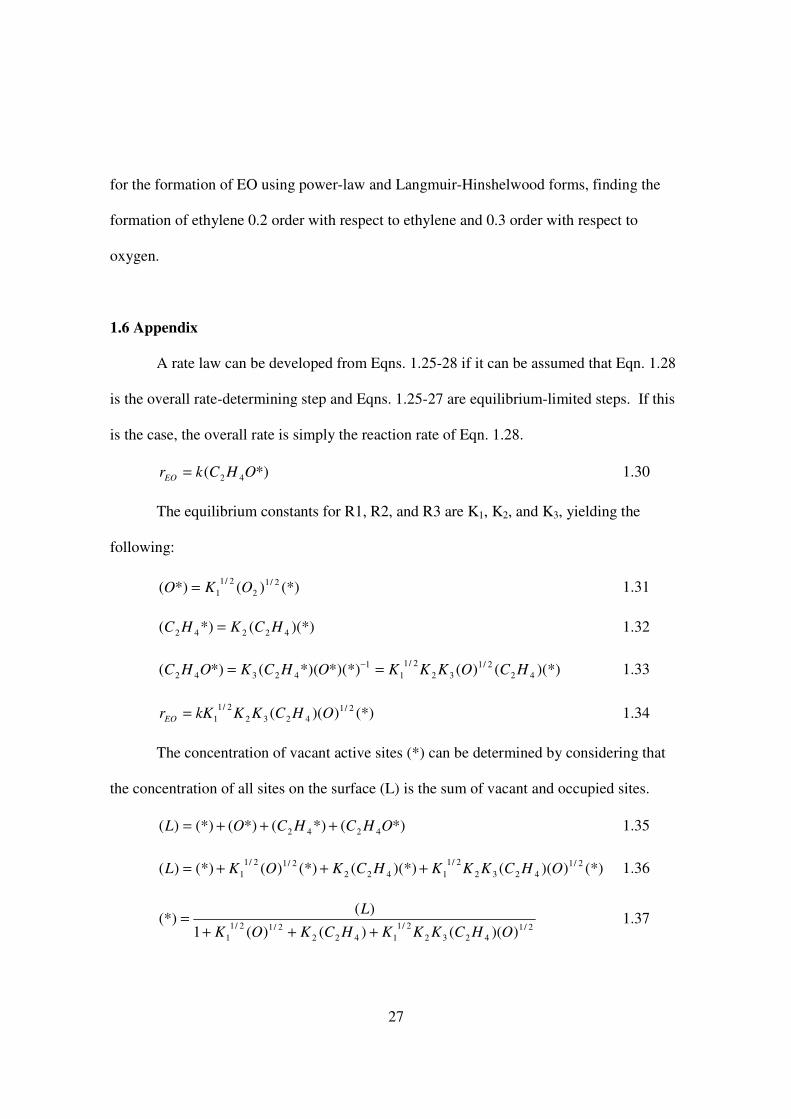
A rate law can be developed from Eqns. 1.25-28 if it can be assumed that Eqn. 1.28
is the overall rate-determining step and Eqns. 1.25-27 are equilibrium-limited steps. If this
is the case, the overall rate is simply the reaction rate of Eqn. 1.28.
*)( 42 OHCkrEO = 1.30
The equilibrium constants for R1, R2, and R3 are K1, K2, and K3, yielding the
following:
(*))(*)( 2/12
2/11 OKO = 1.31
)(*)(*)( 42242 HCKHC = 1.32
)(*)()(*)(*)*)((*)( 422/1
322/1
11
42342 HCOKKKOHCKOHC == − 1.33
(*)))(( 2/14232
2/11 OHCKKkKrEO = 1.34
The concentration of vacant active sites (*) can be determined by considering that
the concentration of all sites on the surface (L) is the sum of vacant and occupied sites.
*)(*)(*)((*))( 4242 OHCHCOL +++= 1.35
(*)))(()(*)((*))((*))( 2/14232
2/11422
2/12/11 OHCKKKHCKOKL +++= 1.36
2/14232
2/11422
2/12/11 ))(()()(1
)((*)
OHCKKKHCKOK
L
+++= 1.37
28
2/14232
2/11422
2/12/11
2/14232
2/11
))(()()(1
))()((
OHCKKKHCKOK
OHCLKKkKrEO
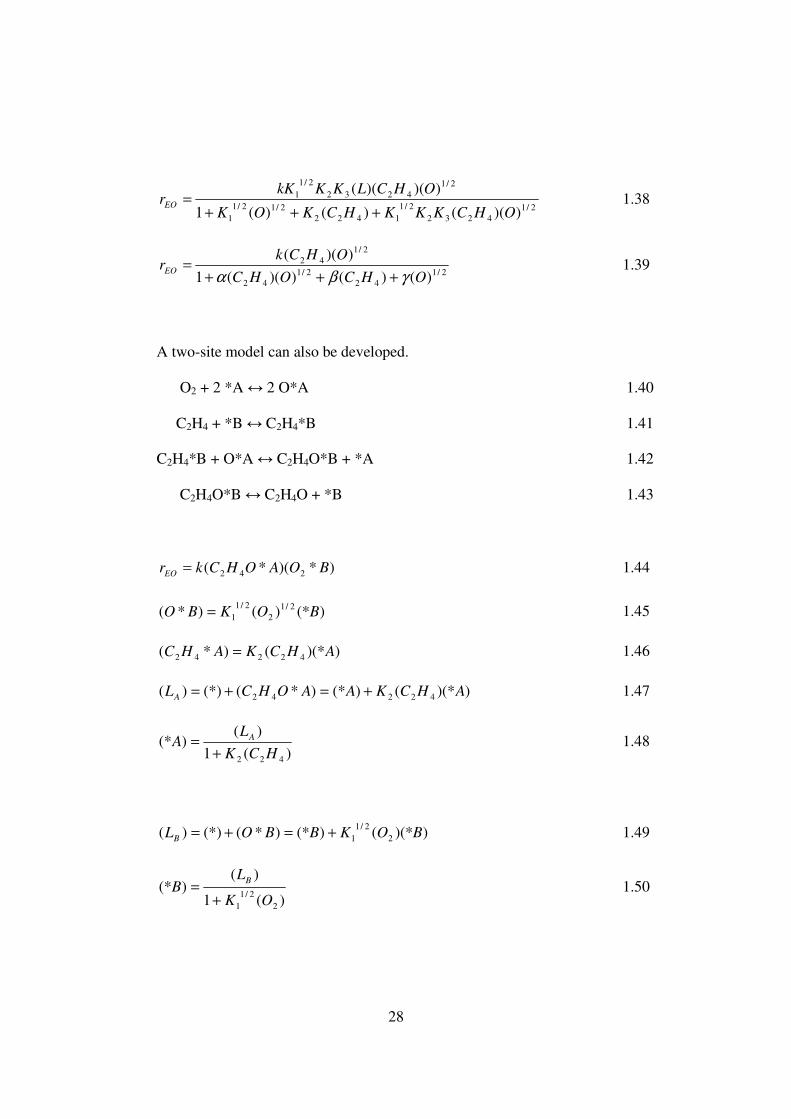
+++= 1.38
2/142
2/142
2/142
)()())((1
))((
OHCOHC
OHCkrEO
γβα +++= 1.39
A two-site model can also be developed.
O2 + 2 *A ↔ 2 O*A 1.40
C2H4 + *B ↔ C2H4*B 1.41
C2H4*B + O*A ↔ C2H4O*B + *A 1.42
C2H4O*B ↔ C2H4O + *B 1.43
)*)(*( 242 BOAOHCkrEO = 1.44
)(*)()*( 2/12
2/11 BOKBO = 1.45
))(*()*( 42242 AHCKAHC = 1.46
))(*()(*)*((*))( 42242 AHCKAAOHCLA +=+= 1.47
)(1
)()(*
422 HCK
LA A
+= 1.48
))(*()(*)*((*))( 22/1
1 BOKBBOLB +=+= 1.49
)(1
)()(*
22/1
1 OK
LB
B
+= 1.50
29
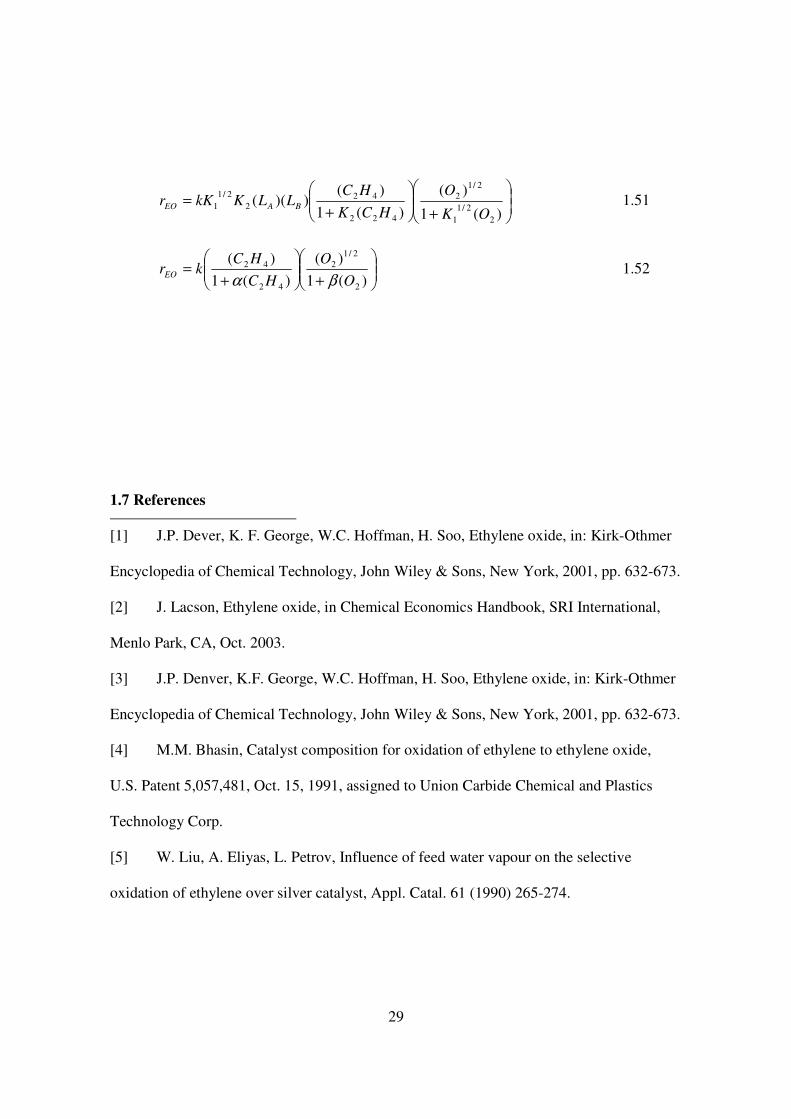
+
+=
)(1
)(
)(1
)())((
22/1
1
2/12
422
422
2/11
OK
O
HCK
HCLLKkKr BAEO 1.51
+
+=
)(1
)(
)(1
)(
2
2/12
42
42
O
O
HC
HCkrEO
βα 1.52
1.7 References
[1] J.P. Dever, K. F. George, W.C. Hoffman, H. Soo, Ethylene oxide, in: Kirk-Othmer
Encyclopedia of Chemical Technology, John Wiley & Sons, New York, 2001, pp. 632-673.
[2] J. Lacson, Ethylene oxide, in Chemical Economics Handbook, SRI International,
Menlo Park, CA, Oct. 2003.
[3] J.P. Denver, K.F. George, W.C. Hoffman, H. Soo, Ethylene oxide, in: Kirk-Othmer
Encyclopedia of Chemical Technology, John Wiley & Sons, New York, 2001, pp. 632-673.
[4] M.M. Bhasin, Catalyst composition for oxidation of ethylene to ethylene oxide,
U.S. Patent 5,057,481, Oct. 15, 1991, assigned to Union Carbide Chemical and Plastics
Technology Corp.
[5] W. Liu, A. Eliyas, L. Petrov, Influence of feed water vapour on the selective
oxidation of ethylene over silver catalyst, Appl. Catal. 61 (1990) 265-274.
30
[6] Robert B. Grant, Richard M. Lambert, Alkali-metal promoters and catalysis: A
single-crystal investigation of ethylene epoxidation on Cs-doped Ag(111), Langmuir 1
(1985) 29-33.
[7] R.P. Nielsen, J.H. La Rochelle, Ethylene oxide process, U.S. Patent 4,012,425, Mar.
15, 1977, assigned to Shell Oil Company.
[8] M. Atkins, J. Couves, M. Hague, B. H. Sakaniki, K. C. Waugh, On the role of Cs,
Cl, and subsurface O in promoting selectivity in Ag/α-Al2O3 catalysed oxidation of ethene
to ethene epoxide, J. Catal. 235 (2005) 103-113.
[9] S. Linic, M.A. Barteau, On the mechanism of Cs promotion in ethylene epoxidation
on Ag, J. Am. Chem. Soc. 126 (2004) 8086-8087.
[10] James K. Lee, Xenophon E. Verykios, Rangasamy Pitchai, Support participation in
chemistry of ethylene oxidation on silver catalysts, Appl. Catal. 44 (1988) 223-237.
[11] N. Rizkalla, Ethylene oxide catalyst, U.S. Patent 6,846,774 B2, Jan. 25, 2005,
assigned to Scientific Design Co., Inc.
[12] A.M. Lauritzen, Ethylene oxide catalyst and process for the catalytic production of
ethylene oxide, European Patent EP 0622015, May 4, 1988, assigned to Shell Int. Research.
[13] R.A. Von Santen, H.P.C.E. Kuipers, The mechanism of ethylene epoxidation,
Advan. Catal. 35 (1987) 265-317.
[14] George H. Law, Henry C. Chitwood, Process of making olefin oxides, U.S. Patent
2,279,469, Apr. 14, 1942, assigned to Carbide and Carbon Chemicals Corporation
[15] C.T. Campbell, M.T. Paffett, The role of chlorine promoters in catalytic ethylene
epoxidation over the Ag(110) surface, Appl. Surf. Sci. 19 (1984) 28-42.
31
[16] S.A. Tan, R.B. Grant, R.M. Lambert, Chlorine-oxygen interactions and the role of
chlorine in ethylene oxidation over Ag(111), J. Catal. 100 (1986) 383-391.
[17] K.L. Yeung, A. Gavriilidis, A. Varma, M.M. Bhasin, Effects of 1,2 dichloroethane
addition on the optimal silver catalyst distribution in pellets for epoxidation of ethylene, J.
Catal. 174 (1988) 1-12.
[18] Emily A. Carter, William A. Goddard III, Chemisorption of oxygen, chlorine,
hydrogen, hydroxide, and ethylene on silver clusters: A model for the olefin epoxidation
reaction, Surf. Sci. 209 (1989) 243-289.
[19] Xenophon E. Verykios, Fred P. Stein, Robert W. Coughlin, Oxidation of ethylene
over silver: Adsorption, Kinetics, Catalyst, Catal. Rev. Sci. Eng. 22 (1980) 197-234.
[20] Ostrovskii, Kul’kova, Lopatin, Temkin. Kinet. Catal. 3 (1962) 160.
[21] You-Sing Yong, Eric M. Kennedy, Noel W. Cant, Oxide catalysed reactions of
ethylene oxide under conditions relevant to ethylene epoxidation over supported silver,
Appl. Catal. 76 (1991) 31-48.
[22] Beulah Griffe, Ernest Blues, Dereck Bryce-Smith, Study of the effect of carbon
dioxide on the catalytic properties of a silver catalyst in the oxidation of ethylene to
ethylene oxide, Appl. Catal. 10 (1984) 303-312
[23] A. Eliyas, L. Petrov, Modelling of the inhibiting effect of carbon dioxide on the
selective oxidation of ethene over silver catalyst, Appl. Catal. 62 (1990) 11-21.
[24] Yu Liu, Shikong Shen, Direct epoxidation of ethylene in a dilute reaction stream in
oxidative coupling of methane, Appl. Catal. A: Gen. 121 (1995) 57-68.
32
[25] C.-F. Mao, M.A. Vannice, High surface area α-aluminas III. Oxidation of ethylene
over silver dispersed on high surface area α -alumina, Appl. Catal. A: Gen. 122 (1995) 61-
76.
[26] W.E. Evans, P.I. Chipman, Process for operating the epoxidation of ethylene, US
Patent 6,717,001 B2, Apr. 6, 2004, To Shell Oil Company.
[27] J.R. Lockemeyer, Preparation of ethylene oxide and catalyst, U.S. Patent 5,929,259,
Jul. 27, 1999, assigned to Shell Oil Company.
[28] S. T. Oyama, Rates, kinetics, and mechanisms of epoxidation: Homogeneous,
heterogeneous, and biological routes, in: Mechanisms in Homogeneous and Heterogeneous
Epoxidation Catalysis, S. T. Oyama, Ed., Elsevier, Amsterdam, 2008, pp. 3-99.
[29] H. Takada, M. Shima, Silver catalyst for production of ethylene oxide, method of
production thereof, and method of production of ethylene oxide, U.S. Patent 6,103,916,
Aug. 15, 2000, assigned to Nippon Shokubai Co., Ltd.
[30] J.V. Porcelli, Catal. Rev. Sci. Eng. 23 (1981) 151-162.
[31] Robert H. Perry, Don W. Green, Perry’s Chemical Engineers’ Handbook, seventh
ed., McGraw-Hill, New York, 1997.
[32] Ch. Méthivier, B. Béguin, M. Brun, J. Massardier, J. C. Bertolini. Pd/SiC Catalysts:
Characterization and Catalytic Activity for the Methane Total Oxidation, J. Catal. 173
(1998) 374-382.
[33] J. Lu, J.J. Bravo-Suarez, A. Takahashi, M. Haruta, S.T. Oyama, J. Catal. 232 (2005)
85.
[34] J. Lu, J.J. Bravo-Suárez, M. Haruta, S. Ted Oyama, App. Catal. A 302 (2006) 283.
33
[35] L. Petrov, A. Eliyas, D. Shopov, A kinetic model of steady state ethylene
epoxidation over a supported silver catalyst, Appl. Catal. 18 (1985) 87-103.
[36] W.M.H. Sachtler, C. Backx, R.A. Van Santen, On the mechanism of ethylene
epoxidation, Catal. Rev. Sci. Eng. 23 (1981) 127-149.
[37] Eric M. Cordi, John L. Falconer, Oxidation of volatile organic compounds on a
Ag/Al2O3 catalyst, Appl. Catal. A: Gen 151 (1997) 179-191.
[38] G. Scott Jones, Manos Mavrikakis, Mark A. Barteau, John M. Vohs, First Synthesis,
Experimental and Theoretical Vibrational Spectra of an Oxametallocycle on a Metal
Surface, J. Am. Chem. Soc. 120 (1998) 3196-3204.
[39] Suljo Linic, Mark A. Barteau, Formation of a Stable Surface Oxametallocycle that
Produces Ethylene Oxide, J. Am. Chem. Soc. 124 (2002) 310-317.
[40] Suljo Linic, Mark A. Barteau, Construction of a reaction coordinate and a
microkinetic model for ethylene epoxidation on silver from DFT calculations and surface
science experiments, J. Catal. 214 (2003) 200-212.
34
Chapter 2
Effect of gold oxidation state
on the epoxidation and hydrogenation
of propylene on Au/TS-1
2.1 Introduction
Supported gold has been a subject of great interest in heterogeneous catalysis
since the discovery that nanosized gold particles oxidize carbon monoxide [1].
Heterogeneous gold catalysts show high activity, mostly for oxidation reactions [2,3,4],
among which the oxidation of propylene to propylene oxide has received considerable
attention [5,6,7,8,9,10]. Reviews are available on this subject [11] and on expoxidation
mechanisms in general [12].
Catalysts consisting of gold nanoparticles supported on titanosilicate have
demonstrated high selectivity in the oxidation of propylene to propylene oxide (PO) with
hydrogen and oxygen [13,14,15]. Supports such as mesoporous Ti-TUD and nanoporous
TS-1 are by themselves mild oxidation catalysts which can epoxidize propylene with
hydrogen peroxide [16,17,18]. It is generally accepted that hydrogen and oxygen first
react on the gold to form hydrogen peroxide, which then migrates to Ti centers to form
hydroperoxide species that react with propylene to form PO and water [19,20,21].
35
The original objective of this study was to study finely dispersed gold in the
propylene epoxidation reaction with hydrogen and oxygen to investigate a suggestion in
the literature that 3-atom gold clusters might be active for the reaction [22,23]. Such
small particle sizes had not been directly observed before. In order to obtain such
clusters a procedure described in the literature was adopted which consisted of treating
supported gold catalysts with sodium cyanide solutions [24]. This procedure was
reported to produce atomically dispersed ionic gold species [25]. Instead, it was
unexpectedly found that the cyanide treatment resulted in the dissolution of the gold and
reprecipitation of larger Au ( +1) cyanide particles. It was found that Au (+1)
nanoparticles generated in this treatment were no longer active for propylene oxidation
but instead were active for propylene hydrogenation. This study demonstrates that
oxidizing supported gold nanoparticles to a (+1) state can fundamentally alter their
catalytic behavior such that the gold takes on Pt-like behavior.
2.2 Experimental
2.2.1. Synthesis of Samples
The TS-1 zeolite was synthesized using a sol-gel method as described in the
literature [21]. In a typical synthesis HCl (0.05 M, 30 g) (1.5 mmol) was stirred in an ice
bath while 39.2 g (188 mmol) tetraethylorthosilicate (TEOS, Aldrich, 98%, batch
06526BC) were added dropwise, followed by 0.642 g (1.88 mmol) of titanium (+4)
butoxide (Aldrich, lot 11131JE) in isopropyl alcohol. The solution was stirred for 10
minutes and 5.65 g (27.8 mmol) tetrapropylammonium hydroxide (TPAOH, 1.0 M in
water, Aldrich, batch 09026ME) added, forming a gel. The gel was allowed to age for 2
36
h, and then was placed in a 373 K drying oven for 24 h. This material was subsequently
autoclaved with 12.45 g (61.2 mmol) TPAOH at 448 K for 24 h, washed with 1 liter
distilled water, and vacuum filtered. The material was dried at 393 K for 24 h, ground to
a fine powder, and finally calcined in air at 773 K for 5 h. The yield based on TEOS was
93%. Powder x-ray diffraction (XDS 2000, Scintag Inc) was utilized to confirm the
existence of TS-1 structure.
Gold nanoparticles were deposited on the TS-1 support using a deposition-
precipitation (DP) method [26]. Gold (+3) chloride hydrate (HAuCl4.4H2O, Fluka, batch
456301/1) (30 mg, 0.0728 mmol, 14 mg Au) was dissolved in 100 ml distilled water and
this solution was stirred and heated to 343 K. The solution had a pH of approximately
2.8 at this temperature (OAKTON Acorn pH-6), which was increased to 7.0 using NaOH
before 1.00 g TS-1 powder was added. The solution was stirred for 1 h and then removed
from heat and the solids were separated from the solution by centrifuging. The solids
were re-suspended in water and centrifuged again. The remaining solids were removed
and dried overnight under room-temperature vacuum without calcination.
2.2.2 Cyanide treatment
Gold was selectively removed from the samples by cyanide leaching [24].
Sodium cyanide (NaCN, 95+%, Aldrich, lot 05629PE) was dissolved in water to 0.05
wt% (0.010 M), 1.0 wt% (0.20 M), and 2.0 wt% (0.41 M), and NaOH was added to
achieve a pH of 12.5. Au/TS-1 (2.0 g) was added to each 50 ml solution and stirred at
room temperature for 1 h, and 100 ml water was added prior to vacuum filtration. The
solids were again suspended in water and filtered, and this was repeated a total of 10
times to remove as much NaCN as possible, and the remaining solids were dried for 8 h
37
in room temperature vacuum. A solution of NaOH at 12.5 pH with no NaCN was used to
produce a control sample. The samples were identified as Au-0.0 (no cyanide), Au-0.05
(0.05% cyanide), AuCN-1.0 (1.0% cyanide) and AuCN-2.0 (2.0% cyanide).
The gold content of the Au/TS-1 samples was determined using X-ray
fluorescence spectroscopy (Rigaku ZSX mini) as well as inductively coupled plasma
atomic emission spectroscopy (Spectro CirOS VISION, using aqua regia). An Au/TS-1
sample that was not further treated was determined to have a gold content of 1.12 wt%,
indicating 80% of the gold in solution was deposited onto the catalyst. X-ray
photoelectron spectroscopy (XPS) was obtained with a PHI-5500 spectrometer with Al
Kα radiation (1253.6 eV) and referenced to the Si 2p line at 103.4 eV.
2.2.3 Transmission electron microscopy
High resolution transmission electron microscopy (TEM) images were obtained
using a Philips CM200 FEG (200 kV) and a spherical aberration-corrected Titan (300kV).
The Philips CM200 FEG has a point resolution of 2.0 Å, while the Titan utilizes a
spherical-aberration corrector which can compensate for the delocalization of image
details, which manifests itself as an extension of the perimeter of a sample beyond the
actual surface in conventional TEM [27]. Particle size distributions were determined by
selecting a representative image for each sample and measuring the diameter of all visible
Au particles.
2.2.4 Reactivity testing
Catalytic activity was measured in a differential flow reactor consisting of a 5 mm
diameter quartz tube placed vertically in a furnace assembly. Temperature monitoring
and control was through a RKC REX-P24 temperature controller, using a thermocouple
38
centered within the catalyst bed. Feed gases used were propylene (Takachiho Chemical,
>99.8%), oxygen (Tomoe Shokai, >99.5%) argon (Suzuki Shokan, >99.9997%) and
hydrogen (Shimadzu OPGU-2100S hydrogen generator, >99.99%), regulated by mass
flow controllers. All experiments used 0.30 g of catalyst, which was activated in reaction
gases (10/10/10/70 H2/O2/C3H6/Ar, 35 cm3NTP min-1, 7000 cm3 h-1 gcat-1) and heated from
room temperature to reaction temperature at 0.5 K min-1. The catalysts were held at 443
K for 2 h, then heated at 0.5 K min-1 to 473 K and held for a further 2 h.
The effluent was sampled every 0.5 h using a pair of two-column gas
chromatographs. A FPAP column and flame ionization detector (FID) was able to
separate and quantify propylene oxide, propionaldehyde, acetone, and acrolein, while a
Gaskuropak column and FID was used to measure propylene and propane. A Porapak Q
column and thermal conductivity detector (TCD) measured carbon dioxide, carbon
monoxide and water, and a MS5A column and TCD was able to measure hydrogen and
oxygen. Quantifiable amounts of propionaldehyde, acetone, acrolein, and carbon
monoxide were not detected under any conditions.
2.2.5 X-ray absorption spectroscopy
In situ Au LIII-edge X-ray absorption spectroscopy (XAS) measurements were
carried out at beamline NW10A of the Photon Factory in the Institute of Materials
Structure Science, High Energy Accelerator Research Organization (PF-IMSS-KEK) in
Tsukuba, Japan. A specially designed reactor cell and flow delivery system [28] was
used to reproduce the pretreatment and reaction conditions used for catalyst screening. In
situ measurements were taken at 443 K at 10 minute intervals using a step-scanning mode.
Pretreatment and reaction conditions were monitored and controlled from outside the
39
radiation shielded hutch and all spectra were obtained in fluorescence mode using a solid
state detector (SSD). The monochromater was calibrated against the LIII edge of a gold
foil sample at E0=11919 eV.
X-ray absorption near-edge structure (XANES) and extended x-ray absorption
fine structure (EXAFS) were analyzed using IFEFFIT 1.2.8 [29]. For each spectrum, a
pre-edge background was subtracted using a least-squares linear fit to E0-150<E<E0-30
eV, and the data was normalized to an edge jump of 1 using a least-squares cubic fit to
E0+150<E<E0+763 eV. The white line area was calculated by shifting these background-
subtracted and normalized spectra to the same E0 as the bulk gold standard and
integrating the area between the white line feature and bulk gold [30,31,32].
For EXAFS analysis, a post-edge background µ0(E) was subtracted from each
normalized spectrum and the wavevector k was substituted for energy E, yielding the
EXAFS function χ(k). A Fourier transform on this k3-weighted function in the range of
2<k<7 Å-1 using a Kaiser-Bessel window with ∆k=2 Å-1 generated χ(R), the EXAFS
function in real space. The background µ0(E) was optimized using the AUTOBK
algorithm [33], which fit a cubic spline [34] to the low-frequency oscillations in the
spectrum such that the χ(R) function was minimized on the range 0<R<RBKG, using a
number of knots equal to the number of independent points in this range to prevent
overcorrelation. The value of RBKG is the frequency below which oscillations in χ(k) are
treated as noise, and the value of RBKG=0.09 nm was determined to be optimal for all
samples. The magnitude of the χ(R) was presented using a standard central atom phase
correction so that the peaks in the Fourier transform more closely correspond with bond
distances.
40
Additional information was extracted by fitting EXAFS χ(R) spectra to ab initio
atomic models. Theoretical clusters of face-centered cubic (FCC) gold metal [35] and
rhombohedral NaAu(CN)2 [36] were generated using ATOMS [37] and the potential
scattering paths of photoelectrons in these clusters were calculated with FEFF 6 [38,39].
A 12-fold 0.2885 nm Au-Au path was applied to the gold metal standard in the range of
0.16<R<0.34 nm and the Au-0.0 and Au-0.05 samples after reaction on the range of
0.16<R<0.30 nm, while a 2-fold 0.200 nm Au-CN path was applied to the AuCN-1.0 and
AuCN-2.0 samples before and during reaction in the range of 0.11<R<0.21 nm. The
regression parameters studied were coordination number (N), path energy shift (∆E),
bond distance (R), and Debye-Waller factor (σ2). As the amplitude correction factor S02
and coordination number N are fully correlated in the single-shell EXAFS equations used
in these fits, the amplitude correction factor could be fixed at S02=0.843 for all samples so
that N=12 for the bulk gold standard. The Au-0.0 and Au-0.05 EXAFS spectra each
contained insufficient data to validate a four-parameter fit; therefore, ∆E was fixed at the
∆E of the gold standard, and σ2 was set to the σ2 of the gold standard with a linear
temperature correction, i.e., σ2298 K = 1.49σ2
443 K [40]. The AuCN-1.0 and AuCN-2.0
samples before and after reaction were simultaneously fit to one value of ∆E, one
independent value of the Debye-Waller factor (where σ2298 K = 1.49σ2
443 K) and
independent N and R for each set. Goodness of fit parameters were generated in
accordance with current International X-ray Absorption Society (IXAS) standards.
Models were selected which presented the smallest values of χ2, R2, and calculated error
of regressed parameters.
41
To aid in XANES interpretation, molecular orbital analysis was carried out using
Gaussian98 population analysis at the B3LYP/LANLDZ level. The structures studied
were square planar AuCl4-, [41] linear Au(CN)2
-, [42] and a proposed square planar
Au(CN)4-. Bond distances used were Au-Cl 0.229 nm, Au-C 0.212 nm, and C-N 0.117
nm and bond angles were approximated as 180o for Au-C-N (linear and square planar)
and C-Au-C (linear) and 90o for Cl-Au-Cl and C-Au-C (square planar).
2.3 Results
2.3.1 Catalyst characterization
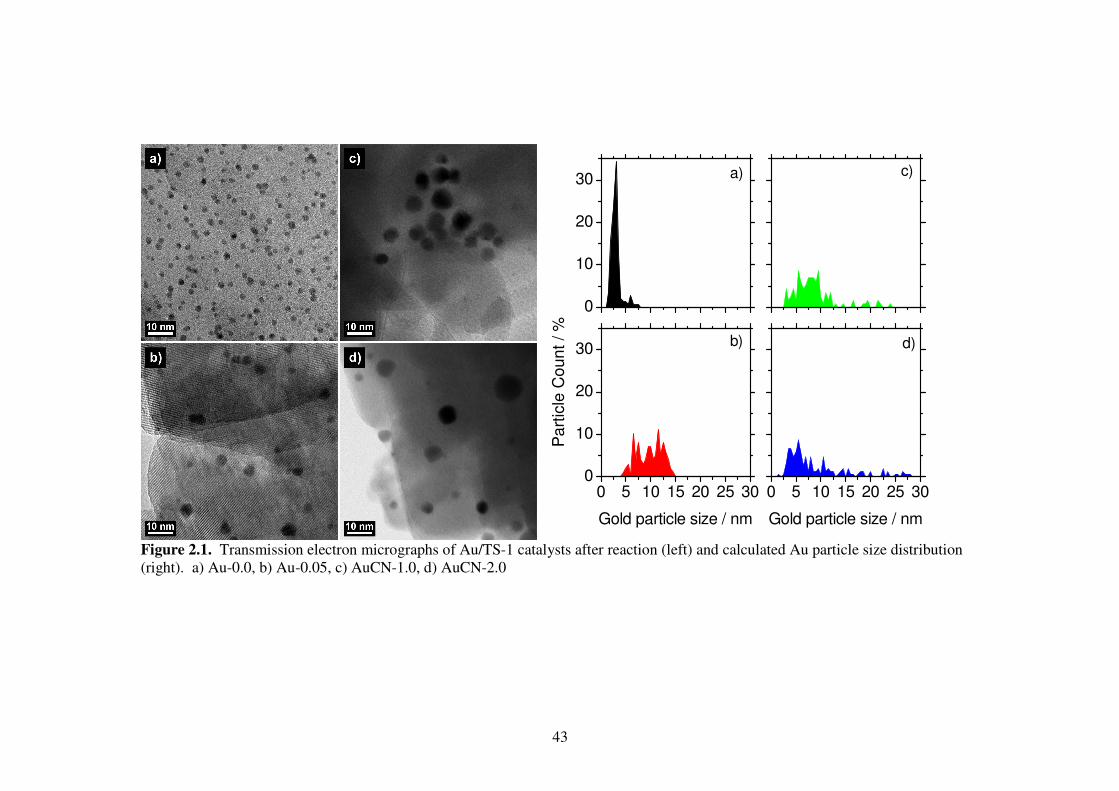
Transmission electron micrographs (TEM) of the activated (post-reaction)
catalysts (Fig. 2.1) show the presence of gold particles in all samples. All gold appears
on the TS-1 surface as round particles. The particle size distribution is narrow for Au-0.0
and becomes progressively wider for Au-0.05, AuCN-1.0, and AuCN-2.0. The average
particle size (Table 2.1) is 3 nm for the untreated Au-0.0 sample, which increases to 9 to
11 nm for the three cyanide treated samples. Treatment with progressively stronger
cyanide treatment yields wider size distribution and reduced gold content. For the
samples Au-0.0, Au-0.05, AuCN-1.0, and AuCN-2.0 the standard deviation of particle
size grow from 1 nm to 2.5 nm, 5.6 nm, and 9.8 nm, and the gold content decreases from
0.81 wt% to 0.59 wt %, 0.29 wt%, and 0.24 wt%.
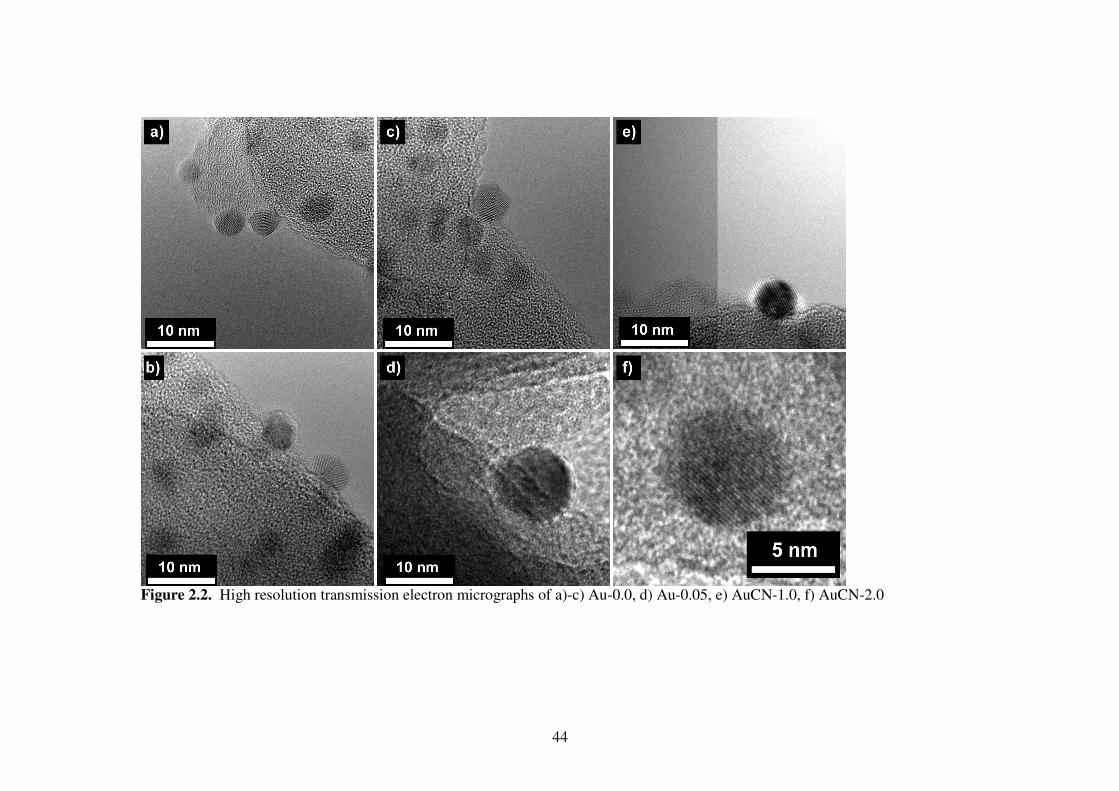
High resolution images of the particles in the Au-0.0 sample show that some have
a complex multifaceted structure (Fig. 2.2) and a few of the particles appear to be
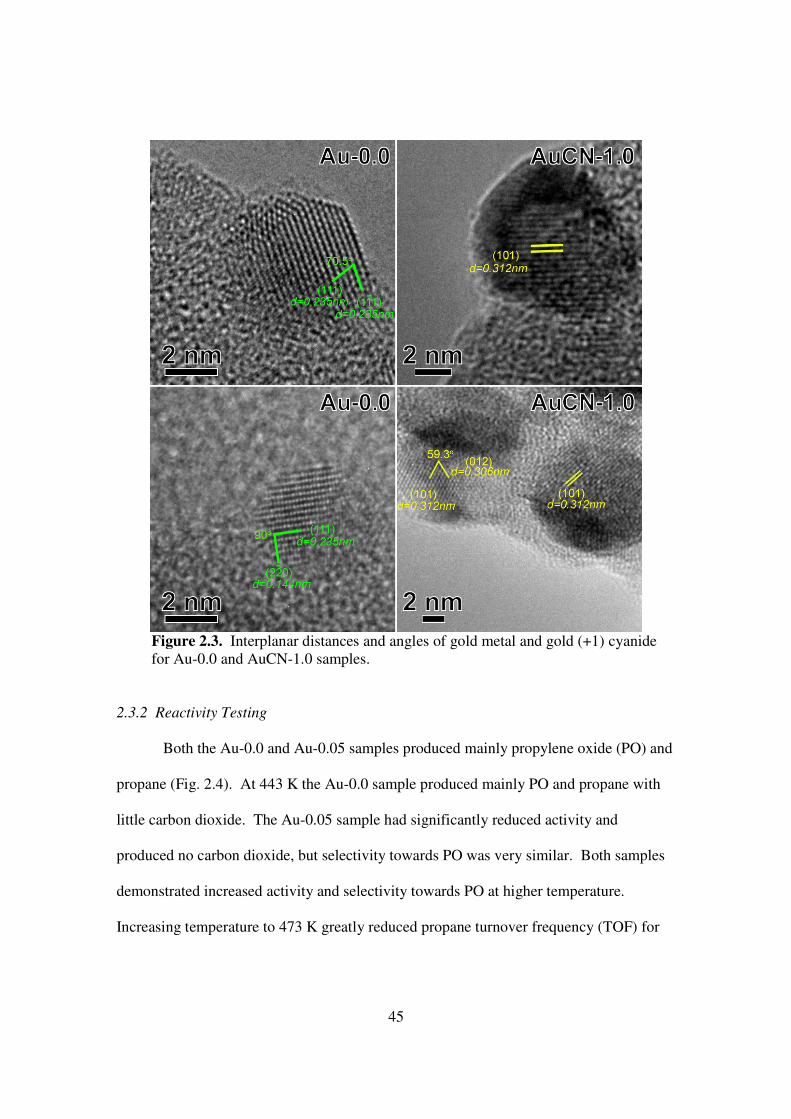
twinned. Interplanar distances and angles (Fig. 2.3) indicate metallic gold for the Au-0.0
sample and NaAu(CN)2 for the AuCN-1.0 sample. X-ray photoelectron spectroscopy
42
(XPS) indicates that the Au-0.0 sample and the AuCN-1.0 samples after reaction have
oxidation states of Au (0) and Au (+1), respectively (Table 2.2).
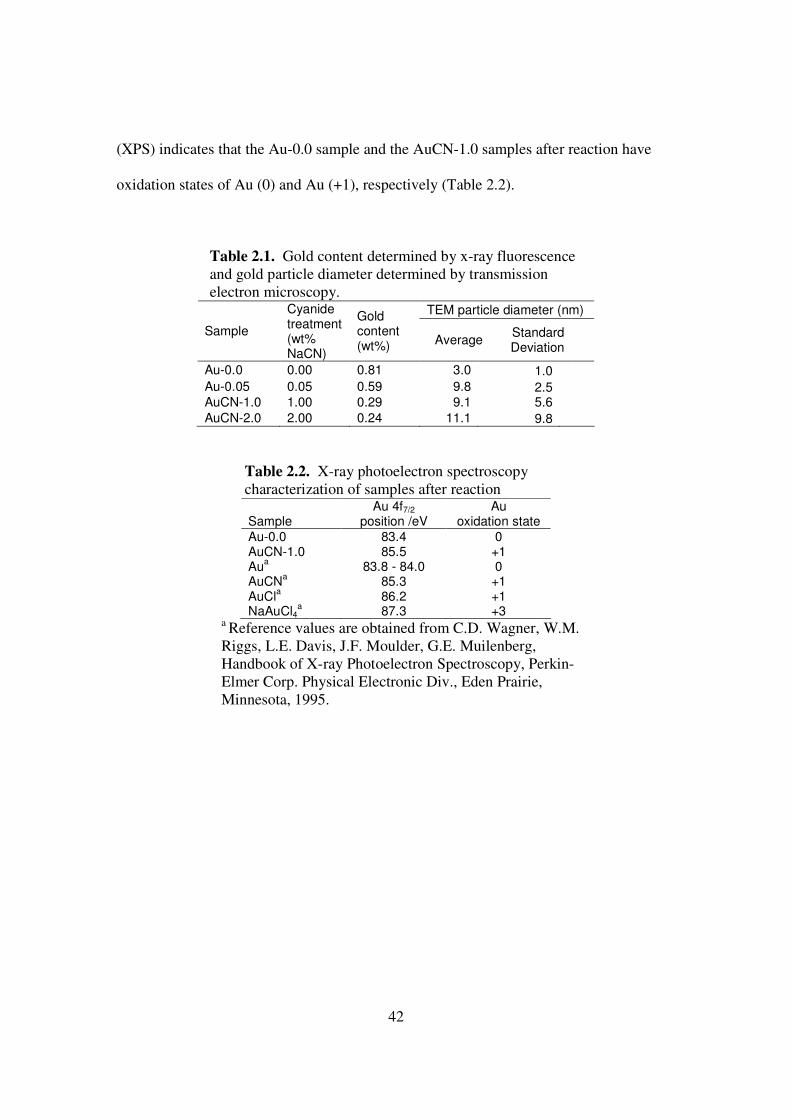
Table 2.1. Gold content determined by x-ray fluorescence and gold particle diameter determined by transmission electron microscopy.
TEM particle diameter (nm)
Sample
Cyanide treatment (wt% NaCN)
Gold content (wt%) Average
Standard Deviation
Au-0.0 0.00 0.81 3.0 1.0
Au-0.05 0.05 0.59 9.8 2.5
AuCN-1.0 1.00 0.29 9.1 5.6
AuCN-2.0 2.00 0.24 11.1 9.8
Table 2.2. X-ray photoelectron spectroscopy characterization of samples after reaction
Au 4f7/2 Au Sample position /eV oxidation state
Au-0.0 83.4 0 AuCN-1.0 85.5 +1 Au
a 83.8 - 84.0 0
AuCNa 85.3 +1
AuCla 86.2 +1
NaAuCl4a 87.3 +3
a Reference values are obtained from C.D. Wagner, W.M. Riggs, L.E. Davis, J.F. Moulder, G.E. Muilenberg, Handbook of X-ray Photoelectron Spectroscopy, Perkin-Elmer Corp. Physical Electronic Div., Eden Prairie, Minnesota, 1995.
43
0
10
20
30
d)
c)
b)
a)
0 5 10 15 20 25 300
10
20
30
Pa
rtic
le C
oun
t / %
Gold particle size / nm
0 5 10 15 20 25 30
Gold particle size / nm
Figure 2.1. Transmission electron micrographs of Au/TS-1 catalysts after reaction (left) and calculated Au particle size distribution (right). a) Au-0.0, b) Au-0.05, c) AuCN-1.0, d) AuCN-2.0
44
Figure 2.2. High resolution transmission electron micrographs of a)-c) Au-0.0, d) Au-0.05, e) AuCN-1.0, f) AuCN-2.0
45
Figure 2.3. Interplanar distances and angles of gold metal and gold (+1) cyanide for Au-0.0 and AuCN-1.0 samples.
2.3.2 Reactivity Testing
Both the Au-0.0 and Au-0.05 samples produced mainly propylene oxide (PO) and
propane (Fig. 2.4). At 443 K the Au-0.0 sample produced mainly PO and propane with
little carbon dioxide. The Au-0.05 sample had significantly reduced activity and
produced no carbon dioxide, but selectivity towards PO was very similar. Both samples
demonstrated increased activity and selectivity towards PO at higher temperature.
Increasing temperature to 473 K greatly reduced propane turnover frequency (TOF) for
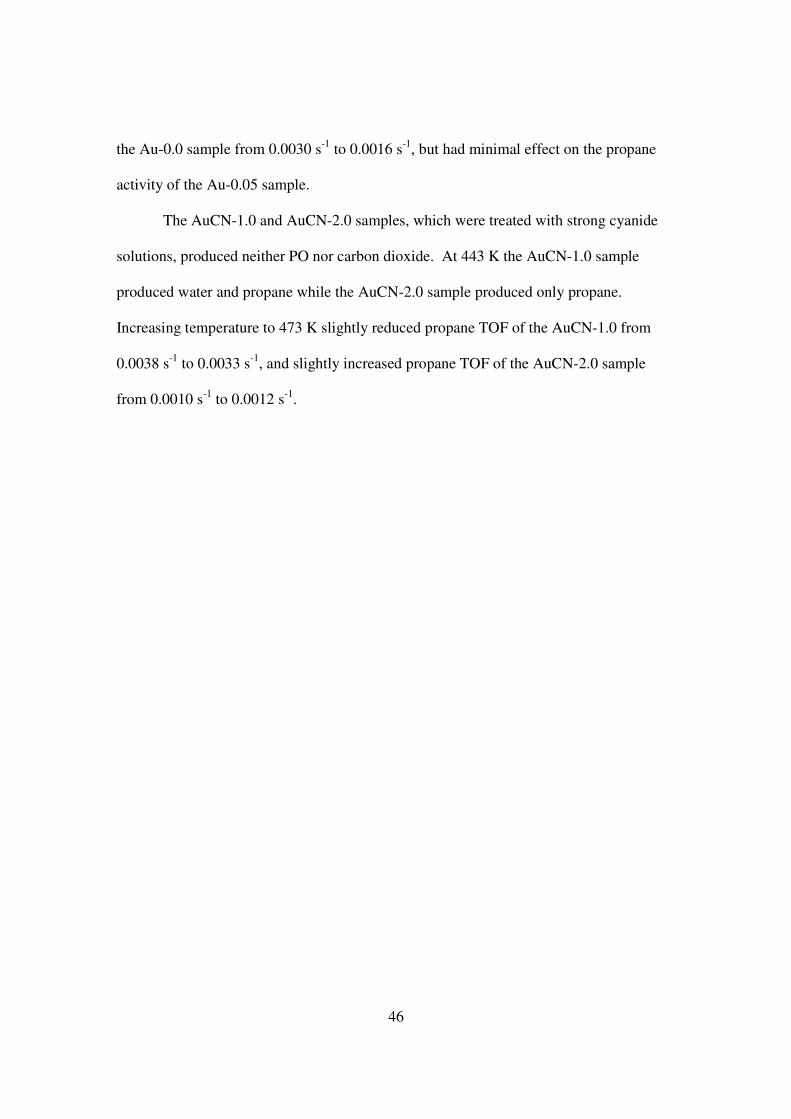
46
the Au-0.0 sample from 0.0030 s-1 to 0.0016 s-1, but had minimal effect on the propane
activity of the Au-0.05 sample.
The AuCN-1.0 and AuCN-2.0 samples, which were treated with strong cyanide
solutions, produced neither PO nor carbon dioxide. At 443 K the AuCN-1.0 sample
produced water and propane while the AuCN-2.0 sample produced only propane.
Increasing temperature to 473 K slightly reduced propane TOF of the AuCN-1.0 from
0.0038 s-1 to 0.0033 s-1, and slightly increased propane TOF of the AuCN-2.0 sample
from 0.0010 s-1 to 0.0012 s-1.
47
0
20
40
60
80
100
120
140
0
1
2
3
4
5
6
7
8
9
10
Au-0.0 Au-0.05 AuCN-1.0 AuCN-2.0
Go
ld T
OF
/ 1
0-3 s
-1
C3H
6O
C3H
8
CO2/3
H2O
0
20
40
60
80
100
120
140
0
1
2
3
4
5
6
7
8
9
10
Au-0.0 Au-0.05 AuCN-1.0 AuCN-2.0
Go
ld T
OF
/ 1
0-3 s
-1
C3H
6O
C3H
8
CO2/3
H2O
Figure 2.4. Turnover frequencies (TOF) (molproduct molAu
-1 s-1) for catalysts at 443 K (left) and 473 K (right).
48
11.9 12.0 12.1
11921
11967
1197611946
Au-0.0
AuCN-2.0
AuCN-1.0
Au-0.05
Au-0.0
Before reaction
No
rma
lize
d µ
(E)
/ a
rb
Energy / keV
11920
1197611946
11919
11967
11919
11.9 12.0 12.1
1196911946
During reaction
Energy / keV
11922
1197511945
AuCN-2.0
AuCN-1.0
Au-0.05
11922
1197511945
11919
11919
1196911946
11.9 12.0 12.1
11969
11938
HAuCl4
Au2O
3
AuCl
Au
Standards
Energy / keV
1196911946
11919
11917
11918
11917
11976
11967
11938
11938
Figure 2.5. Au LIII x-ray absorption spectra. Background-subtracted and normalized XANES spectra of samples before reaction and during reaction, along with gold standards.
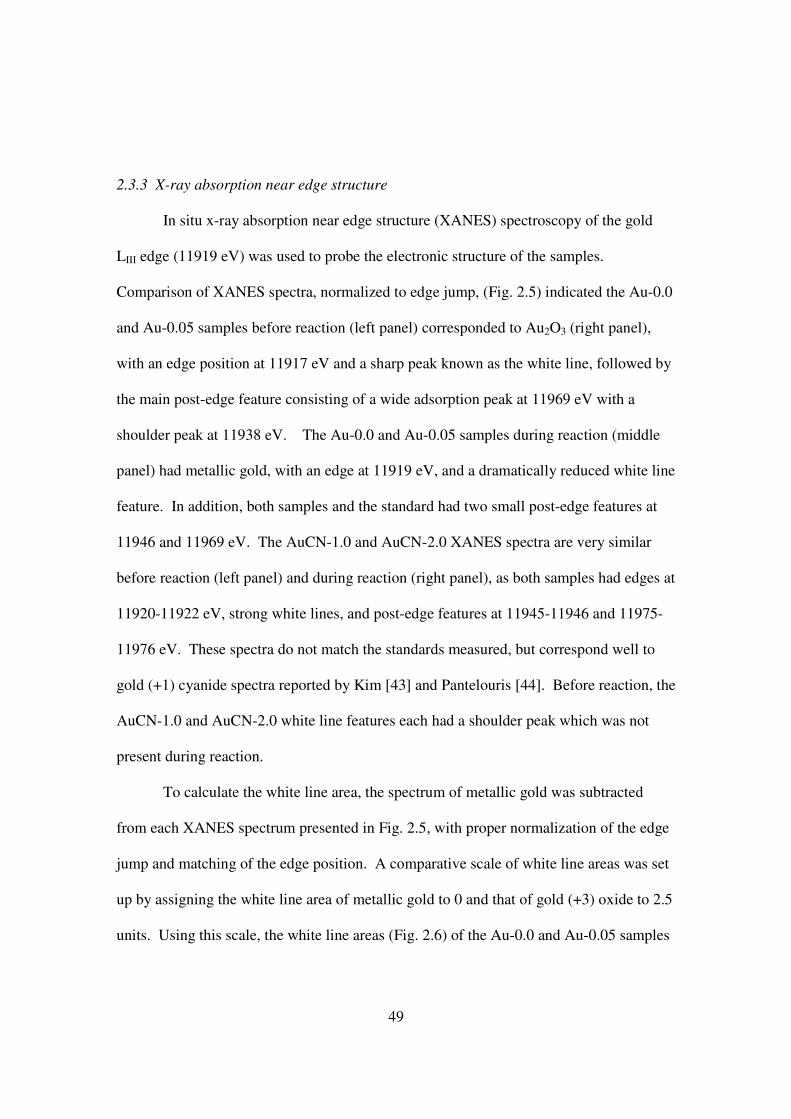
49
2.3.3 X-ray absorption near edge structure
In situ x-ray absorption near edge structure (XANES) spectroscopy of the gold
LIII edge (11919 eV) was used to probe the electronic structure of the samples.
Comparison of XANES spectra, normalized to edge jump, (Fig. 2.5) indicated the Au-0.0
and Au-0.05 samples before reaction (left panel) corresponded to Au2O3 (right panel),
with an edge position at 11917 eV and a sharp peak known as the white line, followed by
the main post-edge feature consisting of a wide adsorption peak at 11969 eV with a
shoulder peak at 11938 eV. The Au-0.0 and Au-0.05 samples during reaction (middle
panel) had metallic gold, with an edge at 11919 eV, and a dramatically reduced white line
feature. In addition, both samples and the standard had two small post-edge features at
11946 and 11969 eV. The AuCN-1.0 and AuCN-2.0 XANES spectra are very similar
before reaction (left panel) and during reaction (right panel), as both samples had edges at
11920-11922 eV, strong white lines, and post-edge features at 11945-11946 and 11975-
11976 eV. These spectra do not match the standards measured, but correspond well to
gold (+1) cyanide spectra reported by Kim [43] and Pantelouris [44]. Before reaction, the
AuCN-1.0 and AuCN-2.0 white line features each had a shoulder peak which was not
present during reaction.
To calculate the white line area, the spectrum of metallic gold was subtracted
from each XANES spectrum presented in Fig. 2.5, with proper normalization of the edge
jump and matching of the edge position. A comparative scale of white line areas was set
up by assigning the white line area of metallic gold to 0 and that of gold (+3) oxide to 2.5
units. Using this scale, the white line areas (Fig. 2.6) of the Au-0.0 and Au-0.05 samples
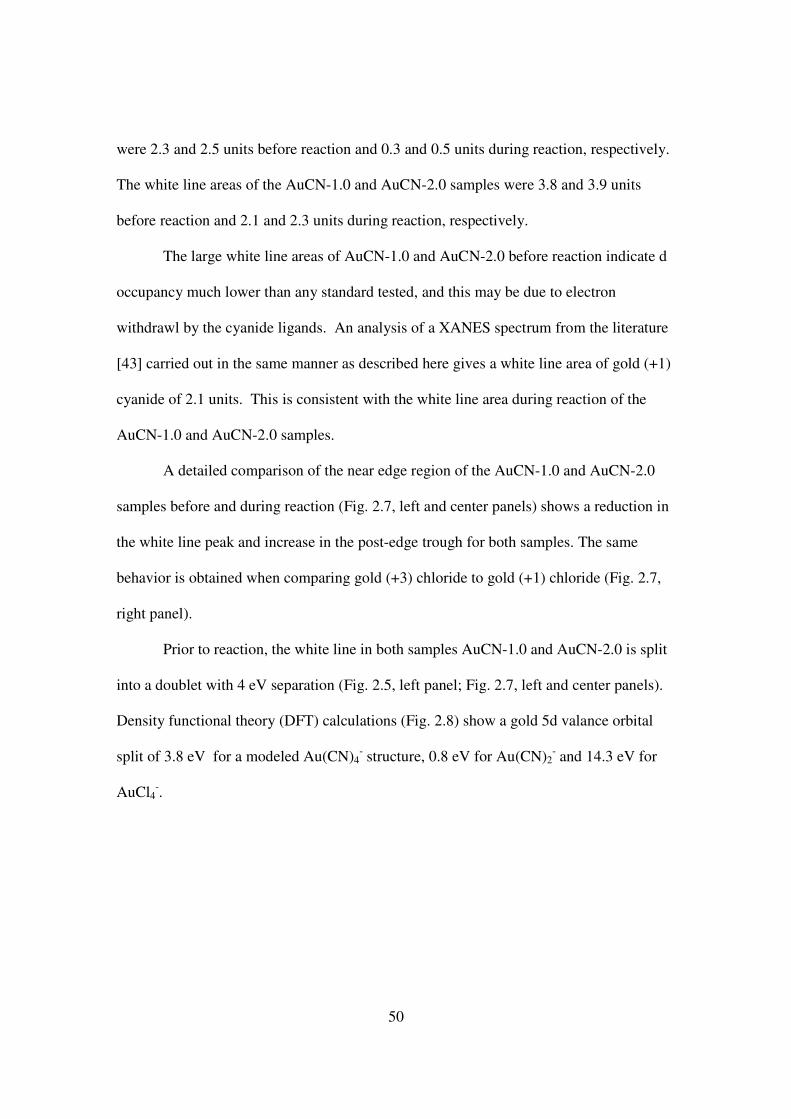
50
were 2.3 and 2.5 units before reaction and 0.3 and 0.5 units during reaction, respectively.
The white line areas of the AuCN-1.0 and AuCN-2.0 samples were 3.8 and 3.9 units
before reaction and 2.1 and 2.3 units during reaction, respectively.
The large white line areas of AuCN-1.0 and AuCN-2.0 before reaction indicate d
occupancy much lower than any standard tested, and this may be due to electron
withdrawl by the cyanide ligands. An analysis of a XANES spectrum from the literature
[43] carried out in the same manner as described here gives a white line area of gold (+1)
cyanide of 2.1 units. This is consistent with the white line area during reaction of the
AuCN-1.0 and AuCN-2.0 samples.
A detailed comparison of the near edge region of the AuCN-1.0 and AuCN-2.0
samples before and during reaction (Fig. 2.7, left and center panels) shows a reduction in
the white line peak and increase in the post-edge trough for both samples. The same
behavior is obtained when comparing gold (+3) chloride to gold (+1) chloride (Fig. 2.7,
right panel).
Prior to reaction, the white line in both samples AuCN-1.0 and AuCN-2.0 is split
into a doublet with 4 eV separation (Fig. 2.5, left panel; Fig. 2.7, left and center panels).
Density functional theory (DFT) calculations (Fig. 2.8) show a gold 5d valance orbital
split of 3.8 eV for a modeled Au(CN)4- structure, 0.8 eV for Au(CN)2
- and 14.3 eV for
AuCl4-.
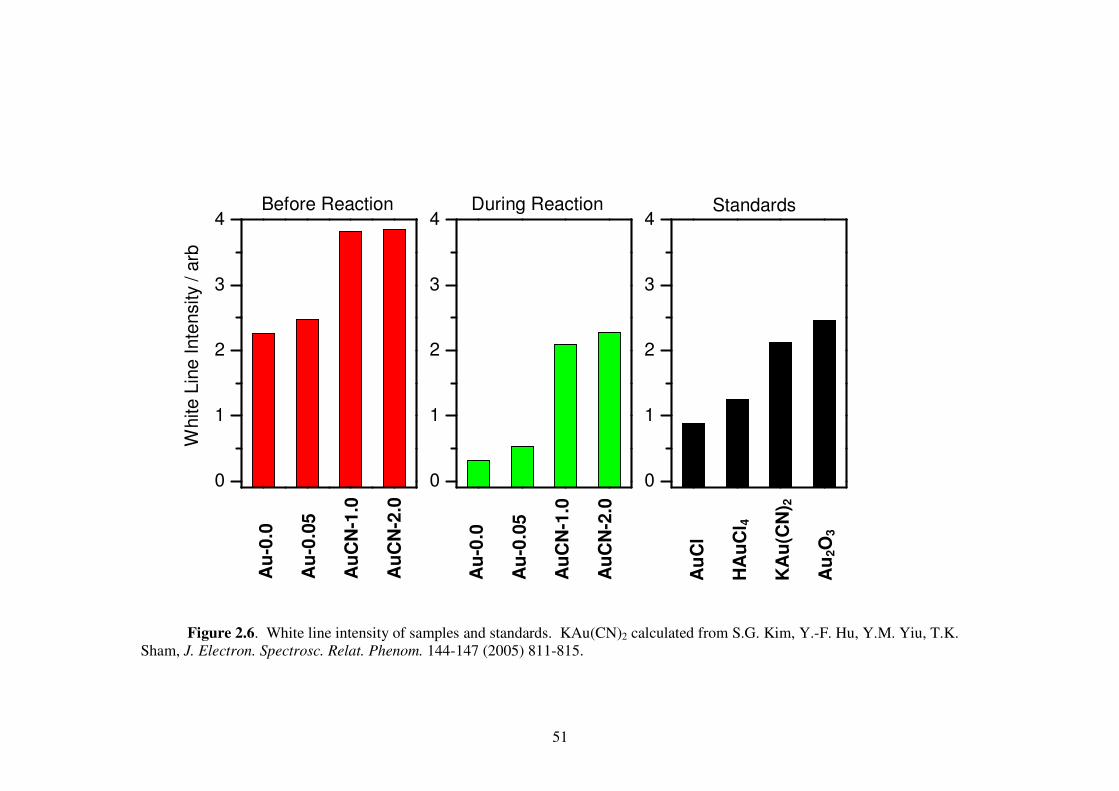
51
Au
-0.0
Au
-0.0
5
Au
CN
-1.0
Au
CN
-2.0
Au
-0.0
Au
-0.0
5
Au
CN
-1.0
Au
CN
-2.0
Au
Cl
HA
uC
l 4
KA
u(C
N) 2
Au
2O
3
0
1
2
3
4
White L
ine Inte
nsity
/ arb
0
1
2
3
4
0
1
2
3
4StandardsDuring ReactionBefore Reaction
Figure 2.6. White line intensity of samples and standards. KAu(CN)2 calculated from S.G. Kim, Y.-F. Hu, Y.M. Yiu, T.K. Sham, J. Electron. Spectrosc. Relat. Phenom. 144-147 (2005) 811-815.
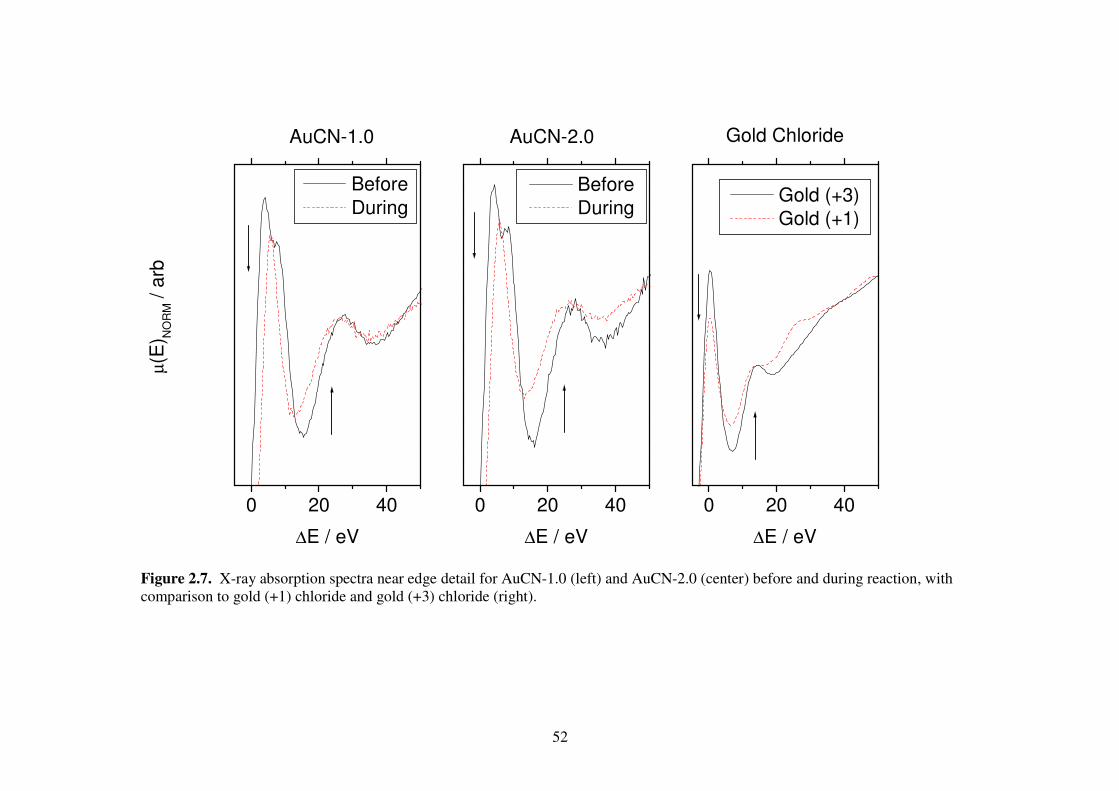
52
0 20 40
AuCN-1.0µ(E
) NO
RM /
arb
∆E / eV
Before
During
0 20 40
AuCN-2.0
∆E / eV
Before
During
0 20 40
Gold (+3)
Gold (+1)
Gold Chloride
∆E / eV
Figure 2.7. X-ray absorption spectra near edge detail for AuCN-1.0 (left) and AuCN-2.0 (center) before and during reaction, with comparison to gold (+1) chloride and gold (+3) chloride (right).
53
Figure 2.8. Gold 5d splitting for Au(CN)4
-, Au(CN)2-, and AuCl4
- determined by density functional theory.
Au Cl
Cl
Cl
Cl+3+3
C
C
N
N
Au C NCN+1
C C NN Au
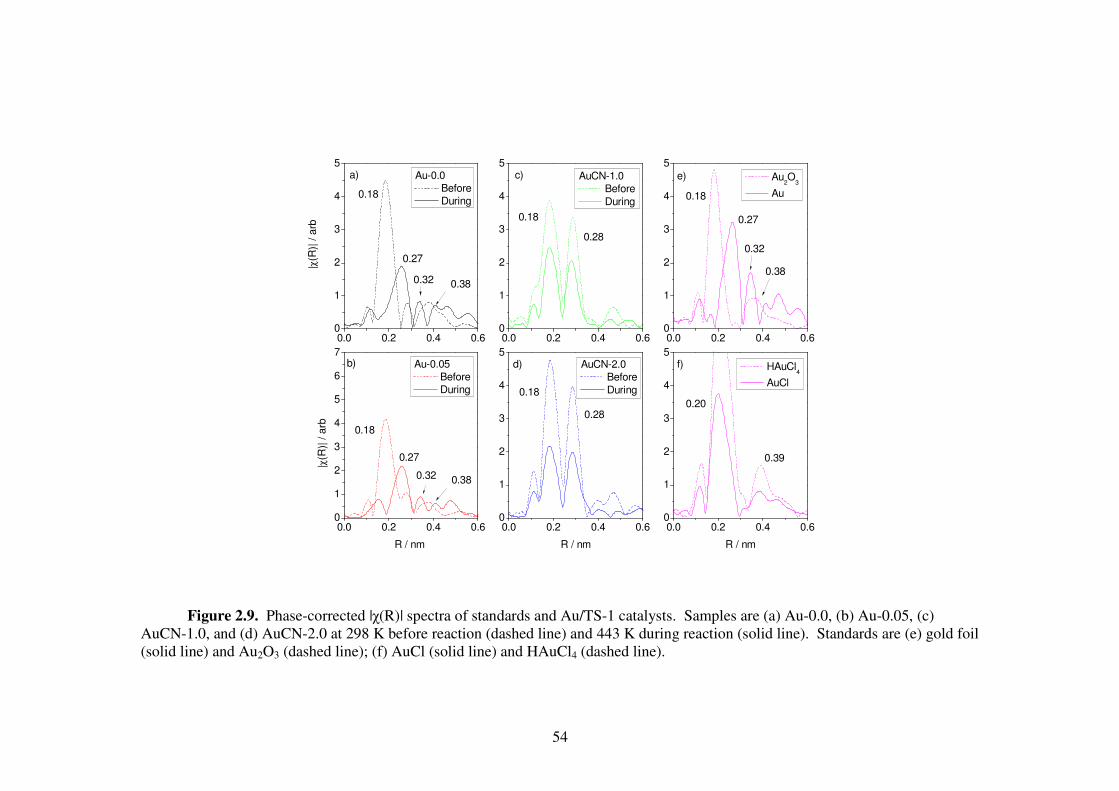
54
0.0 0.2 0.4 0.60
1
2
3
4
5
0.32
0.27
0.38
b)
a)
|χ(R
)| / a
rb
Au-0.0
Before
During0.18
0.0 0.2 0.4 0.60
1
2
3
4
5
0.28
0.18
c)
AuCN-1.0
Before
During
0.0 0.2 0.4 0.60
1
2
3
4
5
0.32
0.27
0.38
0.18
e)
Au2O
3
Au
0.0 0.2 0.4 0.60
1
2
3
4
5
6
7
0.32
0.27
0.38
0.18
|χ(R
)| / a
rb
R / nm
Au-0.05
Before
During
0.0 0.2 0.4 0.60
1
2
3
4
5
0.28
0.18
d)
R / nm
AuCN-2.0
Before
During
0.0 0.2 0.4 0.60
1
2
3
4
5
0.20
0.39
f)
R / nm
HAuCl4
AuCl
Figure 2.9. Phase-corrected |χ(R)| spectra of standards and Au/TS-1 catalysts. Samples are (a) Au-0.0, (b) Au-0.05, (c) AuCN-1.0, and (d) AuCN-2.0 at 298 K before reaction (dashed line) and 443 K during reaction (solid line). Standards are (e) gold foil (solid line) and Au2O3 (dashed line); (f) AuCl (solid line) and HAuCl4 (dashed line).
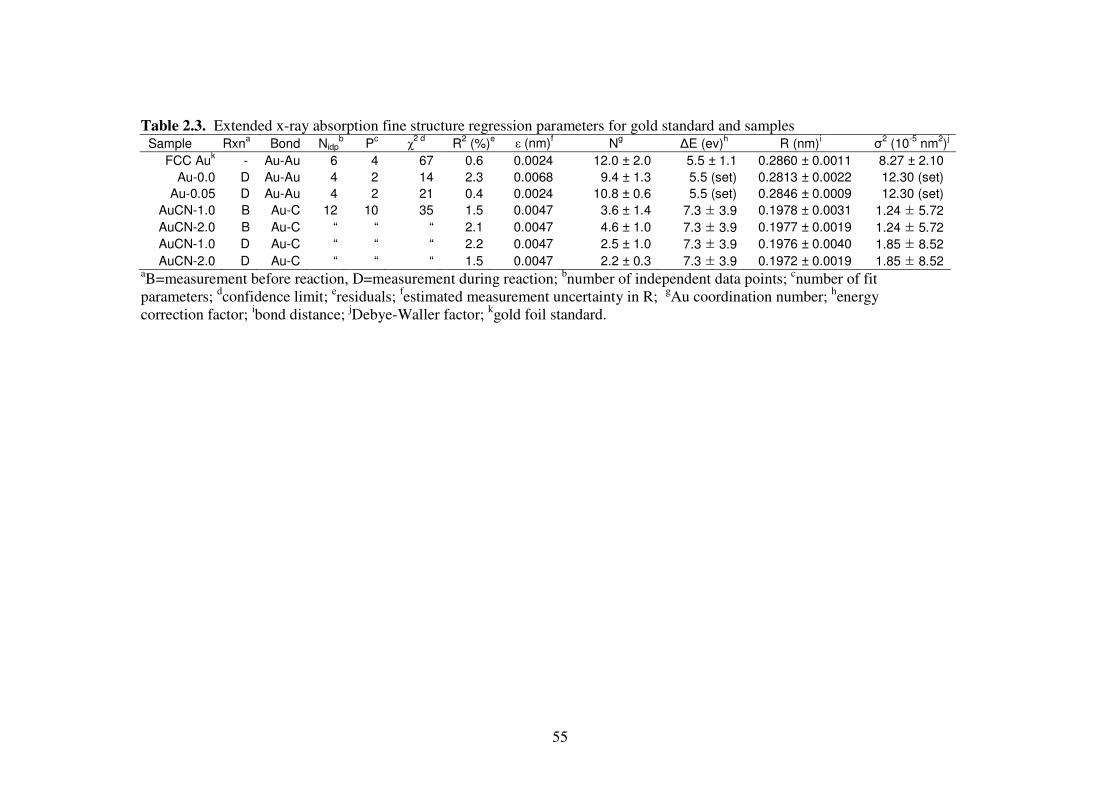
55
Table 2.3. Extended x-ray absorption fine structure regression parameters for gold standard and samples Sample Rxn
a Bond Nidp
b P
c χ
2 d R
2 (%)
e ε (nm)
f N
g ∆E (ev)
h R (nm)
i σ
2 (10
-5 nm
2)j
FCC Auk - Au-Au 6 4 67 0.6 0.0024 12.0 ± 2.0 5.5 ± 1.1 0.2860 ± 0.0011 8.27 ± 2.10
Au-0.0 D Au-Au 4 2 14 2.3 0.0068 9.4 ± 1.3 5.5 (set) 0.2813 ± 0.0022 12.30 (set)
Au-0.05 D Au-Au 4 2 21 0.4 0.0024 10.8 ± 0.6 5.5 (set) 0.2846 ± 0.0009 12.30 (set)
AuCN-1.0 B Au-C 12 10 35 1.5 0.0047 3.6 ± 1.4 7.3 ± 3.9 0.1978 ± 0.0031 1.24 ± 5.72
AuCN-2.0 B Au-C “ “ “ 2.1 0.0047 4.6 ± 1.0 7.3 ± 3.9 0.1977 ± 0.0019 1.24 ± 5.72
AuCN-1.0 D Au-C “ “ “ 2.2 0.0047 2.5 ± 1.0 7.3 ± 3.9 0.1976 ± 0.0040 1.85 ± 8.52
AuCN-2.0 D Au-C “ “ “ 1.5 0.0047 2.2 ± 0.3 7.3 ± 3.9 0.1972 ± 0.0019 1.85 ± 8.52 aB=measurement before reaction, D=measurement during reaction; bnumber of independent data points; cnumber of fit parameters; dconfidence limit; eresiduals; festimated measurement uncertainty in R; gAu coordination number; henergy correction factor; ibond distance; jDebye-Waller factor; kgold foil standard.
56
2.3.4 Extended x-ray absorption fine structure
The extended x-ray absorption fine structure (EXAFS) for the standards and
samples are presented as |χ(R)| functions (Fig. 2.9). Prior to reaction, the Au-0.0 and Au-
0.05 samples each have a narrow and intense peak at 0.18 nm and a wide feature at 0.38
nm, which is consistent with Au2O3 (Fig. 2.9, top right panel). During reaction, these
samples develop a modest feature at 0.27 nm followed by a smaller peak at 0.32 nm,
which is consistent with metallic gold. The AuCN-1.0 and AuCN-2.0 samples (Fig. 2.9,
center panels) have EXAFS spectra very different from Au-0.0 and Au-0.05. Both
AuCN-1.0 and AuCN-2.0 have strong, narrow features at 0.18 and 0.28 nm, which are
more intense before reaction than during reaction. The presence of two peaks of similar
intensity is not consistent with any of the standards tested (gold (0), gold (+1) chloride,
gold (+3) chloride, gold (+3) oxide) (Fig. 2.9, right panels).
The EXAFS parameters determined by ab initio curve fitting are presented in
Table 2.3. During reaction, the Au-0.0 sample has an Au-Au coordination number of 9.4
and an interatomic bond distance of 0.281 nm, while Au-0.05 has a coordination of 10.8
and bond distance of 0.285 nm. These values are less than those calculated for the gold
standard, which has coordination of 12 and bond distance of 0.286 nm. Before reaction,
the AuCN-1.0 and AuCN-2.0 samples have Au-C coordinations of 3.6 and 4.6,
respectively. During reaction, the Au-C coordination is reduced to 2.5 and 2.2. Before
and during reaction, both AuCN-1.0 and AuCN-2.0 have Au-C bond distances of 0.197-
0.198 nm.
57
2.4 Discussion
In this work a method was used reported in the literature [24,45] which was
claimed to form highly dispersed gold by leaching with cyanide solutions. The method
was applied to gold supported on the titanosilicate, TS-1, a catalytic system that is known
for the epoxidation of propylene with hydrogen/oxygen mixtures [5,6,7,8,9,13,14,15].
However, despite using a similar procedure (including a 2% sodium cyanide washing
solution) the results differed substantially, and instead of producing atomically dispersed
gold, precipitates of NaAu(CN)2 were obtained.
Transmission electron micrographs show TS-1 particles as round-edged
rectangular prisms approximately 300 to 1000 nm in size. Gold particles were found on
the exterior surfaces of the microporous TS-1 support and were primarily between 1 and
7 nm but extended to tens of nanometers for the cyanide treated samples (Fig. 2.1).
Cyanide treatment decreased the number of visible gold particles and increased their size.
The Au-0.0 sample has a narrow particle size distribution with a peak at 3.0 nm (Table
2.1). The Au-0.05 sample retains some small particles but has a broader distribution
centered around 10 nm. The AuCN-1.0 and AuCN-2.0 samples also have broad
distributions with substantial numbers of large particles. It is evident that the cyanide
treatment not only removes the smaller particles but also promotes growth of particles.
Electron microscopy shows that the large particles are not agglomerates of smaller
crystallites (Fig. 2.2). The interplanar distances and angles of the gold particles in the
AuCN-1.0 sample indicate these particles are gold (+1) cyanide (Fig. 2.3).
Extended x-ray absorption fine structure (EXAFS), to be discussed later,
confirms that the Au-0.0 and Au-0.05 samples start as gold (+3) oxide and are reduced to
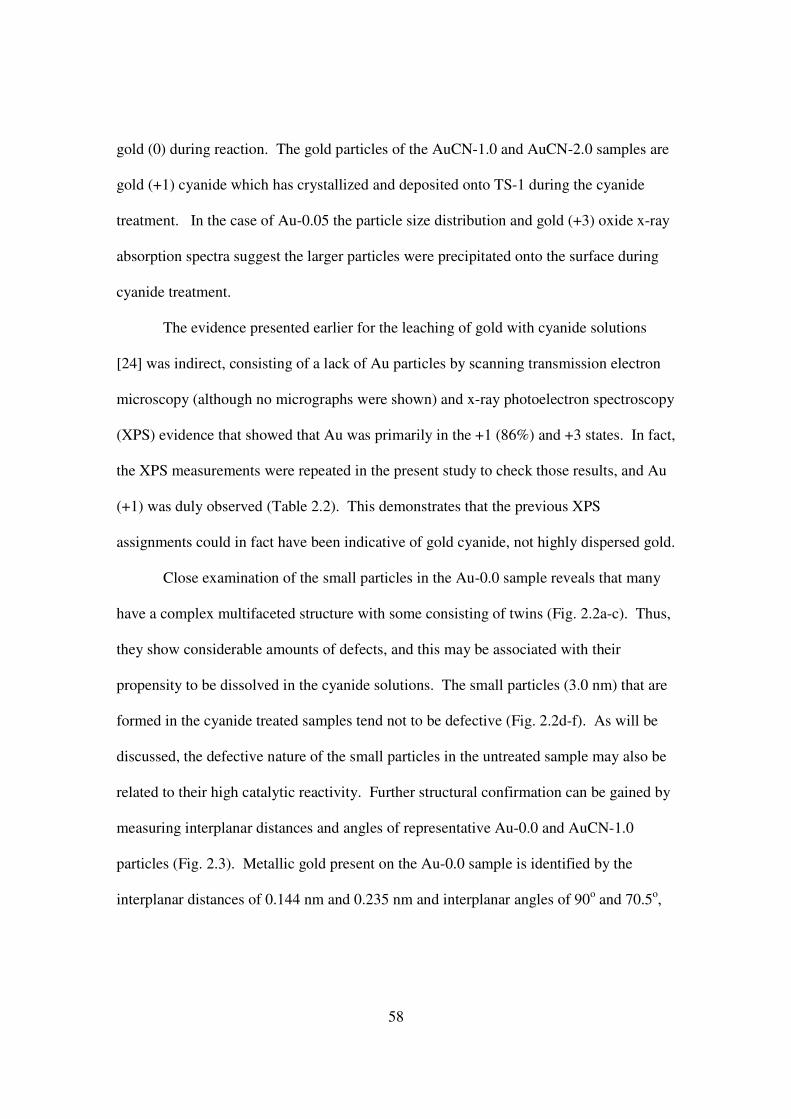
58
gold (0) during reaction. The gold particles of the AuCN-1.0 and AuCN-2.0 samples are
gold (+1) cyanide which has crystallized and deposited onto TS-1 during the cyanide
treatment. In the case of Au-0.05 the particle size distribution and gold (+3) oxide x-ray
absorption spectra suggest the larger particles were precipitated onto the surface during
cyanide treatment.
The evidence presented earlier for the leaching of gold with cyanide solutions
[24] was indirect, consisting of a lack of Au particles by scanning transmission electron
microscopy (although no micrographs were shown) and x-ray photoelectron spectroscopy
(XPS) evidence that showed that Au was primarily in the +1 (86%) and +3 states. In fact,
the XPS measurements were repeated in the present study to check those results, and Au
(+1) was duly observed (Table 2.2). This demonstrates that the previous XPS
assignments could in fact have been indicative of gold cyanide, not highly dispersed gold.
Close examination of the small particles in the Au-0.0 sample reveals that many
have a complex multifaceted structure with some consisting of twins (Fig. 2.2a-c). Thus,
they show considerable amounts of defects, and this may be associated with their
propensity to be dissolved in the cyanide solutions. The small particles (3.0 nm) that are
formed in the cyanide treated samples tend not to be defective (Fig. 2.2d-f). As will be
discussed, the defective nature of the small particles in the untreated sample may also be
related to their high catalytic reactivity. Further structural confirmation can be gained by
measuring interplanar distances and angles of representative Au-0.0 and AuCN-1.0
particles (Fig. 2.3). Metallic gold present on the Au-0.0 sample is identified by the
interplanar distances of 0.144 nm and 0.235 nm and interplanar angles of 90o and 70.5o,
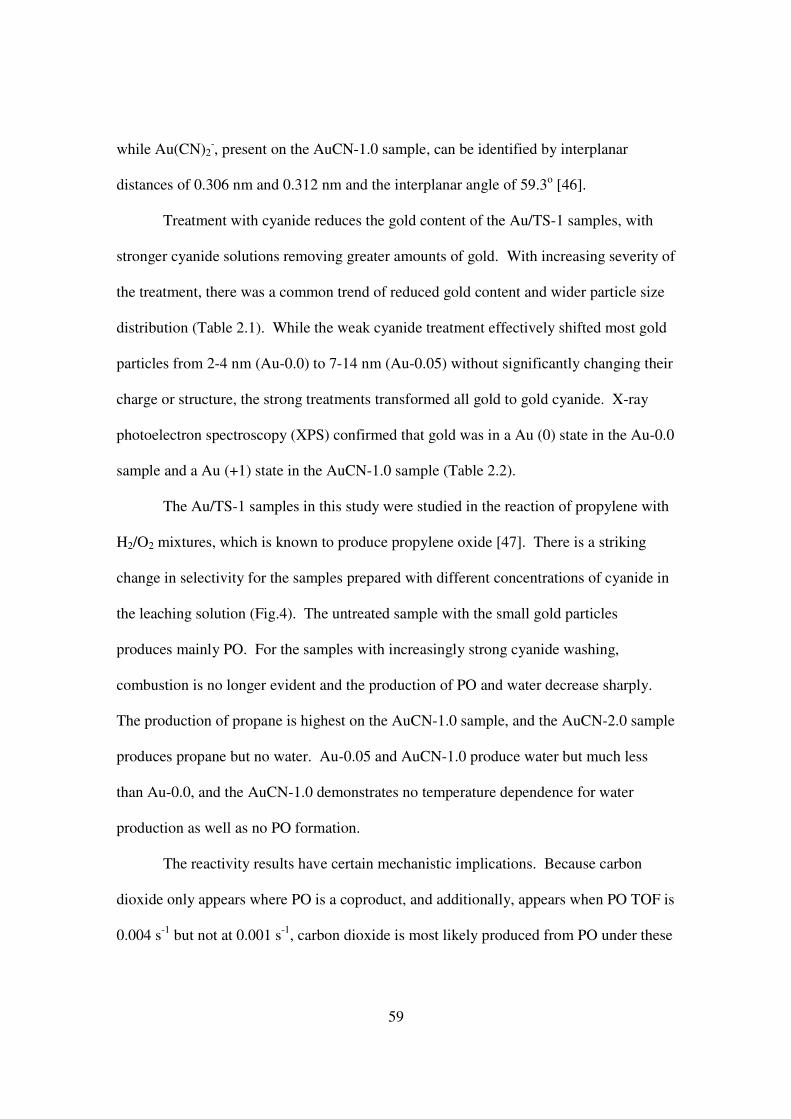
59
while Au(CN)2-, present on the AuCN-1.0 sample, can be identified by interplanar
distances of 0.306 nm and 0.312 nm and the interplanar angle of 59.3o [46].
Treatment with cyanide reduces the gold content of the Au/TS-1 samples, with
stronger cyanide solutions removing greater amounts of gold. With increasing severity of
the treatment, there was a common trend of reduced gold content and wider particle size
distribution (Table 2.1). While the weak cyanide treatment effectively shifted most gold
particles from 2-4 nm (Au-0.0) to 7-14 nm (Au-0.05) without significantly changing their
charge or structure, the strong treatments transformed all gold to gold cyanide. X-ray
photoelectron spectroscopy (XPS) confirmed that gold was in a Au (0) state in the Au-0.0
sample and a Au (+1) state in the AuCN-1.0 sample (Table 2.2).
The Au/TS-1 samples in this study were studied in the reaction of propylene with
H2/O2 mixtures, which is known to produce propylene oxide [47]. There is a striking
change in selectivity for the samples prepared with different concentrations of cyanide in
the leaching solution (Fig.4). The untreated sample with the small gold particles
produces mainly PO. For the samples with increasingly strong cyanide washing,
combustion is no longer evident and the production of PO and water decrease sharply.
The production of propane is highest on the AuCN-1.0 sample, and the AuCN-2.0 sample
produces propane but no water. Au-0.05 and AuCN-1.0 produce water but much less
than Au-0.0, and the AuCN-1.0 demonstrates no temperature dependence for water
production as well as no PO formation.
The reactivity results have certain mechanistic implications. Because carbon
dioxide only appears where PO is a coproduct, and additionally, appears when PO TOF is
0.004 s-1 but not at 0.001 s-1, carbon dioxide is most likely produced from PO under these
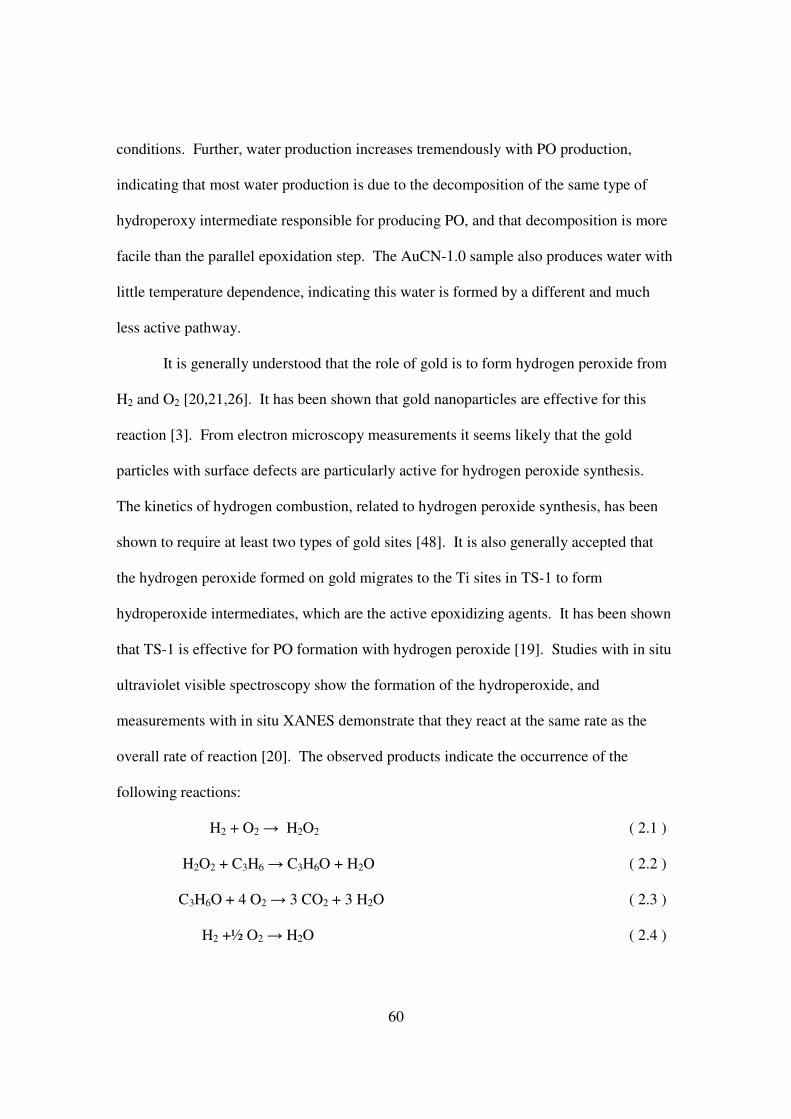
60
conditions. Further, water production increases tremendously with PO production,
indicating that most water production is due to the decomposition of the same type of
hydroperoxy intermediate responsible for producing PO, and that decomposition is more
facile than the parallel epoxidation step. The AuCN-1.0 sample also produces water with
little temperature dependence, indicating this water is formed by a different and much
less active pathway.
It is generally understood that the role of gold is to form hydrogen peroxide from
H2 and O2 [20,21,26]. It has been shown that gold nanoparticles are effective for this
reaction [3]. From electron microscopy measurements it seems likely that the gold
particles with surface defects are particularly active for hydrogen peroxide synthesis.
The kinetics of hydrogen combustion, related to hydrogen peroxide synthesis, has been
shown to require at least two types of gold sites [48]. It is also generally accepted that
the hydrogen peroxide formed on gold migrates to the Ti sites in TS-1 to form
hydroperoxide intermediates, which are the active epoxidizing agents. It has been shown
that TS-1 is effective for PO formation with hydrogen peroxide [19]. Studies with in situ
ultraviolet visible spectroscopy show the formation of the hydroperoxide, and
measurements with in situ XANES demonstrate that they react at the same rate as the
overall rate of reaction [20]. The observed products indicate the occurrence of the
following reactions:
H2 + O2 → H2O2 ( 2.1 )
H2O2 + C3H6 → C3H6O + H2O ( 2.2 )
C3H6O + 4 O2 → 3 CO2 + 3 H2O ( 2.3 )
H2 +½ O2 → H2O ( 2.4 )
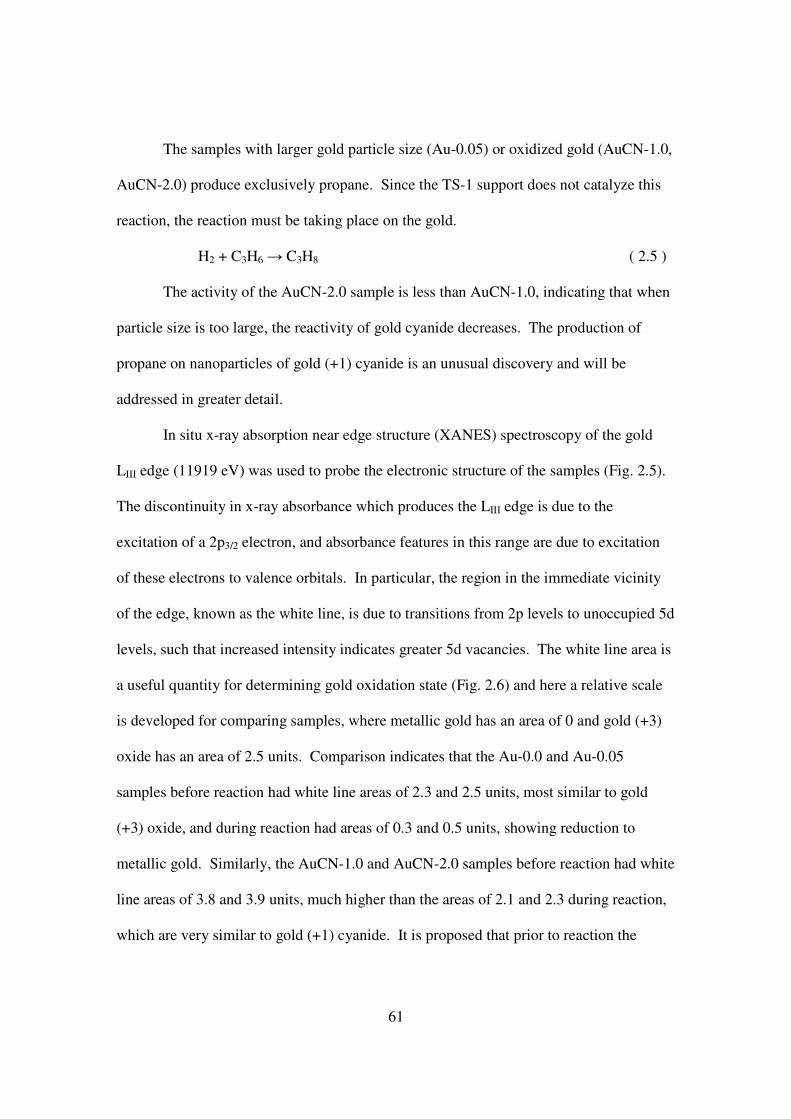
61
The samples with larger gold particle size (Au-0.05) or oxidized gold (AuCN-1.0,
AuCN-2.0) produce exclusively propane. Since the TS-1 support does not catalyze this
reaction, the reaction must be taking place on the gold.
H2 + C3H6 → C3H8 ( 2.5 )
The activity of the AuCN-2.0 sample is less than AuCN-1.0, indicating that when
particle size is too large, the reactivity of gold cyanide decreases. The production of
propane on nanoparticles of gold (+1) cyanide is an unusual discovery and will be
addressed in greater detail.
In situ x-ray absorption near edge structure (XANES) spectroscopy of the gold
LIII edge (11919 eV) was used to probe the electronic structure of the samples (Fig. 2.5).
The discontinuity in x-ray absorbance which produces the LIII edge is due to the
excitation of a 2p3/2 electron, and absorbance features in this range are due to excitation
of these electrons to valence orbitals. In particular, the region in the immediate vicinity
of the edge, known as the white line, is due to transitions from 2p levels to unoccupied 5d
levels, such that increased intensity indicates greater 5d vacancies. The white line area is
a useful quantity for determining gold oxidation state (Fig. 2.6) and here a relative scale
is developed for comparing samples, where metallic gold has an area of 0 and gold (+3)
oxide has an area of 2.5 units. Comparison indicates that the Au-0.0 and Au-0.05
samples before reaction had white line areas of 2.3 and 2.5 units, most similar to gold
(+3) oxide, and during reaction had areas of 0.3 and 0.5 units, showing reduction to
metallic gold. Similarly, the AuCN-1.0 and AuCN-2.0 samples before reaction had white
line areas of 3.8 and 3.9 units, much higher than the areas of 2.1 and 2.3 during reaction,
which are very similar to gold (+1) cyanide. It is proposed that prior to reaction the
62
AuCN-1.0 and AuCN-2.0 samples are primarily gold (+3) cyanide. As the white line is
due to the presence of vacant 5d orbitals, the white line area is indicative of oxidation
state only when comparing samples of similar electronic structure. It is not unexpected
that linear Au(CN)2- and tetrahedral Au2O3 have similar 5d vacancies, and similar white
line areas, despite gold oxidation states of +1 and +3, respectively. A simple
interpretation is that 5d electrons are promoted to orbitals of 6s character [49] in linear
and square planar Au(CN)X . In this interpretation the Au2O3 samples, including Au-0.0
and Au-0.05 before reaction, are in a [Xe] 4f14 5d8 6s0 state while gold (+1) cyanide is in
a [Xe] 4f14 5d8 6s2 state, such that both structures have a d-vacancy of 2. Further, the
AuCN-1.0 and AuCN-2.0 samples before reaction, indicated to be in a gold (+3) cyanide
state, [Xe]4f14 5d6 6s2, have a d-vacancy of 4 and, therefore, a larger white line area.
Trivially, metallic gold, including the Au-0.0 and Au-0.05 samples during reaction, are in
a [Xe] 4f14 5d10 6s1 state and have almost no d-vacancies.
The near edge region of the AuCN-1.0 and AuCN-2.0 samples show that, during
reaction, the white line was reduced and the post edge trough was increased (Fig. 2.7, left
and center panels), a difference that is also seen when comparing gold (+3) chloride to
gold (+1) chloride (Fig. 2.7, right panel), and further evidence that these samples are
reduced from Au (+3) to Au (+1) during reaction.
Close examination shows that the white line for these samples are split (Fig. 2.7,
left and center panels). A white line multiplet on the AuCN-1.0 and AuCN-2.0 samples
exists only before pretreatment. A core hole effect, where core-valance interaction
allows core electron vacancies to reduce degeneracy in valance electrons, is precluded in
gold LIII excitations due to the energy gap and charge screening of 2p and 5d shells [50].
63
Cyanide is a strong field ligand and a gold cyanide compound would be in a low spin
state. A possibility was that the observed doublet was due to multiplet splitting, and this
was investigated by carrying out density functional theory (DFT) calculations on square-
planar Au(CN)4-, square-planar AuCl4
-, and linear Au(CN)2-; specifically, the energy
difference in the crystal field split of d-orbitals was examined (Fig. 2.8). For AuCl4- this
was a 14.3 eV (b1g→eg), for Au(CN)2- this was 0.79 eV (πg→σg), and for Au(CN)4
- this
was 3.8 eV (b1g→b2g). The large energy gap in the chloride complex favors transitions
to the lowest level and produces no doublet, while the small gap in the Au(CN)2- complex
is below the energy resolution of XANES (1 eV) and results in a single line. The gap in
the Au(CN)4- complex, however, matches the energy split. The presence of these
nondegenerate orbitals for gold (+3) cyanide is offered as a plausible reason for this gold
LIII multiplet.
Further evidence regarding the character of these samples before and during
reaction is provided by extended x-ray absorption fine structure (EXAFS). Bulk gold has
a face centered cubic (FCC) structure (12-fold coordination) and a characteristic peak at
0.27 nm due to Au-Au nearest neighbors (Fig 2.9). Gold (+3) oxide, which has an
orthorhombic structure with distorted tetrahedral gold centers (4-fold oxygen
coordination) [51] has a sharp peak at 0.18 nm due to Au-O coordination and a wide
feature at 0.36 nm. Both gold (+1) chloride (bent) and gold (+3) chloride (square planar)
[41] have sharp Au-Cl features at 0.20 nm and a wider feature at 0.39 nm due to a Au-Au
second shell. The difference in R position for the |χ(R)| feature of Au-O (0.18 nm), Au-
Cl (0.20 nm), and Au-Au (0.27 nm) is large enough that they can be readily differentiated.
The intensity of each first-shell |χ(R)| feature is proportional to the coordination of Au to
64
that specific absorbing atom; this can be seen for Au-Cl as the intensity of the 0.20 nm
peak of 4-fold gold (+3) chloride is twice that of 2-fold gold (+1) chloride.
Fig. 2.9 shows that the Au-0.0 and Au-0.05 samples before reaction each have a
narrow peak at 0.18 nm and a wide feature at 0.36 nm, confirming that these samples are
gold (+3) oxide. During reaction, these samples develop the wide 0.27 nm Au-Au feature
of metallic gold. The AuCN-1.0 and AuCN-2.0 samples, both before and during reaction,
show features at 0.18 and 0.28 nm, which are assigned to Au-C and Au-N distances,
respectively. The near-equal intensities of the first and second shells are characteristic of
photoelectron focusing in a linear molecule [52], so that the AuCN-1.0 and AuCN-2.0
species before and after reaction can be identified as Au(CN)X. The reduction of
intensity during pretreatment indicates a significant decrease in coordination. Gold (+1)
cyanide commonly exists as linear Au(CN)2- anions, which form rhombohedral stacks
with alternating layers of cations [42], although a -Au-C-N-Au-C-N- crystal structure
may also exist [53,54]. Ab intio EXAFS fitting (Table 2.3) indicates a coordination of
Au-C of 4 before reaction and 2 during reaction, which provides additional evidence that
AuCN-1.0 and AuCN-2.0 are in a gold (+3) cyanide state before reaction and a gold (+1)
cyanide state during reaction.
It is generally agreed that neutral gold nanoparticles supported on TS-1 produce a
hydroperoxide intermediate responsible for propylene oxidation [55]. The hydrogenation
of crotonaldehyde on Au/Fe2O3 is believed to occur on metallic gold, based on XANES
edge measurements before reaction, but the signal was extremely low and could not be
used to rule out oxidized Au in the periphery of the 5 nm particles [56]. Indeed, Au on a
less reducible Al2O3 support was found to be less active. An early study on the
65
hydrogenation of propylene on Au/SiO2 and Au/MgO found good activity only when the
sample was exposed to molecular oxygen, suggesting that oxidized gold was active for
hydrogenation. Isotopic exchange between 16O2 and 18O2 did not occur, indicating the
formation of adsorbed peroxidic oxygen [57].
Here it is demonstrated that gold (+1) cyanide nanoparticles supported on TS-1
produce propane and do not oxidize propylene. Gold (+1) cyanide as a nanoscale
heterogeneous hydrogenation catalyst is novel, but catalytic behavior of Au (+1)
nanoparticles has been established in the literature. Supported nanoscale gold in an
oxidized state was found to be active for CO oxidation [58], selective oxidation of
alcohols [59], and water gas shift. Supported gold nanoparticles have not been as
extensively studied as a hydrogenation catalyst [60]. Gold in a metallic state was found
active for the selective hydrogenation of 1,3-butadiene [55] and acetylene [61], along
with the reduction of NOX [62]. A DFT study of atomic gold supported on zirconia
indicated Au (+1) was active for 1,3-butadiene hydrogenation [63]. An experimental
study of Au/ZrO2 for 1,3-butadiene hydrogenation and CO oxidation found that gold with
a higher ratio of Au (+3)/Au (0), as determined by Au 4f XPS, was more active for both
hydrogenation and oxidation [64]. A study of an atomically dispersed Au complex found
good activity in ethylene hydrogenation and evidence from XANES of a Au (+3) species
[65]. An initial report [66] for epoxidation of propylene on Au/TiO2 found the formation
of propane on small Au particles and suggested that oxidized gold in the periphery of the
particles was responsible for the hydrogenation. It was noted that the gold had platinum-
like behavior, a view that is echoed here, with the specification that it is Au (+1).
66
However, none of these studies have clearly demonstrated a significant relationship
between gold charge and hydrogenation /oxidation selectivity.
2.5. Conclusions
Treatment of Au/TS-1 catalysts with cyanide selectively removed small gold
particles at low cyanide concentration and formed gold (+3) cyanide at high cyanide
concentration. Nanoscale metallic gold was found to be active for propylene epoxidation
and hydrogenation, as well as combustion of hydrogen. Larger gold particles (>4.5 nm)
were less active for all reactions and had higher hydrogenation selectivity. Nanoscale
gold (+1) cyanide was very active for hydrogenation, with significantly reduced hydrogen
combustion and absolutely no propylene oxidation. Larger gold (+1) cyanide particles
were less active for all reactions. It is hoped that the discovery will promote further
studies in controlling oxidation/hydrogenation activity with gold charge.
2.6 References
[1] M. Haruta, Nature 437 (2005) 1098.
[2] G. J. Hutchings, J. Catal. 96 (1985) 292.
[3] J.K. Edwards, B. Solsona, E. Ntainjua, A.E. Carley, A.A. Herzing, C.J. Kiely, G.J.
Hutchings, Science 323 (2009) 1037.
[4] A. Wittstock, V. Zielasek, J. Biener, C.M. Friend, M. Baumer, Science 15 (2010)
319.
[5] J. Lu, X. Zhang, J.J. Bravo-Suárez, S. Tsubota, J. Gaudet, S.T. Oyama, Catal.
Today 123 (2007) 189
67
[6] J. Lu, X. Zhang, J.J. Bravo-Suárez, T. Fujitani, S.T. Oyama, Catal. Today 147
(2007) 186.
[7] J. Lu, X. Zhang, J.J. Bravo-Suárez, K.K. Bando, T. Fujitani, S.T. Oyama,
J. Catal. 250 (2007) 350
[8] J.J. Bravo-Suárez, J. Lu, C.G. Dallos, T. Fujitani, S.T. Oyama, J. Phys. Chem. C
111 (2007) 17427.
[9] S.T. Oyama, X. Zhang, J. Lu, Y. Gu, T. Fujitani, J. Catal. 257 (2008) 1.
[10] J.F. Ng, Y. Nie, G.K. Chuah, S. Jaenicke, J. Catal. 269 (2009) 302.
[11] A.S.K. Hashmi, G.J. Hutchings, Angew. Chem. Int. Ed. 45 (2006) 7896.
[12] S. T. Oyama, in S.T. Oyama (Ed.), Mechanisms in Homogeneous and
Heterogeneous Epoxidation, Elsevier, Amsterdam, 2008, p. 1.
[13] A.K. Sinha, S. Seelan, S. Tsubota, M. Haruta, Top. Catal. 29 (2004) 95.
[14] T. Alexander Nijhuis, T. Visser, B. M. Weckhuysen, Angew. Chem. Int. Ed. 44
(2005) 1115.
[15] E. Stangland, B. Taylor, R.P. Andres, W.N. Delgass, J. Phys. Chem. B 109 (2005)
2321.
[16] W. Cheng, X. Wang, G. Li, X. Guo, B. Du, Catal. Lett. 95 (2004) 185.
[17] X. Liu, X. Wang, X. Guo, G. Li, Catal. Today 93-95 (2004) 505.
[18] G. F. Thiele, E. Roland, J. Molec. Catal. A 117 (1997) 351.
[19] S. Bordiga, F. Bonino, C. Prestipino, A. Damin, C. Lamberti, Phys. Chem. Chem.
Phys. 9 (2007) 4854.
[20] J.J. Bravo-Surez, K.K. Bando, J. Lu, M. Haruta, T. Fujitani, T. Oyama, J. Phys.
Chem. C 112 (2008) 1115.
68
[21] J.J. Bravo-Suárez, K.K. Bando, T. Fujitani, S.T. Oyama, J. Catal. 257 (2008) 32.
[22] D.H. Wells Jr., W.N. Delgass, K.T. Thomson, J. Catal. 225 (2004) 69.
[23] A.M. Joshi, W.N. Delgass, K.T. Thomson, J. Phys. Chem. B 110 (2006) 16439.
[24] Q. Fu, W. Deng, H. Saltzburg, M. Flytzani-Stephanopoulos, Appl. Catal. B 56
(2005) 57.
[25] J.T. Calla, R.J. Davis, Catal. Lett. 99 (2005) 21.
[26] S. Tsubota, D.A.H. Cunningham, Y. Bando, M. Haruta, Stud. Surf. Sci. Catal. 91
(1995) 227.
[27] D.S. Su, T. Jacob, T.W. Hansen, D. Wang, R. Schlogl, B. Freitag, S. Kujawa,
Angew. Chem. Int. Ed. 47 (2008) 5005.
[28] T. Kubota, N. Hosomi, K.K. Bando, T. Matsui, Y. Okamoto, Phys. Chem. Chem.
Phys. 5 (2003) 4510.
[29] B. Ravel, M. Newville, J. Synchrotron Rad. 12 (2005) 537.
[30] K.H. Chae, S.M. Jung, Y.S. Lee, C.N. Whang, Y. Jeon, M. Croft, D. Sills, P.H.
Ansari, K. Mack, Phys. Rev. B 53 (1996) 10328.
[31] Y.-S. Lee, K.-Y. Lim, Y.-D. Chung, C.-N. Whang, Y. Jeon, Surf. Interface Anal.
30 (2000) 475.
[32] G.K. Upadhyaya, G. Shah, S.N. Gupta, Physica B 208-209 (1995) 297.
[33] M. Newville, P. Livins, Y. Yacoby, E.A. Stern, J.J. Rehr, Phys. Rev. B 47 (1993)
14126.
[34] K. Asakura, in: Y. Iwasawa (Ed.), X-ray Absorption Fine Structure for Catalysts
and Surfaces, World Scientific, River Edge, New Jersey, 1996, p. 34.
69
[35] C. Kittel, Introduction to Solid State Physics, eighth ed., John Wiley & Sons,
Hoboken, New Jersey, 2005, p. 20.
[36] S.J. Hibble, A.C. Hannon, S.M. Cheyne, Inorg. Chem. 42 (2003) 4724.
[37] B. Ravel, J. Synchrotron Rad. 8 (2001) 314-316
[38] J.J. Rehr, R.C. Albers, Rev. Mod. Phys. 72 (2000) 621-654.
[39] A. L. Ankudinov, B. Ravel, J. J. Rehr, S. D. Conradson, Phys. Rev. B. 58 (1998)
7565.
[40] J. Prakash, M.P. Hemkar, J. Phys. Soc. Japan 34 (1973) 1583.
[41] E.S. Clark, D.H. Templeton, C.H. MacGillavry, Acta Cryst. 11 (1958) 284.
[42] A. Rosenzweig, D.T. Cromer, Acta Cryst. 12 (1959) 709.
[43] S.G. Kim, Y.-F. Hu, Y.M. Yiu, T.K. Sham, J. Electron. Spectrosc. Relat. Phenom.
144-147 (2005) 811.
[44] A. Pantelouris, G. Küper, J. Hormes, C. Feldmann, M. Jansen, J. Am. Chem. Soc.
117 (1995) 11749.
[45] Q. Fu, H. Saltsburg, M. Flytzani-Stephanopoulos, Science 301 (2003) 935.
[46] R.A. Penneman, E. Staritzky, L.H. Jones, J. Am. Chem. Soc. 78 (1956) 62.
[47] B. Taylor, J. Lauterbach, G.E. Blau, W.N. Delgass, J. Catal. 242 (2006) 142.
[48] D.G. Barton, S.G. Podkolzin, J. Phys. Chem. B 109 (2005) 2262.
[49] B.R. Orton, C.M. Stanton, N.A. Gulley, D.A. Vorsatz, R. Manaila-Devenyi, J.
Non-Cryst. Solids 156-158 (1993) 133.
[50] F. de Groot, Coord. Chem. Rev. 249 (2005) 31.
[51] P.G. Jones, H. Rumpel, E. Schwarzmann, G.M. Sheldrick, Acta Cryst. B 35
(1979) 1435.
70
[52] K.H. Hallmeier, S. Sauter, R. Szargan, Inorg. Chem. Comm. 4 (2001) 153.
[53] G.A. Bowmaker, B.J. Kennedy, J.C. Reid, Inorg. Chem. 37 (1998) 3968.
[54] A.C. Hannon, Nucl. Instrum. Methods Phys. Res., Sect. A 551 (2005) 88.
[55] A. Hugon, L. Delannoy, C. Louis, Gold Bull. 41 (2008) 127.
[56] J. Lenz, B.C. Campo, M. Alvarez, M.A. Volpe, J. Catal. 267 (2009) 50.
[57] S. Naito, M. Tanimoto, J. Chem. Soc., Chem. Commun. (1998) 832.
[58] J.C. Fierro-Gonzalez, J. Guzman, B.C. Gates, Top. Catal. 44 (2007) 103.
[59] A. Abad, P. Concepción, A. Corma, H. García, Angew. Chem. Int. Ed. 44 (2005)
4069.
[60] S.A. Blankenship, A. Rokicki, J.A. Perkins, US Patent 6 936 568 (2005), to Sud-
Chemie Inc.
[61] Jifei Jia, Kenta Haraki, Junko N. Kondo, Kazunari Domen, and Kenzi Tamaru, J.
Phys. Chem. B 104 (2000) 11153.
[62] G. C. Bond, D. T. Thompson, Catal. Rev. Sci. Eng. 41 (1999) 319.
[63] Z.-P. Liu, C.-M. Wang, K.-N. Fan, Angew. Chem. 118 (2006) 7019.
[64] X. Zhang, H. Shi, B.-Q. Xu, Catal. Today 122 (2007) 330.
[65] J. Guzman, B.C. Gates, J. Catal. 226 (2004) 111. [66] T. Hayashi, K. Tanaka, M. Haruta, J. Catal. 178 (1998) 566.
71
Chapter 3
Raman spectroscopic adsorption study
of TS-1 and Au/TS-1 under propylene
3.1 Introduction
The Au/TS-1 catalytic system described in Chapter 2 has been studied extensively
for propylene oxide (PO) production, with limited studies toward propane production.
Several in situ spectroscopic studies have been used to investigate adsorbed species on
Au/TS-1 and similar titanosilicate-supported gold catalysts such as Au/Ti-TUD,
including Ti K-edge x-ray adsorption near edge spectroscopy (XANES) [1] and diffuse
reflectance ultraviolet-visible absorption spectroscopy (UV-VIS) [2,3]. Raman
spectroscopy (442 nm excitation) has been utilized to demonstrate the formation of a
peroxide O-O band at 875 cm-1 when TS-1 was placed in contact with a H2O2/H2O
mixture [4]. However, in situ Raman spectroscopy of Au/TS-1 under gas-phase
conditions similar to reaction has not previously been investigated.
The TS-1 UV-VIS spectrum is noted for high absorption in the 200-300 nm range,
due primarily to a band near 220 nm [5] which is generally agreed to be a ligand-to-metal
charge-transfer (LMCT) of a tetrahedral TiO4 cluster within the silicalite framework [6].
The use of a UV excitation laser generates a more intense and complex Raman spectrum
due to resonance [7], although many TS-1 features can still be seen at much lower
excitation energies.
72
A previous in situ Raman spectroscopic study demonstrated how analysis of C-H
features in the range of 3100-2800 cm-1 for propylene adsorbed on ZnO could be utilized
to determine the adsorption mode, with the determination of an anionic C3 bonding mode
over an anionic π-bonding mode [8].
In this study the excitation energy of 514.5 nm was found to be sufficient to
generate TS-1 framework bands but low enough to not risk photodegredation of adsorbed
alkyl hydrocarbons at the high photon flux necessary for Raman spectroscopy. A low-
temperature ozone surface treatment was found to reduce surface fluorescence.
Application of propylene produced an array of Raman alkene features. Although
adsorbed oxygen and hydrogen were not directly observed, application of these gases
resulted in reduction in intensity of these alkene features. Density functional theory
(DFT) models of propylene indicated that π-adorbed propylene would be identical to gas-
phase propylene, except for certain out-of-plane vibrations presenting at higher energy
than gas phase propylene. The experimental Raman spectrum matched the predicted π-
adsorbed propylene features more closely than the predicted gas-phase propylene features.
Propylene isotherms of TS-1 and Au/TS-1 were found to conform to the Langmuir model,
and experimentally-derived propylene uptake values were used to scale the intensity of a
characteristic 1648 cm-1 C=C propylene peak to coverage of titanium.
3.2 Experimental
3.2.1 Synthesis and preparation
TS-1 support (atom Ti/Si = 1/100) and Au/TS-1 catalyst (atom Au/Ti/Si =
0.3/1/100) were synthesized in the manner described in Section 2.2.1 of this work. After
73
synthesis, the Au/TS-1 samples were further treated by placing each sample in a
differential flow reactor (0.5 g catalyst, 5/5/5/35 cm3NTP min-1 H2/O2/C3H6), heating to
473 K over 6 h, and holding 2 h to reduce the gold.
3.2.2 Laser Raman spectroscopy
TS-1 and Au/TS-1 were analyzed using in situ laser Raman spectroscopy. The
laser Raman spectrometer consisted of a reactor cell in which the sample was held,
positioned so that the surface of the sample can be exposed to an excitation laser and light
emitted by the sample can be captured by an optical array.
A gas delivery system consisting of mass flow controllers (Brooks 5850E and
5850C, nominal range ~1-100 cm3NTP min-1) metered and mixed feed gases (hydrogen,
Airgas ultra pure carrier (UPC) grade; oxygen, Airgas research grade; propylene, Airgas
99.99%; helium, Airgas UPC grade). Ozone was provided by a corona discharge ozone
generator (Yanco Ozone Services OL80) attached to the oxygen feed line.
The reactor used for in situ Raman spectroscopy consisted of a quartz glass cell
with ports to allow reactant gases to enter and effluent to exit. The catalyst was a powder
sample that has been pressed into a 20 mm diameter self-supporting sample wafer, and
was held at the end of a rod which positions the flat catalyst surface at a 45o angle to both
the excitation laser and the lenses which collect the scattered laser light. During
experiments, the sample was rotated at 1500 revolutions per minute by an electric motor
(Micropuma 415A, PentaPower controller) at the other end of the rod which supported
the sample; this prevented localized heating by the laser and aided convection within the
reactor. The reactor was surrounded by a resistance heater and a temperature probe was
inserted at a point near where the catalyst sample was held, and temperature was
74
controlled with a RKC REX-P24 temperature controller. As the temperature probe was
not in direct contact with the sample, sample temperature was measured using an infrared
thermometer calibrated to the thermal emissivity of the sample (Fisher Scientific
Traceable, 15-077-967). The conical body of the reactor cell was constructed of 1.5 mm
thick high-temperature quartz glass, while the window which exposed the sample to the
laser and the collection optics consisted of flat, circular optical glass 51 mm in diameter
and 1.5 mm thick (GE 124, Thermal Glass Products) that was perpendicular to the sample
and 10 mm from its surface.
Excitation light was provided by a Lexel 95 Ar-ion continuous wave laser tuned
to 514.5 nm with a maximum output over 500 mW (Class IV), although all experiments
were done at 100-400 mW. The laser was directed via mirrors to a SPEX 1450 Tunable
Excitation Filter to removes UV plasma emissions, and then into a modified SPEX 1439
Sample Compartment to direct the beam upwards to pass through the reactor cell window
and strike the catalyst sample.
After striking the sample, the scattered light (Raman and Rayleigh) was captured
and collimated by a collecting lens (Thorlabs AC127-030-A1 Visible Achromatic
Doublet, 12.7mm, f=30mm, BK7-SF2, f/2.4), sent through a filter to remove Rayleigh
scattering (Kaiser Optical Systems SuperNotch Plus, HSPF 5380, 1.0 in.), and then to a
focusing lens to focus the light onto the monochromater aperture (Thorlabs AC127-050-
A1 Visible Achromatic Doublet, 12.7mm, f=50mm, BK7-SF2, f/4).
The monochromater was a SPEX 500M with electronics driven by a SPEX MSD2
controller. The light entering the aperture passed through a shutter and an adjustable
width slit, and then spread onto a focusing mirror. This mirror focused the light onto a
75
diffraction grating, which subsequently reflected it off a collimating mirror and out the
front port to the CCD. The spectrometer had a focal length is 0.5 meters and a f/4
aperture, while the diffraction grating was 110x100mm with 1200 grooves mm-1 and
yielded wavelength dispersion of 1.6 nm mm-1 with 0.02 nm resolution. When properly
focused the CCD was illuminated with a wavelength spread of 42.5 nm, or a Raman shift
range of approximately 1400 cm-1. To allow alignment of the laser, sample, and
collection optics, a Metrologic HeNe laser (632.8 nm) was permanently mounted on the
side port of the monochromater.
The detector was a liquid nitrogen cooled CCD head and electronics package
(SPEX CCD-1024x256-OPEN-3LS, Horiba Jobin Yvon Symphony) which
communicated with a PC via an Ethernet cable. The CCD chip was 26.6 x 6.7 mm and
segmented into 1024 x 256 pixels, so that each pixel is 26 microns. The CCD was
supported by an optical extension tube from the monochromater and by two vertical
stages beneath the body of the camera, and it was focused so that the CCD chip is in the
same optical plane as the entrance port.
To reduce surface fluorescence, each sample was surface-treated by exposing it to
1.5/8/40 cm3NTP min-1 O3/O2/He, heated to 473oC at 10 K min-1, and held 2 h, except
where indicated otherwise. The gold on the Au/TS-1 samples was activated as indicated
in Section 3.2.1 prior to ozone treatment. Measurements were taken with the
spectrometer aperture open 2 mm vertically and 0.2 mm horizontally. Each spectral
image was made using between 3 and 30 60 second exposures, with 10 scans typical. An
Excel macro was used to remove electronic noise from each spectra, average the spectra,
and convert the x-axis from horizontal position (pixel) to Raman shift (cm-1). This
76
conversion was facilitated by a calibration formula determined by the position of the
doublet of a mercury vapor lamp at 577 and 579 nm. A calibration test was made by
measuring the positions of 10 bands of ortho-MoO3, indicating a maximum deviation
from literature values [9] of ±2 cm-1.
3.2.3 Computational molecular modeling
To aid in the study of the experimental results, propylene models were developed,
which allowed the simulation of Raman frequencies of propylene in the gas phase and
bound to a titanium site. Rough models of propylene and titanium hydroxide were
generated using ACD/ChemSketch 8.17. These models were optimized and Raman
frequencies generated at the B3LYP/6-311+G(d,p) level using Gaussian03 on a SGI
ALTIX 3700 supercluster. Conversion between connection table format (CTF) molfile
and Gaussian XYZ format, and generation of Raman spectra from Gaussian output, were
facilitated using bash scripts written for this purpose.
3.2.4 Temperature programmed desorption
The TS-1 and Au/TS-1 samples were characterized using temperature
programmed desorption (TPD) of hydrogen, oxygen, and propylene at 343 K, 393 K, and
443 K using a BEL-CAT-32 flow system. In a typical experiment, 35 mg of the sample
was placed in a quartz tube and heated in 30 cm3NTP min-1 carrier gas (nitrogen for
hydrogen desorption experiments, otherwise helium) to 573 K over 0.5 h and held 2 h to
clean the surface. The sample was cooled to adsorption temperature, and 5% of the test
gas in the carrier gas was introduced to the sample for 1 h, followed by a purge with
carrier for 1 h. The samples were then heated from adsorption temperature to 800 K at a
rate of 5 K min-1. Gases used were propylene (Takachiho Chemical, >99.8%), oxygen
77
(Tomoe Shokai, >99.5%) helium (Suzuki Shokan, >99.999%) and hydrogen (Shimadzu
OPGU-2100S hydrogen generator, >99.99%). A thermal conductivity detector (TCD)
cell downstream of the sample was used to determine the concentration of test gas
leaving the sample. The TCD cell was calibrated by flowing pure test gas and to
determine a sensitivity factor SF (mV-1). The area of the desorption peaks on a chart of
TCD signal (mV) vs. time (s) was determined (A [=] mV s) and was converted to uptake
using the sensitivity factor, the molar flowrate of the carrier (n), and the sample mass (n)
in Eqn. 3.1.
Uptake [µmol g-1] = (Area [mV s]) (n [µmol s-1]) (SF [mV-1]) / (m [g]) ( 3.1 )
3.2.5 Propylene uptake
Propylene uptake for TS-1 and Au/TS-1 at 343 K was also determined using a
chemisorption method. In this method, 0.5 g of the sample was loaded into a quartz tube
and heated in carrier gas (50 cm3NTP min-1 He, Airgas, ultra pure carrier grade) to 573 K
over 1 h, held 1 h, and then cooled to 443 K. Propylene (Airgas, 99.99%) was injected
into the reactor every 60 s in discrete pulses of 4.49 µmol while the effluent was
measured with a quadrupole mass spectrometer (AMETEK Dycor MA100MF).
Propylene which was not adsorbed by the sample was observed as spikes on the m/z = 41
channel, and pulses were continued until these spikes were uniform, indicating saturation
of the sample. A chart of mass spectrometer signal vs. time was recorded (Dell Optiplex
GX1 running LABTECH Notebook). The area of each peak was integrated (A [=] torr s)
and the saturation (uniform) peaks were averaged (Asat). The propylene uptake was thus
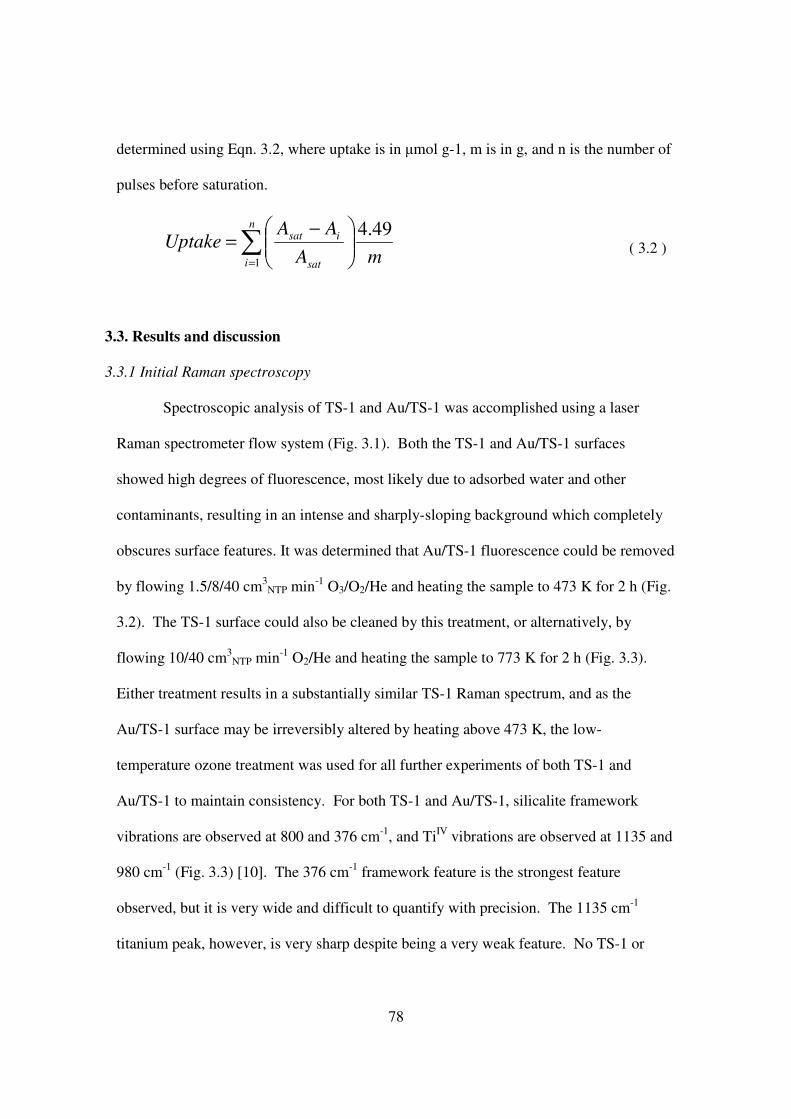
78
determined using Eqn. 3.2, where uptake is in µmol g-1, m is in g, and n is the number of
pulses before saturation.
∑=
−=
n
i sat
isat
mA
AAUptake
1
49.4 ( 3.2 )
3.3. Results and discussion
3.3.1 Initial Raman spectroscopy
Spectroscopic analysis of TS-1 and Au/TS-1 was accomplished using a laser
Raman spectrometer flow system (Fig. 3.1). Both the TS-1 and Au/TS-1 surfaces
showed high degrees of fluorescence, most likely due to adsorbed water and other
contaminants, resulting in an intense and sharply-sloping background which completely
obscures surface features. It was determined that Au/TS-1 fluorescence could be removed
by flowing 1.5/8/40 cm3NTP min-1 O3/O2/He and heating the sample to 473 K for 2 h (Fig.
3.2). The TS-1 surface could also be cleaned by this treatment, or alternatively, by
flowing 10/40 cm3NTP min-1 O2/He and heating the sample to 773 K for 2 h (Fig. 3.3).
Either treatment results in a substantially similar TS-1 Raman spectrum, and as the
Au/TS-1 surface may be irreversibly altered by heating above 473 K, the low-
temperature ozone treatment was used for all further experiments of both TS-1 and
Au/TS-1 to maintain consistency. For both TS-1 and Au/TS-1, silicalite framework
vibrations are observed at 800 and 376 cm-1, and TiIV vibrations are observed at 1135 and
980 cm-1 (Fig. 3.3) [10]. The 376 cm-1 framework feature is the strongest feature
observed, but it is very wide and difficult to quantify with precision. The 1135 cm-1
titanium peak, however, is very sharp despite being a very weak feature. No TS-1 or
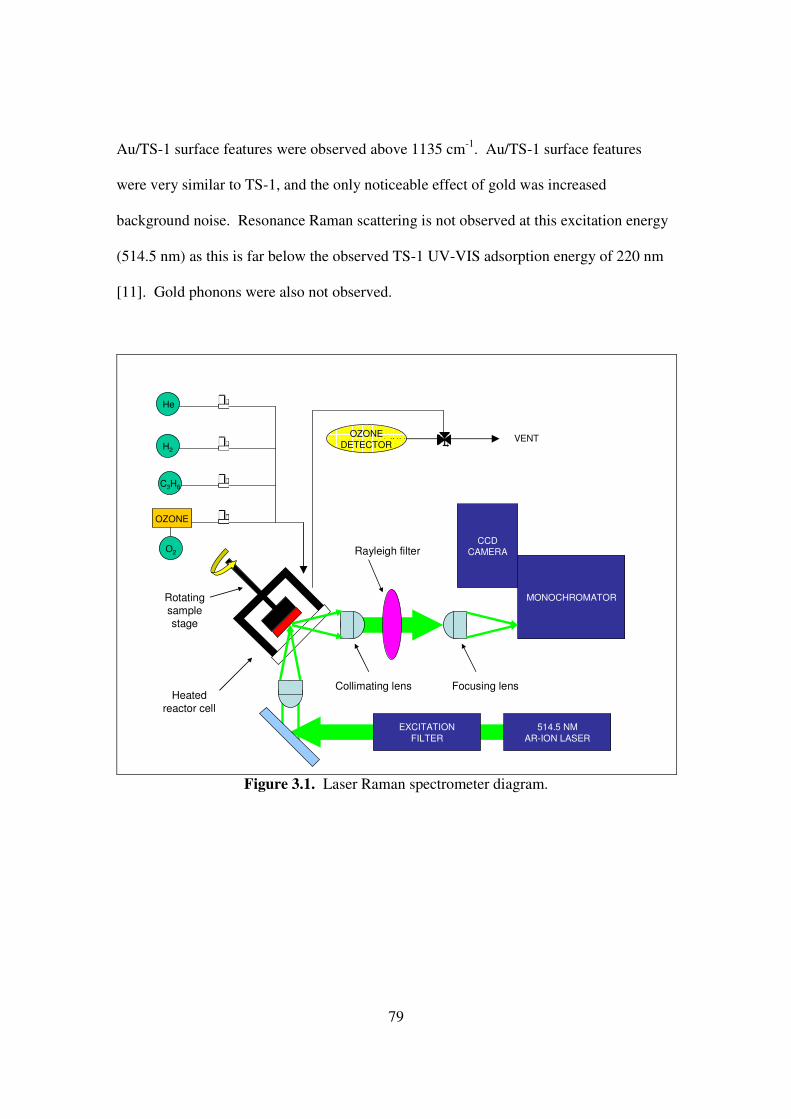
79
Au/TS-1 surface features were observed above 1135 cm-1. Au/TS-1 surface features
were very similar to TS-1, and the only noticeable effect of gold was increased
background noise. Resonance Raman scattering is not observed at this excitation energy
(514.5 nm) as this is far below the observed TS-1 UV-VIS adsorption energy of 220 nm
[11]. Gold phonons were also not observed.
H2
O2
C3H6
He
OZONE
OZONE
DETECTORVENT
EXCITATION
FILTER
514.5 NM
AR-ION LASER
Heated
reactor cell
Rotating sample stage
Collimating lens
MONOCHROMATOR
CCD
CAMERA
Focusing lens
Rayleigh filter
Figure 3.1. Laser Raman spectrometer diagram.
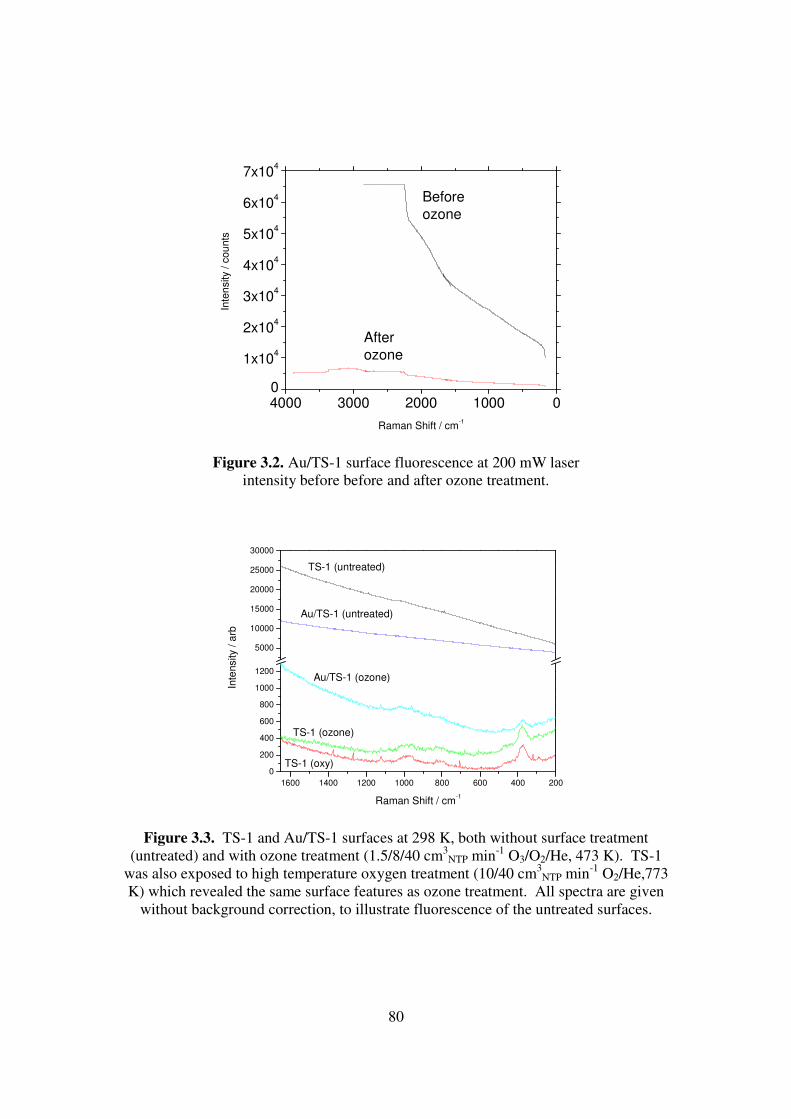
80
4000 3000 2000 1000 00
1x10⁴
2x10⁴
3x10⁴
4x10⁴
5x10⁴
6x10⁴
7x10⁴
After
ozone
Before
ozoneIn
ten
sity / c
ou
nts
Raman Shift / cm-1
Figure 3.2. Au/TS-1 surface fluorescence at 200 mW laser
intensity before before and after ozone treatment.
1600 1400 1200 1000 800 600 400 200
0
200
400
600
800
1000
1200
5000
10000
15000
20000
25000
30000
Au/TS-1 (ozone)
TS-1 (ozone)
TS-1 (oxy)
Au/TS-1 (untreated)
TS-1 (untreated)
Inte
nsity / a
rb
Raman Shift / cm-1
Figure 3.3. TS-1 and Au/TS-1 surfaces at 298 K, both without surface treatment
(untreated) and with ozone treatment (1.5/8/40 cm3NTP min-1 O3/O2/He, 473 K). TS-1
was also exposed to high temperature oxygen treatment (10/40 cm3NTP min-1 O2/He,773
K) which revealed the same surface features as ozone treatment. All spectra are given without background correction, to illustrate fluorescence of the untreated surfaces.
81
Raman spectra were investigated over the range of 4300 to 170 cm-1 by setting the
monchromator to low (1700-170 cm-1), intermediate (2800-1500 cm-1) high (3800-2700
cm-1) and very high (4300-3300 cm-1) wavenumber regimes. Propylene C-H stretch
features were observed at high wavenumber (3100 to 2700 cm-1) while propylene C-C
stretch, C-H bend, and TS-1 structural features were observed at low wavenumber (1800-
200 cm-1). The low wavenumber regime (Fig. 3.4, right panel) shows silicalite
framework bonds indicative of S-1 and TS-1 at 800 and 376 cm-1 as well as Ti-O features
indicative of TS-1 specifically at 1135 and 980 cm-1. Propylene features are much
sharper than these surface features. The strongest peak at 1648 cm-1 was attributed to a
C=C stretch, and the feature at 918 cm-1 was attributed to a C-C stretch. The remaining
features at 1455, 1416, 1297, and 430 cm-1 were attributed to C-H bending deformations.
In the high-wavenumber regime (Fig. 3.4, left panel), there are no TS-1 features but many
C-H stretching modes. The most energetic features at 3080 and 3012 cm-1 were assigned
to asymmetric and symmetric CH2 vinyl stretches. Shoulder peaks of the 3012 cm-1
feature at 2998 and 2980 cm-1 were assigned to C-H stretches of the C3 carbon.
Additional features at 2917, 2885, 2853, 2818, and 2727 cm-1 were asymmetric and
symmetric CH3 stretches and C-H stretches of the C2 carbon [12,13]. Weak features near
3200 cm-1 are likely an overtone of the 1648 cm-1 C=C stretch.
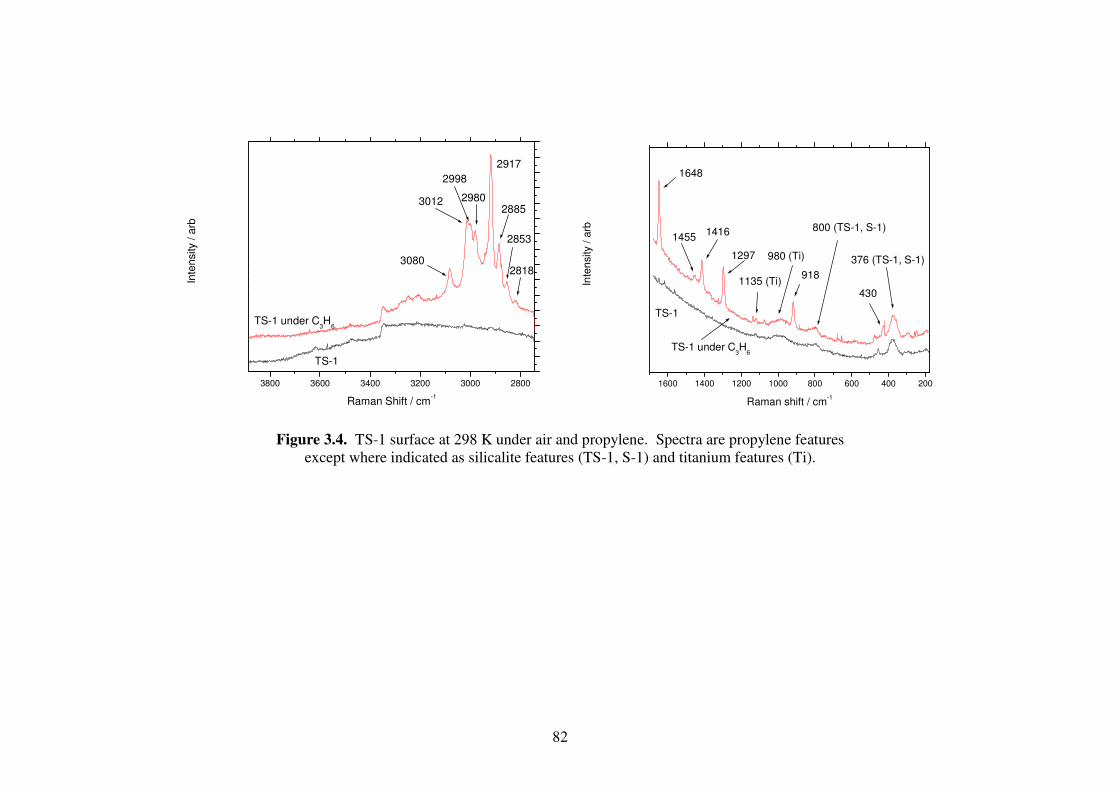
82
3800 3600 3400 3200 3000 2800
2917
2818
2853
2885
2998
29803012
TS-1
TS-1 under C3H
6
3080
Inte
nsity /
arb
Raman Shift / cm-1
1600 1400 1200 1000 800 600 400 200
TS-1 under C3H
6
TS-1
4301135 (Ti)
980 (Ti)
1648
14551416
1297
918
800 (TS-1, S-1)
376 (TS-1, S-1)
Inte
nsity / a
rb
Raman shift / cm-1
Figure 3.4. TS-1 surface at 298 K under air and propylene. Spectra are propylene features
except where indicated as silicalite features (TS-1, S-1) and titanium features (Ti).
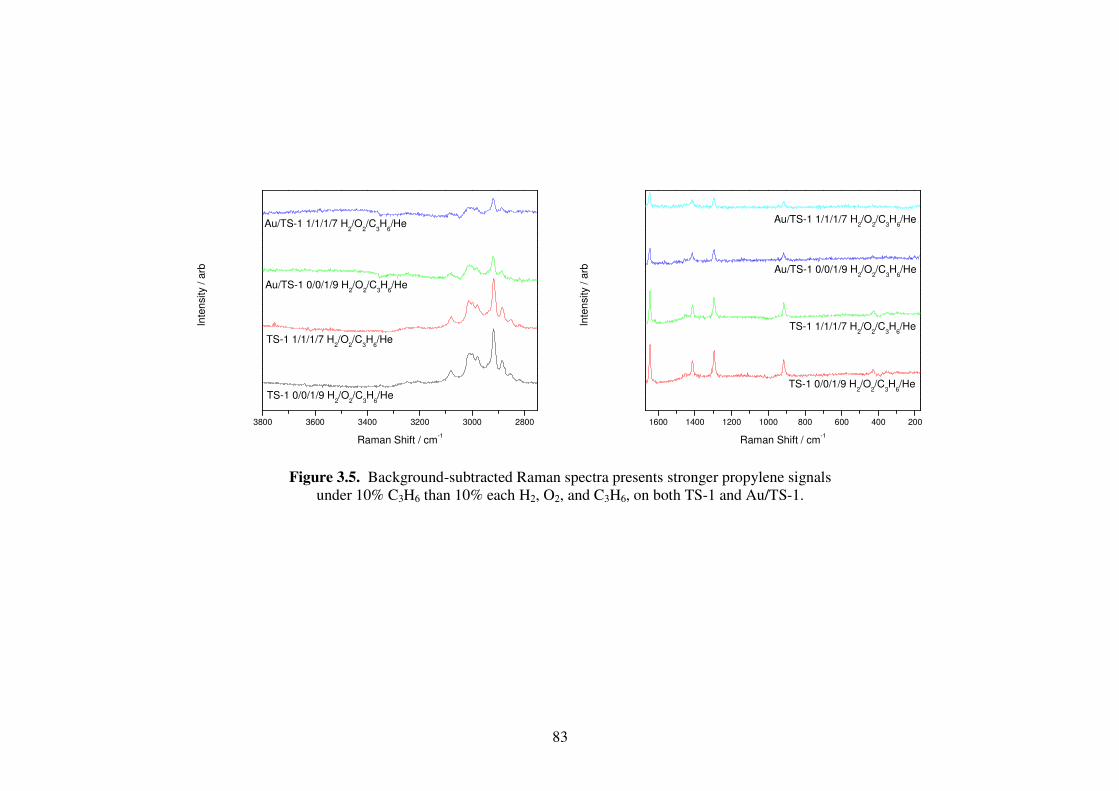
83
3800 3600 3400 3200 3000 2800
Au/TS-1 0/0/1/9 H2/O
2/C
3H
6/He
Au/TS-1 1/1/1/7 H2/O
2/C
3H
6/He
TS-1 1/1/1/7 H2/O
2/C
3H
6/He
TS-1 0/0/1/9 H2/O
2/C
3H
6/He
Inte
nsity / a
rb
Raman Shift / cm-1
1600 1400 1200 1000 800 600 400 200
Au/TS-1 0/0/1/9 H2/O
2/C
3H
6/He
Au/TS-1 1/1/1/7 H2/O
2/C
3H
6/He
TS-1 1/1/1/7 H2/O
2/C
3H
6/He
TS-1 0/0/1/9 H2/O
2/C
3H
6/He
Inte
nsity / a
rb
Raman Shift / cm-1
Figure 3.5. Background-subtracted Raman spectra presents stronger propylene signals
under 10% C3H6 than 10% each H2, O2, and C3H6, on both TS-1 and Au/TS-1.
84
Background subtracted spectra of the TS-1 and Au/TS-1 samples (Fig. 3.5) under
propylene and hydrogen/oxygen/propylene show that the addition of hydrogen and
oxygen produces no new features. However, the intensity of propylene features, such as
the size of the 1648 cm-1 C=C feature, is significantly reduced, despite the fact the partial
pressure of propylene is unchanged. For TS-1, addition of hydrogen and oxygen reduces
the area of the C=C feature by 18%, and for Au/TS-1 addition of hydrogen and oxygen
reduces the area of the C=C feature by 34%. This reduction in C=C signal represents a
proportional decrease in propylene adsorption, due to competition for adsorption sites by
hydrogen and oxygen or some other reversible effect of hydrogen and oxygen on the TS-
1 and Au/TS-1 surface. Although the direct observation of hydrogen and oxygen
adsorbing to the surface could not be made, the reduction in propylene adsorption
indicated this adsorption, as well the effect of gold increasing hydrogen and oxygen
adsorption.
3.3.2 Density functional theory
Computational chemistry allows the mathematical simulation of chemical systems,
which can serve as a powerful tool to predict or explain experimental results of those
systems. The equations necessary to describe the electronic structure of the hydrogenic
atom were Erwin Schrödinger and further formalized by Paul Dirac in the late 1926-
1928; however, the direct solution of multi-electron wavefunctions is so complex that
chemical properties can be modeled only by application of carefully constructed
approximations [14,15].
Density functional theory (DFT), first published by Pierre Hohenberg, W. Kohn,
and Lu J. Sham in 1964-1965, demonstrated that electronic models could be
85
tremendously simplified, yet still produce high accuracy, by approximating electronic
wavefunctions in Hilbert space as electronic density in three-dimensional space, as well
as isolating electron-electron interaction from other energy operators. Energy of the
electronic system is expressed in terms of non-interacting kinetic energy (TS) and
coulombic pontential (J), with electron interaction accounted for using an exchange-
correlation term (EXC). [16]. The non-interacting terms may be easily solved, but the
means by which the exchange correlation term may be solved must be selected based on
the nature and purpose of the model, normally described as a “method” or “level” of
computation. For this study, the Becke 3-parameter Lee-Yang-Parr (B3LYP) method
was selected. The B3LYP method is a hybrid functional which comprises of a linear
combination of three energy terms. An ab initio functional consisting of a partial
Hartree-Fock (HF) exchange correlation functional is complemented with two semi-
empirical density functional terms: a Vosko-Wilk-Nusair semi-empirical local density
approximation (LDA, an energy term dependent only on electron density) [17], and a
Becke, Lee-Yang-Parr general gradient approximation (GGA, an energy term dependent
only on electron density gradient). The B3LYP hybrid functional is commonly used in
organic systems [18].
A basis set for electron population must be selected along with a method to
initiate a computation. Several of John Pople’s 6-31G and 6-311G split-valence basis
sets were investigated, with the 6-311+G(d,p) basis set selected for all final calculations.
In this basis set, electron orbitals are constructed using primitive Gaussian-type radial
functions, which are linearly combined into contracted Gaussians. The 6-311+G(d,p) is a
triple-zeta valance set, where the valence electrons are described by a linear combination
86
of three contracted Gaussians, one of which consists of three primitive Gaussians and the
other two consisting of one primitive Gaussian each. Polarization functions (d,p) allow s-
orbitals to distort to p-orbitals, and p-orbitals to distort to d-orbitals, while a diffuse
function (+) smooths the radial energy function for all atoms except hydrogen. The entire
set of core (non-bonding) electrons are described by a single contracted Gaussian formed
by six primitive Gaussians.
Several chemical models were simulated. For simplicity, the Ti center to which
the propylene is assumed to adsorb is modeled as a tetravalent Ti(OH)4 cluster. A total of
eight propylene orientations were simulated: a single propylene molecule (C3H6), a
propylene molecule adsorbed to Ti(OH)4 at C1, C2, and C3 positions (Ti(OH)4-C3H6
[C1], Ti(OH)4-C3H6 [C2], Ti(OH)4-C3H6 [C3]), a propylene molecule adsorbed to
Ti(OH)4 at C1, C2, and C3 positions with one hydrogen dissociated (Ti(OH)4-C3H5 [C1],
Ti(OH)4-C3H5 [C2], Ti(OH)4-C3H5 [C3]), and a propylene molecule adsorbed to Ti(OH)4
via π bond (Ti(OH)4-C3H6 [π]). All systems were investigated using the 6-31+G(d), 6-
311+G(d), 6-311++G(d), and 6-311++G(d,p) basis sets. The Ti(OH)4-C3H6 [C1,C2,C3]
sets were unstable; however, the three dissociatively adsorbed propylene sets (C3H5-)
were found to be stable (Ti(OH)4-C3H5 [C1,C2,C3]). Gas-phase propylene (C3H6 [gas])
and π-adsorbed propylene (Ti(OH)4-C3H6 [π]) also resolved to stable energy minima.
Presented here are the predicted spectra at the B3LYP/6-311+G(d,p) level for gas-phase
propylene, propylene adsorbed to Ti(OH)4 along the π-bond, and, for illustration,
dissociatively-adsorbed propylene adsorbed to Ti(OH)4 at the C1, C2, and C3 positions.
Calculated vibration energies were adjusted using an energy calibration of 0.97 [19] and
87
Ti-O and O-H bands were removed. Bash scripts were used to generate Raman spectra
and to assist in identifying vibration modes.
As was found in the experimental results, vibrations were predicted in the range
of 1800-200 cm-1 and C-H stretches were observed in the range of 3200-2700 cm-1 (Fig.
3.6). In the low-wavenumber range, the C=C feature near 1650 cm-1 is significantly
reduced for C1 and C2 bound propylene, while for all other spectra this feature is the
most intense feature in the low-wavenumber range. Further, the C3 bound propylene has
a strong feature at 1020 cm-1 which does not appear for any other sample. The spectra for
π-bound propylene, propylene gas, and the experimental results all show the same
features at 1648 (carbon-carbon double bond stretch), 1416 (C(1)H2 symmetric in-plane
bend), 1297 (C(2)H in-plane bend), and 918 cm-1 (carbon-carbon single bond stretch),
matching both position and relative intensities. In the high-wavenumber regime, all
spectra except C1-adsorbed propylene predict the 3080 cm-1 feature, and only the π-
adsorbed propylene and propylene gas predict the features at 3080 (C(1)H2 in-plane
asymmetric stretch), 3012 (C(1)H2 in-plane symmetric stretch), 2998 (C(3)H out-of-plane
stretch), 2980 (C(3)H out-of-plane stretch), and 2917 cm-1 (C(3)H3 asymmetric stretch).
Three important peaks are observed for π-adsorbed and gas-phase propylene. The
peaks at 2998, 2980, and 2917 cm-1 are the only out-of-plane features observed, and these
features are shifted to higher energy when propylene is π-bound to a titanium center. All
in-plane vibrations are not affected by adsorption.
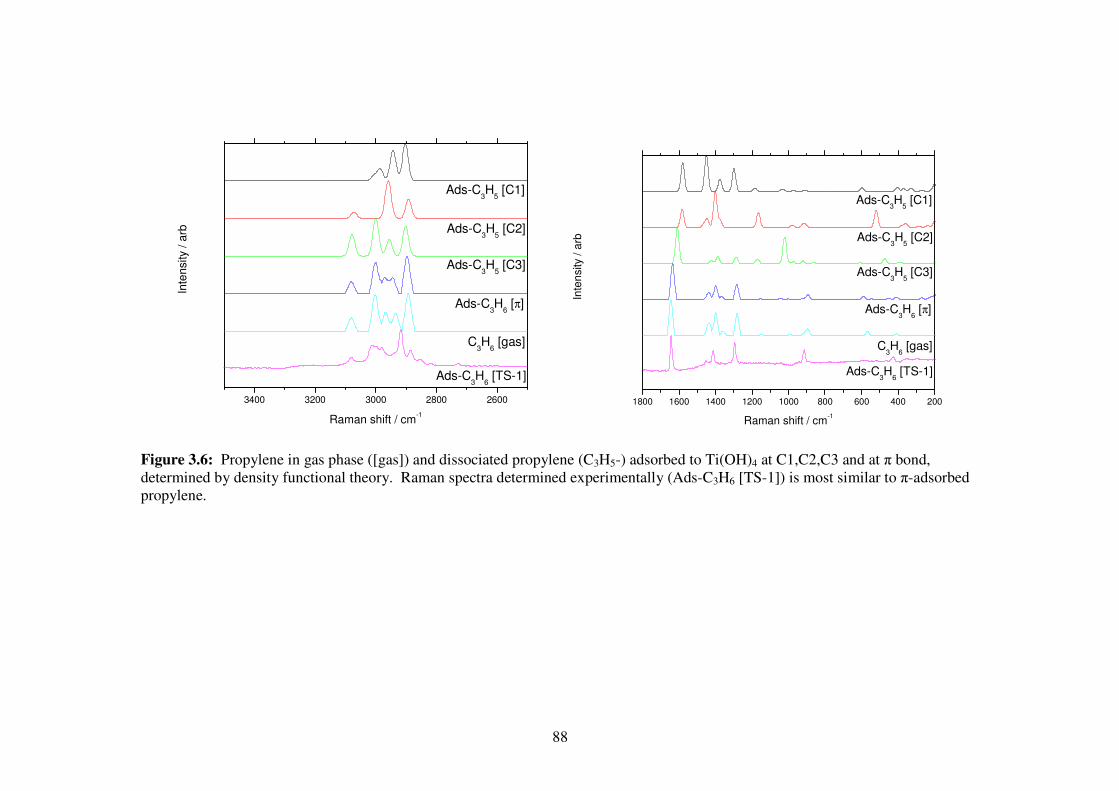
88
3400 3200 3000 2800 2600
Ads-C3H
6 [TS-1]
C3H
6 [gas]
Ads-C3H
6 [π]
Ads-C3H
5 [C3]
Ads-C3H
5 [C2]
Ads-C3H
5 [C1]
Inte
nsity / a
rb
Raman shift / cm-1
1800 1600 1400 1200 1000 800 600 400 200
Ads-C3H
6 [TS-1]
C3H
6 [gas]
Ads-C3H
6 [π]
Ads-C3H
5 [C3]
Ads-C3H
5 [C2]
Ads-C3H
5 [C1]
Inte
nsity / a
rb
Raman shift / cm-1
Figure 3.6: Propylene in gas phase ([gas]) and dissociated propylene (C3H5-) adsorbed to Ti(OH)4 at C1,C2,C3 and at π bond, determined by density functional theory. Raman spectra determined experimentally (Ads-C3H6 [TS-1]) is most similar to π-adsorbed propylene.
89
3.3.3 Temperature programmed desorption and C3H6 uptake
Surface analysis of TS-1 and Au/TS-1 was accomplished using temperature
programmed adsorption (TPD) of H2, O2, and C3H6 as well as measuring uptake of C3H6.
At 343 K, all species are more tightly bound to Au/TS-1 than TS-1, as indicated by the
higher desorption temperature (Fig. 3.7). On Au/TS-1, the propylene desorption trace at
343 K shows two peaks, indicating dual adsorption sites, most likely Ti at lower
temperature and Au at higher temperature. This is not observed for H2 or O2, which may
indicate that adsorption on gold is not activated at this temperature. Studies using Au LIII
x-ray absorption near edge spectroscopy (XANES) have indicated that propylene may
also adsorb to gold on the Au/TS-1 catalyst [20].
Integrating the TPD traces allowed calculation of adsorption, and these values
were compared to adsorption determined by dosing a cleaned surface with propylene
(Table 3.1). Adsorption values were presented as µmol g-1. As propylene adsorption is
of particular interest, this adsorption was also presented in terms of coverage of Ti sites
(θ(Ti) =NC3H6 / NTi ), coverage of Au sites (θ(Au) =NC3H6 / NAu), and coverage of both Ti
and Au sites (θ(Au+Ti) =NC3H6 / (NAu + NAu)), with the simplifying assumption that both Ti
and Au are so disperse that all atoms are active sites. Propylene coverage over titanium
was determined to be 12% for TS-1 and 51% for Au/TS-1 at 343 K as determined by
propylene uptake.
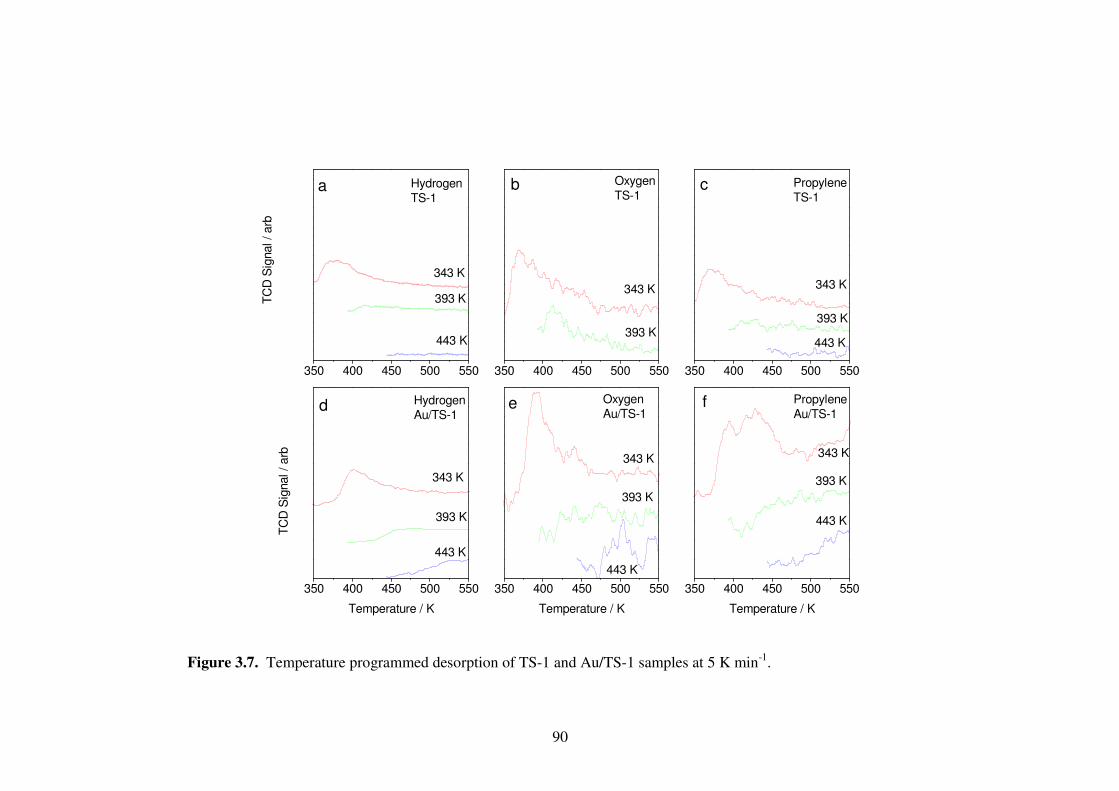
90
350 400 450 500 550
a
443 K
393 K343 K
343 K
Hydrogen
Au/TS-1
TC
D S
ignal / arb
Hydrogen
TS-1
350 400 450 500 550
b
393 K
Oxygen
TS-1
350 400 450 500 550
c
443 K
393 K
393 K
343 K
Propylene
TS-1
350 400 450 500 550
d
443 K
343 K
TC
D S
ignal / arb
Temperature / K
350 400 450 500 550
e
443 K
393 K
343 K
Oxygen
Au/TS-1
Temperature / K
350 400 450 500 550
f
443 K
393 K
343 K
Propylene
Au/TS-1
Temperature / K
Figure 3.7. Temperature programmed desorption of TS-1 and Au/TS-1 samples at 5 K min-1.
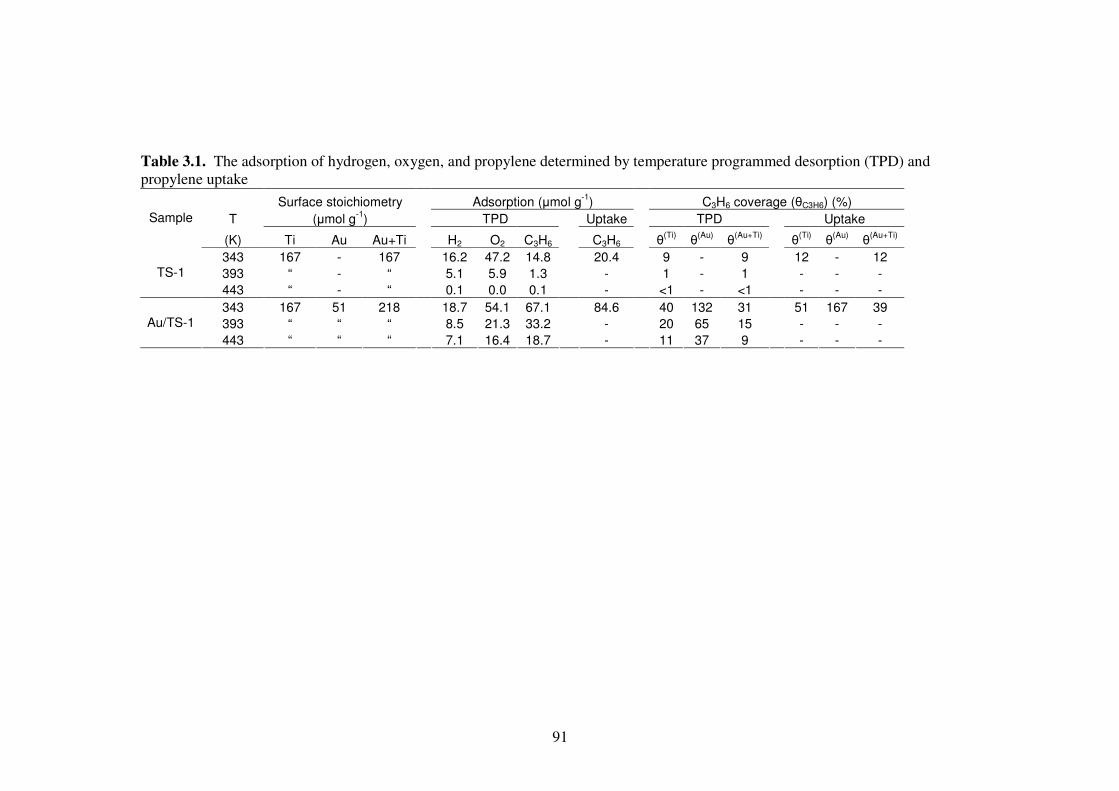
91
Table 3.1. The adsorption of hydrogen, oxygen, and propylene determined by temperature programmed desorption (TPD) and propylene uptake
Surface stoichiometry Adsorption (µmol g-1
) C3H6 coverage (θC3H6) (%)
T (µmol g-1
) TPD Uptake TPD Uptake Sample
(K) Ti Au Au+Ti H2 O2 C3H6 C3H6 θ
(Ti) θ
(Au) θ
(Au+Ti) θ
(Ti) θ
(Au) θ
(Au+Ti)
343 167 - 167 16.2 47.2 14.8 20.4 9 - 9 12 - 12
393 “ - “ 5.1 5.9 1.3 - 1 - 1 - - - TS-1
443 “ - “ 0.1 0.0 0.1 - <1 - <1 - - -
343 167 51 218 18.7 54.1 67.1 84.6 40 132 31 51 167 39
393 “ “ “ 8.5 21.3 33.2 - 20 65 15 - - - Au/TS-1
443 “ “ “ 7.1 16.4 18.7 - 11 37 9 - - -
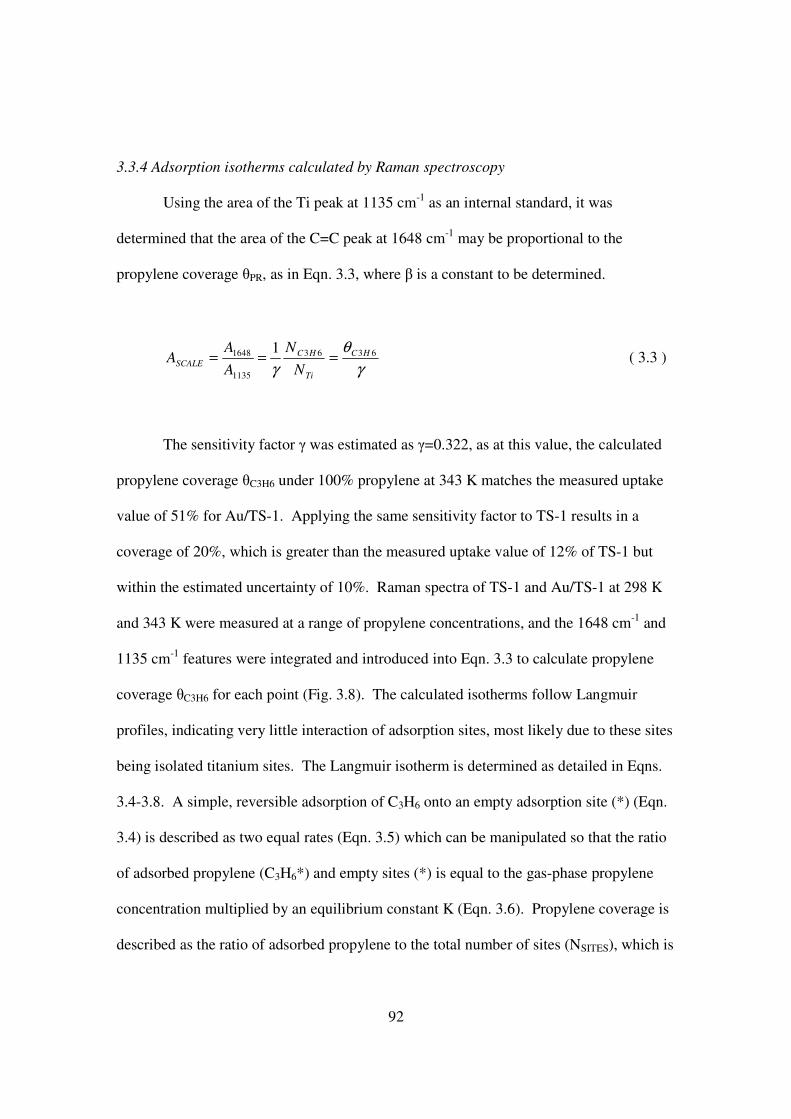
92
3.3.4 Adsorption isotherms calculated by Raman spectroscopy
Using the area of the Ti peak at 1135 cm-1 as an internal standard, it was
determined that the area of the C=C peak at 1648 cm-1 may be proportional to the
propylene coverage θPR, as in Eqn. 3.3, where β is a constant to be determined.
γ
θ
γ6363
1135
1648 1 HC
Ti
HC
SCALEN
N
A
AA === ( 3.3 )
The sensitivity factor γ was estimated as γ=0.322, as at this value, the calculated
propylene coverage θC3H6 under 100% propylene at 343 K matches the measured uptake
value of 51% for Au/TS-1. Applying the same sensitivity factor to TS-1 results in a
coverage of 20%, which is greater than the measured uptake value of 12% of TS-1 but
within the estimated uncertainty of 10%. Raman spectra of TS-1 and Au/TS-1 at 298 K
and 343 K were measured at a range of propylene concentrations, and the 1648 cm-1 and
1135 cm-1 features were integrated and introduced into Eqn. 3.3 to calculate propylene
coverage θC3H6 for each point (Fig. 3.8). The calculated isotherms follow Langmuir
profiles, indicating very little interaction of adsorption sites, most likely due to these sites
being isolated titanium sites. The Langmuir isotherm is determined as detailed in Eqns.
3.4-3.8. A simple, reversible adsorption of C3H6 onto an empty adsorption site (*) (Eqn.
3.4) is described as two equal rates (Eqn. 3.5) which can be manipulated so that the ratio
of adsorbed propylene (C3H6*) and empty sites (*) is equal to the gas-phase propylene
concentration multiplied by an equilibrium constant K (Eqn. 3.6). Propylene coverage is
described as the ratio of adsorbed propylene to the total number of sites (NSITES), which is
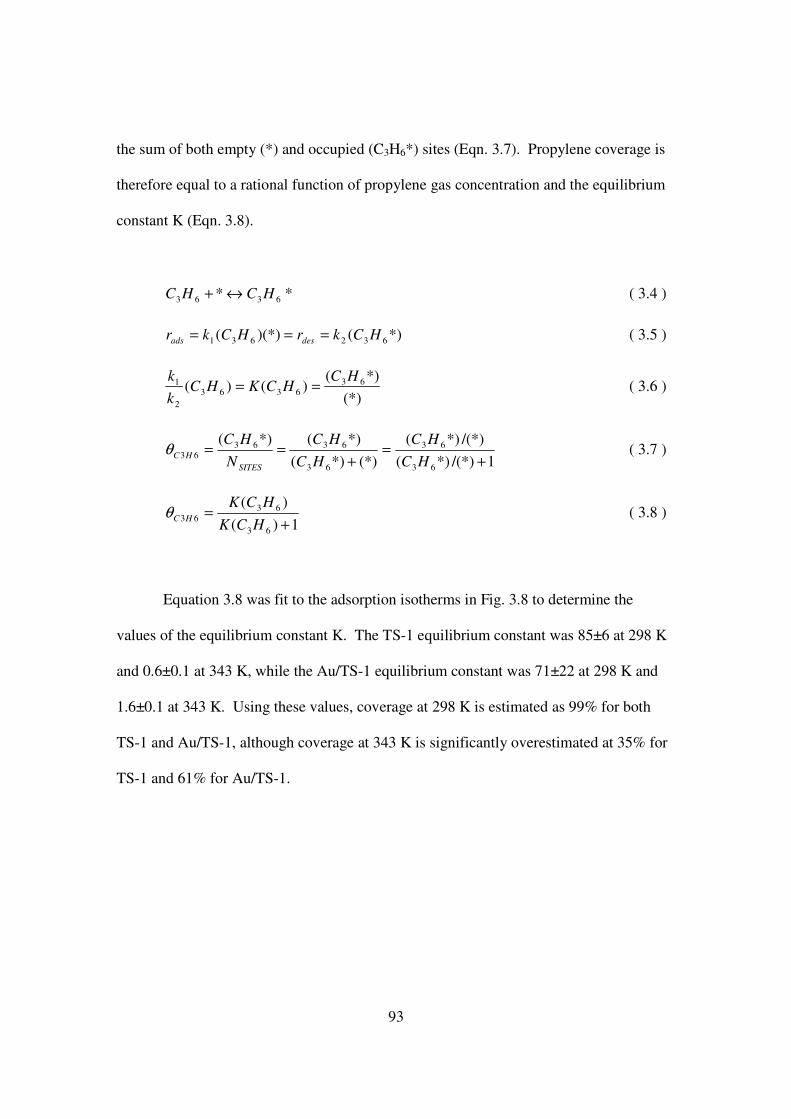
93
the sum of both empty (*) and occupied (C3H6*) sites (Eqn. 3.7). Propylene coverage is
therefore equal to a rational function of propylene gas concentration and the equilibrium
constant K (Eqn. 3.8).
** 6363 HCHC ↔+ ( 3.4 )
*)()(*)( 632631 HCkrHCkr desads === ( 3.5 )
(*)
*)()()( 63
63632
1 HCHCKHC
k
k== ( 3.6 )
1/(*)*)(
/(*)*)(
(*)*)(
*)(*)(
63
63
63
636363
+=
+==
HC
HC
HC
HC
N
HC
SITES
HCθ ( 3.7 )
1)(
)(
63
6363
+=
HCK
HCKHCθ ( 3.8 )
Equation 3.8 was fit to the adsorption isotherms in Fig. 3.8 to determine the
values of the equilibrium constant K. The TS-1 equilibrium constant was 85±6 at 298 K
and 0.6±0.1 at 343 K, while the Au/TS-1 equilibrium constant was 71±22 at 298 K and
1.6±0.1 at 343 K. Using these values, coverage at 298 K is estimated as 99% for both
TS-1 and Au/TS-1, although coverage at 343 K is significantly overestimated at 35% for
TS-1 and 61% for Au/TS-1.
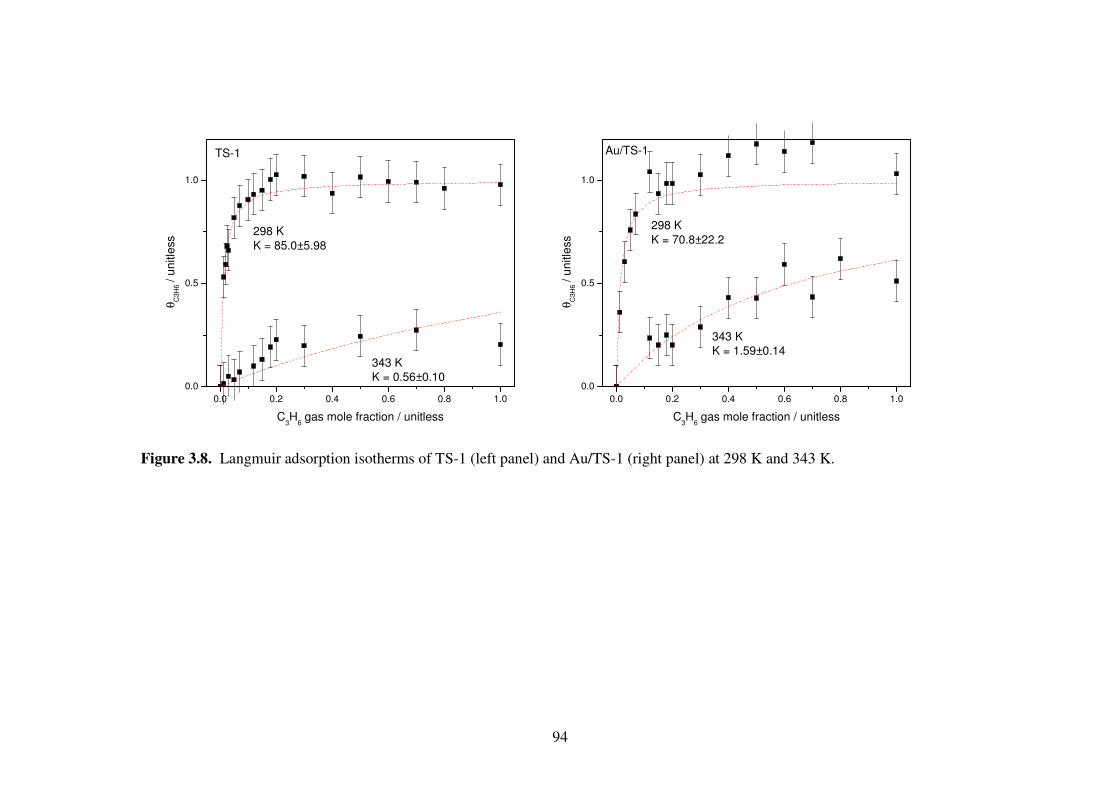
94
0.0 0.2 0.4 0.6 0.8 1.0
0.0
0.5
1.0
TS-1
343 K
K = 0.56±0.10
298 K
K = 85.0±5.98
θC
3H
6 / u
nitle
ss
C3H
6 gas mole fraction / unitless
0.0 0.2 0.4 0.6 0.8 1.0
0.0
0.5
1.0
343 K
K = 1.59±0.14
Au/TS-1
298 K
K = 70.8±22.2
θC
3H
6 / u
nitle
ss
C3H
6 gas mole fraction / unitless
Figure 3.8. Langmuir adsorption isotherms of TS-1 (left panel) and Au/TS-1 (right panel) at 298 K and 343 K.
95
3.4 Conclusions
Laser Raman spectroscopy of a titanisilicate support (TS-1) and a titanosilicate-
supported gold catalyst (Au/TS-1) was accomplished using a low-temperature ozone
treatment to substantially reduce surface fluorescence. TS-1 framework vibrations were
observed in the range of 1135-200 cm-1, although no gold excitation was observed at the
low excitation energy used. Propylene Raman spectra were observed at 3100-2700 cm-1
and 1650-430 cm-1. Although adsorbed hydrogen and oxygen were not observed directly,
the addition of these gases, without altering propylene partial pressure, resulted in
significantly reduced intensity of the 1648 cm-1 propylene C=C feature.
Density functional theory (DFT) was utilized to support frequency assignments as
well as provide evidence for adsorbed propylene by demonstrating a shift of out-of-plane
vibrations to energies slightly higher than expected for gas-phase propylene.
Temperature programmed desorption (TPD) and propylene uptake were utilized
to further characterize the surface of TS-1 and Au/TS-1. Evidence for dual-site
adsorption of propylene on Au/TS-1 was indicated by a split desorption peak. Titanium
uptake of propylene was determined to be 9-12% for TS-1 and 40-51% for Au/TS-1 at
343 K.
Adsorption isotherms for propylene on TS-1 and Au/TS-1 at 298 K and 343 K
showed Langumir adsorption profiles. Application of an internal standard along with the
experimentally-derived propylene uptake values allowed these isotherms to be described
in terms of titanium coverage.
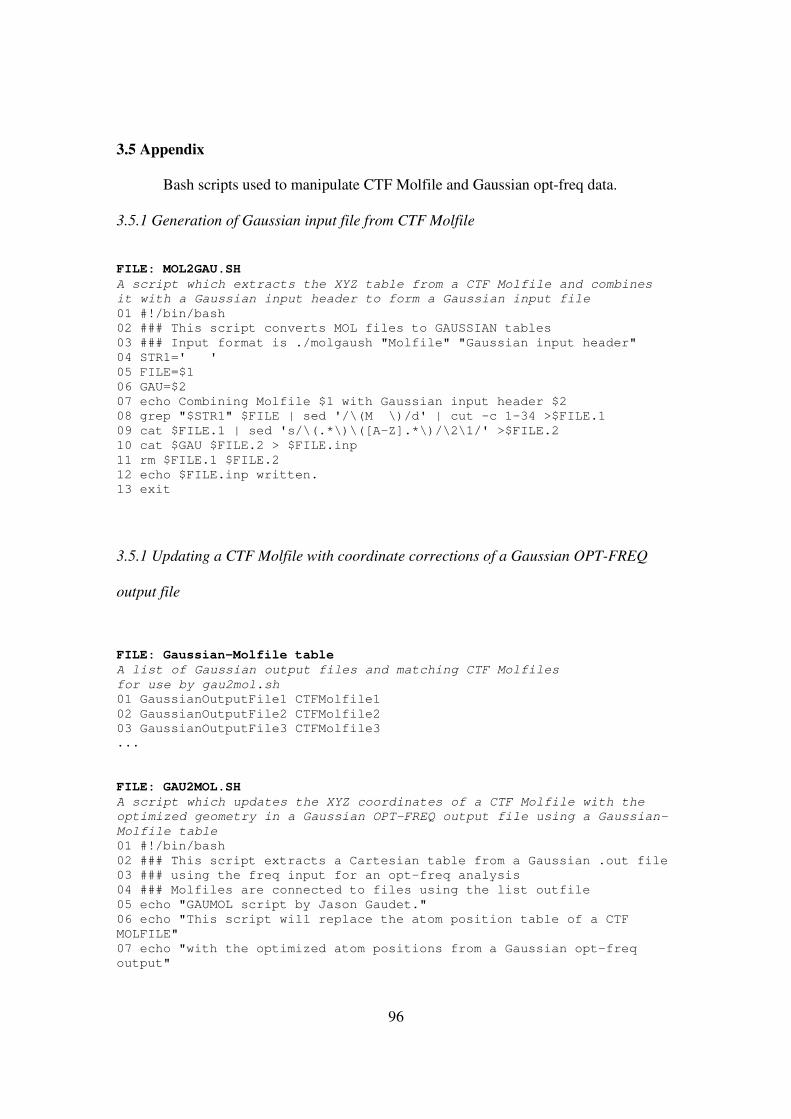
96
3.5 Appendix
Bash scripts used to manipulate CTF Molfile and Gaussian opt-freq data.
3.5.1 Generation of Gaussian input file from CTF Molfile
FILE: MOL2GAU.SH
A script which extracts the XYZ table from a CTF Molfile and combines
it with a Gaussian input header to form a Gaussian input file
01 #!/bin/bash
02 ### This script converts MOL files to GAUSSIAN tables
03 ### Input format is ./molgaush "Molfile" "Gaussian input header"
04 STR1=' '
05 FILE=$1
06 GAU=$2
07 echo Combining Molfile $1 with Gaussian input header $2
08 grep "$STR1" $FILE | sed '/\(M \)/d' | cut -c 1-34 >$FILE.1
09 cat $FILE.1 | sed 's/\(.*\)\([A-Z].*\)/\2\1/' >$FILE.2
10 cat $GAU $FILE.2 > $FILE.inp
11 rm $FILE.1 $FILE.2
12 echo $FILE.inp written.
13 exit
3.5.1 Updating a CTF Molfile with coordinate corrections of a Gaussian OPT-FREQ
output file
FILE: Gaussian-Molfile table
A list of Gaussian output files and matching CTF Molfiles
for use by gau2mol.sh
01 GaussianOutputFile1 CTFMolfile1
02 GaussianOutputFile2 CTFMolfile2
03 GaussianOutputFile3 CTFMolfile3
...
FILE: GAU2MOL.SH
A script which updates the XYZ coordinates of a CTF Molfile with the
optimized geometry in a Gaussian OPT-FREQ output file using a Gaussian-
Molfile table
01 #!/bin/bash
02 ### This script extracts a Cartesian table from a Gaussian .out file
03 ### using the freq input for an opt-freq analysis
04 ### Molfiles are connected to files using the list outfile
05 echo "GAUMOL script by Jason Gaudet."
06 echo "This script will replace the atom position table of a CTF
MOLFILE"
07 echo "with the optimized atom positions from a Gaussian opt-freq
output"
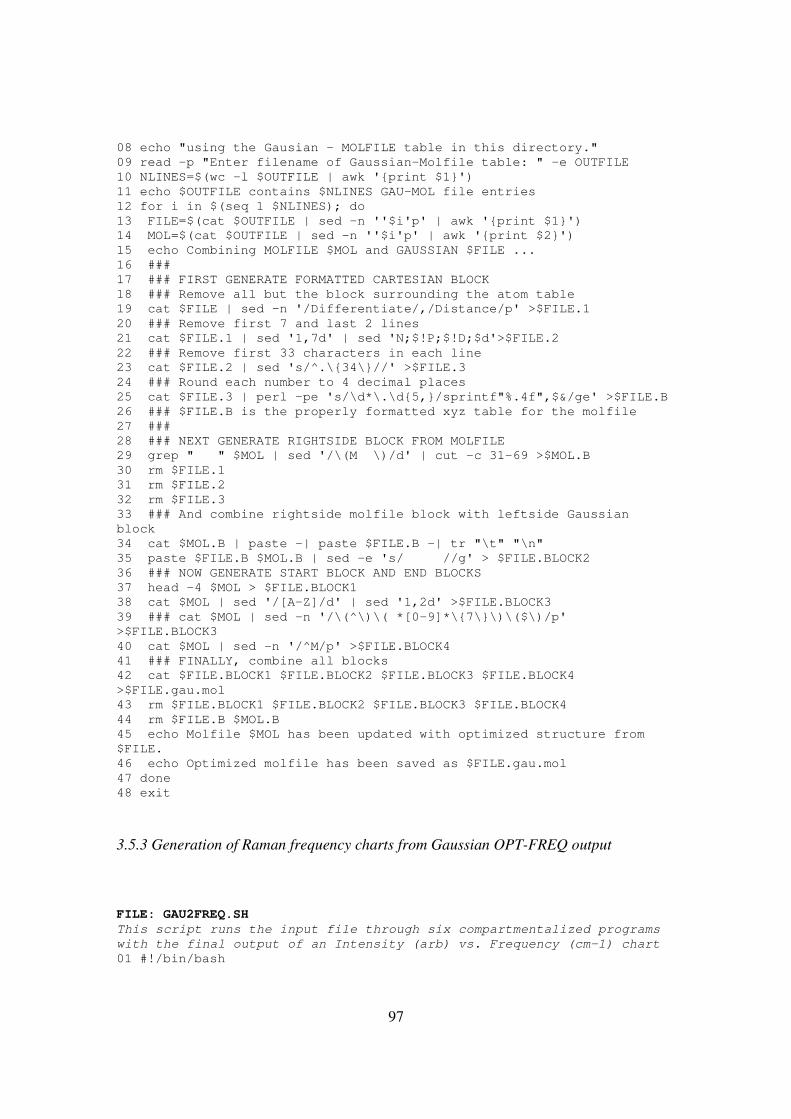
97
08 echo "using the Gausian - MOLFILE table in this directory."
09 read -p "Enter filename of Gaussian-Molfile table: " -e OUTFILE
10 NLINES=$(wc -l $OUTFILE | awk '{print $1}')
11 echo $OUTFILE contains $NLINES GAU-MOL file entries
12 for i in $(seq 1 $NLINES); do
13 FILE=$(cat $OUTFILE | sed -n ''$i'p' | awk '{print $1}')
14 MOL=$(cat $OUTFILE | sed -n ''$i'p' | awk '{print $2}')
15 echo Combining MOLFILE $MOL and GAUSSIAN $FILE ...
16 ###
17 ### FIRST GENERATE FORMATTED CARTESIAN BLOCK
18 ### Remove all but the block surrounding the atom table
19 cat $FILE | sed -n '/Differentiate/,/Distance/p' >$FILE.1
20 ### Remove first 7 and last 2 lines
21 cat $FILE.1 | sed '1,7d' | sed 'N;$!P;$!D;$d'>$FILE.2
22 ### Remove first 33 characters in each line
23 cat $FILE.2 | sed 's/^.\{34\}//' >$FILE.3
24 ### Round each number to 4 decimal places
25 cat $FILE.3 | perl -pe 's/\d*\.\d{5,}/sprintf"%.4f",$&/ge' >$FILE.B
26 ### $FILE.B is the properly formatted xyz table for the molfile
27 ###
28 ### NEXT GENERATE RIGHTSIDE BLOCK FROM MOLFILE
29 grep " " $MOL | sed '/\(M \)/d' | cut -c 31-69 >$MOL.B
30 rm $FILE.1
31 rm $FILE.2
32 rm $FILE.3
33 ### And combine rightside molfile block with leftside Gaussian
block
34 cat $MOL.B | paste -| paste $FILE.B -| tr "\t" "\n"
35 paste $FILE.B $MOL.B | sed -e 's/ //g' > $FILE.BLOCK2
36 ### NOW GENERATE START BLOCK AND END BLOCKS
37 head -4 $MOL > $FILE.BLOCK1
38 cat $MOL | sed '/[A-Z]/d' | sed '1,2d' >$FILE.BLOCK3
39 ### cat $MOL | sed -n '/\(^\)\( *[0-9]*\{7\}\)\($\)/p'
>$FILE.BLOCK3
40 cat $MOL | sed -n '/^M/p' >$FILE.BLOCK4
41 ### FINALLY, combine all blocks
42 cat $FILE.BLOCK1 $FILE.BLOCK2 $FILE.BLOCK3 $FILE.BLOCK4
>$FILE.gau.mol
43 rm $FILE.BLOCK1 $FILE.BLOCK2 $FILE.BLOCK3 $FILE.BLOCK4
44 rm $FILE.B $MOL.B
45 echo Molfile $MOL has been updated with optimized structure from
$FILE.
46 echo Optimized molfile has been saved as $FILE.gau.mol
47 done
48 exit
3.5.3 Generation of Raman frequency charts from Gaussian OPT-FREQ output
FILE: GAU2FREQ.SH
This script runs the input file through six compartmentalized programs
with the final output of an Intensity (arb) vs. Frequency (cm-1) chart
01 #!/bin/bash
98
02 echo Running gau2freq.sh on file $1
03 echo running xltab.sh rftab.sh sftab.sh tcomb.sh tcomp.sh
cleanfreq.sh
04 echo Output will be x,y chart for $1
05 echo RUNNING XLTAB.SH TO GENERATE EXCEL TABLES
06 ./xltab.sh $1
07 echo RUNNING RFTAB.SH TO GENERATE ROUNDED FREQ AND RAMAN AREA TABLES
08 ./rftab.sh $1
09 echo RUNNING SFTAB.SH TO GENERATE NORMAL DISTRIBUTION CHARTS
10 ./sftab.sh $1
11 echo RUNNING TCOMB.SH TO COMBINE FILES INTO MULTICOLUMN FILE
12 ./tcomb.sh $1
13 echo RUNNING TCOMP.SH TO ADD UP ALL COLUMNS AND MAKE FINAL X,Y
SPECTRA
14 ./tcomp.sh $1
15 echo RUNNING CLEANFREQ.SH TO REMOVE ALL INTERMEDIATE FILES
16 ./cleanfreq.sh $1
17 echo RUN COMPLETE
18 exit
FILE:GVAR
This file stores the variables used in generating Raman spectra
01 SIGMA 10
02 XMIN 100
03 XMAX 4100
04 NSIG 2
05 GAIN 1000
06 LOFREQ 100
07 HIFREQ 4100
FILE: GZROUND.SH
This file rounds all non-negative numbers to the nearest integer
and is used in generating Raman spectra
01 #!/bin/bash
02 ### gzround
03 num=$1
04 int=$(echo $num | sed 's/\..*//')
05 if [ -z $int ]
06 then
07 round=$((0))
08 else
09 dec=$(echo $num | sed 's/\(.*\.\)\([0-9]\)\(.*\)/\2/')
10 if [ "$dec" -lt "5" ];
11 then
12 round=$int
13 else
14 round=$[ $int + 1 ]
15 fi
16 fi
17 echo $round
18 exit
FILE: XLTAB.SH
This file extracts the frequencies and Raman activities from the
Gaussian output file
99
into a single table
01 #!/bin/bash
02 ### This script generates frequency tables for the given input file
03 echo "Extracting frequencies, Raman, and IR Intensities"
04 FREQ="Frequencies --"
05 RAMA="Raman Activ --"
06 IRIN="IR Inten --"
07 FILE=$1
08 echo file: $1
09 grep "$FREQ" <"$FILE" | tr -d '\r\n' | tr "$FREQ" '\40' >$FILE.frq
10 grep "$RAMA" <"$FILE" | tr -d '\r\n' | tr "$RAMA" '\40' >$FILE.rmn
11 grep "$IRIN" <"$FILE" | tr -d '\r\n' | tr "$IRIN" '\40' >$FILE.iai
12 cat $FILE.frq | sed 's/^/ FREQ /' >$FILE.fr1
13 cat $FILE.rmn | sed 's/^/\r\n RAMN /' >$FILE.rm1
14 cat $FILE.iai | sed 's/^/\r\n IRIN /' >$FILE.ia1
15 cat $FILE.fr1 $FILE.rm1 $FILE.ia1 > $FILE.freq
16 rm $FILE.frq $FILE.rmn $FILE.iai $FILE.fr1 $FILE.rm1 $FILE.ia1
17 echo "Job complete"
18 exit
FILE: RFTAB.SH
This file locates frequencies in the range of interest and creates
one table of frequencies and another table of peak areas of those
frequencies
01 #!/bin/bash
02 ### Generate frequency charts using Gaussian output
03 ### Establish math variables and input file
04 ### load global variables from file gvar
05 SIGMA=$(grep SIGMA gvar | awk '{print $2}')
06 XMIN=$(grep XMIN gvar | awk '{print $2}')
07 XMAX=$(grep XMAX gvar | awk '{print $2}')
08 NSIG=$(grep NSIG gvar | awk '{print $2}')
09 GAIN=$(grep GAIN gvar | awk '{print $2}')
10 LOFREQ=$(grep LOFREQ gvar | awk '{print $2}')
11 HIFREQ=$(grep HIFREQ gvar | awk '{print $2}')
12 OUT=$1
13 FILE=$(echo $OUT.freq)
14 echo $FILE
15 ### Make column of FREQ and RAMAN so they are easier to work with
16 grep FREQ $FILE | sed 's/\(\.[0-9]\{4\}\)/\1\n/g' | tr -d " " | tr -
d FREQ | sed '/^$/d' >$FILE.ft
17 grep RAMN $FILE | sed 's/\(\.[0-9]\{4\}\)/\1\n/g' | tr -d " " | tr -
d RAMN | sed '/^$/d' >$FILE.rt
18 NFREQ=$(wc -l $FILE.ft | awk '{print $1}')
19 echo $NFREQ frequencies identified
20 if [ -f $FILE.ftab ];
21 then
22 rm $FILE.ftab
23 fi
24 if [ -f $FILE.atab ];
25 then
26 rm $FILE.atab
27 fi
28 for i in $(seq 1 $NFREQ); do
29 MU=$(cat $FILE.ft | sed -n ''$i'p')
30 MU=$(./gzround.sh $MU)
31 RAMINT=$(cat $FILE.rt | sed -n ''$i'p')
100
32 AREA=$(echo "scale=0; $GAIN*$RAMINT" | bc)
33 AREA=$(./gzround.sh $AREA)
34 if [ "$MU" -gt "$LOFREQ" ];
35 then
36 if [ "$MU" -lt "$HIFREQ" ];
37 then
38 echo Freq $MU and Intensity $AREA is number $i of $NFREQ
39 echo $MU >> $FILE.ftab
40 echo $AREA >> $FILE.atab
41 else
42 echo Freq $MU is too high and will be ignored
43 fi
44 else
45 echo Freq $MU is too low and will be ignored
46 fi
47 done
48 rm $FILE.ft $FILE.rt
49 echo Frequency and Area Tables complete and saved as $FILE.ftab and
$FILE.atab
50 exit
FILE: SFTAB.SH
Using the frequencies and peak areas generated in the last file,
this file generates a Normal distribution chart for each frequency
01 #!/bin/bash
02 ### Generate frequency charts using Gaussian output
03 ### Establish math variables and input file
04 SIGMA=$(grep SIGMA gvar | awk '{print $2}')
05 XMIN=$(grep XMIN gvar | awk '{print $2}')
06 XMAX=$(grep XMAX gvar | awk '{print $2}')
07 NSIG=$(grep NSIG gvar | awk '{print $2}')
08 GAIN=$(grep GAIN gvar | awk '{print $2}')
09 LOFREQ=$(grep LOFREQ gvar | awk '{print $2}')
10 HIFREQ=$(grep LOFREQ gvar | awk '{print $2}')
11 OUT=$1
12 FILE=$(echo $OUT.freq)
13 MINDIST=$[$NSIG*$SIGMA]
14 IEXP=$(echo "scale=3; -1/(2*$SIGMA^2)" | bc)
15 ZERO=$((0))
16 ### Input the number of frequencies and number of areas as variables
17 NFREQ=$(wc -l $FILE.ftab | awk '{print $1}')
18 NAREA=$(wc -l $FILE.atab | awk '{print $1}')
19 if [ "$NFREQ" != "$NAREA" ]
20 then
21 echo Files $FILE.ftab and $FILE.atab do not match, $NFREQ , $NAREA
22 else
23 for i in $(seq 1 $NFREQ); do
24 SAV=$(echo $FILE.$i)
25 if [ -f $SAV ]
26 then
27 rm $FILE.$i
28 fi
29 MU=$(cat $FILE.ftab | sed -n ''$i'p')
30 AREA=$(cat $FILE.atab | sed -n ''$i'p')
31 XSTART=$(echo "scale=0; $MU-$MINDIST" | bc)
32 XEND=$(echo "scale=0; $MU+$MINDIST" | bc)
33 if [ "$XSTART" -lt "$XMIN" ]
101
34 then
35 XSTART=$XMIN
36 fi
37 if [ "$XEND" -gt "$XMAX" ]
38 then
39 XEND=$XMAX
40 fi
41 for X in $(seq $XSTART $XEND); do
42 Y=$(echo "scale=8; $AREA*e($IEXP*($X-$MU)^2)" | bc -l)
43 Y=$(./gzround.sh $Y)
44 echo "$X $Y" >> $FILE.$i
45 echo Calculated $X,$Y for Freq $MU, $i of $NFREQ
46 done
47 echo FILE $FILE.$i COMPLETED
48 done
49 fi
50 echo Job Complete. $i files created
51 exit
FILE: TCOMB.SH
Using the Normal distribution charts generated with the last file,
this file aligns each table and combines them into one large multicolum
table
01 #!/bin/bash
02 ### Generate frequency charts using Gaussian output
03 ### Establish math variables and input file
04 ### File form of *.out.freq.ftab
05 SIGMA=$(grep SIGMA gvar | awk '{print $2}')
06 XMIN=$(grep XMIN gvar | awk '{print $2}')
07 XMAX=$(grep XMAX gvar | awk '{print $2}')
08 OUT=$1
09 FILE=$(echo $OUT.freq)
10 ### Make column of FREQ and RAMAN so they are easier to work with
11 NFREQ=$(wc -l $FILE.ftab | awk '{print $1}')
12 echo $NFREQ is nfreq
13 for i in $(seq 1 $NFREQ); do
14 cat $FILE.$i | awk '{print $2}' > $FILE.b.$i
15 done
16 for i in $(seq 1 $NFREQ); do
17 if [ -f lead ]
18 then
19 rm lead
20 fi
21 if [ -f follow ]
22 then
23 rm follow
24 fi
25 XSTART=$(cat $FILE.$i | awk 'NR==1 {print $1}')
26 XEND=$(cat $FILE.$i | awk 'END {print $1}')
27 LEAD=$(echo "scale=0; $XSTART-$XMIN" | bc)
28 FOLLOW=$(echo "scale=0; $XMAX-$XEND" | bc)
29 echo lead $LEAD follow $FOLLOW xstart $XSTART xend $XEND file $i of
$NFREQ
30 for b in $(seq 1 $LEAD); do
31 echo "0" >> lead
32 done
102
33 for b in $(seq 1 $FOLLOW); do
34 echo "0" >> follow
35 done
36 if [ -f lead ]
37 then
38 if [ -f follow ]
39 then
40 cat lead $FILE.b.$i follow > $FILE.c.$i
41 else
42 cat lead $FILE.b.$i > $FILE.c.$i
43 fi
44 else
45 if [ -f follow ]
46 then
47 cat $FILE.b.$i follow > $FILE.c.$i
48 else
49 cat $FILE.b.$i > $FILE.c.$i
50 fi
51 fi
52 rm $FILE.b.$i
53 NL=$(wc -l $FILE.c.$i)
54 echo Written $NL
55 done
56 if [ -f lead ]
57 then
58 rm lead
59 fi
60 if [ -f follow ]
61 then
62 rm follow
63 fi
64 echo $i files processed. Consolidating...
65 TFIL=$(ls $FILE.c.*)
66 paste $TFIL > $FILE.d
67 for i in $(seq 1 $NFREQ); do
68 rm $FILE.c.$i
69 done
70 echo Job Complete. File $FILE.d generated
71 exit
FILE: TCOMP.SH
Using the above multicolum table, this file adds the values of all y-
columns to generate a final table of Frequency vs. Intensity
01 #!/bin/bash
02 ### Generate x,y freq chart using files from talign.sh
03 XMIN=$(grep XMIN gvar | awk '{print $2}')
04 XMAX=$(grep XMAX gvar | awk '{print $2}')
05 OUT=$1
06 FILE=$(echo $OUT.freq)
07 ### number of lines is
08 NLINE=$(wc -l $FILE.d | awk '{print $1}')
09 NCOL=$(cat $FILE.d | sed -n '1p' | awk '{print NF}')
10 echo nline $NLINE
11 echo ncol $NCOL
12 cat $FILE.d | awk '{x=0; for(i=1; i<=NF; i++) {x+=$i}; print x }' >
$FILE.ye
103
13 if [ -f $FILE.xe ]
14 then
15 rm $FILE.xe
16 fi
17 for i in $(seq $XMIN $XMAX); do
18 echo $i >> $FILE.xe
19 done
20 paste $FILE.xe $FILE.ye > $FILE.comp
21 rm $FILE.xe $FILE.ye
22 echo Job Complete. $FILE.comp written.
23 exit
FILE: CLEANFREQ.SH
This file removes any intermediate files left by the previous scripts
01 #!/bin/bash
02 ### Generate frequency charts using Gaussian output
03 ### Establish math variables and input file
04 XMIN=$(grep XMIN gvar | awk '{print $2}')
05 XMAX=$(grep XMAX gvar | awk '{print $2}')
06 OUT=$1
07 FILE=$(echo $OUT.freq)
08 NFREQ=$(wc -l $FILE.ftab | awk '{print $1}')
09 ### Make sure the output file has the correct number of lines before
proceeding
10 REQLINE=$(echo "scale=0; $XMAX-$XMIN+1" | bc)
11 LINE=$(wc -l $FILE.comp | awk '{print $1}')
12 if [ "$REQLINE" -eq "$LINE" ]
13 then
14 for i in $(seq 1 $NFREQ); do
15 SAV=$(echo $FILE.$i)
16 if [ -f $SAV ]
17 then
18 rm $SAV
19 fi
20 done
21 SAV=$(echo $FILE.$i)
22 SAV=$(echo $FILE.d)
23 if [ -f $SAV ]
24 then
25 rm $SAV
26 fi
27 SAV=$(echo $FILE)
28 if [ -f $SAV ]
29 then
30 rm $SAV
31 fi
32 SAV=$(echo $FILE.ftab)
33 if [ -f $SAV ]
34 then
35 rm $SAV
36 fi
37 SAV=$(echo $FILE.atab)
38 if [ -f $SAV ]
39 then
40 rm $SAV
41 fi
42 echo $FILE.comp intermediate files have been cleaned up.
104
43 else
44 echo $FILE.comp is invalid
45 fi
46 exit
3.6 References
[1] J.J. Bravo-Suárez, K.K. Bando, J. Lu, M. Haruta, T. Fujitani, S.T. Oyama, J. Phys.
Chem. C 112 (2008) 1115.
[2] C. Li, J. Catal. 216 (2003) 203.
[3] B. Chowdhury, J.J. Bravo- Suárez, N. Mimura, J. Lu, K.K. Bando, S. Tsubota, M.
Haruta, J. Phys. Chem. B 110 (2006) 22995.
[4] S. Bordiga, A. Damin, F. Bonino, G. Ricchiardi, C. Lamberti, A. Zecchina,
Angew. Chem. Int. Ed. 41 (2002) 4734.
[5] F.-Z. Zhang, X.-W. Guo, X.-S. Wang, G. Li, J.-C. Zhou, J.-Q. Yu, C. Li, Catal.
Lett 72 (2001) 235.
[6] F. Bonino, A. Damin, G. Ricchiardi, M. Ricci, G. Spanò, R. D’Aloisio, A.
Zecchina, C. Lamberti, C. Prestipino, S. Bordiga, J. Phys. Chem. B 108 (2004) 3573.
[7] C. Li, G. Xiong, J. Liu, P. Ying, Q. Xin, Z. Feng, J. Phys Chem. B 105 (2001)
2993.
[8] Tam T. Nguyen, Norman Sheppard, J.C.S. Chem. Comm 596 (1978) 868.
[9] L. Seguin, M. Figlarz, R. Cavagnat, J.-C. Lassegues, Spectrochim. Acta A 51
(1995) 1323.
[10] S. Bordiga, A. Damin, F. Bonino, G. Ricchiardi, A. Zecchina, R. Tagliapietra ,C.
Lamberti, Phys. Chem. Chem. Phys. 5 (2003) 4390-4393.
[11] Can Li, Guang Xiong, Jianke Liu, Pinliang Ying, Qin Xin, and Zhaochi Feng, J.
Phys. Chem. B 105 (2001) 2993.
105
[12] L.M Sverdlov, M.A. Kovner, E.P. Krainov, Vibrational Spectra of Polyatomic
Models, John Wiley & Sons, New York, 1974. Translation of Kolebatel’nye Spektry
Mnogoatomnykh Molekul, Moscow, 1970.
[13] George Socrates, Infrared and Raman Characteristic Group Frequencies, 3rd ed.,
John Wiley & Sons, New York, 2001.
[14] S. Fraga, J.M.G. de la Vega, E.S. Fraga, The Schrodinger and Riccati Equations,
Springer-Verlag, Berlin, 1999.
[15] D. Shriver, P. Atkins, Inorganic Chemistry, 3rd ed., W. H. Freeman and Company,
New York, 1999.
[16] W.Kohn, Rev. Mod. Phys. 71 (1999) 1253.
[17] S. H. Vosko, L. Wilk, M. Nusair, Can. J. Phys. 58 (1980) 1200.
[18] W. Koch, M.C. Holthausen, A Chemist's Guide to Density Functional Theory,
Wiley-VCH, Weinheim, 2000.
[19] K.K. Irikura, R.D. Johnson III, R.N. Kacker, J. Phys. Chem. A 109 (2005) 8430.
[20] T.A. Nijhuis, E. Sacaliuc, A.M. Beale, A.M.J. van der Eerden, J.C. Schouten,
B.M. Weckhuysen, J. Catal. 258 (2008) 256.
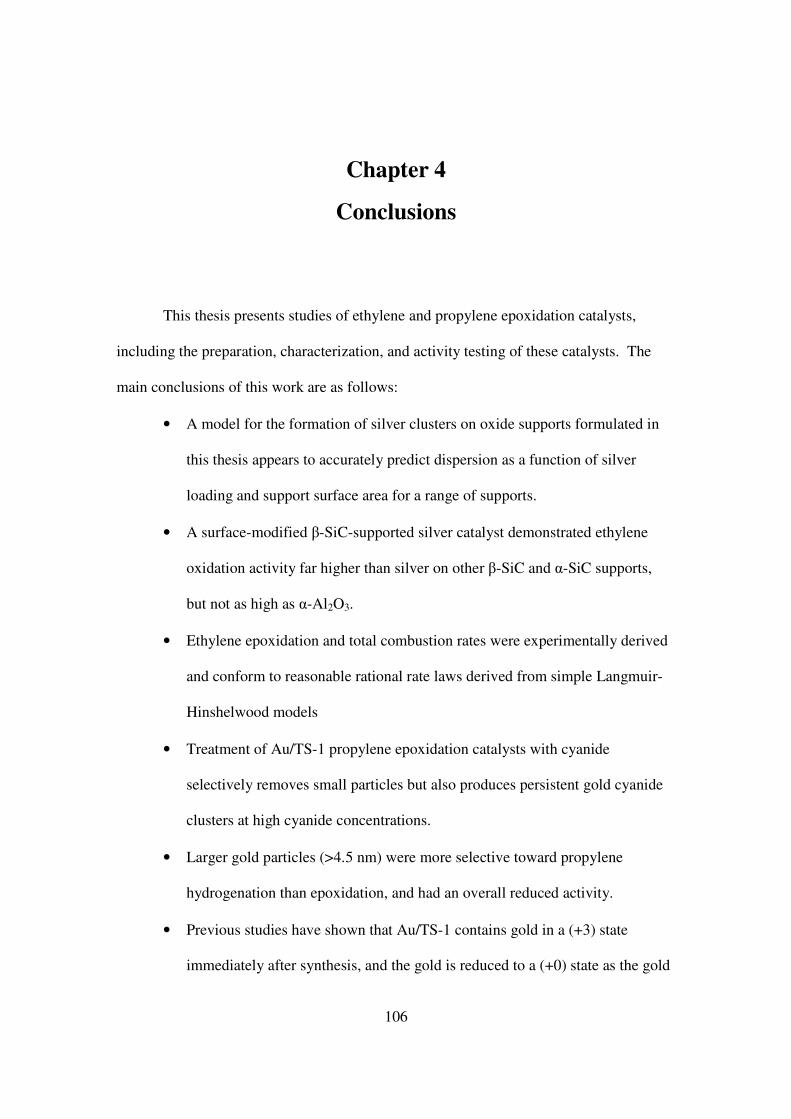
106
Chapter 4
Conclusions
This thesis presents studies of ethylene and propylene epoxidation catalysts,
including the preparation, characterization, and activity testing of these catalysts. The
main conclusions of this work are as follows:
• A model for the formation of silver clusters on oxide supports formulated in
this thesis appears to accurately predict dispersion as a function of silver
loading and support surface area for a range of supports.
• A surface-modified β-SiC-supported silver catalyst demonstrated ethylene
oxidation activity far higher than silver on other β-SiC and α-SiC supports,
but not as high as α-Al2O3.
• Ethylene epoxidation and total combustion rates were experimentally derived
and conform to reasonable rational rate laws derived from simple Langmuir-
Hinshelwood models
• Treatment of Au/TS-1 propylene epoxidation catalysts with cyanide
selectively removes small particles but also produces persistent gold cyanide
clusters at high cyanide concentrations.
• Larger gold particles (>4.5 nm) were more selective toward propylene
hydrogenation than epoxidation, and had an overall reduced activity.
• Previous studies have shown that Au/TS-1 contains gold in a (+3) state
immediately after synthesis, and the gold is reduced to a (+0) state as the gold
107
is heated in hydrogen and oxygen prior to reaction. X-ray absortion
spectroscopy (XAS) was used to demonstrate a similar effect for nanoscale
gold cyanide clusters, where were reduced from (+3) to (+1) under the same
conditions.
• Nanoscale gold (+1) cyanide clusters, which have not been previously studied
as a catalyst, are surprisingly active for propylene hydrogenation.
• Raman spectroscopy of the TS-1 and Au/TS-1 surfaces can be accomplished
by using a surface treatment of low-temperature ozone to reduce fluorescence.
• A rich adsorption spectrum of propylene on TS-1 and Au/TS-1 can be
observed using a 514.5 nm excitation laser.
• Reduction in intensity of propylene spectral features was used to demonstrate
competition of hydrogen and oxygen for propylene sites.
• Density functional theory (DFT) was used to validate the adsorption of
propylene by π-bond, by demonstrating increased energy of out-of-plane
vibrations.
• Langmuir adsorption isotherms were observed for propylene on TS-1 and
Au/TS-1, and a scaling factor derived from propylene uptake experiments
allowed these isotherms to be presented in terms of propylene coverage of
titanium.


![Stability Phenomena in Novel Electrode Materials for ...170724/FULLTEXT01.pdf · EPDM Ethylene propylene diene copolymer ... chemical intercalation was now defined [1, 2]. ... In](https://img.pdfslide.tips/doc/110x75/5b0ce5f47f8b9a02508cde0a/stability-phenomena-in-novel-electrode-materials-for-170724fulltext01pdfepdm.jpg)