Embed Size (px)
Citation preview
GE Capital
Overview / Strategy
“This document contains “forward-looking statements”- that is, statements related to future, not past, events. In this context, forward-looking statements often address our expected future business and financial performance, and often contain words such as “expect,” “anticipate,” “intend,” “plan,” believe,” “seek,” or “will.” Forward-looking statements by their nature address matters that are, to different degrees, uncertain. For us, particular uncertainties that could adversely or positively affect our future results include: the behavior of financial markets, including fluctuations in interest and exchange rates and commodity and equity prices; the commercial and consumer credit environment; the impact of regulation and regulatory and legal actions; strategic actions, including acquisitions and dispositions; future integration of acquired businesses; future financial performance of major industries which we serve, including, without limitation, the air and rail transportation, energy generation, media, real estate and healthcare industries; and numerous other matters of national, regional and global scale, including those of a political, economic, business and competitive nature. These uncertainties may cause our actual future results to be materially different than those expressed in our forward-looking statements. We do not undertake to update our forward-looking statements."
2013 third quarter

GE
3
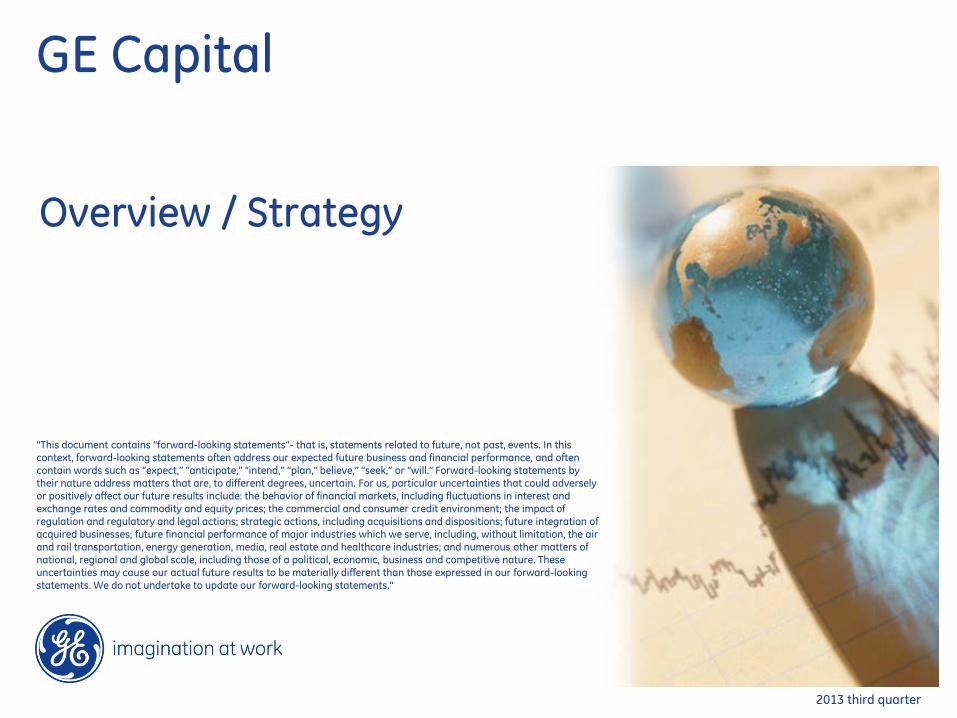
GE’s portfolio
Transportation
$5.6B
$1.0B
Revenue
Operating profit
Power & Water
$28.3B
$5.4B
Energy Management
$7.4B
$0.1B
Oil & Gas
$15.2B
$1.9B
Aviation
$20.0B
$3.7B
Home & Business
$8.0B
$0.3B
Capital
$45.9B
$7.4B
Healthcare
$18.3B
$2.9B
(Total Year 2012 figures)
$147 billion in revenue
52% revenue outside the U.S
$16 billion operating earnings
15% industrial ROTC
$11B industrial CFOA
$7 billion dividends paid
Revenue
Operating profit
4 2013 third quarter
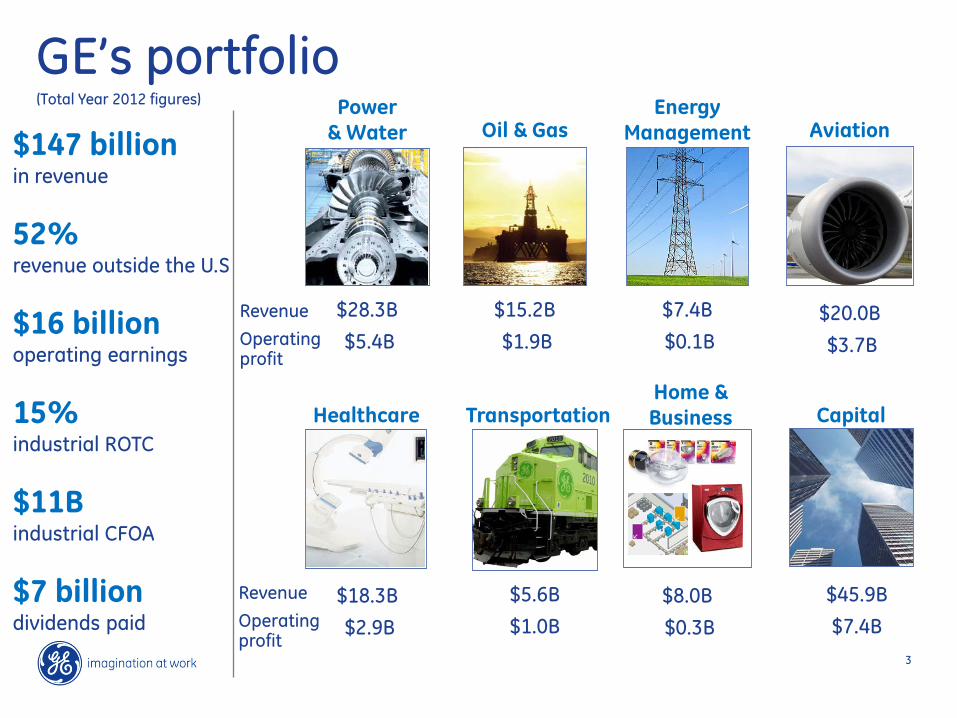
($ in billions)
Infrastructure orders in backlog
3Q’13 orders - $25.7B Largest backlog in history
Equip.
Svcs.
$175 $204 $200 $201 $203 $210 $216 $223 $229 Equipment +32% … book-to-bill 1.2
Service orders +5% with 5/6 segments … PGS +8%, +14% ex. Europe; Aviation commercial spares +9%
Every segment positive
Broad regional growth … U.S. +18%, Europe +17%, growth markets +22% … Russia/CIS +51%, ANZ +36%, SSA +18%, MENAT +17%, China +17%, ASEAN 2x, Canada +10%
Backlog +$6B … Aviation & Transportation
Solid orders performance … very broad based Equipment & services backlog expansion continues
5 2013 third quarter
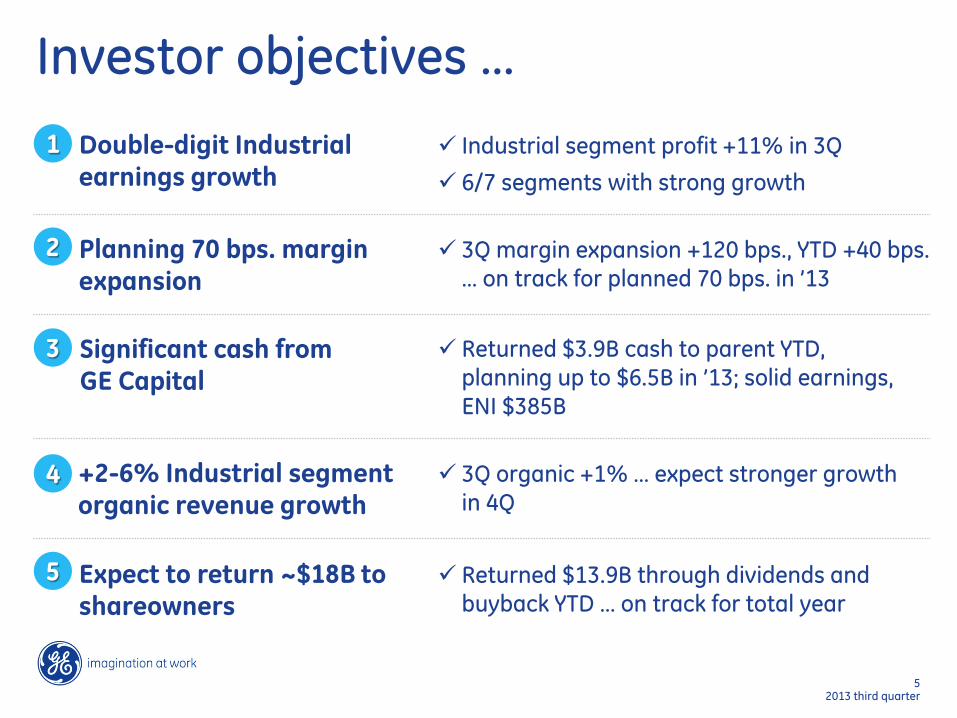
Investor objectives …
Double-digit Industrial earnings growth
1 Industrial segment profit +11% in 3Q
6/7 segments with strong growth
2 Planning 70 bps. margin expansion
3Q margin expansion +120 bps., YTD +40 bps. … on track for planned 70 bps. in ’13
Returned $3.9B cash to parent YTD, planning up to $6.5B in ’13; solid earnings, ENI $385B
Significant cash from GE Capital
3
Returned $13.9B through dividends and buyback YTD … on track for total year
Expect to return ~$18B to shareowners
5
4 +2-6% Industrial segment organic revenue growth
3Q organic +1% … expect stronger growth in 4Q
6 2013 third quarter
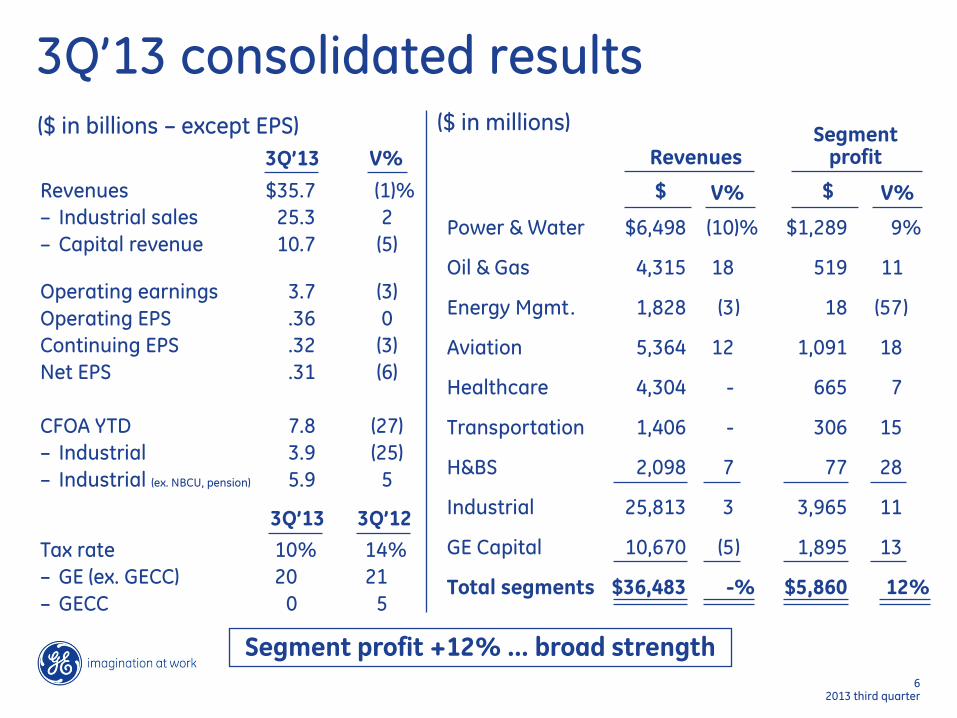
3Q’13 consolidated results
Revenues $35.7 (1)% – Industrial sales 25.3 2 – Capital revenue 10.7 (5)
Operating earnings 3.7 (3) Operating EPS .36 0 Continuing EPS .32 (3) Net EPS .31 (6) CFOA YTD 7.8 (27) – Industrial 3.9 (25) – Industrial (ex. NBCU, pension) 5.9 5
3Q’13 V% Segment
profit
Power & Water $6,498 (10)% $1,289 9%
Oil & Gas 4,315 18 519 11
Energy Mgmt. 1,828 (3 ) 18 (57 )
Aviation 5,364 12 1,091 18
Healthcare 4,304 - 665 7
Transportation 1,406 - 306 15
H&BS 2,098 7 77 28
Industrial 25,813 3 3,965 11
GE Capital 10,670 (5 ) 1,895 13
Total segments $36,483 -% $5,860 12%
Revenues
$ V% $ V%
($ in billions – except EPS)
3Q’13 3Q’12
($ in millions)
Tax rate 10% 14% – GE (ex. GECC) 20 21 – GECC 0 5
Segment profit +12% … broad strength
GE Capital
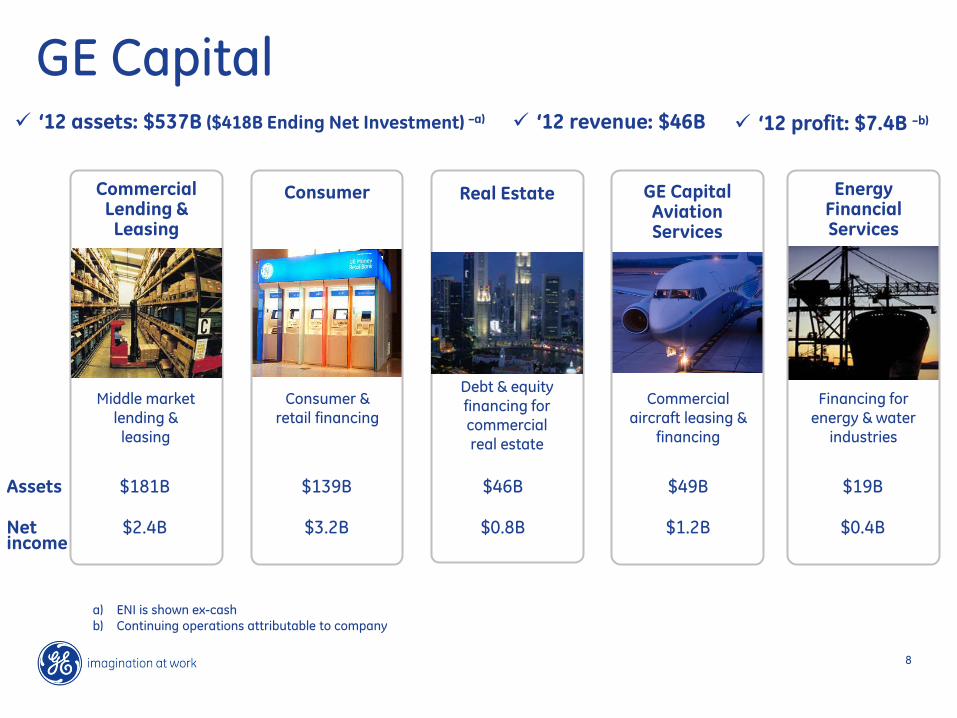
8
GE Capital ‘12 revenue: $46B ‘12 assets: $537B ($418B Ending Net Investment) –a) ‘12 profit: $7.4B –b)
a) ENI is shown ex-cash b) Continuing operations attributable to company
GE Capital Aviation Services
Commercial aircraft leasing &
financing
$49B
Consumer
Consumer & retail financing
$139B
Real Estate
Debt & equity financing for commercial real estate
$46B
Energy Financial Services
Financing for energy & water
industries
$19B
Middle market lending &
leasing
Commercial Lending &
Leasing
$181B
$1.2B $3.2B $0.8B $0.4B $2.4B
Assets
Net income
9
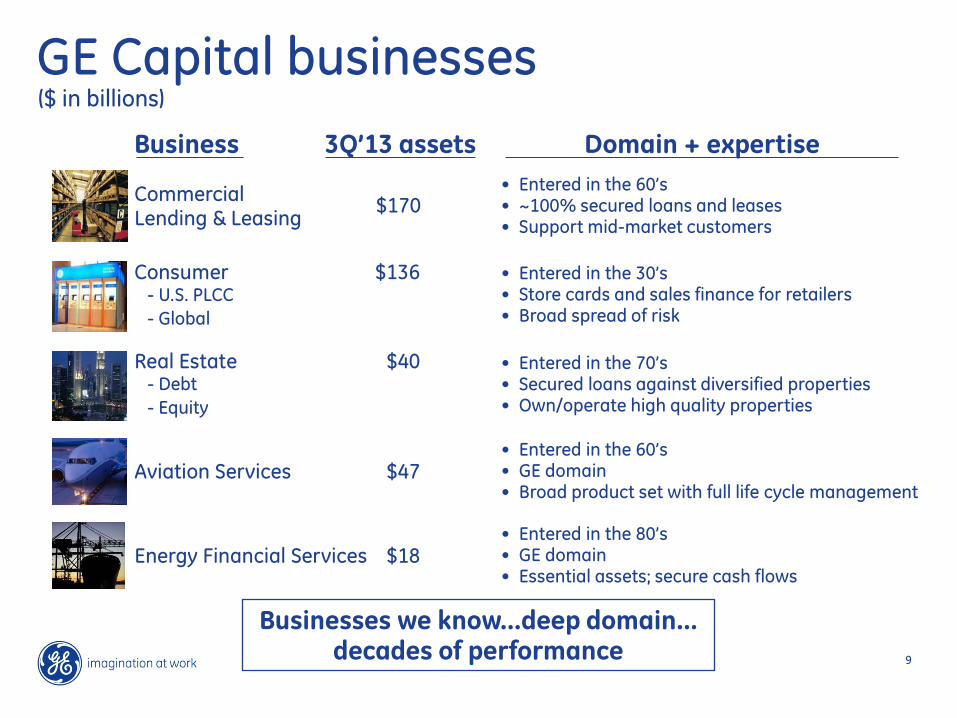
GE Capital businesses Business
Commercial Lending & Leasing
3Q’13 assets • Entered in the 60’s • ~100% secured loans and leases • Support mid-market customers
• Entered in the 70’s • Secured loans against diversified properties • Own/operate high quality properties
• Entered in the 30’s • Store cards and sales finance for retailers • Broad spread of risk
• Entered in the 60’s • GE domain • Broad product set with full life cycle management
• Entered in the 80’s • GE domain • Essential assets; secure cash flows
Domain + expertise
Businesses we know…deep domain… decades of performance
Real Estate $40 - Debt - Equity
Consumer $136 - U.S. PLCC - Global
Aviation Services $47
Energy Financial Services $18
($ in billions)
$170
10 2013 third quarter
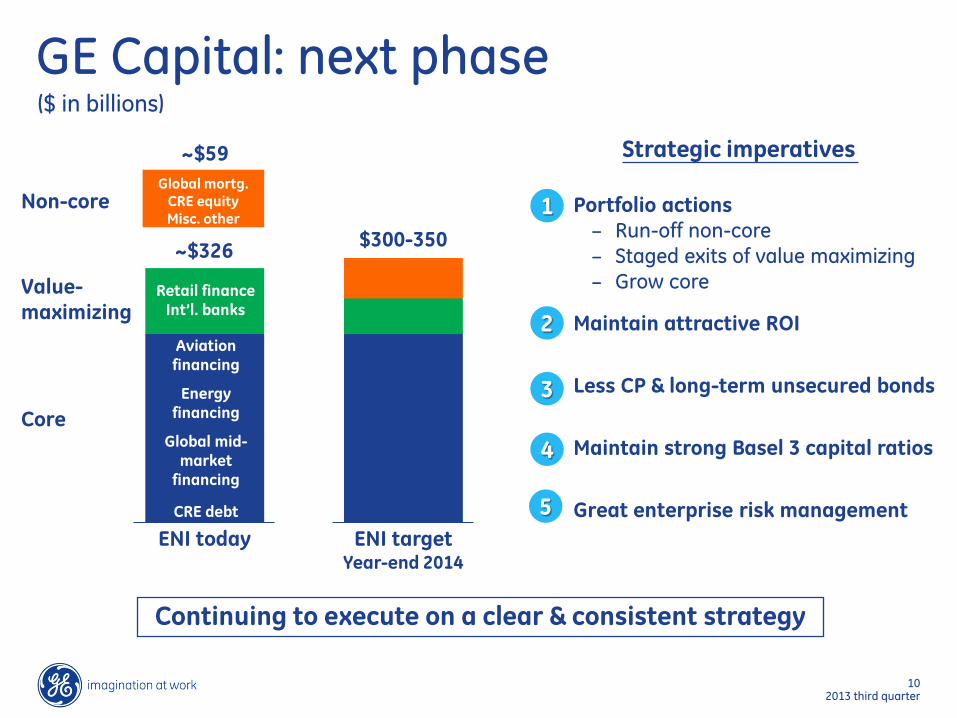
GE Capital: next phase
Aviation financing
Energy financing
Global mid-market
financing
CRE debt
Retail finance Int’l. banks
Global mortg. CRE equity Misc. other
Non-core
Value- maximizing
Core
~$59
~$350
ENI today
$300-350
ENI target Year-end 2014
Portfolio actions ‒ Run-off non-core ‒ Staged exits of value maximizing ‒ Grow core
Maintain attractive ROI
Less CP & long-term unsecured bonds
Maintain strong Basel 3 capital ratios
Great enterprise risk management
Strategic imperatives
($ in billions)
~$326
1
2
3
4
5
Continuing to execute on a clear & consistent strategy
11 2013 third quarter
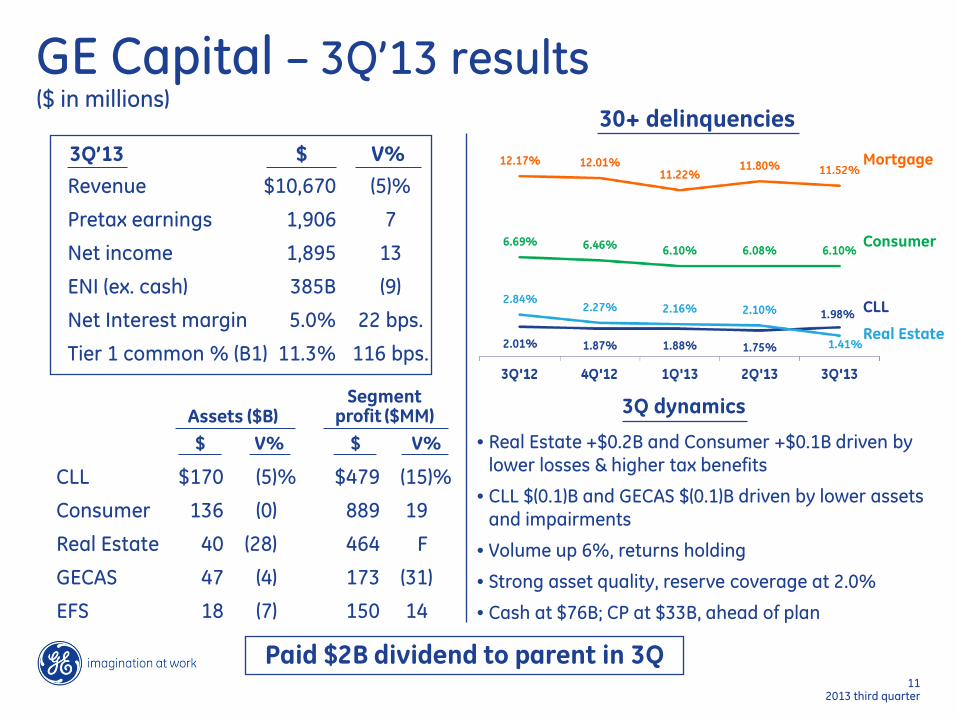
GE Capital – 3Q’13 results
Revenue $10,670 (5)%
Pretax earnings 1,906 7
Net income 1,895 13
ENI (ex. cash) 385B (9)
Net Interest margin 5.0% 22 bps.
Tier 1 common % (B1) 11.3% 116 bps.
CLL $170 (5)% $479 (15)%
Consumer 136 (0) 889 19
Real Estate 40 (28) 464 F
GECAS 47 (4) 173 (31)
EFS 18 (7) 150 14
$ V% 3Q’13
Segment profit ($MM)
$ V% $ V% Assets ($B) 3Q dynamics
• Real Estate +$0.2B and Consumer +$0.1B driven by lower losses & higher tax benefits
• CLL $(0.1)B and GECAS $(0.1)B driven by lower assets and impairments
• Volume up 6%, returns holding
• Strong asset quality, reserve coverage at 2.0%
• Cash at $76B; CP at $33B, ahead of plan
Paid $2B dividend to parent in 3Q
30+ delinquencies
Real Estate
Consumer
Mortgage
CLL
($ in millions)

Funding
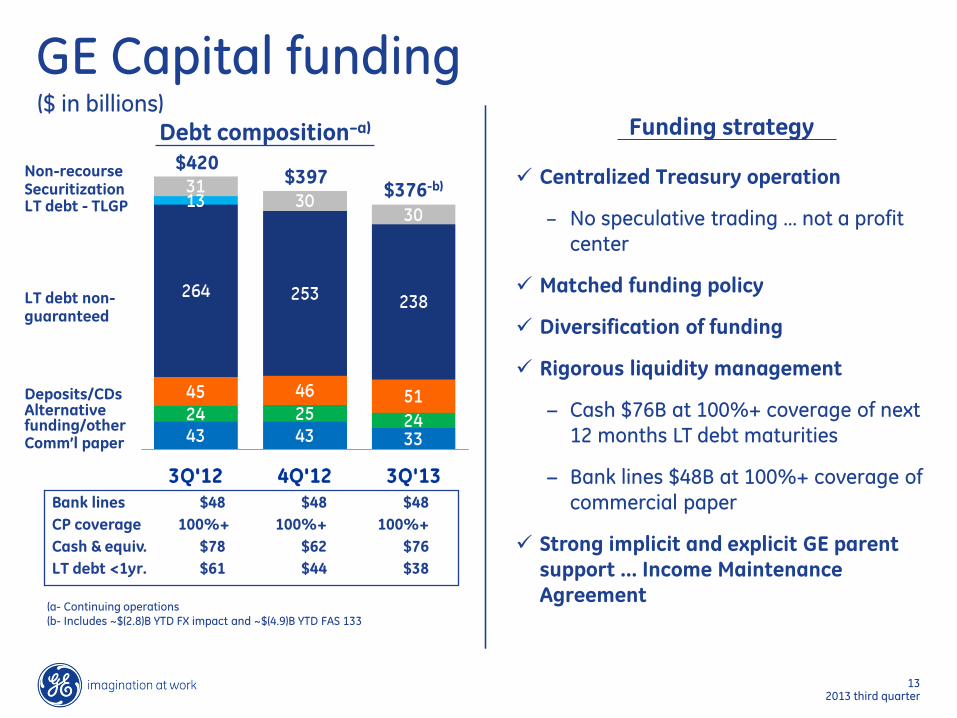
13 2013 third quarter
GE Capital funding ($ in billions)
Debt composition–a)
Comm’l paper
LT debt - TLGP
LT debt non-guaranteed
Alternative funding/other
(a- Continuing operations (b- Includes ~$(2.8)B YTD FX impact and ~$(4.9)B YTD FAS 133
Deposits/CDs
$397 $376-b)
Non-recourse Securitization
$420
Bank lines $48 $48 $48 CP coverage 100%+ 100%+ 100%+ Cash & equiv. $78 $62 $76 LT debt <1yr. $61 $44 $38
Funding strategy
Centralized Treasury operation
‒ No speculative trading … not a profit center
Matched funding policy
Diversification of funding
Rigorous liquidity management
− Cash $76B at 100%+ coverage of next 12 months LT debt maturities
− Bank lines $48B at 100%+ coverage of commercial paper
Strong implicit and explicit GE parent support … Income Maintenance Agreement
14
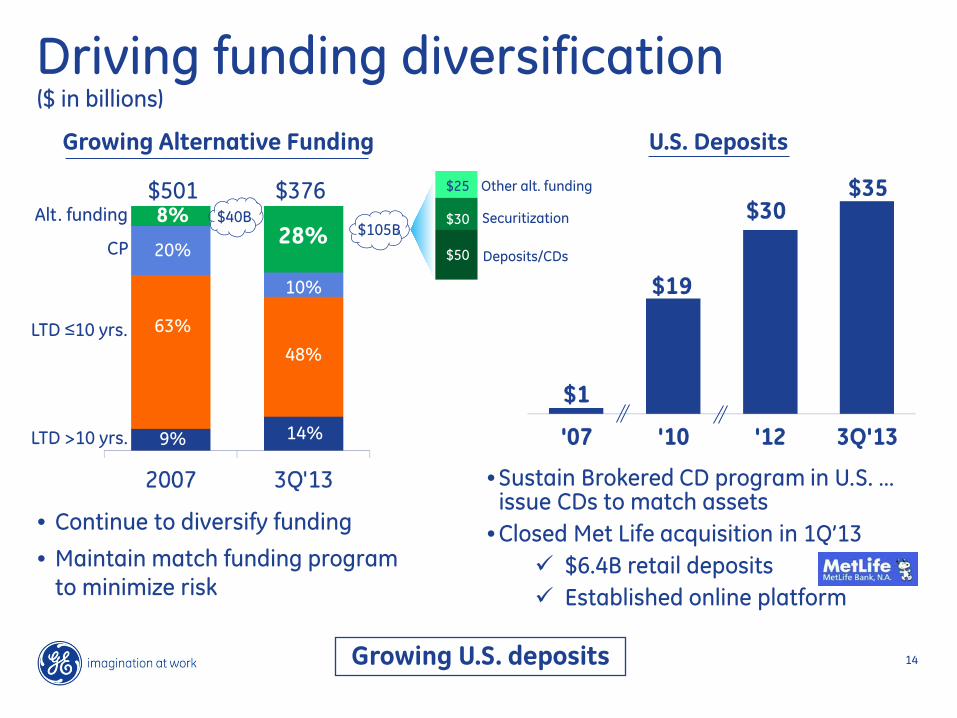
$105B
Growing U.S. deposits
Growing Alternative Funding
($ in billions)
• Continue to diversify funding
• Maintain match funding program to minimize risk
Alt. funding
CP
LTD ≤10 yrs.
LTD >10 yrs.
8%
20%
63%
9%
U.S. Deposits
• Sustain Brokered CD program in U.S. … issue CDs to match assets
• Closed Met Life acquisition in 1Q’13 $6.4B retail deposits Established online platform
$501 Other alt. funding
Securitization
Deposits/CDs
$25
$30
$50 28%
10%
48%
14%
$376 $40B
Driving funding diversification
15
2007 2008 3Q'13 2013Target
Future
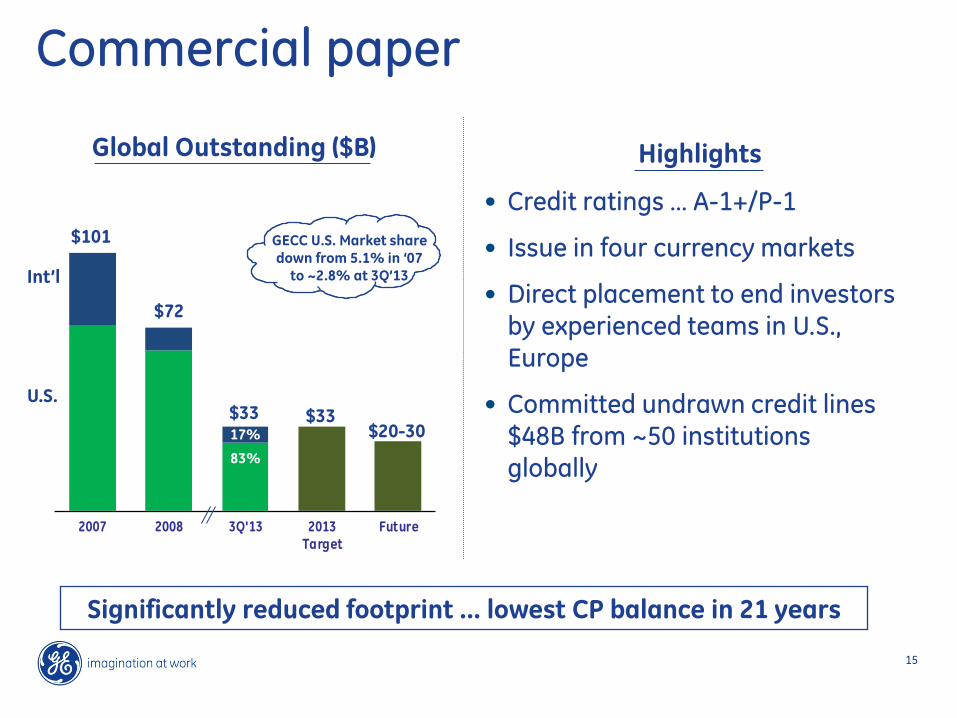
Commercial paper
Significantly reduced footprint … lowest CP balance in 21 years
Global Outstanding ($B)
• Credit ratings … A-1+/P-1
• Issue in four currency markets
• Direct placement to end investors by experienced teams in U.S., Europe
• Committed undrawn credit lines $48B from ~50 institutions globally
17%
83%
GECC U.S. Market share down from 5.1% in ‘07
to ~2.8% at 3Q’13
$72
$101
Highlights
Int’l
U.S. $33 $33
$20-30
16 2013 third quarter
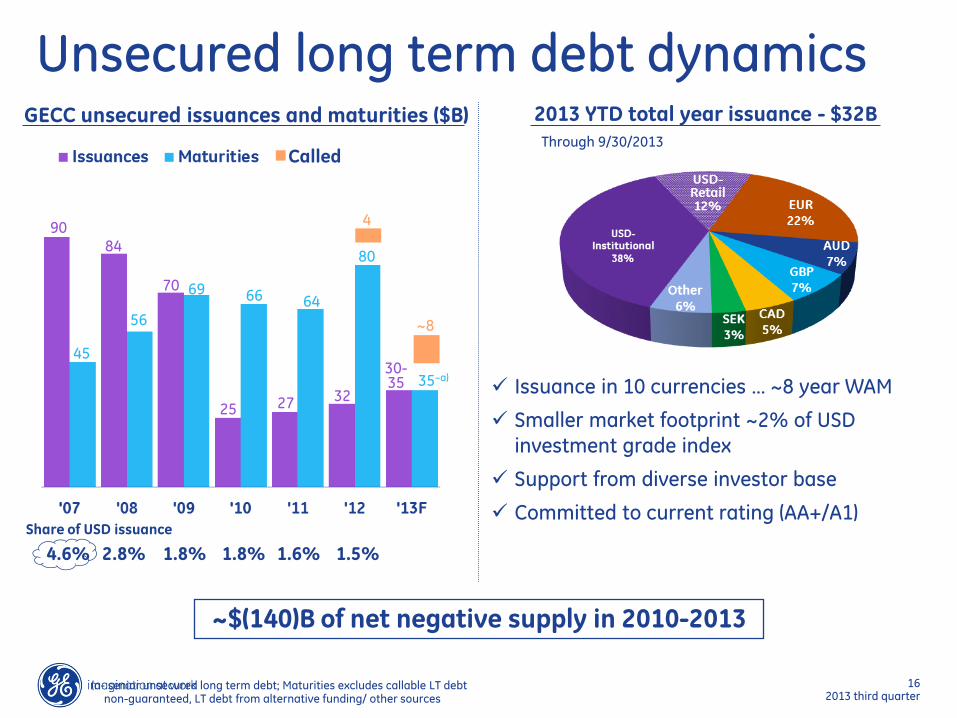
Unsecured long term debt dynamics GECC unsecured issuances and maturities ($B)
90 84
70
25 27
45
56
69 66 64
32
80
35–a) Issuance in 10 currencies … ~8 year WAM
Smaller market footprint ~2% of USD investment grade index
Support from diverse investor base
Committed to current rating (AA+/A1)
(a- senior unsecured long term debt; Maturities excludes callable LT debt non-guaranteed, LT debt from alternative funding/ other sources
Share of USD issuance
4.6% 2.8% 1.8% 1.8% 1.6% 1.5%
~$(140)B of net negative supply in 2010-2013
2013 YTD total year issuance - $32B
30-35
Through 9/30/2013 Called
4
~8
17 2013 third quarter
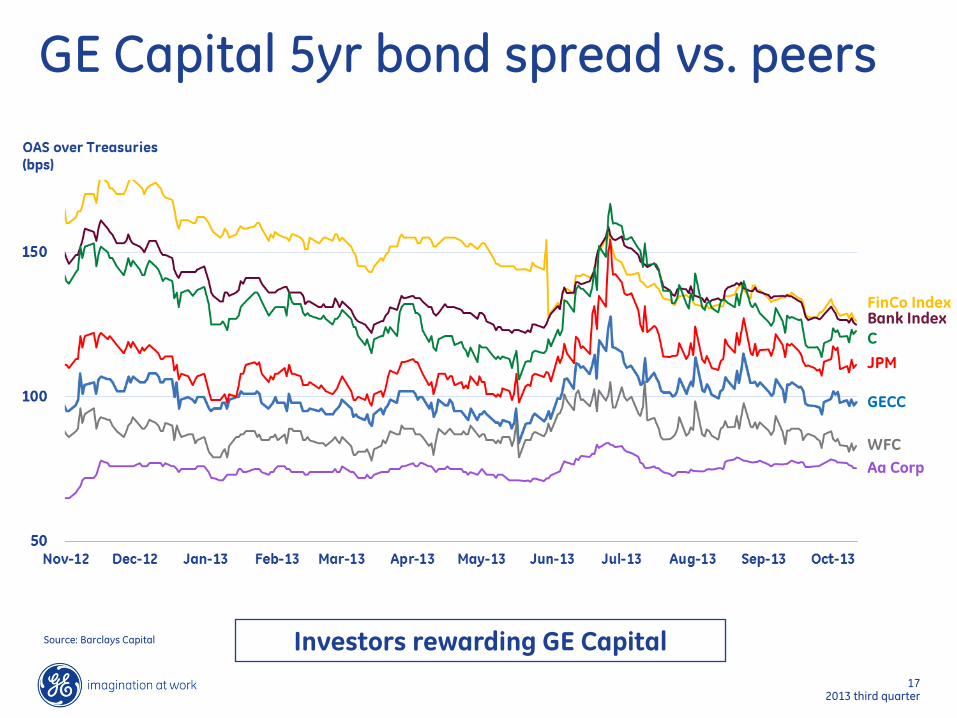
WFC
GECC
Bank Index
JPM
FinCo Index
C
Aa Corp
GE Capital 5yr bond spread vs. peers
Source: Barclays Capital Investors rewarding GE Capital
18 2013 third quarter
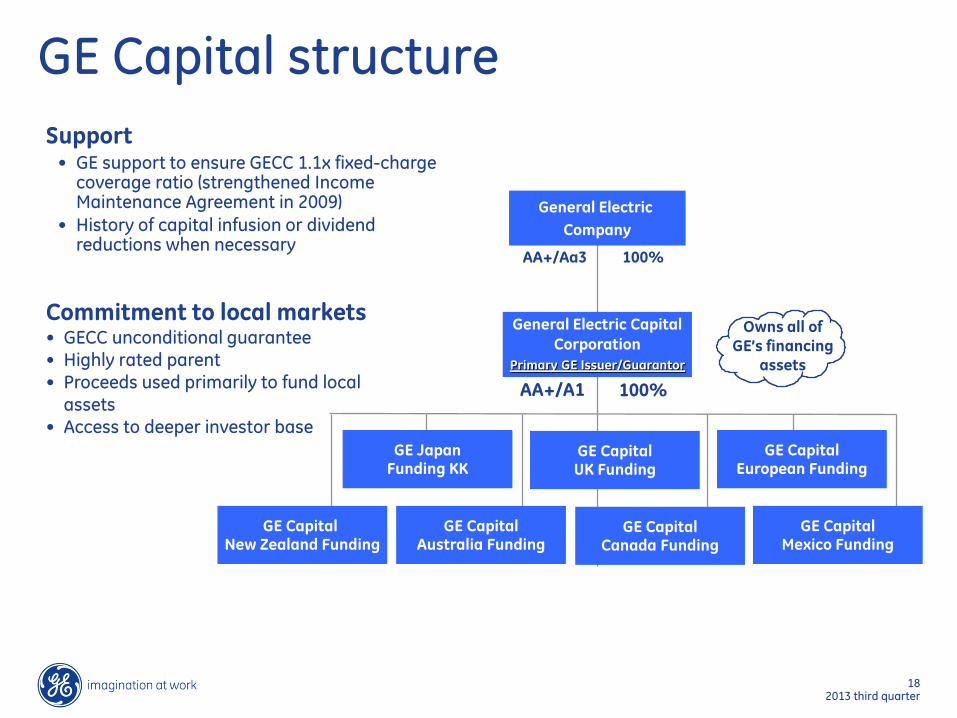
Support • GE support to ensure GECC 1.1x fixed-charge
coverage ratio (strengthened Income Maintenance Agreement in 2009)
• History of capital infusion or dividend reductions when necessary
GE Capital structure
100% AA+/Aa3
General Electric Capital Corporation
Primary GE Issuer/Guarantor
General Electric Company
Owns all of GE’s financing
assets
AA+/A1 100%
Commitment to local markets • GECC unconditional guarantee • Highly rated parent • Proceeds used primarily to fund local
assets • Access to deeper investor base
GE Capital UK Funding
GE Capital Australia Funding
GE Capital European Funding
GE Capital Canada Funding
GE Japan Funding KK
GE Capital New Zealand Funding
GE Capital Mexico Funding
19 2013 third quarter
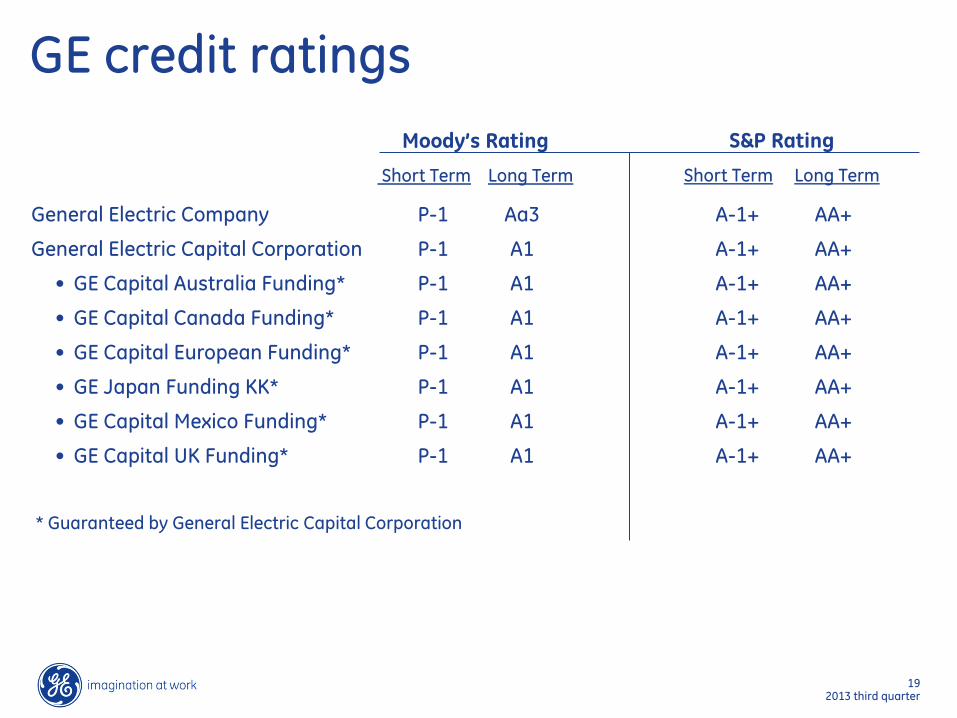
GE credit ratings
General Electric Company P-1 Aa3 A-1+ AA+
General Electric Capital Corporation P-1 A1 A-1+ AA+
• GE Capital Australia Funding* P-1 A1 A-1+ AA+
• GE Capital Canada Funding* P-1 A1 A-1+ AA+
• GE Capital European Funding* P-1 A1 A-1+ AA+
• GE Japan Funding KK* P-1 A1 A-1+ AA+
• GE Capital Mexico Funding* P-1 A1 A-1+ AA+
• GE Capital UK Funding* P-1 A1 A-1+ AA+
* Guaranteed by General Electric Capital Corporation
Moody’s Rating
Short Term Long Term
S&P Rating
Short Term Long Term
20
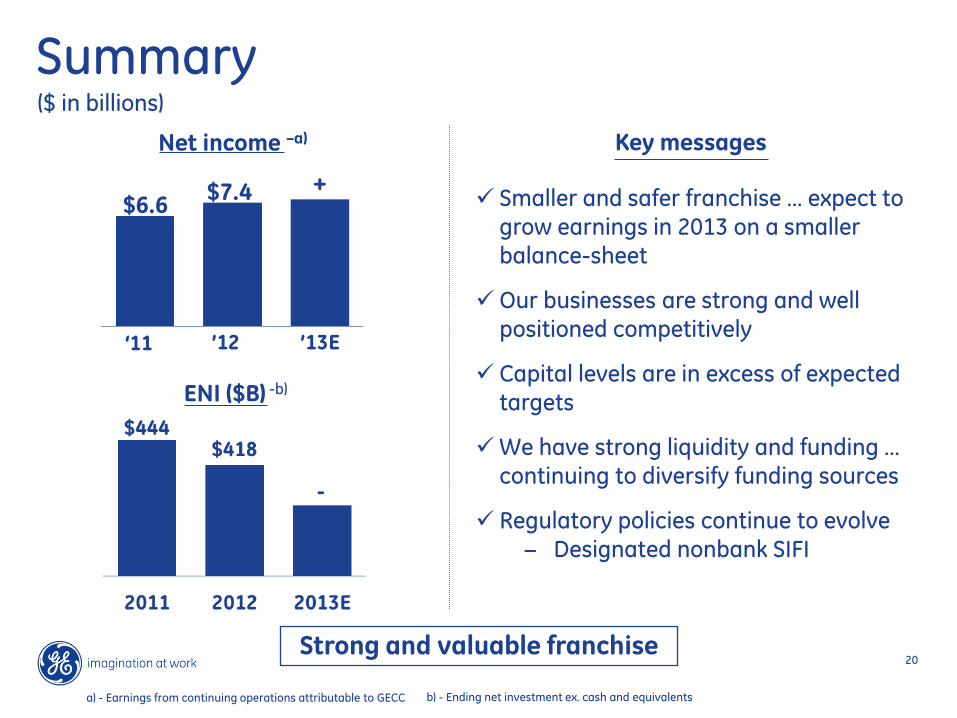
$7.4
Net income –a)
+
’12 ’13E
ENI ($B) -b)
b) - Ending net investment ex. cash and equivalents
Summary
Smaller and safer franchise … expect to grow earnings in 2013 on a smaller balance-sheet
Our businesses are strong and well positioned competitively
Capital levels are in excess of expected targets
We have strong liquidity and funding … continuing to diversify funding sources
Regulatory policies continue to evolve − Designated nonbank SIFI
Key messages
Strong and valuable franchise
($ in billions)
a) - Earnings from continuing operations attributable to GECC
‘11
$6.6


![Implicit and Related Rates Review Solutions[1]](https://img.pdfslide.tips/doc/110x75/553e6095550346933f8b49bb/implicit-and-related-rates-review-solutions1.jpg)