Embed Size (px)
Citation preview
GENERAL MILLS, INC. (NYSE: GIS) Analysts: Cassandra Smalley & Al Clawson January 24, 2010
Targe Price $78.00
Company Profile
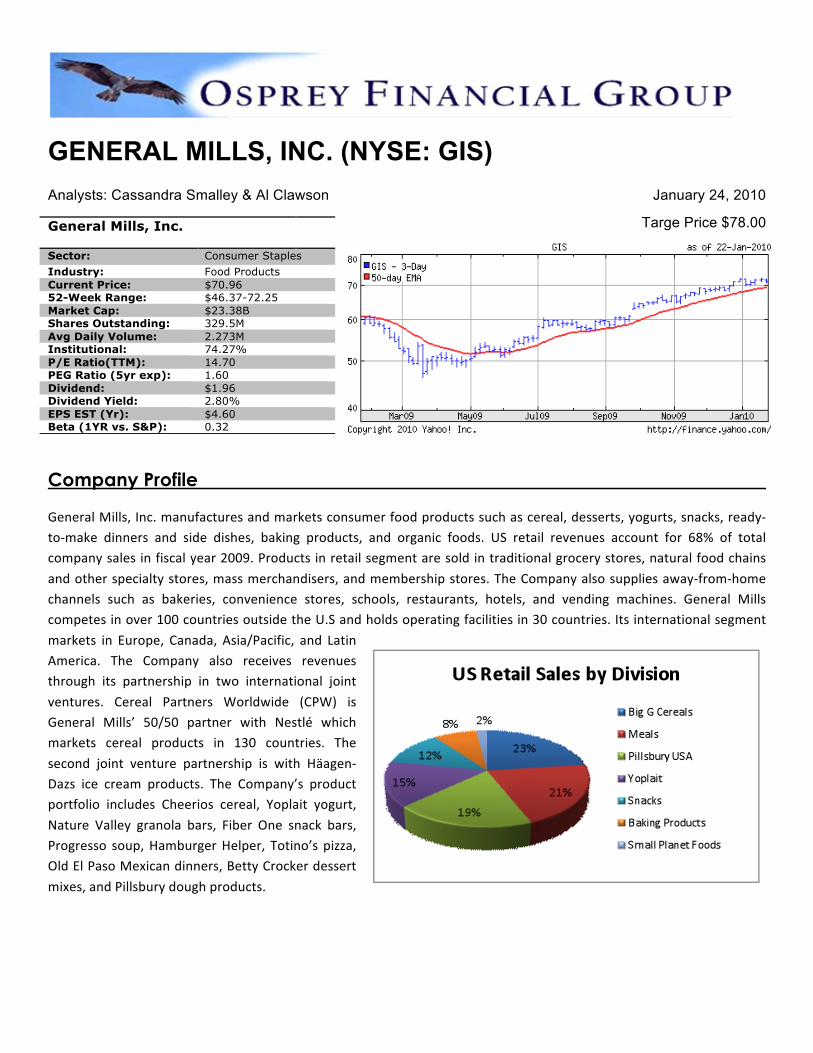
General Mills, Inc. manufactures and markets consumer food products such as cereal, desserts, yogurts, snacks, ready‐to‐make dinners and side dishes, baking products, and organic foods. US retail revenues account for 68% of total company sales in fiscal year 2009. Products in retail segment are sold in traditional grocery stores, natural food chains
and other specialty stores, mass merchandisers, and membership stores. The Company also supplies away‐from‐home channels such as bakeries, convenience stores, schools, restaurants, hotels, and vending machines. General Mills competes in over 100 countries outside the U.S and holds operating facilities in 30 countries. Its international segment
markets in Europe, Canada, Asia/Pacific, and Latin America. The Company also receives revenues through its partnership in two international joint
ventures. Cereal Partners Worldwide (CPW) is General Mills’ 50/50 partner with Nestlé which markets cereal products in 130 countries. The
second joint venture partnership is with Häagen‐Dazs ice cream products. The Company’s product portfolio includes Cheerios cereal, Yoplait yogurt,
Nature Valley granola bars, Fiber One snack bars, Progresso soup, Hamburger Helper, Totino’s pizza, Old El Paso Mexican dinners, Betty Crocker dessert
mixes, and Pillsbury dough products.
General Mills, Inc.
Sector: Consumer Staples Industry: Food Products Current Price: $70.96 52-Week Range: $46.37-72.25 Market Cap: $23.38B Shares Outstanding: 329.5M Avg Daily Volume: 2.273M Institutional: 74.27% P/E Ratio(TTM): 14.70 PEG Ratio (5yr exp): 1.60 Dividend: $1.96 Dividend Yield: 2.80% EPS EST (Yr): $4.60 Beta (1YR vs. S&P): 0.32

General Mills is the market leader in a broad array of food product categories. The table shown to the right provides an indication of the strength of the Company’s products.
Business Model General Mills’ Business Model is centered on Holistic Margin Management (HMM), a company‐wide discipline of leveraging productivity, sales mix and pricing to offset input cost inflation, protect gross margin and reinvest increasing
levels of consumer marketing support to drive growth in net sales. 2009 input cost inflation was 9%, yet HMM allowed the company to hold gross margins steady at 35.6%. By protecting the gross margin, the company generated funds sufficient to afford a 16% increase in marketing over 2008 levels. Strong marketing is the lifeblood of consumer staples
companies such as General Mills, but particularly so in an economic environment where lower‐priced brands receive increased consumer attention. The 2009 marketing programs led to increasing consumer demand, market share and profitability in each operating division as shown below.
The company remains laser focused on creating shareholder
value. In 2006 the company committed to combining good earnings growth with increasing returns on the capital invested in the business. The return on average total capital (ROC) has
improved by an average of 50 basis points per year ever since, and the company anticipates another year of improvement in
2010. Earnings is the primary driver of increasing ROC as the company generated $1.8B in cash in 2009. The cash was used to grow 2009 dividends by 10% to $1.72/share, and 2010
dividends have increased an additional 12% to $1.92/share. Additional cash was used in 2009 to repurchase approximately 1% of common stock outstanding, and another 3% has been repurchased during the 1st half of FY 2010.
Competitive Analysis
General Mills is the second largest producer of ready‐to‐eat cereals in the U.S. behind Kellogg. The Company’s low P/E ratio, favorable profitability and debt ratios, and 3‐Year CAGR measures stand out among the packaged food products industry. With a P/E of 14.7, General Mills is priced at a discount to its competitors Kraft, Campbell Soup, and Kellogg.
High debt ratios are common in the food products industry; however, we view General Mills’ debt ratios and subsequent profitability ratios (ROA, ROC, ROE) more favorably than its larger competitors who are 2.5 times more levered than
Category 2009 Dollar Share %
Rank
Dry dinner Mixes 81 1 Refrigerated Dough 69 1 Fruit Snacks 52 1 Dessert Mixes 41 1 Refrigerated Yogurt 35 1 Grain Snacks 29 1 Frozen Hot Snacks 27 1 Mexican Aisle Products 17 1 Ready‐to‐Serve Soup 35 2 Ready‐to‐Eat Cereal 31 2 Frozen Vegetables 19 2

General Mills. General Mills has produced increasing returns over the last six years (2004‐
2009); the compound annual growth rates for ROA, ROC and ROE are 7.6%, 10.7% and 22.7%, respectively. The 3‐Year CAGR increase of 7%
in Total Revenue indicates that the Company is experiencing benefits from changes in consumer spending habits, increased revenues
through advertising and marketing initiatives, increasing brand loyalty, among other drivers. An 11.8% 3‐Year CAGR Gross Profit indicates that General Mills is improving efficiencies and reducing cost of goods sold. General Mills manages price risk for ingredients such as oats, wheat, corn, soybean, non‐fat dry milk, and energy costs of natural gas and diesel
fuel through derivatives and long‐term contracts with suppliers.
Valuation Ratios ‐ TTM GIS KFT CPB CAG K
TEV/Total Revenue 2.0 1.5 1.9 1.1 2.0
TEV/EBITDA 8.6 9.4 8.8 7.8 10.3
TEV/EBIT 10 10.9 10.5 9.7 12.1
P/E TTM 14.7 17 14.9 13.3 17.2
Price/Book (MRQ) 3.8 1.6 11.8 2.1 10.2
Profitability Measures ‐ TTM GIS KFT CPB CAG K Return on Assets % 9.5 5.1 13.3 7.2 11.1 Return on Capital % 13.5 7.3 21.6 9.9 16.9 Return on Equity % 28.7 9.4 76.7 15.9 52.3
Margin Analysis ‐ TTM GIS KFT CPB CAG K Gross Margin % 40.8 34.9 41.1 25 42.8 Net Income Margin % 11.1 6.2 10.3 6.2 9.6 Levered Free Cash Flow Margin % 12 9 9.8 4.6 9.3 Unlevered Free Cash Flow Margin % 13.7 11 10.7 5.9 10.7
GIS – General Mills
CAG – ConAgra
^GSPC – S&P 500
K ‐ Kellogg
CPB – Campbell Soup
KFT ‐ Kraft
Turnovers ‐ TTM GIS KFT CPB CAG K
Total Asset Turnover(X10) 0.8 0.6 1.2 1.1 1.1 Fixed Asset Turnover 5 3.8 4 4.8 4.2 Accounts Receivable Turnover 12.1 8.6 9.6 13.7 10.1 Inventory Turnover(X10) 5.5 6 5.1 4.2 8.2
Liquidity ‐ TTM GIS KFT CPB CAG K
Current Ratio 1.2 1.1 0.9 1.9 1.1
Quick Ratio 0.6 0.6 0.4 0.7 0.7
Capital Structure ‐ TTM GIS KFT CPB CAG K Total Debt/Equity % 110 82.5 312 69.9 261 Total Debt/Capital % 51.4 45.1 75.7 41 72.3 LT Debt/Equity % 92.8 72.1 240 64.7 238 LT Debt/Capital % 43.3 39.4 58.3 37.9 65.8 EBIT/Interest Expense 7.2 4.4 12.8 5.3 7.5
3‐Yr CAGR ‐ TTM GIS KFT CPB CAG K Total Revenue% 7.0 5.2 0.2 2.7 5.6 Gross Profit% 11.8 3.8 ‐0.5 2.2 3.9 Net Income% 13.4 ‐7.9 1.1 6.2 6.2 Total Assets% ‐0.4 4.3 ‐2.9 ‐2.2 1.3 Levered Free Cash Flow% 22.5 1.7 ‐2.7 ‐2.9 15.6 Unlevered Free Cash Flow% 17.6 5.1 ‐4.2 ‐2.9 12.6
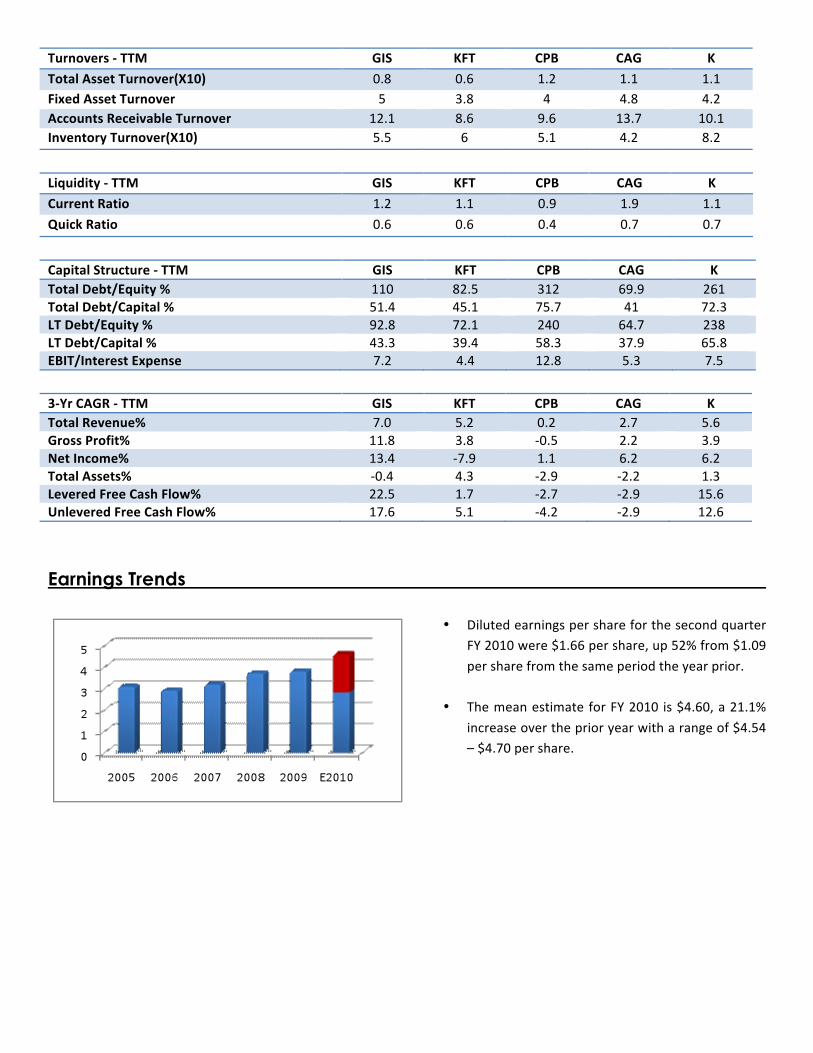
Earnings Trends
• Diluted earnings per share for the second quarter FY 2010 were $1.66 per share, up 52% from $1.09
per share from the same period the year prior.
• The mean estimate for FY 2010 is $4.60, a 21.1%
increase over the prior year with a range of $4.54 – $4.70 per share.

Valuation
We use market multiples for Total Enterprise Value/EBITDA (TEV/EBITDA) and trailing twelve month Price/Earnings (P/E) to discern an indication of value as noted:
Multiple Min Max Average Selected Indication of Value ($/Share)
TEV/EBITDA 7.8 10.3 8.9 9.5 $78.06
P/E 13.3 17.2 14.7 15.5 $77.14
Valuation multiples derived from competitors in the market indicate a value ranging from $77.14/share to $78.06/sh. We establish a price target of $78/share, a 10% premium to Friday’s closing price.
Fear & Greed Positive Factors:
• Valuation: General Mills is valued at a discount with a TTM P/E ratio of 14.7 versus 17.2 for the food products
industry. • Profitability: Gross Profit and Net Income continually improving and exceed its peers. • Growth Potential: Q2 EPS saw a 52% YOY increase and FY 2010 EPS is estimated at a 21% YOY increase.
• Increasing Shareholder Value: Increase in dividends by 10% and share buybacks of 3% outstanding through half the current fiscal year.
• Market Sensitivity: Low beta of 0.32 insulates from wide price swings of the broader market.
• Market Position: General Mills is the market leader in many product categories. Increasing advertising and new product development should maintain/increase the Company’s market position.
• Industry: Consumer Staples remains a defensive sector in today’s uncertain market.
Negative Factors:
• Commodity Price Risk: An unexpected increase in the cost of ingredients would lower gross margins if unable to
hedge against this risk. • Consumer Spending Habits: General Mills is experiencing increasing revenues due to increasing food‐at‐home
sales. Consumers may begin eating away from home or trading down to private labels thereby hindering sales.
• New Products: Failure of new product launch can reduce market share and profitability. • Industry: Food Products is a mature industry and explosive growth is unlikely.
Recommendation
We recommend the purchase of one full position, taken from XLP, at the open.

Disc laimer
Osprey Financial Group (OFG) is a course offered in the Coggin College of Business at the University of North Florida. The students comprising OFG engage in the security analysis and management of the fund. This report is for information purposes only and does not constitute a solicitation or offer to sell securities or investment advisory services. Information throughout this report is obtained from sources that OFG believe to be reliable, but OFG does not warrant or guarantee the timeliness or accuracy of this information and any opinions expressed herein are subject to change without notice. Nothing in this document should be interpreted to state or imply that past results are an indication of future performance. OFG may acquire, hold or sell securities mentioned and discussed in this report. Neither OFG nor its information providers shall be liable for any errors or inaccuracies, regardless of cause, or the lack of timeliness, or for any delay or interruption in the transmission thereof to viewers of this report. There are no warranties, expressed or implied, as to the accuracy, completeness, or results obtained from any information posted on this or any attached report.