Embed Size (px)
Citation preview
Geological Society of Malaysia Annual Geological Conference 2000 September 8-9 2000, Pulau Pinang, Malaysia
Geological Applications of AIRSAR/TOPSAR Data in the Tubau Area, Bintulu, Sarawak
FREDDY ANAK HEWARD CHINTA
Minerals and Geoscience Department Malaysia Tingkat 20, Bangunan Tabung Haji, Jalan Tun Razak,
Peti Surat 11110, 50736, Kuala Lumpur, Malaysia
Abstract During the early period of geological investigation, aerial photographs were the only source of remotely sensed data
for analyzing geological features. With the advance of technology in remote sensing, radar images are available and readily provides a helpful tool to analyze geological features. Geological interpretation of AIRSARJTOPSAR images identification revealed numerous interesting findings, both in the local and regional scales. The images were then used to extract lithologic information, structural interpretation and digital terrain models. There are three lithological units that can be identified from these images based on their morphological and textural appearances, namely: riverine alluvium, Neogene Peripheral Basin and Folded Rajang Group. Several major faults were also identified, namely: the Bukit Mersing Line, the Tubau Fault, the Kalo Fault and another four newly named faults; the Merirai Fault, Hulu MeriraiUnan Fault, Kupa Fault and Tingang Fault. The imagery can enhance the topographic features, which are controlled by geological elements. The colour composites using 3 multi-polarization bands have improved the visual interpretability of land covered features compared to the single SAR data. With the correct choice of bands, the information extracted could be maximized.
Aplikasi Geologi Data AIRSARITOPSAR di Kawasan Tubau, Bintulu, Sarawak
Abstrak Pada masa penyiasatan geologi terawal, hanya fotograf udara menjadi sumber utama untuk menganalisa fitur
geologi. Peningkatan teknologi dalam penderiaan jauh membolehkan imej radar mudah diperolehi dan berguna dalam analisis fitur geologi. Tafsiran geologi imej AIRSARJTOPSAR mendedahkan beberapa maklumat menarik, dalam skala tempatan dan rantau. lmej-imej terse but digunakan untuk mendapatkan maklumat litologi, penafsiran struktur dan model terain digital. Terdapat tiga unit litologi yang boleh ditentukan daripada imej ini berdasarkan kehadiran morfologi dan tekstumya, iaitu aluvium sungai, Lembangan Tepi Neogen dan Kumpulan Terlipat Rajang. Beberapa sesar utama juga boleh ditentukan iaitu; Garis Bukit Mersing, Sesar Tubau, Sesar Kalo dan empat sesar baru; Sesar Merirai, Sesar Hulu Merirai-Unan, Sesar Kupa dan Sesar Tingang. Penafsiran geologi menggunakan imej ini boleh menjelaskan fitur topografi yang dikawal oleh elemen geologi. Komposit warna menggunakan tiga jalur multi-polar menambahkan penafsiran visual fitur litupan tanah berbanding data satu SAR. Dengan pemilihan kombinasi jalur yang sesuai, maklumat yang diekstrak boleh dimaksimumkan.
INTRODUCTION
Background and Objectives The study area, Tubau, located in Central Sarawak, is
underlain by many interesting geological structures. There are also several occurrences of economic deposits such as coal and limestone. The area is also situated along the structural feature dividing the Neogene Peripheral Basin and the Rajang Folded Group. The Peripheral Basin is made up of lithostratigraphic units such as Tubau, Nyalau and Belait, with the age of Oligocene to Late Miocene. The Folded Rajang Group comprising the Metah Member of the Belaga Formation is of Late Eocene age.
During the early period of geological investigation, aerial photographs on the scale of I :I 0,000 were the only source of the remotely sensed data for the analysis of
geological features. Aerial photographs were studied under the stereoscope to analyze the bedding traces, faults, lineaments and other geographical features such as hills, rivers and cliffs. With the advance of technology in remote sensing, radar images became available and provide a useful tool to analyze geological features. The advantage of the radar image is the ability to penetrate through the cloud and vegetation covers. However, geological investigation using radar data is yet to be popularized in this country, because not much research has been conducted on the radar's application in geological studies. The geological application of computer processed digital images, has been hampered because most computer systems are not designed for direct application for geological research. Further more there is little communication between workers in geology and workers in image processing.
Airborne Synthetic Aperture Radar (AIRSAR) data
428 FREDDY ANAK HEWARD CHINTA
was acquired over seven sites in Malaysia as part of the Pacific Rim Deployment (PACRIM) program , which is coordinated by the Malaysian Centre For Remote Sensing (MACRES) in collaboration with the National Aeronauti c Ad ministrat ion (NASA), USA and Commonweal th Science and Ind ia Research Institution (CSIRO), Australia with the participation of eleven Malaysian Agencies and Universities, each in a specific area of interest.
The Tubau area is one of the sites covered under thi s program in 1996 and was selected for the pilot project of enhancement of AIRS AR/TOPS AR . T he object ive was to delineate st ru ctura l features such as fa ul ts and lineaments as well as lithology ; to provide a platform for detail ed geological mapping and minera l expl orat ion in the area.
Literature Review
Research carried out using microwave a irborne SAR data espec ially in the field of geology in Malaysia is limited. Bannert eta /. , ( 1993) was the first to carry out pre liminary geo log ical interpretation of a satellite image from LANDSAT in central Sarawak. The study delineated some inte resting geo log ical features and subsequently described many fa ults such as the Sungai Anap , Rajang , Sunga i Pila, and Sungai Dap Faults in the Rajang Bas in and provided the deformational hi story of the area. Ling ( 1994) rep o rted good results fro m th e geo log ica l interpretation of the GlobeSAR image in the TubauBukit Lumut a rea, Bintulu, Sarawak, where major struc tural pattern s such as the Kalo Fault was f irst desc ribed. D'Iorio et a l. (1995) reviewed radar app lication in geo logical interpretation in the same area and they discovered th a t ai rborne a nd s imul ated RADARSAT images proved to be very useful to visually en hance and understand the geology , both at a local and regional scale .
a·
-- hoctive - r.
o! Active 1ldge
_!__Inactive Active SObO.Jctlon nench Faull
- Oi<ecllon"' '""'"""plate"""""""' 0 500km '--------'
Geological Setting
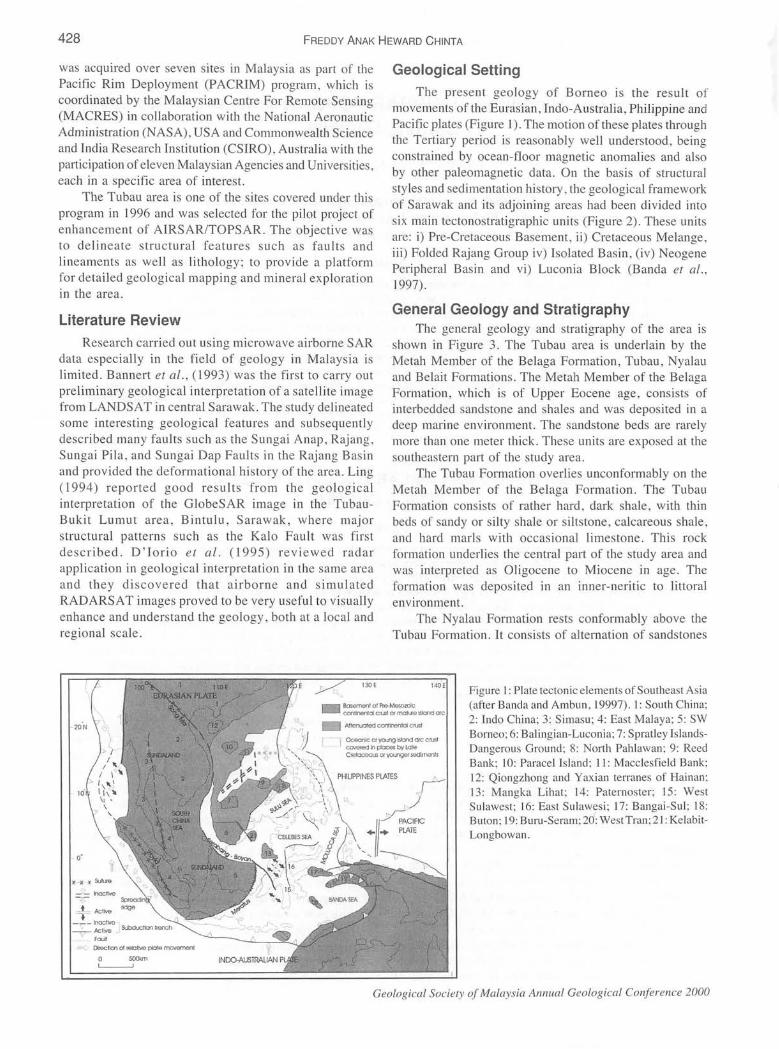
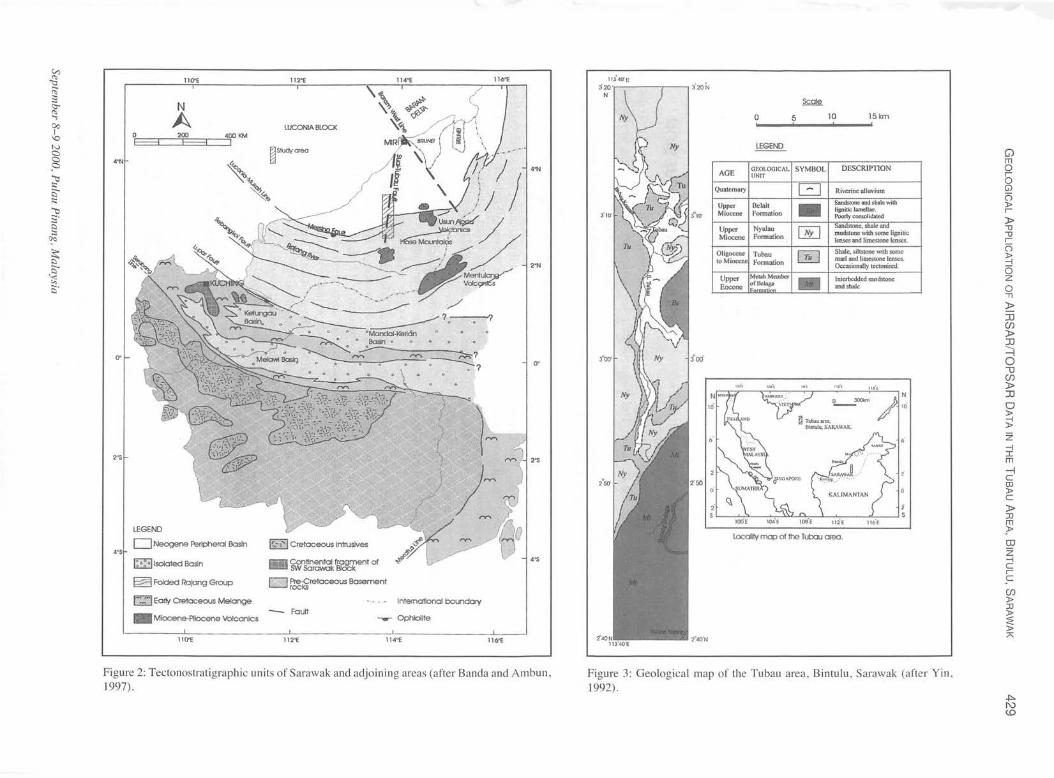
The present geology of Borneo is the res ult of movements of the Eurasian , Indo-Australia , Philippine and Pacific plates (Figure I ). The motion of these plates through the Tertiary period is reasonably well understood , be ing constrained by ocean-floor magnetic anomalies and also by other paleomagneti c data. On the basis of structural styles and sedimentation history, the geological framework of Sarawak and its adjoining areas had been divided into six main tectonostrati graphic units (Figure 2). These units are: i) Pre-Cretaceous Basement, ii ) Cretaceous Melange, iii ) Folded Rajang Group iv) Iso lated Basin, (iv) Neogene Peripheral Basin and vi) Luconia Block (Banda et a /. , 1997) .
General Geology and Stratigraphy The general geo logy and stratigraphy of the area is
shown in F igure 3 . The Tubau area is underlain by the Metah Member of the Belaga Formation , Tubau, Nyalau and Belait Formations. The Metah Member of the Belaga Formation , which is of Upper Eocene age, consists of interbedded sandstone and shales and was deposited in a deep marine environment. The sandstone beds are rarely more than one meter thick. These units are exposed at the southeastern part of the study area.
The Tubau Formation overlies unconformably on the Metah Member of the Belaga Formation . The Tubau Formation consists of rather hard , dark shale, with thin beds of sandy or silty shale or s iltstone, ca lcareous shale , and hard marls with occasional limes tone . This rock fo rmation underlies the central part of the study area and was interpreted as Oligocene to Miocene in age. The fo rmation was deposited in an inner-neritic to li ttoral environment.
The Nyalau Formation rests confo rmably above the Tubau Formation. It consists of alternation of sandstones
Figure I: Plate tectonic e lements of Southeast Asia (after Banda and Ambun, 19997). l: South Ch ina ; 2: Indo China ; 3: Simasu; 4 : East Malaya; 5: SW Bomeo; 6: Balingian-Luconia; 7: Spratley IslandsDangerous Ground ; 8: North Pahlawan; 9: Reed Bank; 10: Paracel Is land; l J: Macclesfield Bank; 12: Qiongzhong and Yax ian terranes of Hainan; 13: Mangka Lihat; 14: Paternoster; 15 : West Sulawes t; 16: East Sulawesi; 17: Banga i-Sul ; 18: Buton; 19: Buru-Seram; 20: WestTran; 2 1: KelabitLongbowan.
Geolog ical Society of Malaysia Annual Geological Conference 2000
4'N
2"S
4"S
110'£
N
A o'=:::=:r:::=:::=E::==c=::•]oo, KM E"""3 F-"""1 .
LEGEND
D Neogene Peripheral Basin
~Isolated Basin
~ Folded RoJong Group
~ Eot1y Oetoceous Melange
-Miocene-Pliocene Volcanics
110'£
112"£
LUCONIA BLOCK
~~.=~~~entof
0 ~~retoceous Bosennent
-Fault
114"1:
lntemollonal boundary
Ophiolite
112"£ 114-£
4'N
2"N
2"S
4"S
116"£
Figure 2: Tectonostratigraphic units of Sarawak and adjoining areas (after Banda and Ambun , 1997).
a"2oN
Scale
0 5 10 15km
LEGEND
AGE GEOLOGICAL SYMBOL DESCRIPTION UNIT
Qu:uemary G Riverine alluvium
Upper Bcla.it -M iocene Fonnmion
Upper Nyalau CELl tone, can
Miocene Fonnation mudstone with some lignilic lenses and limestone lenses.
Oligocene Tubau [!!] SbaJe. silwone with some to Miocene Formation marl and limestone lenses.
Occasionally t«tonised. - Interbedded s:mdstone and shale
·--"""" } N ;/ 10
locality mop of the TubaJ area.
Figure 3: Geological map of the Tubau area , Bintulu , Sarawak (after Yin , 1992).
Gl m 0 5 Gl 0 )> r )> "'0 "'0 r 0 )> -I 0 z 0 'T1
~ :Il UJ )> :Il ~ 0 "U UJ )> :Il 0 )>
:;; z -I I m -l c CD )> c )> :0 m }>
~ z -I c r c UJ )> :0 )>
~ )> ;>;
430 FREDDY ANAK HEWARD CHINTA
with clay-shales; containing occasional limestone as well as lenticular layers or beds of calcareous sandstone. The Nyalau Formation is considered to be the time equivalent of the Tubau Formation and was deposited in a littoral to paralic environment. This formation is exposed at the western part of the study area.
The Belait Formation which is Late Miocene in age, consists of alternating carbonaceous sandstone and shale and clay in varying proportion and thickness. It is exposed at the small portion at the eastern part of the area. The sediment was deposited in an isolated basin infill oscillating between littoral and deltaic-paralic type. Quaternary alluviam were deposited along the Tubau and Kemena river basins.
MATERIAL AND METHODOLOGY
Source of Data
In November 25, 1996, a 80km long airborne synthetic aperture radar (AIRSAR) and radar interferometry (TOPSAR) transect was flown along an angle of 22°-62° across the vegetated forest in the Tubau area, Bintulu. The multi-polarised and multi-frequency SAR data acquired from an airborne platform on board of a NASA DC-8 aircraft and was processed by the Jet Propulsion Laboratory (JPL) in Pasadena, California.
Among the data products that had been received from JPL are the polarimetric data for both P- and L-bands and also the C-Band VV- polarization image. The Digital Elevation Model (DEM) was generated by JPL using SAR interferometry using the C-band antenna. Also provided are the correlation image and an incidence angle image generated from C-band data and these images can be easily displayed using the ENVI software packages. The P-band data had been filtered to remove ground based interference prior to processing.
Topsar data is a polarimetric Synthetic Aperture Radar (SAR) dataset generated by an airborne SAR system flown by the Jet Propulsion Laboratory (JPL). The polarimetric SAR data and a Digital Elevation Model (DEM) generated from JPL's Topsar data.
This investigation entailed the input and display of SAR data and also the display and analysis of DEM using standard tools within ENVI software. The DEM analysis included data input, grayscale and color-density-sliced display, generation and overlay of elevation contours, use of ENVI' s X, Y, and arbitrary profiles (transects) to generate terrain profiles and generation of slope, aspect and shaded relief images.
The data has been received in two stages, TS520 (30km strip) and TS456 (50km strip). All of the data was processed using the ENVI 3.0 software.
Data Processing
Polarimetric data in compressed Strokes Matrix Format for both P- and L- bands were supplied by JPL. These data
were decompressed and synthesized so that they could be displayed in the image format. The polarization bands produced are, L-hh, L-vv, L-hv, L-rc (right circular), P-hh, P-vv, P-hv and P-re. The noise from these images were removed using the minimum noise fraction (MNF) transformation in ENVI. The results of this inverse MNF can be displayed in grey colour or in RGB colour combination in the form of an image.
The TOPSAR data present in this dataset was then converted to Sigma Zero and the DEM to meters based upon values present in the TOPSAR headers. The four images produced are; vv polarization image, correlation image, incidence angle (in degree) image and DEMs (in meter) image.
The DEMs were then processed to extract parametric information including slope and aspect, and to generate lambertian (shaded relief) surfaces. Fieldwork was carried out for ground thruthing purposes.
RESULTS AND DISCUSSION
The geological interpretation of AIRSAR!fOPSAR images revealed a number of interesting observations. Interpretation was mainly done on gray color using a single band and on colour composites using 3 multi-polarization bands.
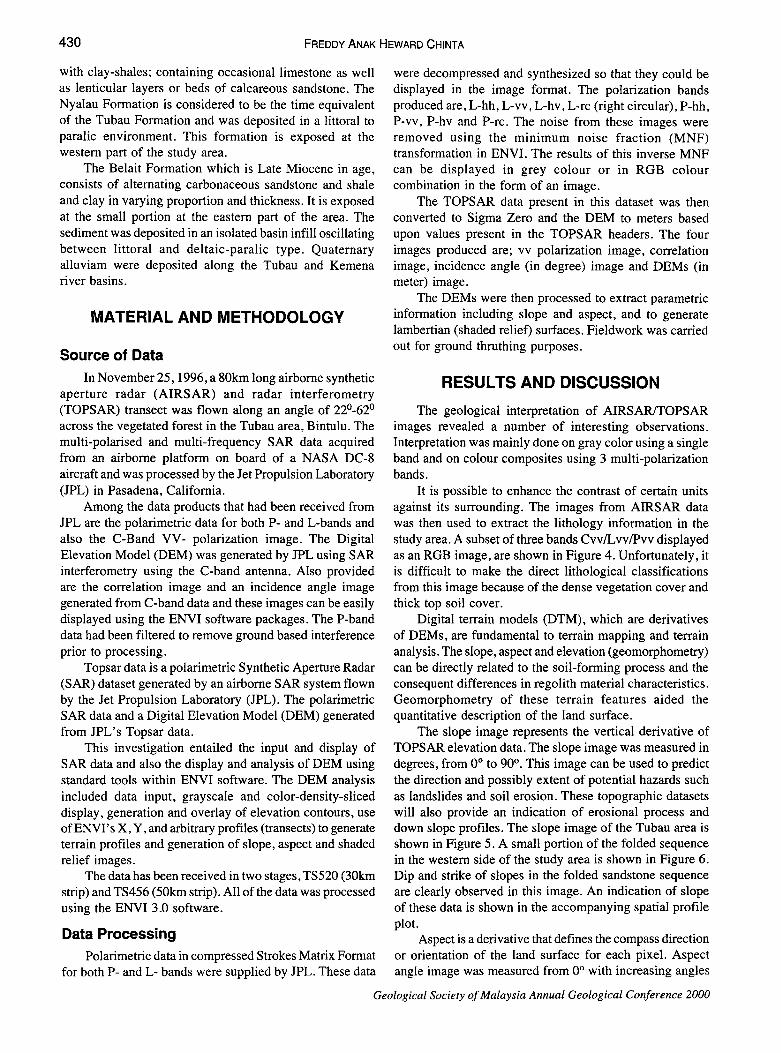
It is possible to enhance the contrast of certain units against its surrounding. The images from AIRSAR data was then used to extract the lithology information in the study area. A subset of three bands Cvv/Lvv/Pvv displayed as an RGB image, are shown in Figure 4. Unfortunately, it is difficult to make the direct lithological classifications from this image because of the dense vegetation cover and thick top soil cover.
Digital terrain models (DTM), which are derivatives of DEMs, are fundamental to terrain mapping and terrain analysis. The slope, aspect and elevation (geomorphometry) can be directly related to the soil-forming process and the consequent differences in regolith material characteristics. Geomorphometry of these terrain features aided the quantitative description of the land surface.
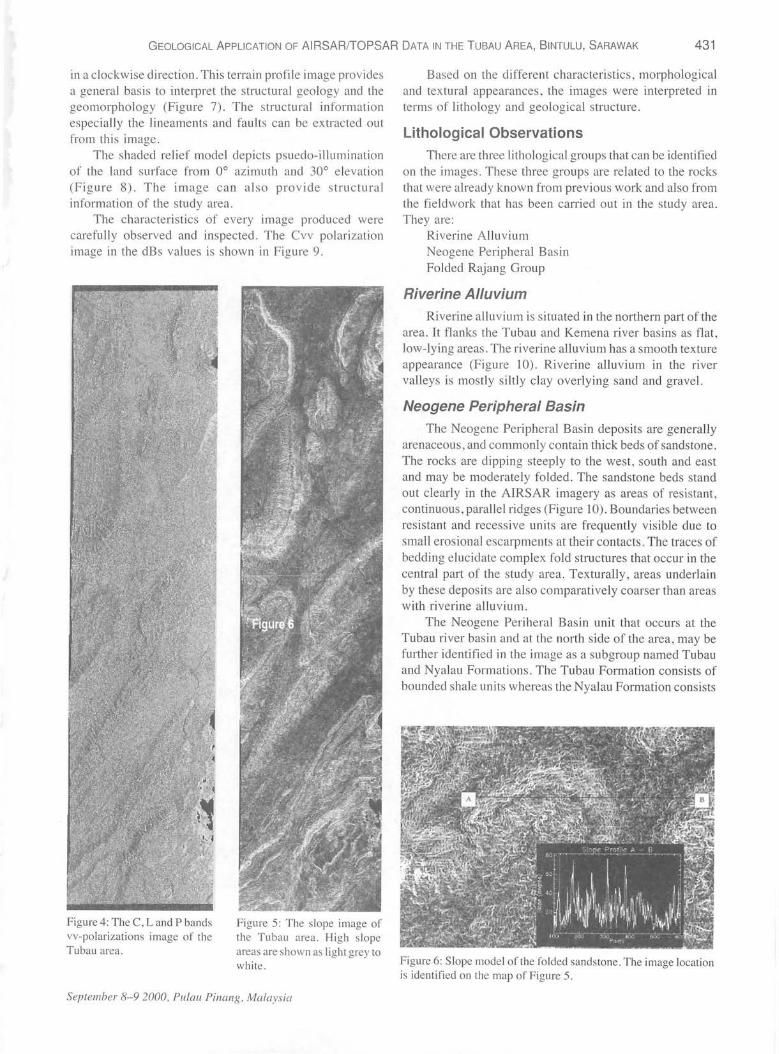
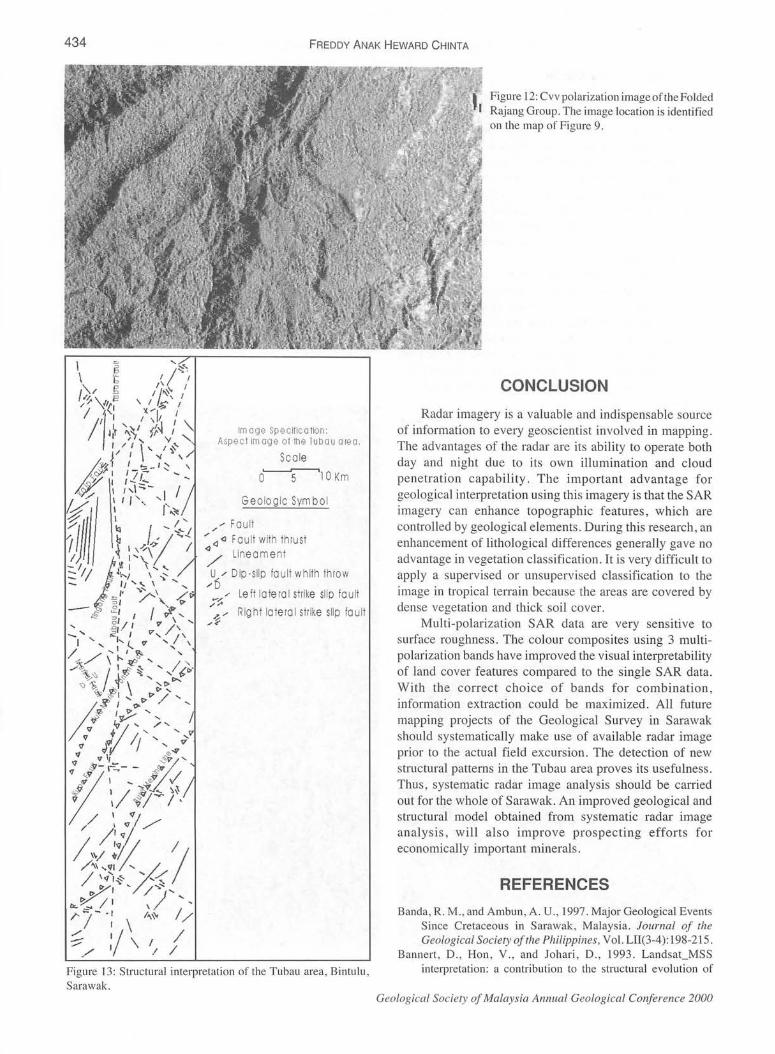
The slope image represents the vertical derivative of TOPSAR elevation data. The slope image was measured in degrees, from 0° to 90°. This image can be used to predict the direction and possibly extent of potential hazards such as landslides and soil erosion. These topographic datasets will also provide an indication of erosional process and down slope profiles. The slope image of the Tubau area is shown in Figure 5. A small portion of the folded sequence in the western side of the study area is shown in Figure 6. Dip and strike of slopes in the folded sandstone sequence are clearly observed in this image. An indication of slope of these data is shown in the accompanying spatial profile plot.
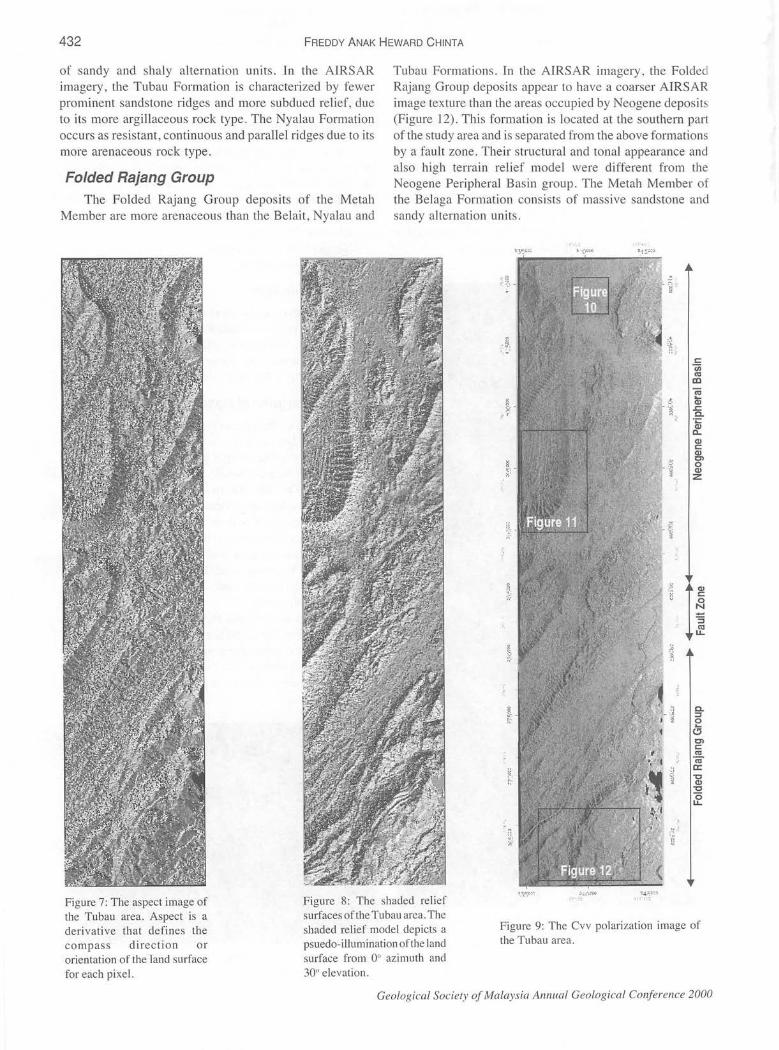
Aspect is a derivative that defines the compass direction or orientation of the land surface for each pixel. Aspect angle image was measured from 0° with increasing angles
Geological Society of Malaysia Annual Geological Conference 2000
GEOLOGICAL APPLICATION OF AIRSAR{fOPSAR DATA IN THE T UBAU AREA, BINTULU , SARAWAK 431
in a clockw ise direction . This terrain profile image provides a gene ral basis to interpret the structural geology and the geomorphology (Figure 7). The structural informat ion espec ially the lineaments and faults can be extracted out from this image.
The shaded relief model depicts psuedo-illumination of the land surface from 0° azimuth and 30° e levat ion (F igu re 8). The im age can a lso provide structura l informat ion of the study area.
The characteristi cs of every image produced were carefull y observed and inspected. The Cvv polarization image in the c!Bs va lues is shown in Figure 9 .
Figure 4: The C, Land P bands vv-polarizat ions image of the Tubau area .
F igure 5: The slope image of the Tubau area. High slope areas are shown as light grey to white.
September 8-9 2000, Pulau Pinang , Malaysia
Based on the different characteristics, morphological and textural appearances, the images were interpreted in terms of lithology and geological structure .
Lithological Observations
There are three lithologica l groups that can be identified on the images. These three groups are re lated to the rocks that were already known from previous work and also from the fieldwork that has been carried out in the study area . They are:
Riverine Allu vium Neogene Peripheral Basin Folded Rajang Group
Riverine Alluvium
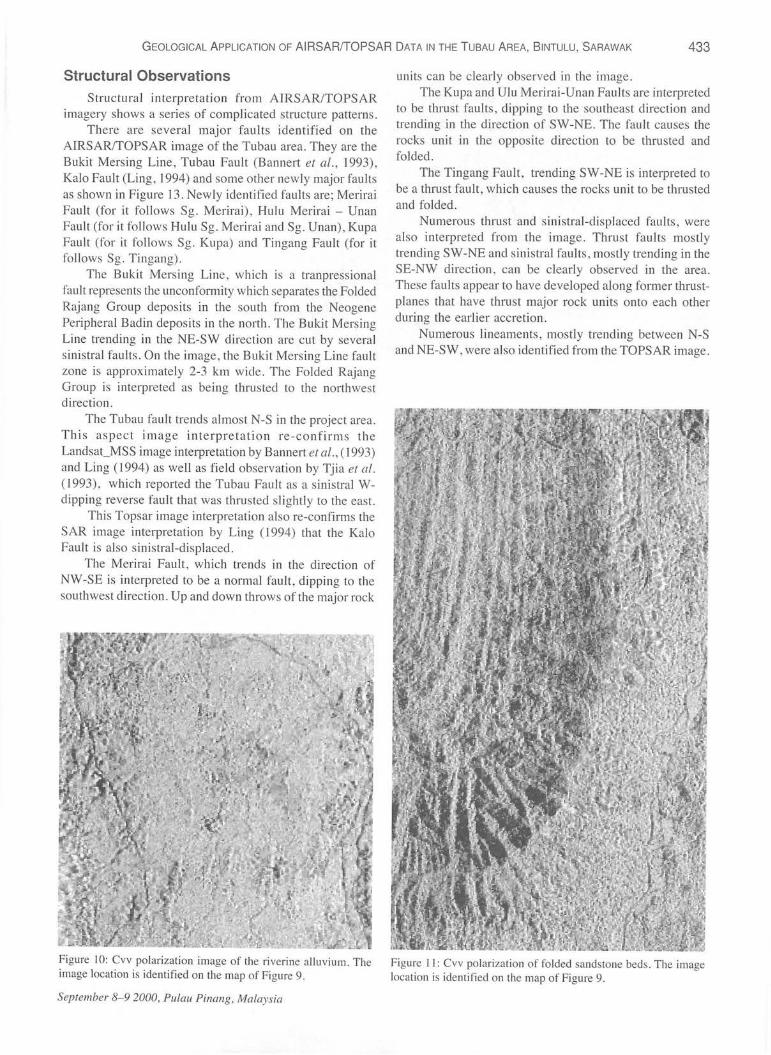
Riverine allu vium is situated in the northern part of the area. It flanks the Tubau and Kemena river bas ins as flat , low-lying areas. The riverine alluvium has a smooth texture appearance (Figure I 0) . Riverine alluvium in the river valleys is mostly sil tly clay overlying sand and gravel.
Neogene Peripheral Basin
The Neogene Peripheral Basin deposits are genera lly arenaceous, and commonly contain thick beds of sandstone. The rocks are clipping steeply to the west, south and east and may be moderately folded. The sandstone beds stand out clearly in the AIRSAR imagery as areas of resistant, continuous, parallel ridges (Figure 1 0). Boundaries between resistant and recess ive units are frequently vis ible clue to small eros ional escarpments at their contacts. The traces of bedding e lucidate complex fold structures that occur in the centra l part of the study area. Texturally , areas underlain by these deposits are a lso comparatively coarser than areas with riverine a llu vium.
The Neogene Periheral Basin unit that occurs at the Tubau river bas in and at the north side of the area , may be further identif ied in the image as a subgroup named Tubau and Nya lau Formations. The Tubau Formation consists of bounded shale units whereas the Nyalau Formation consists
F igure 6: Slope model of the folded sandstone. The image location is identified on the map of Figure 5.
432 FREDDY ANAK HEWARD CHINTA
of sandy and shaly alternation units . In the AIRSAR imagery, the Tubau Formation is characterized by fewer prominent sandstone ridges and more subdued reli ef, due to its more argillaceous rock type. The Nya lau Formation occurs as resistant , continuous and parallel ridges due to its more arenaceous rock type.
Folded Rajang Group
The Folded Rajang Group deposits of the Metah Member are more arenaceous than the Belait , Nyalau and
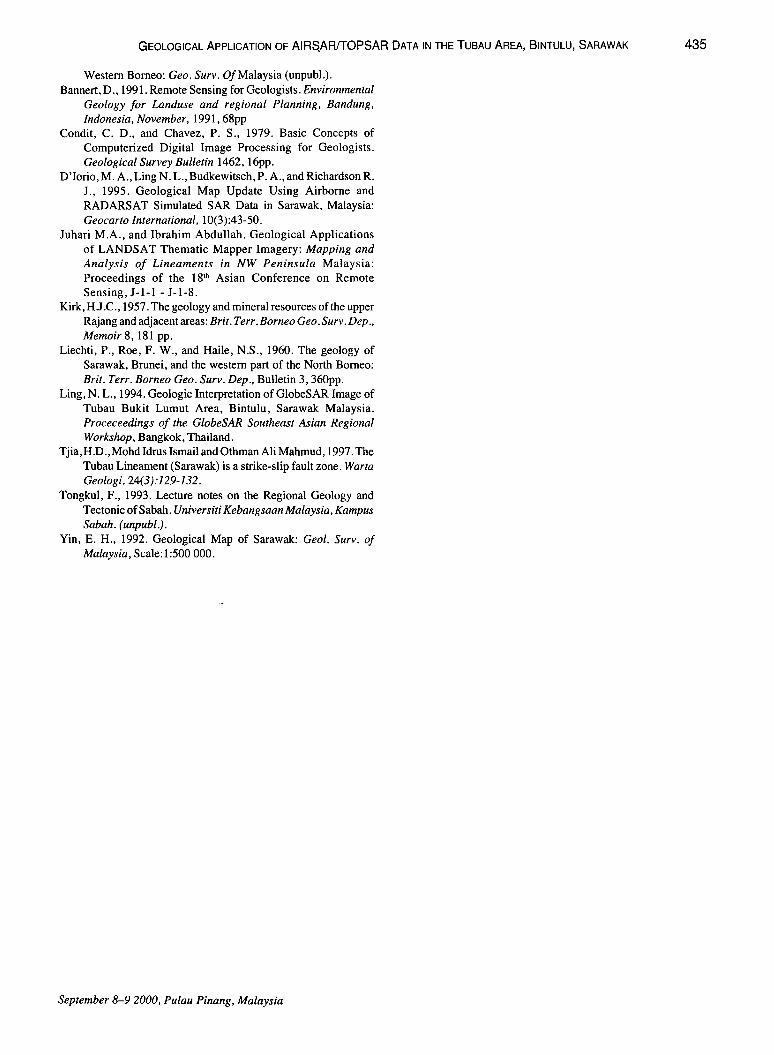
Tubau Formations . In the AIRSAR imagery , the Folded Rajang Group depos its appear to have a coarser AIRSAR image texture than the areas occupied by Neogene deposit (Figure 12) . This formation is located at the southern part of the study area and is separated from the above formations by a fault zone. Their structural and tonal appearance and also high terrain relief model were different from the Neogene Peripheral Basin group. The Metah Member of the Belaga Formation consists of mass ive sandstone and sandy alternation units.
· ~ r.;. :I•
r::: Cii
"' Ill c;;
~- (ij
"' .s:::. t "" c..
-~ c.. Q) r::: Q)
~~ .:.: C> ::;. 0
Q) ~ - § z
~. c.. :::l
h' 0
& C> r::: "' -m
·• a: ~ : ~ "C , ..
Q) "C 0 u..
"' ·u ;i
Figure 7: The aspect image of the Tubau area. Aspect is a de ri va tive th at defines the compass direc ti o n o r orientation of the land surface for each pixel.
Figure 8: The shaded relief surfaces of the Tubau area . The shaded relief model depicts a psuedo-illumination of the land surface from oo azimuth and 30° elevation.
Figure 9: The Cvv polarization image of the Tubau area.
Geological Society of Malaysia Annual Geological Conference 2000
GEOLOGICAL APPLICATION OF AIRSARfrOPSAR DATA IN THE TUBAU AREA, BINTULU, SARAWAK 433
Structural Observations
Structural interpretation from AIRSAR/TOPSAR imagery shows a series of complicated structure patterns.
There are several major faults identified on the AIRSAR/TOPSAR image of the Tubau area. They are the Bukit Mersing Line, Tubau Fault (Bannert eta!. , 1993) , Kalo Fault (Ling, 1994) and some other newly major faults as shown in Figure 13. Newly identified faults are; Meri.rai Fault (for it follows Sg. Merirai), Hulu Merirai - Unan Fault (for it follows Hulu Sg. Merirai and Sg. Unan) , Kupa Fault (for it follows Sg . Kupa) and Tingang Fault (for it follows Sg. Tingang).
The Bukit Mersing Line , which is a tranpressional fault represents the unconformity which separates the Folded Rajang Group deposits in the south from the Neocrene
b
Peripheral Badin deposits in the north . The Bukit Mersing Line trending in the NE-SW direction are cut by severa l sinistral faults. On the image , the Bukit Mersing Line fault zone is approximately 2-3 km wide. The Folded Rajang Group is interpreted as being thrusted to the northwest direction .
The Tubau fa ult trends almost N-S in the project area . This aspect image interpretat ion re-confirms the Landsat_MSS image interpretation by Bannert et al., (1993) and Ling ( 1994) as well as field observation by Tjia eta/. ( 1993), which reported the Tub au Fault as a sin istral Wdipping reverse fault that was thrusted slightly to the east.
This Topsar image interpretation also re-confirms the SAR image interpretation by Ling (1994) that the Kalo Fault is also s inistral-displaced.
The Merirai Fault, which trends in the direction of NW -SE is interpreted to be a normal fault, dipping to the southwest direction. Up and down throws of the major rock
Figure 10: Cvv polarization image of the riverine alluvium. The image location is identified on the map of F igure 9.
September 8-9 2000, Pulau Pinang, Malaysia
units can be clearly observed in the image. The Kupa and Ulu Merirai-Unan Faults are interpreted
to be tlu·ust faults, dipping to the southeast direction and trending in the direction of SW-NE. The fault causes the rocks unit in the opposite direction to be thrusted and folded.
The Tingang Fault, trending SW-NE is interpreted to be a thrust fault , which causes the rocks unit to be thrusted and folded.
Numerous thrust and sinistral-displaced faults , were also interpreted from the image. Thrust faults mostly trending SW-NE and sinistral faults, mostly trending in the SE-NW direction , can be clearly observed in the area. These faults appea r to have developed along former thrustplanes that have thrust major rock units onto each other during the earl ier accretion.
Numerous lineaments, mostly trending between N-S and NE-SW , were also identified from the TOPSAR image.
Figure II: Cvv polarization of folded sandstone beds. The image location is identified on the map of Figure 9.
434 FREDDY ANAK HEWARD CHINTA
Image Specification: Aspect imag e or the Ju bau area.
Sca le
0 5 10 Km
Geolog ic Sym bo l
./' Fau ll ""' 4 <1 Fau lt with thrust / Linea ment
U _,. Dip -slip fault whlth throw / 6
~...- ..,. Le fl Ia te ra I strike slip fo ult _,_. ~ .... Right latera l strike slip fault
..,.~
Figure 13: Structural interpretation of the Tubau area, Bintulu , Sarawak.
Figure 12: Cvv polarization imageoftheFolded Rajang Group. The image location is identified on the map of Figure 9.
CONCLUSION
Radar imagery is a valuable and indispensable source of information to every geoscientist involved in mapping. The advantages of the radar are its ability to operate both day and night due to its own illumination and cloud penetration capability. The important advantage for geological interpretation using this imagery is that the SAR imagery can enhance topographic features, which are controlled by geological elements. During this research, an enhancement of lithological differences generally gave no advantage in vegetation classification. It is very difficult to apply a supervised or unsupervised classification to the image in tropical terrain because the areas are covered by dense vegetation and thick soil cover.
Multi-polarization SAR data are very sensitive to sudace roughness. The colour composites using 3 multipolarization bands have improved the visual interpretability of land cover features compared to the single SAR data. With the correct choice of bands for combination , information extraction could be maximized. All future mapping projects of the Geological Survey in Sarawak should systematically make use of available radar image prior to the actual field excursion . The detection of new structural patterns in the Tubau area proves its usefulness. Thus , systematic radar image analysis should be carried out for the whole of Sarawak. An improved geological and structural model obtained from systematic radar image analysis, will also improve pros pecting efforts for economically important minerals.
REFERENCES
Banda, R. M., and Am bun , A. U., 1997. Major Geological Events Since Cretaceous in Sarawak, Malaysia. Journal of the Geological Society oft he Philippines, Vol. LII(3-4): 198-2 15.
Emmert, D., Hon, V., and Johari, D., 1993. Landsat_MSS interpretation : a contribution to the structural evolution of
Geological Society of Malaysia Annual Geological Conference 2000
GEOLOGICAL APPLICATION OF AIRS,ARffOPSAR DATA IN THE TUBAU AREA, BINTULU, SARAWAK
Western Borneo: Geo. Surv. OfMalaysia (unpubl.). Bannert, D., 1991. Remote Sensing for Geologists. Environmental
Geology for Landuse and regional Planning, Bandung, Indonesia, November, 1991, 68pp
Condit, C. D., and Chavez, P. S., 1979. Basic Concepts of Computerized Digital Image Processing for Geologists. Geological Survey Bulletin 1462, l6pp.
D'Iorio, M.A., Ling N. L., Budkewitsch,P. A., and Richardson R. J., 1995. Geological Map Update Using Airborne and RADARSAT Simulated SAR Data in Sarawak, Malaysia: Geocarto International, 10(3):43-50.
Juhari M.A., and Ibrahim Abdullah. Geological Applications of LANDSAT Thematic Mapper Imagery: Mapping and Analysis of Lineaments in NW Peninsula Malaysia: Proceedings of the l8'h Asian Conference on Remote Sensing, J-1-l- J-l-8.
Kirk, HJ .C., 1957. The geology and mineral resources of the upper Rajang and adjacent areas: Brit. Terr. Borneo Geo. Surv. Dep ., Memoir 8, 181 pp.
Liechti, P., Roe, F. W., and Haile, N.S., 1960. The geology of Sarawak, Brunei, and the western part of the North Borneo: Brit. Terr. Borneo Geo. Surv. Dep., Bulletin 3, 360pp.
Ling, N. L., 1994. Geologic Interpretation ofGlobeSAR Image of Tubau Bukit Lumut Area, Bintulu, Sarawak Malaysia. Proceceedings of the GlobeSAR Southeast Asian Regional Workshop, Bangkok, Thailand.
Tjia, H .D., Mohd Idrus Ismail and Othman Ali Mahmud, 1997. The Tubau Lineament (Sarawak) is a strike-slip fault zone. Warta Geologi. 24(3):129-132.
Tongkul, F., 1993. Lecture notes on the Regional Geology and Tectonic ofSabah. Universiti Kebangsaan Malaysia, Kampus Sabah. (unpubl.).
Yin, E. H., 1992. Geological Map of Sarawak: Geol. Surv. of Malaysia, Scale:l:500 000.
September 8-9 2000, Pulau Pinang, Malaysia
435