Embed Size (px)
Citation preview
Global and Local Strength Analysis in Equivalent Quasi-
static Head Waves, for a Tanker Ship Structure, Based on
Full Length and 2-3 Cargo Holds 3D-FEM Models
Supervisor: Prof. Leonard Domnisoru, "Dunarea de Jos" University of Galati
Reviewer: Prof. André Hage, University of Liege
Master student: Cioarec Dan Sebastian
Galati, February 2013
“EMSHIP” Erasmus Mundus Master Course in
“Integrated Advanced Ship Design”
3/14/2013 1
3/14/2013 2
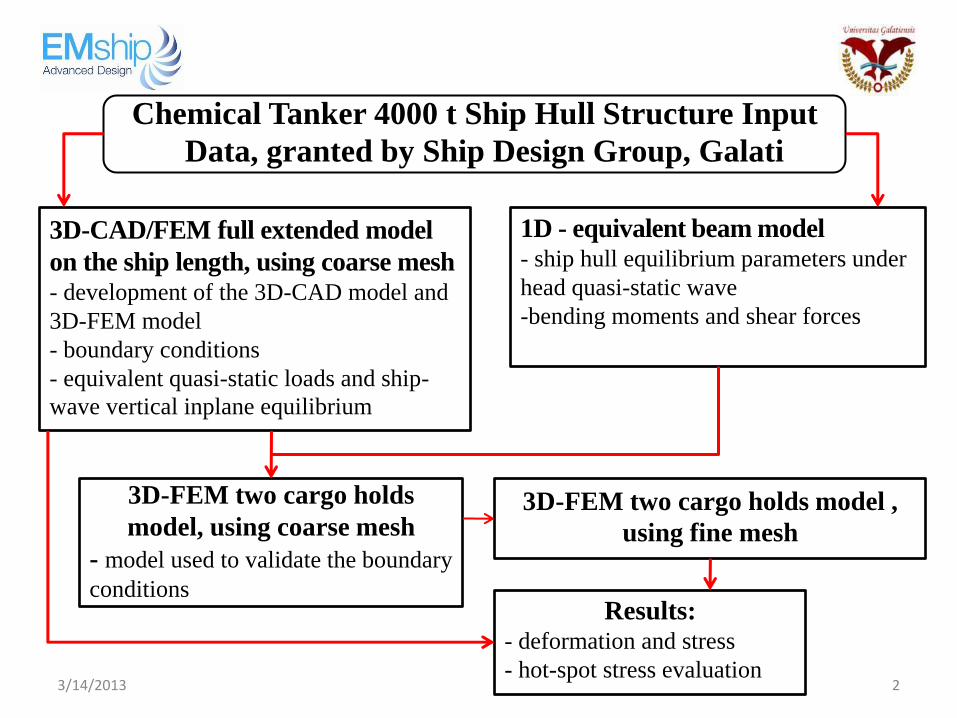
Chemical Tanker 4000 t Ship Hull Structure Input
Data, granted by Ship Design Group, Galati
3D-CAD/FEM full extended model
on the ship length, using coarse mesh - development of the 3D-CAD model and
3D-FEM model
- boundary conditions
- equivalent quasi-static loads and ship-
wave vertical inplane equilibrium
1D - equivalent beam model - ship hull equilibrium parameters under
head quasi-static wave
-bending moments and shear forces
3D-FEM two cargo holds
model, using coarse mesh
- model used to validate the boundary
conditions
3D-FEM two cargo holds model ,
using fine mesh
Results: - deformation and stress
- hot-spot stress evaluation
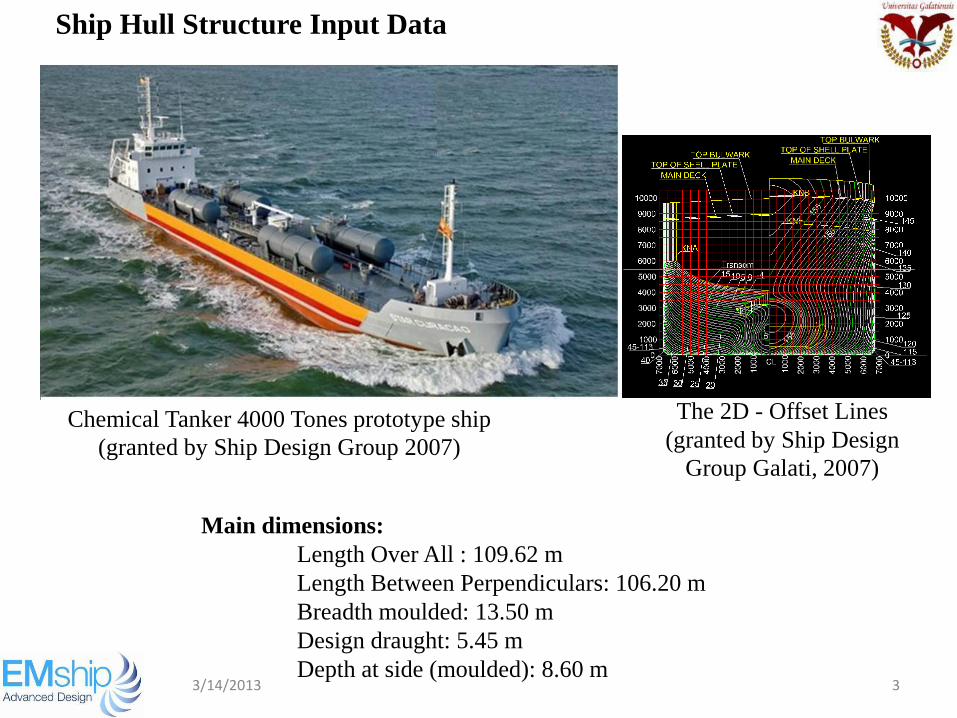
Ship Hull Structure Input Data
Chemical Tanker 4000 Tones prototype ship
(granted by Ship Design Group 2007)
The 2D - Offset Lines
(granted by Ship Design
Group Galati, 2007)
3/14/2013 3
Main dimensions:
Length Over All : 109.62 m
Length Between Perpendiculars: 106.20 m
Breadth moulded: 13.50 m
Design draught: 5.45 m
Depth at side (moulded): 8.60 m
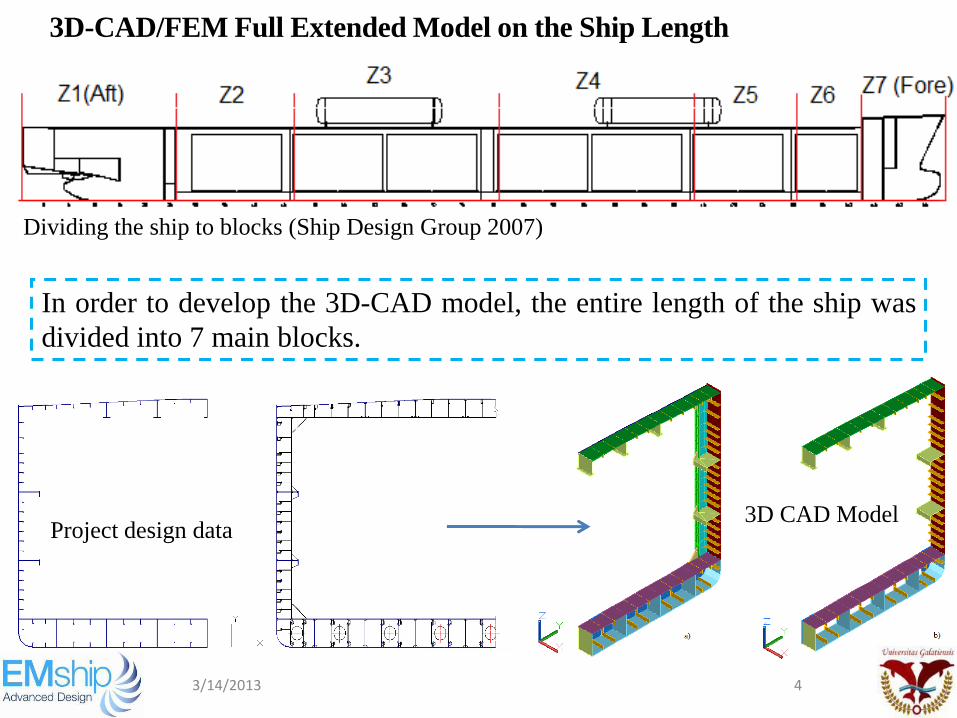
3D-CAD/FEM Full Extended Model on the Ship Length
In order to develop the 3D-CAD model, the entire length of the ship was
divided into 7 main blocks.
Dividing the ship to blocks (Ship Design Group 2007)
3/14/2013 4
Project design data 3D CAD Model
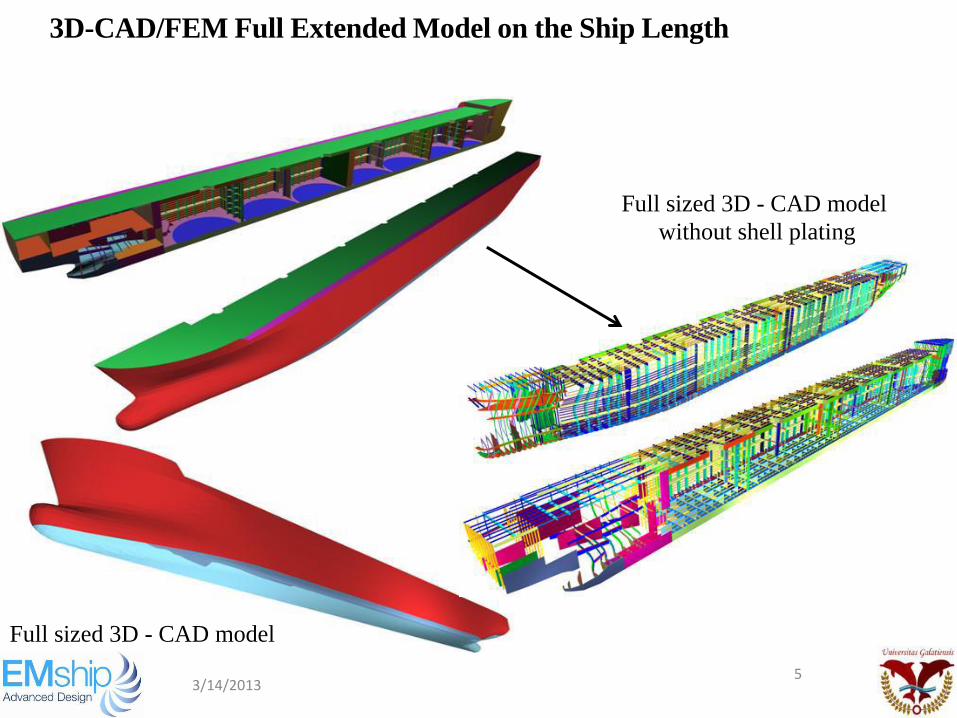
Full sized 3D - CAD model
Full sized 3D - CAD model
without shell plating
3/14/2013 5
3D-CAD/FEM Full Extended Model on the Ship Length
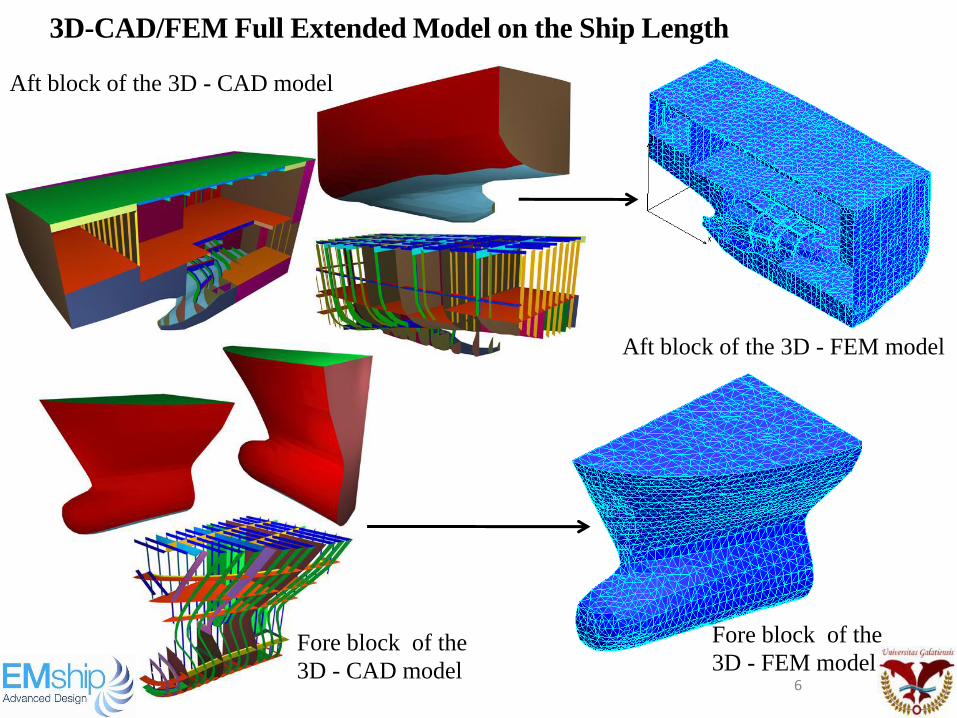
Aft block of the 3D - CAD model
Aft block of the 3D - FEM model
3/14/2013 6
3D-CAD/FEM Full Extended Model on the Ship Length
Fore block of the
3D - CAD model
Fore block of the
3D - FEM model
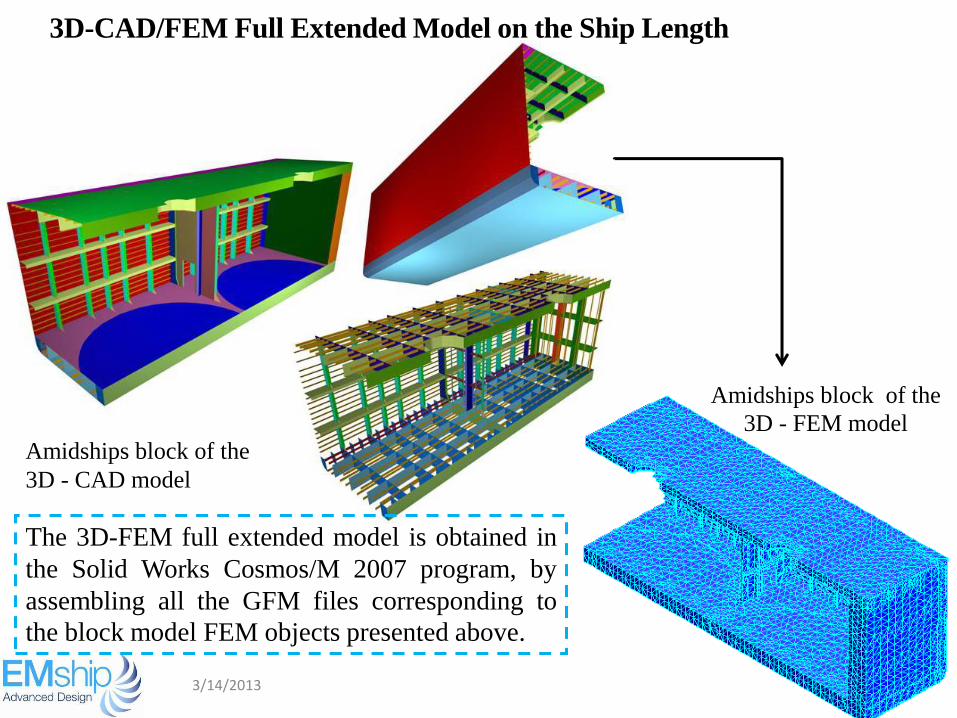
Amidships block of the
3D - CAD model
3/14/2013 7
3D-CAD/FEM Full Extended Model on the Ship Length
Amidships block of the
3D - FEM model
The 3D-FEM full extended model is obtained in
the Solid Works Cosmos/M 2007 program, by
assembling all the GFM files corresponding to
the block model FEM objects presented above.
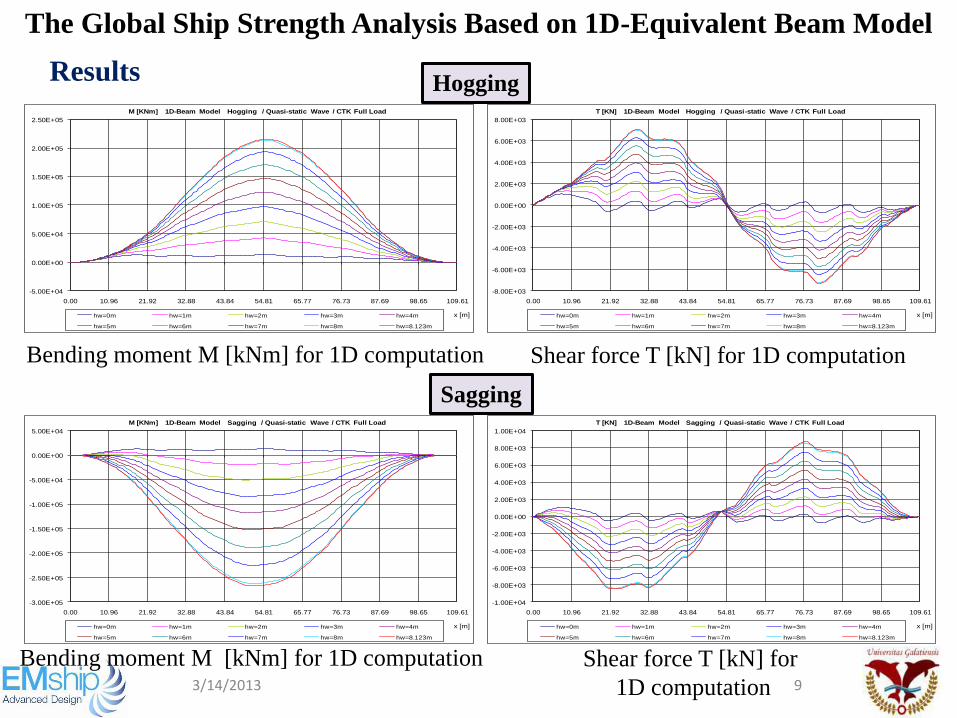
The Global Ship Strength Analysis Based on 1D-Equivalent Beam Model
The 1D equivalent beam model for the ship hull is selected for an evaluation of
the global strength at the initial design stage, without the possibility to include
the local hot-spots stress domains.
In order to obtain the equilibrium conditions of the ship hull girder under
equivalent head waves, it is used a nonlinear iterative procedure for the free
floating and trim condition, making possible to take into account the ship hull
shape geometrical nonlinearities.
The 1D equivalent beam model numerical analysis is performed by P_ACASV
program, developed at the Galati Naval Architecture Department. The input data
for the 1D analysis contains the mass distribution diagram along the ship's length
and the equivalent beam transversal sections strength characteristics. The height
of the equivalent quasi-static head wave is considered to be in the range hw = 0 –
8.123 m, with the step increment Δhw = 1 m.
3/14/2013 8
-5.00E+04
0.00E+00
5.00E+04
1.00E+05
1.50E+05
2.00E+05
2.50E+05
0.00 10.96 21.92 32.88 43.84 54.81 65.77 76.73 87.69 98.65 109.61
x [m]
M [KNm] 1D-Beam Model Hogging / Quasi-static Wave / CTK Full Load
hw=0m hw=1m hw=2m hw=3m hw=4m
hw=5m hw=6m hw=7m hw=8m hw=8.123m
Bending moment M [kNm] for 1D computation
-8.00E+03
-6.00E+03
-4.00E+03
-2.00E+03
0.00E+00
2.00E+03
4.00E+03
6.00E+03
8.00E+03
0.00 10.96 21.92 32.88 43.84 54.81 65.77 76.73 87.69 98.65 109.61
x [m]
T [KN] 1D-Beam Model Hogging / Quasi-static Wave / CTK Full Load
hw=0m hw=1m hw=2m hw=3m hw=4m
hw=5m hw=6m hw=7m hw=8m hw=8.123m
Shear force T [kN] for 1D computation
-3.00E+05
-2.50E+05
-2.00E+05
-1.50E+05
-1.00E+05
-5.00E+04
0.00E+00
5.00E+04
0.00 10.96 21.92 32.88 43.84 54.81 65.77 76.73 87.69 98.65 109.61
x [m]
M [KNm] 1D-Beam Model Sagging / Quasi-static Wave / CTK Full Load
hw=0m hw=1m hw=2m hw=3m hw=4m
hw=5m hw=6m hw=7m hw=8m hw=8.123m
Bending moment M [kNm] for 1D computation
-1.00E+04
-8.00E+03
-6.00E+03
-4.00E+03
-2.00E+03
0.00E+00
2.00E+03
4.00E+03
6.00E+03
8.00E+03
1.00E+04
0.00 10.96 21.92 32.88 43.84 54.81 65.77 76.73 87.69 98.65 109.61
x [m]
T [KN] 1D-Beam Model Sagging / Quasi-static Wave / CTK Full Load
hw=0m hw=1m hw=2m hw=3m hw=4m
hw=5m hw=6m hw=7m hw=8m hw=8.123m
Shear force T [kN] for
1D computation
Sagging
Hogging
3/14/2013 9
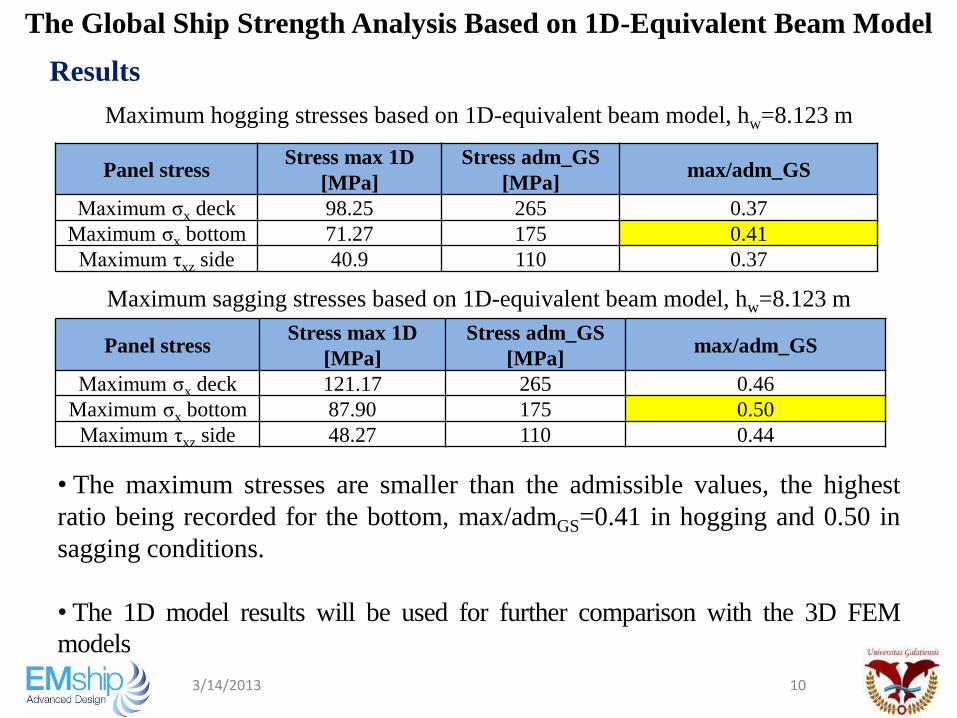
The Global Ship Strength Analysis Based on 1D-Equivalent Beam Model
Results
Panel stress Stress max 1D
[MPa]
Stress adm_GS
[MPa] max/adm_GS
Maximum σx deck 98.25 265 0.37
Maximum σx bottom 71.27 175 0.41
Maximum τxz side 40.9 110 0.37
Maximum hogging stresses based on 1D-equivalent beam model, hw=8.123 m
Panel stress Stress max 1D
[MPa]
Stress adm_GS
[MPa] max/adm_GS
Maximum σx deck 121.17 265 0.46
Maximum σx bottom 87.90 175 0.50
Maximum τxz side 48.27 110 0.44
Maximum sagging stresses based on 1D-equivalent beam model, hw=8.123 m
• The maximum stresses are smaller than the admissible values, the highest
ratio being recorded for the bottom, max/admGS=0.41 in hogging and 0.50 in
sagging conditions.
• The 1D model results will be used for further comparison with the 3D FEM
models
3/14/2013 10
The Global Ship Strength Analysis Based on 1D-Equivalent Beam Model
Results
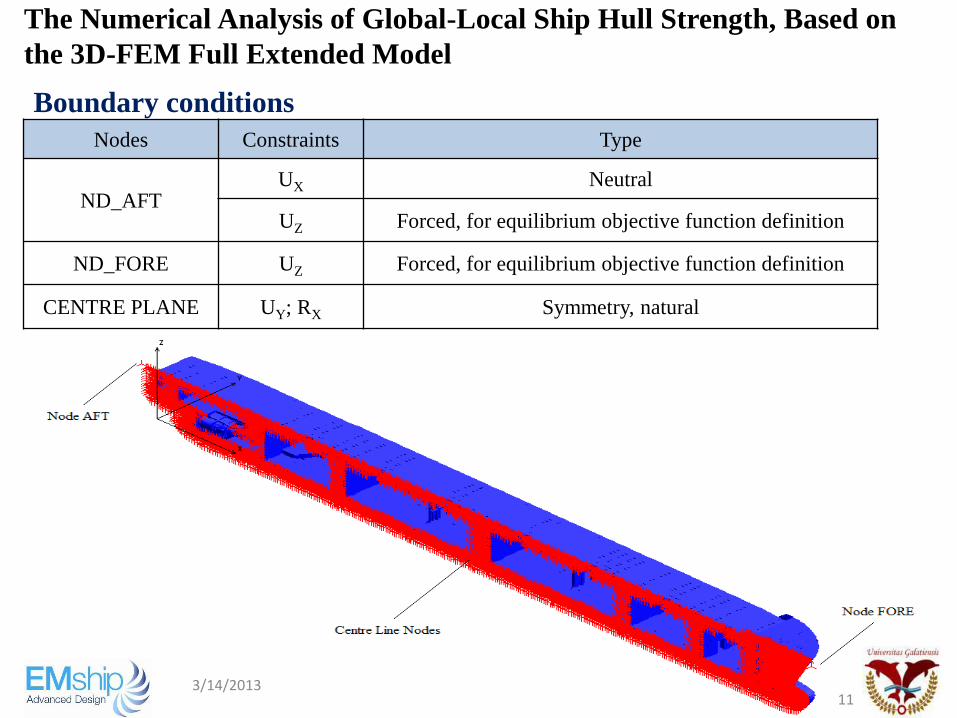
The Numerical Analysis of Global-Local Ship Hull Strength, Based on
the 3D-FEM Full Extended Model
Nodes Constraints Type
ND_AFT UX Neutral
UZ Forced, for equilibrium objective function definition
ND_FORE UZ Forced, for equilibrium objective function definition
CENTRE PLANE UY; RX Symmetry, natural
Boundary conditions
3/14/2013 11
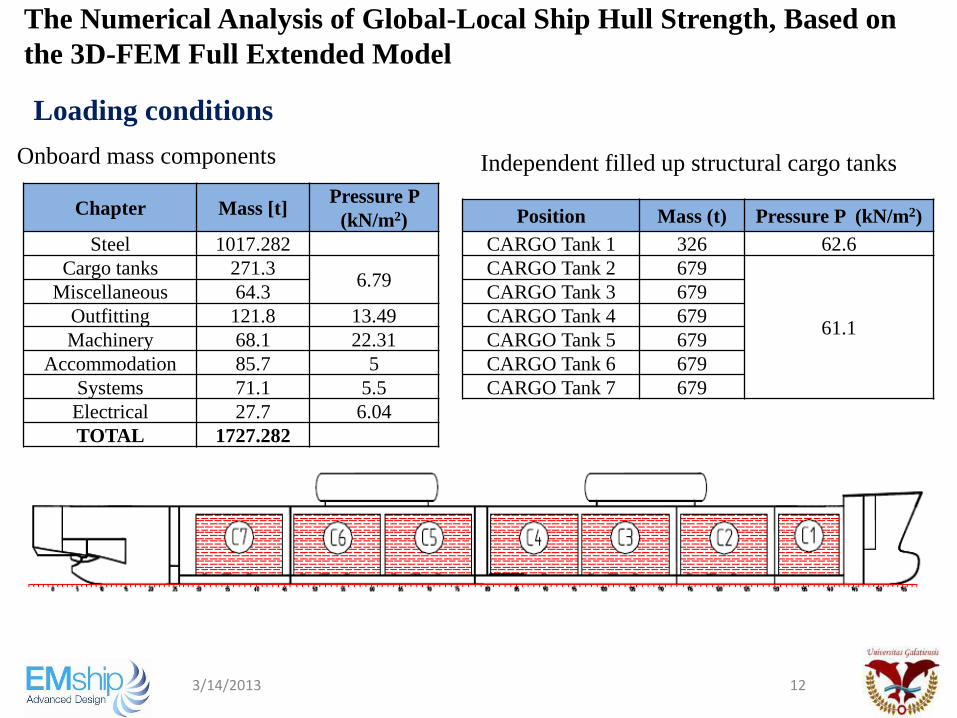
Chapter Mass [t] Pressure P
(kN/m2)
Steel 1017.282
Cargo tanks 271.3 6.79
Miscellaneous 64.3
Outfitting 121.8 13.49
Machinery 68.1 22.31
Accommodation 85.7 5
Systems 71.1 5.5
Electrical 27.7 6.04
TOTAL 1727.282
Onboard mass components
Position Mass (t) Pressure P (kN/m2)
CARGO Tank 1 326 62.6
CARGO Tank 2 679
61.1
CARGO Tank 3 679
CARGO Tank 4 679
CARGO Tank 5 679
CARGO Tank 6 679
CARGO Tank 7 679
Independent filled up structural cargo tanks
3/14/2013 12
The Numerical Analysis of Global-Local Ship Hull Strength, Based on
the 3D-FEM Full Extended Model
Loading conditions
0.00000
10.00000
20.00000
30.00000
40.00000
50.00000
60.00000
70.00000
80.00000
90.00000
0.1
50
6.6
00
13
.20
0
19
.74
4
27
.47
6
35
.34
1
43
.10
7
50
.87
3
58
.94
5
66
.71
1
74
.47
7
82
.34
2
90
.10
8
97
.55
0
10
4.2…
Ma
ss p
er u
nit
le
gth
(t/
m)
x (m)
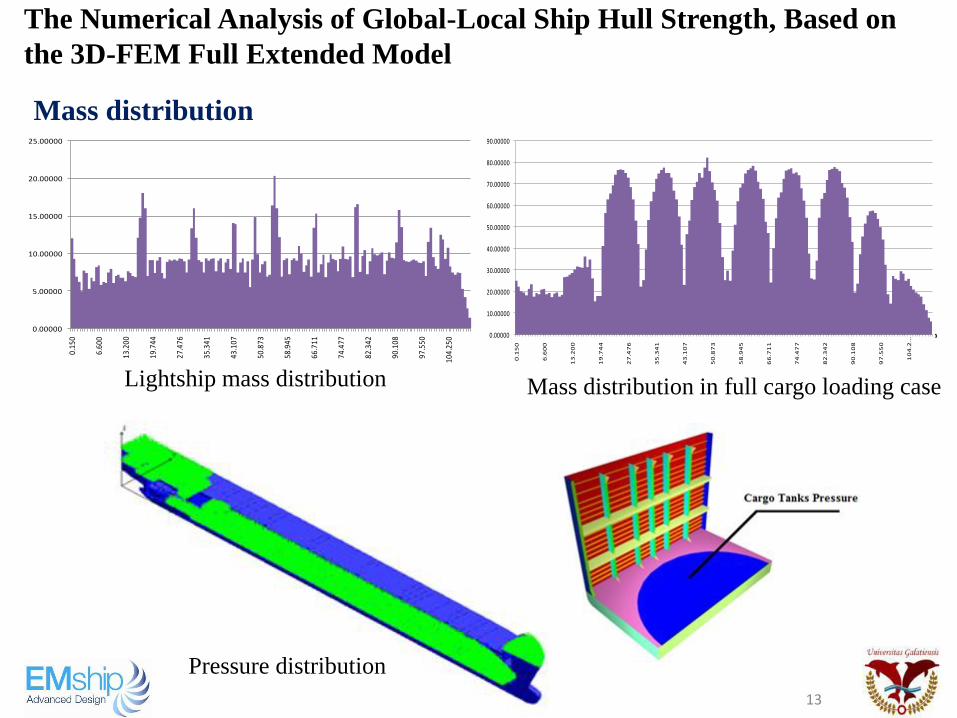
Mass distribution in the Full cargo loading case
Mass distribution in full cargo loading case
3/14/2013 13
0.00000
5.00000
10.00000
15.00000
20.00000
25.00000
0.15
0
6.60
0
13.2
00
19.7
44
27.4
76
35.3
41
43.1
07
50.8
73
58.9
45
66.7
11
74.4
77
82.3
42
90.1
08
97.5
50
104.
250
Mas
s pe
r un
it le
ngth
(t/m
)
x (m)
Mass distribution in Light Ship case (hull steel only)
Lightship mass distribution
The Numerical Analysis of Global-Local Ship Hull Strength, Based on
the 3D-FEM Full Extended Model
Mass distribution
Pressure distribution
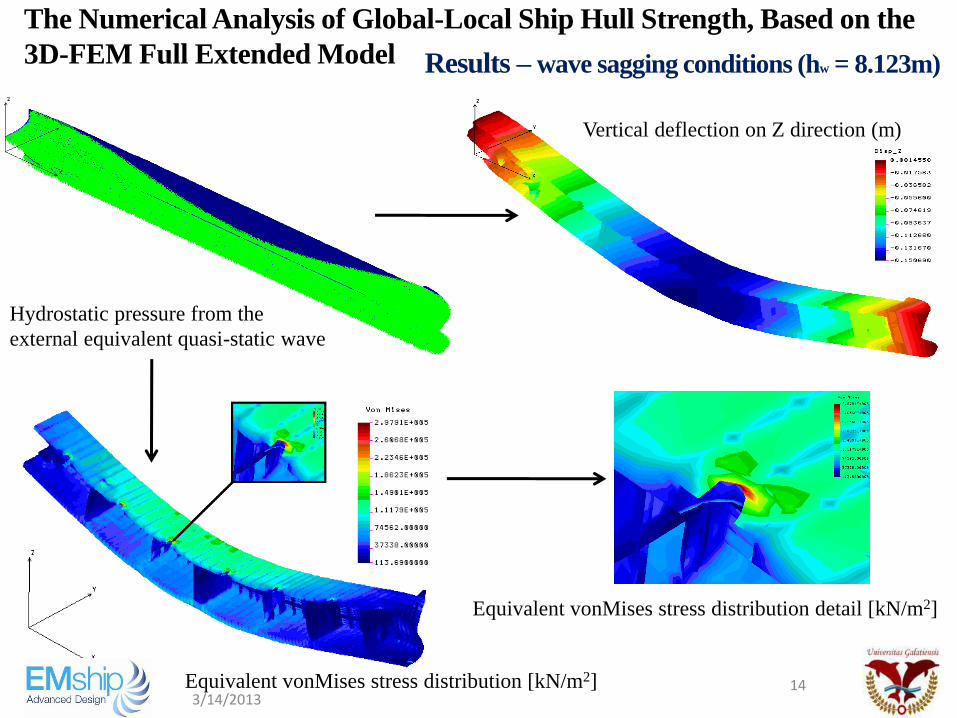
Hydrostatic pressure from the
external equivalent quasi-static wave
Vertical deflection on Z direction (m)
Equivalent vonMises stress distribution [kN/m2]
Equivalent vonMises stress distribution detail [kN/m2]
3/14/2013 14
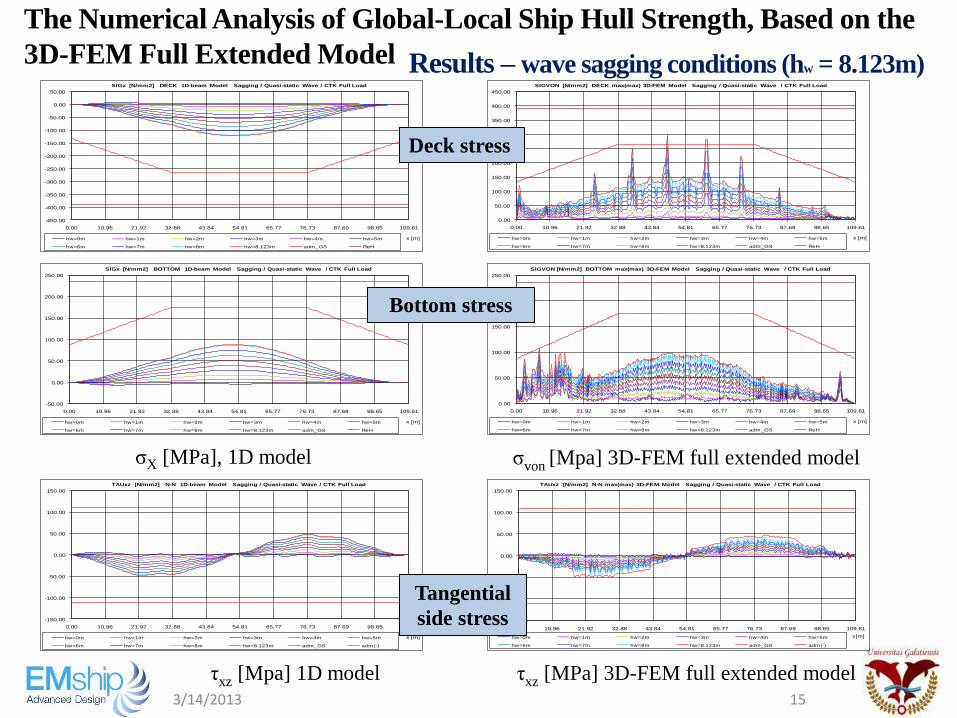
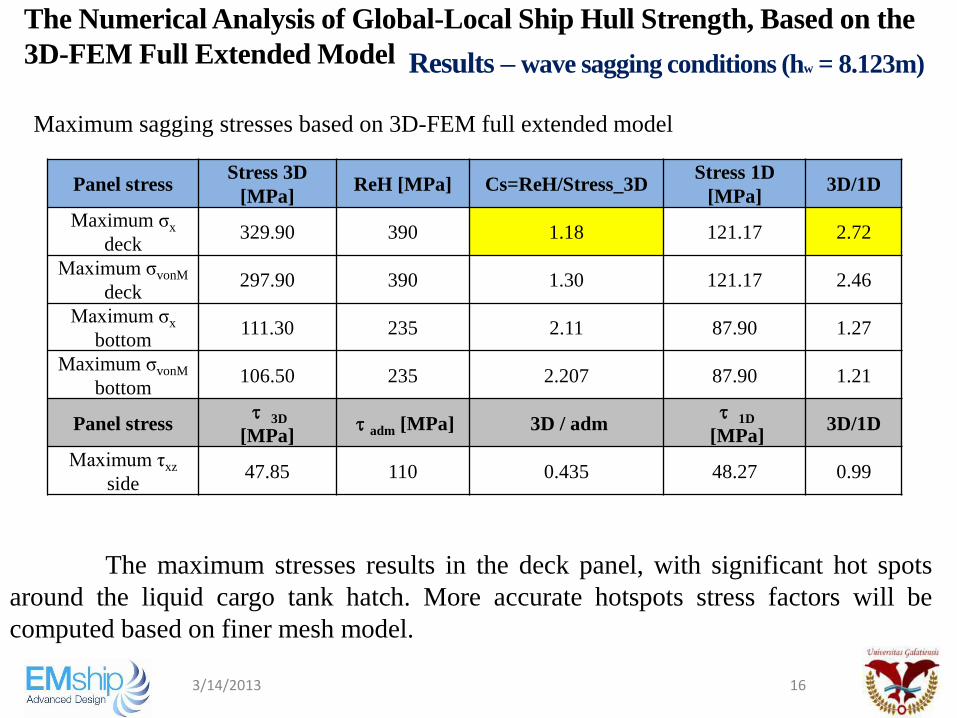
The Numerical Analysis of Global-Local Ship Hull Strength, Based on the
3D-FEM Full Extended Model Results – wave sagging conditions (hw = 8.123m)
0.00
50.00
100.00
150.00
200.00
250.00
300.00
350.00
400.00
450.00
0.00 10.96 21.92 32.88 43.84 54.81 65.77 76.73 87.69 98.65 109.61
x [m]
SIGVON [N/mm2] DECK max(max) 3D-FEM Model Sagging / Quasi-static Wave / CTK Full Load
hw=0m hw=1m hw=2m hw=3m hw=4m hw=5m
hw=6m hw=7m hw=8m hw=8.123m adm_GS ReH
-450.00
-400.00
-350.00
-300.00
-250.00
-200.00
-150.00
-100.00
-50.00
0.00
50.00
0.00 10.96 21.92 32.88 43.84 54.81 65.77 76.73 87.69 98.65 109.61
x [m]
SIGx [N/mm2] DECK 1D-beam Model Sagging / Quasi-static Wave / CTK Full Load
hw=0m hw=1m hw=2m hw=3m hw=4m hw=5m
hw=6m hw=7m hw=8m hw=8.123m adm_GS ReH
3/14/2013 15
0.00
50.00
100.00
150.00
200.00
250.00
0.00 10.96 21.92 32.88 43.84 54.81 65.77 76.73 87.69 98.65 109.61
x [m]
SIGVON [N/mm2] BOTTOM max(max) 3D-FEM Model Sagging / Quasi-static Wave / CTK Full Load
hw=0m hw=1m hw=2m hw=3m hw=4m hw=5m
hw=6m hw=7m hw=8m hw=8.123m adm_GS ReH
σvon [Mpa] 3D-FEM full extended model
-50.00
0.00
50.00
100.00
150.00
200.00
250.00
0.00 10.96 21.92 32.88 43.84 54.81 65.77 76.73 87.69 98.65 109.61
x [m]
SIGx [N/mm2] BOTTOM 1D-beam Model Sagging / Quasi-static Wave / CTK Full Load
hw=0m hw=1m hw=2m hw=3m hw=4m hw=5m
hw=6m hw=7m hw=8m hw=8.123m adm_GS ReH
σX [MPa], 1D model
-150.00
-100.00
-50.00
0.00
50.00
100.00
150.00
0.00 10.96 21.92 32.88 43.84 54.81 65.77 76.73 87.69 98.65 109.61
x [m]
TAUxz [N/mm2] N-N 1D-beam Model Sagging / Quasi-static Wave / CTK Full Load
hw=0m hw=1m hw=2m hw=3m hw=4m hw=5m
hw=6m hw=7m hw=8m hw=8.123m adm_GS adm(-)
τxz [Mpa] 1D model
Deck stress
-150.00
-100.00
-50.00
0.00
50.00
100.00
150.00
0.00 10.96 21.92 32.88 43.84 54.81 65.77 76.73 87.69 98.65 109.61
x[m]
TAUxz [N/mm2] N-N max(max) 3D-FEM Model Sagging / Quasi-static Wave / CTK Full Load
hw=0m hw=1m hw=2m hw=3m hw=4m hw=5m
hw=6m hw=7m hw=8m hw=8.123m adm_GS adm(-)
τxz [MPa] 3D-FEM full extended model
Results – wave sagging conditions (hw = 8.123m)
Bottom stress
Tangential
side stress
The Numerical Analysis of Global-Local Ship Hull Strength, Based on the
3D-FEM Full Extended Model
Panel stress Stress 3D
[MPa] ReH [MPa] Cs=ReH/Stress_3D
Stress 1D
[MPa] 3D/1D
Maximum σx
deck 329.90 390 1.18 121.17 2.72
Maximum σvonM
deck 297.90 390 1.30 121.17 2.46
Maximum σx
bottom 111.30 235 2.11 87.90 1.27
Maximum σvonM
bottom 106.50 235 2.207 87.90 1.21
Panel stress 3D
[MPa] adm [MPa] 3D / adm
1D
[MPa] 3D/1D
Maximum τxz
side 47.85 110 0.435 48.27 0.99
Maximum sagging stresses based on 3D-FEM full extended model
The maximum stresses results in the deck panel, with significant hot spots
around the liquid cargo tank hatch. More accurate hotspots stress factors will be
computed based on finer mesh model.
3/14/2013 16
Results – wave sagging conditions (hw = 8.123m)
The Numerical Analysis of Global-Local Ship Hull Strength, Based on the
3D-FEM Full Extended Model
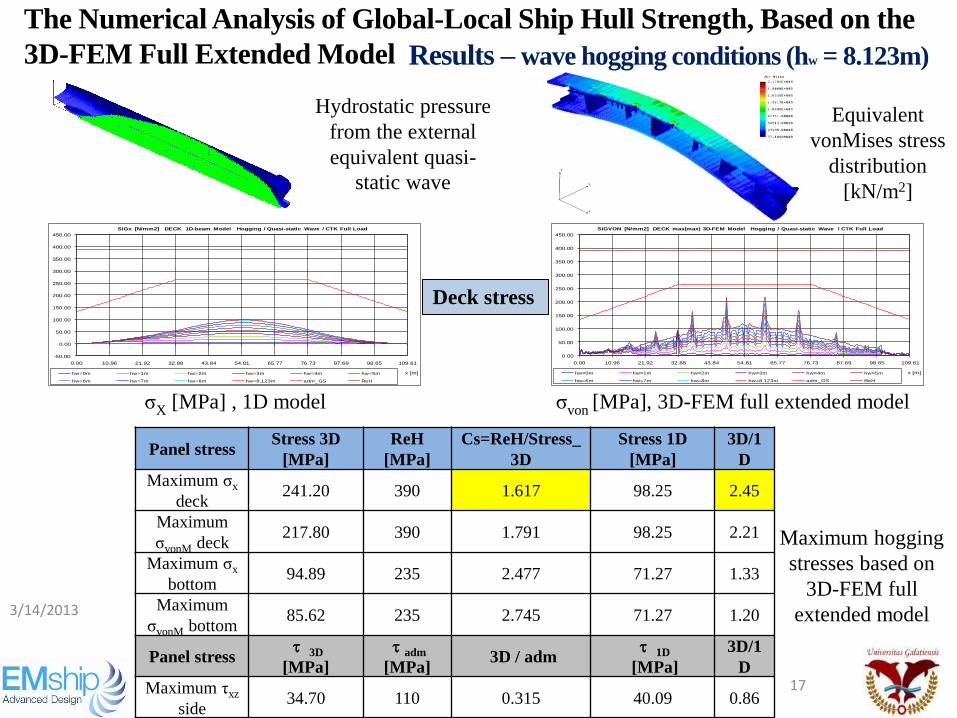
Hydrostatic pressure
from the external
equivalent quasi-
static wave
Equivalent
vonMises stress
distribution
[kN/m2]
3/14/2013
17
0.00
50.00
100.00
150.00
200.00
250.00
300.00
350.00
400.00
450.00
0.00 10.96 21.92 32.88 43.84 54.81 65.77 76.73 87.69 98.65 109.61
x [m]
SIGVON [N/mm2] DECK max(max) 3D-FEM Model Hogging / Quasi-static Wave / CTK Full Load
hw=0m hw=1m hw=2m hw=3m hw=4m hw=5m
hw=6m hw=7m hw=8m hw=8.123m adm_GS ReH
σvon [MPa], 3D-FEM full extended model
-50.00
0.00
50.00
100.00
150.00
200.00
250.00
300.00
350.00
400.00
450.00
0.00 10.96 21.92 32.88 43.84 54.81 65.77 76.73 87.69 98.65 109.61
x [m]
SIGx [N/mm2] DECK 1D-beam Model Hogging / Quasi-static Wave / CTK Full Load
hw=0m hw=1m hw=2m hw=3m hw=4m hw=5m
hw=6m hw=7m hw=8m hw=8.123m adm_GS ReH
σX [MPa] , 1D model
Panel stress Stress 3D
[MPa]
ReH
[MPa]
Cs=ReH/Stress_
3D
Stress 1D
[MPa]
3D/1
D
Maximum σx
deck 241.20 390 1.617 98.25 2.45
Maximum
σvonM deck 217.80 390 1.791 98.25 2.21
Maximum σx
bottom 94.89 235 2.477 71.27 1.33
Maximum
σvonM bottom 85.62 235 2.745 71.27 1.20
Panel stress 3D
[MPa]
adm
[MPa] 3D / adm
1D
[MPa]
3D/1
D
Maximum τxz
side 34.70 110 0.315 40.09 0.86
Maximum hogging
stresses based on
3D-FEM full
extended model
Results – wave hogging conditions (hw = 8.123m)
Deck stress
The Numerical Analysis of Global-Local Ship Hull Strength, Based on the
3D-FEM Full Extended Model
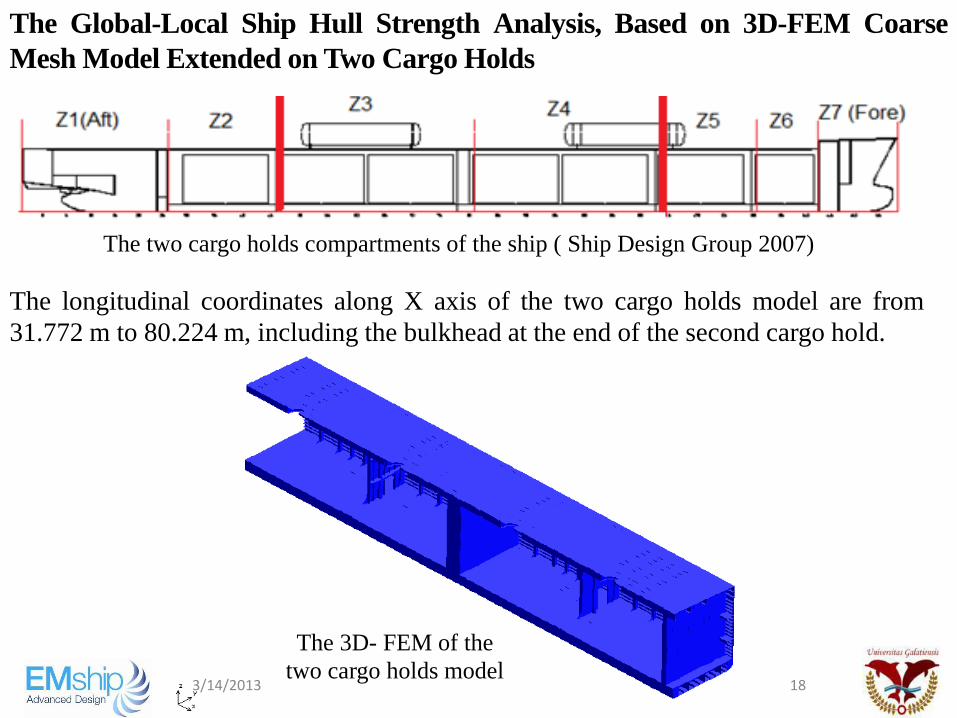
The Global-Local Ship Hull Strength Analysis, Based on 3D-FEM Coarse
Mesh Model Extended on Two Cargo Holds
The longitudinal coordinates along X axis of the two cargo holds model are from
31.772 m to 80.224 m, including the bulkhead at the end of the second cargo hold.
The two cargo holds compartments of the ship ( Ship Design Group 2007)
3/14/2013 18
The 3D- FEM of the
two cargo holds model
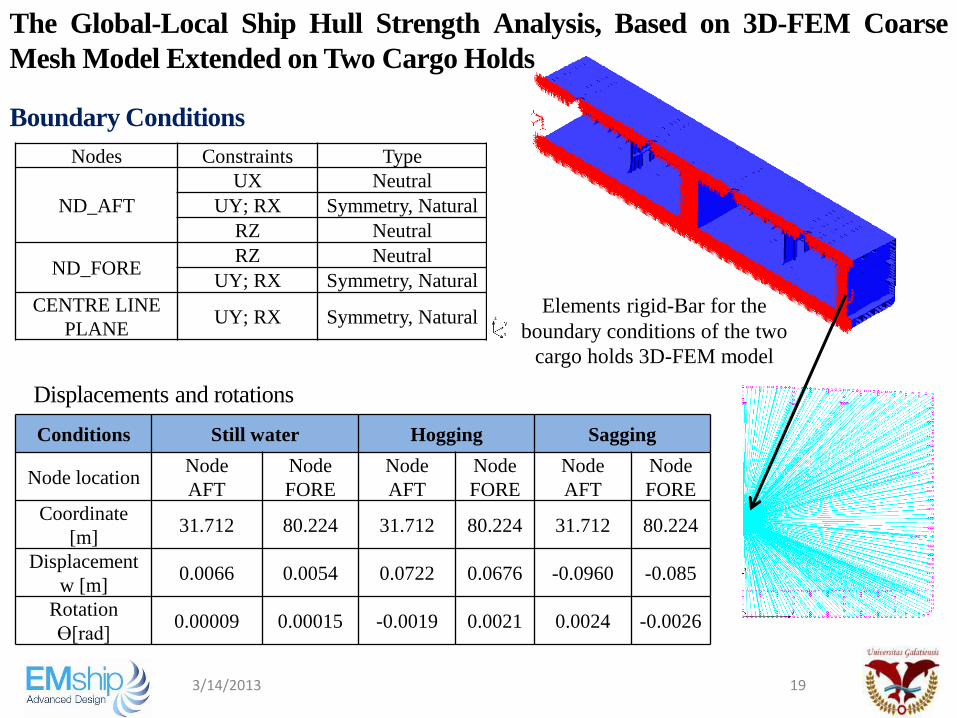
Nodes Constraints Type
ND_AFT
UX Neutral
UY; RX Symmetry, Natural
RZ Neutral
ND_FORE RZ Neutral
UY; RX Symmetry, Natural
CENTRE LINE
PLANE UY; RX Symmetry, Natural
Conditions Still water Hogging Sagging
Node location Node
AFT
Node
FORE
Node
AFT
Node
FORE
Node
AFT
Node
FORE
Coordinate
[m] 31.712 80.224 31.712 80.224 31.712 80.224
Displacement
w [m] 0.0066 0.0054 0.0722 0.0676 -0.0960 -0.085
Rotation
Ɵ[rad] 0.00009 0.00015 -0.0019 0.0021 0.0024 -0.0026
Displacements and rotations
3/14/2013 19
Boundary Conditions
Elements rigid-Bar for the
boundary conditions of the two
cargo holds 3D-FEM model
The Global-Local Ship Hull Strength Analysis, Based on 3D-FEM Coarse
Mesh Model Extended on Two Cargo Holds
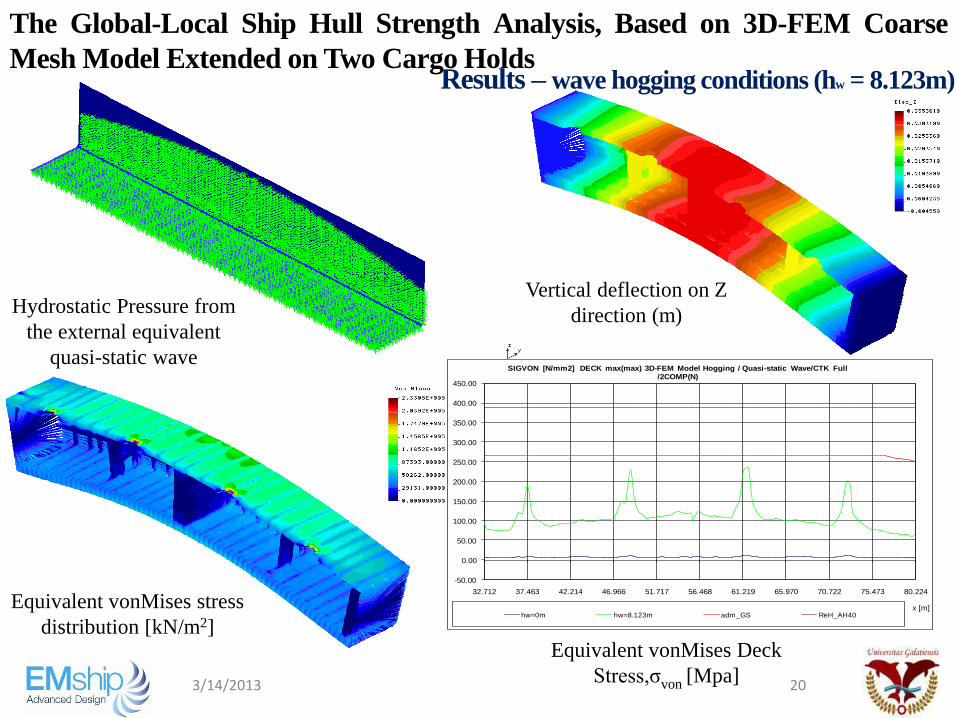
Hydrostatic Pressure from
the external equivalent
quasi-static wave
Vertical deflection on Z
direction (m)
Equivalent vonMises stress
distribution [kN/m2]
3/14/2013 20
-50.00
0.00
50.00
100.00
150.00
200.00
250.00
300.00
350.00
400.00
450.00
32.712 37.463 42.214 46.966 51.717 56.468 61.219 65.970 70.722 75.473 80.224
x [m]
SIGVON [N/mm2] DECK max(max) 3D-FEM Model Hogging / Quasi-static Wave/CTK Full /2COMP(N)
hw=0m hw=8.123m adm_GS ReH_AH40
Equivalent vonMises Deck
Stress,σvon [Mpa]
Results – wave hogging conditions (hw = 8.123m)
The Global-Local Ship Hull Strength Analysis, Based on 3D-FEM Coarse
Mesh Model Extended on Two Cargo Holds
3/14/2013 21
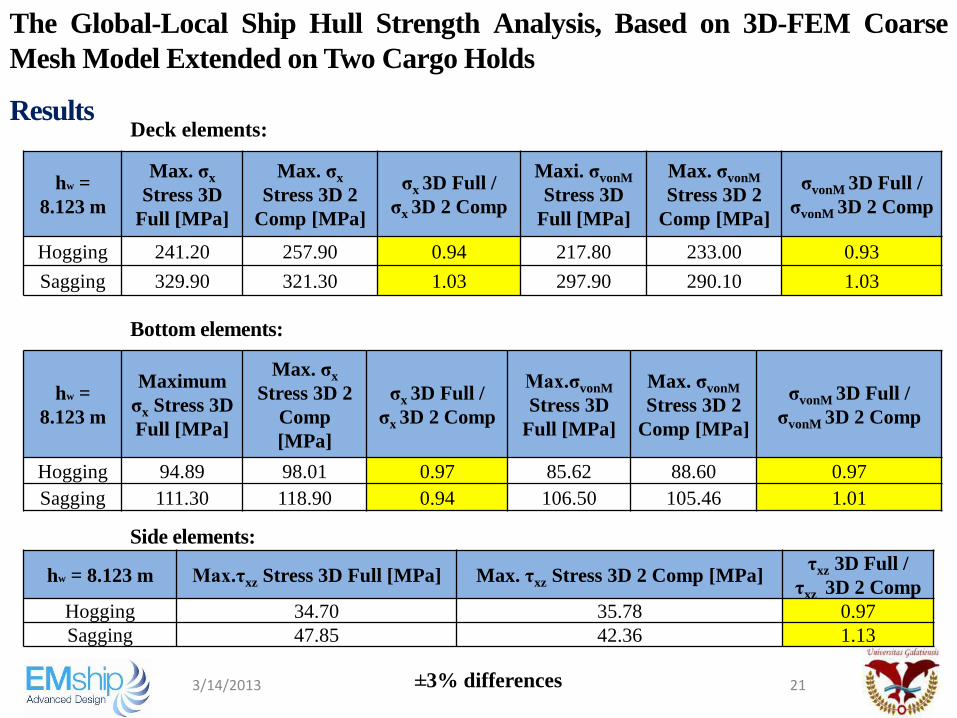
hw =
8.123 m
Max. σx
Stress 3D
Full [MPa]
Max. σx
Stress 3D 2
Comp [MPa]
σx 3D Full /
σx 3D 2 Comp
Maxi. σvonM
Stress 3D
Full [MPa]
Max. σvonM
Stress 3D 2
Comp [MPa]
σvonM 3D Full /
σvonM 3D 2 Comp
Hogging 241.20 257.90 0.94 217.80 233.00 0.93
Sagging 329.90 321.30 1.03 297.90 290.10 1.03
hw =
8.123 m
Maximum
σx Stress 3D
Full [MPa]
Max. σx
Stress 3D 2
Comp
[MPa]
σx 3D Full /
σx 3D 2 Comp
Max.σvonM
Stress 3D
Full [MPa]
Max. σvonM
Stress 3D 2
Comp [MPa]
σvonM 3D Full /
σvonM 3D 2 Comp
Hogging 94.89 98.01 0.97 85.62 88.60 0.97
Sagging 111.30 118.90 0.94 106.50 105.46 1.01
Deck elements:
Bottom elements:
hw = 8.123 m Max.τxz Stress 3D Full [MPa] Max. τxz Stress 3D 2 Comp [MPa] τxz 3D Full /
τxz 3D 2 Comp
Hogging 34.70 35.78 0.97
Sagging 47.85 42.36 1.13
Side elements:
±3% differences
Results
The Global-Local Ship Hull Strength Analysis, Based on 3D-FEM Coarse
Mesh Model Extended on Two Cargo Holds
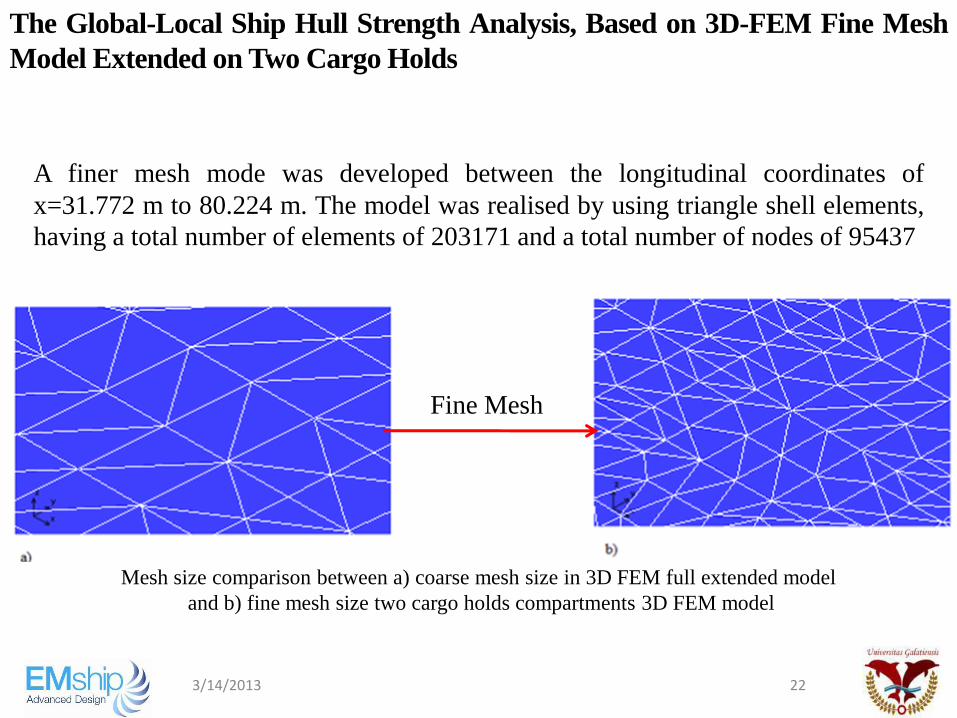
A finer mesh mode was developed between the longitudinal coordinates of
x=31.772 m to 80.224 m. The model was realised by using triangle shell elements,
having a total number of elements of 203171 and a total number of nodes of 95437
Mesh size comparison between a) coarse mesh size in 3D FEM full extended model
and b) fine mesh size two cargo holds compartments 3D FEM model
3/14/2013 22
The Global-Local Ship Hull Strength Analysis, Based on 3D-FEM Fine Mesh
Model Extended on Two Cargo Holds
Fine Mesh
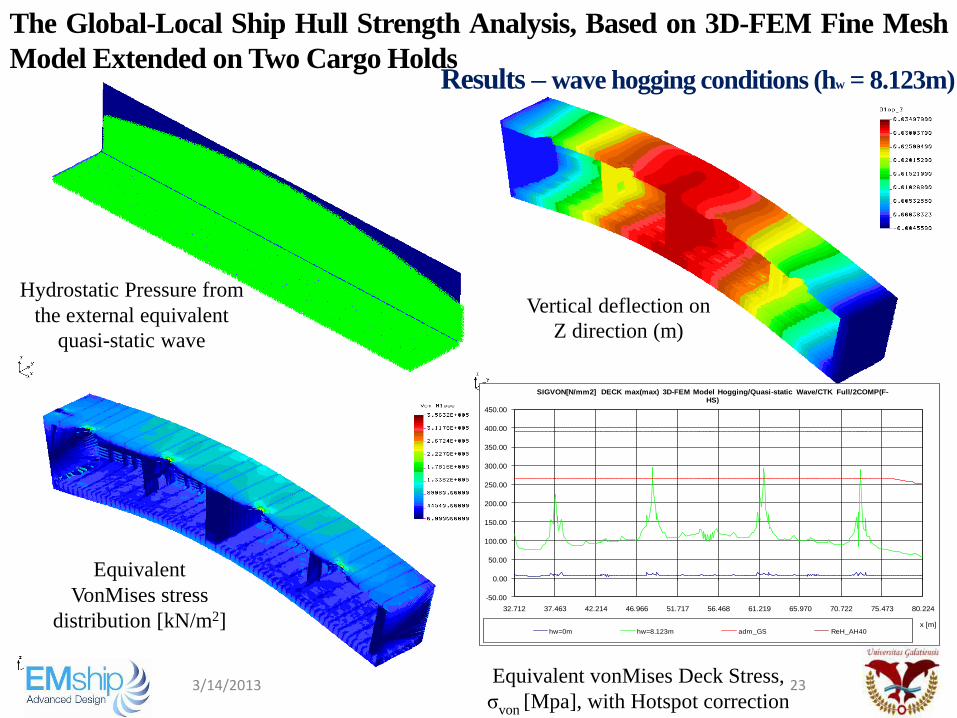
Hydrostatic Pressure from
the external equivalent
quasi-static wave
Vertical deflection on
Z direction (m)
Equivalent
VonMises stress
distribution [kN/m2]
3/14/2013 23
-50.00
0.00
50.00
100.00
150.00
200.00
250.00
300.00
350.00
400.00
450.00
32.712 37.463 42.214 46.966 51.717 56.468 61.219 65.970 70.722 75.473 80.224
x [m]
SIGVON[N/mm2] DECK max(max) 3D-FEM Model Hogging/Quasi-static Wave/CTK Full/2COMP(F-HS)
hw=0m hw=8.123m adm_GS ReH_AH40
Equivalent vonMises Deck Stress,
σvon [Mpa], with Hotspot correction
Results – wave hogging conditions (hw = 8.123m)
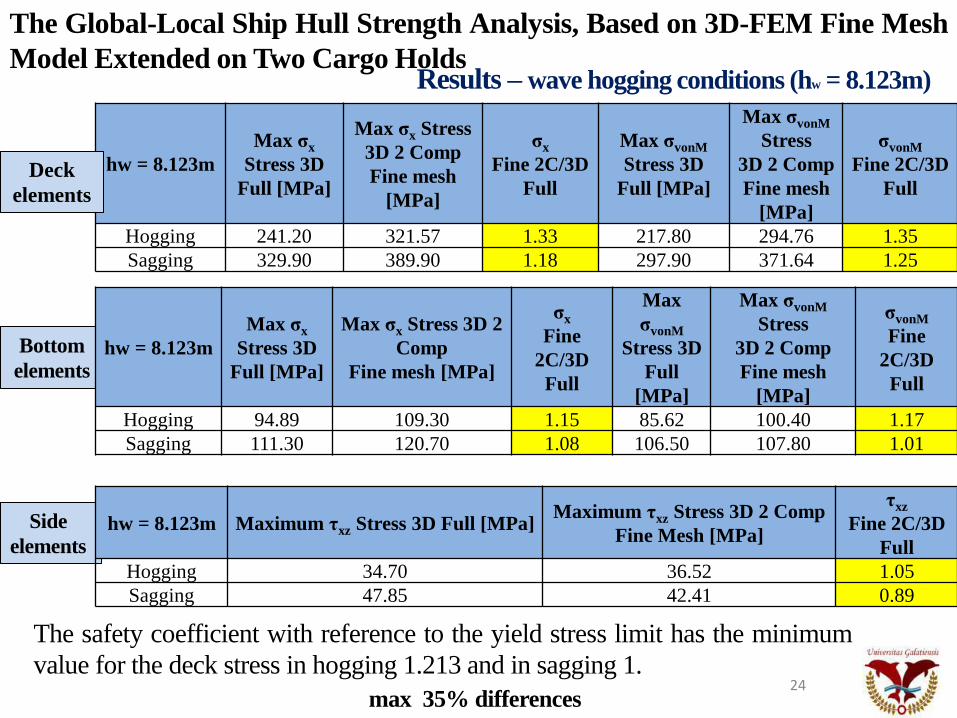
The Global-Local Ship Hull Strength Analysis, Based on 3D-FEM Fine Mesh
Model Extended on Two Cargo Holds
24
hw = 8.123m
Max σx
Stress 3D
Full [MPa]
Max σx Stress
3D 2 Comp
Fine mesh
[MPa]
σx
Fine 2C/3D
Full
Max σvonM
Stress 3D
Full [MPa]
Max σvonM
Stress
3D 2 Comp
Fine mesh
[MPa]
σvonM
Fine 2C/3D
Full
Hogging 241.20 321.57 1.33 217.80 294.76 1.35
Sagging 329.90 389.90 1.18 297.90 371.64 1.25
Deck
elements
Bottom
elements
Side
elements
hw = 8.123m
Max σx
Stress 3D
Full [MPa]
Max σx Stress 3D 2
Comp
Fine mesh [MPa]
σx
Fine
2C/3D
Full
Max
σvonM
Stress 3D
Full
[MPa]
Max σvonM
Stress
3D 2 Comp
Fine mesh
[MPa]
σvonM
Fine
2C/3D
Full
Hogging 94.89 109.30 1.15 85.62 100.40 1.17
Sagging 111.30 120.70 1.08 106.50 107.80 1.01
hw = 8.123m Maximum τxz Stress 3D Full [MPa] Maximum τxz Stress 3D 2 Comp
Fine Mesh [MPa]
τxz
Fine 2C/3D
Full
Hogging 34.70 36.52 1.05
Sagging 47.85 42.41 0.89
Results – wave hogging conditions (hw = 8.123m)
The safety coefficient with reference to the yield stress limit has the minimum
value for the deck stress in hogging 1.213 and in sagging 1. max 35% differences
The Global-Local Ship Hull Strength Analysis, Based on 3D-FEM Fine Mesh
Model Extended on Two Cargo Holds
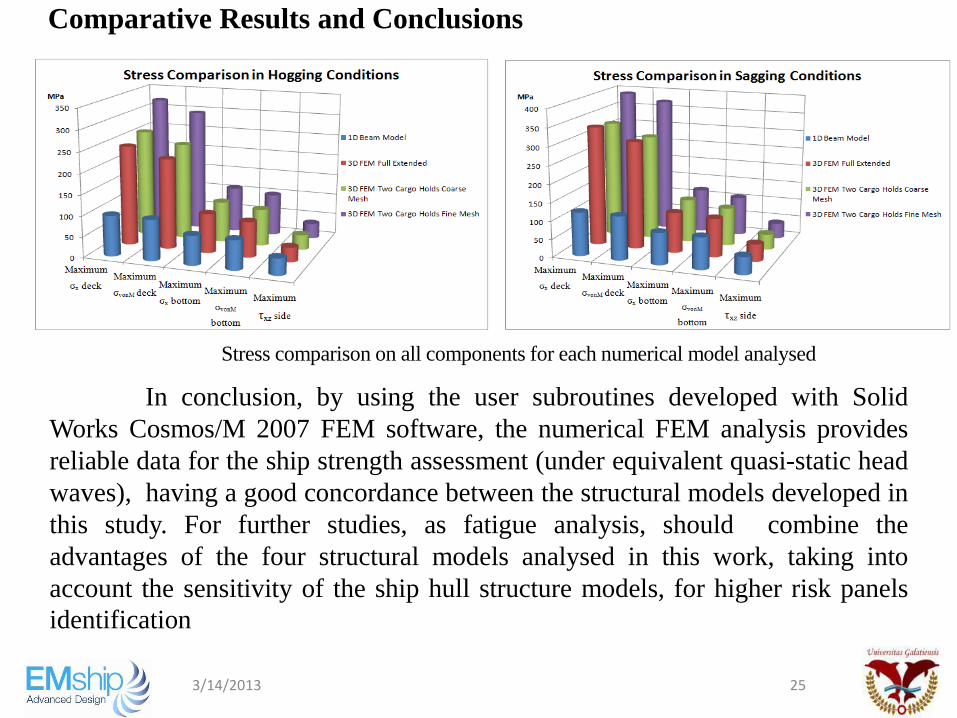
Comparative Results and Conclusions
Stress comparison on all components for each numerical model analysed
3/14/2013 25
In conclusion, by using the user subroutines developed with Solid
Works Cosmos/M 2007 FEM software, the numerical FEM analysis provides
reliable data for the ship strength assessment (under equivalent quasi-static head
waves), having a good concordance between the structural models developed in
this study. For further studies, as fatigue analysis, should combine the
advantages of the four structural models analysed in this work, taking into
account the sensitivity of the ship hull structure models, for higher risk panels
identification
THANK YOU FOR YOUR
ATTENTION ! 3/14/2013 26
CIOAREC DAN SEBASTIAN


![Masterthesis E. Bekker-Janssens [4254694]](https://img.pdfslide.tips/doc/110x75/58edeb421a28ab2d5c8b458d/masterthesis-e-bekker-janssens-4254694.jpg)