Embed Size (px)
Citation preview

© 2012 Noyce Foundation
Performance Assessment Task Winning Spinners
Grade 6 task aligns in part to CCSSM HS Statistics & Probability The task challenges a student to demonstrate an understanding of the concept of constructing and interpreting two‐way tables as a sample space. A student must make sense of the sample space to determine probabilities. A student must be able to create a new table to verify the change of the spinners in the game to increase the probability of winning for a particular player.
Common Core State Standards Math ‐ Content Standards High School – Statistics and Probability Conditional Probability and the Rules of Probability Understand independence and conditional probability and use them to interpret data. S‐CP.4 Construct and interpret two‐way frequency tables of data when two categories are associated with each object being classified. Use the two‐way table as a sample space to decide if events are independent and to approximate conditional probabilities. For example, collect data from a random sample of students in your school on their favorite subject among math, science, and English. Estimate the probability that a randomly selected student from your school will favor science given that the student is in tenth grade. Do the same for other subjects and compare the results.
Common Core State Standards Math – Standards of Mathematical Practice MP. 2 Reason abstractly and quantitatively.Mathematically proficient students make sense of quantities and their relationships in problem situations. They bring two complementary abilities to bear on problems involving quantitative relationships: the ability to decontextualize—to abstract a given situation and represent it symbolically and manipulate the representing symbols as if they have a life of their own, without necessarily attending to their referents—and the ability to contextualize, to pause as needed during the manipulation process in order to probe into the referents for the symbols involved. Quantitative reasoning entails habits of creating a coherent representation of the problem at hand; considering the units involved; attending to the meaning of quantities, not just how to compute them; and knowing and flexibly using different properties of operations and objects. MP.6 Attend to precision. Mathematically proficient students try to communicate precisely to others. They try to use clear definitions in discussion with others and in their own reasoning. They state the meaning of the symbols they choose, including using the equal sign consistently and appropriately. They are careful about specifying units of measure, and labeling axes to clarify the correspondence with quantities in a problem. They calculate accurately and efficiently, express numerical answers with a degree of precision appropriate for the problem context. In the elementary grades, students give carefully formulated explanations to each other. By the time they reach high school they have learned to examine claims and make explicit use of definitions.
Assessment Results This task was developed by the Mathematics Assessment Resource Service and administered as part of a national, normed math assessment. For comparison purposes, teachers may be interested in the results of the national assessment, including the total points possible for the task, the number of core points, and the percent of students that scored at standard on the task. Related materials, including the scoring rubric, student work, and discussions of student understandings and misconceptions on the task, are included in the task packet. Grade Level Year Total Points Core Points % At Standard
6 2005 10 4 69 %

Grade 6 – 2005 pg. 35

Grade Six – 2005 pg. 36
Winning Spinners Grade 6 Rubric The core elements of performance required by this task are: • work with probability Based on these, credit for specific aspects of performance should be assigned as follows
points
section points
1. Fills in the table correctly:
Partial credit No more than 2 mistakes or no values, only “odd” or “even” given correctly.
2
(1)
2
2. Gives a correct answer: 4/16 = 1/4 or equivalent Accept correct decimals, percents and ’out of’. Partial credit denominator 16
2ft
(1)
2 3. Fills in spinners correctly:
The even numbers split so there is one even number on one spinner and two on the other (position of the numbers does not matter)
Gives a correct answer: 1/2 or equivalent
Gives an explanation or table to show a correct method.
Special case Correctly uses their own numbers: maximum 2 points
2 2 2
6 Total Points 10
Spinner A
Spinner B
+ 8 4 2 1
7
9
5
3
15 11 9 8
13
13 6
5
17
11
9
7
11
7
10
4

Grade 6 – 2005 pg. 37
Looking at Student Work on Spinners: Student A shows a strong understanding of probability. The student defines the number of possible outcomes and the number of favorable outcomes. In part 3, the student finds two ways to show the sample space. Student A
(c) Noyce Foundation 2012

Grade Six – 2005 pg. 38
Student B is able to figure out the design for the new spinner by reasoning about number properties (an odd plus an odd makes an even). Student B
Student C is able to show the sample space for part 3 by making an organized list, which includes all the possible outcomes. Student C
(c) Noyce Foundation 2012

Grade 6 – 2005 pg. 39
Student D attempts to show the sample space for part 3, but her list is incomplete. Notice that the student still thinks about probability as whole numbers, how many favorable outcomes. Students at this grade should know that probability is expressed as a ratio of favorable outcomes/ all possible outcomes. Student D
(c) Noyce Foundation 2012

Grade Six – 2005 pg. 40
Student E is able to fill out the addition chart and correctly rearrange the numbers on the spinner to get a more favorable probability. The student thinks about number combinations to reason about the arrangement of the numbers on the spinners. However, like student D the list of combinations is not exhaustive. While at younger grades students discuss probabilities in terms of likeliness, at sixth grade students need to be able to quantify the probability. Student E
(c) Noyce Foundation 2012

Grade 6 – 2005 pg. 41
Student F is able to fill out the addition chart in part 1 and make a new addition chart for the spinner designed in part 3. However, the student does not realize how to use the chart to calculate probability. Student F sums each row of the chart to see if its an even number, which has nothing to do with the mathematics of this task. Student F
(c) Noyce Foundation 2012

Grade Six – 2005 pg. 42
While Student G appears to have good understanding of the task, getting 8 out of 10 points, notice that the student is thinking about individual numbers on the spinner in part 3 rather than the outcome of combining results of two spinners used together. Student G
(c) Noyce Foundation 2012

Grade 6 – 2005 pg. 43
Student H is able to fill out the addition chart, but does not make a connection between the results in the chart and finding probability. The student thinks about the spinner as an individual event, rather than the effect of combining the results of both spinners to determine an outcome. Student H
(c) Noyce Foundation 2012

Grade Six – 2005 pg. 44
Student I thinks of probability as a “how to win”, rather than a condition of likelihood or a quantity for expressing likelihood. Student I
Student J does not understand that to improve the probability for winning the numbers must be switched across spinners. Student J makes the common error of just rearranging the numbers on the same spinner. Student J
(c) Noyce Foundation 2012

Grade 6 – 2005 pg. 45
Student K changes the numbers for the spinners to improve the probability for winning. While the new spinners do improve the chances, the mathematics is considerably easier than rearranging the numbers on the original spinners. Student K
Student L misinterprets the task in many ways. The student does not understand probability and writes lists of numbers rather than making a numerical statement about the chances of winning. The student uses numbers from the addition chart to make the new spinner, rather than rearranging the numbers on Spinners A and B. Student L
(c) Noyce Foundation 2012
Grade Six – 2005 pg. 46
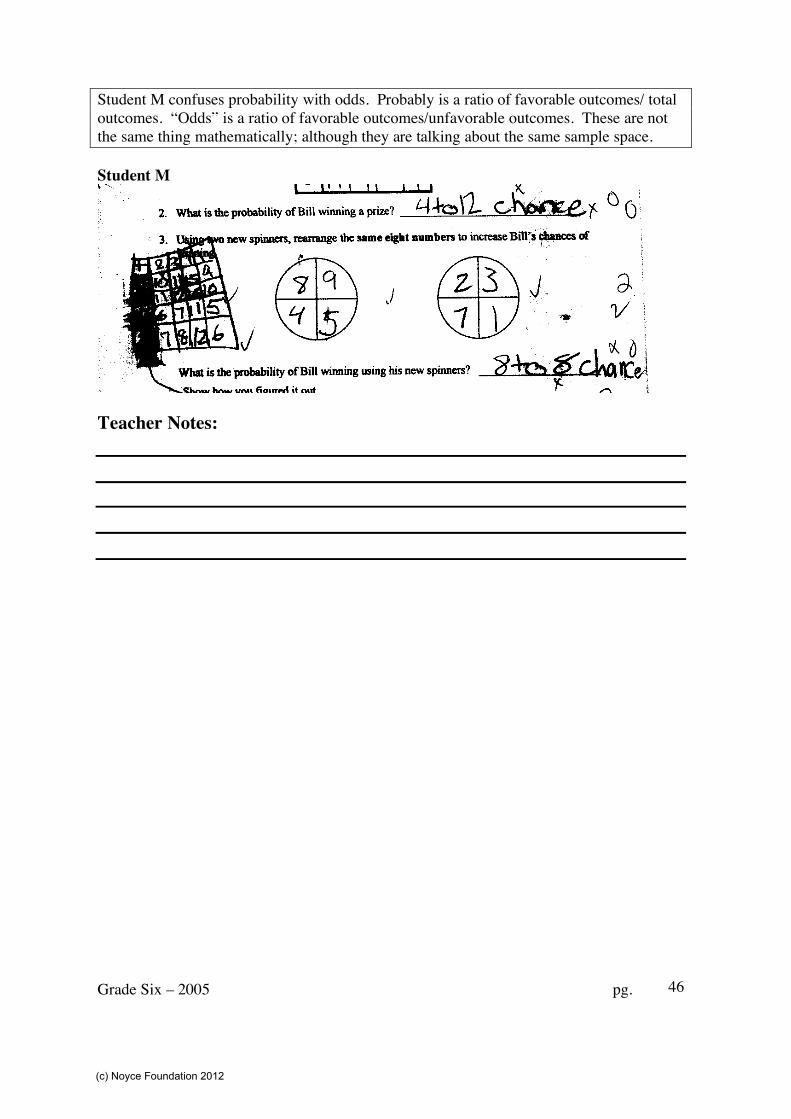
Student M confuses probability with odds. Probably is a ratio of favorable outcomes/ total outcomes. “Odds” is a ratio of favorable outcomes/unfavorable outcomes. These are not the same thing mathematically; although they are talking about the same sample space. Student M
Teacher Notes:
(c) Noyce Foundation 2012

Grade 6 – 2005 pg. 47
Frequency Distribution for Task 3 – Grade 6 – Winning Spinners
Winning Spinners Mean: 5.43 StdDev: 3.37
MARS Task 3 Raw Scores
Score: 0 1 2 3 4 5 6 7 8 9 10 Student Count 656 241 1346 269 1325 179 1045 127
801
161 1842
% < = 8.2% 11.2% 28.1% 31.4% 48.0% 50.3% 63.3% 64.9% 74.9% 77.0% 100.0% % > = 100.0% 91.8% 88.8% 71.9% 68.6% 52.0% 49.7% 36.7% 35.1% 25.1% 23.0%
The maximum score available for this task is 10 points. The minimum score for a level 3 response, meeting standards, is 4 points. Most students, 89%, were able to fill in the addition chart for combining the values of the two spinners. More than half the students, 69%, were able to fill in the addition chart and design a new set of spinners with a higher probability of winning. Almost half, 49%, could fill in the addition chart for the original spinners, design spinners with a higher probability of winning, and make an addition chart for the new spinners. 24% of the students could meet all the demands of the task, including giving numerical probabilities for each set of spinners. 7% of the students received no points on this task. 92% of those students attempted the task.
(c) Noyce Foundation 2012

Grade Six – 2005 pg. 48
Winning Spinners Points Understandings Misunderstandings
0 92% of the students attempted the task.
Students did not understand the purpose of the addition chart. Most seemed to be looking for a pattern to the numbers in the chart, like 13, 14,15. Students did not use addition to find values.
2 Students could use addition to accurately fill out the chart.
Students did not know how to express a probability mathematically. 19% of all students gave the probability as a verbal description, like not likely, or described how to win, e.g. “get an even number”.
4 Students could fill out addition chart and design spinners with better odds.
15% of all students rearranged the numbers on the same spinner. 15% substituted their own numbers (82% of these numbers were all even). 6% used the given numbers, but used some more than once. Many of these designs did not improve the odds.
6 Students could fill out the addition chart, design spinners with better odds, and either make a new addition chart for their spinner or give a probability for the first set of spinners.
13% gave whole numbers for the probability. 6% were thinking in eighths because there were eight numbers on the spinner. 13% gave wrong values of sixteenths.
8 Students could fill out the chart, design spinners, give the probability for the first spinner, and either make the chart for the new spinners or give the probability for the new spinners.
Some students could make the addition chart, but did not relate the chart to finding probability. The chart was not connected to solving the task. Students with the correct probability gave incomplete explanations, usually not defining the whole sample space, or gave explanations not based on the mathematics of the task.
10 Students could fill out an addition chart to show the sample space for spinning two spinners, using the same numbers design a spinner with a higher probability of winning, show the sample space for the new spinner, and give quantify the probabilities for each set of spinners. Of the students who gave correct probabilities: 63% used fractions,18% used percents, and 8% “out of”.
(c) Noyce Foundation 2012

Grade 6 – 2005 pg. 49
Based on teacher observation, this is what sixth graders know and are able to do:
• Complete an addition chart • Design a set of spinners, using the given numbers, with a higher probability of
winning • Give a probability with 16ths as the denominator
Areas of difficulty for sixth graders: • Quantifying probability instead of using language of likelihood • Connecting the addition chart to the probability • Understanding a compound event (Students thought of getting an even number on
one of the spinners, versus the sum of numbers on both spinners.) • Identifying the constraints of the task ( using the same numbers on the new
spinners, improving the odds) Strategies used by successful students:
• Making an organized list or new addition chart to find the probability for the second set of spinners
• Using fractions, percents, and “out of” to quantify probabilities Questions for Reflection on Winning Spinners:
• What experiences have your students had with probability this year? • Have their experiences dealt with strictly the language of probability: likely,
unlikely, equally likely, sometimes, never? Or have students had opportunities to think about quantifying probability?
• Do your students commonly use ratios, percents, or “out of” to express the value of a probability?
• Have students’ probability experiences been limited to thinking about a single event: spinning 1 spinner or rolling one dice? Or have students worked with compound events?
• Have they used strategies like tree diagrams, organized lists, charts to help them find all possible outcomes or sample space?
Look at student work on the probability for the first set of spinners. How many of your students could: 4/16 or 1/4 Express
probability in words (likely, unlikely)
Give rules of the game (get an even number)
Used a denominator of 16
Used a denominator of 8
Other
What does this show about their understanding of probability and compound events?
(c) Noyce Foundation 2012

Grade Six – 2005 pg. 50
Look at the design of their spinners. How many of the students could: Design spinner with higher prob.
Used their own numbers
Repeated some numbers
Rearranged the numbers within the same spinner
Did not improve their spinner
What constraints were students missing? What probability concepts were students missing? In part 3, did your students:
• Make or attempt to make an organized list of possible outcomes? Did they make an addition chart for the new spinners?
• Did they think about number properties (an even plus and odd equals an odd)? • Did they think just about combinations that make even numbers? • Did they ignore the combination of the two spinners and just look at values on the
spinners (3/8 or 2 out of 4) • Did they appear to guess?
What experiences will help students start to develop an understanding of sample space for compound events? Implications for Instruction: Students at this grade level should transition from thinking about probability in terms of likelihood to being able to quantify probabilities as a value between 0 and 1. Students might start by trying to give a variety of probability words, such as always, never, likely, equally likely, seldom and trying to assign possible values to the numbers. Students should then start to think about more exact values such as getting heads on a coin or a certain color on a single spinner. Students then need to move to compound events, like tossing two coins or spinning a spinner and flipping a coin. These combined events then need to be first expressed as possible outcomes. Students might make factor trees, organized lists, charts or tables, or use a combinatorics formula to find all the possible outcomes. Students should have discussions to find the relationships between all these representations. Having students design their own games or rules, gets them involved in understanding the context as well as an opportunity to organize the possible outcomes and find the probabilities. Giving students a game and asking them to change the rules to improve the chances of winning, also makes them think about how the events effect each other and how they change the sample space. Students should also have opportunities to investigate the difference between theoretical and experimental probabilities. Playing a game a number of times gives them a small flavor of this idea, but using a computer simulation can give them the bigger idea of how the two values become closer over a large number of repetitions. Students often have misconceptions about how spinners are made. For example they might think that a spinner
(c) Noyce Foundation 2012

Grade 6 – 2005 pg. 51
with two separate 1/8 red sections will have a better chance of winning than a single 1/4 red section because it is more spread out. Computer simulations give them the opportunity to make and test these conjectures and confront these misconceptions head on. Teacher Notes:
(c) Noyce Foundation 2012