Embed Size (px)
Citation preview

Graduation thesis
ENERGY EFFIENCY OF THE MARINE
MAIN ENGINE AUXILIARY SYSTEMS
Jere Kettunen
Mechanical Engineering
2009

TURUN TIIVISTELMÄ
AMMATTIKORKEAKOULU
Koulutusohjelma: Konetekniikka
Tekijä: Jere Kettunen
Aihe: Laivan päämoottorin apulaitesysteemien energiatehokkuus
Suuntautumisvaihtoehto:
Ympäristö ja energiatekniikka
Valvoja(t)Kari Nieminen
Seppo Rautava
Opinnäytetyön valmistumisajankohta
Huhtikuu 2009
Sivumäärä 46
Tämän työ tarkoituksena oli selvittää, kuinka paljon energiaa tarvitaan nesteiden
pumppaamiseen laivan pääkoneen apulaitejärjestelmissä ja valita energiaa kuluttavin
järjestelmä lähempään tarkasteluun. Kun yksi järjestelmä on valittu, on tarkoitus
selvittää voidaanko kyseisen järjestelmän energiatehokkuutta parantaa säilyttäen
kuitenkin Wärtsilän tekniset suositukset. Päämoottoriksi valittiin 9L46 moottori ja
kaikki valmistajien laitteistotiedot, kuten esimerkiksi pumput, saatiin Wärtsilä Ship
power:in TERPS tietokannasta. Saatujen tulosten pohjalta tehtiin taloudellisuus
vertailu normaalin ja muutetun järjestelmän välillä.
Hakusanat: Energiatehokkuus, apulaitesysteemi, pumppu
Säilytyspaikka: Turun ammattikorkeakoulun kirjasto

TURKU UNIVERSITY OF APPLIED SCIENCES ABSTRACT
Degree programme: Mechanical Engineering
Author: Jere Kettunen
Title: Energy Efficiency of the Marine Main Engine Auxiliary Systems
Specialization line:
Energy Technology
Instructor(s) Kari Nieminen
Seppo Rautava
Date:
April 2009
Total number of pages 46
The purpose of this thesis was to study, how much energy is used in pumping fluids
in each auxiliary system of marine main engine and to choose the system that is the
most energy consuming. After choosing one system for closer observation the target
was to study how pumping energy efficiency of that specific auxiliary system can be
improved by changing the design, but still keeping the original technical limits for
the system valid. 9L46 marine main engine was chosen as a reference engine for all
calculations and all the component data for each part and unit of different
manufacturer was obtained from the TERPS database in Wärtsilä Ship power’s
intranet page. Based on the calculated results a ballpark economical estimate of
investment difference between a normal system and an energy efficient system was
made.
Keywords: energy, efficiency, auxiliary system, pump
Deposit at: Library of Turku university of Applied Sciences

PREFACE
Today it is important to pay attention to energy consumption. Using more energy
efficient ways can save companies assets and the environment. Considering energy
efficiency in the design phase is the best way to make savings. Although some
investments can be a bit high at the beginning, they will pay it self back in the long
run. This concerns also ship design from propeller to the exhaust pipe. Paying
attention to the engines, auxiliary systems, piping etcetera will make difference in
energy consumption. This is even more important in the current economical situation
of the world. Making little savings here and there can save a reasonable amount of
assets.
“Now when the world faces this long and deep depression attention must be focused
on expenses. Research and development grants have usually been cut down in this
situation, but not anymore. This year Wärtsilä invests more to research and
development.” (Ole Johansson, Wattsup, 1/2009)
This work commissioned by for Wärtsilä Finland Technical Service department as a
part of engineering education at Turku University of Applied Sciences. The
supervisors of this work were Seppo Rautava from Wärtsilä Technical Service and
Kari Nieminen from Turku University of Applied Sciences.
The author thanks both supervisors for making this work possible and for very good
co-operation. Big thanks also to Mr Rautava for arranging the opportunity to visit
onboard Estraden to get a concrete view of the engine room and its components.

TABLE OF CONTENTS
1 OVERVIEW OF THE AUXILIARY SYSTEMS 7
1.2. Fuel system 7
1.3 Cooling system 10
1.4 Lubricating oil system 12
2 ENERGY CONSUMPTION OF THE PUMPS 14
2.1 Fuel system 14
2.2 Lubricating oil system 16
2.3 Cooling system 17
2.4 Choosing one system 19
3 CLOSER OBSERVATION 20
3.1 Pressure losses in HT system 20
3.2 Pressure losses in LT system 21
3.3 Pump dimensioning 23
3.4 Reduced LT flow 23
3.4.1 Circulating pump 24
3.4.2 Coolers 24
3.4.2.1 Charge air cooler 25
3.4.2.2 Lubricating oil cooler 26
3.4.2.3 Central cooler 28
3.4.5 Cooling area comparison 30
3.5 Economical evaluation 31
3.5.1 Circulating pumps on normal flow 31
3.5.2 Circulating pumps on reduced flow 32

3.5.3 Coolers 34
4 CONCLUSION 35
5 SOURCES 36
APPENDICES
APPENDIX 1 Bunker prices 2005-2009
APPENDIX 2 Heavy fuel oil densities in different temperatures
APPENDIX 3 Pump curves of the HT and LT pumps
APPENDIX 4 Water densities in different temperatures
APPENDIX 5 Pump delivery head and power consumption chart
APPENDIX 6 Engine driven lubricating oil pump chart
APPENDIX 7 Picture from Estraden (Engine driven cooling pumps)
APPENDIX 8 Picture from Estraden (Central cooler)
APPENDIX 9 Picture from Estraden (Booster unit)
APPENDIX 10 Picture from Estraden (Lubricating oil cooler)
7
1 OVERVIEW OF THE AUXILIARY SYSTEMS
1.1 Fuel oil system
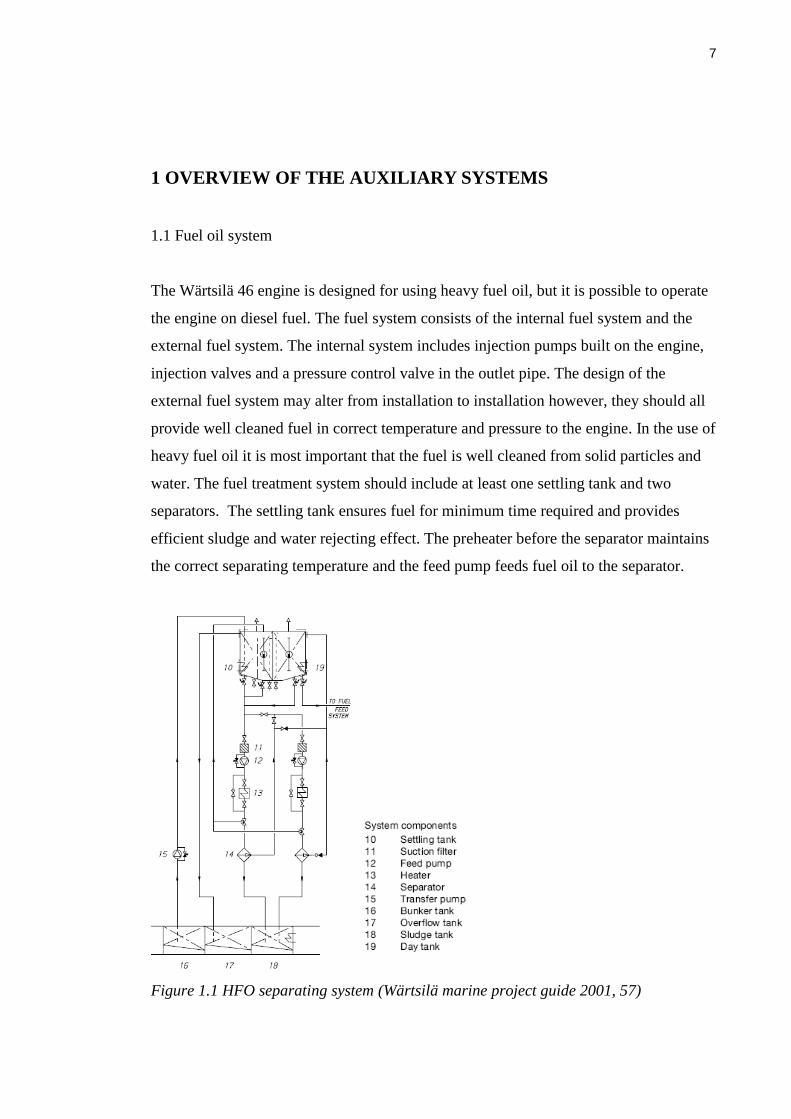
The Wärtsilä 46 engine is designed for using heavy fuel oil, but it is possible to operate
the engine on diesel fuel. The fuel system consists of the internal fuel system and the
external fuel system. The internal system includes injection pumps built on the engine,
injection valves and a pressure control valve in the outlet pipe. The design of the
external fuel system may alter from installation to installation however, they should all
provide well cleaned fuel in correct temperature and pressure to the engine. In the use of
heavy fuel oil it is most important that the fuel is well cleaned from solid particles and
water. The fuel treatment system should include at least one settling tank and two
separators. The settling tank ensures fuel for minimum time required and provides
efficient sludge and water rejecting effect. The preheater before the separator maintains
the correct separating temperature and the feed pump feeds fuel oil to the separator.
Figure 1.1 HFO separating system (Wärtsilä marine project guide 2001, 57)
8
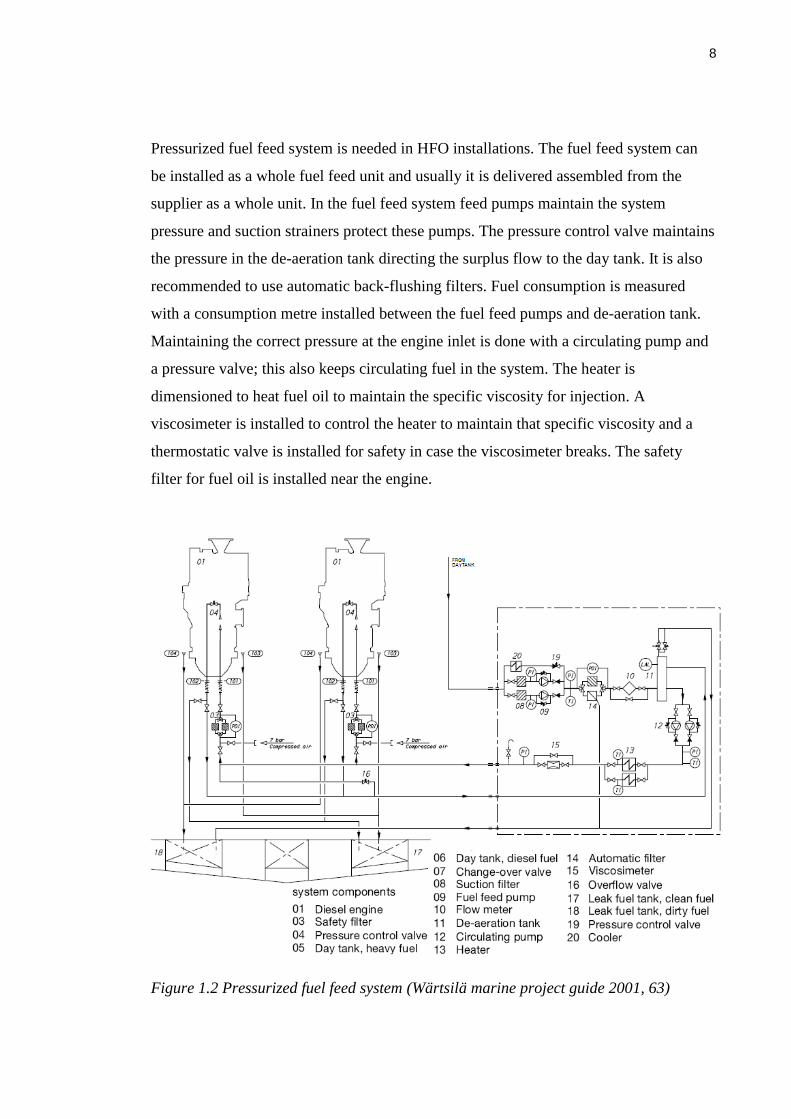
Pressurized fuel feed system is needed in HFO installations. The fuel feed system can
be installed as a whole fuel feed unit and usually it is delivered assembled from the
supplier as a whole unit. In the fuel feed system feed pumps maintain the system
pressure and suction strainers protect these pumps. The pressure control valve maintains
the pressure in the de-aeration tank directing the surplus flow to the day tank. It is also
recommended to use automatic back-flushing filters. Fuel consumption is measured
with a consumption metre installed between the fuel feed pumps and de-aeration tank.
Maintaining the correct pressure at the engine inlet is done with a circulating pump and
a pressure valve; this also keeps circulating fuel in the system. The heater is
dimensioned to heat fuel oil to maintain the specific viscosity for injection. A
viscosimeter is installed to control the heater to maintain that specific viscosity and a
thermostatic valve is installed for safety in case the viscosimeter breaks. The safety
filter for fuel oil is installed near the engine.
Figure 1.2 Pressurized fuel feed system (Wärtsilä marine project guide 2001, 63)

9
1.2 Cooling water system
Fresh water is used for cooling the jacket, charge air and lubricating oil. Fresh water can
be generated by a reverse osmosis plant or evaporator onboard the vessel. The pH-
value and hardness of the water should be within normal values and the chlorine and
sulphate content should be as low as possible to avoid corrosion.
The cooling water system, like fuel system, is divided into the internal and external
system. The internal system keeps the temperature low enough to limit thermal load and
prevents hot corrosion in the combustion chamber at high loads. At low loads it keeps
the temperature high enough to ensure complete combustion. The cooling water
systems, both internal and external, are divided into low-temperature (LT) and high-
temperature (HT) circuits. The internal LT-circuit includes LT-charger air cooler and
lubricating oil cooler and the HT-circuit includes the cylinders and the HT-charge air
cooler.
The external system is divided into the HT-circuit and LT-circuit and they can be
separated from each other, but in the standard Wärtsilä marine cooling system the HT-
circuit mixes to the LT-circuit before the central cooler. The fresh water central cooler
in marine applications are usually plate type coolers and it can be common for several
engines. The lubricating oil cooler is also usually a plate type cooler and it is cooled by
LT water. Sea water pumps are electrically driven pumps and circulating pumps are can
be electrically or engine driven. The HT-circuit has individual pumps on each circuit,
but the LT-circuit can have individual pumps for each engine, or two or three engines in
the same circuit can be supplied by the same separately installed pump. In both LT-
circuit and HT-circuit there is a thermostatic valve installed. In the LT-circuit it controls
the charge air temperature and in the HT-circuit the outlet temperature from the engine.
The HT-circuit is heated with a preheater and before the preheater, a preheater pump is
installed. The expansion tank compensates volume changes in the cooling water system.
It provides static pressure for the system and ensures constant positive suction head at
the circulating pump.

10
Figure 1.3 External cooling water system (Wärtsilä marine project guide 2001, 87)

11
1.3 Lubricating oil system
As the previous systems the lubricating oil system is divided into the external and
internal system. Side stream centrifugal filter and starting-up/running-in filter or filters
are installed on the engine. If there are engine driven pumps they are located at the free
end of the engine.
All the other equipment of the lubricating oil system belongs to the external system.
When running with heavy fuel oil engines should have continuous centrifuging of the
lubricating oil. The engine dry sump has four drain outlets and totally at least three
should be used in 9L46 engine. The oil sump drains to system oil tank. The system oil
tank is placed as close to the engine as possible and so that the oil is not cooled too
much to maintain the proper oil temperature. The connection between the sump and the
system oil tanks is flexible due to thermal expansion. Before the lubricating pumps a
suction strainer is installed to protect the pumps. Also a safety valve is attached to the
pump, which protects it from overpressure. A thermostatic valve ensures the desired oil
temperature at the engine inlet and the pressure control valve ensures the correct
pressure. Also an automatic filter and a safety filter need to installed. The lubricating oil
separator is dimensioned for continuous centrifuging and each oil system has its own
separator. The separator pump is either electrically driven or directly driven, and before
the separator there is a preheater to heat the oil to required separating temperature. The
heater can be steam or electric model. The lubricating oil temperature increases during
operation so it must be cooled with the lubricating oil cooler to the required
temperature.

12
Figure 1.4 Lubricating oil system with engine driven pumps for L and V type engine
(Wärtsilä marine project guide 2001, 74)

13
2 ENERGY CONSUMPTION OF THE PUMPS
2.1 Fuel system
In HFO separating system pumping is done with a transfer pump and a separator feed
pump. The transfer pump is used for pumping fuel to the day tank and the separator feed
pump feeds fuel to the separator with required flow. In the fuel feed system pumping is
done with a feeder pump and a circulating pump. These pumps are used for maintaining
the correct pressure in the system and they keep fuel circulating in the system.
To know how much energy is needed for pumping fuel oil, the required flow rate must
be known for each pump. The required flow rate can be found in Wärtsilä’s guide books
or it can be calculated. When the flow rate is known, a right-sized electric motor is
needed. Various pump manufacturers have determined a right-sized electric motor for
each pump size and these figures can be found in manufacturers’ catalogue. In this case
all the pumps and the electrical motor were chosen from TERPS database.
There are not exactly right-sized pumps for each flow rate so in this case the next
standard size up is selected. (Wärtsilä marine project guide 2001, 56-66)
The transfer pump is dimensioned with flow 30% over the overall fuel oil consumption.
(Wärtsilä diesel power plants guide, 21)
Fuel oil consumption
h
kgkW
kWh
kgWFF
iS
iNiE 3.16449450174.01000
,
,, (2.1)
Fuel consumption =kWh
gF iN 174, (Wärtsilä marine project guide 2001, 20)
Engine output power = kWW iS 9450, (Wärtsilä marine project guide 2001, 20)

14
Flow rate
h
mF iE3
,6592.1
Fuel oil consumption =h
kgF iE 3.1644,
Fuel density =3
991m
kg (Wärtsilä marine project guide 2001, 2)
The separator pump is dimensioned according to the flow of the separator with formula
2.3 (Wärtsilä marine project guide 2001, 56) Fuel oil density for exact temperature is
calculated according to Wärtsilä’s recommendations (Wärtsilä diesel power plant guide,
3) For every temperature degree rise density drops approximately 0.64kg/m³ (formula
(2.2)
3333388.937)64.0)1598((991)64.0)15((991
m
kg
m
kgCC
m
kg
m
kgCt
m
kg (2.2)
Desired temperature = Ct 98
h
m
hm
kg
hkWh
kgkW
t
hbPQ
3
3
07.2
2388.937
241978.0945024
(2.3)
Max continuous rating = kWP 9450
Fuel consumption + 15 percent margin =kWh
gb 8.197
Fuel oil density =3
88.937m
kgat 98ºC
Daily separating time = ht 23
The feeder pump is dimensioned to cover fuel oil consumption and the flow of the
automatic filter. The feeder pump is located in the feeder and booster unit which comes
as a whole unit. The circulating pump is dimensioned to cover fuel oil consumption

15
with a circulating factor, which is 4 (Wärtsilä marine project guide 2001, 20). In other
words four times the fuel oil consumption means that the required flow is 6.6 m³/h.
The circulating pump capacity is chosen according to Wärtsilä’s recommendations
(Wärtsilä marine project guide 2001, 20)
Table 2.1 Required flows
The actual power consumption of the pumps is calculated using known pressures of the
pumps and required liquid flow for each pump (Table 2.2). All the calculated pumps are
screw pumps and for all pumps the average efficiency 60% is used. As the pump’s
efficiency is average it is important to use the same value in every calculation so that the
results are comparable.
The power consumption ( reqP ) for each pump in all three systems is calculated with
formula 2.4 (Wirzenius 1978, 48) For example, for the separator pump
kW
mh
m
s
m
m
kg
hQgPreq 469.0
6.036001000
5007.281.988.937
36001000
3
23
(2.4)
Density =3
88.937m
kg at 98ºC
Acceleration of free fall =2
81.9s
mg
Flow =h
mQ
3
07.2
Lifting height of the pump = mh 50
Efficiency = 6.0

16
Table 2.2 Power consumption
2.2 Lubricating oil system
Pumping in the lubricating oil system is done with a lubricating oil pump, a
prelubricating oil pump and a separator pump. Main lubricating oil pump is a directly
driven pump or electrically driven screw type pump and it is dimensioned according to
Wärtsilä’s recommendations (Wärtsilä marine project guide 2001, 20). If the main
lubricating oil pump is engine driven, the capacity differs a bit from the electrically
driven pump, because also at low speeds engine driven pumps have to be able to cover
the lubricating oil need. The prelubricating oil pump is also an electrically driven screw
pump and it is dimensioned according to Wärtsilä’s recommendations (Wärtsilä marine
project guide 2001, 20). It is used for filling the lubricating system with lubricating oil
and getting some pressure before starting. This pump is not constantly running so the
pumping energy consumption must be calculated without it. The separator pump can be
directly driven by the separator or separately driven by an electric motor. The flow of
the separator is calculated with formula 2.5 (Wärtsilä marine project guide 2001, 70)
The separator pump is dimensioned according to the flow of the separator.
)5.2(7.27.267023
594503.1
23
)5.1...2.1( 3
h
m
h
lkWmPV
M-value (depends which fuel is used) HFOform 5 (Wärtsilä recommendations)
Engine output power = kWP 9450
Separation time = 23h/day

17
There is an option to choose the main lubricating oil pump to be engine driven so
calculations have to be made for both cases (Table 2.3). The required flow rates are
Wärtsilä’s recommended values. The prelubricating oil pump is not taken into account,
because it is not running at the same time with the other pumps.
Table 2.3 Electrically and engine driven LO pumps
The actual power consumptions of the pumps were calculated with formula 2.4 using
known pressures of the pumps and required liquid flow for each pump (Table 2.4). All
the calculated pumps are screw pumps and for all pumps the average efficiency 60% is
used.
Table 2.4 Power consumption of LO pumps
2.3 Cooling water system
Circulating pumps in a high temperature system and in a low temperature system are
centrifugal type pumps and they can be driven by an electric motor or the engine. For
both systems there is one main pump and one stand-by pump. The delivery heads for
these pumps are determined considering flow resistances in the engine, pipelines and
valves. Capacities for these pumps for 9L46 engine are determined by Wärtsilä’s
recommendations. In both systems the flow rate is hm3200 (Wärtsilä marine project
guide 2001, 23).

18
The preheater pump is dimensioned according to Wärtsilä’s recommendations for the
required flow (Wärtsilä marine project guide 2001, 83). It depends on the quantity of
the cylinders.
9
4.14.6.133
cyl
h
mcyl
h
m
The transfer pump is used for emptying and filling the drain tank. Engines and coolers
can be drained to the drain tank if they need maintenance.
The required sea water pump flow is normally 20-50 percent higher than fresh water
flow. (Wärtsilä marine project guide 2001, 20)
The circulating pumps in the HT and LT systems are centrifugal pumps. Like in the
lubricating oil system there is an optional engine driven circulating pump in both the LT
and HT system.
Table 2.5 HT and LT pumps
If the circulating pumps are engine driven the pressure is 0.3 bars higher than on the
electrically driven pumps, because for the manufacturing reasons Wärtsilä has chosen
impeller standards between 10 millimetres. In all centrifugal pumps average 60 percent
efficiency is used. The actual power consumptions are calculated using formula 2.4.

19
Table 2.6 Power consumption of HT and LT pumps
2.4 Choosing one system
Based on the calculations above the most energy consuming liquid pumping system is
the cooling water system. Liquid flows are a bit bigger in comparison in the cooling
water system than on the other two systems. The Lubricating oil system is almost as
consuming as the cooling water system. The chart below shows all three systems and
the differences if the pump is either electrically driven or engine driven.
Power consumption (kW)
0
10
20
30
40
50
60
70
80
Fuel oil system LO system
(electrically driven
pump)
LO system (engine
driven pump)
Cooling water
system (electrically
driven pump)
Cooling water
system (engine
driven pump)
Chart 2.1 Power consumptions of different auxiliary systems

20
3 CLOSER OBSERVATION OF THE CHOSEN SYSTEM
3.1 HT system pressure losses
In the cooling water system the pumps are dimensioned to cover total pressure losses of
the system which consists of pressure losses of the components and pipelines. Also the
static pressure produced by the expansion tank is taken into account. If the pressures
created by the pumps are larger than pressure losses, orifices must be used to reduce the
pressure. This causes energy losses in the system, and an ideal system would be a
system without the orifices.
Table 3.1 Pressure losses in the HT system (Wärtsilä marine project guide 2001, 24)
Pressure before engine has to be between 3.2 bars and 4.8 bars (Wärtsilä marine project
guide 2001, 24) Static pressure variation depends on the height the expansion tank is
installed. It is between 0.7 bars and 1.5 bars (Wärtsilä marine project guide 2001, 83). It
also determined that the delivery head for both the HT and LT system circulating pump
is 2.5 bars (Wärtsilä marine project guide 2001, 83). Pressure losses for the pipelines is
chosen to be 0.5 bars which is a rough average value, but due to the fact that pressure
losses vary a lot based on the installation design, this average value was chosen. If
pressure losses from system components and pipelines are 1.6 bars in total, which is 0.9
bars less than the delivery head of the pump, this has to be reduced with orifices so that
the system is in balance. In this case total energy losses are 39 percent caused by the
orifices.

21
Power consumption and power losses of the separately installed circulating pump
in the HT system (kW)
0,00
5,00
10,00
15,00
20,00
25,00
Total power consumption Losses
Chart 3.1 Power consumption and losses of the separately installed pump in the HT
system
Power consumption and power losses of the engine driven circulating pump in the HT
system (kW)
0,00
5,00
10,00
15,00
20,00
25,00
30,00
Total power consumption Losses
Chart 3.2 Power consumption and losses of engine driven pump in the HT system

22
3.2 Pressure losses in LT system
The LT system is much more balanced with given starting values as shown in the charts
3.3 and 3.4 for separately installed pump and for engine driven pump. Only 0.2 bars is
needed to cover with orifices (Table 3.3 and 3.4) so there is only 8 percent losses.
Table 3.2 Pressure losses in the LT system (Wärtsilä marine project guide 2001, 24)
Power consumption and power losses of the separately installed circulating pump in the LT
system (kW)
0,00
5,00
10,00
15,00
20,00
25,00
Total power consumption (kW) Losses (kW)
Chart 3.3 Power consumption and losses of separately installed pump in the LT system

23
Power consumption and power losses of the engine driven circulating pump in the LT
system (kW)
0,00
5,00
10,00
15,00
20,00
25,00
30,00
Total power consumption (kW) Losses (kW)
Chart 3.4 Power consumption and losses of engine driven pump in the LT system
3.3 Pump dimensioning
The backpressure of the HT system being smaller than the pressure caused by the HT
circulating pump, a smaller delivery head for the pump is needed. In the figure 3.1 it is
shown that the flow rate remains the same but the delivery head is decreased. This can
be done by choosing a whole new pump with a smaller delivery head or adjusting the
impeller on the existing pump. When the delivery head of the pump is reduced the
engine inlet pressure is not according to Wärtsilä’s standards anymore. This must be
compensated by lifting the expansion tank to keep the right inlet pressure at the engine.
Figure 3.1 Pump curve of the HT centrifugal pump

24
3.4 Reduced LT flow
One way to cut down the power consumption is to alter the LT flow by reducing it. The
chosen reduction was half from the original flow. The LT flow is cut down to half by
simply choosing a smaller pump. Reducing the flow will affect the size of the coolers in
the LT circuit. Cooling water temperatures on the inlet and outlet of the coolers will be
altered.
3.4.1 LT circulating pump
The power consumption is calculated in table 3.2 with formula 2.4. Only the flow and
pressure are altered. When the flow is cut down to half the back pressure is cut down to
¼ as shown below.
2038.7
81.92
200
22
3
2
s
mh
m
g
vH flownormal
509.6
81.92
100
22
3
2
s
mh
m
g
vH flowreduced
v = Flow rate (h
m3
)
g = Acceleration of free fall (2s
m)
The back pressure on reduced flow is four times smaller than on the normal flow.
4509.6
2038.7
flowreduced
flownormal
H
H
25
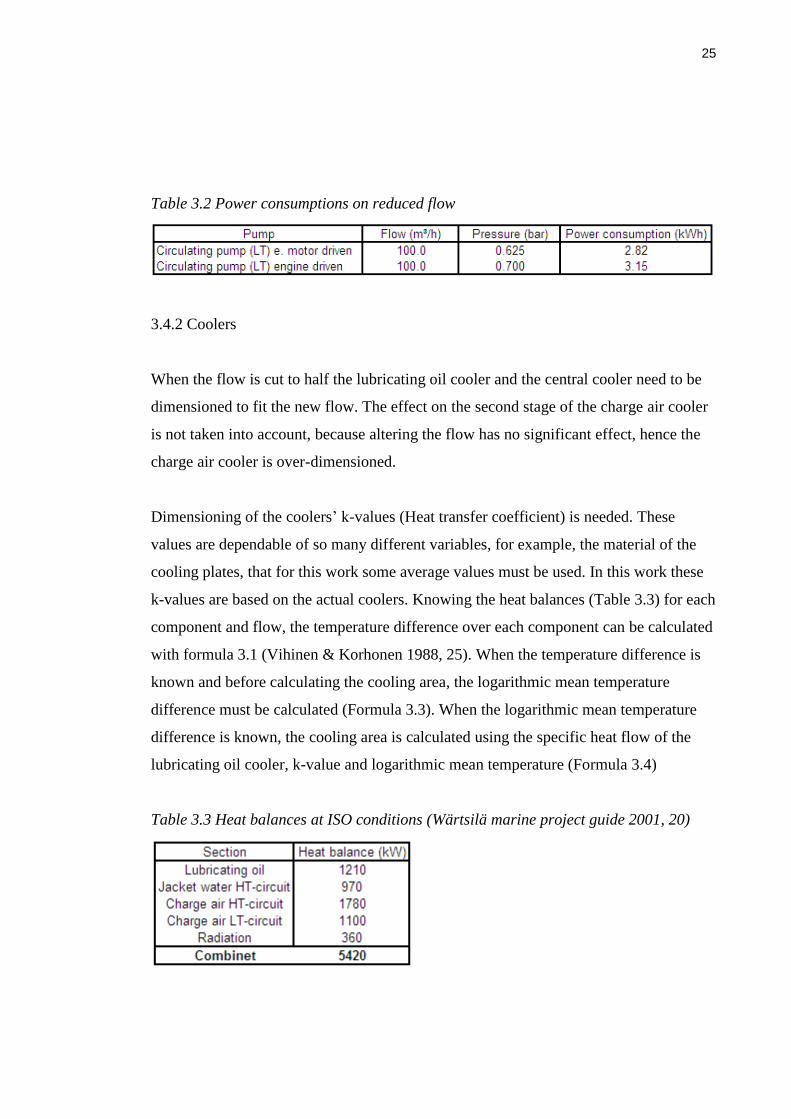
Table 3.2 Power consumptions on reduced flow
3.4.2 Coolers
When the flow is cut to half the lubricating oil cooler and the central cooler need to be
dimensioned to fit the new flow. The effect on the second stage of the charge air cooler
is not taken into account, because altering the flow has no significant effect, hence the
charge air cooler is over-dimensioned.
Dimensioning of the coolers’ k-values (Heat transfer coefficient) is needed. These
values are dependable of so many different variables, for example, the material of the
cooling plates, that for this work some average values must be used. In this work these
k-values are based on the actual coolers. Knowing the heat balances (Table 3.3) for each
component and flow, the temperature difference over each component can be calculated
with formula 3.1 (Vihinen & Korhonen 1988, 25). When the temperature difference is
known and before calculating the cooling area, the logarithmic mean temperature
difference must be calculated (Formula 3.3). When the logarithmic mean temperature
difference is known, the cooling area is calculated using the specific heat flow of the
lubricating oil cooler, k-value and logarithmic mean temperature (Formula 3.4)
Table 3.3 Heat balances at ISO conditions (Wärtsilä marine project guide 2001, 20)

26
3.4.2.1 Charge air cooler
Cooling water enters the charge air cooler at 38 ºC temperature (Wärtsilä marine project
guide 2001, 24) and the heat balance of the charge air cooler is 1100 kW (see table 3.3).
Temperatures over charge air cooler are
)1.3(55.9
990163.1100
100011101000
3
3C
m
kg
Ckg
kJ
h
m
kW
Cq
QT
p
flowreduced
)1.3(77.4
990163.1200
100011101000
3
3C
m
kg
Ckg
kJ
h
m
kW
Cq
QT
p
flownormal
3
3
)(
)(
m
kgdensity
Kkg
kJcapacityheatSpecificC
h
mrateFlowq
kWflowHeatQ
p
Table 3.4 Temperatures over charge air cooler second stage
3.4.2.2 Lubricating oil cooler
The temperature differences over lubricating oil cooler are calculated the same as the
temperature differences over charge air cooler with formula 3.1.
The cooling water outlet temperature can be calculated using the heat flow (table 3.3).
The temperature difference is calculated with formula 3.1 and added to the water inlet
temperature (table 3.5)

27
The temperature differences over lubricating oil cooler
)1.3(5
990163.1200
100012101000
)1.3(11
990163.1100
100012101000
3
3
3
3
C
m
kg
Kkg
kJ
h
m
kW
Cq
QT
C
m
kg
Kkg
kJ
h
m
kW
Cq
QT
p
flownormal
p
flowreduced
Table 3.5 Temperature differences over lubricating oil cooler
Logarithmic mean temperature
The lubricating oil temperature at the lubricating oil cooler inlet is 75 ºC as it is almost
the same as in the system oil tank and the outlet temperature is 63 ºC (Wärtsilä marine
project guide 2001, 69).
Figure 3.2 Temperature differences on the lubricating oil cooler

28
intempwaterFreshouttempoilgLubricatin
outtempwaterFreshintempoilgLubricatin
C
C
C
CC
C
C
C
CC
flownormal
flowreduced
..
..
)3.3(33.23
20
27ln
2027
ln
)(
)3.3(49.15
15
16ln
1516
ln
)(
2
1
2
1
21ln
2
1
21ln
Cooling area
The cooling area is calculated using the specific heat flow of the lubricating oil cooler,
k-value and logarithmic mean temperature (formula 3.4)
)4.3(64.9749.158.0
1210 2
ln
mC
kW
k
QA flowreduced
etemperaturmeanarithmic
valuekk
kWflowHeatQ
mC
kW
k
QA flownormal
log
)4.3(83.6333.238.0
1210
ln
2
ln
3.4.2.3 Central cooler
Before the central cooler the HT water mixes to the LT water. The temperature
difference, after the HT water is mixed to the LT water, can also be calculated with
formula (3.1). The heat flow is jacket water HT circuit and charge air HT circuit
combined (Table 3.3)

29
3
3
3
3
3
3
)(
)(
)1.3(94.11
990163.1200
100027501000
)1.3(88.23
990163.1100
100027501000
m
kgdensity
Kkg
kJcapacityheatSpecificC
h
mrateFlowq
kWflowHeatQ
C
m
kg
Kkg
kJ
h
m
kW
Cq
QT
C
m
kg
Kkg
kJ
h
m
kW
Cq
QT
p
p
flownormal
p
flowreduced
According to Wärtsilä’s recommendations the inlet temperature of the LT water at the
engine is 38 ºC (Table 3.6).
Table 3.6 Temperature differences over central cooler
Logarithmic mean temperature
The sea water inlet temperature to the central cooler is 32 ºC and the seawater
temperature after the central cooler is 45 degrees due to Wärtsilä’s recommendations to
prevent corrosion.

30
Figure 3.3 Temperature differences on the central cooler
intempwaterSeaouttempwaterFresh
outtempwaterSeaintempwaterFresh
C
C
C
CC
C
C
C
CC
flownormal
flowreduced
..
..
90.10
6
15ln
615
ln
)(
33.17
6
38ln
638
ln
)(
2
1
2
1
21
ln
2
1
21
ln
Cooling area
etemperaturmeanarithmic
valuekk
kWflowHeatQ
mC
kW
k
QA
mC
kW
k
QA
flownormal
flowreduced
log
44.9990.105
5420
55.6233.175
5420
ln
2
ln
2
ln

31
3.4.4 Cooling area comparison
Comparing reduced LT flow to the normal fresh water flow the temperature difference
over lubricating cooler is higher. On the normal flow the cooling area needed is smaller
than on the reduced flow. The central cooler cooling area is smaller on the reduced flow
than on the normal flow.
Table 3.6 Cooling area
Lubricating oil cooler cooling area comparing (m2)
0
20
40
60
80
100
120
Cooling area on reduced flow Cooling area on normal flow
Chart 3.6 Cooling areas of the lubricating oil coolers
Central cooler cooling area comparing (m2)
0
20
40
60
80
100
120
Cooling area on reduced flow Cooling area on normal flow
Chart 3.7 Cooling areas central coolers

32
3.5 Economical evaluation
3.5.1 Circulating pumps on normal flow
Energy saving for the right dimensioned pump or new impeller can be notable. Power
losses are calculated in chart 3.1. below 39 percent of the produced power is wasted in
the HT system.
The calculation is based for one year usage. The average running hours for marine main
engine and therefore for the circulating pump in a year is 6000. When the power losses
are known, energy losses can be calculated (Table 3.8)
Table 3.7 Power losses of the HT and LT pumps
Table 3.8 Energy losses of the HT and LT pumps
When the energy losses are known the amount of wasted heavy fuel oil can be
calculated. (Table 3.9) For example, with an electrical motor driven HT circulating
pump.
kgkWhkWh
kgQF wastediN 917140.52712174.0, (3.2)
Fuel consumption =kWh
gF iN 174, (Wärtsilä marine project guide 2001, 20)
Energy wasted = wastedQ = 52712.40 kWh/a

33
Table 3.9 Wasted fuel
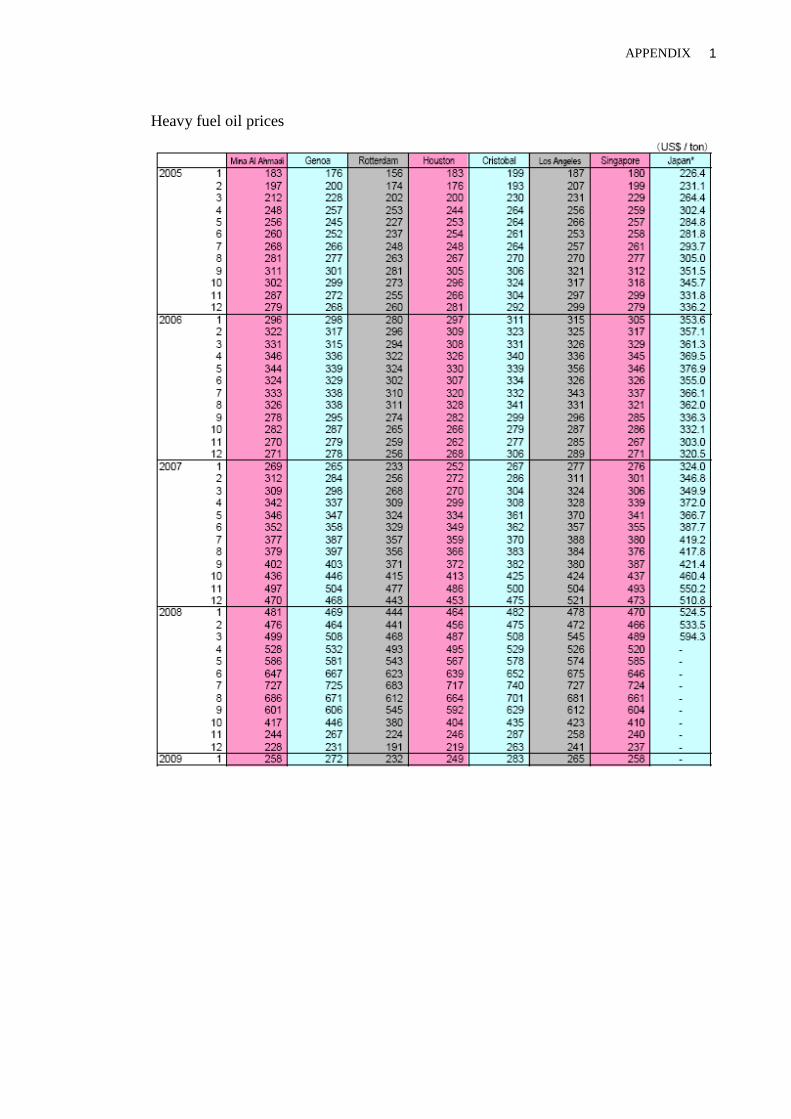
2005-2009 January bunker prices (US$/ton)
0
100
200
300
400
500
600
700
800
1 3 5 7 9 11 13 15 17 19 21 23 25 27 29 31 33 35 37 39 41 43 45 47 49
Chart 3.8 Bunker prices
As seen in chart 3.8 bunker prices have changed a lot in few years so the average sum
must be calculated to get a rough idea how much money can be saved. For the
calculations below an average 333 US dollars per fuel ton is used.
Table 3.10 Losses
3.5.2 LT circulating pumps on reduced flow
On reduced and normal flow energy consumption was calculated. When the flow rate is
dropped down to half, the energy consumption is dropped down (table 3.11). Both flows
were compared (Chart 3.9) and energy consumption for both flows was calculated with

34
the same 6000 running hours. The evaluation for possible savings was made when the
energy consumption difference between both flows was calculated (Table 3.13). Fuel
savings was calculated with formula 3.2 and savings was calculated with the same
bunker average price 333 US dollars/ton mentioned in the previous paragraph.
Table 3.11 Power consumption of LT circulating pumps on reduced flow
Table 3.12 Energy consumption of LT circulating pumps on normal flow
Energy consumptions of LT circulating pumps (kWh/a)
0
20000
40000
60000
80000
100000
120000
140000
160000
E. motor driven pump Engine driven pump
Reduced flow
Normal flow
Chart 3.9 Comparing reduced and normal LT flow
Table 3.13 Results for reduced LT flow

35
3.5.3 Coolers
The cooling area of the reduced and normal flow is almost the same. As the plate
material used in the coolers is different in the central coolers than the lubricating oil
coolers, a direct comparison cannot be made. The plate material used in central coolers
is titan and in the lubricating oil coolers it is basically stainless steel. Titan is more
valuable than steel so with this LT flow reduction the cooling area of the central cooler
is reduced so some savings although can be made the cooling area of the lubricating oil
cooler increases.
According to Alfa laval, which is one of the Wärtsilä’s cooler suppliers, the price for the
titan plate (0.61m²/plate) is 101 Euros and the price for the steel plate (0.61m²/plate) is
24.7 Euros. The prices for the coolers are calculated in table 3.14 and as seen in chart
3.10 the combined prices of coolers on reduced LT flow are 4676 Euros lower.
Table 3.14 Cooler prices
Combined cooler prices (eur)
0,0
5000,0
10000,0
15000,0
20000,0
25000,0
Normal flow Reduced flow
Chart 3.10 Combined cooler prices

36
4 CONCLUSION
Changing the design of by altering or choosing a new smaller pump or cutting the LT
flow down to half can save a reasonable mount of assets. The results were a rough
evaluation and the purpose was to get some idea and direction where the savings can be
made and how they stand on each other. Exact results are difficult to get, because they
depend on so many variables, for example, the heavy fuel oil price, which has changed a
lot during the last years.
Small investments made by choosing a new pump or a smaller impeller for balancing
the pressures on the HT system can pay it self back in just about one year. This depends
on the price of the new pump. Of course, if this is done in the design phase, there will
be no need for any extra investments. Dropping the LT flow down to half makes
sufficient savings comparing to the normal LT flow. This also affects the coolers in the
LT circuit. The lubricating oil cooler temperature difference between the cooling water
and the lubricating oil is less on the reduced flow than on the normal flow. This causes
the need for more cooling area. Reducing the flow has the exact opposite effect on the
central cooler than to the lubricating oil cooler. As the plates of the central cooler are
titan and the plates on the lubricating oil cooler are stainless steel this change is
profitable.

37
5 SOURCES
1 Offer from Tage Löfman, Alfa laval
2 TERPS database
3 Vihinen, Simo; Korhonen, Unto 1988, Lämpöoppi
4 Wattsup 1/2009
5 Weekly update meetings with Seppo Rautava
6 Wirzenius, Allan 1978. Keskipakopumput
7 Wärtsilä diesel power plant guide
8 Wärtsilä marine project guide 2001
9 Wärtsilä training material by Per-Erik Andtsjö
APPENDIX
1
Heavy fuel oil prices

APPENDIX
2
Heavy fuel oil density diagram

APPENDIX
3
Pump curves

APPENDIX
4
Pump delivery head and power consumption chart

APPENDIX
5
Water densities at different temperatures
Den
sity
of p
ure
wat
er
950
960
970
980
990
1000
1010
04
914
1924
2934
3944
4954
5964
6974
7984
8994
99
°C
kg/m³

APPENDIX
6
Engine driven lubricating oil pump chart

APPENDIX
7
Picture from Estraden (Engine driven cooling pumps)

APPENDIX
8
Picture from Estraden (Central cooler)

APPENDIX
9
Picture from Estraden (Booster unit)

APPENDIX
10
Picture from Estraden (Lubricating oil cooler)

APPENDIX
11