Embed Size (px)
Citation preview
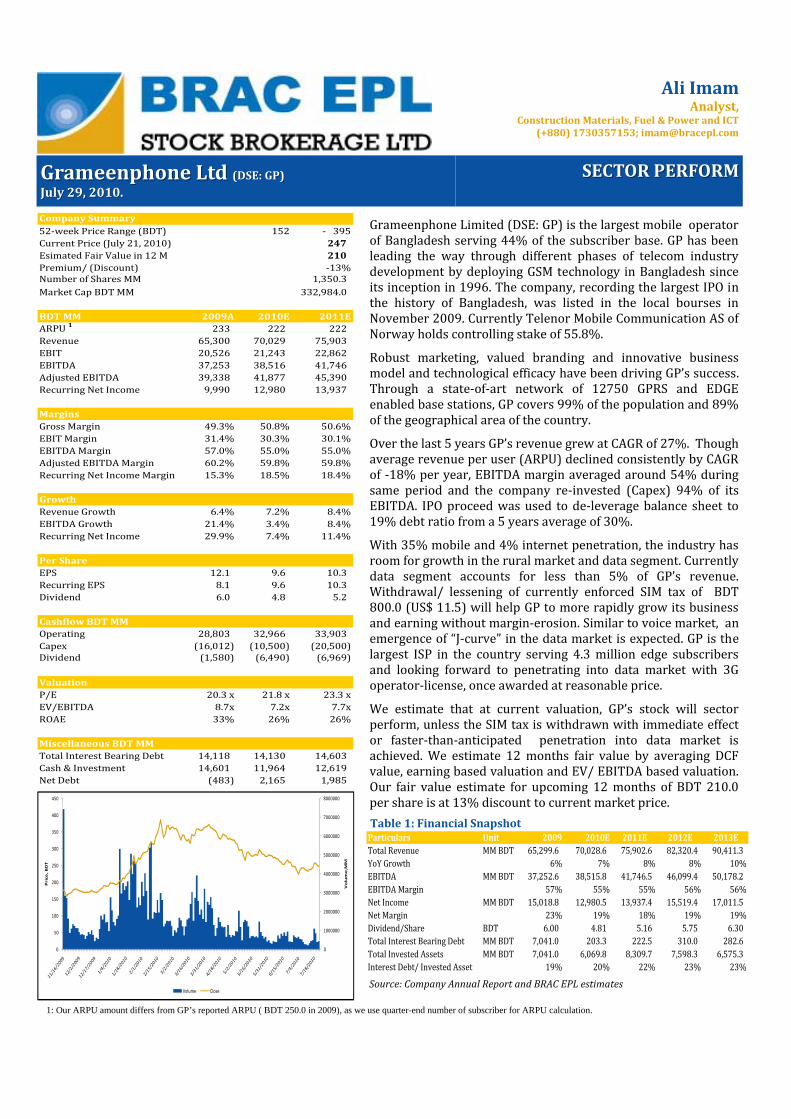
Ali Imam Analyst,
Construction Materials, Fuel & Power and ICT (+880) 1730357153; [email protected]
Grameenphone Ltd Grameenphone Ltd (DSE: GP)(DSE: GP)
July 29, 2010.July 29, 2010. SECTOR PERFORMSECTOR PERFORM
Grameenphone Limited (DSE: GP) is the largest mobile operator of Bangladesh serving 44% of the subscriber base. GP has been leading the way through different phases of telecom industry development by deploying GSM technology in Bangladesh since its inception in 1996. The company, recording the largest IPO in the history of Bangladesh, was listed in the local bourses in November 2009. Currently Telenor Mobile Communication AS of Norway holds controlling stake of 55.8%.
Robust marketing, valued branding and innovative business model and technological efficacy have been driving GP’s success. Through a state‐of‐art network of 12750 GPRS and EDGE enabled base stations, GP covers 99% of the population and 89% of the geographical area of the country.
Over the last 5 years GP’s revenue grew at CAGR of 27%. Though average revenue per user (ARPU) declined consistently by CAGR of ‐18% per year, EBITDA margin averaged around 54% during same period and the company re‐invested (Capex) 94% of its EBITDA. IPO proceed was used to de‐leverage balance sheet to 19% debt ratio from a 5 years average of 30%.
With 35% mobile and 4% internet penetration, the industry has room for growth in the rural market and data segment. Currently data segment accounts for less than 5% of GP’s revenue. Withdrawal/ lessening of currently enforced SIM tax of BDT 800.0 (US$ 11.5) will help GP to more rapidly grow its business and earning without margin‐erosion. Similar to voice market, an emergence of “J‐curve” in the data market is expected. GP is the largest ISP in the country serving 4.3 million edge subscribers and looking forward to penetrating into data market with 3G operator‐license, once awarded at reasonable price.
We estimate that at current valuation, GP’s stock will sector perform, unless the SIM tax is withdrawn with immediate effect or faster‐than‐anticipated penetration into data market is achieved. We estimate 12 months fair value by averaging DCF value, earning based valuation and EV/ EBITDA based valuation. Our fair value estimate for upcoming 12 months of BDT 210.0 per share is at 13% discount to current market price. Table 1: Financial Snapshot
Source: Company Annual Report and BRAC EPL estimates
Particulars Unit 2009 2010E 2011E 2012E 2013ETotal Revenue MM BDT 65,299.6 70,028.6 75,902.6 82,320.4 90,411.3 YoY Growth 6% 7% 8% 8% 10%EBITDA MM BDT 37,252.6 38,515.8 41,746.5 46,099.4 50,178.2 EBITDA Margin 57% 55% 55% 56% 56%Net Income MM BDT 15,018.8 12,980.5 13,937.4 15,519.4 17,011.5 Net Margin 23% 19% 18% 19% 19%Dividend/Share BDT 6.00 4.81 5.16 5.75 6.30 Total Interest Bearing Debt MM BDT 7,041.0 203.3 222.5 310.0 282.6 Total Invested Assets MM BDT 7,041.0 6,069.8 8,309.7 7,598.3 6,575.3 Interest Debt/ Invested Asset 19% 20% 22% 23% 23%
0
1000000
2000000
3000000
4000000
5000000
6000000
7000000
8000000
0
50
100
150
200
250
300
350
400
450
Volume,M
M
Price, BDT
Volume Close
1: Our ARPU amount differs from GP’s reported ARPU ( BDT 250.0 in 2009), as we use quarter-end number of subscriber for ARPU calculation.
52‐week Price Range (BDT) 152 ‐ 395Current Price (July 21, 2010) 247 Esimated Fair Value in 12 M 210 Premium/ (Discount) ‐13%Number of Shares MM 1,350.3 Market Cap BDT MM 332,984.0
BDT MM 2009A 2010E 2011EARPU 1 233 222 222 Revenue 65,300 70,029 75,903 EBIT 20,526 21,243 22,862 EBITDA 37,253 38,516 41,746 Adjusted EBITDA 39,338 41,877 45,390 Recurring Net Income 9,990 12,980 13,937
MarginsGross Margin 49.3% 50.8% 50.6%EBIT Margin 31.4% 30.3% 30.1%EBITDA Margin 57.0% 55.0% 55.0%Adjusted EBITDA Margin 60.2% 59.8% 59.8%Recurring Net Income Margin 15.3% 18.5% 18.4%
GrowthRevenue Growth 6.4% 7.2% 8.4%EBITDA Growth 21.4% 3.4% 8.4%Recurring Net Income 29.9% 7.4% 11.4%
Per ShareEPS 12.1 9.6 10.3 Recurring EPS 8.1 9.6 10.3 Dividend 6.0 4.8 5.2
Cashflow BDT MMOperating 28,803 32,966 33,903 Capex (16,012) (10,500) (20,500) Dividend (1,580) (6,490) (6,969)
ValuationP/E 20.3 x 21.8 x 23.3 xEV/EBITDA 8.7x 7.2x 7.7xROAE 33% 26% 26%
Miscellaneous BDT MMTotal Interest Bearing Debt 14,118 14,130 14,603 Cash & Investment 14,601 11,964 12,619 Net Debt (483) 2,165 1,985
Company Summary
Grameenphone Ltd. (DSE: GP)
2
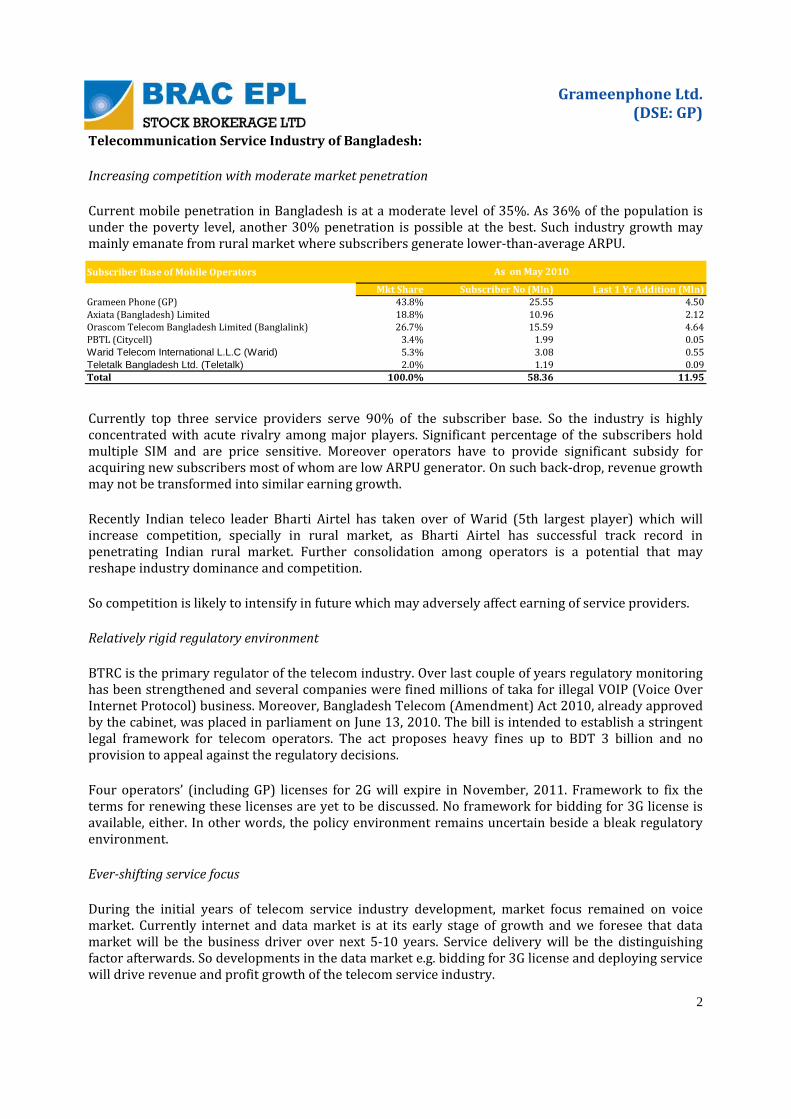
Telecommunication Service Industry of Bangladesh:
Increasing competition with moderate market penetration
Current mobile penetration in Bangladesh is at a moderate level of 35%. As 36% of the population is under the poverty level, another 30% penetration is possible at the best. Such industry growth may mainly emanate from rural market where subscribers generate lower‐than‐average ARPU.
Currently top three service providers serve 90% of the subscriber base. So the industry is highly concentrated with acute rivalry among major players. Significant percentage of the subscribers hold multiple SIM and are price sensitive. Moreover operators have to provide significant subsidy for acquiring new subscribers most of whom are low ARPU generator. On such back‐drop, revenue growth may not be transformed into similar earning growth.
Recently Indian teleco leader Bharti Airtel has taken over of Warid (5th largest player) which will increase competition, specially in rural market, as Bharti Airtel has successful track record in penetrating Indian rural market. Further consolidation among operators is a potential that may reshape industry dominance and competition.
So competition is likely to intensify in future which may adversely affect earning of service providers.
Relatively rigid regulatory environment
BTRC is the primary regulator of the telecom industry. Over last couple of years regulatory monitoring has been strengthened and several companies were fined millions of taka for illegal VOIP (Voice Over Internet Protocol) business. Moreover, Bangladesh Telecom (Amendment) Act 2010, already approved by the cabinet, was placed in parliament on June 13, 2010. The bill is intended to establish a stringent legal framework for telecom operators. The act proposes heavy fines up to BDT 3 billion and no provision to appeal against the regulatory decisions.
Four operators’ (including GP) licenses for 2G will expire in November, 2011. Framework to fix the terms for renewing these licenses are yet to be discussed. No framework for bidding for 3G license is available, either. In other words, the policy environment remains uncertain beside a bleak regulatory environment.
Evershifting service focus
During the initial years of telecom service industry development, market focus remained on voice market. Currently internet and data market is at its early stage of growth and we foresee that data market will be the business driver over next 5‐10 years. Service delivery will be the distinguishing factor afterwards. So developments in the data market e.g. bidding for 3G license and deploying service will drive revenue and profit growth of the telecom service industry.
Subscriber Base of Mobile Operators
Mkt Share Subscriber No (Mln) Last 1 Yr Addition (Mln)Grameen Phone (GP) 43.8% 25.55 4.50Axiata (Bangladesh) Limited 18.8% 10.96 2.12Orascom Telecom Bangladesh Limited (Banglalink) 26.7% 15.59 4.64PBTL (Citycell) 3.4% 1.99 0.05Warid Telecom International L.L.C (Warid) 5.3% 3.08 0.55Teletalk Bangladesh Ltd. (Teletalk) 2.0% 1.19 0.09Total 100.0% 58.36 11.95
As on May 2010
Grameenphone Ltd. (DSE: GP)
3
Fiscal Incentives
Telecom service providers’ earnings are heavily taxed at 45%, in contrast to general corporate tax rate of 37.5%. Moreover 5.5% revenue sharing with BTRC directly reduces profit margins for mobile operators.
SIM tax paid to the Govt. pushes connection cost to US$ 13 in Bangladesh which is the highest relative to its South Asian peer group. Present SIM tax is BDT 800 or around US$ 11.51 in Bangladesh against US$ 1.36 in India, US$ 3.0 in Pakistan, while Sri Lanka, Cambodia and Indonesia do not impose any SIM tax. Such high start up cost is a major impediment towards further growth of the subscriber base. Most of the operators are subsiding this SIM tax which reduces their earnings significantly. Govt. did not withdraw or reduce SIM tax in the budget for FY 2010‐11 as opposed to the general anticipation. Long term prospect of this industry depends heavily on different fiscal incentives including lifting or reducing SIM tax and reducing corporate tax rate.
Grameenphone Ltd. (DSE: GP)
4
Recent performance and future outlook of Grameenphone:
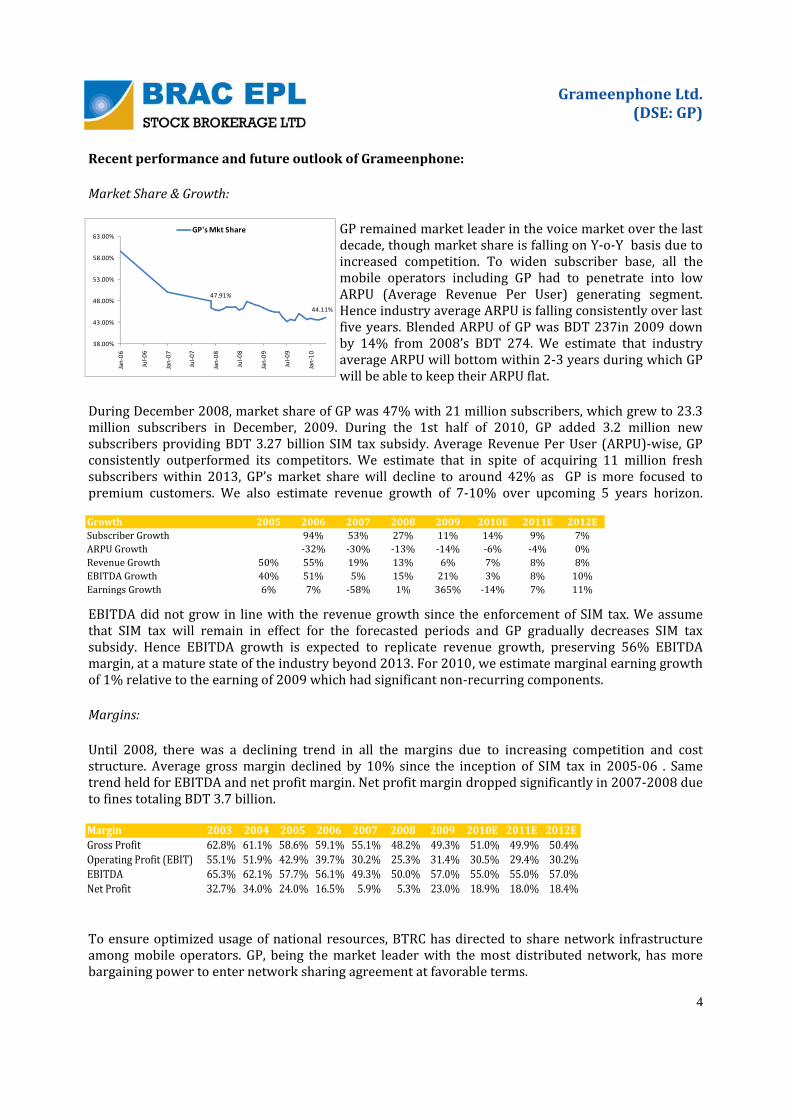
Market Share & Growth:
GP remained market leader in the voice market over the last decade, though market share is falling on Y‐o‐Y basis due to increased competition. To widen subscriber base, all the mobile operators including GP had to penetrate into low ARPU (Average Revenue Per User) generating segment. Hence industry average ARPU is falling consistently over last five years. Blended ARPU of GP was BDT 237in 2009 down by 14% from 2008’s BDT 274. We estimate that industry average ARPU will bottom within 2‐3 years during which GP will be able to keep their ARPU flat.
During December 2008, market share of GP was 47% with 21 million subscribers, which grew to 23.3 million subscribers in December, 2009. During the 1st half of 2010, GP added 3.2 million new subscribers providing BDT 3.27 billion SIM tax subsidy. Average Revenue Per User (ARPU)‐wise, GP consistently outperformed its competitors. We estimate that in spite of acquiring 11 million fresh subscribers within 2013, GP’s market share will decline to around 42% as GP is more focused to premium customers. We also estimate revenue growth of 7‐10% over upcoming 5 years horizon.
EBITDA did not grow in line with the revenue growth since the enforcement of SIM tax. We assume that SIM tax will remain in effect for the forecasted periods and GP gradually decreases SIM tax subsidy. Hence EBITDA growth is expected to replicate revenue growth, preserving 56% EBITDA margin, at a mature state of the industry beyond 2013. For 2010, we estimate marginal earning growth of 1% relative to the earning of 2009 which had significant non‐recurring components.
Margins:
Until 2008, there was a declining trend in all the margins due to increasing competition and cost structure. Average gross margin declined by 10% since the inception of SIM tax in 2005‐06 . Same trend held for EBITDA and net profit margin. Net profit margin dropped significantly in 2007‐2008 due to fines totaling BDT 3.7 billion.
To ensure optimized usage of national resources, BTRC has directed to share network infrastructure among mobile operators. GP, being the market leader with the most distributed network, has more bargaining power to enter network sharing agreement at favorable terms.
47.91%
44.11%
38.00%
43.00%
48.00%
53.00%
58.00%
63.00%
Jan‐06
Jul‐0
6
Jan‐07
Jul‐0
7
Jan‐08
Jul‐0
8
Jan‐09
Jul‐0
9
Jan‐10
GP's Mkt Share
Margin 2003 2004 2005 2006 2007 2008 2009 2010E 2011E 2012EGross Profit 62.8% 61.1% 58.6% 59.1% 55.1% 48.2% 49.3% 51.0% 49.9% 50.4%Operating Profit (EBIT) 55.1% 51.9% 42.9% 39.7% 30.2% 25.3% 31.4% 30.5% 29.4% 30.2%EBITDA 65.3% 62.1% 57.7% 56.1% 49.3% 50.0% 57.0% 55.0% 55.0% 57.0%Net Profit 32.7% 34.0% 24.0% 16.5% 5.9% 5.3% 23.0% 18.9% 18.0% 18.4%
Growth 2005 2006 2007 2008 2009 2010E 2011E 2012ESubscriber Growth 94% 53% 27% 11% 14% 9% 7%ARPU Growth ‐32% ‐30% ‐13% ‐14% ‐6% ‐4% 0%Revenue Growth 50% 55% 19% 13% 6% 7% 8% 8%EBITDA Growth 40% 51% 5% 15% 21% 3% 8% 10%Earnings Growth 6% 7% ‐58% 1% 365% ‐14% 7% 11%
Grameenphone Ltd. (DSE: GP)
5
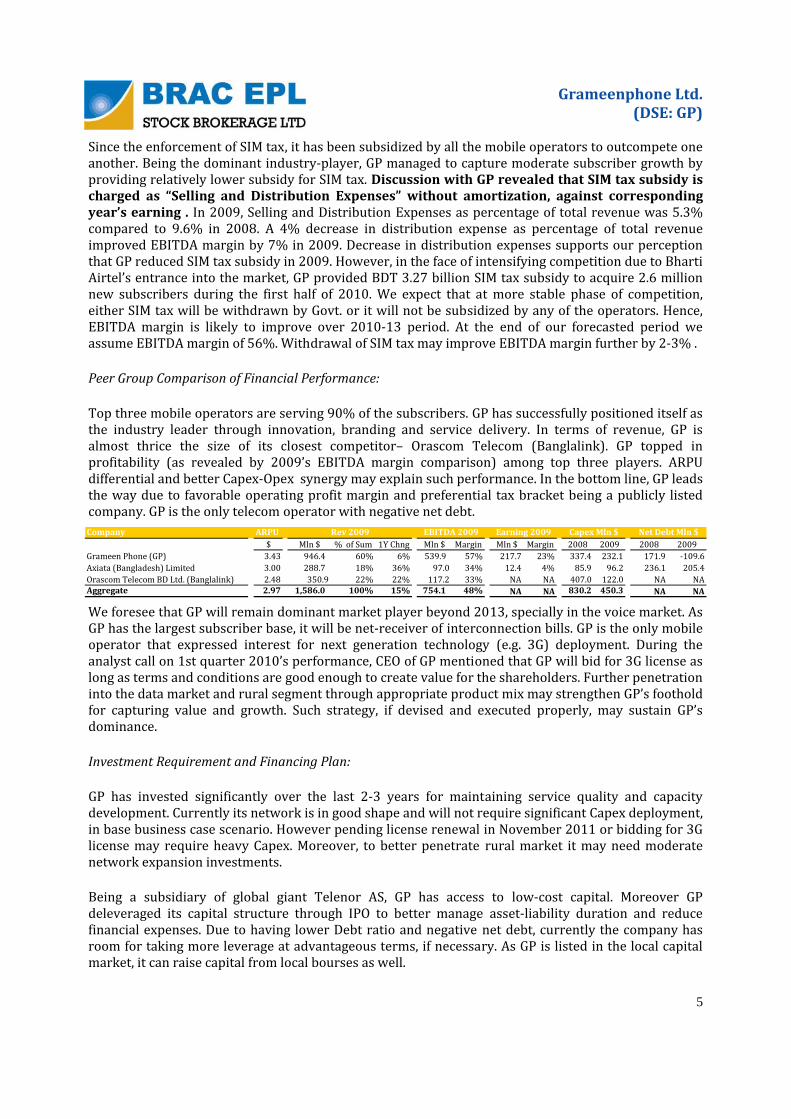
Since the enforcement of SIM tax, it has been subsidized by all the mobile operators to outcompete one another. Being the dominant industry‐player, GP managed to capture moderate subscriber growth by providing relatively lower subsidy for SIM tax. Discussion with GP revealed that SIM tax subsidy is charged as “Selling and Distribution Expenses” without amortization, against corresponding year’s earning . In 2009, Selling and Distribution Expenses as percentage of total revenue was 5.3% compared to 9.6% in 2008. A 4% decrease in distribution expense as percentage of total revenue improved EBITDA margin by 7% in 2009. Decrease in distribution expenses supports our perception that GP reduced SIM tax subsidy in 2009. However, in the face of intensifying competition due to Bharti Airtel’s entrance into the market, GP provided BDT 3.27 billion SIM tax subsidy to acquire 2.6 million new subscribers during the first half of 2010. We expect that at more stable phase of competition, either SIM tax will be withdrawn by Govt. or it will not be subsidized by any of the operators. Hence, EBITDA margin is likely to improve over 2010‐13 period. At the end of our forecasted period we assume EBITDA margin of 56%. Withdrawal of SIM tax may improve EBITDA margin further by 2‐3% .
Peer Group Comparison of Financial Performance:
Top three mobile operators are serving 90% of the subscribers. GP has successfully positioned itself as the industry leader through innovation, branding and service delivery. In terms of revenue, GP is almost thrice the size of its closest competitor– Orascom Telecom (Banglalink). GP topped in profitability (as revealed by 2009’s EBITDA margin comparison) among top three players. ARPU differential and better Capex‐Opex synergy may explain such performance. In the bottom line, GP leads the way due to favorable operating profit margin and preferential tax bracket being a publicly listed company. GP is the only telecom operator with negative net debt.
We foresee that GP will remain dominant market player beyond 2013, specially in the voice market. As GP has the largest subscriber base, it will be net‐receiver of interconnection bills. GP is the only mobile operator that expressed interest for next generation technology (e.g. 3G) deployment. During the analyst call on 1st quarter 2010’s performance, CEO of GP mentioned that GP will bid for 3G license as long as terms and conditions are good enough to create value for the shareholders. Further penetration into the data market and rural segment through appropriate product mix may strengthen GP’s foothold for capturing value and growth. Such strategy, if devised and executed properly, may sustain GP’s dominance.
Investment Requirement and Financing Plan:
GP has invested significantly over the last 2‐3 years for maintaining service quality and capacity development. Currently its network is in good shape and will not require significant Capex deployment, in base business case scenario. However pending license renewal in November 2011 or bidding for 3G license may require heavy Capex. Moreover, to better penetrate rural market it may need moderate network expansion investments.
Being a subsidiary of global giant Telenor AS, GP has access to low‐cost capital. Moreover GP deleveraged its capital structure through IPO to better manage asset‐liability duration and reduce financial expenses. Due to having lower Debt ratio and negative net debt, currently the company has room for taking more leverage at advantageous terms, if necessary. As GP is listed in the local capital market, it can raise capital from local bourses as well.
Company ARPU$ Mln $ % of Sum 1Y Chng Mln $ Margin Mln $ Margin 2008 2009 2008 2009
Grameen Phone (GP) 3.43 946.4 60% 6% 539.9 57% 217.7 23% 337.4 232.1 171.9 ‐109.6Axiata (Bangladesh) Limited 3.00 288.7 18% 36% 97.0 34% 12.4 4% 85.9 96.2 236.1 205.4Orascom Telecom BD Ltd. (Banglalink) 2.48 350.9 22% 22% 117.2 33% NA NA 407.0 122.0 NA NAAggregate 2.97 1,586.0 100% 15% 754.1 48% NA NA 830.2 450.3 NA NA
Earning 2009 Capex Mln $ Net Debt Mln $Rev 2009 EBITDA 2009
Grameenphone Ltd. (DSE: GP)
6
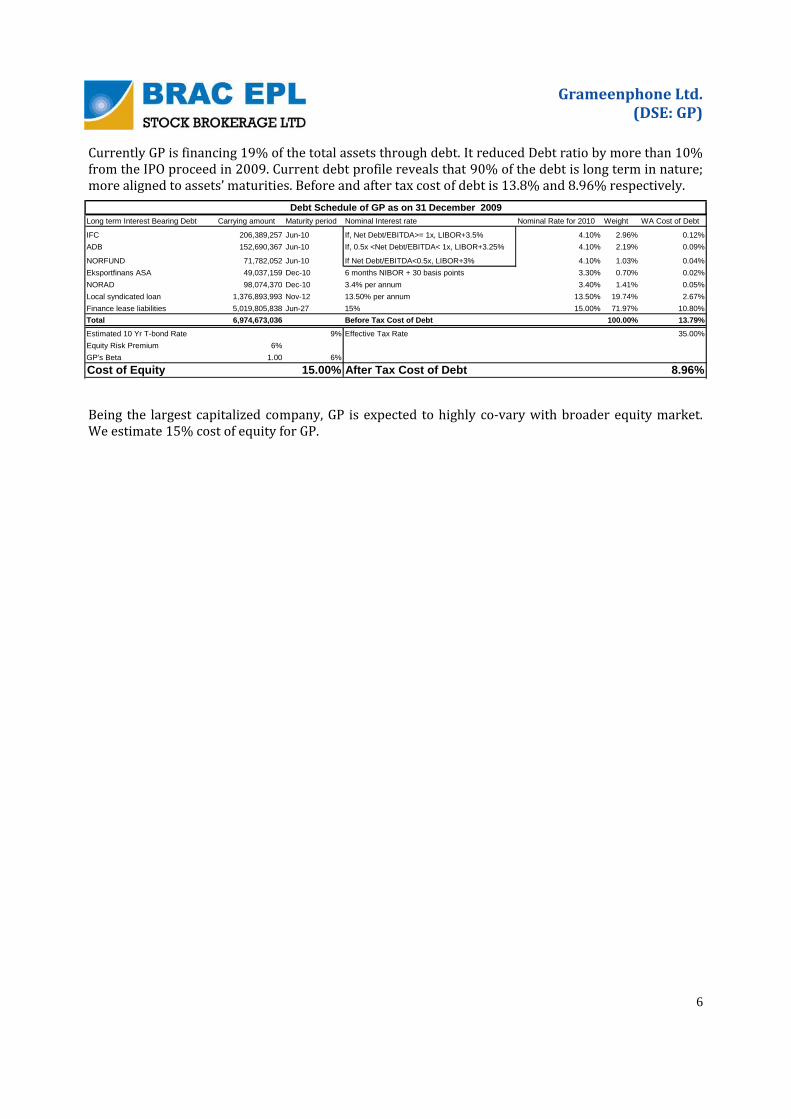
Currently GP is financing 19% of the total assets through debt. It reduced Debt ratio by more than 10% from the IPO proceed in 2009. Current debt profile reveals that 90% of the debt is long term in nature; more aligned to assets’ maturities. Before and after tax cost of debt is 13.8% and 8.96% respectively.
Being the largest capitalized company, GP is expected to highly co‐vary with broader equity market. We estimate 15% cost of equity for GP.
Long term Interest Bearing Debt Carrying amount Maturity period Nominal Interest rate Nominal Rate for 2010 Weight WA Cost of Debt
IFC 206,389,257 Jun-10 If, Net Debt/EBITDA>= 1x, LIBOR+3.5% 4.10% 2.96% 0.12%ADB 152,690,367 Jun-10 If, 0.5x <Net Debt/EBITDA< 1x, LIBOR+3.25% 4.10% 2.19% 0.09%
NORFUND 71,782,052 Jun-10 If Net Debt/EBITDA<0.5x, LIBOR+3% 4.10% 1.03% 0.04%Eksportfinans ASA 49,037,159 Dec-10 6 months NIBOR + 30 basis points 3.30% 0.70% 0.02%NORAD 98,074,370 Dec-10 3.4% per annum 3.40% 1.41% 0.05%Local syndicated loan 1,376,893,993 Nov-12 13.50% per annum 13.50% 19.74% 2.67%Finance lease liabilities 5,019,805,838 Jun-27 15% 15.00% 71.97% 10.80%Total 6,974,673,036 Before Tax Cost of Debt 100.00% 13.79%
Estimated 10 Yr T-bond Rate 9% Effective Tax Rate 35.00%Equity Risk Premium 6%GP's Beta 1.00 6%
Cost of Equity 15.00% After Tax Cost of Debt 8.96%
Debt Schedule of GP as on 31 December 2009
Grameenphone Ltd. (DSE: GP)
7
Future Outlook:
GP is likely to provide increased SIM tax subsidy in 2010 to acquire more subscribers to outcompete new entrant (Bharti Airtel). Recently launched package “Baadhon” aims to penetrate rural market by offering a “Grameenphone C100” handset and Grameenphone SIM at BDT 1,499.00. Thus significant portion of SIM tax of BDT 800.00 per connection is being subsidized by GP. No other operators have any such economical subscribers targeted product in the market. So we foresee that GP will be able to resist loss of market share at 42‐44% in growing market. But subscriber growth in the rural segment may dilute blended ARPU over next 2‐3 years. EBITDA margin may temporarily decline to 55% over next two years, from current 57%, due to increased level of SIM tax subsidy. During 2012‐13 EBITDA margin is likely to be around 56%.
Data Market & 3G License:
Grameenphone has expressed interest for 3G operator license. Bangladesh's telecom regulator is planning to issue a minimum of four licenses via open auction in 2010, though no framework and time line has been declared yet.
In 2008‐09, BTRC awarded two Broadband Wireless Access (BWA) licenses through bidding to deploy WiMAX network through out the country. Winners bid BDT 2,150 million for each license, which was much higher than what industry‐experts thought as reasonable. Similar overheated bidding may adversely affect GP’s pursuit for 3G license at reasonable license fees.
Currently GP has 4.3 million edge subscribers. In 2009, GP earned BDT 670 million through delivering data service which was 40% up from that of 2008. Y‐O‐Y growth for such revenue was 68% for the 1st half of 2010. However at only 1% of the revenue, data revenue is still insignificant.
Penetration into the data market will be much easier for GP, once it successfully deploys next generation technology like 3G. During 2009, less than 5% of GP’s revenue came from data market. With second lowest level of internet penetration (at 4%) in South Asia, data market is expected to take off in 5 years. To pursue the mandate to build “Digital Bangladesh”, Govt. of Bangladesh is devising ICT‐friendly policies. For example, all the public examination results and university admission procedures are taken online. Besides payment for utilities, transportation and money‐transfers have already been facilitated by mobile operators. Rapid development of handset architecture is widening scope for mobile enabled services. In near future, mobile phones will emerge as convenient distribution channel for product and services with significant network effect. Being the largest operator, GP is in a more advantageous position to ride such wave.
SIM Tax Withdrawal:
Withdrawal or reduction of SIM tax will not only boost top line growth of GP but also significantly improve its operating profit margin. SIM tax subsidy, since enforecement, accounted for 60‐70% of the Selling and Distribution Expenses, in other words 3‐7% of the revenue. If SIM tax is withdrawn with immediate effect, we expect 3‐5% EBITDA margin improvement.
(BDT Million) 2003 2004 2005 2006 2007 2008 2009 2010E 2011E 2012EEBITDA 8,181 12,181 17,004 25,603 26,780 30,685 37,253 38,516 41,746 46,099 Selling & Distribution Exp 81 433 2,057 3,944 6,660 5,875 3,475 5,602 6,072 6,586 SIM Tax Subsidy* ‐ ‐ 617 2,367 3,996 3,525 2,085 3,361 3,643 3,951 Adjusted EBITDA 8,181 12,181 17,621 27,970 30,776 34,210 39,338 41,877 45,390 50,051
EBITDA Margin 65% 62% 58% 56% 49% 50% 57% 55% 55% 56%Adjusted EBITDA Margin 65% 62% 60% 61% 57% 56% 60% 60% 60% 61%SIM Tax Subsidy as % of Revenue 0% 0% 2% 5% 7% 6% 3% 5% 5% 5%
Grameenphone Ltd. (DSE: GP)
8
SIM tax contradicts the idea of digital Bangladesh and withdrawal/ reduction of such tax has been being proposed by different industry‐stakeholders. A parliamentary committee proposed for SIM tax withdrawal in the national budget for the FY 2010‐11, though such idea was not implemented finally. We perceive such higher SIM tax as an inefficiency which will not remain enforced in the long term. We expect that Govt. will ease SIM tax within five years. Such steps will broaden the subscriber net and promote ICT penetration into the rural market and low income people without lessening Govt. revenue.
GP’s stock may appreciate substantially once SIM tax has been withdrawn.
Infrastructure Sharing:
GP signed infrastructure sharing agreements with major mobile operators namely Axiata (Robi) and Orascom (Banglalink). Augere Wireless Broadband Bangladesh Ltd. (Augere) is also sharing network infrastructure with GP. With around 13000 base stations covering 99% of the population, GP does not need any resource co‐operation from other operators. However such network sharing was enforced by BTRC. GP earned BDT 60 million during 1st half of 2010 from infrastructure sharing which was less than 0.5% of the total revenue. Net effect of infrastructure revenue and “co‐operating competitors” are yet to be assessed, but we do not expect any significant swing in revenue or margin from infrastructure sharing.
Stock Performance Catalyst:
Category change and its implication: GP’s stock has been transferred to category A from earlier N category because of declaring more than 10% cash dividend (as % of paid up capital only). Such transition makes GP’s stock eligible for margin lending in mid August, 2010 for a price up to BDT 286.0 per share according to the PE threshold set by SEC. So, GP’s stock is not expected to break the resistance level beyond BDT 286.0 until earning estimate is revised.
Negative earning growth for 2010: We expect negative earning growth for GP in 2010. During the first half of 2010, net profit after tax amounted BDT 4.83 billion, increased by 1.2% over previous year’s earning for the same period. However in 2009, annual earning had significant (almost 14% of the total earning) nonrecurring items like interest income on IPO application fund and reversal of deferred tax. Moreover during the first half of 2010, GP provided SIM tax subsidy equivalent to 9% of the revenue which cut EBITDA margin by around 10% relative to EBITDA margin of first half, 2009. Considering all such issues, we estimate that GP’s net income will decline by 14% during 2010. Such negative earning growth may cause underperformance of the stock relative to the broader market.
Free float to be doubled in October 2010: Currently only 5% of the total shares of GP is floating in the market. Pre‐IPO privately placed stock to different institutions make up another 5%. Such privately placed shares are under the lock‐in provision which is going to expire in late October 2010. So, from October onward free‐float shares will double. Being the largest capitalized company representing 14% of the market capital and with doubled free‐floating shares, GP is expected to be priced fairly beyond late October.
Shareholders 2009Telenor 56%Grameen Telecom 34%Institutions Investors 5%General public 5%Total 100%
Grameenphone Ltd. (DSE: GP)
9
Valuation: DCF Valuation: We value GP by applying discounted cash flow (DCF) model which forecasts free cash flow (FCF) over next four years over which we have reasonable estimates. We estimate terminal value at the end of fifth year averaging terminal values derived by applying 1) Constant growth cash flow model and 2) EV/EBITDA exit multiple‐based model. We assume weighted average cost of capital of 13.7%, terminal growth rate of 4% and terminal EV/ EBITDA multiple of 6.0. We assume that at the end of fourth year, SIM tax will be fully withdrawn. Hence there will be no SIM tax subsidy in the terminal year in which we assume adjusted EBITDA margin of 60%. Our DCF model reveals a fair of BDT 226.8 per share of GP in 12 months period.
Relative Valuation: GP is the sole listed telecom operator in Bangladesh. Other listed ICT companies are not comparable to GP. Hence, we compare GP’s valuation multiples to those of other regional publicly listed telecom op‐erators. Average Price Earning Ratio (PER) of regional peer companies was 13.5 times the last twelve months aggregate earning. Average of EV/ EBITDA multiples for same companies was 6.5 times the last twelve months aggregate EBITDA. In contrast, GP is traded at 33 times the last twelve months earning revealing an EV/EBITDA ratio of 9.4 times. It is very important to adjust GP’s earning and EBITDA for SIM tax subsidy which is unusually high in Bangladesh at US$ 11.5 per connection (In contrast SIM tax is US$ 1.36 in India, US$ 3 in Pakistan. Sri Lanka, Cambodia and Indonesia do not impose any SIM tax). No other regional listed operators except GP is providing such a high SIM tax subsidy. SIM tax subsidy, being charged against current year’s earning, is investment‐like in nature and temporarily suppresses earning and profitability. We perceive that GP, being the leader in its local market, should trade at higher multiples to capture the investment‐like effect of SIM tax subsidy. Hence, as described in the following page, we applied a forward PER of 20x and EV to EBITDA ratio of 6.5x to value GP relative to its regional peer group.
DCF Valuation Million BDT 2008 2009 2010E 2011E 2012E 2013E TerminalTotal Revenue 61,359 65,300 70,029 75,903 82,320 90,411 94,932 EBIT 15,541 20,526 21,243 22,862 25,469 27,628 ‐ Cash Tax 4,843 6,506 7,059 8,462 8,710 8,456 9,968 Unlevered Net Income 10,698 14,020 14,184 14,400 16,758 19,172 + Depreciation & Amortization 15,144 16,727 17,273 18,884 20,631 22,551 EBITDA 30,685 37,253 38,516 41,746 46,099 50,178 + SIM Tax Subsidy 3,525 2,085 3,361 3,643 3,951 4,340 Adjusted EBITDA 34,210 39,338 41,877 45,390 50,051 54,518 56,959 Assumed Adjusted EBITDA Margin 60%‐ Working Capital Investment 6,547 (2,943) 2,567 1,873 658 2,265 (1,899) ‐ Capital Investment (23,277) (16,012) (10,500) (20,500) (12,000) (12,000) (22,551) Free Cash Flow to Firm 13,955 18,298 30,583 23,119 34,758 40,444 22,543 Terminal Value with constantly growing CF a 243,500
Terminal Value with assumed EV/ EBITDA b 341,755
Average Terminal Value average of a & b 292,627 PV of Free Cash Flow 21,788 11,947 18,686 20,195 184,744 Enterprise Value (Sum of PV) 257,360 ‐ Net Debt ‐7571.92Equity Value 264,932 Current No of Outstanding Shares 1350.3
Per Share Value 196 Cost of Equity 15%12 Months Fair Value (FV of Per Shre Value) 225
Assumptions:Weighted Avg. Cost of Capital 13.6%Terminal Growth Rate 4.0%Adjusted EBITDA Margin 60.0%Terminal EV/ EBITDA Exit Multiple 6.0x
Grameenphone Ltd. (DSE: GP)
10
Company
LTM Filing Date
Revenue
MCAP of Equity
EVNet Debt
PEEV/EBITDA
Net Debt/EBITDA
Mln $
Mln $
% of Rev
Mln $
% of Rev
Mln $
Mln $
Mln $
xx
xAxiata Group Berhad (KLSE:AXIATA)
May‐27‐2010
4,356
1,838
42.2%
780
17.9%
10,716
13,953
2,842
13.7 x
7.6 x
1.5 x
Bharti Airtel Ltd. (BSE:532454)
A pr‐28‐2010
8,413
3,374
40.1%
1,935
23.0%
23,790
24,134
(261)
12.3 x
7.2 x
‐0.1 x
China Mobile Limited (SEH
K:941)
A pr‐07‐2010
66,667
34,173
51.3%
17,000
25.5%
201,809
168,227
(34,027)
11.9 x
4.9 x
‐1.0 x
China Unicom
(Hong Kong) Limited (SEH
K:762)
Apr‐30‐2010
23,069
8,451
36.6%
1,061
4.6%
31,460
40,431
9,047
29.6 x
4.8 x
1.1 x
Digi.com Bhd (KLSE:DIGI)
May‐04‐2010
1,551
649
41.9%
312
20.1%
5,740
5,874
134
18.4 x
9.0 x
0.2 x
Globe Telecom Inc. (PSE:GLO)
Ma y‐05‐2010
1,364
765
56.1%
248
18.2%
2,506
3,451
946
10.1 x
4.5 x
1.2 x
Indosat tbk PT (JK
SE:ISAT)
A pr‐30‐2010
2,041
978
47.9%
182
8.9%
2,951
5,410
2,422
16.2 x
5.5 x
2.5 x
PT XL Axiata Tbk (JKSE:EXCL)
A pr‐30‐2010
1,644
798
48.5%
278
16.9%
4,034
5,327
1,293
14.5 x
6.7 x
1.6 x
Reliance Communications Ltd. (BSE:532712)
Ma y‐17‐2010
4,565
1,484
32.5%
991
21.7%
8,243
12,446
4,007
8.3 x
8.4 x
2.7 x
Telkom
SA Ltd. (JSE:TKG)
Jun‐21‐2010
4,964
1,174
23.7%
4,914
99.0%
2,245
2,941
651
0.5 x
2.5 x
0.6 x
Total Access Com
. Public Co. Ltd. (SET:DT
AC)
A pr‐30‐2010
2,055
410
19.9%
234
11.4%
3,023
3,157
133
12.9 x
7.7 x
0.3 x
Gram
eenPhone Ltd. (DSE:GP)*
Jul‐18‐2010
994
515
51.8%
145
14.5%
4,789
4,865
(109)
33.1 x
9.4 x
‐0.2 x
Avera ge Excl. GP
40.1%
24.3%
13.5 x
6.3 x
1.0 x
Median Excl. GP
41.9%
18.2%
12.9 x
6.7 x
1.1 x
Multiples for valuing GP
20.0 x
6.5 x
GrameenPhone Ltd. (DSE:GP)
forward estimates (BDT) for 2010
70029
38516
55.0%
12980
18.5%
(7,572)
Fair Value per share of GP in 12 Months
192.3
191.0
* Earning for LTM
was normalized
Source: Ca pital IQ, July 22, 2010 and BRAC EPL Research
LTM EBITDA
LTM Earning
Grameenphone Ltd. (DSE: GP)
11
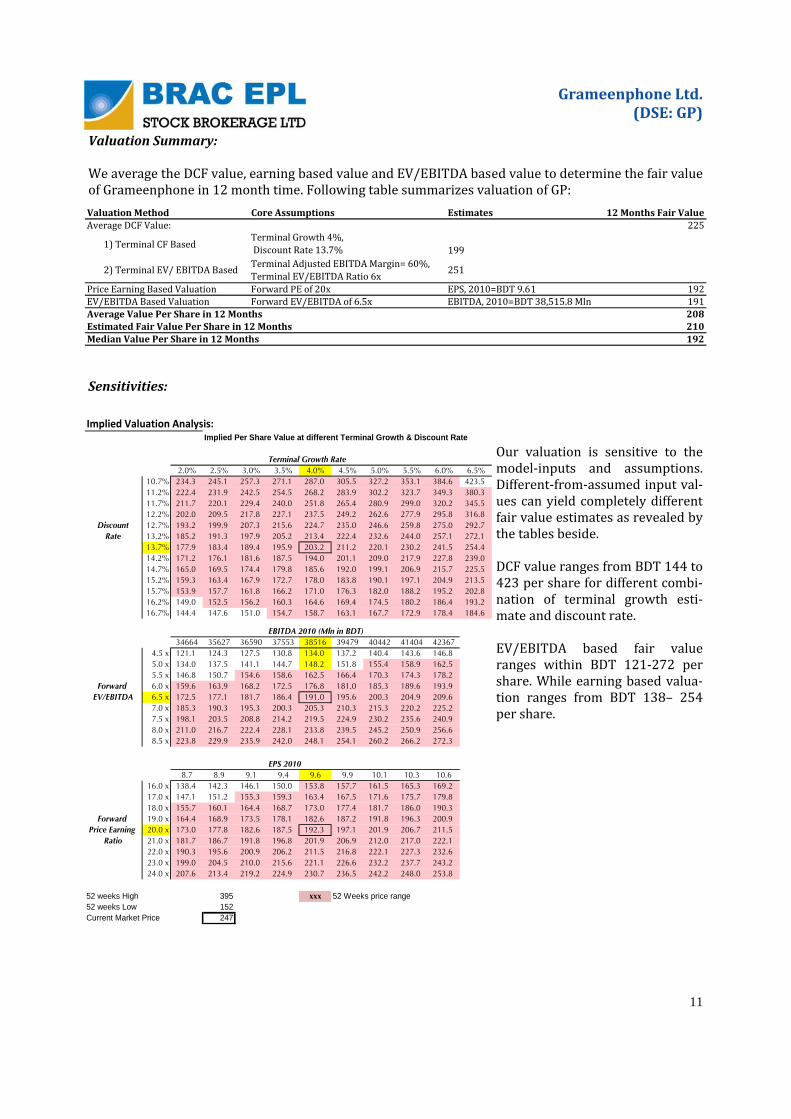
Valuation Summary: We average the DCF value, earning based value and EV/EBITDA based value to determine the fair value of Grameenphone in 12 month time. Following table summarizes valuation of GP:
Sensitivities:
Our valuation is sensitive to the model‐inputs and assumptions. Different‐from‐assumed input val‐ues can yield completely different fair value estimates as revealed by the tables beside. DCF value ranges from BDT 144 to 423 per share for different combi‐nation of terminal growth esti‐mate and discount rate. EV/EBITDA based fair value ranges within BDT 121‐272 per share. While earning based valua‐tion ranges from BDT 138– 254 per share.
Implied Valuation Analysis:Implied Per Share Value at different Terminal Growth & Discount Rate
Terminal Growth Rate##### 2.0% 2.5% 3.0% 3.5% 4.0% 4.5% 5.0% 5.5% 6.0% 6.5%10.7% 234.3 245.1 257.3 271.1 287.0 305.5 327.2 353.1 384.6 423.511.2% 222.4 231.9 242.5 254.5 268.2 283.9 302.2 323.7 349.3 380.311.7% 211.7 220.1 229.4 240.0 251.8 265.4 280.9 299.0 320.2 345.512.2% 202.0 209.5 217.8 227.1 237.5 249.2 262.6 277.9 295.8 316.8
Discount 12.7% 193.2 199.9 207.3 215.6 224.7 235.0 246.6 259.8 275.0 292.7Rate 13.2% 185.2 191.3 197.9 205.2 213.4 222.4 232.6 244.0 257.1 272.1
13.7% 177.9 183.4 189.4 195.9 203.2 211.2 220.1 230.2 241.5 254.414.2% 171.2 176.1 181.6 187.5 194.0 201.1 209.0 217.9 227.8 239.014.7% 165.0 169.5 174.4 179.8 185.6 192.0 199.1 206.9 215.7 225.515.2% 159.3 163.4 167.9 172.7 178.0 183.8 190.1 197.1 204.9 213.515.7% 153.9 157.7 161.8 166.2 171.0 176.3 182.0 188.2 195.2 202.816.2% 149.0 152.5 156.2 160.3 164.6 169.4 174.5 180.2 186.4 193.216.7% 144.4 147.6 151.0 154.7 158.7 163.1 167.7 172.9 178.4 184.6
EBITDA 2010 (Mln in BDT) ##### 34664 35627 36590 37553 38516 39479 40442 41404 42367
4.5 x 121.1 124.3 127.5 130.8 134.0 137.2 140.4 143.6 146.85.0 x 134.0 137.5 141.1 144.7 148.2 151.8 155.4 158.9 162.55.5 x 146.8 150.7 154.6 158.6 162.5 166.4 170.3 174.3 178.2
Forward 6.0 x 159.6 163.9 168.2 172.5 176.8 181.0 185.3 189.6 193.9EV/EBITDA 6.5 x 172.5 177.1 181.7 186.4 191.0 195.6 200.3 204.9 209.6
7.0 x 185.3 190.3 195.3 200.3 205.3 210.3 215.3 220.2 225.27.5 x 198.1 203.5 208.8 214.2 219.5 224.9 230.2 235.6 240.98.0 x 211.0 216.7 222.4 228.1 233.8 239.5 245.2 250.9 256.68.5 x 223.8 229.9 235.9 242.0 248.1 254.1 260.2 266.2 272.3
EPS 2010##### 8.7 8.9 9.1 9.4 9.6 9.9 10.1 10.3 10.616.0 x 138.4 142.3 146.1 150.0 153.8 157.7 161.5 165.3 169.217.0 x 147.1 151.2 155.3 159.3 163.4 167.5 171.6 175.7 179.818.0 x 155.7 160.1 164.4 168.7 173.0 177.4 181.7 186.0 190.3
Forward 19.0 x 164.4 168.9 173.5 178.1 182.6 187.2 191.8 196.3 200.9Price Earning 20.0 x 173.0 177.8 182.6 187.5 192.3 197.1 201.9 206.7 211.5
Ratio 21.0 x 181.7 186.7 191.8 196.8 201.9 206.9 212.0 217.0 222.122.0 x 190.3 195.6 200.9 206.2 211.5 216.8 222.1 227.3 232.623.0 x 199.0 204.5 210.0 215.6 221.1 226.6 232.2 237.7 243.224.0 x 207.6 213.4 219.2 224.9 230.7 236.5 242.2 248.0 253.8
52 weeks High 395 xxx 52 Weeks price range52 weeks Low 152Current Market Price 247
Valuation Method Core Assumptions Estimates 12 Months Fair ValueAverage DCF Value: 225
1) Terminal CF BasedTerminal Growth 4%, Discount Rate 13.7% 199
2) Terminal EV/ EBITDA Based Terminal Adjusted EBITDA Margin= 60%,Terminal EV/EBITDA Ratio 6x 251
Price Earning Based Valuation Forward PE of 20x EPS, 2010=BDT 9.61 192EV/EBITDA Based Valuation Forward EV/EBITDA of 6.5x EBITDA, 2010=BDT 38,515.8 Mln 191Average Value Per Share in 12 Months 208Estimated Fair Value Per Share in 12 Months 210Median Value Per Share in 12 Months 192
Grameenphone Ltd. (DSE: GP)
12
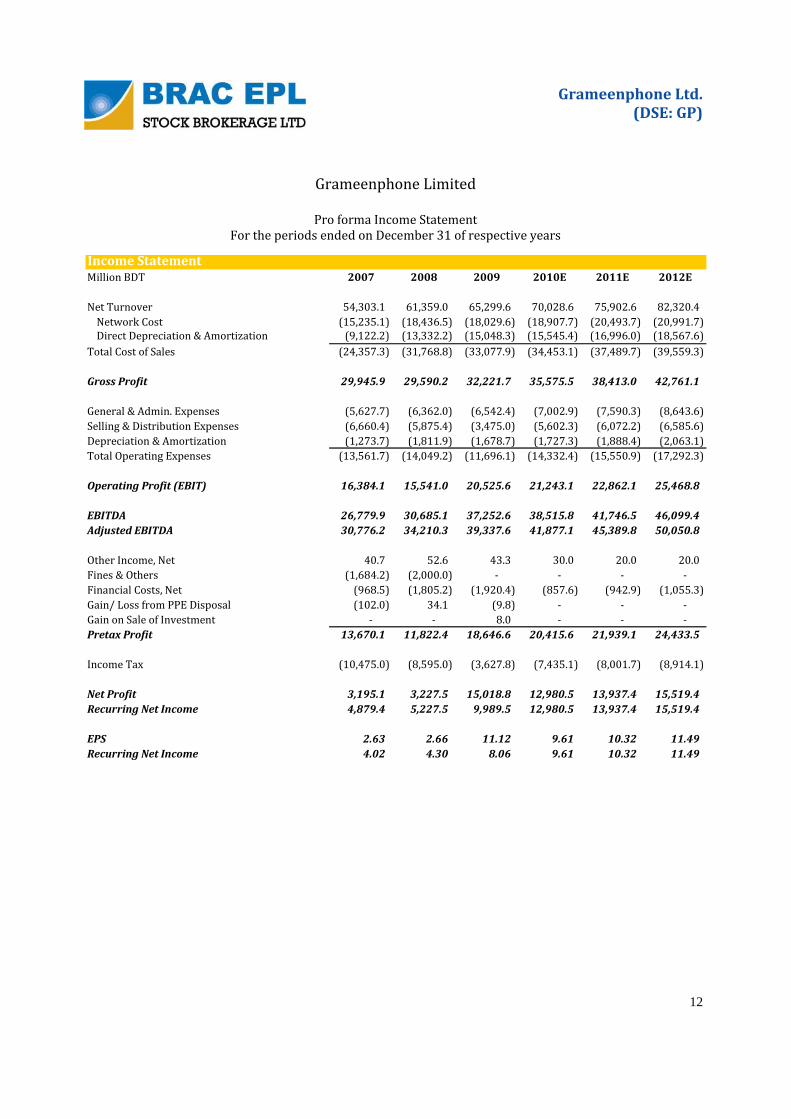
Million BDT 2007 2008 2009 2010E 2011E 2012E
Net Turnover 54,303.1 61,359.0 65,299.6 70,028.6 75,902.6 82,320.4 Network Cost (15,235.1) (18,436.5) (18,029.6) (18,907.7) (20,493.7) (20,991.7) Direct Depreciation & Amortization (9,122.2) (13,332.2) (15,048.3) (15,545.4) (16,996.0) (18,567.6)
Total Cost of Sales (24,357.3) (31,768.8) (33,077.9) (34,453.1) (37,489.7) (39,559.3)
Gross Profit 29,945.9 29,590.2 32,221.7 35,575.5 38,413.0 42,761.1
General & Admin. Expenses (5,627.7) (6,362.0) (6,542.4) (7,002.9) (7,590.3) (8,643.6) Selling & Distribution Expenses (6,660.4) (5,875.4) (3,475.0) (5,602.3) (6,072.2) (6,585.6) Depreciation & Amortization (1,273.7) (1,811.9) (1,678.7) (1,727.3) (1,888.4) (2,063.1) Total Operating Expenses (13,561.7) (14,049.2) (11,696.1) (14,332.4) (15,550.9) (17,292.3)
Operating Profit (EBIT) 16,384.1 15,541.0 20,525.6 21,243.1 22,862.1 25,468.8
EBITDA 26,779.9 30,685.1 37,252.6 38,515.8 41,746.5 46,099.4 Adjusted EBITDA 30,776.2 34,210.3 39,337.6 41,877.1 45,389.8 50,050.8
Other Income, Net 40.7 52.6 43.3 30.0 20.0 20.0 Fines & Others (1,684.2) (2,000.0) ‐ ‐ ‐ ‐ Financial Costs, Net (968.5) (1,805.2) (1,920.4) (857.6) (942.9) (1,055.3) Gain/ Loss from PPE Disposal (102.0) 34.1 (9.8) ‐ ‐ ‐ Gain on Sale of Investment ‐ ‐ 8.0 ‐ ‐ ‐ Pretax Profit 13,670.1 11,822.4 18,646.6 20,415.6 21,939.1 24,433.5
Income Tax (10,475.0) (8,595.0) (3,627.8) (7,435.1) (8,001.7) (8,914.1)
Net Profit 3,195.1 3,227.5 15,018.8 12,980.5 13,937.4 15,519.4 Recurring Net Income 4,879.4 5,227.5 9,989.5 12,980.5 13,937.4 15,519.4
EPS 2.63 2.66 11.12 9.61 10.32 11.49 Recurring Net Income 4.02 4.30 8.06 9.61 10.32 11.49
Income Statement
Grameenphone Limited
Pro forma Income Statement For the periods ended on December 31 of respective years
Grameenphone Ltd. (DSE: GP)
13
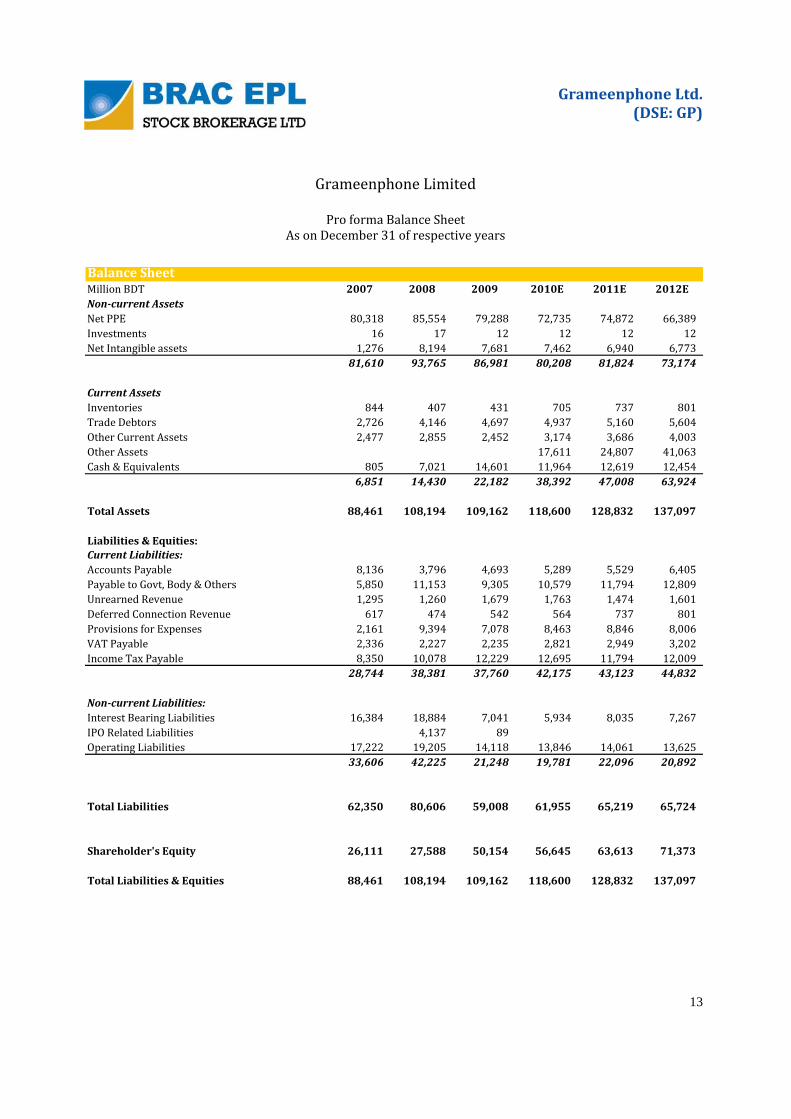
Grameenphone Limited
Pro forma Balance Sheet As on December 31 of respective years
Balance SheetMillion BDT 2007 2008 2009 2010E 2011E 2012ENoncurrent AssetsNet PPE 80,318 85,554 79,288 72,735 74,872 66,389 Investments 16 17 12 12 12 12 Net Intangible assets 1,276 8,194 7,681 7,462 6,940 6,773
81,610 93,765 86,981 80,208 81,824 73,174
Current AssetsInventories 844 407 431 705 737 801 Trade Debtors 2,726 4,146 4,697 4,937 5,160 5,604 Other Current Assets 2,477 2,855 2,452 3,174 3,686 4,003 Other Assets 17,611 24,807 41,063 Cash & Equivalents 805 7,021 14,601 11,964 12,619 12,454
6,851 14,430 22,182 38,392 47,008 63,924
Total Assets 88,461 108,194 109,162 118,600 128,832 137,097
Liabilities & Equities:Current Liabilities:Accounts Payable 8,136 3,796 4,693 5,289 5,529 6,405 Payable to Govt, Body & Others 5,850 11,153 9,305 10,579 11,794 12,809 Unrearned Revenue 1,295 1,260 1,679 1,763 1,474 1,601 Deferred Connection Revenue 617 474 542 564 737 801 Provisions for Expenses 2,161 9,394 7,078 8,463 8,846 8,006 VAT Payable 2,336 2,227 2,235 2,821 2,949 3,202 Income Tax Payable 8,350 10,078 12,229 12,695 11,794 12,009
28,744 38,381 37,760 42,175 43,123 44,832
Noncurrent Liabilities:Interest Bearing Liabilities 16,384 18,884 7,041 5,934 8,035 7,267 IPO Related Liabilities 4,137 89 Operating Liabilities 17,222 19,205 14,118 13,846 14,061 13,625
33,606 42,225 21,248 19,781 22,096 20,892
Total Liabilities 62,350 80,606 59,008 61,955 65,219 65,724
Shareholder's Equity 26,111 27,588 50,154 56,645 63,613 71,373
Total Liabilities & Equities 88,461 108,194 109,162 118,600 128,832 137,097
Grameenphone Ltd. (DSE: GP)
14
Analyst Certification: Each research analyst and research associate who authored this document and whose name appears herein certifies that the recommendations and opinions expressed in the research re‐port accurately reflect their personal views about any and all of the securities or issuers discussed therein that are within the coverage universe. Disclaimer: Estimates and projections herein are our own and are based on assumptions that we believe to be reasonable. Information presented herein, while obtained from sources we believe to be reliable, is not guaranteed either as to accuracy or completeness. Neither the information nor any opinion expressed herein constitutes a solicitation of the purchase or sale of any security. As it acts for public companies from time to time, BRAC‐EPL may have a relationship with the above mentioned company(s). This report is in‐tended for distribution in only those jurisdictions in which BRAC‐EPL is registered and any distribution out‐side those jurisdictions is strictly prohibited. Compensation of Analysts: The compensation of research analysts is intended to reflect the value of the services they provide to the clients of BRAC‐EPL. As with most other employees, the compensation of re‐search analysts is impacted by the overall profitability of the firm, which may include revenues from corpo‐rate finance activities of the firm's Corporate Finance department. However, Research analysts' compensa‐tion is not directly related to specific corporate finance transaction. General Risk Factors: BRAC‐EPL will conduct a comprehensive risk assessment for each company under coverage at the time of initiating research coverage and also revisit this assessment when subsequent up‐date reports are published or material company events occur. Following are some general risks that can im‐pact future operational and financial performance: (1) Industry fundamentals with respect to customer de‐mand or product / service pricing could change expected revenues and earnings; (2) Issues relating to ma‐jor competitors or market shares or new product expectations could change investor attitudes; (3) Unfore‐seen developments with respect to the management, financial condition or accounting policies alter the pro‐spective valuation; or (4) Interest rates, currency or major segments of the economy could alter investor confidence and investment prospects.
BRAC EPL Investments Capital Markets Group
Aminul Haque, CFA Head of Capital Markets [email protected] 01730317802 Md. Monirul Islam, ACA Research Analyst [email protected] 01730357150 Parvez Morshed Chowdhury Research Analyst [email protected] 01730357154 Ali Imam Investment Analyst [email protected] 01730357153 Asif Khan Investment Analyst [email protected] 01730357158 Md. Ashfaque Alam Research Associate [email protected] 01671020956 Khandakar Safwan Saad Research Associate [email protected] 01911420549
BRAC EPL Research www.bracepl.com WW Tower (8th Floor) 68 Motijheel C/A, Dhaka‐1000 Tel: +88 02 9514731‐40 Fax: +88 02 7116418 E‐Mail: [email protected]
IMPORTANT DISCLOSURES


![[DSE] 4 Etapa anitzeko anplifikadoreak](https://img.pdfslide.tips/doc/110x75/5464cbe4b4af9fda3f8b47f9/dse-4-etapa-anitzeko-anplifikadoreak.jpg)


![[DSE] 4 Amplificadores multietapa](https://img.pdfslide.tips/doc/110x75/5464cbe9af795969458b47f4/dse-4-amplificadores-multietapa.jpg)